Embed Size (px)
Citation preview
535 | P a g e
BEHAVIOUR OF GEOPOLYMER CONCRETE WITH
FERROCEMENT
N Ranjith Kumar1, K Sampath Kumar
2
1PG Student, Dept of Civil Engineering, Nova College of Engineering & Technology,
Vijayawada, (India)
2Asst.Professor, Dept of Civil Engineering, Nova College of Engineering & Technology,
Vijayawada, (India)
ABSTRACT
This paper presents the experimental investigations of the resistance of Geopolymer mortar slabs to impact
loading for the specimens of size 200mmx210mmx100mm. The results obtained show that the addition of the
above mesh reinforcement has increased the impact residual strength ratio of GeopolymerFerro cement by 4-28
that of the reference plain Ferro cement mortar slab. The combination of 1 layer of weld mesh and 4 layers of
chicken mesh of GeopolymerFerro cement specimens show the best performance in the test, i.e. energy
absorbed, residual impact strength ratio (I-rs),It was concluded that the increase in Volume fraction of
reinforcement V-r, increases the energy absorption and also residual impact strength ratio
ofGeopolymerFerrocement than that of Ferro cement specimens.
Keywords: Ferro cement, Geopolymer mortar slab, Residual impact strength ratio
I. INTRODUCTION
Concrete usage around the world is second only to water. Ordinary Portland cement (OPC) is conventionally
used as the primary binder to produce concrete. The amount of the carbon dioxide released during the
manufacture of OPC due to the calcination of limestone and combustion of fossil fuel is in the order of one ton
for every ton of OPC produced. In addition, the extent of energy required to produce OPC is only next to steel
and aluminum. The fly ash worldwide creates opportunity to utilize this by-product of burning coal, as a
substitute for OPC to manufacture cement products. When used as a partial replacement of OPC, in the presence
of water and in ambient temperature, fly ash reacts with the calcium hydroxide during the hydration process of
OPC to form the calcium silicate hydrate (C-S-H) gel. which enabled the replacement of OPC up to 60% by
mass is a significant development. In 1978, Davidovits proposed that binders could be produced by a polymeric
reaction of alkaline liquids with the silicon and the aluminum in source materials of geological origin or by-
product materials such as fly ash and rice husk ash. He termed these binders as Geopolymer.
II. CALCULATIONS
2.1 For Cement Mortar Prisms & Geo Polymer Mortar Prisms
Size of the mortar cube=200*100*100=0.002m³
536 | P a g e
Density of geo polymer mortar=2200kg/m³
Weight of cube=2200*0.002=4.4
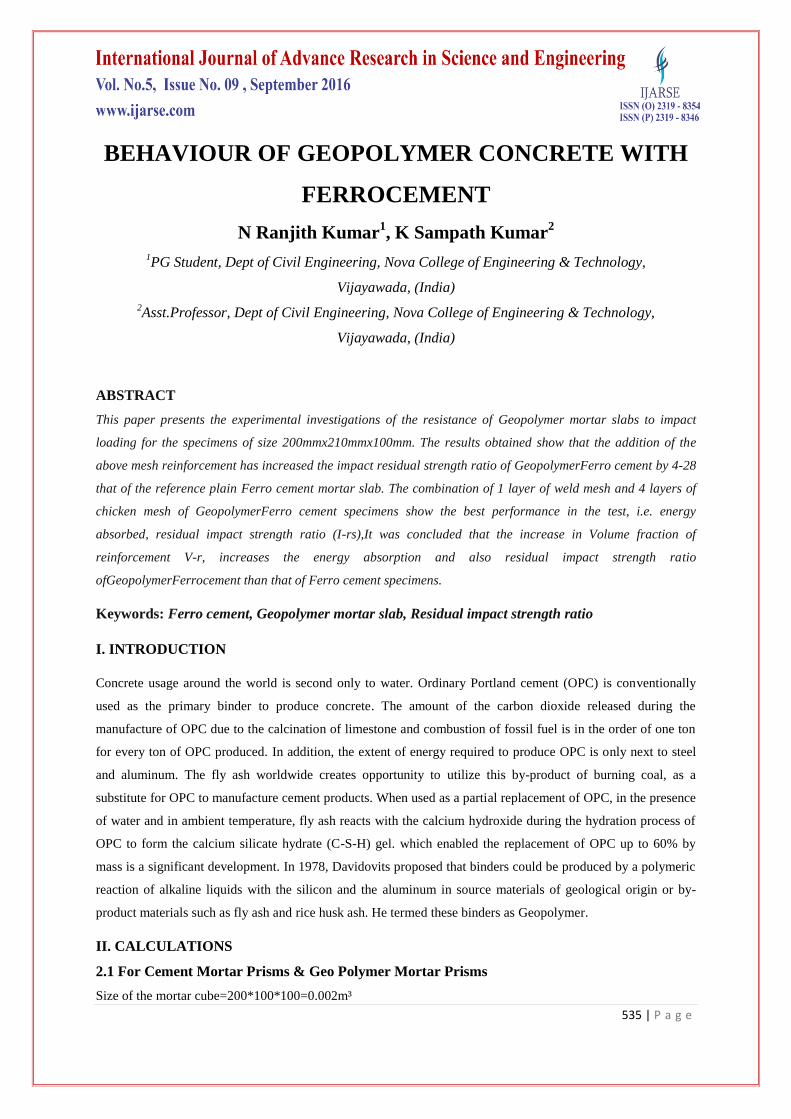
Table 1: Comparison of compressive strength values for Geopolymer mortar and cement mortar for different layers.
Fig.1 Graphical representation of compressive strength values of Geopolymer mortar with different ratios.
537 | P a g e
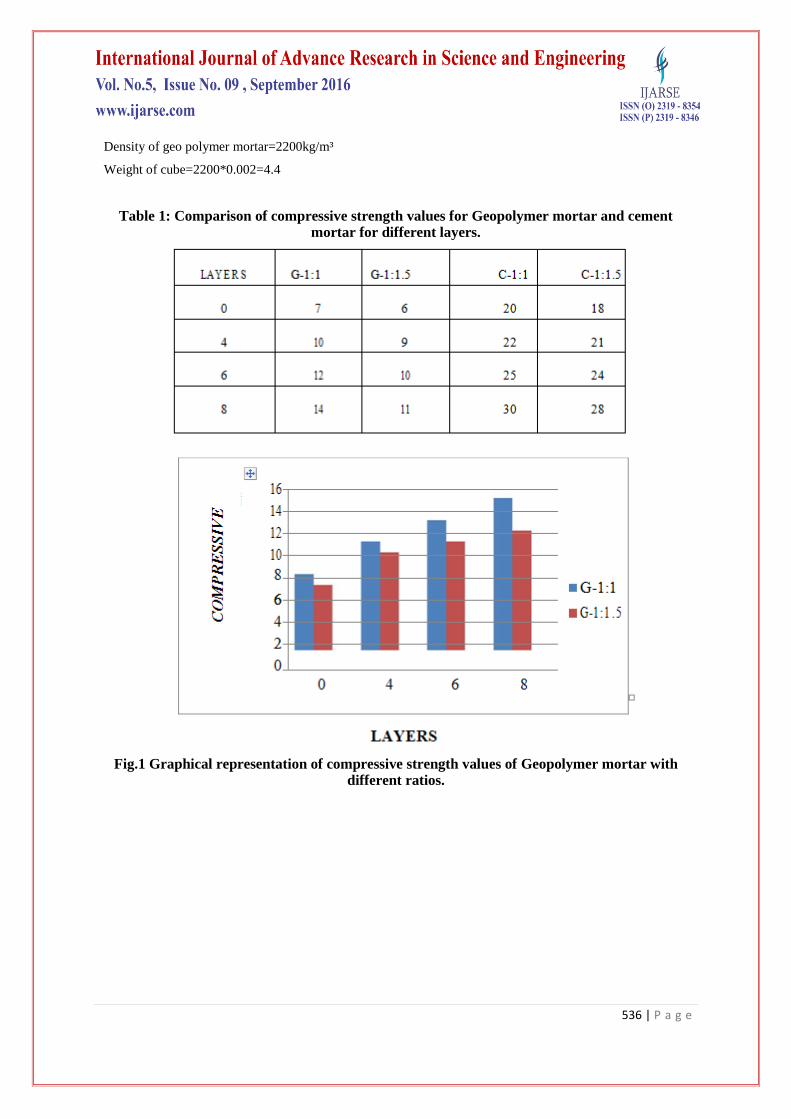
Fig.2 Graphical representation of compressive strength values of cement mortar with ratios
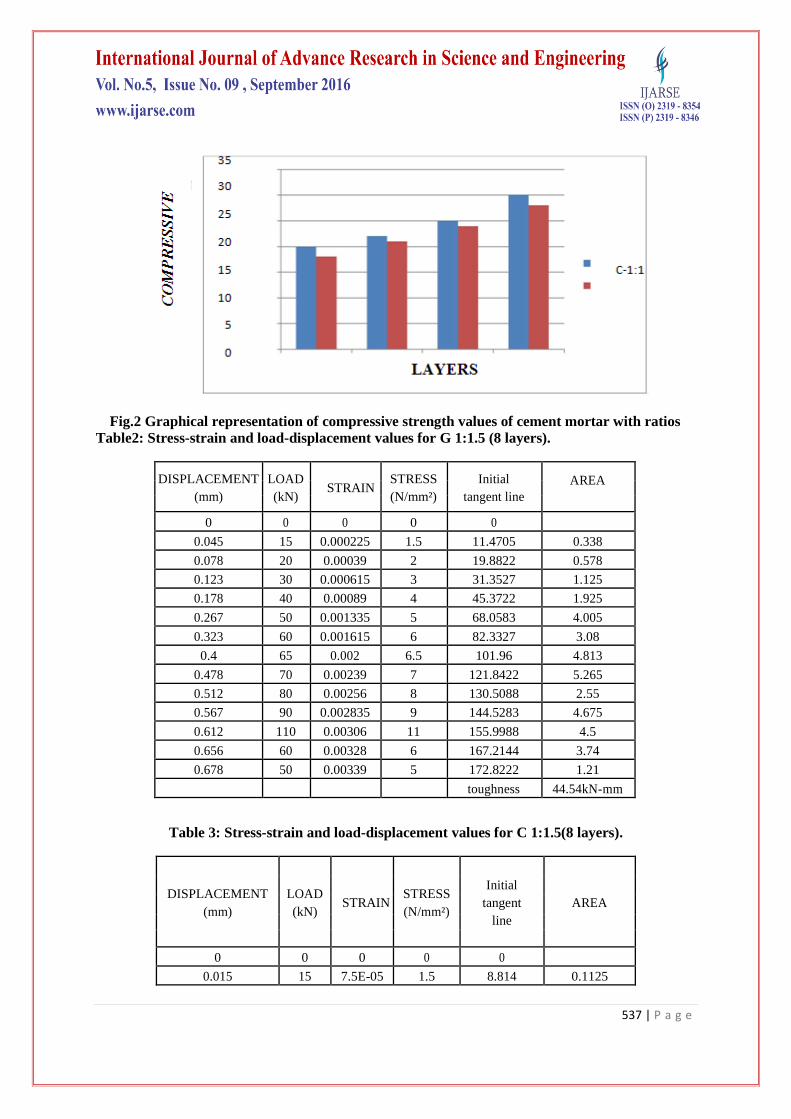
Table2: Stress-strain and load-displacement values for G 1:1.5 (8 layers).
DISPLACEMENT
(mm)
LOAD
(kN) STRAIN
STRESS
(N/mm²)
Initial
tangent line
AREA
0 0 0 0 0
0.045 15 0.000225 1.5 11.4705 0.338
0.078 20 0.00039 2 19.8822 0.578
0.123 30 0.000615 3 31.3527 1.125
0.178 40 0.00089 4 45.3722 1.925
0.267 50 0.001335 5 68.0583 4.005
0.323 60 0.001615 6 82.3327 3.08
0.4 65 0.002 6.5 101.96 4.813
0.478 70 0.00239 7 121.8422 5.265
0.512 80 0.00256 8 130.5088 2.55
0.567 90 0.002835 9 144.5283 4.675
0.612 110 0.00306 11 155.9988 4.5
0.656 60 0.00328 6 167.2144 3.74
0.678 50 0.00339 5 172.8222 1.21
toughness 44.54kN-mm
Table 3: Stress-strain and load-displacement values for C 1:1.5(8 layers).
DISPLACEMENT
(mm)
LOAD
(kN) STRAIN
STRESS
(N/mm²)
Initial
tangent
line
AREA
0 0 0 0 0
0.015 15 7.5E-05 1.5 8.814 0.1125
538 | P a g e
0.034 20 0.00017 2 19.9784 0.3325
0.054 30 0.00027 3 31.7304 0.5
0.076 40 0.00038 4 44.6576 0.77
0.098 50 0.00049 5 57.5848 0.99
0.121 60 0.00061 6 71.0996 1.265
0.154 70 0.00077 7 90.4904 2.145
0.189 80 0.00095 8 111.0564 2.625
0.212 90 0.00106 9 124.5712 1.955
0.234 100 0.00117 10 137.4984 2.09
0.267 110 0.00134 11 156.8892 3.465
0.283 130 0.00142 13 166.2908 1.92
0.312 150 0.00156 15 183.3312 1.885
0.356 170 0.00178 17 209.1856 2.31
0.376 180 0.00188 18 220.9376 3.5
0.389 190 0.00195 19 228.5764 2.405
0.412 200 0.00206 20 242.0912 4.485
0.445 210 0.00223 21 261.482 6.765
0.489 220 0.00245 22 287.3364 9.46
0.512 230 0.00256 23 300.8512 5.175
0.545 270 0.00273 27 320.242 8.25
0.589 240 0.00295 24 346.0964 11.22
toughness= 80.435KN-mm
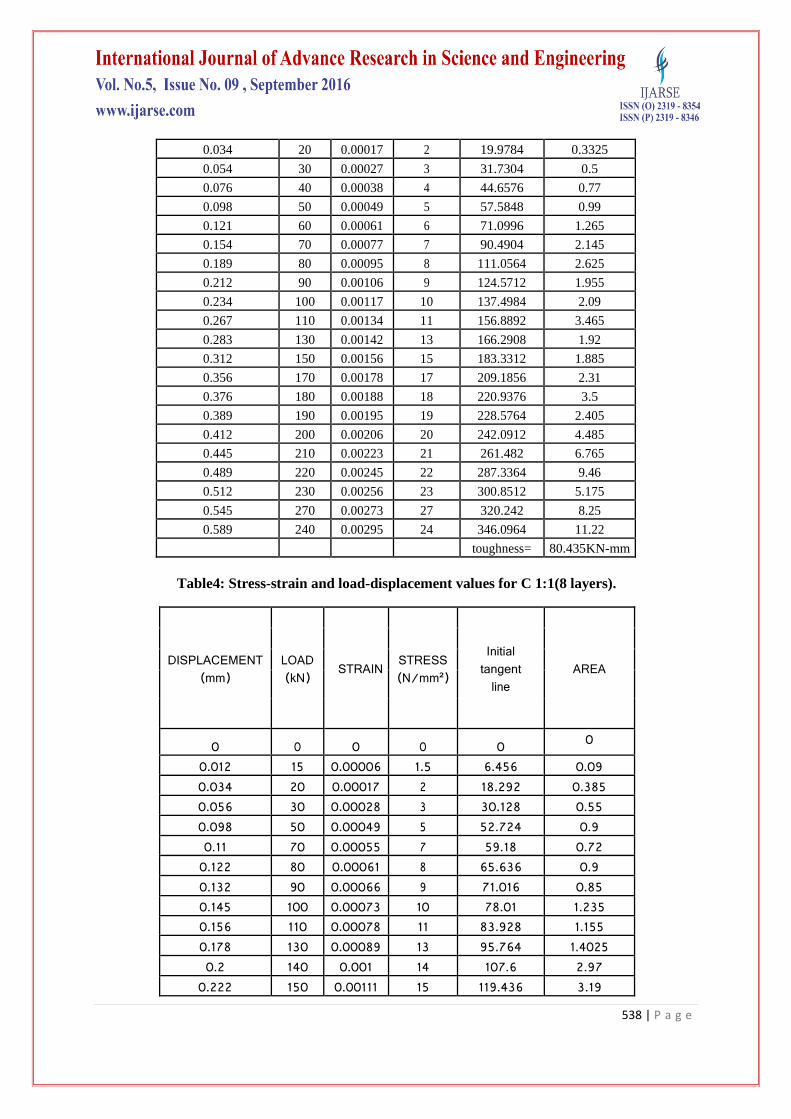
Table4: Stress-strain and load-displacement values for C 1:1(8 layers).
DISPLACEMENT (mm)
LOAD (kN) STRAIN STRESS
(N/mm²) Initial
tangent line
AREA
0 0 0 0 0 0 0.012 15 0.00006 1.5 6.456 0.09 0.034 20 0.00017 2 18.292 0.385 0.056 30 0.00028 3 30.128 0.55 0.098 50 0.00049 5 52.724 0.9 0.11 70 0.00055 7 59.18 0.72
0.122 80 0.00061 8 65.636 0.9 0.132 90 0.00066 9 71.016 0.85 0.145 100 0.00073 10 78.01 1.235 0.156 110 0.00078 11 83.928 1.155 0.178 130 0.00089 13 95.764 1.4025 0.2 140 0.001 14 107.6 2.97
0.222 150 0.00111 15 119.436 3.19
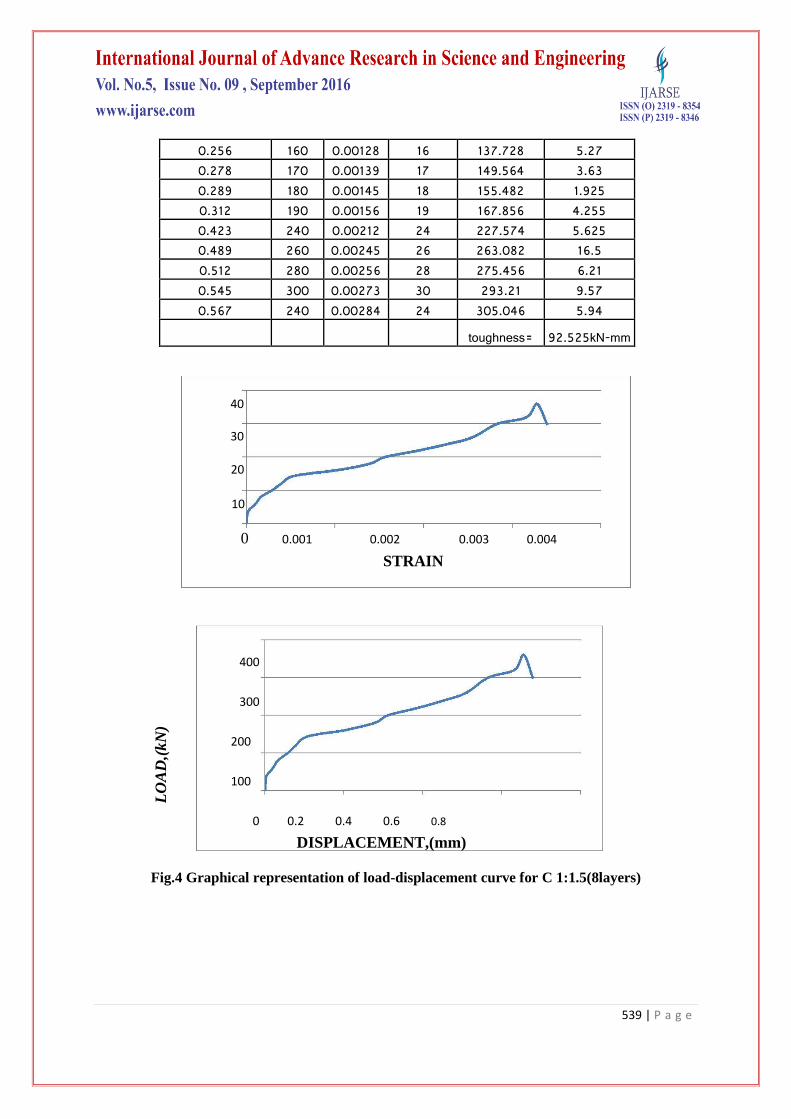
539 | P a g e
0.256 160 0.00128 16 137.728 5.27 0.278 170 0.00139 17 149.564 3.63 0.289 180 0.00145 18 155.482 1.925 0.312 190 0.00156 19 167.856 4.255 0.423 240 0.00212 24 227.574 5.625 0.489 260 0.00245 26 263.082 16.5 0.512 280 0.00256 28 275.456 6.21 0.545 300 0.00273 30 293.21 9.57 0.567 240 0.00284 24 305.046 5.94
toughness= 92.525kN-mm
40 30
20
10
0 0.001 0.002 0.003 0.004 STRAIN
400
300
200
100
0 0.2 0.4 0.6 0.8
DISPLACEMENT,(mm)
Fig.4 Graphical representation of load-displacement curve for C 1:1.5(8layers)
LO
AD
,(k
N)
540 | P a g e
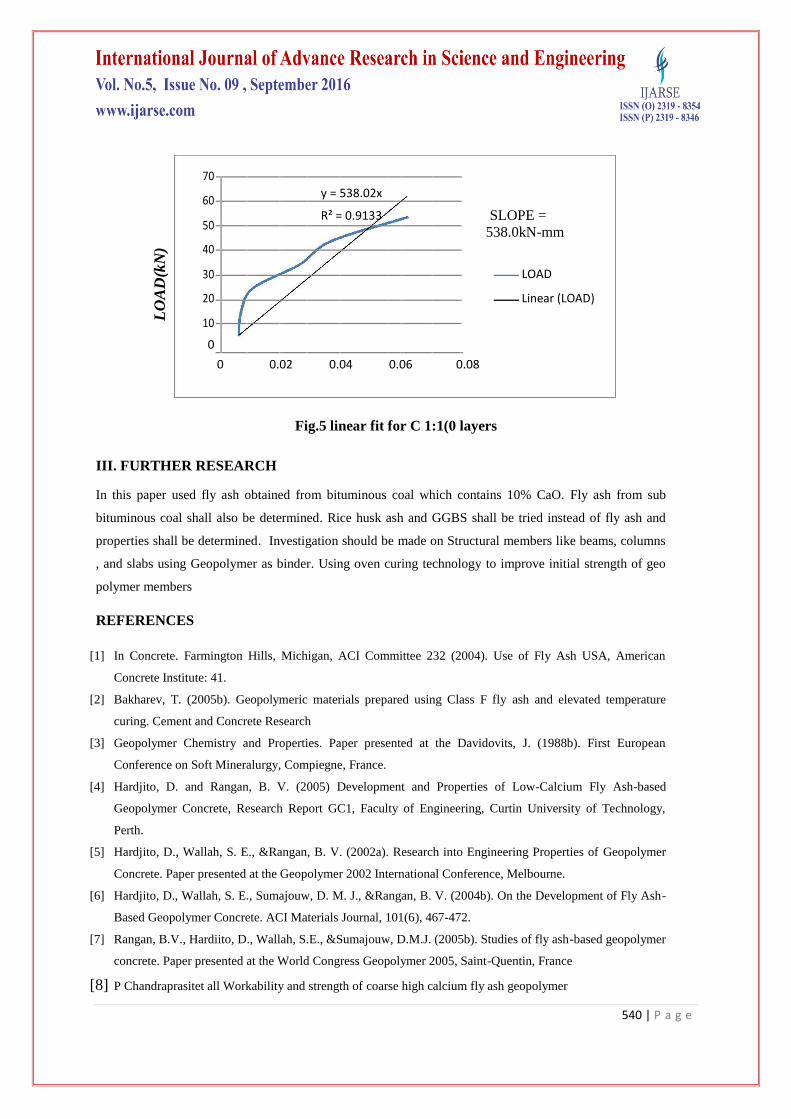
Fig.5 linear fit for C 1:1(0 layers
III. FURTHER RESEARCH
In this paper used fly ash obtained from bituminous coal which contains 10% CaO. Fly ash from sub
bituminous coal shall also be determined. Rice husk ash and GGBS shall be tried instead of fly ash and
properties shall be determined. Investigation should be made on Structural members like beams, columns
, and slabs using Geopolymer as binder. Using oven curing technology to improve initial strength of geo
polymer members
REFERENCES
[1] In Concrete. Farmington Hills, Michigan, ACI Committee 232 (2004). Use of Fly Ash USA, American
Concrete Institute: 41.
[2] Bakharev, T. (2005b). Geopolymeric materials prepared using Class F fly ash and elevated temperature
curing. Cement and Concrete Research
[3] Geopolymer Chemistry and Properties. Paper presented at the Davidovits, J. (1988b). First European
Conference on Soft Mineralurgy, Compiegne, France.
[4] Hardjito, D. and Rangan, B. V. (2005) Development and Properties of Low-Calcium Fly Ash-based
Geopolymer Concrete, Research Report GC1, Faculty of Engineering, Curtin University of Technology,
Perth.
[5] Hardjito, D., Wallah, S. E., &Rangan, B. V. (2002a). Research into Engineering Properties of Geopolymer
Concrete. Paper presented at the Geopolymer 2002 International Conference, Melbourne.
[6] Hardjito, D., Wallah, S. E., Sumajouw, D. M. J., &Rangan, B. V. (2004b). On the Development of Fly Ash-
Based Geopolymer Concrete. ACI Materials Journal, 101(6), 467-472.
[7] Rangan, B.V., Hardiito, D., Wallah, S.E., &Sumajouw, D.M.J. (2005b). Studies of fly ash-based geopolymer
concrete. Paper presented at the World Congress Geopolymer 2005, Saint-Quentin, France
[8] P Chandraprasitet all Workability and strength of coarse high calcium fly ash geopolymer
LO
AD
(kN
) 70
y = 538.02x
60
R² = 0.9133
SLOPE =
50
538.0kN-mm
40
30
LOAD
20 Linear (LOAD)
10
0
0 0.02 0.04 0.06 0.08