Embed Size (px)
Citation preview
Benchmark of Distra Universal Payments Platform on Cisco VBlock
Infrastructure
May 2011
Confidential and Copyright © Distra Pty Ltd
Cisco UCS Benchmark Report - May 2011
Distra UPP Performance - Cisco UCS Benchmark Report Page 2 of 42
TABLE OF CONTENTS Table Of Contents ............................................................2
1 Executive Summary ....................................................4 1.1 Bare Metal Benchmark ............................................................ 6 1.2 Virtualized Environment Benchmark .......................................... 9 1.3 Benchmark Assessment ........................................................ 10
2 Benchmark Methodology ............................................ 14 2.1 Document Overview ............................................................. 14 2.2 Objectives ........................................................................... 14 2.3 Deliverables ........................................................................ 14
3 Environments .......................................................... 16 3.1 The VBlock Platform ............................................................. 16
3.1.1 Logical Configuration ......................................................... 17 3.1.2 Server Configuration ......................................................... 18 3.1.3 Storage Configuration ........................................................ 18 3.1.4 Operating System ............................................................. 19 3.1.5 Database Configuration ...................................................... 19 3.1.6 Java Runtime Environment ................................................. 20
3.2 Distra Software .................................................................... 20 3.2.1 Executive ......................................................................... 20 3.2.2 EFT Configuration .............................................................. 21
4 Bare Metal Benchmark Results and Analysis ................... 22 4.1 Scalability Demonstration ...................................................... 22
4.1.1 Overview ......................................................................... 22 4.1.2 CPU Utilization .................................................................. 23 4.1.3 Memory Utilization ............................................................ 24 4.1.4 Network Utilization ............................................................ 25 4.1.5 Disk Utilization .................................................................. 26 4.1.6 Message Latency ............................................................... 27 4.1.7 Conclusions ...................................................................... 27
4.2 Longevity Demonstration ....................................................... 28 4.2.1 Overview ......................................................................... 28 4.2.2 Conclusions ...................................................................... 29
4.3 Failure and Recovery Demonstration ....................................... 29 4.3.1 UPP Failover ..................................................................... 29
4.4 Conclusions ......................................................................... 31
5 Virtualized Benchmark ............................................... 33 5.1 Overview ............................................................................ 33 5.2 Scalability Demonstration ...................................................... 33
Cisco UCS Benchmark Report - May 2011
Executive Summary
Distra UPP Performance - Cisco UCS Benchmark Report Page 3 of 42
5.2.1 Sunny Day Test ................................................................ 34 5.2.2 CPU Load Distribution ........................................................ 36
5.3 Failover Demonstration ......................................................... 36 5.3.1 Rainy Day Test – Failover and Delayed Response .................. 36 5.3.2 Rainy Day Test – Failover with No Response ......................... 38
6 Benchmark Conclusions and Observations ..................... 40 6.1 Scalability Demonstration ...................................................... 40 6.2 Longevity Demonstration ....................................................... 41 6.3 Failure and Recovery Demonstration ....................................... 42
Cisco UCS Benchmark Report - May 2011
Executive Summary
Distra UPP Performance - Cisco UCS Benchmark Report Page 4 of 42
1 EXECUTIVE SUMMARY Distra and Cisco successfully conducted benchmark tests of the Distra Universal
Payments Platform on Cisco VBlock infrastructure that demonstrated sustained
performance of over 3000 payment transactions per second, low message
latency of less than 150 milliseconds, and robust failover and recovery in both
dedicated and virtualized configurations.
The demand for cost effective real-time payments from point-of-sale, ATM,
Internet, and mobile devices from both consumer and corporate customers
continues to grow. Payment transactions need to be more flexible and
sophisticated, carrying data about items purchased, calculating real-time
discounts, splitting payments over several accounts, including loyalty points,
returning targeted sales offers and adapting to the latest fraud prevention and
regulations – all in real-time.
The Distra Universal Payments Platform (UPP) is an agile, pure Java, real-time,
high availability (99.999%) solution that meets the latest payment market
demands using cost-effective, fault-tolerant, scalable infrastructure. The Distra
UPP is production proven in Tier 1 clients and is message agnostic, handling the
market demands for value-added data with the payments.
Cisco and partners VMware and EMC have created a flexible, highly integrated,
easy to manage next generation computing platform called VBlock, delivered in
discrete sizes and with one support point from their VCE joint venture. VBlock is
a robust, stable and highly scalable platform for UPP deployments.
Cisco UCS Benchmark Report - May 2011
Executive Summary
Distra UPP Performance - Cisco UCS Benchmark Report Page 5 of 42
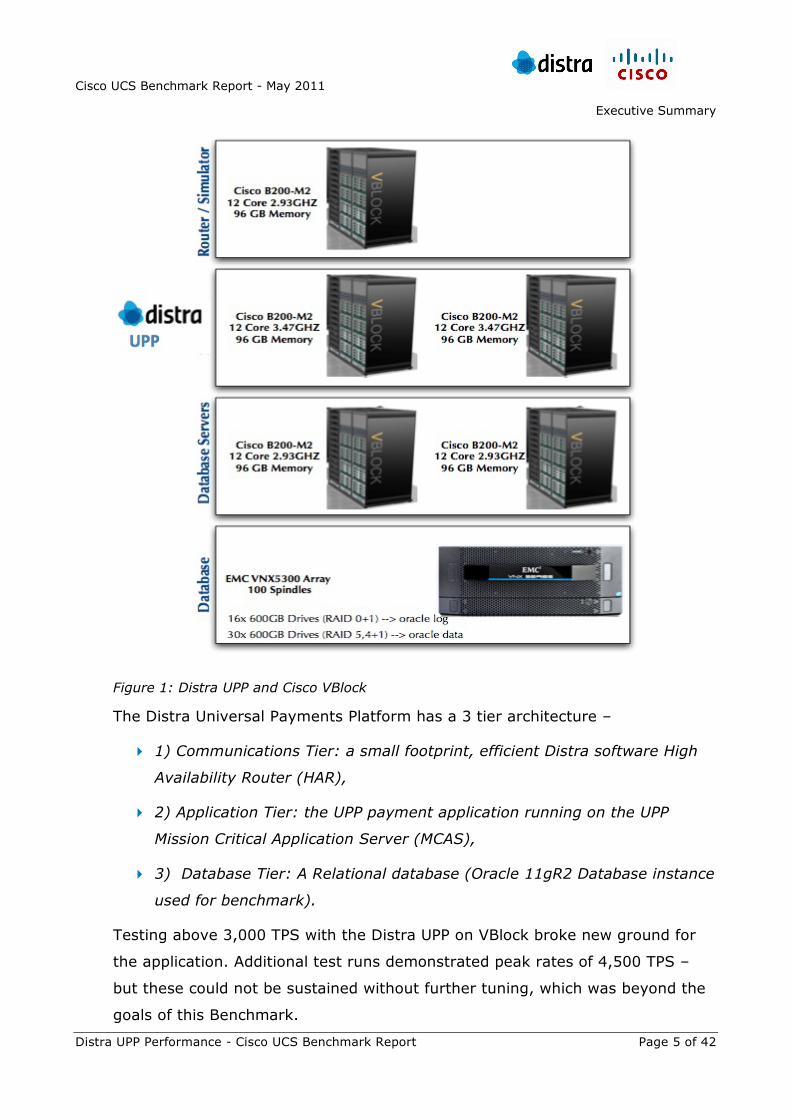
Figure 1: Distra UPP and Cisco VBlock
The Distra Universal Payments Platform has a 3 tier architecture –
1) Communications Tier: a small footprint, efficient Distra software High
Availability Router (HAR),
2) Application Tier: the UPP payment application running on the UPP
Mission Critical Application Server (MCAS),
3) Database Tier: A Relational database (Oracle 11gR2 Database instance
used for benchmark).
Testing above 3,000 TPS with the Distra UPP on VBlock broke new ground for
the application. Additional test runs demonstrated peak rates of 4,500 TPS –
but these could not be sustained without further tuning, which was beyond the
goals of this Benchmark.
Cisco UCS Benchmark Report - May 2011
Executive Summary
Distra UPP Performance - Cisco UCS Benchmark Report Page 6 of 42
These tests prove how both the Distra UPP and VBlock deliver significant
business advantages in key areas, that include:
Reduced TCO
Scalability
High Performance
High Availability
Integrated Management
Simplified Deployment
Support of either Virtualized or non-virtualized environments
Benchmarking tests were conducted with the Distra UPP in both Bare Metal
VBlock and Virtualized VBlock environments to demonstrate the performance of
the Distra UPP and the flexibility of VBlock using the following key
measurements:
Scalability – scalable performance, up to 3,000 TPS with low latency,
Longevity – continuous operation at high throughput for extended
periods, and
Failure & Recovery - automated failure and recovery for high reliability
and availability.
1.1 BARE METAL BENCHMARK The Distra UPP was installed on an 8-slot UCS chassis with 6 dual socket blades
as illustrated above. Each software tier for the Bare Metal Benchmark was run
on a separate server blade. The UPP Application and DB Tiers each ran on
servers with 96GB of memory and dual 3.46GHz 6-core CPUs. The HAR
Communications Tier ran on 2.93GHz CPUs. An EMC VNX 5300 disk array with
100 15K drives delivered all storage. Databases were on 30 RAID 5 (4+1) disks
with Log Files on 8 disks in RAID 1. This environment was designed for 3000
TPS with sufficient resources to handle higher peaks and failover/recovery.
Cisco UCS Benchmark Report - May 2011
Executive Summary
Distra UPP Performance - Cisco UCS Benchmark Report Page 7 of 42
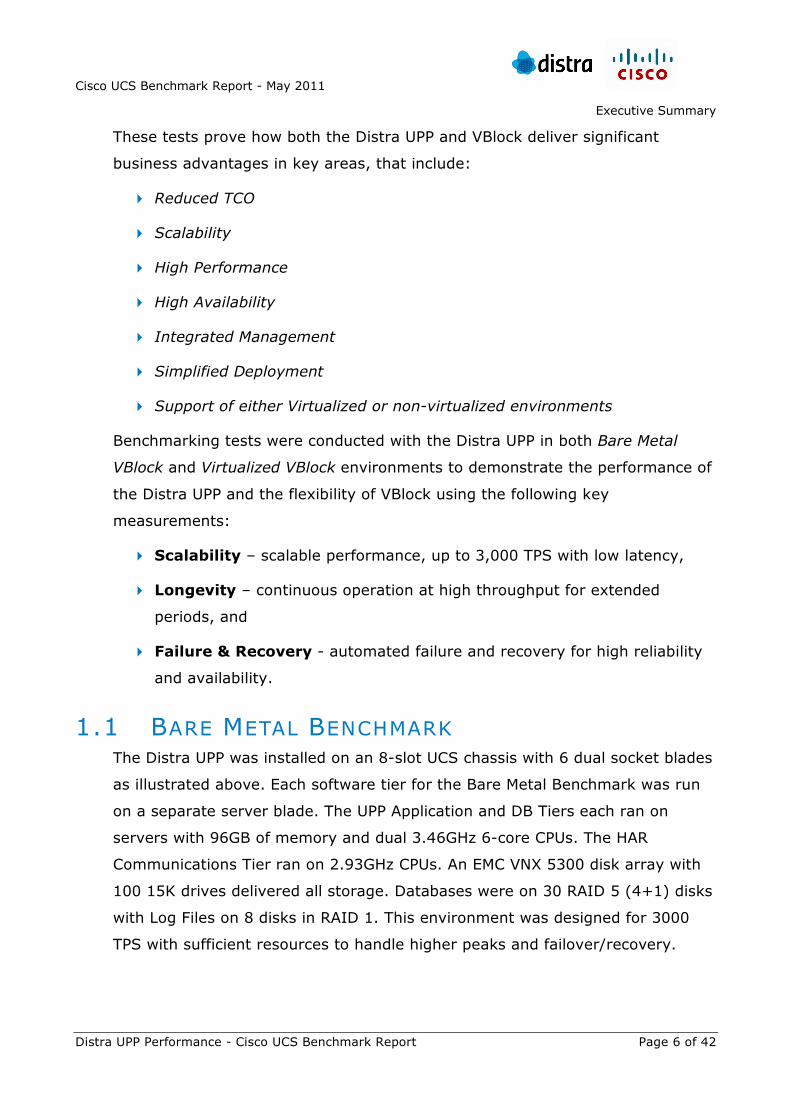
The graph below plots the average and peak CPU and the RAM utilized for the
UPP-1 Server Application Tier for benchmark test loads of 500; 1,000; 2,000
and 3000 TPS on Bare Metal. The results show significant headroom in the bare
metal implementation of the Distra UPP – with the platform scaling linearly with
TPS load.
Figure 2: UPP TPS versus CPU Utilization on non-Virtualized VBlock
The longevity results (page 28) show peak UPP-1 Application Tier server CPU
utilization at 37% for a 10 hour sustained 3,000 TPS load. This shows the bare
metal environment has significant transaction processing headroom. Memory,
CPU or Disk resource could be reduced and throughput still exceed our 3,000
TPS target performance. Alternatively, available resources could be virtualized
to place all physical servers on a single partitioned blade as described in the
next section about the Virtualized Environment Benchmark tests.
Note:
1) Complete financial transactions were counted, consisting of matched request and response message for each transaction and each message being persisted before transmission.
Cisco UCS Benchmark Report - May 2011
Executive Summary
Distra UPP Performance - Cisco UCS Benchmark Report Page 8 of 42
2) The CPU Utilization as load increased, was measured only on the Application Tier server as the load on the Communications Tier and Database Tier servers was minimal.
3) The application configuration directed all transaction loads to a single application server for processing (alternate server continued to replicate). This allowed clearer illustration of the maximum processing limits of the Application Tier and the platforms ability to failover and recover to the alternate server under full load.
Tests on the Distra UPP running on the VBlock platform also evaluated the fault
tolerant behaviour of the application. This was demonstrated by killing the
primary load processing UPP instance. We observed the automatic recovery of
processing on the secondary UPP instance. The load automatically migrated
back to the failed UPP instance once it recovered.
The 3,000 TPS target was quickly achieved with a stable validation run
averaging 3,000 TPS over 10 hours. Analysis showed the hardware had plenty
of spare capacity (>50% CPU headroom) at the targeted 3,000 TPS benchmark.
The platform proved capable of high throughput; running reliably at 3,000 TPS
with message latencies of approximately 100ms.
The VBlock hardware configuration with two CPU Intel Xeon X5690 @ 3.47GHz
processors running a JVM with 16GB of heap allocation was more than sufficient
for processing 3,000 TPS. Results demonstrated the potential for the Distra UPP
platform to process transactions at a rate that exceeds 3,000 TPS on the VBlock
hardware.
Positive performance results:
Longevity - The Distra UPP platform demonstrated stable operation for
sustained periods at over 3,000 TPS.
Scalability/CPU Utilization - System performance of the primary UPP
during the demonstration had a low and stable CPU utilization of 30% and
memory utilization of 16 GB of RAM.
Failover and Recovery - The system showed ample headroom available to
handle traffic spikes, peak rates and failover activities.
Cisco UCS Benchmark Report - May 2011
Executive Summary
Distra UPP Performance - Cisco UCS Benchmark Report Page 9 of 42
More detail about the hardware and software configurations, tests and results is
presented in the following sections.
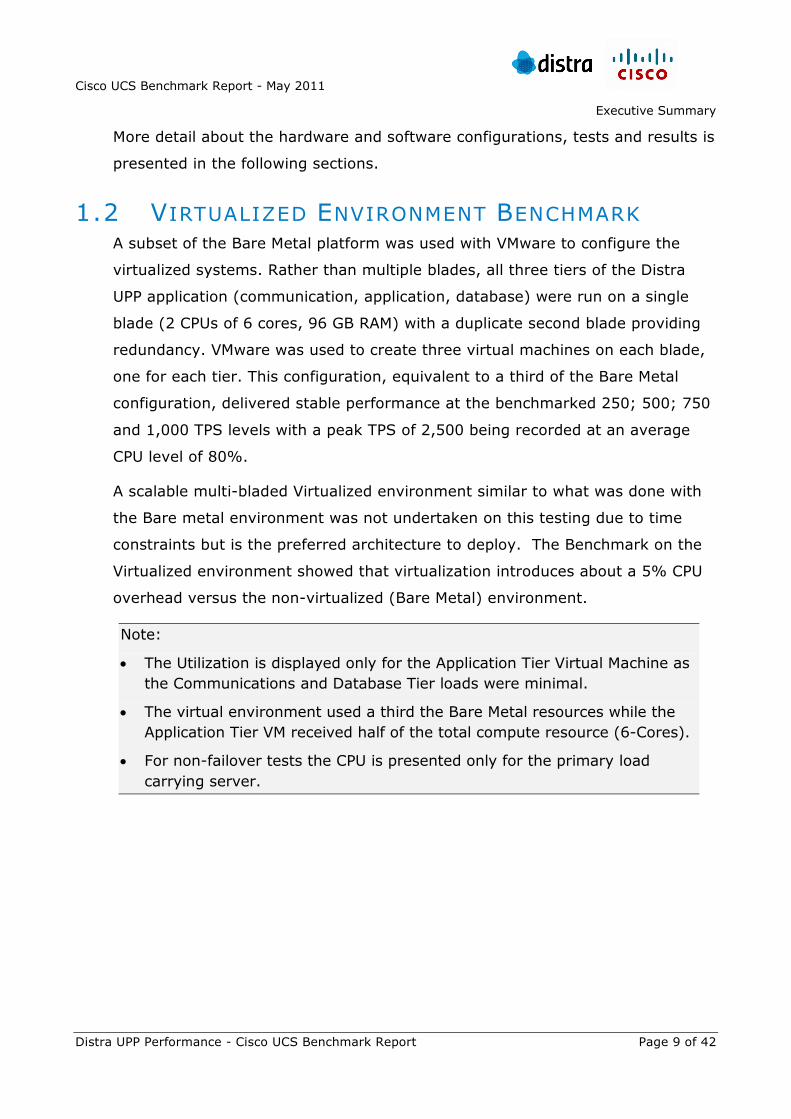
1.2 VIRTUALIZED ENVIRONMENT BENCHMARK A subset of the Bare Metal platform was used with VMware to configure the
virtualized systems. Rather than multiple blades, all three tiers of the Distra
UPP application (communication, application, database) were run on a single
blade (2 CPUs of 6 cores, 96 GB RAM) with a duplicate second blade providing
redundancy. VMware was used to create three virtual machines on each blade,
one for each tier. This configuration, equivalent to a third of the Bare Metal
configuration, delivered stable performance at the benchmarked 250; 500; 750
and 1,000 TPS levels with a peak TPS of 2,500 being recorded at an average
CPU level of 80%.
A scalable multi-bladed Virtualized environment similar to what was done with
the Bare metal environment was not undertaken on this testing due to time
constraints but is the preferred architecture to deploy. The Benchmark on the
Virtualized environment showed that virtualization introduces about a 5% CPU
overhead versus the non-virtualized (Bare Metal) environment.
Note:
• The Utilization is displayed only for the Application Tier Virtual Machine as the Communications and Database Tier loads were minimal.
• The virtual environment used a third the Bare Metal resources while the Application Tier VM received half of the total compute resource (6-Cores).
• For non-failover tests the CPU is presented only for the primary load carrying server.
Cisco UCS Benchmark Report - May 2011
Executive Summary
Distra UPP Performance - Cisco UCS Benchmark Report Page 10 of 42
Figure 3: UPP TPS versus CPU Utilization on Virtualized VBlock
Virtualizing the Distra UPP onto a single blade (paired with a fail-over unit)
showed this combination, using VMware on a mini-VBlock, is stable, provides
fault tolerance, and is capable of transaction rates of 1,000 TPS. Higher rates
are possible for peak periods. The new B230 blade offers E2800 CPU’s, which
offer 20 cores (@ 2.26 GHz). The B230 blade could be configured with 2 core
for communications, 14 cores for the application and 6 cores for database
providing more resources to the Universal Payments Platform to achieve even
higher transaction per second processing rates.
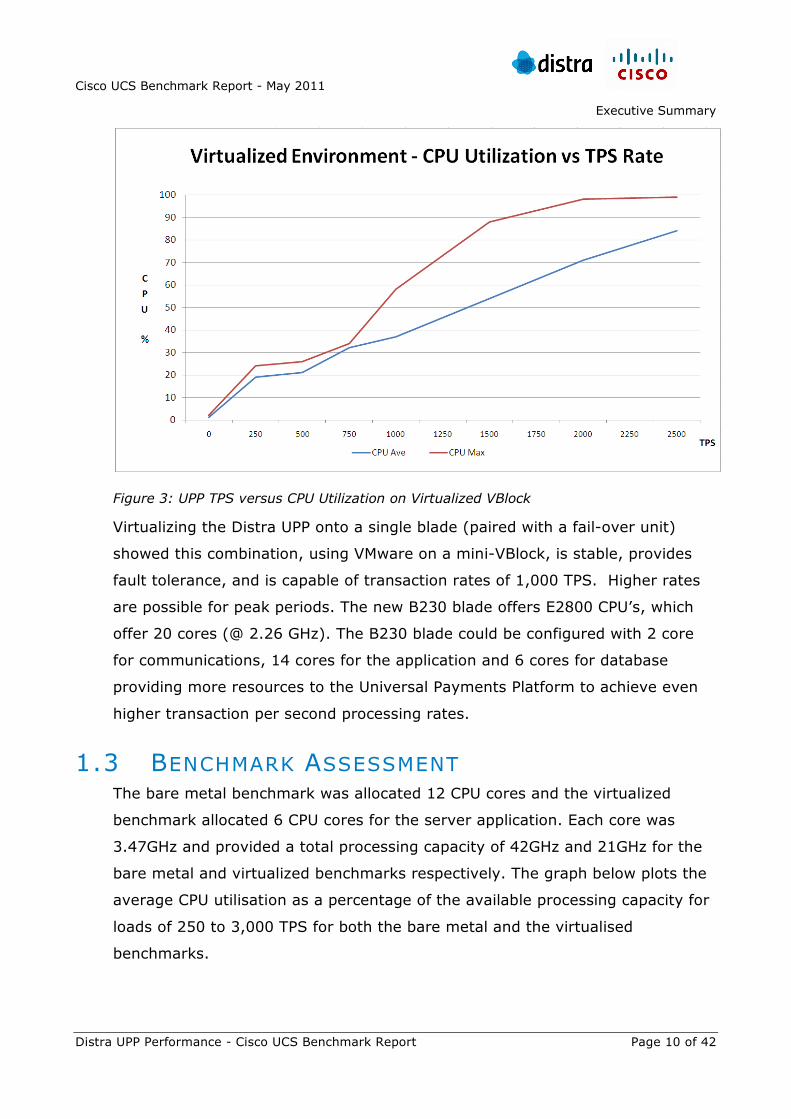
1.3 BENCHMARK ASSESSMENT The bare metal benchmark was allocated 12 CPU cores and the virtualized
benchmark allocated 6 CPU cores for the server application. Each core was
3.47GHz and provided a total processing capacity of 42GHz and 21GHz for the
bare metal and virtualized benchmarks respectively. The graph below plots the
average CPU utilisation as a percentage of the available processing capacity for
loads of 250 to 3,000 TPS for both the bare metal and the virtualised
benchmarks.
Cisco UCS Benchmark Report - May 2011
Executive Summary
Distra UPP Performance - Cisco UCS Benchmark Report Page 11 of 42
These results show significant headroom in the bare metal benchmark with the
platform scaling linearly with TPS load and less headroom for the virtualized
environment.
Figure 4: UPP Raw CPU Comparison Virtualized vs Bare Metal
Cisco UCS Benchmark Report - May 2011
Executive Summary
Distra UPP Performance - Cisco UCS Benchmark Report Page 12 of 42
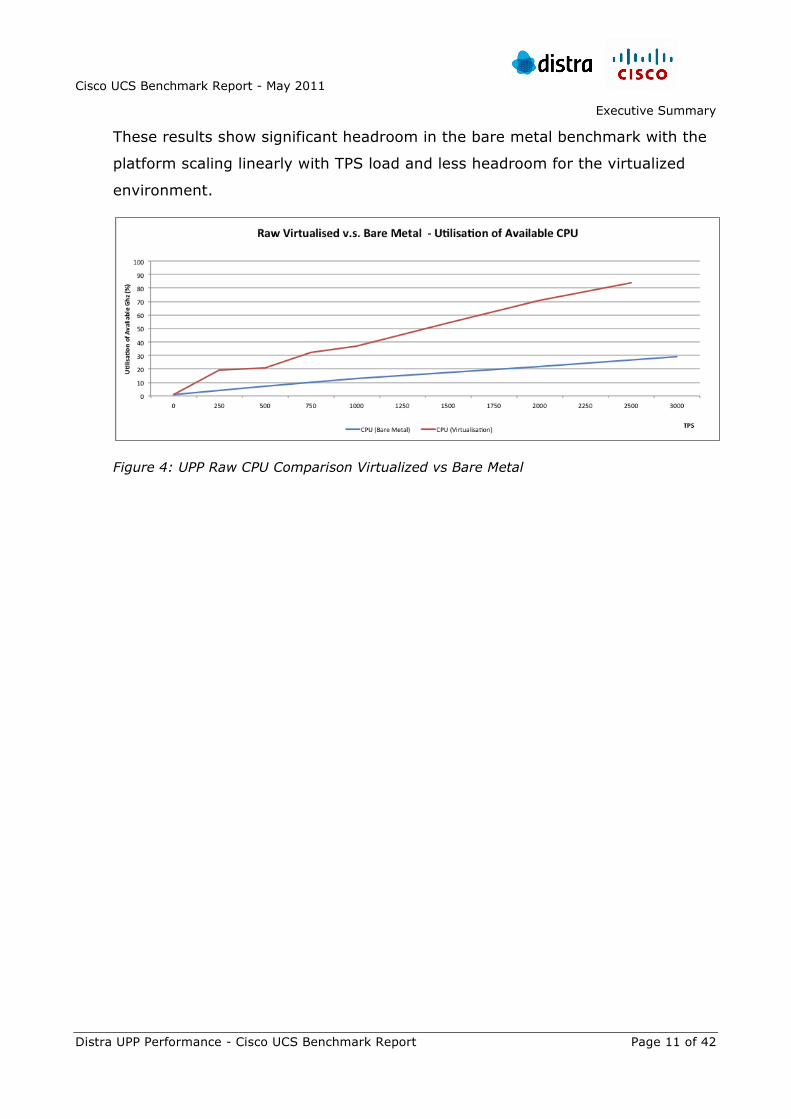
The following graph plots the CPU usage of the two benchmark tests but
normalises the available CPU so that a direct comparison of the two tests can
be made. The Virtualized environment uses a greater percentage of the 21GHz
available to it but the Bare Metal environment uses less in real terms and as a
percentage of its available 42GHz.
This graph shows that there is small processing overhead when running the UPP
in the virtualised environment, particularly in the measured range 0 – 1,000
TPS which was common to both tests.
Figure 5: Normalised UPP Virtualized vs Bare Metal CPU Utilization at Increasing TPS Rate
These benchmark results were achieved with minimal tuning. Access to the
platform was limited and it is possible to tune the system to gain additional
improvements in performance.
Cisco UCS Benchmark Report - May 2011
Executive Summary
Distra UPP Performance - Cisco UCS Benchmark Report Page 13 of 42
The virtualized testing at load levels up to 1,000TPS on a single blade, and the
Bare Metal testing at over 3,000TPS, confirmed that the Distra UPP running on
a Cisco VBlock system can be configured for emerging markets requirements
and scale dynamically to meet the growing transaction volumes of Tier One
clients.
Cisco UCS Benchmark Report - May 2011
Distra UPP Performance - Cisco UCS Benchmark Report Page 14 of 42
2 BENCHMARK METHODOLOGY 2.1 DOCUMENT OVERVIEW
This report documents the Distra Universal Payments Platform April-May 2011
Benchmarks on Cisco VBlock hardware in both Bare Metal (non-virtualized) and
Virtualized Environment configurations.
2.2 OBJECTIVES The objective of the Bare Metal benchmark was to run tests in the area of
scalability and performance and demonstrate processing and fault tolerance
capabilities at a rate of 3,000 TPS.
The objective of the Virtualized Environment benchmark was to run comparable
performance and fault tolerance tests for a lower, but still scalable, rate of
1,000 TPS. Additionally, ‘Rainy Day’ transaction scenarios were added into the
benchmark (delayed transaction response and no transaction response). As
these ‘Rainy Day’ testing scenarios were introduced late in the benchmarking
process there was insufficient time to tune the Distra UPP to perform at higher
than 1,000 TPS.
Note: ‘Rainy Day’ scenarios introduced reversal processing to the messaging flow, constituting extra legs in the transaction.
2.3 DELIVERABLES Distra undertook three performance related tests.
Scalability Demonstration
Distra UPP was operated with varying transaction loads for short periods
of time, to record and observe the CPU usage, memory usage, network
usage, disk usage and message latency.
Longevity Demonstration
The Distra UPP was run for 10 hours with a constant load of 3,000 TPS.
Failure and Recovery Demonstration
Cisco UCS Benchmark Report - May 2011
Benchmark Methodology
Distra UPP Performance - Cisco UCS Benchmark Report Page 15 of 42
The platform was subjected to application instance failure and subsequent
recovery at a high transaction load.
Cisco UCS Benchmark Report - May 2011
Distra UPP Performance - Cisco UCS Benchmark Report Page 16 of 42
3 ENVIRONMENTS 3.1 THE VBLOCK PLATFORM
The VBlock platform is an Intel based platform created by Cisco and partners
VMWare and EMC. The key components are UCS Server Blades, EMC storage and
a VMWare vSphere for virtualization. The VBlock is a flexible, highly integrated,
and manageable next generation computing platform. Distra saw the potential
for the VBlock to align with the Distra UPP platform and this exercise was used to
verify the fit and performance characteristics that could be achieved by running
on the VBlock.
The hardware included an 8-slot UCS chassis with 6 dual socket B2 blades. Each
blade had 96GB of memory and two 3.47GHz OR 2.93GHZ 6-core Xeon 5600
CPU’s. Storage was the EMC VNX 5300 array with 100 15K SAS drives. The
physical environment was located at the Cisco Labs in San Jose, California, while
the Distra Technical team was located in Sydney, Australia. The Cisco Vblock
management tools let technical tuning and remote operation be performed on
test equipment located half a world away with minimal physical intervention.
This indicates the VBLOCK remote support capacity for emerging market
environments.
Cisco UCS Benchmark Report - May 2011
Environments
Distra UPP Performance - Cisco UCS Benchmark Report Page 17 of 42
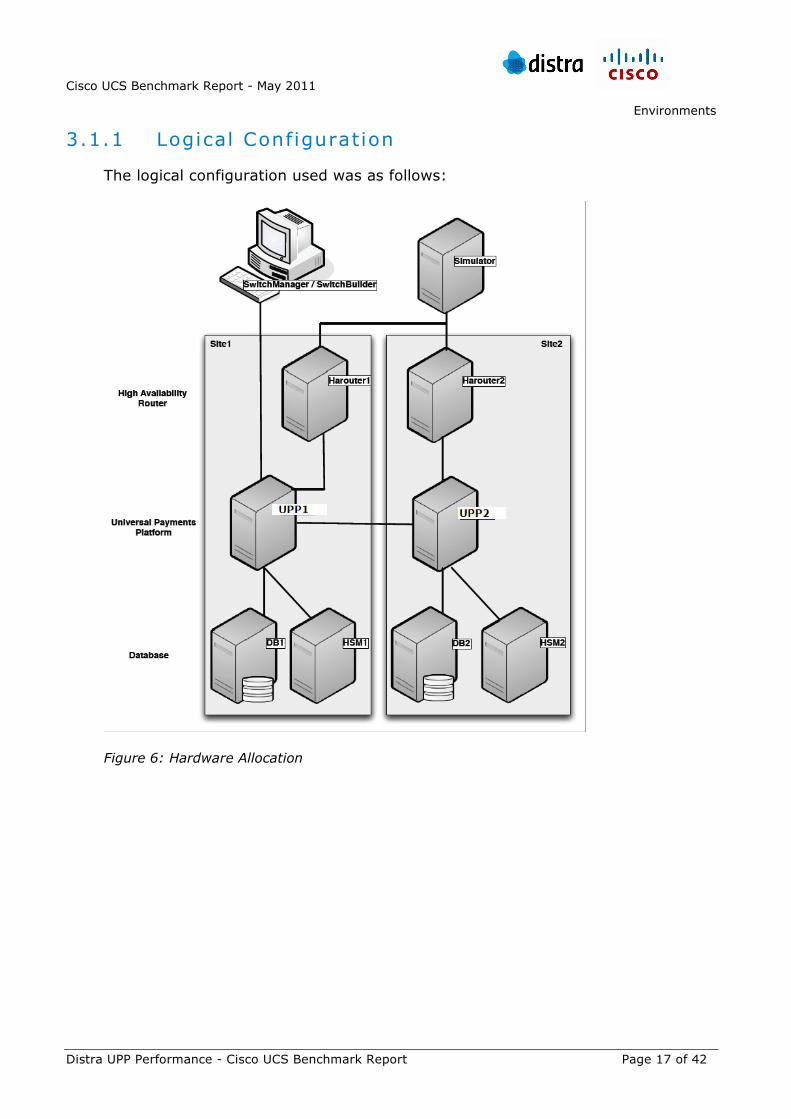
3.1.1 Logical Configuration
The logical configuration used was as follows:
Figure 6: Hardware Allocation
Cisco UCS Benchmark Report - May 2011
Environments
Distra UPP Performance - Cisco UCS Benchmark Report Page 18 of 42
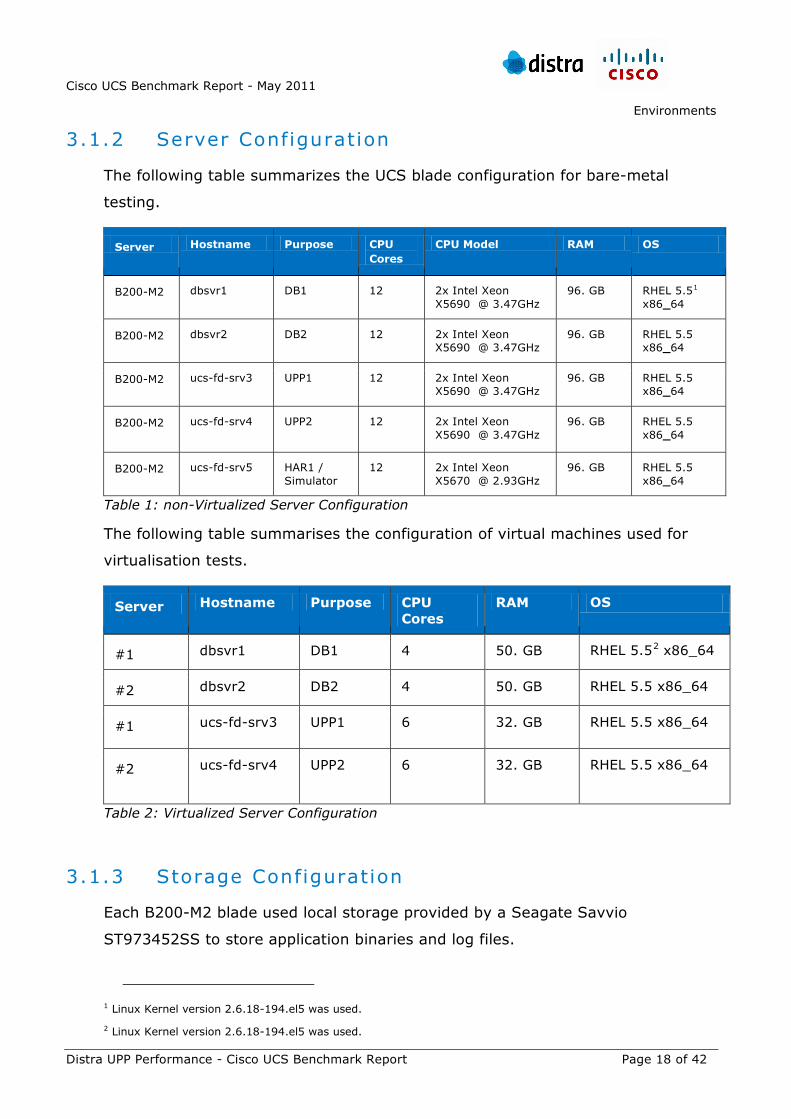
3.1.2 Server Configuration
The following table summarizes the UCS blade configuration for bare-metal
testing.
Server Hostname Purpose CPU Cores
CPU Model RAM OS
B200-M2 dbsvr1 DB1 12 2x Intel Xeon X5690 @ 3.47GHz
96. GB RHEL 5.51
B200-M2
x86_64
dbsvr2 DB2 12 2x Intel Xeon X5690 @ 3.47GHz
96. GB RHEL 5.5 x86_64
B200-M2 ucs-fd-srv3 UPP1 12 2x Intel Xeon X5690 @ 3.47GHz
96. GB RHEL 5.5 x86_64
B200-M2 ucs-fd-srv4 UPP2 12 2x Intel Xeon X5690 @ 3.47GHz
96. GB RHEL 5.5 x86_64
B200-M2 ucs-fd-srv5 HAR1 / Simulator
12 2x Intel Xeon X5670 @ 2.93GHz
96. GB RHEL 5.5 x86_64
Table 1: non-Virtualized Server Configuration
The following table summarises the configuration of virtual machines used for
virtualisation tests.
Server Hostname Purpose CPU Cores
RAM OS
#1 dbsvr1 DB1 4 50. GB RHEL 5.52
#2
x86_64
dbsvr2 DB2 4 50. GB RHEL 5.5 x86_64
#1 ucs-fd-srv3 UPP1 6 32. GB RHEL 5.5 x86_64
#2 ucs-fd-srv4 UPP2 6 32. GB RHEL 5.5 x86_64
Table 2: Virtualized Server Configuration
3.1.3 Storage Configuration
Each B200-M2 blade used local storage provided by a Seagate Savvio
ST973452SS to store application binaries and log files.
1 Linux Kernel version 2.6.18-194.el5 was used.
2 Linux Kernel version 2.6.18-194.el5 was used.
Cisco UCS Benchmark Report - May 2011
Environments
Distra UPP Performance - Cisco UCS Benchmark Report Page 19 of 42
The EMC VNX530 network storage device was used by both databases. The
VNX5300 was configured to utilize 76 of its 100 spindles. These 76 spindles were
split between each database server and split again into data and log groups.
Each drive was 600 GB 15K RPM. Twelve RAID 5 (4+1), and four RAID 1/0 (2/2)
raid groups were created. From each of the RAID 5 groups a 500 GB LUN was
created, and a 200 GB LUN cut from the RAID 1/0. Half of the available LUNs
were then exported via multiple paths to each database server using EMC
Powerpath. This gave each database server access to 6x 500GB of RAID5
storage for Oracle data and 2x 200 GB RAID 1/0 for Oracle logs. Oracle ASM
diskgroups were created to combine the separate LUNs into Oracle storage units.
Oracle ASM external fault tolerance was used.
For virtualized testing the same EMC VNX 5300 storage array was used with the
same partition allocations as used for bare-metal testing. All LUNS previously
accessed by the database servers were migrated to the new database virtual
machines. VMWare datastores were created from the local drives of the B200-
M2 servers for local storage on the UPP and HA Router servers. This effectively
created the same storage configuration as used with bare-metal testings.
3.1.4 Operating System
Red Hat Enterprise Linux Server release 5.5 (Tikanga).
3.1.5 Database Configuration
Oracle 11.2.0.1.0 Enterprise Edition was installed and storage configured with
ASM. Three TB of data storage and 400 GB for logs was available from the disk
array. The logs used a small fraction of the available space. The System Global
Area (SGA) was 37GB.
Each Oracle instance had the same configuration. Oracle was configured with a
single tablespace accessible to the distra user account that was utilized by the
Distra UPP platform for database access. The Distra Pre-installation Guide
documents the configuration process.
Cisco UCS Benchmark Report - May 2011
Environments
Distra UPP Performance - Cisco UCS Benchmark Report Page 20 of 42
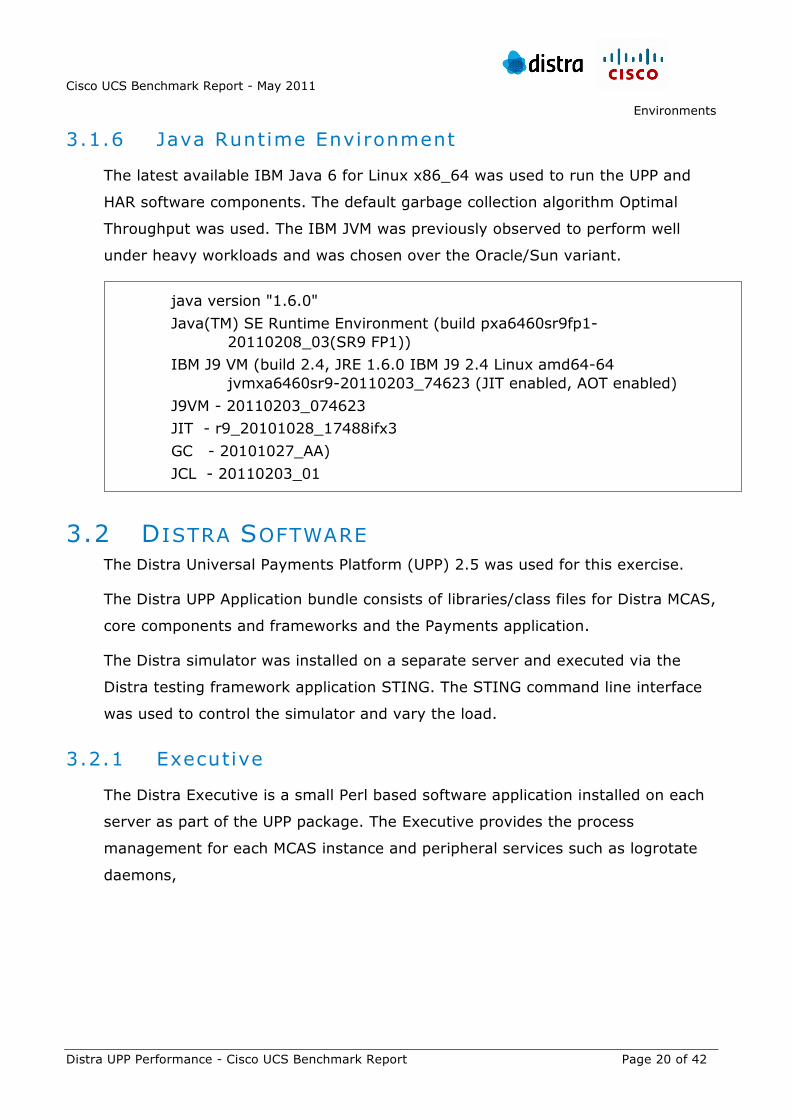
3.1.6 Java Runtime Environment
The latest available IBM Java 6 for Linux x86_64 was used to run the UPP and
HAR software components. The default garbage collection algorithm Optimal
Throughput was used. The IBM JVM was previously observed to perform well
under heavy workloads and was chosen over the Oracle/Sun variant.
3.2 DISTRA SOFTWARE The Distra Universal Payments Platform (UPP) 2.5 was used for this exercise.
The Distra UPP Application bundle consists of libraries/class files for Distra MCAS,
core components and frameworks and the Payments application.
The Distra simulator was installed on a separate server and executed via the
Distra testing framework application STING. The STING command line interface
was used to control the simulator and vary the load.
3.2.1 Executive
The Distra Executive is a small Perl based software application installed on each
server as part of the UPP package. The Executive provides the process
management for each MCAS instance and peripheral services such as logrotate
daemons,
java version "1.6.0"
Java(TM) SE Runtime Environment (build pxa6460sr9fp1-20110208_03(SR9 FP1))
IBM J9 VM (build 2.4, JRE 1.6.0 IBM J9 2.4 Linux amd64-64 jvmxa6460sr9-20110203_74623 (JIT enabled, AOT enabled)
J9VM - 20110203_074623
JIT - r9_20101028_17488ifx3
GC - 20101027_AA)
JCL - 20110203_01
Cisco UCS Benchmark Report - May 2011
Environments
Distra UPP Performance - Cisco UCS Benchmark Report Page 21 of 42
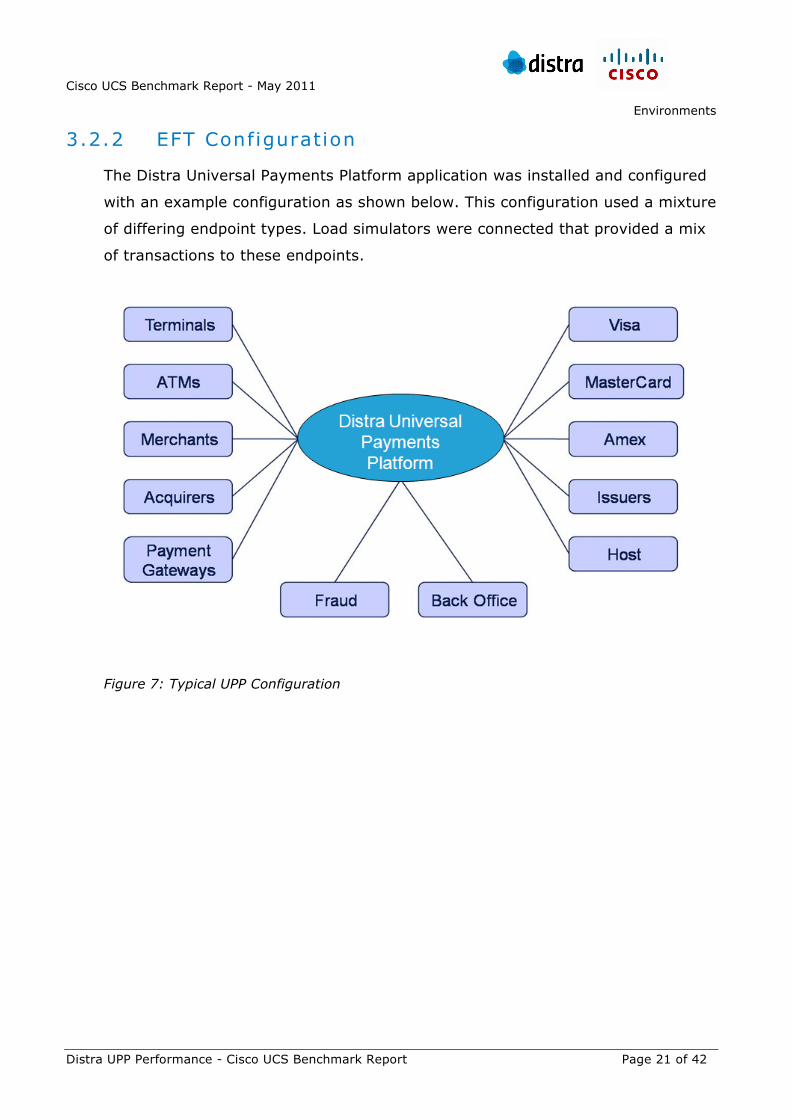
3.2.2 EFT Configuration
The Distra Universal Payments Platform application was installed and configured
with an example configuration as shown below. This configuration used a mixture
of differing endpoint types. Load simulators were connected that provided a mix
of transactions to these endpoints.
Figure 7: Typical UPP Configuration
Cisco UCS Benchmark Report - May 2011
Distra UPP Performance - Cisco UCS Benchmark Report Page 22 of 42
4 BARE METAL BENCHMARK RESULTS AND ANALYSIS
4.1 SCALABILITY DEMONSTRATION Scalability measures:
CPU usage,
memory usage,
network usage,
disk usage and
message latency3
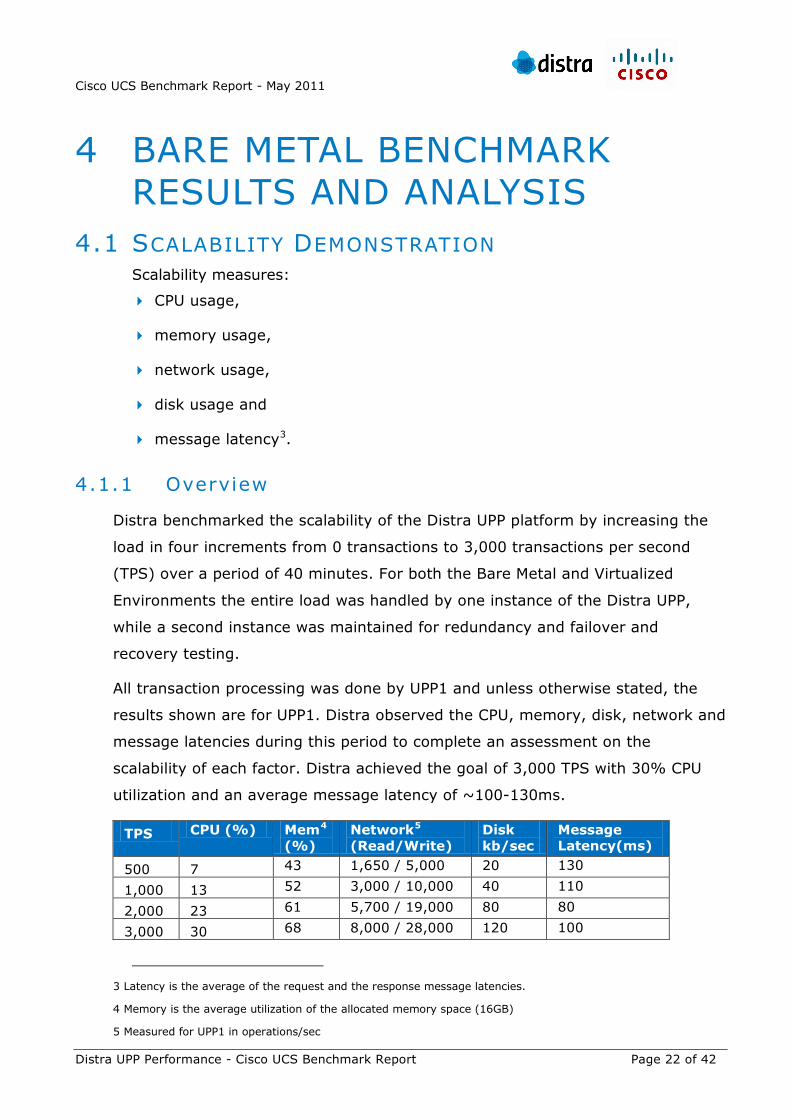
4.1.1 Overview
.
Distra benchmarked the scalability of the Distra UPP platform by increasing the
load in four increments from 0 transactions to 3,000 transactions per second
(TPS) over a period of 40 minutes. For both the Bare Metal and Virtualized
Environments the entire load was handled by one instance of the Distra UPP,
while a second instance was maintained for redundancy and failover and
recovery testing.
All transaction processing was done by UPP1 and unless otherwise stated, the
results shown are for UPP1. Distra observed the CPU, memory, disk, network and
message latencies during this period to complete an assessment on the
scalability of each factor. Distra achieved the goal of 3,000 TPS with 30% CPU
utilization and an average message latency of ~100-130ms.
TPS CPU (%) Mem4 Network (%)
5
(Read/Write) Disk
kb/sec Message Latency(ms)
500 7 43 1,650 / 5,000 20 130
1,000 13 52 3,000 / 10,000 40 110
2,000 23 61 5,700 / 19,000 80 80
3,000 30 68 8,000 / 28,000 120 100
3 Latency is the average of the request and the response message latencies.
4 Memory is the average utilization of the allocated memory space (16GB)
5 Measured for UPP1 in operations/sec

Cisco UCS Benchmark Report - May 2011
Bare Metal Benchmark Results and Analysis
Distra UPP Performance - Cisco UCS Benchmark Report Page 23 of 42
Table 3: UPP non-Virtualized Scalability - Results Summary
4.1.2 CPU Uti l ization
The chart below illustrates that the Distra UPP platform uses the CPU efficiently.
Figure 8 is broken into four time intervals of equal length where load was
increased from 500 to 3,000 transactions per seconds (TPS). The CPU utilization
increases as a linear function of load for both primary (UPP1) and secondary
(UPP2). While UPP1 was processing the load, UPP2 was executing background
operations. While CPU utilization for UPP2 was a fraction of that for UPP1, it also
increased as a function of load. At 3,000 TPS the CPU utilization averaged ~30%
and reached a maximum of 37%. The CPU 1 Linear trend line shows the linear
scalability of CPU utilization for UPP1.
Figure 8: UPP Non-Virtualized Scalability - Platform CPU Utilization
Cisco UCS Benchmark Report - May 2011
Bare Metal Benchmark Results and Analysis
Distra UPP Performance - Cisco UCS Benchmark Report Page 24 of 42
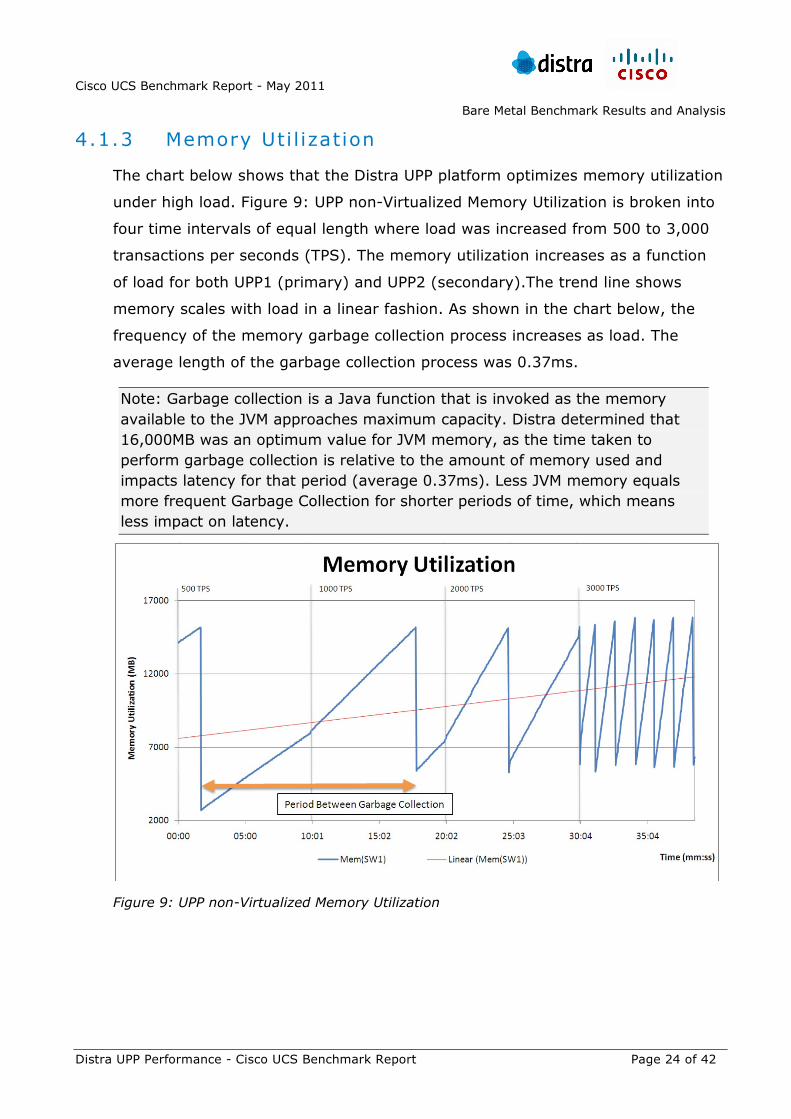
4.1.3 Memory Uti l ization
The chart below shows that the Distra UPP platform optimizes memory utilization
under high load. Figure 9: UPP non-Virtualized Memory Utilization is broken into
four time intervals of equal length where load was increased from 500 to 3,000
transactions per seconds (TPS). The memory utilization increases as a function
of load for both UPP1 (primary) and UPP2 (secondary).The trend line shows
memory scales with load in a linear fashion. As shown in the chart below, the
frequency of the memory garbage collection process increases as load. The
average length of the garbage collection process was 0.37ms.
Note: Garbage collection is a Java function that is invoked as the memory available to the JVM approaches maximum capacity. Distra determined that 16,000MB was an optimum value for JVM memory, as the time taken to perform garbage collection is relative to the amount of memory used and impacts latency for that period (average 0.37ms). Less JVM memory equals more frequent Garbage Collection for shorter periods of time, which means less impact on latency.
Figure 9: UPP non-Virtualized Memory Utilization
Cisco UCS Benchmark Report - May 2011
Bare Metal Benchmark Results and Analysis
Distra UPP Performance - Cisco UCS Benchmark Report Page 25 of 42
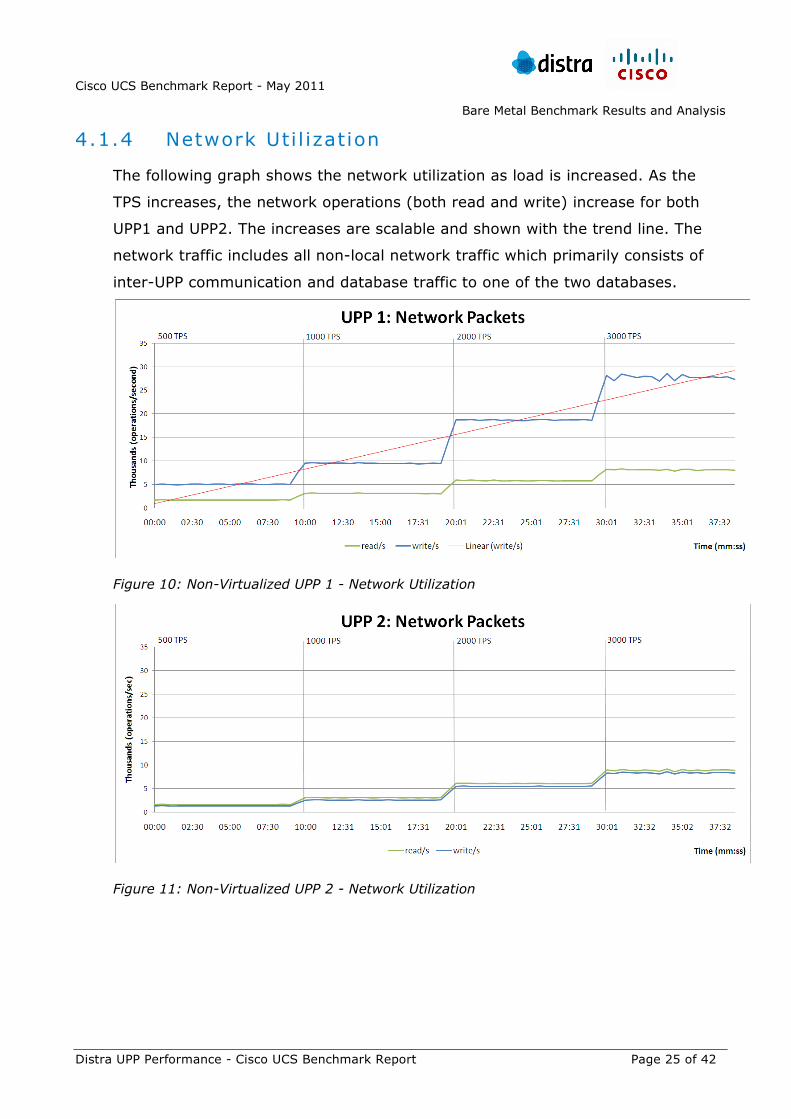
4.1.4 Network Uti l ization
The following graph shows the network utilization as load is increased. As the
TPS increases, the network operations (both read and write) increase for both
UPP1 and UPP2. The increases are scalable and shown with the trend line. The
network traffic includes all non-local network traffic which primarily consists of
inter-UPP communication and database traffic to one of the two databases.
Figure 10: Non-Virtualized UPP 1 - Network Utilization
Figure 11: Non-Virtualized UPP 2 - Network Utilization
Cisco UCS Benchmark Report - May 2011
Bare Metal Benchmark Results and Analysis
Distra UPP Performance - Cisco UCS Benchmark Report Page 26 of 42
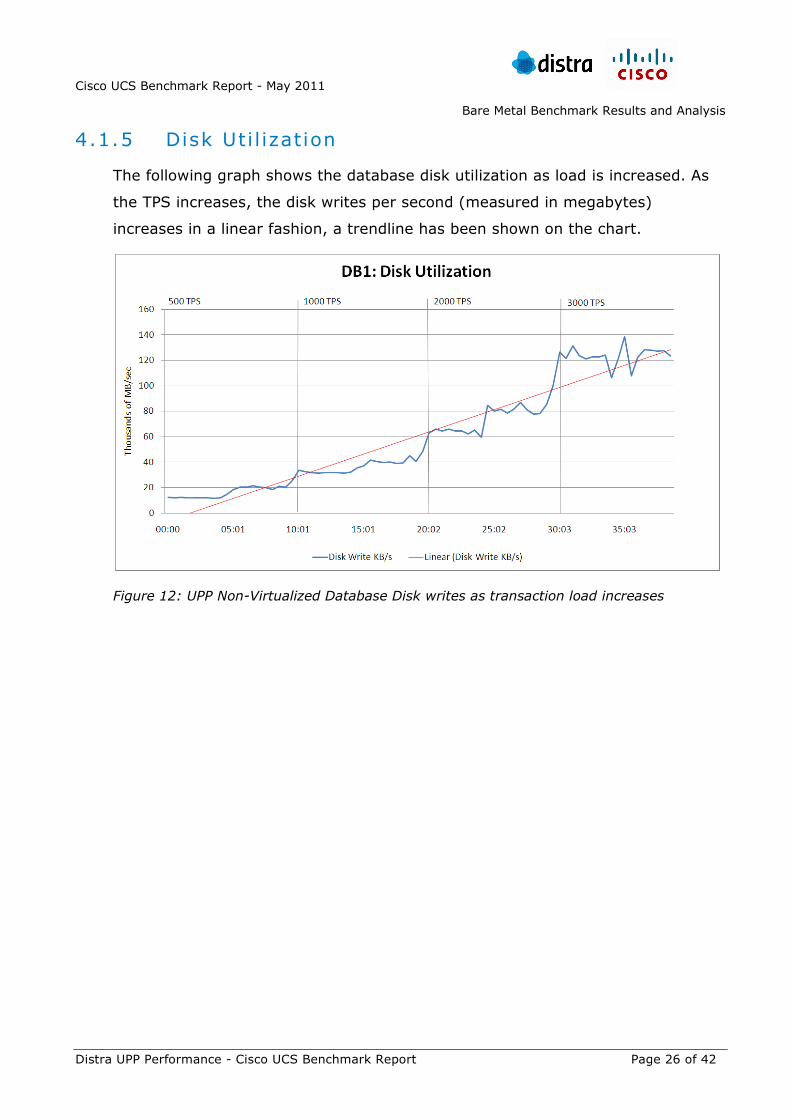
4.1.5 Disk Uti l ization
The following graph shows the database disk utilization as load is increased. As
the TPS increases, the disk writes per second (measured in megabytes)
increases in a linear fashion, a trendline has been shown on the chart.
Figure 12: UPP Non-Virtualized Database Disk writes as transaction load increases
Cisco UCS Benchmark Report - May 2011
Bare Metal Benchmark Results and Analysis
Distra UPP Performance - Cisco UCS Benchmark Report Page 27 of 42
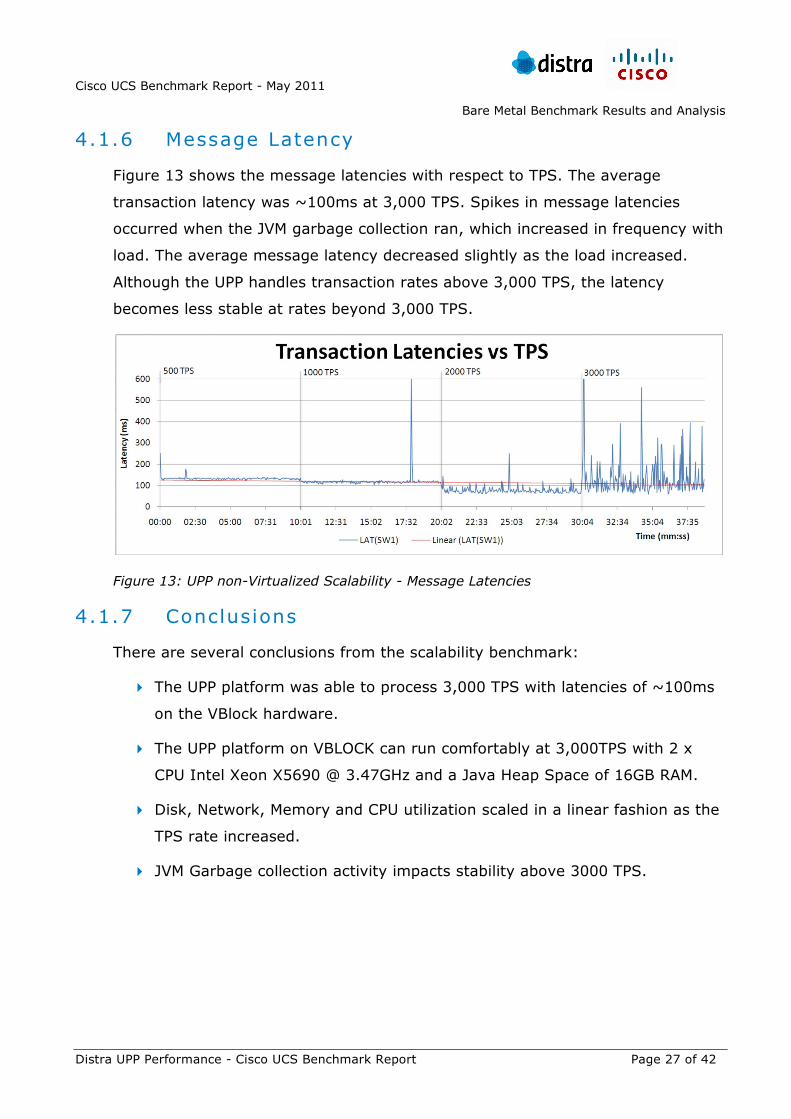
4.1.6 Message Latency
Figure 13 shows the message latencies with respect to TPS. The average
transaction latency was ~100ms at 3,000 TPS. Spikes in message latencies
occurred when the JVM garbage collection ran, which increased in frequency with
load. The average message latency decreased slightly as the load increased.
Although the UPP handles transaction rates above 3,000 TPS, the latency
becomes less stable at rates beyond 3,000 TPS.
Figure 13: UPP non-Virtualized Scalability - Message Latencies
4.1.7 Conclusions
There are several conclusions from the scalability benchmark:
The UPP platform was able to process 3,000 TPS with latencies of ~100ms
on the VBlock hardware.
The UPP platform on VBLOCK can run comfortably at 3,000TPS with 2 x
CPU Intel Xeon X5690 @ 3.47GHz and a Java Heap Space of 16GB RAM.
Disk, Network, Memory and CPU utilization scaled in a linear fashion as the
TPS rate increased.
JVM Garbage collection activity impacts stability above 3000 TPS.
Cisco UCS Benchmark Report - May 2011
Distra UPP Performance - Cisco UCS Benchmark Report Page 28 of 42
4.2 LONGEVITY DEMONSTRATION Longevity measures performance over an extended period (more than 10
hours) at a constant high transaction rate (3,000 TPS).
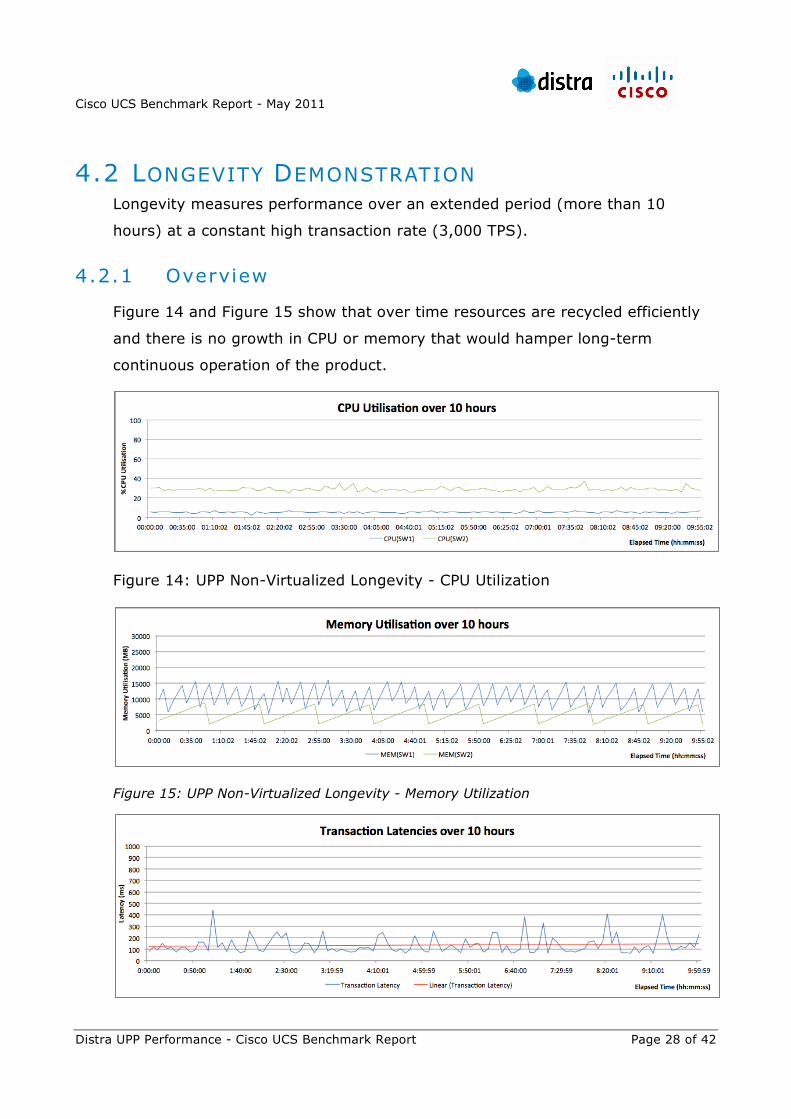
4.2.1 Overview
Figure 14 and Figure 15 show that over time resources are recycled efficiently
and there is no growth in CPU or memory that would hamper long-term
continuous operation of the product.
Figure 14: UPP Non-Virtualized Longevity - CPU Utilization
Figure 15: UPP Non-Virtualized Longevity - Memory Utilization
Cisco UCS Benchmark Report - May 2011
Bare Metal Benchmark Results and Analysis
Distra UPP Performance - Cisco UCS Benchmark Report Page 29 of 42
Figure 16: UPP Non-Virtualized Longevity – Message Latencies
4.2.2 Conclusions
The Distra UPP platform sustained 3,000 TPS for a period in excess of 10 hours
with a latency of less than 150ms.
4.3 FAILURE AND RECOVERY DEMONSTRATION Failover and Recovery measures:
Failover (affects on CPU utilization, TPS and message latency), and
Recovery (affects on CPU utilization, TPS and message latency).
4.3.1 UPP Fai lover
Distra benchmarked the operational impact of killing the primary UPP to
simulate a sudden unexpected failure. UPP1 was brought down with a Linux
kill command and made to stay down until restarted. UPP2 immediately
assumed all primary-processing responsibilities for a seamless failover. UPP1
was then manually restarted 5 minutes later. UPP1 took 2 and a half minutes to
start-up and begin the recovery process. The platform performance is analysed
in the graphs below.
Figure 17 shows the CPU utilization of both the primary (UPP1) and secondary
(UPP2) during the UPP failover demonstration.
Cisco UCS Benchmark Report - May 2011
Bare Metal Benchmark Results and Analysis
Distra UPP Performance - Cisco UCS Benchmark Report Page 30 of 42
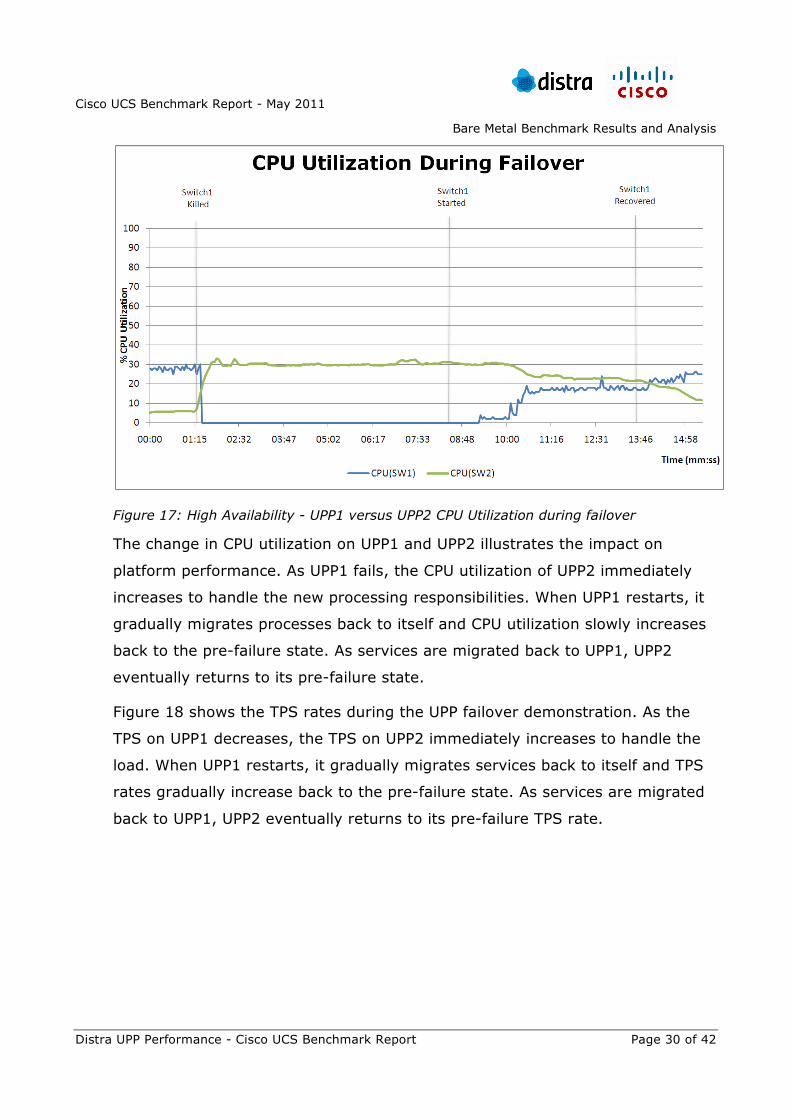
Figure 17: High Availability - UPP1 versus UPP2 CPU Utilization during failover
The change in CPU utilization on UPP1 and UPP2 illustrates the impact on
platform performance. As UPP1 fails, the CPU utilization of UPP2 immediately
increases to handle the new processing responsibilities. When UPP1 restarts, it
gradually migrates processes back to itself and CPU utilization slowly increases
back to the pre-failure state. As services are migrated back to UPP1, UPP2
eventually returns to its pre-failure state.
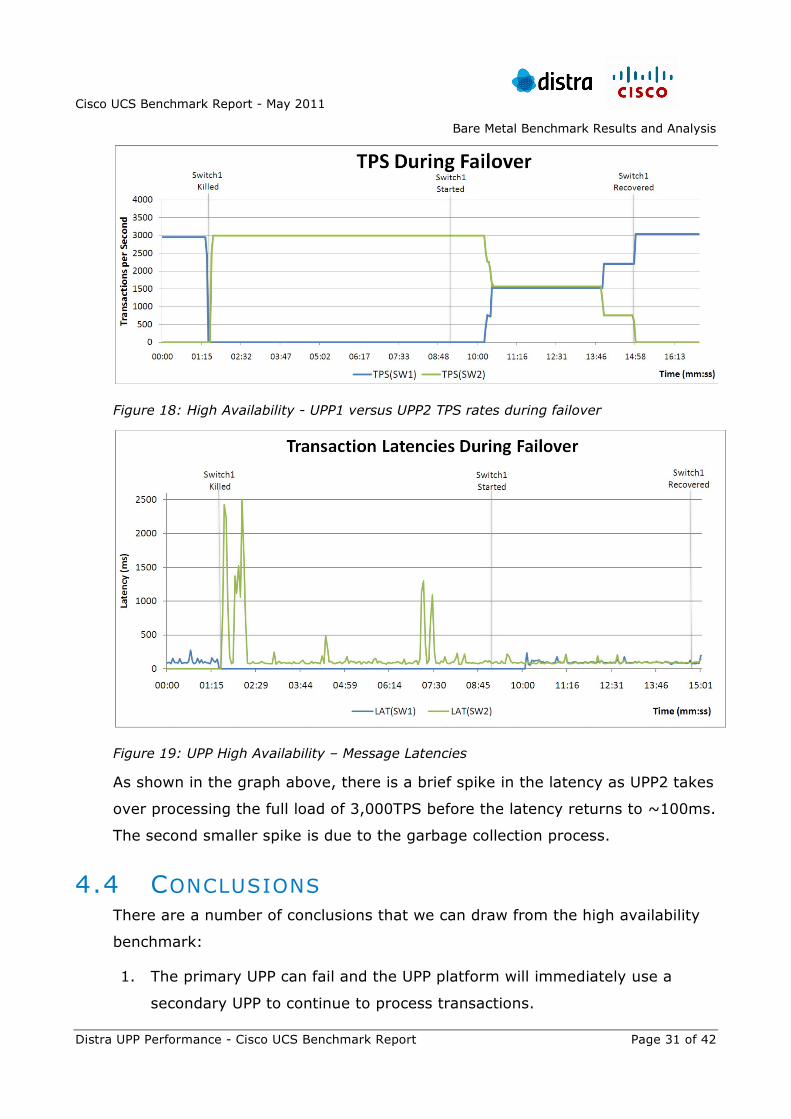
Figure 18 shows the TPS rates during the UPP failover demonstration. As the
TPS on UPP1 decreases, the TPS on UPP2 immediately increases to handle the
load. When UPP1 restarts, it gradually migrates services back to itself and TPS
rates gradually increase back to the pre-failure state. As services are migrated
back to UPP1, UPP2 eventually returns to its pre-failure TPS rate.
Cisco UCS Benchmark Report - May 2011
Bare Metal Benchmark Results and Analysis
Distra UPP Performance - Cisco UCS Benchmark Report Page 31 of 42
Figure 18: High Availability - UPP1 versus UPP2 TPS rates during failover
Figure 19: UPP High Availability – Message Latencies
As shown in the graph above, there is a brief spike in the latency as UPP2 takes
over processing the full load of 3,000TPS before the latency returns to ~100ms.
The second smaller spike is due to the garbage collection process.
4.4 CONCLUSIONS There are a number of conclusions that we can draw from the high availability
benchmark:
1. The primary UPP can fail and the UPP platform will immediately use a
secondary UPP to continue to process transactions.
Cisco UCS Benchmark Report - May 2011
Bare Metal Benchmark Results and Analysis
Distra UPP Performance - Cisco UCS Benchmark Report Page 32 of 42
2. Even when the primary UPP fails there is only a brief spike in the message
latency while the secondary UPP takes over the full processing load (in this
case, 3,000 TPS).
Cisco UCS Benchmark Report - May 2011
Virtualized Benchmark
Distra UPP Performance - Cisco UCS Benchmark Report Page 33 of 42
5 VIRTUALIZED BENCHMARK 5.1 OVERVIEW
Details of the hardware configuration used for the Virtualized benchmark, equal
to one third of the hardware allocation for the Bare Metal benchmark, are
defined in the section titled Virtualized Environment Benchmark on page 9.
Distra benchmarked the scalability of the Distra UPP platform by increasing the
load in increments from 0 transactions to 2,500 transactions per second (TPS)
over a period of 40 minutes. For both the Bare Metal and Virtualized
Environments the entire load was handled by one instance of the Distra UPP,
while a second instance was maintained for redundancy and failover and
recovery testing.
All transaction processing was done by UPP1 and unless otherwise stated, the
results shown are for UPP1. Distra observed the CPU, memory, disk, network
and message latencies during this period to complete an assessment on the
scalability of each factor. In the Virtualized environment Distra achieved 1,000
TPS with ~40% CPU utilization and an average message latency of ~100-
130ms
5.2 SCALABILITY DEMONSTRATION Scalability measures:
CPU usage at varying TPS rates and under various scenarios
Latency at varying TPS rates
Distribution of load over multiple cores
Cisco UCS Benchmark Report - May 2011
Virtualized Benchmark
Distra UPP Performance - Cisco UCS Benchmark Report Page 34 of 42
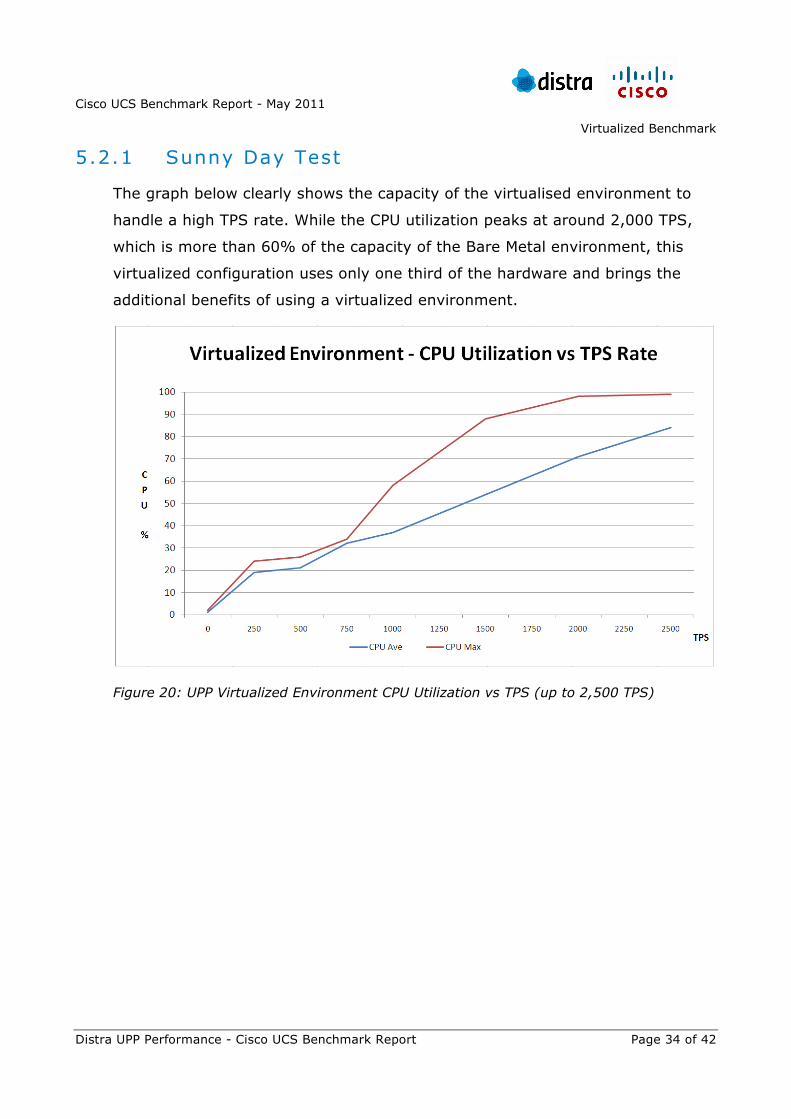
5.2.1 Sunny Day Test
The graph below clearly shows the capacity of the virtualised environment to
handle a high TPS rate. While the CPU utilization peaks at around 2,000 TPS,
which is more than 60% of the capacity of the Bare Metal environment, this
virtualized configuration uses only one third of the hardware and brings the
additional benefits of using a virtualized environment.
Figure 20: UPP Virtualized Environment CPU Utilization vs TPS (up to 2,500 TPS)
Cisco UCS Benchmark Report - May 2011
Virtualized Benchmark
Distra UPP Performance - Cisco UCS Benchmark Report Page 35 of 42
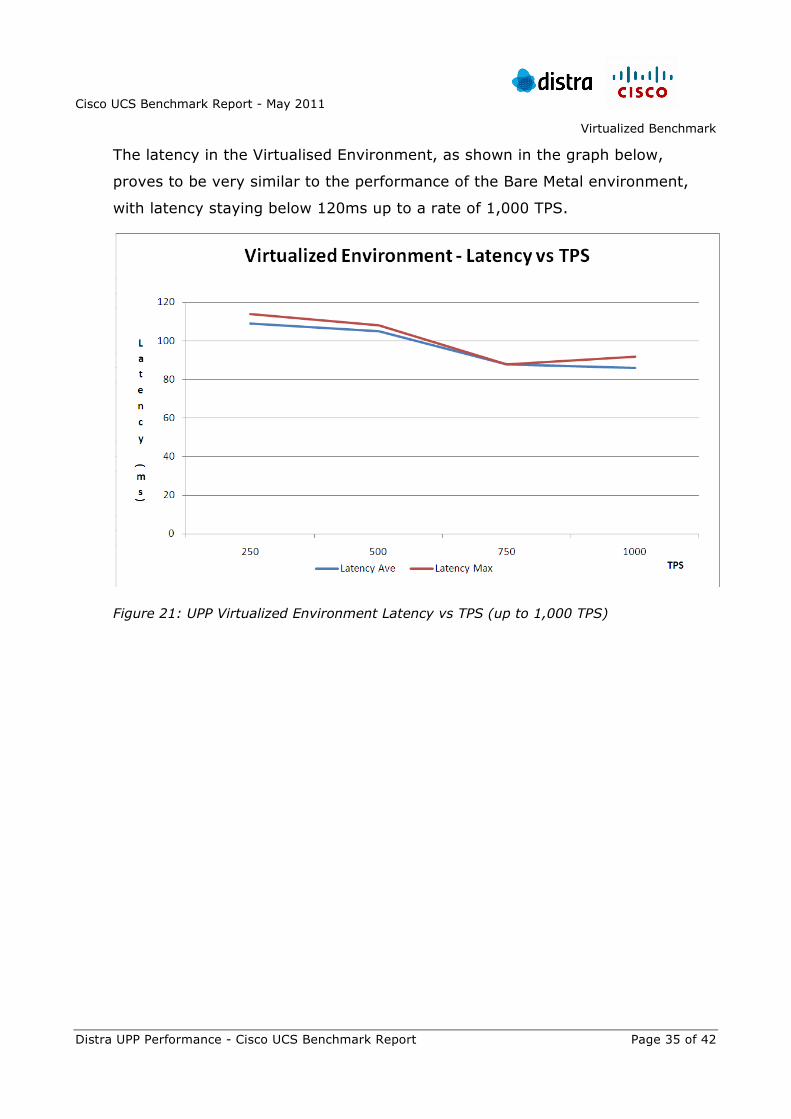
The latency in the Virtualised Environment, as shown in the graph below,
proves to be very similar to the performance of the Bare Metal environment,
with latency staying below 120ms up to a rate of 1,000 TPS.
Figure 21: UPP Virtualized Environment Latency vs TPS (up to 1,000 TPS)
Cisco UCS Benchmark Report - May 2011
Virtualized Benchmark
Distra UPP Performance - Cisco UCS Benchmark Report Page 36 of 42
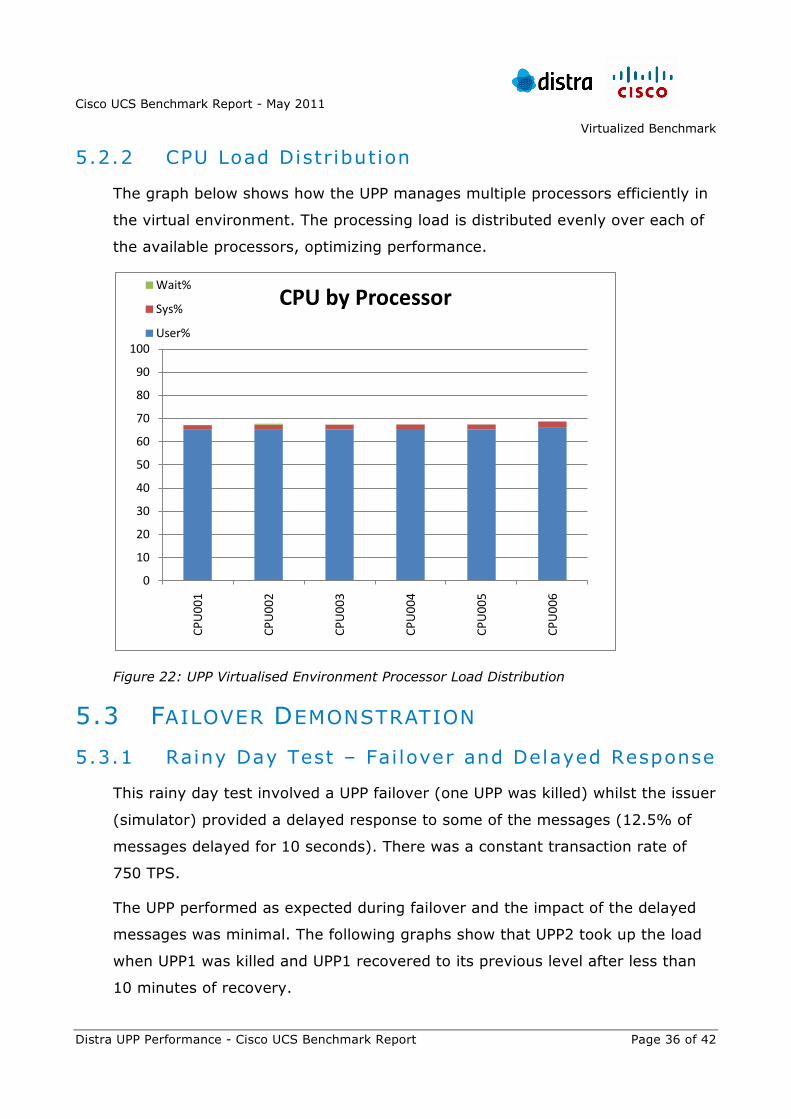
5.2.2 CPU Load Distribution
The graph below shows how the UPP manages multiple processors efficiently in
the virtual environment. The processing load is distributed evenly over each of
the available processors, optimizing performance.
Figure 22: UPP Virtualised Environment Processor Load Distribution
5.3 FAILOVER DEMONSTRATION
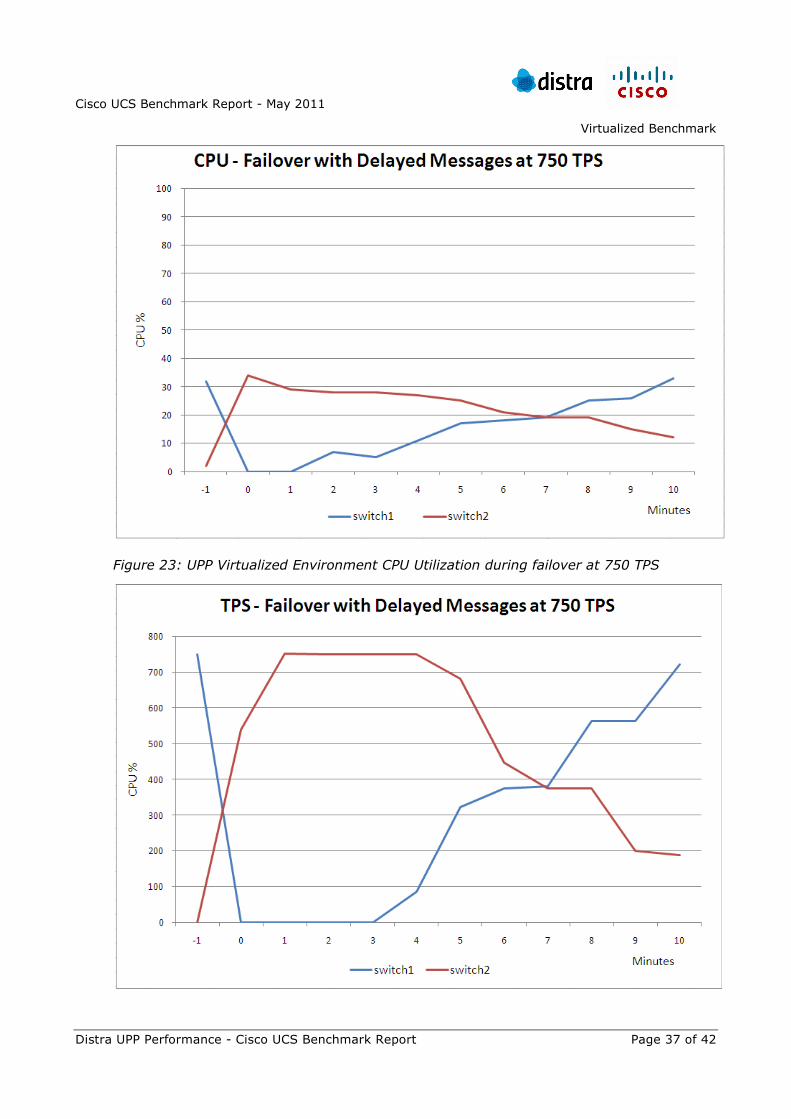
5.3.1 Rainy Day Test – Fai lover and Delayed Response
This rainy day test involved a UPP failover (one UPP was killed) whilst the issuer
(simulator) provided a delayed response to some of the messages (12.5% of
messages delayed for 10 seconds). There was a constant transaction rate of
750 TPS.
The UPP performed as expected during failover and the impact of the delayed
messages was minimal. The following graphs show that UPP2 took up the load
when UPP1 was killed and UPP1 recovered to its previous level after less than
10 minutes of recovery.
0
10
20
30
40
50
60
70
80
90
100
CPU
001
CPU
002
CPU
003
CPU
004
CPU
005
CPU
006
CPU by Processor Wait%
Sys%
User%
Cisco UCS Benchmark Report - May 2011
Virtualized Benchmark
Distra UPP Performance - Cisco UCS Benchmark Report Page 37 of 42
Figure 23: UPP Virtualized Environment CPU Utilization during failover at 750 TPS
Cisco UCS Benchmark Report - May 2011
Virtualized Benchmark
Distra UPP Performance - Cisco UCS Benchmark Report Page 38 of 42
Figure 24: UPP Virtualized Environment TPS during failover at 750 TPS load
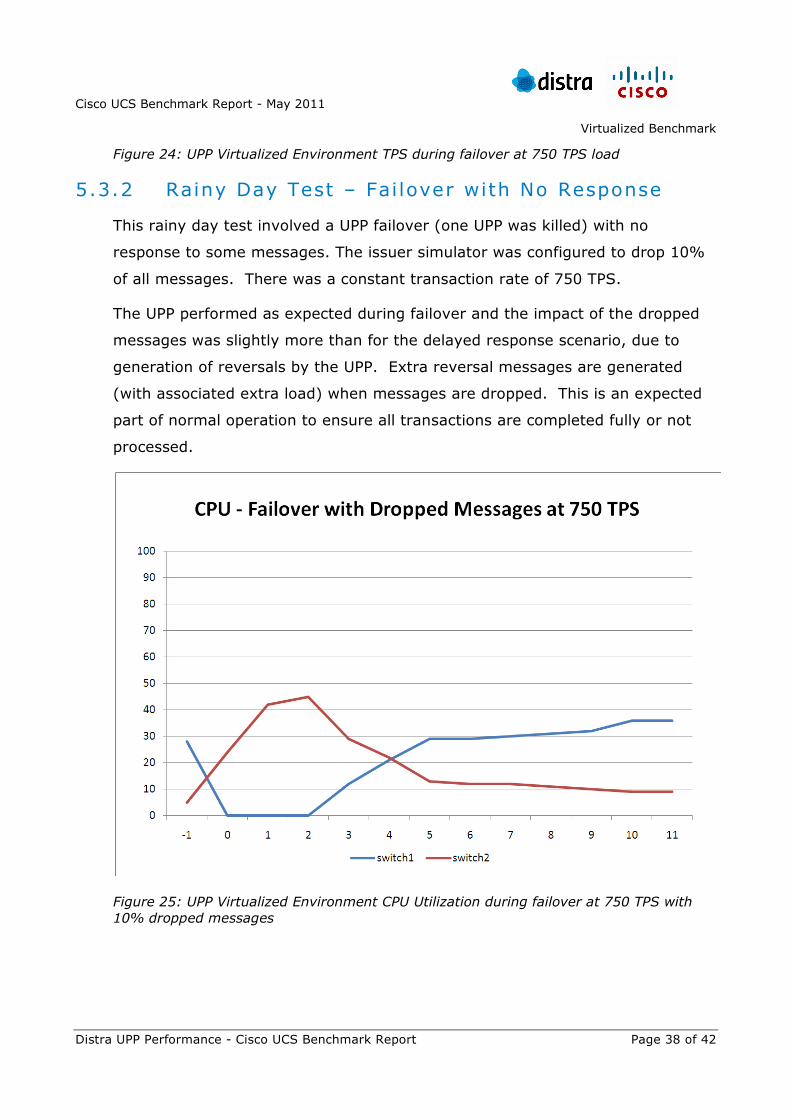
5.3.2 Rainy Day Test – Fai lover with No Response
This rainy day test involved a UPP failover (one UPP was killed) with no
response to some messages. The issuer simulator was configured to drop 10%
of all messages. There was a constant transaction rate of 750 TPS.
The UPP performed as expected during failover and the impact of the dropped
messages was slightly more than for the delayed response scenario, due to
generation of reversals by the UPP. Extra reversal messages are generated
(with associated extra load) when messages are dropped. This is an expected
part of normal operation to ensure all transactions are completed fully or not
processed.
Figure 25: UPP Virtualized Environment CPU Utilization during failover at 750 TPS with 10% dropped messages
Cisco UCS Benchmark Report - May 2011
Virtualized Benchmark
Distra UPP Performance - Cisco UCS Benchmark Report Page 39 of 42
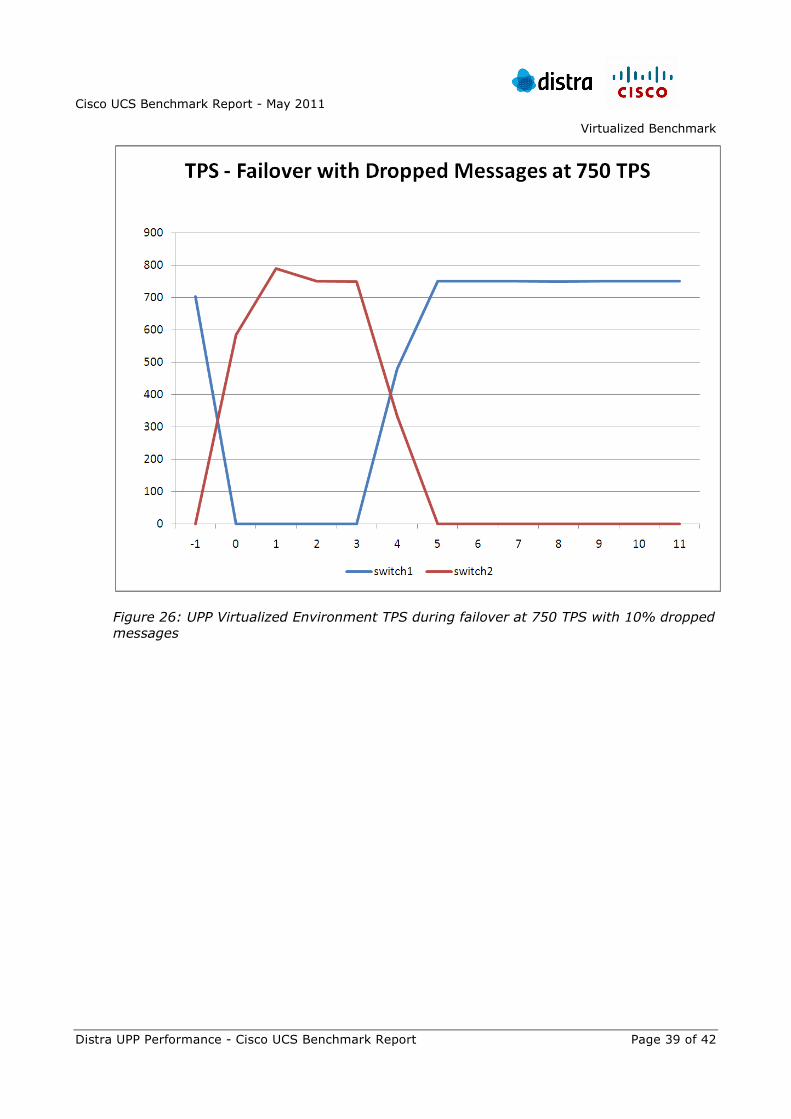
Figure 26: UPP Virtualized Environment TPS during failover at 750 TPS with 10% dropped messages
Cisco UCS Benchmark Report - May 2011
Benchmark Conclusions and Observations
Distra UPP Performance - Cisco UCS Benchmark Report Page 40 of 42
6 BENCHMARK CONCLUSIONS AND OBSERVATIONS
During this benchmark Distra undertook to prove the performance of the
Universal Payments Platform on VBlock hardware in both Bare Metal and
Virtualised configurations. The following conclusions can be reached from the
results:
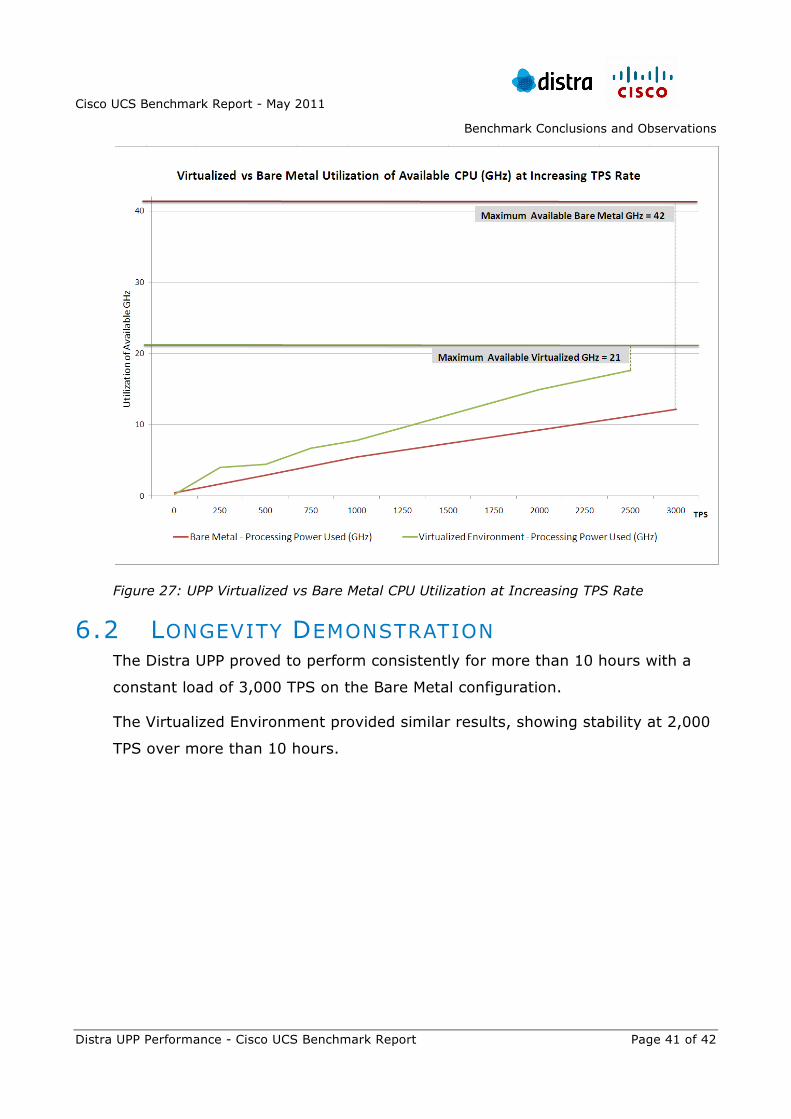
6.1 SCALABILITY DEMONSTRATION Using the Bare Metal configuration of the VBlock hardware the UPP
platform was able to process 3,000 TPS with latencies of ~100ms.
Using the Virtualized configuration (1/3 of the Bare Metal resources) the
VBlock hardware and UPP platform processed 1,000 TPS with latencies of
~100ms.
Note: The Virtualized environment was pushed to 2,500 TPS with
acceptable latency (<500ms) but would require optimization for stability
at this rate.
Disk, Network, Memory and CPU utilization scaled in a linear fashion as
the TPS rate increased for both Bare Metal and Virtualized environments.
Cisco UCS Benchmark Report - May 2011
Benchmark Conclusions and Observations
Distra UPP Performance - Cisco UCS Benchmark Report Page 41 of 42
Figure 27: UPP Virtualized vs Bare Metal CPU Utilization at Increasing TPS Rate
6.2 LONGEVITY DEMONSTRATION The Distra UPP proved to perform consistently for more than 10 hours with a
constant load of 3,000 TPS on the Bare Metal configuration.
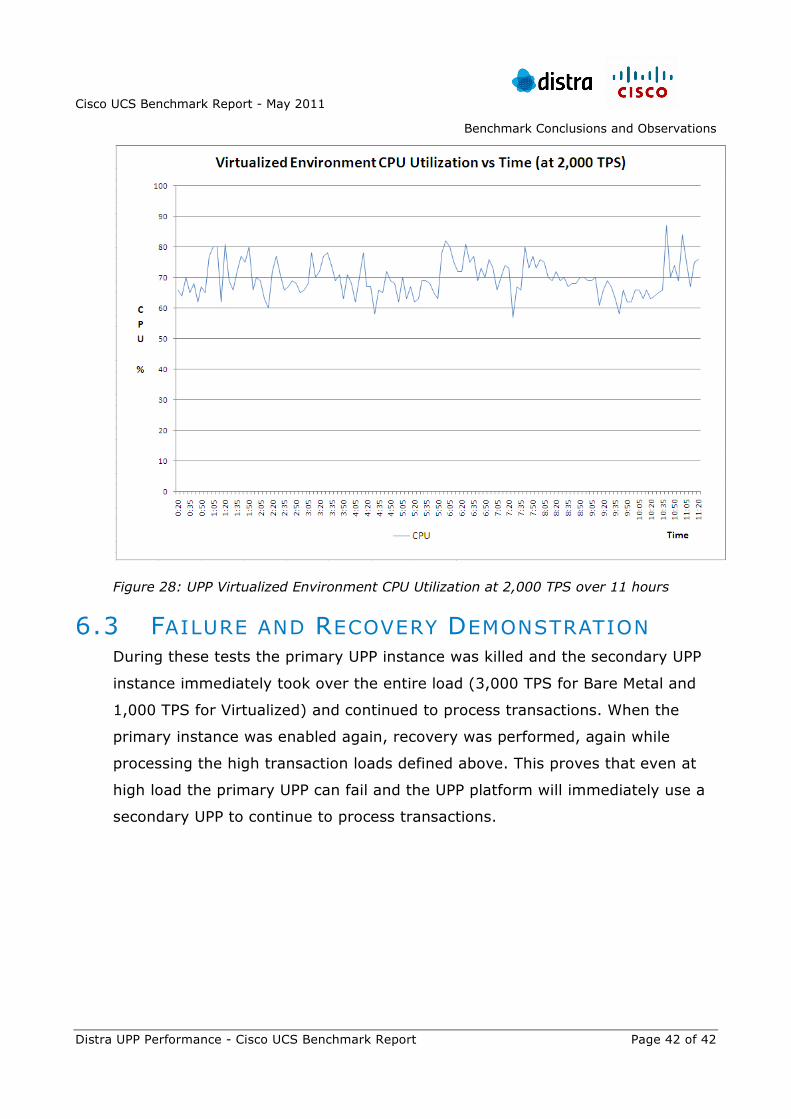
The Virtualized Environment provided similar results, showing stability at 2,000
TPS over more than 10 hours.
Cisco UCS Benchmark Report - May 2011
Benchmark Conclusions and Observations
Distra UPP Performance - Cisco UCS Benchmark Report Page 42 of 42
Figure 28: UPP Virtualized Environment CPU Utilization at 2,000 TPS over 11 hours
6.3 FAILURE AND RECOVERY DEMONSTRATION During these tests the primary UPP instance was killed and the secondary UPP
instance immediately took over the entire load (3,000 TPS for Bare Metal and
1,000 TPS for Virtualized) and continued to process transactions. When the
primary instance was enabled again, recovery was performed, again while
processing the high transaction loads defined above. This proves that even at
high load the primary UPP can fail and the UPP platform will immediately use a
secondary UPP to continue to process transactions.