Embed Size (px)
Citation preview
7/27/2019 Benchmarking Airport Terminals: A Simplified Toolkit for Estimating Peak Capacity - GARS Benchmarking Workshop Berlin November 2010
http://slidepdf.com/reader/full/benchmarking-airport-terminals-a-simplified-toolkit-for-estimating-peak-capacity 1/20
Internet: www.gap-projekt.de
Contact: [email protected]
GERMAN AIRPORT
PERFORMANCE
GERMAN AVIATION
BENCHMARKING
partner/sponsor:
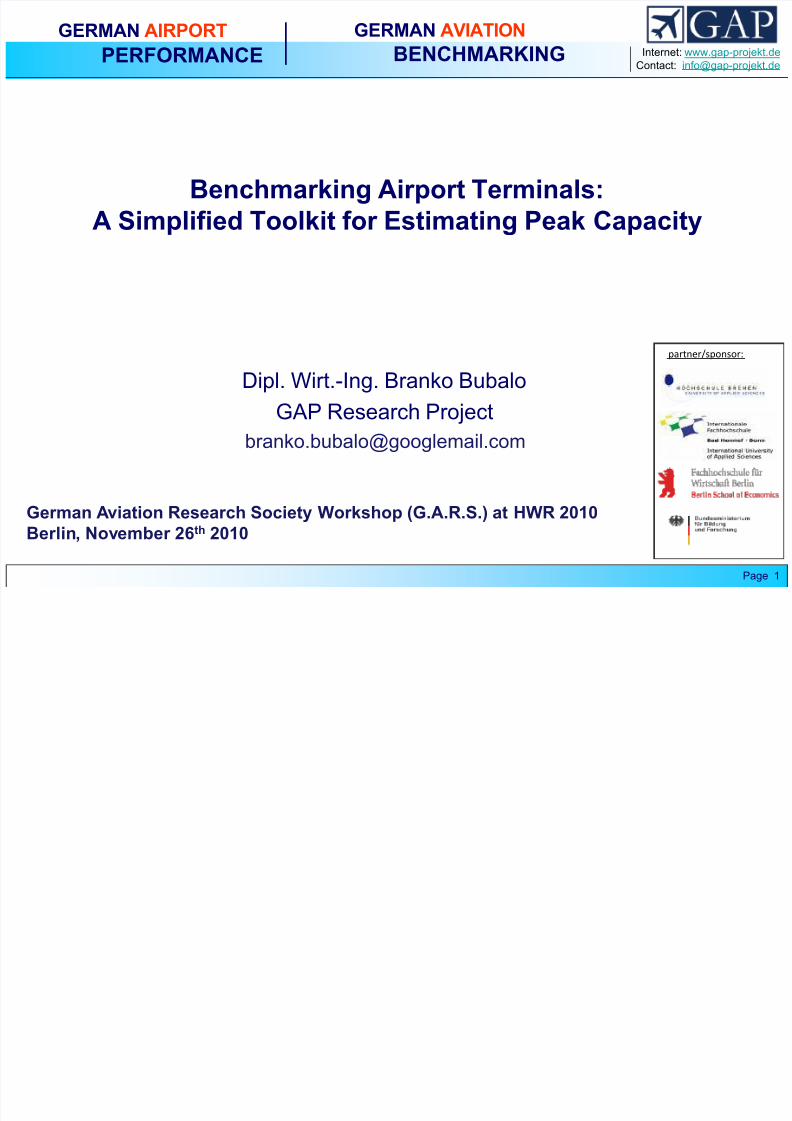
Benchmarking Airport Terminals:
A Simplified Toolkit for Estimating Peak Capacity
Dipl. Wirt.-Ing. Branko Bubalo
GAP Research [email protected]
German Aviation Research Society Workshop (G.A.R.S.) at HWR 2010
Berlin, November 26th 2010
Page 1

7/27/2019 Benchmarking Airport Terminals: A Simplified Toolkit for Estimating Peak Capacity - GARS Benchmarking Workshop Berlin November 2010
http://slidepdf.com/reader/full/benchmarking-airport-terminals-a-simplified-toolkit-for-estimating-peak-capacity 2/20
GERMAN AIRPORT
PERFORMANCE
GERMAN AVIATION
BENCHMARKING
Personal Background
• Graduate in Business Administration and Engineering from BerlinSchool of Economics and Law and University of Applied Sciences Berlin
• Diploma Thesis (2009): “Benchmarking Airport Productivity and the Role
of Capacity Utilization – A Study of selected European Airports”
• 4th year in German Airport Performance Research Project at Berlin
School of Economics and Law• Conducted Benchmarking studies of European Airports and Airlines
(over 70 Airports, 30 individual Airlines)
• Consultation work in MIME Project (study on noise mitigation around
airports by the means of permit trading), funded by EU Commission
• Looking for a University for writing my Dissertation and doing Research
GARS Benchmarking Workshop Berlin – 26.11.2010 – Branko Bubalo Page 2
7/27/2019 Benchmarking Airport Terminals: A Simplified Toolkit for Estimating Peak Capacity - GARS Benchmarking Workshop Berlin November 2010
http://slidepdf.com/reader/full/benchmarking-airport-terminals-a-simplified-toolkit-for-estimating-peak-capacity 3/20
GERMAN AIRPORT
PERFORMANCE
GERMAN AVIATION
BENCHMARKING
Contents
1. The Airport Process Chain
2. Difficulties with Airport Terminal Benchmarking
3. Methods for Measuring Terminal Processes
4. New Approach to Terminal Benchmarking through theuse of IATA Formulae and „Airport Schedule Scanner“
5. Preliminary Results
6. Outlook
Page 3GARS Benchmarking Workshop Berlin – 26.11.2010 – Branko Bubalo

7/27/2019 Benchmarking Airport Terminals: A Simplified Toolkit for Estimating Peak Capacity - GARS Benchmarking Workshop Berlin November 2010
http://slidepdf.com/reader/full/benchmarking-airport-terminals-a-simplified-toolkit-for-estimating-peak-capacity 4/20
GERMAN AIRPORT
PERFORMANCE
GERMAN AVIATION
BENCHMARKING
The Airport Process Chain
• Strong interrelations between Airport Processes• A combination of Queues and Servers
• Certain capacity limitations exist
• Capacity Bottlenecks influence Passenger flows up- and
downstream• Each flow and therefore airport client has different
infrastructure requirements
Page 4GARS Benchmarking Workshop Berlin – 26.11.2010 – Branko Bubalo
7/27/2019 Benchmarking Airport Terminals: A Simplified Toolkit for Estimating Peak Capacity - GARS Benchmarking Workshop Berlin November 2010
http://slidepdf.com/reader/full/benchmarking-airport-terminals-a-simplified-toolkit-for-estimating-peak-capacity 5/20
GERMAN AIRPORT
PERFORMANCE
GERMAN AVIATION
BENCHMARKING
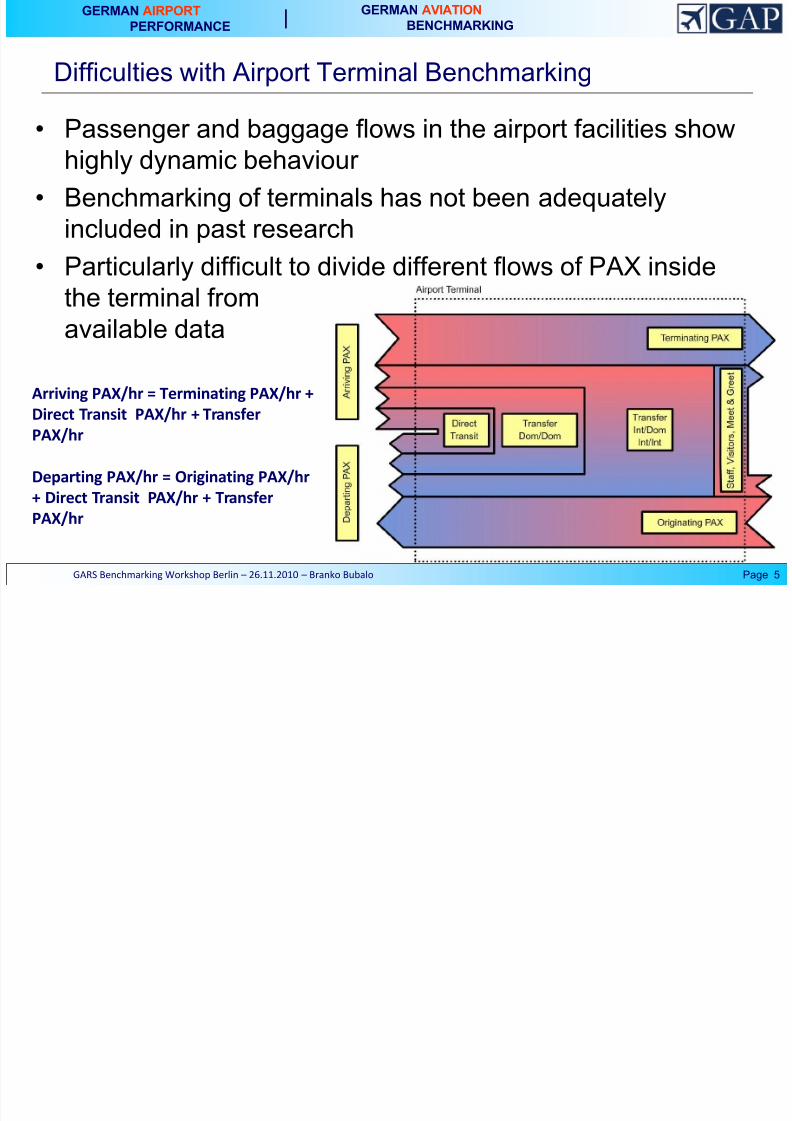
Difficulties with Airport Terminal Benchmarking
• Passenger and baggage flows in the airport facilities showhighly dynamic behaviour
• Benchmarking of terminals has not been adequately
included in past research
• Particularly difficult to divide different flows of PAX insidethe terminal from
available data
Page 5GARS Benchmarking Workshop Berlin – 26.11.2010 – Branko Bubalo
Arriving PAX/hr = Terminating PAX/hr +
Direct Transit PAX/hr + TransferPAX/hr
Departing PAX/hr = Originating PAX/hr
+ Direct Transit PAX/hr + Transfer
PAX/hr
7/27/2019 Benchmarking Airport Terminals: A Simplified Toolkit for Estimating Peak Capacity - GARS Benchmarking Workshop Berlin November 2010
http://slidepdf.com/reader/full/benchmarking-airport-terminals-a-simplified-toolkit-for-estimating-peak-capacity 6/20
GERMAN AIRPORT
PERFORMANCE
GERMAN AVIATION
BENCHMARKING
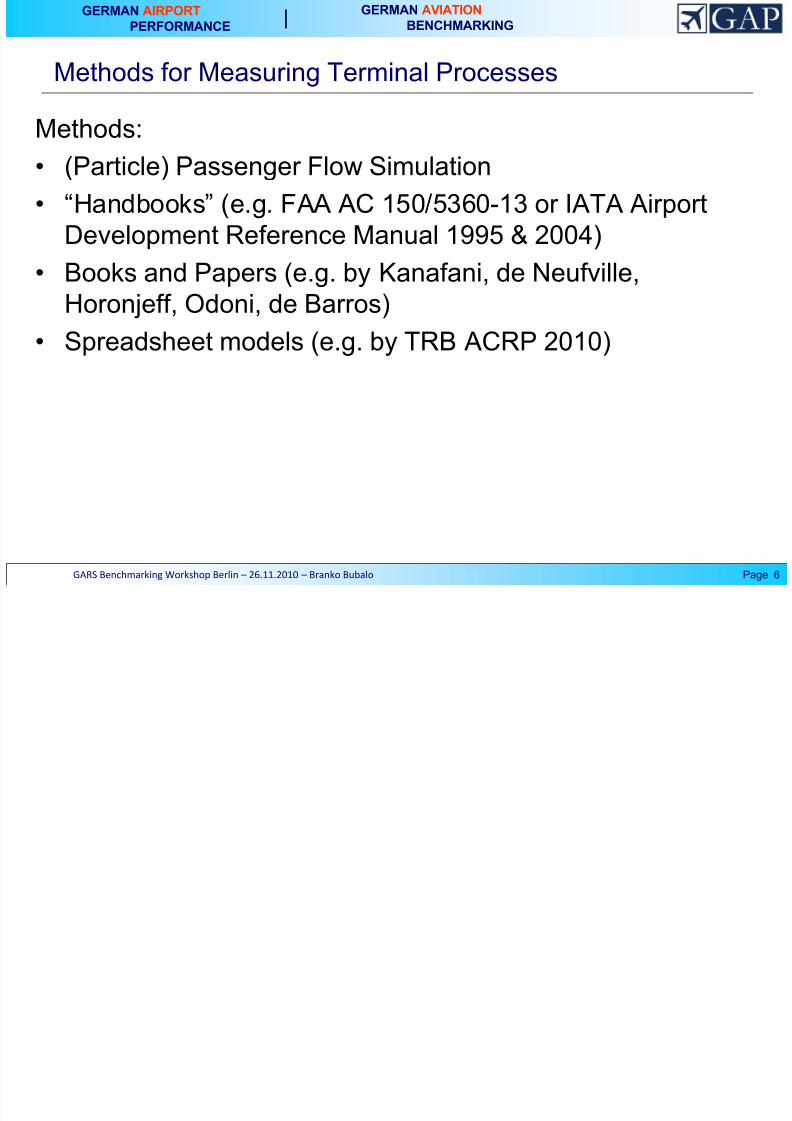
Methods for Measuring Terminal Processes
Methods:• (Particle) Passenger Flow Simulation
• “Handbooks” (e.g. FAA AC 150/5360-13 or IATA Airport
Development Reference Manual 1995 & 2004)
• Books and Papers (e.g. by Kanafani, de Neufville,Horonjeff, Odoni, de Barros)
• Spreadsheet models (e.g. by TRB ACRP 2010)
Page 6GARS Benchmarking Workshop Berlin – 26.11.2010 – Branko Bubalo
7/27/2019 Benchmarking Airport Terminals: A Simplified Toolkit for Estimating Peak Capacity - GARS Benchmarking Workshop Berlin November 2010
http://slidepdf.com/reader/full/benchmarking-airport-terminals-a-simplified-toolkit-for-estimating-peak-capacity 7/20
GERMAN AIRPORT
PERFORMANCE
GERMAN AVIATION
BENCHMARKING
Methods for Measuring Terminal Processes
Page 7GARS Benchmarking Workshop Berlin – 26.11.2010 – Branko Bubalo
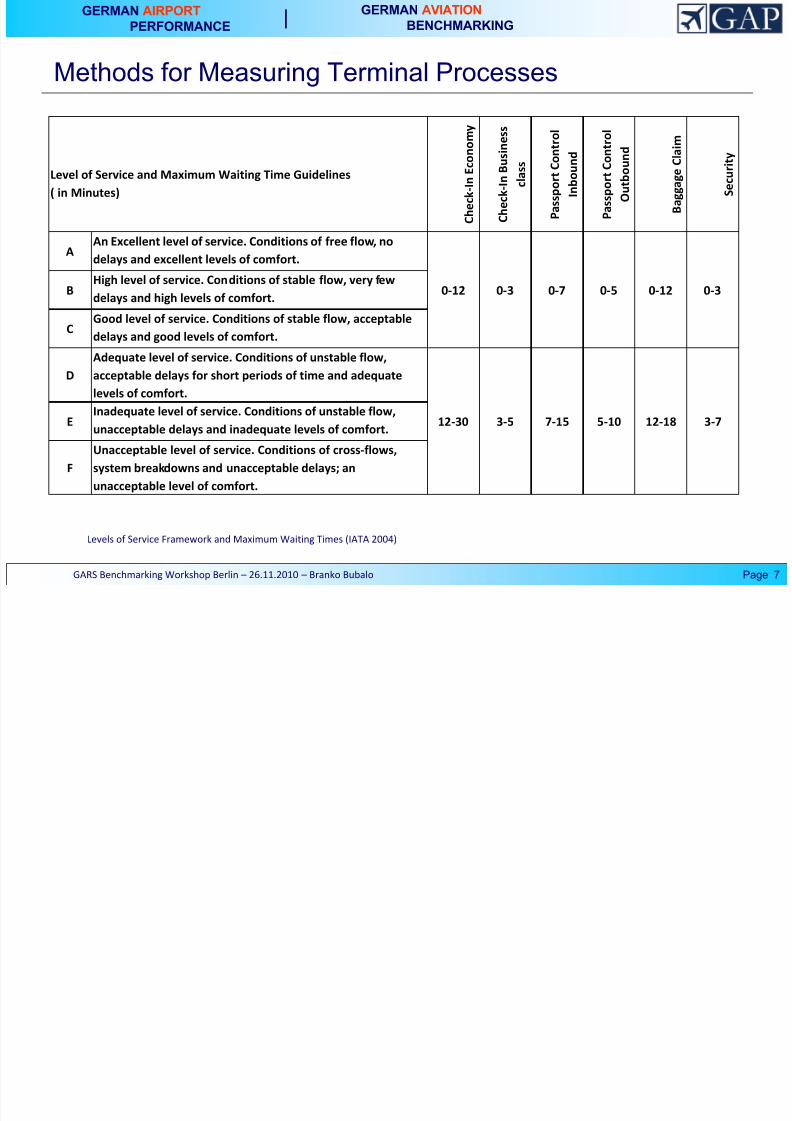
Levels of Service Framework and Maximum Waiting Times (IATA 2004)
Level of Service and Maximum Waiting Time Guidelines
( in Minutes)
C h e c k - I n E c o n o m
y
C h e c k - I n B u s i n e s s
c l a s s
P a s s p o r t C o n t r o
l
I n b o u n d
P a s s p o r t C o n t r o
l
O u t b o u n d
B a g g a g e C l a i m
S e c u r i t y
AAn Excellent level of service. Conditions of free flow, no
delays and excellent levels of comfort.
0-12 0-3 0-7 0-5 0-12 0-3BHigh level of service. Conditions of stable flow, very few
delays and high levels of comfort.
CGood level of service. Conditions of stable flow, acceptable
delays and good levels of comfort.
D
Adequate level of service. Conditions of unstable flow,
acceptable delays for short periods of time and adequate
levels of comfort.
12-30 3-5 7-15 5-10 12-18 3-7E Inadequate level of service. Conditions of unstable flow,unacceptable delays and inadequate levels of comfort.
F
Unacceptable level of service. Conditions of cross-flows,
system breakdowns and unacceptable delays; an
unacceptable level of comfort.
7/27/2019 Benchmarking Airport Terminals: A Simplified Toolkit for Estimating Peak Capacity - GARS Benchmarking Workshop Berlin November 2010
http://slidepdf.com/reader/full/benchmarking-airport-terminals-a-simplified-toolkit-for-estimating-peak-capacity 8/20
GERMAN AIRPORT
PERFORMANCE
GERMAN AVIATION
BENCHMARKING
Page 8
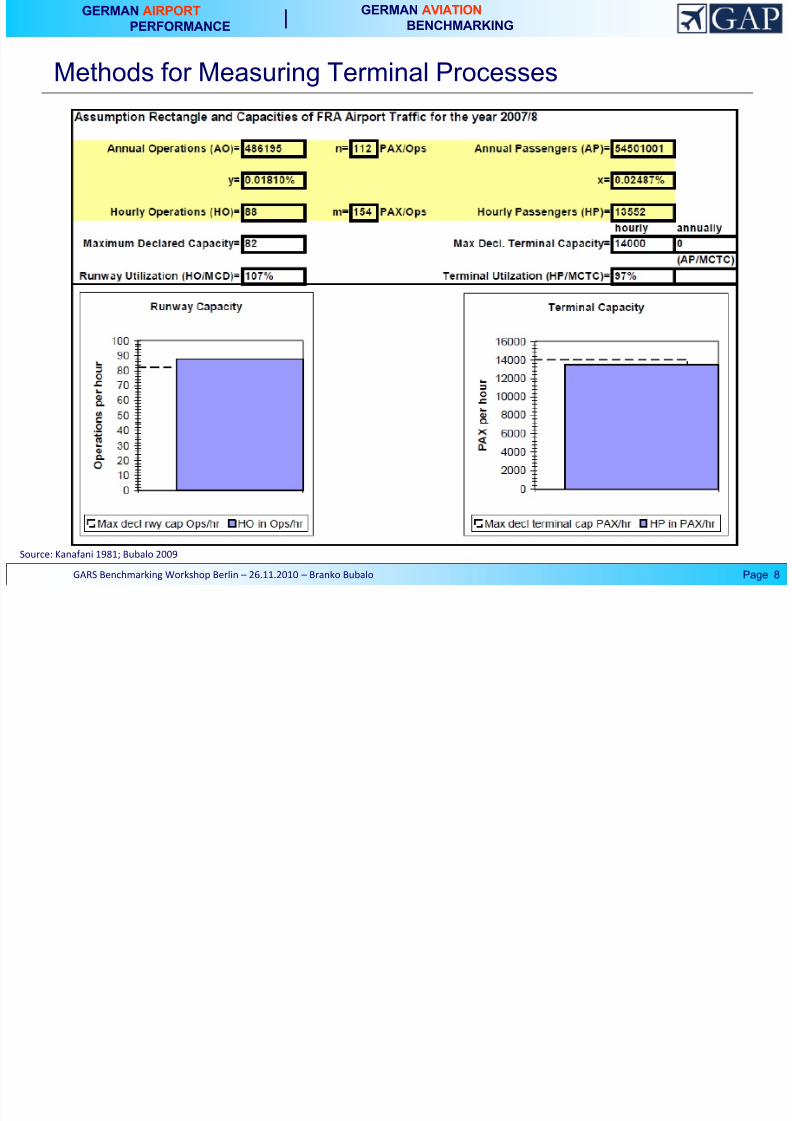
Source: Kanafani 1981; Bubalo 2009
GARS Benchmarking Workshop Berlin – 26.11.2010 – Branko Bubalo
Methods for Measuring Terminal Processes
7/27/2019 Benchmarking Airport Terminals: A Simplified Toolkit for Estimating Peak Capacity - GARS Benchmarking Workshop Berlin November 2010
http://slidepdf.com/reader/full/benchmarking-airport-terminals-a-simplified-toolkit-for-estimating-peak-capacity 9/20
GERMAN AIRPORT
PERFORMANCE
GERMAN AVIATION
BENCHMARKING
Methods for Measuring Terminal Processes
Page 9GARS Benchmarking Workshop Berlin – 26.11.2010 – Branko Bubalo
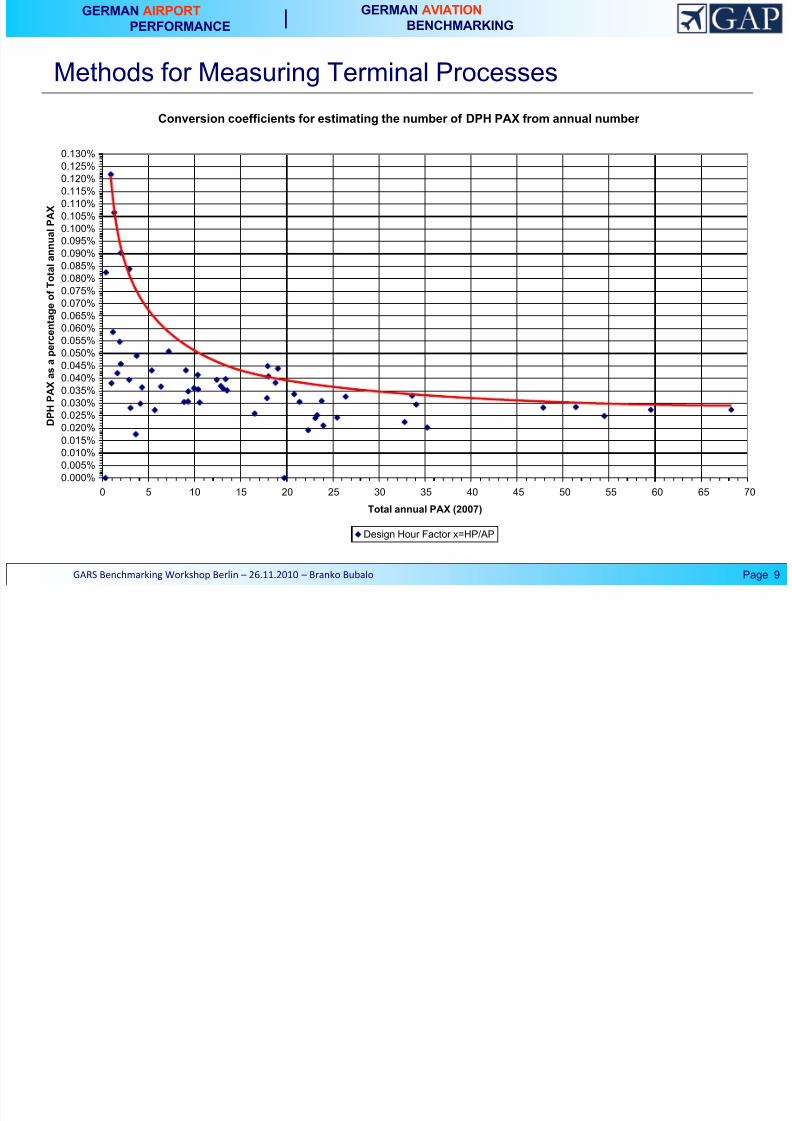
Conversion coefficients for estimating the number of DPH PAX from annual number
0.000%
0.005%
0.010%
0.015%
0.020%0.025%
0.030%
0.035%
0.040%
0.045%
0.050%
0.055%
0.060%
0.065%
0.070%
0.075%0.080%
0.085%
0.090%
0.095%
0.100%
0.105%
0.110%
0.115%
0.120%
0.125%
0.130%
0 5 10 15 20 25 30 35 40 45 50 55 60 65 70
Total annual PAX (2007)
D P H P A X a s a p e r c e n t a g e o f T o t
a l a n n u a l P A X
Design Hour Factor x=HP/AP
GERMAN AVIATION
7/27/2019 Benchmarking Airport Terminals: A Simplified Toolkit for Estimating Peak Capacity - GARS Benchmarking Workshop Berlin November 2010
http://slidepdf.com/reader/full/benchmarking-airport-terminals-a-simplified-toolkit-for-estimating-peak-capacity 10/20
GERMAN AIRPORT
PERFORMANCE
GERMAN AVIATION
BENCHMARKING
Methods for Measuring Terminal Processes
Page 10GARS Benchmarking Workshop Berlin – 26.11.2010 – Branko Bubalo
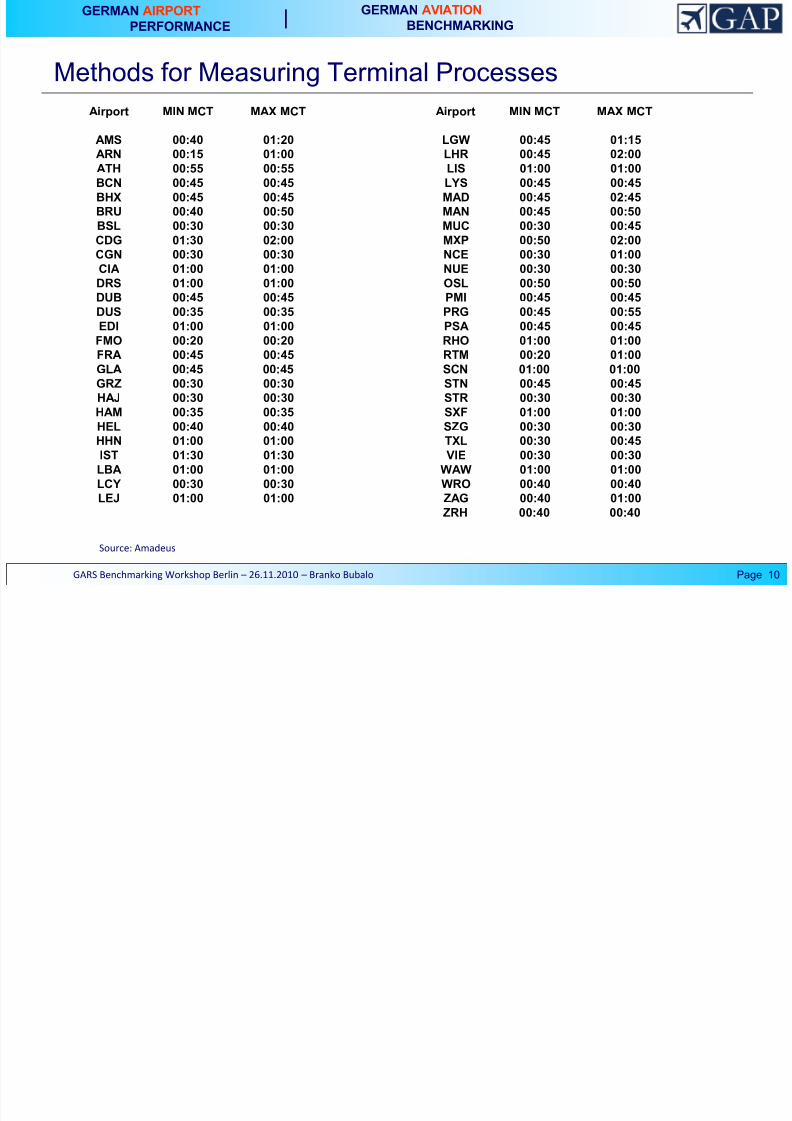
Source: Amadeus
Airport MIN MCT MAX MCT Airport MIN MCT MAX MCT
AMS 00:40 01:20 LGW 00:45 01:15ARN 00:15 01:00 LHR 00:45 02:00
ATH 00:55 00:55 LIS 01:00 01:00
BCN 00:45 00:45 LYS 00:45 00:45
BHX 00:45 00:45 MAD 00:45 02:45
BRU 00:40 00:50 MAN 00:45 00:50
BSL 00:30 00:30 MUC 00:30 00:45
CDG 01:30 02:00 MXP 00:50 02:00
CGN 00:30 00:30 NCE 00:30 01:00
CIA 01:00 01:00 NUE 00:30 00:30
DRS 01:00 01:00 OSL 00:50 00:50
DUB 00:45 00:45 PMI 00:45 00:45
DUS 00:35 00:35 PRG 00:45 00:55
EDI 01:00 01:00 PSA 00:45 00:45
FMO 00:20 00:20 RHO 01:00 01:00
FRA 00:45 00:45 RTM 00:20 01:00
GLA 00:45 00:45 SCN 01:00 01:00GRZ 00:30 00:30 STN 00:45 00:45
HAJ 00:30 00:30 STR 00:30 00:30
HAM 00:35 00:35 SXF 01:00 01:00HEL 00:40 00:40 SZG 00:30 00:30
HHN 01:00 01:00 TXL 00:30 00:45
IST 01:30 01:30 VIE 00:30 00:30
LBA 01:00 01:00 WAW 01:00 01:00
LCY 00:30 00:30 WRO 00:40 00:40
LEJ 01:00 01:00 ZAG 00:40 01:00
ZRH 00:40 00:40
G O GERMAN AVIATION
7/27/2019 Benchmarking Airport Terminals: A Simplified Toolkit for Estimating Peak Capacity - GARS Benchmarking Workshop Berlin November 2010
http://slidepdf.com/reader/full/benchmarking-airport-terminals-a-simplified-toolkit-for-estimating-peak-capacity 11/20
GERMAN AIRPORT
PERFORMANCE
GERMAN AVIATION
BENCHMARKING
Methods for Measuring Terminal Processes
Page 11GARS Benchmarking Workshop Berlin – 26.11.2010 – Branko Bubalo
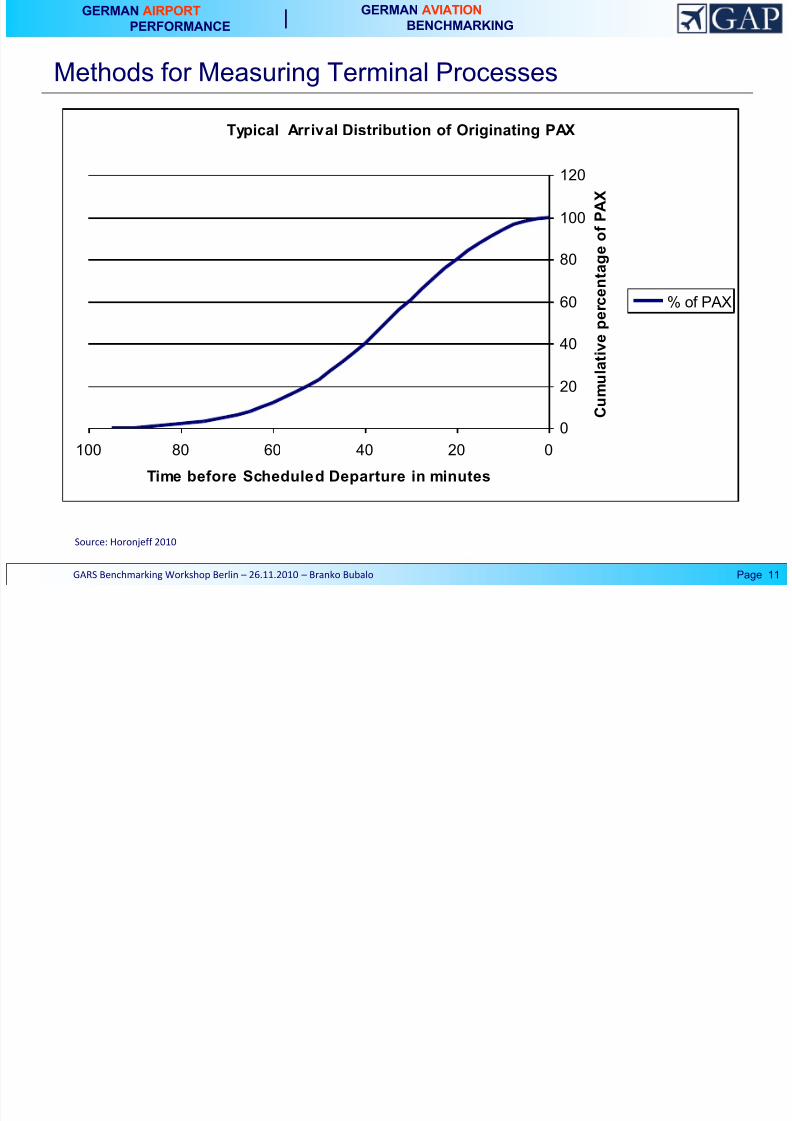
Typical Arrival Distribution of Originating PAX
0
20
40
60
80
100
120
020406080100
Time before Scheduled Departure in minutes
C
u m u l a t i v e p e r c e n t a g e o f P A X
% of PAX
Source: Horonjeff 2010
GERMAN AIRPORT GERMAN AVIATION
7/27/2019 Benchmarking Airport Terminals: A Simplified Toolkit for Estimating Peak Capacity - GARS Benchmarking Workshop Berlin November 2010
http://slidepdf.com/reader/full/benchmarking-airport-terminals-a-simplified-toolkit-for-estimating-peak-capacity 12/20
GERMAN AIRPORT
PERFORMANCE
GERMAN AVIATION
BENCHMARKING
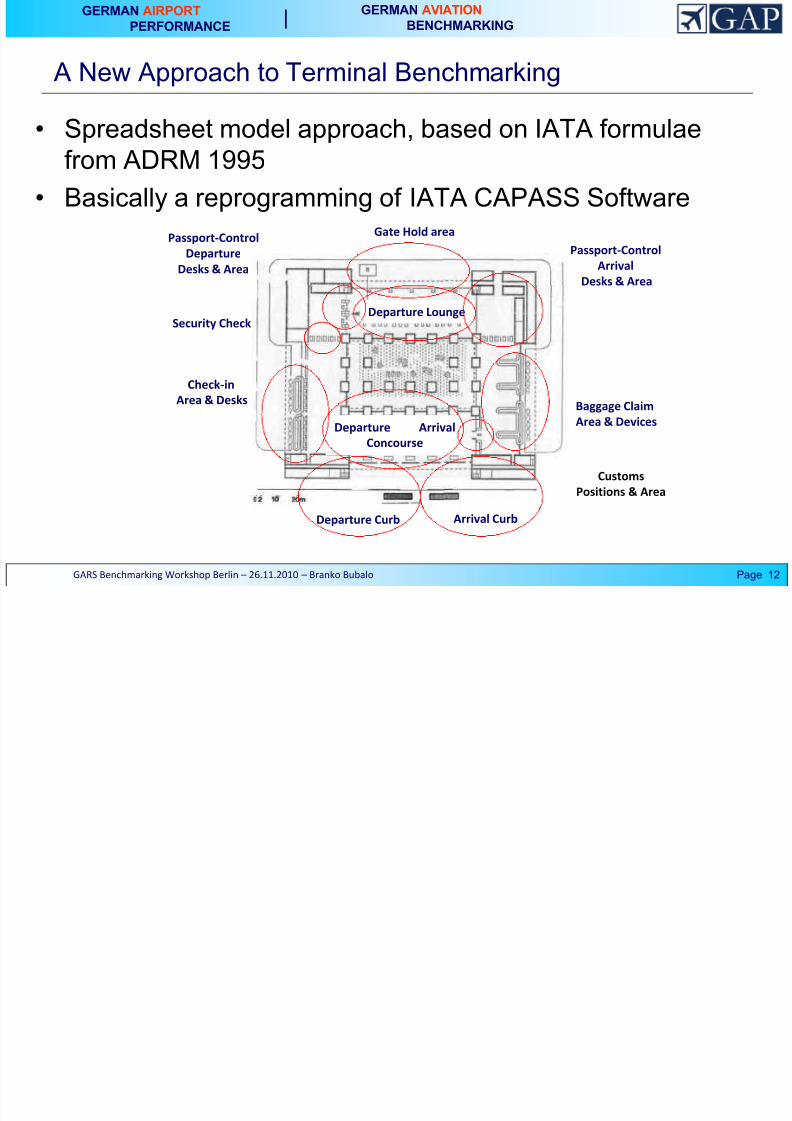
A New Approach to Terminal Benchmarking
• Spreadsheet model approach, based on IATA formulaefrom ADRM 1995
• Basically a reprogramming of IATA CAPASS Software
Page 12GARS Benchmarking Workshop Berlin – 26.11.2010 – Branko Bubalo
Departure Curb
Check-in
Area & Desks
Departure Arrival
Concourse
Gate Hold area
Passport-Control
Arrival
Desks & Area
Baggage Claim
Area & Devices
Arrival Curb
Security Check
Passport-Control
Departure
Desks & Area
Departure Lounge
Customs
Positions & Area
GERMAN AIRPORT GERMAN AVIATION
7/27/2019 Benchmarking Airport Terminals: A Simplified Toolkit for Estimating Peak Capacity - GARS Benchmarking Workshop Berlin November 2010
http://slidepdf.com/reader/full/benchmarking-airport-terminals-a-simplified-toolkit-for-estimating-peak-capacity 13/20
GERMAN AIRPORT
PERFORMANCE
GERMAN AVIATION
BENCHMARKING
A New Approach to Terminal Benchmarking
Page 13GARS Benchmarking Workshop Berlin – 26.11.2010 – Branko Bubalo
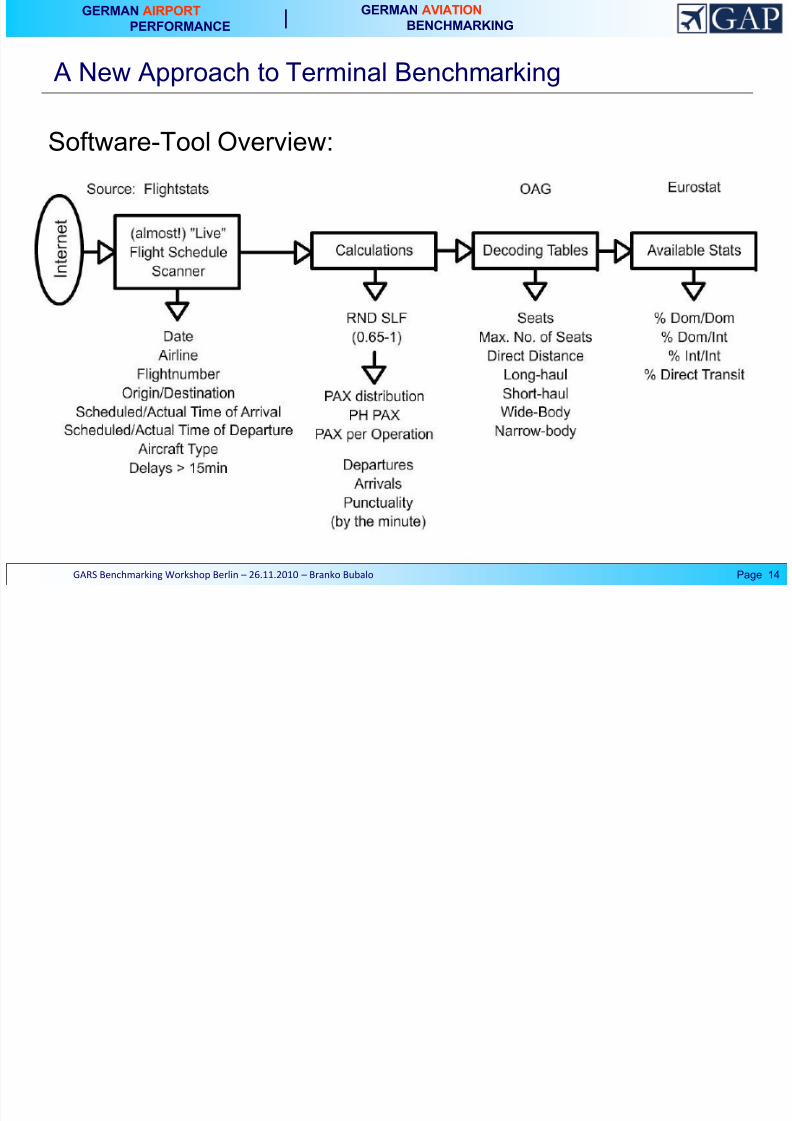
Data sources:• Flightstats -> Airport Schedule
• OAG -> De-/Coding Tables
• Eurostat -> Shares Int/Dom Passengers
• IATA Airport Capacity/Demand Profiles 2003 -> Declared
Terminal Capacities
• National Slot Coordination -> Declared Runway CAPs
• Airport Websites -> missing or more recent information
GERMAN AIRPORT GERMAN AVIATION
7/27/2019 Benchmarking Airport Terminals: A Simplified Toolkit for Estimating Peak Capacity - GARS Benchmarking Workshop Berlin November 2010
http://slidepdf.com/reader/full/benchmarking-airport-terminals-a-simplified-toolkit-for-estimating-peak-capacity 14/20
GERMAN AIRPORT
PERFORMANCE
GERMAN AVIATION
BENCHMARKING
A New Approach to Terminal Benchmarking
Page 14GARS Benchmarking Workshop Berlin – 26.11.2010 – Branko Bubalo
Software-Tool Overview:
GERMAN AIRPORT GERMAN AVIATION

7/27/2019 Benchmarking Airport Terminals: A Simplified Toolkit for Estimating Peak Capacity - GARS Benchmarking Workshop Berlin November 2010
http://slidepdf.com/reader/full/benchmarking-airport-terminals-a-simplified-toolkit-for-estimating-peak-capacity 15/20
GERMAN AIRPORT
PERFORMANCE
GERMAN AVIATION
BENCHMARKING
A New Approach to Terminal Benchmarking
• Inputs:
Page 15GARS Benchmarking Workshop Berlin – 26.11.2010 – Branko Bubalo
o Peak hour total passengerso Peak hour number of originating passengerso Peak hour number of departing passengerso Peak hour number of terminating passengerso Share of Direct Transit passengers (checked
airside)o Direct Transit passengers (checked airside)o
Proportion of transfer passengers not checkedairside during peak hour o Peak hour number of transfer passengers not
checked airsideo Peak hour number of terminating and
international/domestic transfer passengers
(arriving passengers)o Proportion of long-haul departing passengers
during peak hour
o Proportion of short-haul departing passengersduring peak hour
o Proportion of terminating passengers arriving by
wide-body aircraft during peak hour o Proportion of terminating passengers arriving by
narrow-body aircraft during peak hour o Time of arrival of first passenger at gate hold
rooms (minutes before standard time of departure
of largest aircraft handled at the gate)
o Time last passenger should board (minutes before
standard time of departure)o Number of visitors per originating passengerso Number of visitors per terminating passengerso Number of passengers per wide-body aircraft at 80% load
factor o Number of passengers per narrow-body aircraft at 80% load
factor o Maximum Number of Seats on largest aircraft handled at
gateo Maximum Number of Seats on largest aircraft handled at
airport
o Average occupancy time of departure lounge per departing
long-haul passenger
o Average occupancy time of departure lounge per departingshort-haul passenger
o Proportion of Passengers to be customs checkedo Average processing time per passenger at check-in desko Average processing time per passenger at Passport
Control - Departureo Average processing time per passenger at Passport
Control - Arrivalo Average processing time per passenger at Customs -
Arrival
GERMAN AIRPORT GERMAN AVIATION
7/27/2019 Benchmarking Airport Terminals: A Simplified Toolkit for Estimating Peak Capacity - GARS Benchmarking Workshop Berlin November 2010
http://slidepdf.com/reader/full/benchmarking-airport-terminals-a-simplified-toolkit-for-estimating-peak-capacity 16/20
GERMAN AIRPORT
PERFORMANCE
GERMAN AVIATION
BENCHMARKING
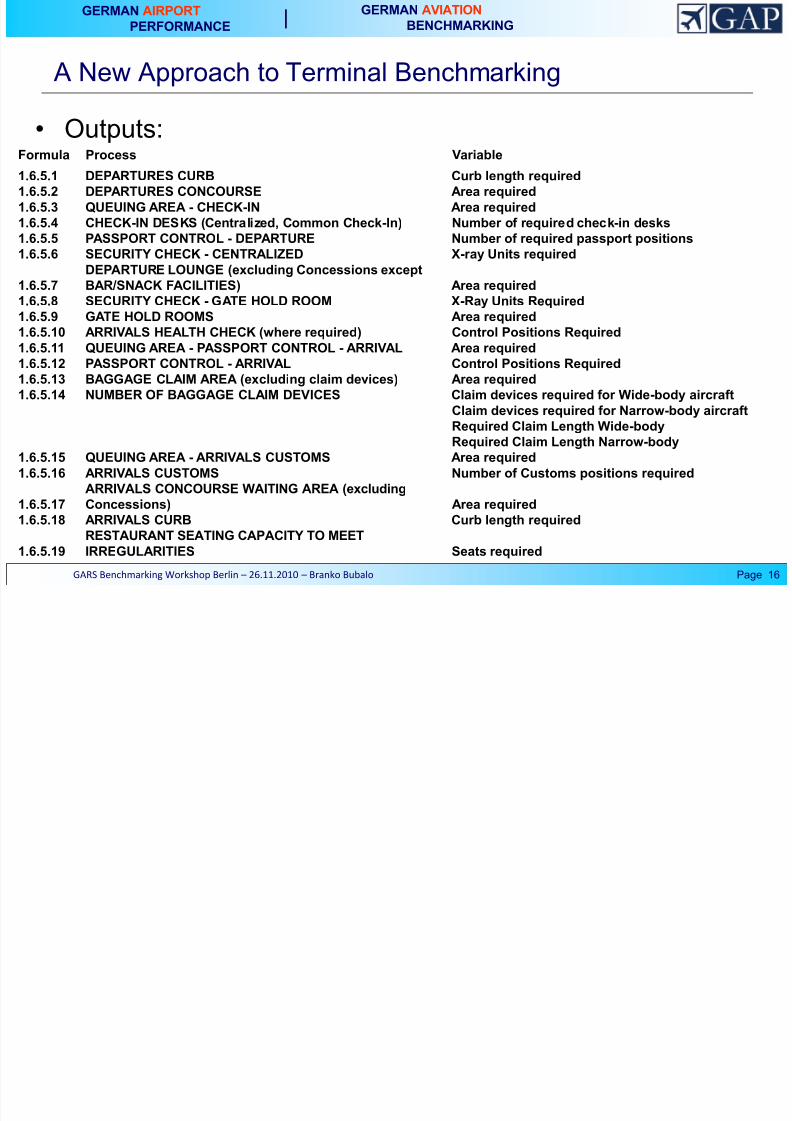
A New Approach to Terminal Benchmarking
• Outputs:
Page 16GARS Benchmarking Workshop Berlin – 26.11.2010 – Branko Bubalo
Formula Process Variable
1.6.5.1 DEPARTURES CURB Curb length required
1.6.5.2 DEPARTURES CONCOURSE Area required
1.6.5.3 QUEUING AREA - CHECK-IN Area required
1.6.5.4 CHECK-IN DESKS (Centralized, Common Check-In) Number of required check-in desks
1.6.5.5 PASSPORT CONTROL - DEPARTURE Number of required passport positions
1.6.5.6 SECURITY CHECK - CENTRALIZED X-ray Units required
1.6.5.7 DEPARTURE LOUNGE (excluding Concessions exceptBAR/SNACK FACILITIES) Area required
1.6.5.8 SECURITY CHECK - GATE HOLD ROOM X-Ray Units Required
1.6.5.9 GATE HOLD ROOMS Area required
1.6.5.10 ARRIVALS HEALTH CHECK (where required) Control Positions Required
1.6.5.11 QUEUING AREA - PASSPORT CONTROL - ARRIVAL Area required
1.6.5.12 PASSPORT CONTROL - ARRIVAL Control Positions Required
1.6.5.13 BAGGAGE CLAIM AREA (excluding claim devices) Area required
1.6.5.14 NUMBER OF BAGGAGE CLAIM DEVICES Claim devices required for Wide-body aircraft
Claim devices required for Narrow-body aircraftRequired Claim Length Wide-body
Required Claim Length Narrow-body
1.6.5.15 QUEUING AREA - ARRIVALS CUSTOMS Area required
1.6.5.16 ARRIVALS CUSTOMS Number of Customs positions required
1.6.5.17
ARRIVALS CONCOURSE WAITING AREA (excluding
Concessions) Area required
1.6.5.18 ARRIVALS CURB Curb length required
1.6.5.19
RESTAURANT SEATING CAPACITY TO MEET
IRREGULARITIES Seats required
GERMAN AIRPORT GERMAN AVIATION
7/27/2019 Benchmarking Airport Terminals: A Simplified Toolkit for Estimating Peak Capacity - GARS Benchmarking Workshop Berlin November 2010
http://slidepdf.com/reader/full/benchmarking-airport-terminals-a-simplified-toolkit-for-estimating-peak-capacity 17/20
GERMAN AIRPORT
PERFORMANCE
GERMAN AVIATION
BENCHMARKING
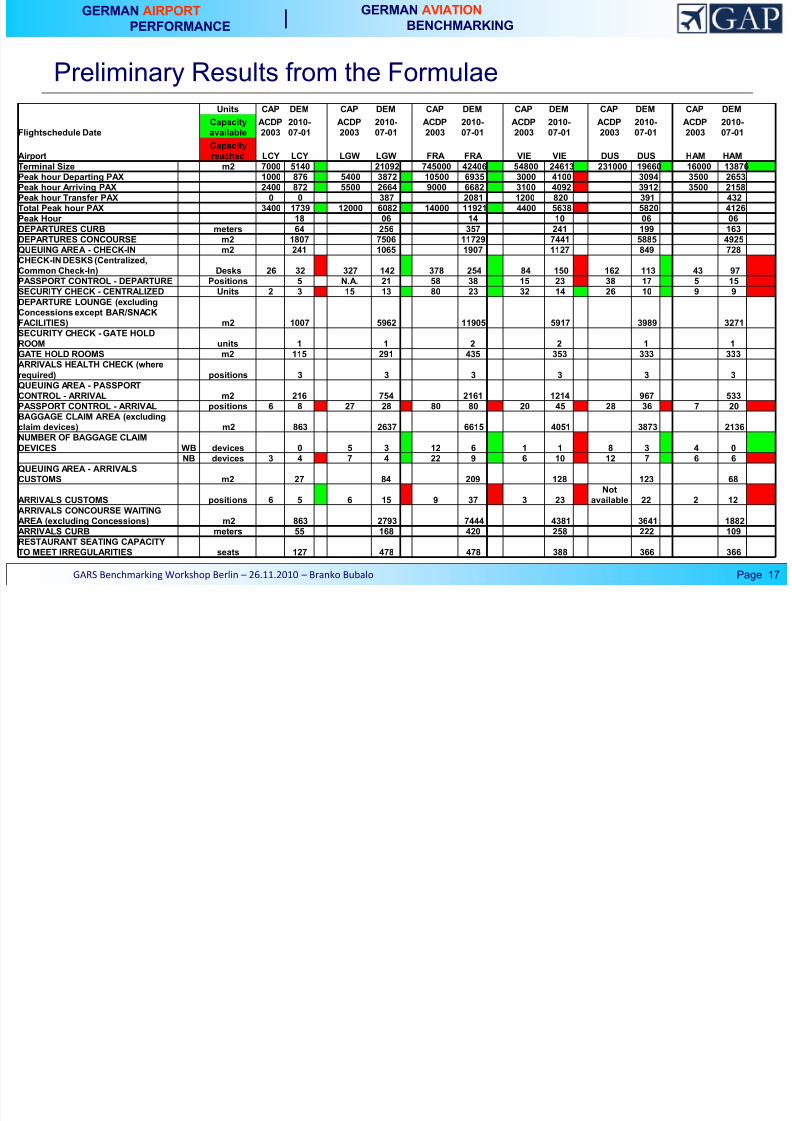
Preliminary Results from the Formulae
Page 17GARS Benchmarking Workshop Berlin – 26.11.2010 – Branko Bubalo
Units CAP DEM CAP DEM CAP DEM CAP DEM CAP DEM CAP DEM
Flightschedule Date
Capacity
available
ACDP
2003
2010-
07-01
ACDP
2003
2010-
07-01
ACDP
2003
2010-
07-01
ACDP
2003
2010-
07-01
ACDP
2003
2010-
07-01
ACDP
2003
2010-
07-01
Airport
Capacity
reached LCY LCY LGW LGW FRA FRA VIE VIE DUS DUS HAM HAM
Terminal Size m2 7000 5140 21092 745000 42406 54800 24613 231000 19660 16000 13876
Peak hour Departing PAX 1000 876 5400 3872 10500 6935 3000 4100 3094 3500 2653
Peak hour Arriving PAX 2400 872 5500 2664 9000 6682 3100 4092 3912 3500 2158
Peak hour Transfer PAX 0 0 387 2081 1200 820 391 432
Total Peak hour PAX 3400 1739 12000 6082 14000 11921 4400 5638 5820 4126
Peak Hour 18 06 14 10 06 06
DEPARTURES CURB meters 64 256 357 241 199 163
DEPARTURES CONCOURSE m2 1807 7506 11729 7441 5885 4925
QUEUING AREA - CHECK-IN m2 241 1065 1907 1127 849 728
CHECK-IN DESKS (Centralized,
Common Check-In) Desks 26 32 327 142 378 254 84 150 162 113 43 97
PASSPORT CONTROL - DEPARTURE Positions 5 N.A. 21 58 38 15 23 38 17 5 15
SECURITY CHECK - CENTRALIZED Units 2 3 15 13 80 23 32 14 26 10 9 9
DEPARTURE LOUNGE (excluding
Concessions except BAR/SNACK
FACILITIES) m2 1007 5962 11905 5917 3989 3271
SECURITY CHECK - GATE HOLD
ROOM units 1 1 2 2 1 1
GATE HOLD ROOMS m2 115 291 435 353 333 333
ARRIVALS HEALTH CHECK (where
required) positions 3 3 3 3 3 3
QUEUING AREA - PASSPORT
CONTROL - ARRIVAL m2 216 754 2161 1214 967 533
PASSPORT CONTROL - ARRIVAL positions 6 8 27 28 80 80 20 45 28 36 7 20
BAGGAGE CLAIM AREA (excludingclaim devices) m2 863 2637 6615 4051 3873 2136
NUMBER OF BAGGAGE CLAIM
DEVICES WB devices 0 5 3 12 6 1 1 8 3 4 0
NB devices 3 4 7 4 22 9 6 10 12 7 6 6
QUEUING AREA - ARRIVALS
CUSTOMS m2 27 84 209 128 123 68
ARRIVALS CUSTOMS positions 6 5 6 15 9 37 3 23
Not
available 22 2 12
ARRIVALS CONCOURSE WAITING
AREA (excluding Concessions) m2 863 2793 7444 4381 3641 1882
ARRIVALS CURB meters 55 168 420 258 222 109
RESTAURANT SEATING CAPACITY
TO MEET IRREGULARITIES seats 127 478 478 388 366 366
GERMAN AIRPORT GERMAN AVIATION
7/27/2019 Benchmarking Airport Terminals: A Simplified Toolkit for Estimating Peak Capacity - GARS Benchmarking Workshop Berlin November 2010
http://slidepdf.com/reader/full/benchmarking-airport-terminals-a-simplified-toolkit-for-estimating-peak-capacity 18/20
GERMAN AIRPORT
PERFORMANCE
GERMAN AVIATION
BENCHMARKING
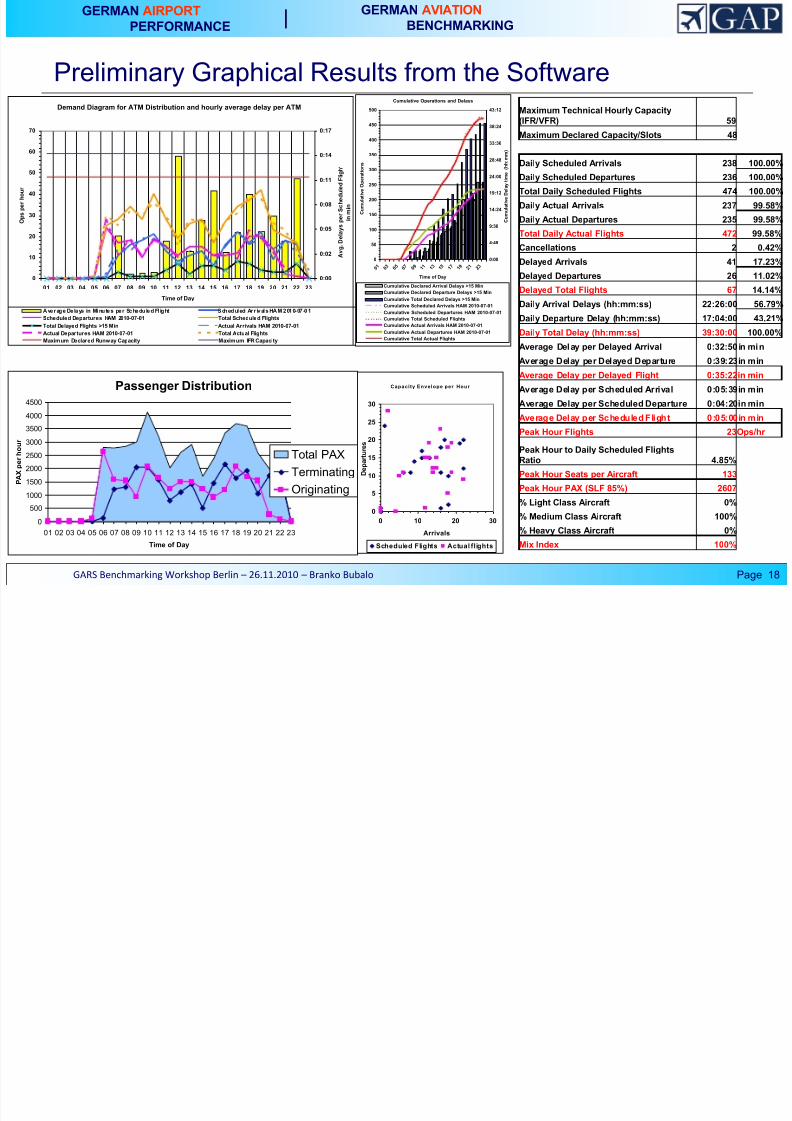
Preliminary Graphical Results from the Software
Page 18GARS Benchmarking Workshop Berlin – 26.11.2010 – Branko Bubalo
Maximum Technical Hourly Capacity
(IFR/VFR) 59
Maximum Declared Capacity/Slots 48
Daily Scheduled Arrivals 238 100.00%
Daily Scheduled Departures 236 100.00%
Total Daily Scheduled Flights 474 100.00%
Daily Actual Arrivals 237 99.58%
Daily Actual Departures 235 99.58%
Total Daily Actual Flights 472 99.58%
Cancellations 2 0.42%
Delayed Arrivals 41 17.23%
Delayed Departures 26 11.02%Delayed Total Flights 67 14.14%
Daily Arrival Delays (hh:mm:ss) 22:26:00 56.79%
Daily Departure Delay (hh:mm:ss) 17:04:00 43.21%
Daily Total Delay (hh:mm:ss) 39:30:00 100.00%
Average Delay per Delayed Arrival 0:32:50in min
Average Delay per Delayed Departure 0:39:23in min
Average Delay per Delayed Flight 0:35:22in min
Average Delay per Scheduled Arrival 0:05:39in min
Average Delay per Scheduled Departure 0:04:20in min
Average Delay per Scheduled Flight 0:05:00in min
Peak Hour Flights 23Ops/hr
Peak Hour to Daily Scheduled Flights
Ratio 4.85%
Peak Hour Seats per Aircraft 133
Peak Hour PAX (SLF 85%) 2607
% Light Class Aircraft 0%
% Medium Class Aircraft 100%
% Heavy Class Aircraft 0%
Mix Index 100%
Passenger Distribution
0
500
1000
1500
2000
2500
3000
3500
4000
4500
01 02 03 04 05 06 07 08 09 10 11 12 13 14 15 16 17 18 19 20 21 22 23
Time of Day
P A X p e r h o u r
Total PAX
Terminating
Originating
Demand Diagram for ATM Distribution and hourly average delay per ATM
0
10
20
30
40
50
60
70
01 02 03 04 05 06 07 08 09 10 11 12 13 14 15 16 17 18 19 20 21 22 23
Time of Day
O p s p e r h o u r
0:00
0:02
0:05
0:08
0:11
0:14
0:17
A v g . D e l a y s p e r S c h e d u l e d F l i g h
i n m i n
Averag e De lays in Minu tes per Schedu led Fl ig ht Sch ed uled Arr ivals HAM 2010-07 -01
Scheduled Departures HAM 2010-07-01 Total Scheduled Flights
Total Delayed Flights >15 Min Actual Arrivals HAM 2010-07-01
Actual Departures HAM 2010-07-01 Total Actual Flights
Maximum Declared Runway Capacity Maximum IFR Capacity
Capacity Envelope per Hour
0
5
10
15
20
25
30
0 10 20 30
Arrivals
D e p a r t u r e s
Scheduled Flights Actual flights
Cumulative Operations and Delays
0
50
100
150
200
250
300
350
400
450
500
0 1 0 3 0 5 0 7 0 9 1 1 1 3 1 5 1 7 1 9 2 1 2 3
Time of Day
C u m u l a t i v e O p e r a t i o n s
0:00
4:48
9:36
14:24
19:12
24:00
28:48
33:36
38:24
43:12
C u m u l a t i v e D e l a y t i m e
( h h : m m )
Cumulative Declared Arrival Delays >15 Min
Cumulative Declared Departure Delays >15 Min
Cumulative Total Declared Delays >15 Min
Cumulative Scheduled Arrivals HAM 2010-07-01
Cumulative Scheduled Departures HAM 2010-07-01
Cumulative Total Scheduled Flights
Cumulative Actual Arrivals HAM 2010-07-01
Cumulative Actual Departures HAM 2010-07-01
Cumulative Total Actual Flights
GERMAN AIRPORT GERMAN AVIATION
7/27/2019 Benchmarking Airport Terminals: A Simplified Toolkit for Estimating Peak Capacity - GARS Benchmarking Workshop Berlin November 2010
http://slidepdf.com/reader/full/benchmarking-airport-terminals-a-simplified-toolkit-for-estimating-peak-capacity 19/20
GERMAN AIRPORT
PERFORMANCE
GERMAN AVIATION
BENCHMARKING
Outlook and further Refinement
• Obtaining detailed floor plans• Passenger flow simulation for locating terminal
“bottlenecks” (e.g. wrong arrangement of facilities &
servers)
• Runs regarding sensitivity to varying seat load factor • Runs regarding sensitivity to different schedules
• Runs regarding sensitivity to different levels-of-service
• Runs regarding sensitivity to different transfer rates
Page 19GARS Benchmarking Workshop Berlin – 26.11.2010 – Branko Bubalo
GERMAN AIRPORT GERMAN AVIATION
7/27/2019 Benchmarking Airport Terminals: A Simplified Toolkit for Estimating Peak Capacity - GARS Benchmarking Workshop Berlin November 2010
http://slidepdf.com/reader/full/benchmarking-airport-terminals-a-simplified-toolkit-for-estimating-peak-capacity 20/20
GERMAN AIRPORT
PERFORMANCE
GERMAN AVIATION
BENCHMARKING
Thank you for your attention! Questions?
Suggestions and Comments are welcome.
www.gap-projekt.de
P 20GARS B h ki W k h B li 26 11 2010 B k B b l