Embed Size (px)
Citation preview
Benchmarking EU countries against Danish flexicurity model
Eamets Raul, Philips Kaia, Alloja Janika, Krillo Kerly
University of Tartu, Institute of Economics
Narva Rd 4 51009 Tartu Estonia Phone: +3727376374, Fax: +3727376312 E-mail: [email protected], [email protected]
Abstract The key issue of renewed Lisbon strategy is the urgent need to increase competitiveness of European economy. One potential way to achieve this is increased labour market flexibility, which should be combined with workers’ social protection. The balance between labour market flexibility and social security is labelled with new concept of flexicurity. In this paper we present short overview of different interpretation of the concept. Usually Danish or Dutch models are referred in literature as benchmark models for flexicurity. In our analyses we use Danish model as benchmark for other EU member states. The purpose of this paper is to find out what is the current state in implementation of flexicurity policies in EU member states. We use factor analysis in order to map different aspects of Danish “golden triangle” and see how EU25 member states relate to this triangle. Three factors identified in model are labour market adaptability/flexibility, social security and social cohesion. Countries are classified into a particular group according to an overall measure of “distance” between countries reflecting the scores obtained for the principal dimensions that characterise flexicurity systems. In our cluster analysis we grouped countries into six major clusters. Most successful country group is Nordic group, least successful are Mediterranean group and new member states from Central Europe.
JEL Classification numbers: J6, O52
Keywords: Flexicurity, Danish Golden Triangle, European social model, labour market flexibility, social security
Acknowledgements This study was initiated in the framework of the research undertaken for the European Foundation for the Improvement of Living and Working Conditions in the project “Industrial relations, future trends and challenges of globalization”. We are very grateful to Timo Kauppinnen for useful comments to previous drafts and several discussions. We also acknowledge the support from the Estonian Science Foundation in the frame of grant project No. 6479 “The valuation of human capital in Estonian labour market: over-education and skill-mismatch issues”.
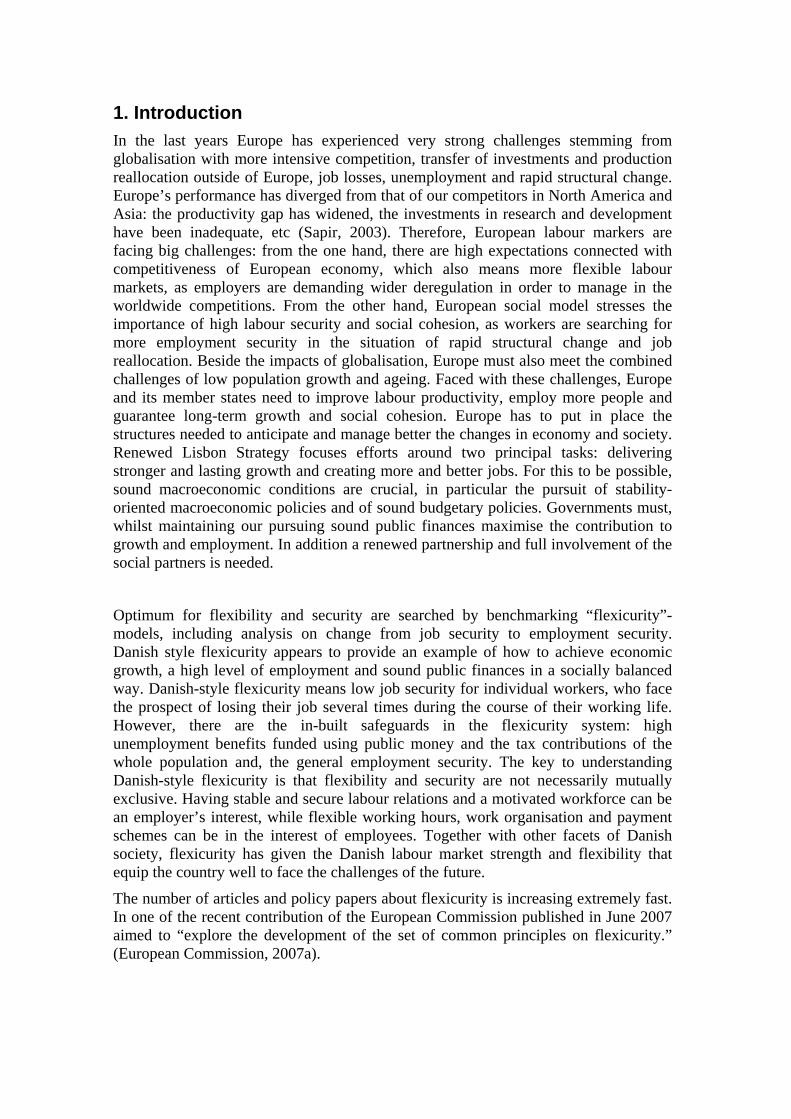
1. Introduction In the last years Europe has experienced very strong challenges stemming from globalisation with more intensive competition, transfer of investments and production reallocation outside of Europe, job losses, unemployment and rapid structural change. Europe’s performance has diverged from that of our competitors in North America and Asia: the productivity gap has widened, the investments in research and development have been inadequate, etc (Sapir, 2003). Therefore, European labour markers are facing big challenges: from the one hand, there are high expectations connected with competitiveness of European economy, which also means more flexible labour markets, as employers are demanding wider deregulation in order to manage in the worldwide competitions. From the other hand, European social model stresses the importance of high labour security and social cohesion, as workers are searching for more employment security in the situation of rapid structural change and job reallocation. Beside the impacts of globalisation, Europe must also meet the combined challenges of low population growth and ageing. Faced with these challenges, Europe and its member states need to improve labour productivity, employ more people and guarantee long-term growth and social cohesion. Europe has to put in place the structures needed to anticipate and manage better the changes in economy and society. Renewed Lisbon Strategy focuses efforts around two principal tasks: delivering stronger and lasting growth and creating more and better jobs. For this to be possible, sound macroeconomic conditions are crucial, in particular the pursuit of stability-oriented macroeconomic policies and of sound budgetary policies. Governments must, whilst maintaining our pursuing sound public finances maximise the contribution to growth and employment. In addition a renewed partnership and full involvement of the social partners is needed.
Optimum for flexibility and security are searched by benchmarking “flexicurity”-models, including analysis on change from job security to employment security. Danish style flexicurity appears to provide an example of how to achieve economic growth, a high level of employment and sound public finances in a socially balanced way. Danish-style flexicurity means low job security for individual workers, who face the prospect of losing their job several times during the course of their working life. However, there are the in-built safeguards in the flexicurity system: high unemployment benefits funded using public money and the tax contributions of the whole population and, the general employment security. The key to understanding Danish-style flexicurity is that flexibility and security are not necessarily mutually exclusive. Having stable and secure labour relations and a motivated workforce can be an employer’s interest, while flexible working hours, work organisation and payment schemes can be in the interest of employees. Together with other facets of Danish society, flexicurity has given the Danish labour market strength and flexibility that equip the country well to face the challenges of the future.
The number of articles and policy papers about flexicurity is increasing extremely fast. In one of the recent contribution of the European Commission published in June 2007 aimed to “explore the development of the set of common principles on flexicurity.” (European Commission, 2007a).
According to EU definitions flexicurity can be defined as integrated strategy to enhance, at the same time, flexibility and security in the labour market (Common Principles, p.10)
According the communication from the Commission there is agreement within the EU that flexicurity policy should include the following components: flexible and reliable contractual arrangements, comprehensive lifelong learning strategies; effective active labour market policies and modern social security systems (European Commission, 2007b).
Employment in Europe 2006 states that the member states need to identify and implement appropriate combinations of policies enhancing both the flexibility and security of their labour markets. There is no single flexicurity solution for all, and therefore adopted reforms will need to reflect the specific situation in each member state. The purpose of this paper is to find out what is the current state of the situation in implementation of flexicurity policies in EU member state. Danish model of flexicurity is taken as benchmark and we use factor analysis in order to map different aspects of Danish “golden triangle” and see how other EU24 member states relate to this triangle. Countries are classified into a particular group according to an overall measure of “distance” between countries reflecting the scores obtained for the factors that characterise flexicurity systems. Three factors identified in model are social protection, labour market adaptability/flexibility and social inclusion. Novelty of this analysis is the number of countries and the variety of variables used in analysis. In earlier study launched by European Commission in 2006 (see Employment in Europe 2006) only OECD countries were taken under observation.
The paper is structured as follows. Section 2 describes the flexicurity concept and provides a brief overview of the definitions and discussion about flexicurity as well as brief description of Danish flexicurity “golden triangle”. Section 3 discusses the measurement possibilities and indicators used to analyse flexicurity together with description of data we used in the factor and cluster analysis. The empirical results as well as comparison with Danish flexicurity model are presented in Section 4. The final section concludes.
2. Flexicurity concepts and the Danish “golden triangle” There are high expectations connected with the improvement of the competitiveness of European economy and the enlargement of the euro area. Flexible labour markets help to maintain the expected quick economic growth of the European economies and to adjust to the possible asymmetric shocks of the euro area (HM Treasury, 2003). The particular significance of the labour market flexibility is also outlined by the Optimal Currency Area Theory (Mundell, 1961), which forms a theoretical framework for the European Monetary Union. A possible serious negative consequence of enhancing labour market flexibility may be an increased feeling of insecurity that may weaken the cohesion of society and discourage the improvement of human capital. In the face of such feelings, the question how people can be protected from these unacceptable forms of labour flexibility evidently arises. Therefore the European social model stresses the importance of high labour security and social cohesion. To put these two tasks − the necessity to increase labour market flexibility simultaneously with providing social security and supporting social cohesion − together for enhancing economic growth and competitiveness, a relatively new concept called labour flexicurity has been developed.
Flexicurity as a policy option in general means social protection measures for flexible workforce.
However, despite the fact that the term “flexicurity” clearly indicates the policy which optimally combines labour market flexibility and security, we usually think of flexibility in more general terms as adaptability. As Boeri et al (2002) assert, the adaptability includes the flexibility, but at least potentially goes far beyond. They argue that flexibility and employment protection legislation are too narrow concepts to successfully express the multidimensionality of the labour market and say that “There are a number of reasons why adaptability can be a more meaningful and useful object to focus on when evaluating labour market performance. Indeed, adaptability measures would explicitly take into account the reasons why such institutions are put into place, and the fact that they are likely to emerge as an endogenous response to an inherently imperfect labour market.” In their definition of adaptability tries to capture i) the ability of the market to protect against uninsurable risk, ii) the ability to make sure that skill requirements are met while simultaneously allow for a iii) sizeable labour market and iv) labour mobility.
Wilthagen and Tros (2004) ascribe the initial concept of flexicurity to Dutch professor H. Adriaansens who started to use this term in his speeches and interviews in 1995. He defined flexicurity as a shift from job security towards employment security and suggested compensating the decrease of job security due to fewer permanent jobs and easier dismissals by improving employment opportunities and social security. Based on these initial considerations, Wilthagen and Rogowski (2002) defined flexicurity as “a policy strategy that attempts, synchronically and in deliberate way, to enhance the flexibility of labour market and to enhance security – employment security and social security − notably for weaker groups in and outside the labour market on the other hand”. This definition is sometimes also called the Dutch approach of flexicurity (see Klammer, 2004). In Denmark flexicurity is also viewed in combination of low level of dismissal protection with high unemployment benefits (see also Madsen 2003). Denmark and the Netherlands are often pointed out as examples of good practice in the field of flexicurity.
Several authors have defined flexicurity in a much more general way. For instance Keller and Seifert (2004) view flexicurity as social protection for flexible workforce, understood as an alternative to pure flexibilisation, or to deregulation-only policy according to Klammer (2004). As correctly mentioned by Tangian (2005), the definitions describing flexicurity concepts are more like strategies, which are difficult to describe quantitatively. Therefore he suggests to arrow the definition so that we could measure the flexicurity numerically. According to Tangian, flexicurity is the employment and social security of atypically employed people, thus people who ordi-narily do not have permanent full time job. Based on this relatively narrow definition he constructs the flexicurity index, which is based on qualitative juridical data and sev-eral other indicators. Tangian stresses that regardless of the particularities all definitions of flexicurity can be summarised by analogy with a motto of the Prague Spring 1968” socialism with human face”. According to his definition flexicurity is ..”a deregulation of labour market (=flexibilisation) with a “human face”, that is, compensated by some advantages in social security and employment security, in particular, for the groups affected..”(Tangian 2008, p12.).
Eamets and Paas (2007) define flexicurity as increasing labour market mobility (job flows, workers flows, functional and occupational mobility, geographical mobility,

flexible working time arrangements) with opportunities for getting a new job and not loosing substantially in income level. The last two mean that unemployed people should get sufficient training and active labour market policy support in order to get a new job quickly. The unemployment benefit should be sufficient to cover major income losses while people are looking for new jobs. The duration of the payment of unemployment benefit should be relatively short, so that people will not lose motivation to seek new jobs.
Flexicurity model have been also criticised as very vague concept, which allows to everybody to use its own definition and eventually to subsume everything they like under the fleicurity label. This tends to lead to very unproductive discussion on the definitions of the concept. That diverts interest away from the fundamental issues of the exact measures required to achieve a set of clearly defined objectives. (Calmfors, 2007)
Calmfors identify at least for potential problems related to the flexicurity concept.
1. A tendency to mix up instruments and objectives.
2. A tendency to pretend that all good things can be achieved simultaneously without analyse if difficult trade-offs.
3. The view that social dialogue and consensus are always a desirable means to achieve a well functioning labour market, and
4. The view that it is desirable to adopt “ a set of common principles” of flexicurity in the EU
Despite of the criticism and the fact that some authors still consider flexicurity as a specific Dutch/Danish phenomenon (Gorter, 2000), the idea has spread all over Europe within a few years. At the Lisbon summit of 2001 the EU already referred to this concept (Vielle and Walthery, 2003). In the European Union’s Employment Guidelines for 2003 the balance between security and flexibility was explained as follows: “providing the right balance between flexibility and security will help support the competitiveness of firms, increase quality and productivity at work and facilitate the adaptation of firms and workers to economic change” (Council of the European Union, 2003, §12)
The idea behind Danish flexicurity is that a combination of worker flexibility and security can, together, safeguard social security and competitiveness. Danish-style flexicurity means low job security for individual, workers facing the prospect of losing their job several times during their working lives. Flexibility on the Danish labour market is multi-facetted:
• flexible hiring and firing rules and liberal mindset in relation to firing rules (leading to a high degree of numerical flexibility);
• working-time flexibility – under the relevant agreements, working time may be calculated on a yearly basis and job-sharing can be introduced for short periods;
• wage flexibility – final wages are set through collective agreement at company level.
At the same time, people can feel secure due to high unemployment benefits funded by public money and the tax contributions of the whole population and, the general employment security. Employment security is further backed up by a broad raft of supplementary and further training measures which are managed and administered
jointly by the authorities and the social partners. The objective is to give people opportunities in their working lives and to redistribute resources via public-sector budgets and activities: high expenditures on social protection and high unemployment benefits. This generates social cohesion through a strong policy of income equalisation and action to head off major social tensions and high life satisfaction. As several social surveys show, Danes do generally feel safe and content and their life satisfaction is highest in European Union (Delhey, 2002). In the face of the globalisation and the fact that jobs are being relocated abroad, flexicurity also creates a high degree of economic and social security for the people by means of the following paradigm shifts: “security of employment rather than job security”. It is quite true that individuals do risk losing their job but the social security network ensures that they have enough to live on in the short term, while, in the longer run, their chances of finding a new job are enhanced through active labour market measures, combined with high levels of employment.
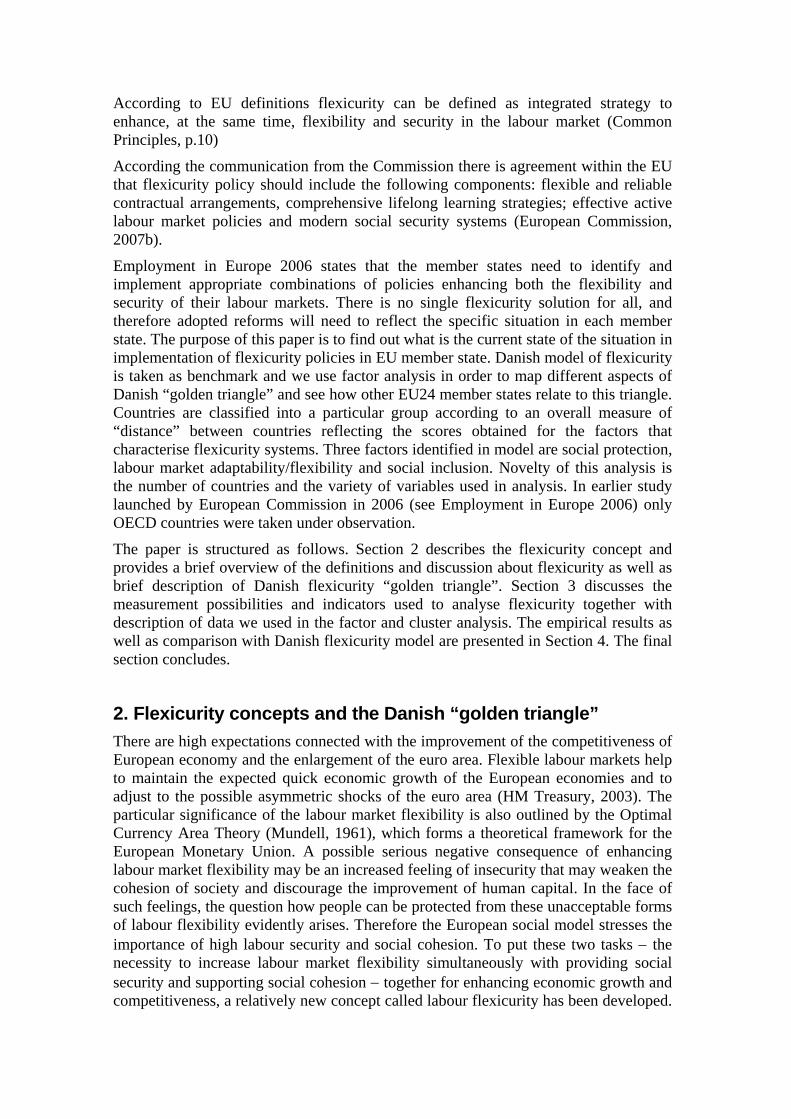
Boyer (2007) described Danish flexicurity model as synergy of three components: labour law, employment policy and welfare. Permissive labour laws about hiring and firing generate high workers flows and such situation is accepted by workers because of generous unemployment benefit system. Negative effect of generosity is counterbalanced with active labour market policy based on sophisticated mix of control of the unemployed and upgrading of their competences. This concept labelled in literature as Danish Golden triangle of flexicurity is presented in the Figure 1 (see also Madsen, 2003)
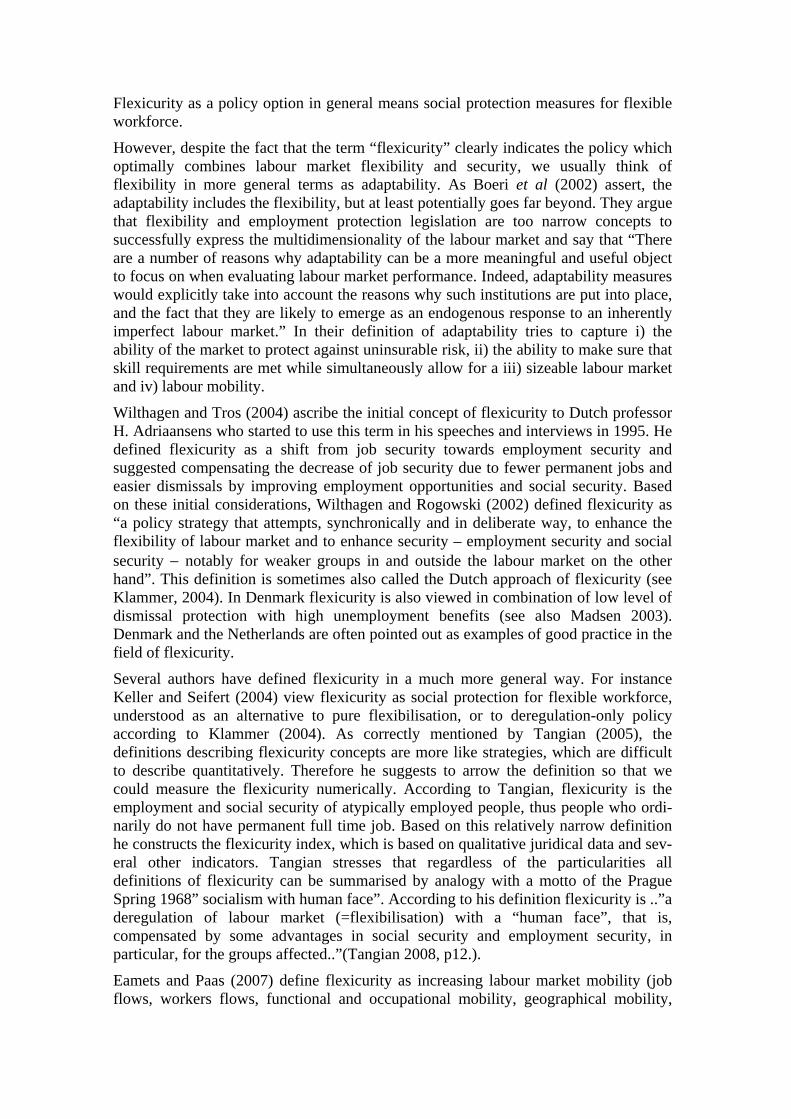
The key to understanding Danish-style flexicurity is that flexibility and security are not necessarily mutually exclusive. The concept of flexicurity breaks with this antagonism. Employers may be keen to have stable and secure working relationships and motivated staff, while workers may be similarly keen for flexible working time, flexible work organisation and flexible pay arrangements. These new kinds of labour markets can thus generate a new interplay between flexibility and security Table 1 summarises the different aspects of Danish “golden triangle” and relevant policies that support critical success factors of flexicurity model.
The Danish ”Flexicurity Model”
Flexible labour market
Active LMPGenerous welfare
schemes
The main axis of the flexicurity model
The qualification effect of the LMP
Motivational effect of LMP
Figure 1. Danish “golden triangle” of flexicurity Source: Madsen 2006.
Table 1. Critical success factors and relevant policies of flexicurity in Denmark Critical success factors Relevant policies Flexibility Flexible hiring and firing rules Employment security
Social security and unemployment insurance/ support Social dialogue and collective bargaining Liberal firing rules
Working-time flexibility Job sharing Social dialogue and collective bargaining Wage flexibility
Social security: A generous support system (providing social security)
Tax policy Public spending/public service Social dialogue and collective bargaining Social security and unemployment insurance/ support
Security to combine family life and work; attractive arrangements for maternity/paternity leave, childcare facilities, etc.
Public spending/public service Income equalisation Equal career opportunities
Active labour market policies Strong activation and training measures Tax policy
Active labour market policies Social security and unemployment insurance/ support
High level of skills among population Training and further training support Life-long learning
Source: authors compilation
To sum up, the Danish system is expensive for the state, which pays a substantial proportion of the wage-replacement benefits to the unemployed. Around a quarter of the population of working age is without a job and in receipt of some form of public support. Around half of these people have withdrawn permanently from the labour market. To maintain welfare state funding without tax hikes requires higher employment rates among people of working age. Demographic developments mean a rise in the number of older people and a fall in the number of those who are economi-cally active. There may be a labour shortage and, since women, who constitute the labour reserve, are already to a large extent part of the workforce, new ways will have to be found of boosting employment. These may include raising the retirement age or increasing the numbers of immigrant workers with the requisite skills.
3. Measurement of labour market flexicurity Over the last few years, there has been an increasing amount of literature discussing the concept of flexicurity. While the literature is growing, there is still no wide con-sensus about the definition and measurement of flexicurity. The number of indicators reflecting flexibility and social security is very large and include various aspects con-cerning both labour demand and labour supply. There is a variety of papers describing different aspects of flexicurity issues. As the concept of flexicurity itself is relatively new, there is no consensus in literature, which indicators are better and which reflect the essence of the concepts in the best way.
For example, Tangian (2004) introduced a flexicurity indices, which are constructed from: i) scores of the strictness of employment protection legislation provided by the OECD, ii) qualitative juridical data on social security benefits (unemployment insurance, public pensions, etc.), and iii) data on the dynamics of employment types (permanent, temporary, full-time, part-time, self-employed, etc.). He distinguished between norm-security index (indicating the security of the permanent full-time employees), flexicurity index (covering the security of the permanent part-time and fixed-term full-time employees) and all-security index (indicating the security of all three aforementioned groups). The analysis revealed that the highest indices are attained by Sweden and Netherlands, while the worst places occupy the UK, Portugal, Spain and Czech Republic.
However, different authors have mostly used separate measures for labour market flexibility and social security. The most well-known classification of labour market flexibility distinguishes four forms of labour market flexibility and four forms of social security (see for example Tangian 2006; Wilthagen, Tros 2004, van Lieshout 2003 among others). Tangian (2006) and Boeri et al (2002, 2006) have analysed the relationship between labour market flexibility (EPL index) and security (the generosity of unemployment insurance benefits). The results indicate that it is possible to dis-tinguish different groups of countries. In several countries (France, Germany, Belgium) unemployment benefits are particularly generous, while EPL has traditionally been close to the EU average. Southern European countries like Italy, Spain and Greece, on the other hand, are historically characterized by very strict employment protection regulations and a rather low coverage of unemployment benefits.
Several authors have found significant trade-off between social security and flexibility (see for example Boeri, Conde-Ruix, Galasso, 2003, 2006), meaning that countries with flexible labour markets have rather low level on security and otherwise. In the
context of measuring flexicurity it means that some aspects of social security and flexibility can be measured with same indicators, but with “opposite signs”, thereby they “cancel out”. Following Tangiani (2005) it has little sense to oppose all types of security to flexibility, because the latter implies most of the former. In case of social security, income security is only category not described by different types of flexibility. This concept has been adopted by several authors describing social security. For example, Tangiani (2005) considers only different social security benefits measuring social security, as was done by Baulsh et al (2006), Botero et al (2003), Moffitt (2000) (who, however have called this measure as overall measure of welfare generosity and not bonded it with wider concept of social security).
The objective of the following analysis is to classify EU member states into groups based on flexicurity models. Therefore, in our analysis we are using factor analysis and cluster analysis. Factor analysis is method for detecting structure in the relationships between large set of variables. Method allows summarising information in variables and reducing initial set of variables to new smaller set of combined variables — factors. Cluster analysis comprises a group of multivariate statistics techniques whose primary purpose is to group objects based on their characteristics. It is used to simplify data and identify relationships among the observations. Objects are classified so that each object is similar to others in the same cluster with respect to some predetermined selection criterion. Therefore objects belonging to the same cluster are more similar to one another than they are to objects in other clusters, i.e. resulting clusters should exhibit high within-cluster homogeneity and high between-cluster heterogeneity.
There are weaknesses of factor and cluster analysis which must be considered. Most important is that both of these methods are highly subjective. For example, in the factor analysis it is decision of researcher how many factors to retain, which rotation method to use, which variables are considered to be connected to which factors, names of factors etc. Hence different solutions may be founded from same initial data. The cluster analysis can be characterised as a theoretical, exploratory and descriptive; it has no statistical basis upon which to draw statistical inferences from sample to population (so it is difficult to generalise the sample-based results to whole population); the results depend on the researcher’s decisions and the cluster solution is extremely dependent upon the variables used in the analysis as the similarity measure.
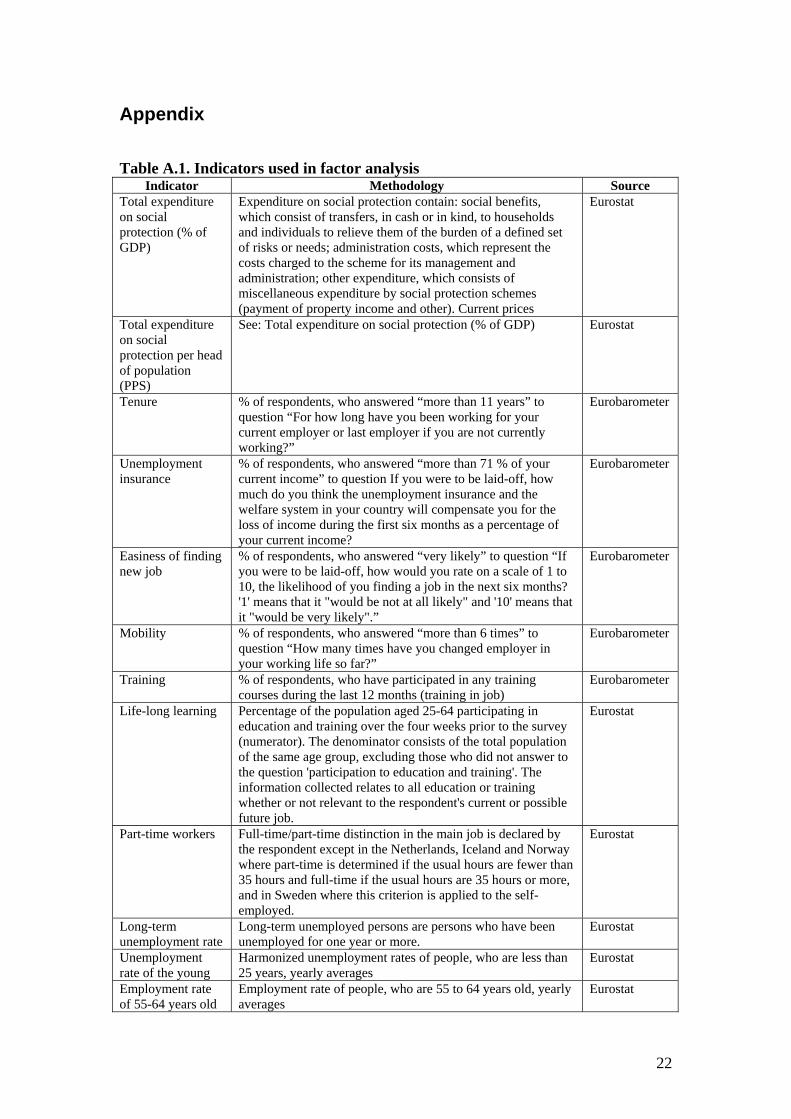
One of our purposes was to create flexicurity models for all EU member states (except very new comers Romania and Bulgaria). Up to now, most of the research in this field is based on analysing OECD countries or EU15 countries. This is a challenging task, as to find comparable information about all EU25 countries is complicated. For example, the most well-known composite indicator used for measuring the strictness of employment protection legislation – EPL index – is not available for majority of new member states. Therefore the choice of indicators to include into the analysis is quite limited (for definitions and sources of the following variables see Table A.1 in Appendix and discussion in the next Section). To measure flexibility of labour market we included into the analysis the following indicators: tenure, mobility, easiness of finding a new job, and the share of part time workers. To characterise the security in different countries we used: total expenditure on social protection (% of GDP), total expenditure on social protection per head, unemployment insurance, long-term unemployment rate, unemployment rate of youth, early school leavers, employment rate of elderly people (55-64), ratio of 80/20 income quartiles, Gini coefficient, poverty rate (50%), at-risk-of-poverty rate after social transfers. To characterise the activation
side of labour market we included life-long learning and training indicators into the analysis.
In the final version we used 15 variables as input in factor analysis. Variables correspond to main assumption of factor analysis that there exists underlying structure among variables, i.e. variables are logically related. Variables were selected if they had values for every country; since case-wise selection applies. Three factors remained in model, since they account sufficiently variance and yield tractable solution. Oblique rotation was employed, as we assume that different factors of labour market variables may be strongly related. Results indicate that three factors account 85% of common variance shared by 15 indicators, meaning that ¾ of common variance is described by the model. The goal was to achieve simple structure in solution, therefore only factor loadings which were highest for every variable were considered.
4. Flexicurity profiles of EU25 countries Table 2 presents factors – adaptability/flexicurity, social security and social cohesion – and their components we identified in our model.
Adaptability/flexicurity. This factor consists of Eurobarometer indicators about easiness to find a new job, mobility indicator (if persons have changed job more the six times during their work life), and two indicators reflecting training issues. Also the long-term unemployment rate, youth unemployment rate and employment rate of elderly persons were included. The share of part-time workers was considered as part of this factor, although indicator was correlated with the second factor as well. We can interpret this factor so that parts of indicators (mobility, part-time work, and easiness of finding new job) are flexibility indicators. Training and lifelong learning show the adaptability and employment and unemployment rates of different social groups show both adaptability and flexibility of the labour market.
Social security. In the social security factor, two indicators characterising expenditures on social protection and unemployment insurance indicator grouped together. As the tenure was also switched to this factor we can interpret that social security in broader sense includes also some elements of job protection (or low job mobility). It must be pointed out, that part-time employment highly correlates also with this factor.
Social cohesion. The social cohesion1 factor consists of poverty and income distribution data. The share of early school leavers also belongs to this factor. If people do not have appropriate qualification and skills, they will be in a weaker position in terms of labour market and the likelihood to become in low income group is relatively high. Tenure is negatively correlated with this factor indicating that longer tenure might increase income security.
In addition we tried to measure in somehow the importance of social partners in whole process. In Danish model trust between social partners and industrial relations system plays crucial role. Our attempts to include any industrial relation indicator failed as different industrial relations indicators grouped to different factors and it was not possible to give reasonable interpretation.
1 The values of the third factor score were reversed meaning that third factor represents social cohesion instead of social inclusion as indicated in factor analysis.
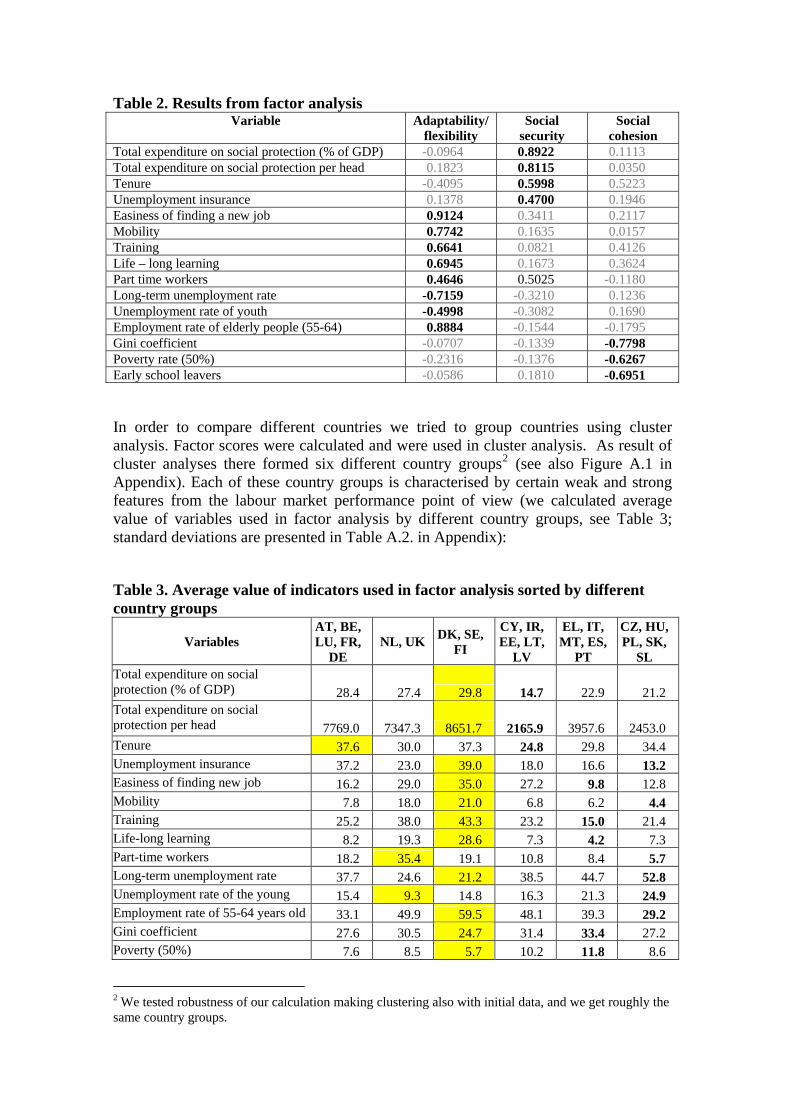
Table 2. Results from factor analysis Variable Adaptability/
flexibility Social
security Social
cohesion Total expenditure on social protection (% of GDP) -0.0964 0.8922 0.1113 Total expenditure on social protection per head 0.1823 0.8115 0.0350 Tenure -0.4095 0.5998 0.5223 Unemployment insurance 0.1378 0.4700 0.1946 Easiness of finding a new job 0.9124 0.3411 0.2117 Mobility 0.7742 0.1635 0.0157 Training 0.6641 0.0821 0.4126 Life – long learning 0.6945 0.1673 0.3624 Part time workers 0.4646 0.5025 -0.1180 Long-term unemployment rate -0.7159 -0.3210 0.1236 Unemployment rate of youth -0.4998 -0.3082 0.1690 Employment rate of elderly people (55-64) 0.8884 -0.1544 -0.1795 Gini coefficient -0.0707 -0.1339 -0.7798 Poverty rate (50%) -0.2316 -0.1376 -0.6267 Early school leavers -0.0586 0.1810 -0.6951
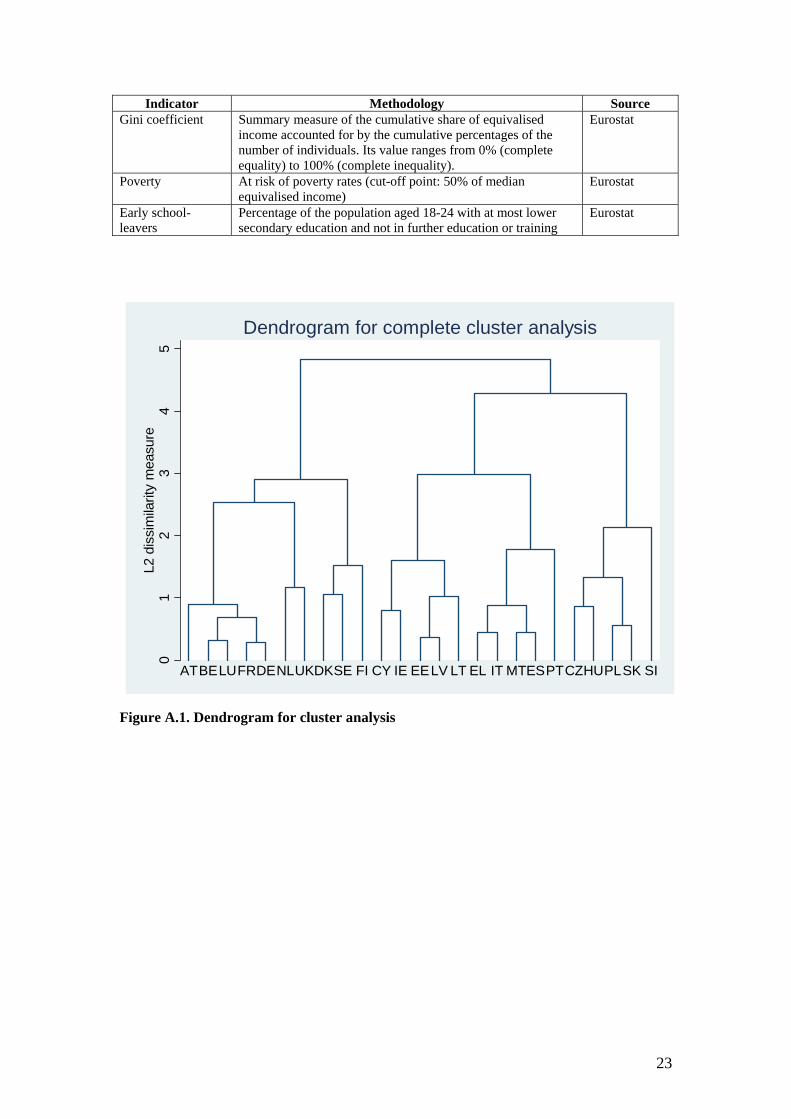
In order to compare different countries we tried to group countries using cluster analysis. Factor scores were calculated and were used in cluster analysis. As result of cluster analyses there formed six different country groups2 (see also Figure A.1 in Appendix). Each of these country groups is characterised by certain weak and strong features from the labour market performance point of view (we calculated average value of variables used in factor analysis by different country groups, see Table 3; standard deviations are presented in Table A.2. in Appendix):
Table 3. Average value of indicators used in factor analysis sorted by different country groups
Variables AT, BE, LU, FR,
DE NL, UK DK, SE,
FI
CY, IR, EE, LT,
LV
EL, IT, MT, ES,
PT
CZ, HU, PL, SK,
SL Total expenditure on social protection (% of GDP) 28.4 27.4 29.8 14.7 22.9 21.2 Total expenditure on social protection per head 7769.0 7347.3 8651.7 2165.9 3957.6 2453.0 Tenure 37.6 30.0 37.3 24.8 29.8 34.4 Unemployment insurance 37.2 23.0 39.0 18.0 16.6 13.2 Easiness of finding new job 16.2 29.0 35.0 27.2 9.8 12.8 Mobility 7.8 18.0 21.0 6.8 6.2 4.4 Training 25.2 38.0 43.3 23.2 15.0 21.4 Life-long learning 8.2 19.3 28.6 7.3 4.2 7.3 Part-time workers 18.2 35.4 19.1 10.8 8.4 5.7 Long-term unemployment rate 37.7 24.6 21.2 38.5 44.7 52.8 Unemployment rate of the young 15.4 9.3 14.8 16.3 21.3 24.9 Employment rate of 55-64 years old 33.1 49.9 59.5 48.1 39.3 29.2 Gini coefficient 27.6 30.5 24.7 31.4 33.4 27.2 Poverty (50%) 7.6 8.5 5.7 10.2 11.8 8.6
2 We tested robustness of our calculation making clustering also with initial data, and we get roughly the same country groups.
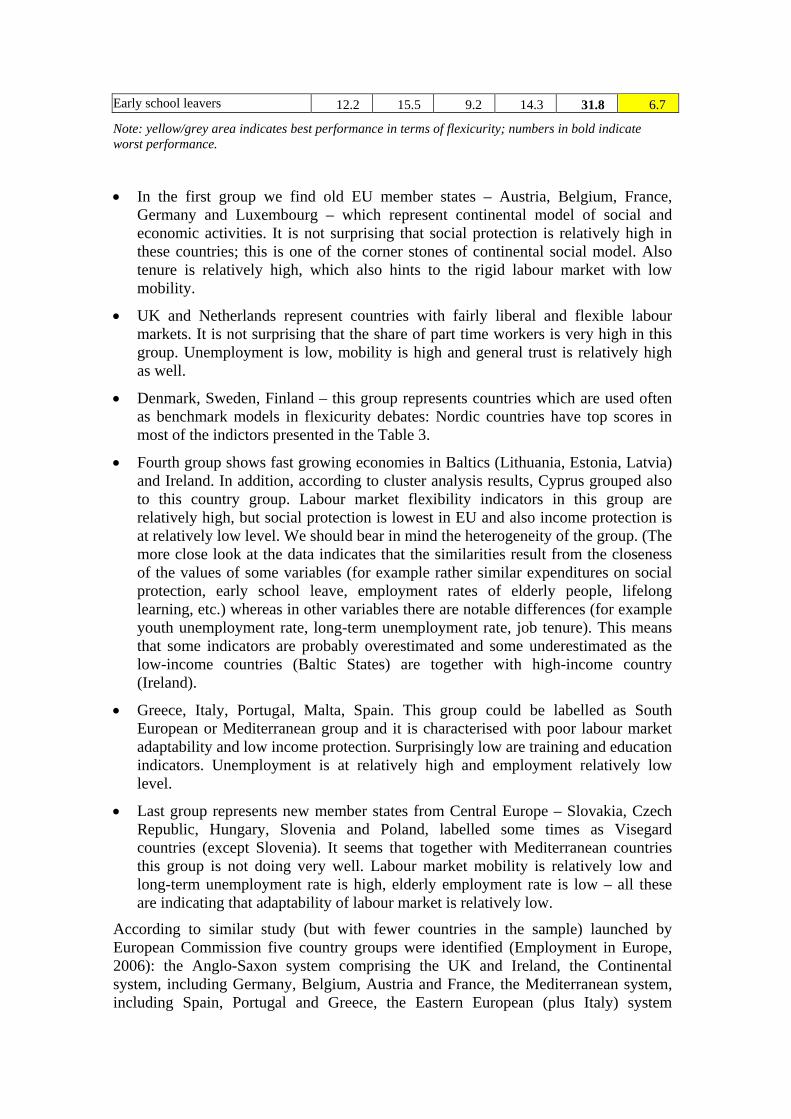
Early school leavers 12.2 15.5 9.2 14.3 31.8 6.7
Note: yellow/grey area indicates best performance in terms of flexicurity; numbers in bold indicate worst performance.
• In the first group we find old EU member states – Austria, Belgium, France, Germany and Luxembourg – which represent continental model of social and economic activities. It is not surprising that social protection is relatively high in these countries; this is one of the corner stones of continental social model. Also tenure is relatively high, which also hints to the rigid labour market with low mobility.
• UK and Netherlands represent countries with fairly liberal and flexible labour markets. It is not surprising that the share of part time workers is very high in this group. Unemployment is low, mobility is high and general trust is relatively high as well.
• Denmark, Sweden, Finland – this group represents countries which are used often as benchmark models in flexicurity debates: Nordic countries have top scores in most of the indictors presented in the Table 3.
• Fourth group shows fast growing economies in Baltics (Lithuania, Estonia, Latvia) and Ireland. In addition, according to cluster analysis results, Cyprus grouped also to this country group. Labour market flexibility indicators in this group are relatively high, but social protection is lowest in EU and also income protection is at relatively low level. We should bear in mind the heterogeneity of the group. (The more close look at the data indicates that the similarities result from the closeness of the values of some variables (for example rather similar expenditures on social protection, early school leave, employment rates of elderly people, lifelong learning, etc.) whereas in other variables there are notable differences (for example youth unemployment rate, long-term unemployment rate, job tenure). This means that some indicators are probably overestimated and some underestimated as the low-income countries (Baltic States) are together with high-income country (Ireland).
• Greece, Italy, Portugal, Malta, Spain. This group could be labelled as South European or Mediterranean group and it is characterised with poor labour market adaptability and low income protection. Surprisingly low are training and education indicators. Unemployment is at relatively high and employment relatively low level.
• Last group represents new member states from Central Europe – Slovakia, Czech Republic, Hungary, Slovenia and Poland, labelled some times as Visegard countries (except Slovenia). It seems that together with Mediterranean countries this group is not doing very well. Labour market mobility is relatively low and long-term unemployment rate is high, elderly employment rate is low – all these are indicating that adaptability of labour market is relatively low.
According to similar study (but with fewer countries in the sample) launched by European Commission five country groups were identified (Employment in Europe, 2006): the Anglo-Saxon system comprising the UK and Ireland, the Continental system, including Germany, Belgium, Austria and France, the Mediterranean system, including Spain, Portugal and Greece, the Eastern European (plus Italy) system
including Italy, Poland, Hungary, the Czech Republic and Slovakia, the Nordic system, including Denmark, the Netherlands, Sweden and Finland. We can see that our findings are similar to the results presented in Commission study.
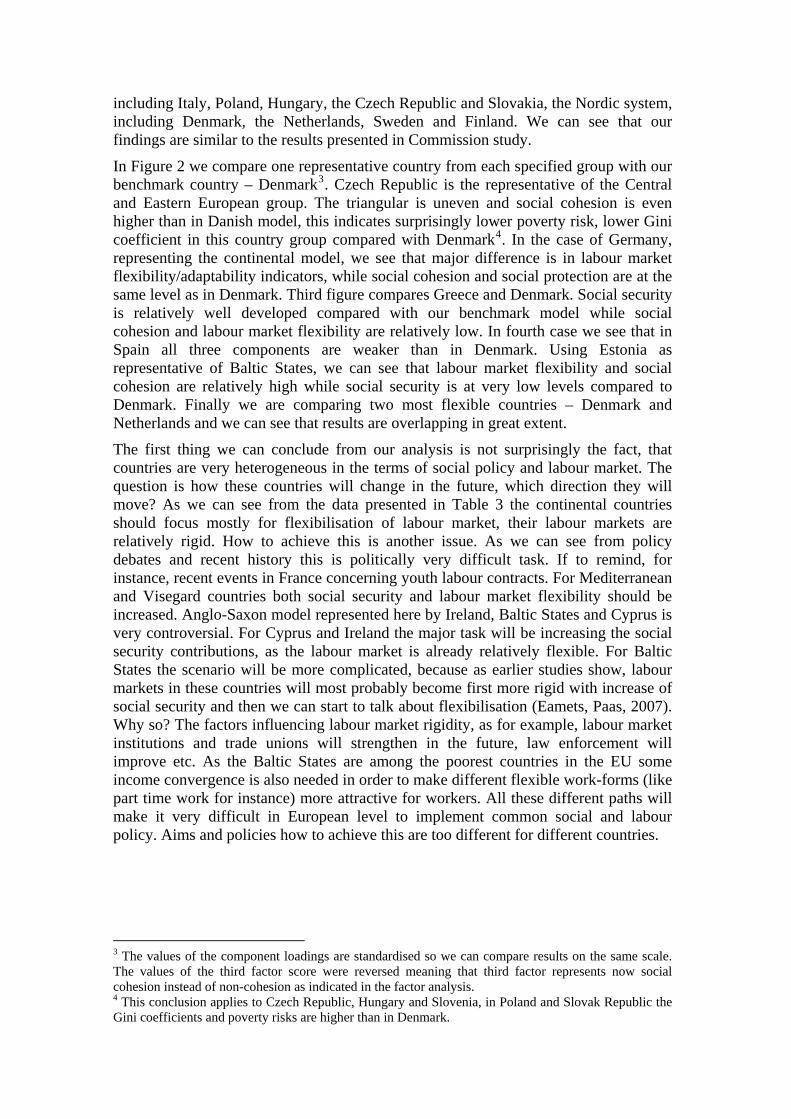
In Figure 2 we compare one representative country from each specified group with our benchmark country – Denmark3. Czech Republic is the representative of the Central and Eastern European group. The triangular is uneven and social cohesion is even higher than in Danish model, this indicates surprisingly lower poverty risk, lower Gini coefficient in this country group compared with Denmark4. In the case of Germany, representing the continental model, we see that major difference is in labour market flexibility/adaptability indicators, while social cohesion and social protection are at the same level as in Denmark. Third figure compares Greece and Denmark. Social security is relatively well developed compared with our benchmark model while social cohesion and labour market flexibility are relatively low. In fourth case we see that in Spain all three components are weaker than in Denmark. Using Estonia as representative of Baltic States, we can see that labour market flexibility and social cohesion are relatively high while social security is at very low levels compared to Denmark. Finally we are comparing two most flexible countries – Denmark and Netherlands and we can see that results are overlapping in great extent.
The first thing we can conclude from our analysis is not surprisingly the fact, that countries are very heterogeneous in the terms of social policy and labour market. The question is how these countries will change in the future, which direction they will move? As we can see from the data presented in Table 3 the continental countries should focus mostly for flexibilisation of labour market, their labour markets are relatively rigid. How to achieve this is another issue. As we can see from policy debates and recent history this is politically very difficult task. If to remind, for instance, recent events in France concerning youth labour contracts. For Mediterranean and Visegard countries both social security and labour market flexibility should be increased. Anglo-Saxon model represented here by Ireland, Baltic States and Cyprus is very controversial. For Cyprus and Ireland the major task will be increasing the social security contributions, as the labour market is already relatively flexible. For Baltic States the scenario will be more complicated, because as earlier studies show, labour markets in these countries will most probably become first more rigid with increase of social security and then we can start to talk about flexibilisation (Eamets, Paas, 2007). Why so? The factors influencing labour market rigidity, as for example, labour market institutions and trade unions will strengthen in the future, law enforcement will improve etc. As the Baltic States are among the poorest countries in the EU some income convergence is also needed in order to make different flexible work-forms (like part time work for instance) more attractive for workers. All these different paths will make it very difficult in European level to implement common social and labour policy. Aims and policies how to achieve this are too different for different countries.
3 The values of the component loadings are standardised so we can compare results on the same scale. The values of the third factor score were reversed meaning that third factor represents now social cohesion instead of non-cohesion as indicated in the factor analysis. 4 This conclusion applies to Czech Republic, Hungary and Slovenia, in Poland and Slovak Republic the Gini coefficients and poverty risks are higher than in Denmark.
-2.5
-1.5
-0.5
0.5
1.5
2.5adaptability
social securitysocial cohesion
DenmarkCzech Republic
-2.5
-1.5
-0.5
0.5
1.5
2.5adaptability
social securitysocial cohesion
DenmarkGermany
-2.5
-1.5
-0.5
0.5
1.5
2.5adaptability
social securitysocial cohesion
DenmarkGreece
-2.5
-1.5
-0.5
0.5
1.5
2.5adaptability
social securitysocial cohesion
DenmarkSpain
-2.5
-1.5
-0.5
0.5
1.5
2.5adaptability
social securitysocial cohesion
DenmarkEstonia
-2.5
-1.5
-0.5
0.5
1.5
2.5adaptability
social securitysocial cohesion
DenmarkNetherlands
Figure 2. Country flexicurity systems compared to the Danish system
5. Discussion and conclusion In new member states opening up national economies to the global competition has made domestic enterprises adjust their inputs, including labour, to the market demand. Within the structural adjustment package, introducing employment flexibility and lowering social protection was in most cases offered as the sole alternative for transforming labour markets in the new market conditions. As a result, the low administrative capacity of labour market institutions and weakness of trade unions combined with poor law enforcement have contributed to high labour market flexibil-ity and job insecurity felt by workers. In old member states we can see relatively regulated labour markets, relatively high density and coverage rates, different forms of workers representation etc. However the best way to differentiate countries is according to their type of social model. Well-known typology groups countries into four different models: Anglo-Saxon, Continental, Nordic and Mediterranean. In reality these groups are relatively mixed and our analyses show that from point of view of flexicurity six different country groups could be formed:
• The first group comprises old EU member states – Austria, Belgium, France, Germany and Luxembourg – which represent the continental model
• UK and Netherlands belong to the second group – countries which represent fairly liberal and flexible labour markets.
• Nordic group (Finland, Denmark and Sweden) represents countries which are used often as benchmark models in flexicurity debates.
• Fourth group contains of fast growing economies in Baltics (Lithuania, Estonia, Latvia) together with Ireland and Cyprus.
• Mediterranean group (Greece, Italy, Malta, Portugal and Spain) is characterised with poor labour market adaptability and low income protection.
• Last group represents new member states from Central Europe (Czech Republic, Hungary, Poland, Slovakia, and Slovenia).
Although we compared our factor analyses results with Danish results we should be careful with conclusions and policy recommendations. First of all every county has its own country specific features of social security and labour market flexibility, there are also political, economic, cultural and historical reasons for that. Moreover, Denmark has its own challenges to deal with. For example, unskilled workers in particular are coming under pressure as they face competition from lower-wage countries and production automation. Denmark has dealt with this pressure by reducing the number of unskilled workers on the labour market, since more old unskilled workers are leaving the labour market than young ones entering it. However, many young people do not receive skills training – something which, in the long run, may undermine the Danish flexicurity system. Thus, unless the supply of skilled workers is kept fairly much in sync with demand, public expenditure on unemployment benefits and other transfers will simply be too high. The Danish labour market model is characterised by a high percentage of working women. On the one hand, this means that women are more economically independent, while, on the other hand, it presents challenges in terms of reconciling family life and work. Compared with many European countries, Denmark has made substantial progress in this area but there is still long way to go to
16
achieve, among other things, equal career opportunities for men and women. The Danish system is expensive for the state, which pays a substantial proportion of the wage-replacement benefits to the unemployed. Around a quarter of the population of working age is without a job and in receipt of some form of public support. Around half of these people have withdrawn permanently from the labour market. To maintain welfare state funding without tax hikes requires higher employment rates among people of working age. Demographic developments mean a rise in the number of older people and a fall in the number of those who are economically active. There may be a labour shortage and, since women, who constitute the labour reserve, are already to a large extent part of the workforce, new ways will have to be found of boosting employment. These may include rising the retirement age or increasing the numbers of immigrant workers with the requisite skills. But, immigrants and their descendants are in general less well-educated than ethnic Danes; they have, on average, a lower participation rate on the labour market and suffer from higher unemployment than the rest of the population.
As we can see from our analyses, the diversity of different models is big and Danish model is not perfect as well. The renewed Lisbon strategy tries to find balance between social security and labour market flexibility. We can generalise the previous discussion and say that implementation of flexicurity concept has different approaches for different country groups. We believe that countries are strategically in different positions (see Figure 3):
• Some old member states are in large extent characterised by high social security and relatively rigid labour market (continental group). The biggest task for these countries is flexibilisation of labour markets.
• Second group is the mix of countries from Anglo-Saxon model and the Baltic States with their very liberal economic policy. The Baltic States are special case in terms of flexicurity. It sounds paradoxically, but in order to achieve more flexicurity, the Baltic labour markets should become more rigid providing sufficient protection to labour force and then possibly more flexible labour market arrangements will be implemented again. Cyprus and Ireland should mostly deal with social protection issues.
• Mediterranean countries and also new member states from Central Europe belong to the same group. Our analysis indicates that both security and flexibility should be developed further if these countries want to implement the flexicurity model.
• Nordic countries and the Netherlands and United Kingdom are actually very close to the model EU Commission labelled as flexicurity.
It is important to understand that in order to converge with western economies some new member states, particularly the Baltic States, should maintain a relatively liberal economic policy, which means flexible labour market with a strict monetary and fiscal policy. In general, for new member states, there are two unavoidable issues: time and active labour policies from the government side. Time means that a certain time period should be considered while nominal and real convergence of the new EU economies will take place. Active labour policies help to accelerate faster adjustment of labour force to external shocks mainly via training activities. Mutual trust is also an important issue stressed in flexicurity strategies. Both, employers and employees should trust each other and realise that it is possible to implement effective measures which may increase flexicurity as it happened in Denmark and the Netherlands.
17
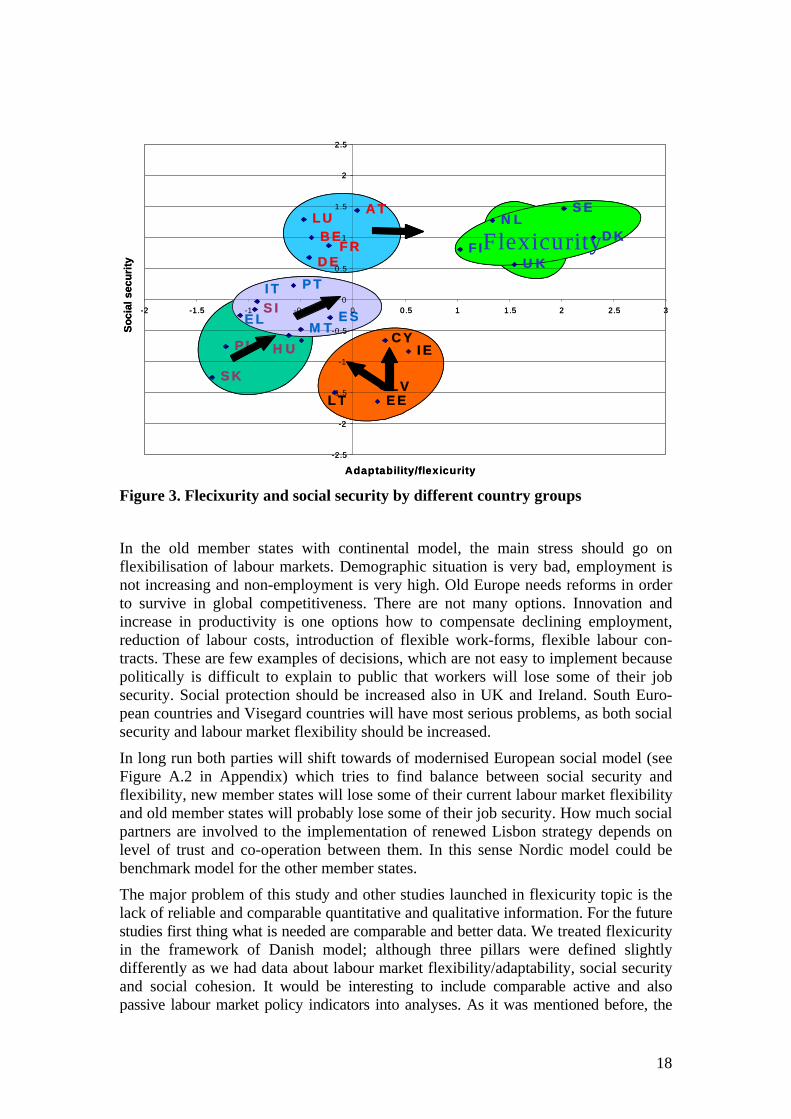
igure 3. Flecixurity and social security by different country groups
the old member states with continental model, the main stress should go on
uropean social model (see
ies launched in flexicurity topic is the
SK
PL
ELSIIT PT
HUM T
ES
LT
DEFR
BELU
AT
0.
1
CYIE
LVEE
UKFI
NLSE
DK
-2.5
-2
-1.5
-1
-0.5
0
5
1.5
2
2.5
-2 -1.5 -1 -0.5 0 0.5 1 1.5 2 2.5 3
Adaptability/flexicurity
Soci
al s
ecur
ity
F
Inflexibilisation of labour markets. Demographic situation is very bad, employment is not increasing and non-employment is very high. Old Europe needs reforms in order to survive in global competitiveness. There are not many options. Innovation and increase in productivity is one options how to compensate declining employment, reduction of labour costs, introduction of flexible work-forms, flexible labour con-tracts. These are few examples of decisions, which are not easy to implement because politically is difficult to explain to public that workers will lose some of their job security. Social protection should be increased also in UK and Ireland. South Euro-pean countries and Visegard countries will have most serious problems, as both social security and labour market flexibility should be increased.
In long run both parties will shift towards of modernised EFigure A.2 in Appendix) which tries to find balance between social security and flexibility, new member states will lose some of their current labour market flexibility and old member states will probably lose some of their job security. How much social partners are involved to the implementation of renewed Lisbon strategy depends on level of trust and co-operation between them. In this sense Nordic model could be benchmark model for the other member states.
The major problem of this study and other studlack of reliable and comparable quantitative and qualitative information. For the future studies first thing what is needed are comparable and better data. We treated flexicurity in the framework of Danish model; although three pillars were defined slightly differently as we had data about labour market flexibility/adaptability, social security and social cohesion. It would be interesting to include comparable active and also passive labour market policy indicators into analyses. As it was mentioned before, the
Flexicurity
SK
PL
ELSIIT PT
HUM T
ES
LT
CYIE
LVEE
UKFI
NLSE
DK
-2.5
-2
-1.5
-1
-0.5
0
5
1.5
2
2.5
-2 -1.5 -1 -0.5 0 0.5 1 1.5 2 2.5 3
Adaptability/flexicurity
Soci
al s
ecur
ity DEFR
BELU
AT
0.
1 Flexicurity
18
core of Danish Golden triangle are active labour market policy measures. Also there is no employment protection indexes calculated for all EU member states; however, this indicator is also essential in the flexicurity analysis. One potential direction for the future research is to conduct another benchmark exercise using another country model as a benchmark. One potential benchmark model could be Dutch model of flexicurity. What concerns current debate about changes in European labour law it would be interesting to find answers to the questions presented in Green Paper (2006) using the experience of the best practise countries. As it was mentioned before, there are no universal solutions to the questions raised in Green Paper; every country should find its own way how to balance labour market flexibility and social security.
References d, J., Weber, A. (2006). Developing a Social Protection Index for
2002). Adaptability of Labour
omy of
a, R., Lopez-de-Silanes, F., Shliefer, A. (2003) The
titutional complementarity
uestion? European Policy Analysis
n Union (2003). Council Decision of 22 July 2003 on
the
d flexicurity in in Labor
uropean Commission (2007a) Towards Common Principles of Flexicurity: More 7)
ropa.eu/employment_social/employment_strategy/flexicurity%20media/fle
ommunication from the Commission to the ttee and
Baulch, B., WooAsia Development Policy Review, 2006, 24 (1), 5-29.
Boeri, T., Garibaldi, P., Macis, M., Maggioni, M. (Markets: a Tentative Definition and a Synthetic Indicator. Milan, June2002.
Boeri, T., Conde-Ruiz, J., I., Galasso, V. (2006). The Political EconFlexicurity. FEDEA, Feb 2006.
Botero, J., Djankov, S., La Portregulation of labor, NBER working paper no. 9756, 2003.
Boyer, R. Growth strategies and poverty reduction: the inshypothesis. PSE Working Paper No. 2007-43.
Calmfors, L. Flexicurity- An Answer or QNovember Issue 6- 2007
Council of the Europeaguidelines for employment policies of the Member States, OJ L 197, 5 Aug 2003.
Delhey, J. 2004 Life satisfaction in an enlarged Europe. European Foundation forImprovement of Living and Working Conditions, 2004, 88.
Eamets, R., Paas, T. (2007). Labour market flexibility anMarket Flexibility, Flexicurity and Employment: Lessons of the Baltic States, eds T. Paas, R. Eamets, Nova Science
Eand Better Jobs Through Flexibility and Security. Brussels, 27.06.2007, COM (200359 final. http://ec.euxicuritypublication_2007_en.pdf
European Commission (2007b), CEuropean Parliament, the Council, the European Economic and Social Commithe Committee of the Regions: Towards Common Principles of Flexicurity: More and Better Jobs Through Flexibility and Security; Brussels, COM (2007) 359.
19
Employment in Europe 2006 (2006). European Commission, Luxembourg.
mmission,
, C. (2000). The Dutch Miracle? In G. Esping-Andersen and M. Regini (Eds.),
st century.
http://www.hm-
t, H. (2004). Flexibility – the German trajectory. Transfer, Vol. 10,
04). Flexicurity in a life-course perspective. Transfer, Vol. 10, No. 2,
. K. (2003). Flexicurity through labour market policies and institutions in
labour
s and female headship in US. time series, Johns
f Optimum Currency Areas. American Economic
or a Growing Europe. Making the EU Economic System
tion to European
dedicated
curity policies in Europe from three different
rinciples of Flexicurity , WSI-DP, No. 159
onde-Ruiz, J.I., Galasso, V. (2006). The Political Economy of Flexicurity,
ery, P. (2003). Flexibility and Social Protection. Dublin:
al Labour Markets. In G. Schmid and B. Gazier (Eds.), The Dynamics of Full Employment:
Eurobarometer: European Employment and Social Policy, European Co2006.
GorterWhy deregulate markets? New York: Oxford University Press, 181−210.
Green Paper. Modernisation of labour law to meet the challenges of the 21European Commission (COM(2006) 708 final), Brussels 22.11.2006.
HM Treasury (2003), EMU and Labour Market Flexibility. treasury.gov.uk.
Keller, B., SeiferNo. 2, 226-247.
Klammer, U. (20282−299.
Madsen, PDenmark. In P. Auer and S. Cazes (Eds.), Employment stability in an age of flexibility. Evidence from industrialised countries, (pp. 59−105). Geneva: ILO.
Madsen, P. K. (2006), “How can it possibly fly? The paradox of a dynamic market in a Scandinavian welfare state” in Campbell, J. L., Hall, J. A., and Pedersen, O. K. (eds.) “National Identity and a variety of Capitalism: the Case of Denmark”, Montreal, MacGill University Press.
Moffitt R.A. (2000). Welfare benefitHopkins University, June, 2000.
Mundell, R. (1961). A theory oReview, 51, No. 4, 657−665.
Sapir, A. (2003) An Agenda fDeliver, Report of an Independent High-Level Study Group, established on the initiative of the, President of the European Commission, July 2003.
Tangian, A. (2004). Defining the Flexicurity Index in ApplicaCountries. WSI Diskussionspapier 122, Hans Böckler Stiftung, Düsseldorf.
Tangian, A. (2005). Monitoring flexicurity policies in the EU with composite indicators. Conference of International Employment Relations Association, Denmark, Aalborg, 26−29 June 2005.
Tangian, A. (2006). Monitoring flexiviewpoints. WSI-DP No 145, June 2006.
Tangian, A.(2008),Towards Consistent PApril 2008
Boeri, T., CFEDEA WP 2006-15.
Vielle, P., and WalthEuropean Foundation for Improvement of Living and Working Conditions.
Wilthagen, T., and Rogowski, R. (2002). Legal Regulation of Transition
20

Social Integration through Transitional Labour Markets, (pp. 233−273). Cheltenham: Edward Elgar.
Wilthagen, T., and Tros, F. (2004). The concept of “flexicurity”: A new approach to regulating employment and labour markets. Transfer, 10, No. 2, 166−186.
21
Appendix
Table A.1. Indicators used in factor analysis Indicator Methodology Source
Total expenditure on social protection (% of GDP)
Expenditure on social protection contain: social benefits, which consist of transfers, in cash or in kind, to households and individuals to relieve them of the burden of a defined set of risks or needs; administration costs, which represent the costs charged to the scheme for its management and administration; other expenditure, which consists of miscellaneous expenditure by social protection schemes (payment of property income and other). Current prices
Eurostat
Total expenditure on social protection per head of population (PPS)
See: Total expenditure on social protection (% of GDP) Eurostat
Tenure % of respondents, who answered “more than 11 years” to question “For how long have you been working for your current employer or last employer if you are not currently working?”
Eurobarometer
Unemployment insurance
% of respondents, who answered “more than 71 % of your current income” to question If you were to be laid-off, how much do you think the unemployment insurance and the welfare system in your country will compensate you for the loss of income during the first six months as a percentage of your current income?
Eurobarometer
Easiness of finding new job
% of respondents, who answered “very likely” to question “If you were to be laid-off, how would you rate on a scale of 1 to 10, the likelihood of you finding a job in the next six months? '1' means that it "would be not at all likely" and '10' means that it "would be very likely".”
Eurobarometer
Mobility % of respondents, who answered “more than 6 times” to question “How many times have you changed employer in your working life so far?”
Eurobarometer
Training % of respondents, who have participated in any training courses during the last 12 months (training in job)
Eurobarometer
Life-long learning Percentage of the population aged 25-64 participating in education and training over the four weeks prior to the survey (numerator). The denominator consists of the total population of the same age group, excluding those who did not answer to the question 'participation to education and training'. The information collected relates to all education or training whether or not relevant to the respondent's current or possible future job.
Eurostat
Part-time workers Full-time/part-time distinction in the main job is declared by the respondent except in the Netherlands, Iceland and Norway where part-time is determined if the usual hours are fewer than 35 hours and full-time if the usual hours are 35 hours or more, and in Sweden where this criterion is applied to the self-employed.
Eurostat
Long-term unemployment rate
Long-term unemployed persons are persons who have been unemployed for one year or more.
Eurostat
Unemployment rate of the young
Harmonized unemployment rates of people, who are less than 25 years, yearly averages
Eurostat
Employment rate of 55-64 years old
Employment rate of people, who are 55 to 64 years old, yearly averages
Eurostat
22
Indicator Methodology Source Gini coefficient Summary measure of the cumulative share of equivalised
income accounted for by the cumulative percentages of the number of individuals. Its value ranges from 0% (complete equality) to 100% (complete inequality).
Eurostat
Poverty At risk of poverty rates (cut-off point: 50% of median equivalised income)
Eurostat
Early school-leavers
Percentage of the population aged 18-24 with at most lower secondary education and not in further education or training
Eurostat
01
23
45
L2 d
issi
mila
rity
mea
sure
ATBELUFRDENLUKDKSE FI CY IE EELV LT EL IT MTESPTCZHUPLSK SI
Dendrogram for complete cluster analysis
Figure A.1. Dendrogram for cluster analysis
23
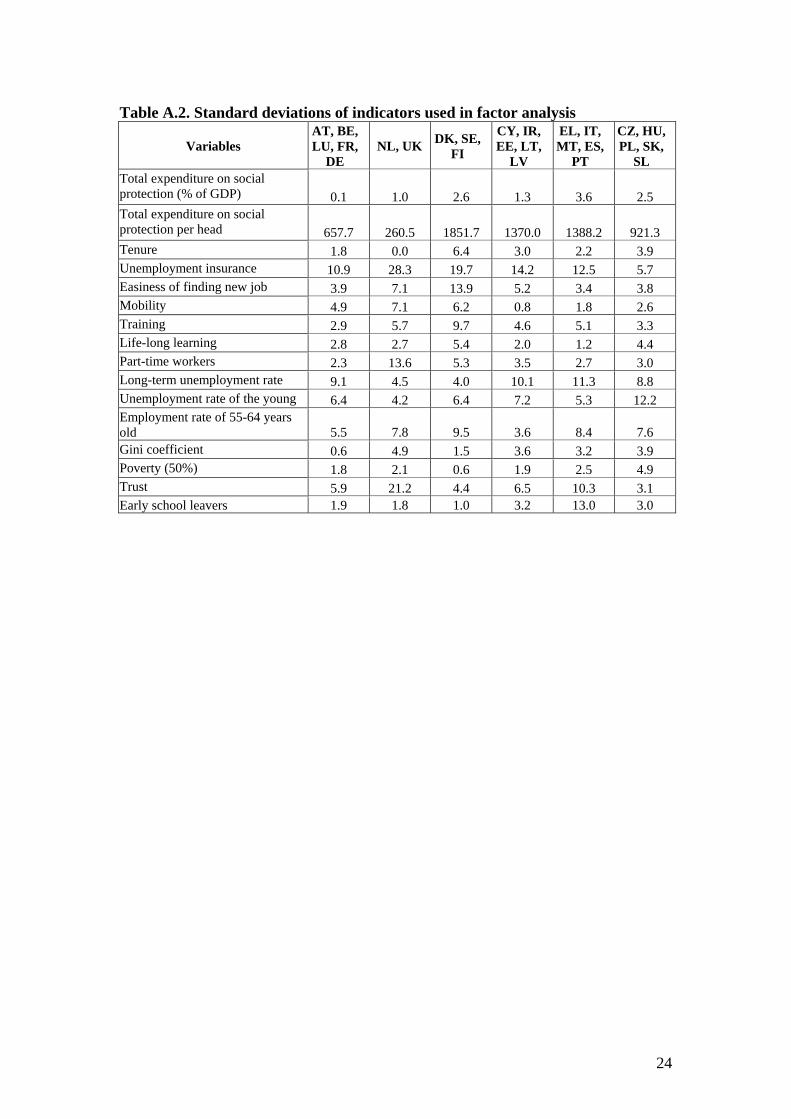
Table A.2. Standard deviations of indicators used in factor analysis
Variables AT, BE, LU, FR,
DE NL, UK DK, SE,
FI
CY, IR, EE, LT,
LV
EL, IT, MT, ES,
PT
CZ, HU, PL, SK,
SL Total expenditure on social protection (% of GDP) 0.1 1.0 2.6 1.3 3.6 2.5 Total expenditure on social protection per head 657.7 260.5 1851.7 1370.0 1388.2 921.3 Tenure 1.8 0.0 6.4 3.0 2.2 3.9 Unemployment insurance 10.9 28.3 19.7 14.2 12.5 5.7 Easiness of finding new job 3.9 7.1 13.9 5.2 3.4 3.8 Mobility 4.9 7.1 6.2 0.8 1.8 2.6 Training 2.9 5.7 9.7 4.6 5.1 3.3 Life-long learning 2.8 2.7 5.4 2.0 1.2 4.4 Part-time workers 2.3 13.6 5.3 3.5 2.7 3.0 Long-term unemployment rate 9.1 4.5 4.0 10.1 11.3 8.8 Unemployment rate of the young 6.4 4.2 6.4 7.2 5.3 12.2 Employment rate of 55-64 years old 5.5 7.8 9.5 3.6 8.4 7.6 Gini coefficient 0.6 4.9 1.5 3.6 3.2 3.9 Poverty (50%) 1.8 2.1 0.6 1.9 2.5 4.9 Trust 5.9 21.2 4.4 6.5 10.3 3.1 Early school leavers 1.9 1.8 1.0 3.2 13.0 3.0
24
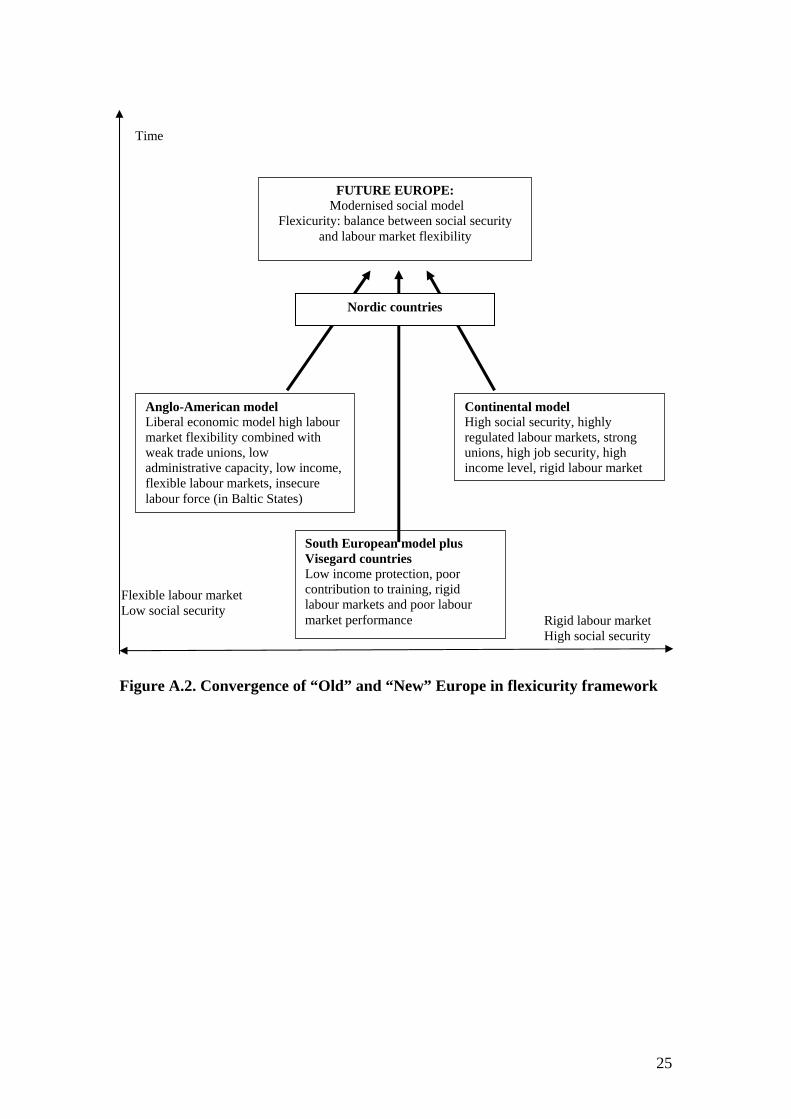
Rigid labour market High social security
Flexible labour market Low social security
Time
Anglo-American model Liberal economic model high labour market flexibility combined with weak trade unions, low administrative capacity, low income, flexible labour markets, insecure labour force (in Baltic States)
Continental model High social security, highly regulated labour markets, strong unions, high job security, high income level, rigid labour market
Nordic countries
South European model plus Visegard countries Low income protection, poor contribution to training, rigid labour markets and poor labour market performance
FUTURE EUROPE: Modernised social model
Flexicurity: balance between social security and labour market flexibility
Figure A.2. Convergence of “Old” and “New” Europe in flexicurity framework
25