Embed Size (px)
Citation preview
Bend loss in all-solid bandgap fibres T. A. Birks, F. Luan, G. J. Pearce, A. Wang, J. C. Knight, and D. M. Bird
Centre for Photonics and Photonic Materials and Department of Physics, University of Bath, Claverton Down, Bath, BA2 7AY, United Kingdom
http://www.bath.ac.uk/physics/groups/cppm/
Abstract: Experimental measurements of all-solid photonic bandgap fibres with an array of high-index rods in a low-index background revealed an unexpected variation of bend loss across different bandgaps. This behaviour was confirmed by calculations of photonic band structure, and explained with reference to the differing field distributions of the modes of the cladding rods. Our understanding was confirmed by further experiments, leading to proposals for the improvement of these fibres.
©2006 Optical Society of America
OCIS codes: (060.2280) Fiber design and fabrication; (060.2400) Fiber properties.
References and links
1. J. C. Knight, “Photonic crystal fibres,” Nature 424, 847-851 (2003). 2. Y. Fink, D. J. Ripin, S. H. Fan, C. P. Chen, J. D. Joannopoulos, and E. L. Thomas, “Guiding optical light in
air using an all-dielectric structure,” IEEE J. Lightwave Technol. 17, 2039-2041 (1999). 3. R. F. Cregan, B. J. Mangan, J. C. Knight, T. A. Birks, P. St. J. Russell, P. J. Roberts, and D. C. Allen,
“Single-mode photonic band gap guidance of light in air,” Science 285, 1537-1539 (1999). 4. C. M. Smith, N. Venkataraman, M. T. Gallagher, D. Muller, J. A. West, N. F. Borrelli, D. C. Allan, and K.
W. Koch, “Low-loss hollow-core silica/air photonic bandgap fibre,” Nature 424, 657-659 (2003). 5. R. T. Bise, R. S. Windeler, K. S. Kranz, C. Kerbage, B. J. Eggleton, D. J. Trevor, “Tunable photonic band
gap fiber,” in Optical Fiber Communications Conference, Postconference edition, 70 of OSA Trends in Optics and Photonics Series Technical Digest (Optical Society of America, Washington D.C. 2002) pp. 466-468.
6. F. Luan, A. K. George, T. D. Hedley, G. J. Pearce, D. M. Bird, J. C. Knight, P. and St. J. Russell, “All-solid photonic band gap fiber,” Opt. Lett. 29, 2369-2371 (2004).
7. A. Argyros, T. A. Birks, S. G. Leon-Saval, C. M. B. Cordeiro, F. Luan, and P. St. J. Russell, “Photonic bandgap with an index step of one percent,” Opt. Express 13, 309-314 (2005).
8. A. Argyros, T. A. Birks, S. G. Leon-Saval, C. M. B. Cordeiro, and P. St. J. Russell, “Guidance properties of low-contrast photonic bandgap fibres,” Opt. Express 13, 2503-2511 (2005).
9. G. Bouwmans, L. Bigot, Y. Quiquempois, F. Lopez, L. Provino, and M. Douay, “Fabrication and characterization of an all-solid 2D photonic bandgap fiber with a low-loss region (< 20 dB/km) around 1550 nm,” Opt. Express 13, 8452-8459 (2005).
10. A. Wang, A. K. George, and J. C. Knight, “Three-level neodymium laser incorporating photonic bandgap fiber,” Opt. Lett. 31, 1388-1390 (2006).
11. T. P. White, R. C. McPhedran, C. M. de Sterke, N. M. Litchinitser, B. J. Eggleton, “Resonance and scattering in microstructured optical fibers,” Opt. Lett. 27, 1977-1979 (2002).
12. N. M. Litchinitser, S. C. Dunn, B. Usner, B. J. Eggleton, T. P. White, R. C. McPhedran, and C. M. de Sterke, “Resonances in microstructured optical waveguides,” Opt. Express 11, 1243-1251 (2003).
13. P. Steinvurzel, B. T. Kuhmley, T. P. White, M. J. Steel, C. M. de Sterke, andd B. J. Eggleton, “Long-wavelength anti-resonant guidance in high index inclusion microstructured fibers,” Opt. Express 12, 5424-5433 (2004).
14. J. Lægsgaard, “Gap formation and guided modes in photonic band gap fibres with high-index rods,” J. Opt. A: Pure Appl. Opt. 6, 798-804 (2004).
15. T. P. Handen, J. Broeng, C. Jakobsen, G. Vienne, H. R. Simonsen, M. D. Nielsen, P. M. W. Skovgaard, J. R. Folkenberg, and A. Bjarklev, “Air-guiding photonic bandgap fibers: spectral properties, macrobending loss, and practical handling,” IEEE J. Lightwave Technol. 22, 11-15 (2004).
16. W. J. Wadsworth, N. Joly, J. C. Knight, T. A. Birks, F. Biancalana, and P. St. J. Russell, “Supercontinuum and four-wave mixing with Q-switched pulses in endlessly single-mode photonic crystal fibers,” Opt. Express 12, 299-309 (2004).
#70120 - $15.00 USD Received 19 April 2006; revised 23 May 2006; accepted 23 May 2006
(C) 2006 OSA 12 June 2006 / Vol. 14, No. 12 / OPTICS EXPRESS 5688
17. G. J. Pearce, T. D. Hedley, and D. M. Bird, “Adaptive curvilinear coordinates in a plane-wave solution of Maxwell's equations in photonic crystals,” Phys. Rev. B 71, 195108 (2005).
18. T. A. Birks, D. M. Bird, T. D. Hedley, J. M. Pottage, and P. St. J. Russell, “Scaling laws and vector effects in bandgap-guiding fibres,” Opt. Express 12, 69-74 (2004).
19. W. A. Gambling, H. Matsumura, and C. M. Ragdale, “Curvature and microbending losses in single-mode optical fibres,” Opt. Quantum Electron. 11, 43-59 (1979).
20. A. W. Snyder, and J. D. Love, Optical Waveguide Theory (Chapman and Hall, 1983). 21. J. D. Love, “Application of a low-loss criterion to optical waveguides and devices,” IEE Proc. J 136, 225-
228 (1989). 22. T. A. Birks, J. C. Knight, and P. St. J. Russell, “Endlessly single-mode photonic crystal fiber,” Opt. Lett.
22, 961-963 (1997). 23. P. W. Barber, R. K. Chang, eds., Optical Effects Associated With Small Particles (World Scientific, 1988). 24. P. Steinvurzel, E. D. Moore, E. C. Mägi, B. T. Kuhmley, and B. J. Eggleton, “Long period grating
resonances in photonic bandgap fiber,” Opt. Express 14, 3007-3014 (2006). 25. We would like to thank one of this paper's reviewers for bringing to our attention the applicability of our
work to these other results. 26. M. Yan, P. Shum, and J. Hu, “Design of air-guiding honeycomb photonic bandgap fiber,” Opt. Lett. 30,
465-467 (2005).
1. Introduction
Photonic bandgap fibres are optical fibres in which light is confined to the core by a photonic bandgap of the cladding, instead of the more usual total internal reflection [1]. The purpose of this paper is to report experimental and theoretical results leading to an understanding of light propagation (particularly bend loss) in one class of these fibres, for its own sake and as a stepping stone towards a comprehensive understanding of propagation in all bandgap fibres. (We consider only 2-D bandgap fibres, where the cladding is two-dimensionally microstructured in a lattice-like way, and exclude Bragg fibres where the refractive index distribution is coaxial and therefore one-dimensional [2].)
Hollow-core bandgap fibres with air holes in a glass background allow low-loss propagation in an empty or gas-filled core, giving the fibre several interesting properties and applications [3,4]. However, the detailed bandgap properties of the cladding are conceptually rather complicated. Advances in their design tend to be made by experimentation and exhaustive numerical modelling rather than intuitive leaps forward.
To make progress we therefore focus instead on fibres in which the cladding comprises an arrangement of isolated high-index circular rods in a connected low-index background (eg, Fig. 1). These are complicated enough to have full bandgaps and rich properties, while being easier to comprehend than hollow-core fibres. Nevertheless we expect many of their properties to be analogous to those of hollow-core fibres.
For the remainder of this paper, the term "bandgap fibre" will refer specifically to such fibres with high-index rods in the cladding. They were first demonstrated by filling the holes in an index-guiding photonic crystal fibre (PCF) with a high-index liquid [5]. All-solid bandgap fibres made from silicate glasses were demonstrated more recently [6], followed by all-solid bandgap fibres made entirely from fused silica with refractive index contrasts as low as 1% [7,8]. Losses less than 20 dB/km have recently been reported [9]. All these fibres have transmission spectra with several low-loss windows, corresponding to successive bandgaps of the cladding which can be numbered in increasing order of frequency. These give all-solid silica bandgap fibres a number of potential applications, for example as wavelength-selective elements within fibre lasers [10].
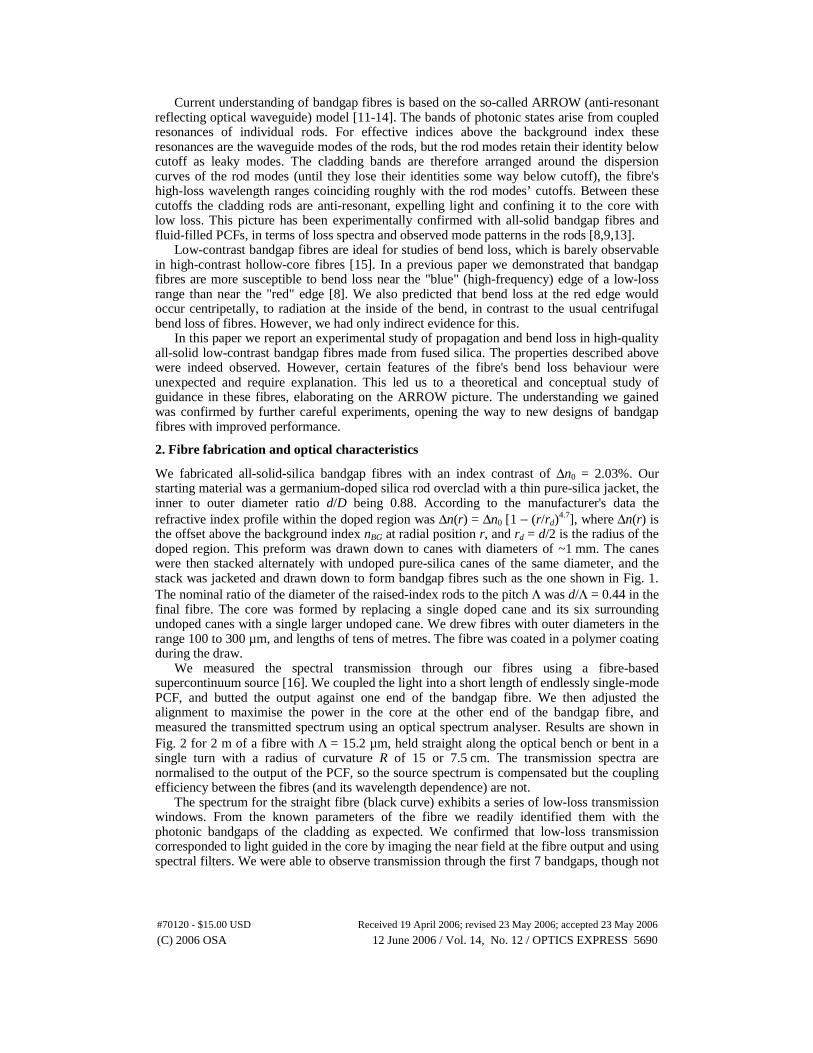
It is computationally convenient to assume the rods to be periodically arranged so that Bloch's theorem can be applied, though this is not necessary for bandgaps to occur. We assume the rods to be identical to each other, though this is also not necessary provided their resonances match. The core is a defect in this structure, which we will consider to be formed by omitting a single rod from the array. In practice the array of rods is restricted to an inner cladding region, surrounded by a uniform outer jacket of the low-index background material which is mainly for mechanical strength. Figure 1 is an SEM image of such a fibre.
#70120 - $15.00 USD Received 19 April 2006; revised 23 May 2006; accepted 23 May 2006
(C) 2006 OSA 12 June 2006 / Vol. 14, No. 12 / OPTICS EXPRESS 5689
Current understanding of bandgap fibres is based on the so-called ARROW (anti-resonant reflecting optical waveguide) model [11-14]. The bands of photonic states arise from coupled resonances of individual rods. For effective indices above the background index these resonances are the waveguide modes of the rods, but the rod modes retain their identity below cutoff as leaky modes. The cladding bands are therefore arranged around the dispersion curves of the rod modes (until they lose their identities some way below cutoff), the fibre's high-loss wavelength ranges coinciding roughly with the rod modes’ cutoffs. Between these cutoffs the cladding rods are anti-resonant, expelling light and confining it to the core with low loss. This picture has been experimentally confirmed with all-solid bandgap fibres and fluid-filled PCFs, in terms of loss spectra and observed mode patterns in the rods [8,9,13].
Low-contrast bandgap fibres are ideal for studies of bend loss, which is barely observable in high-contrast hollow-core fibres [15]. In a previous paper we demonstrated that bandgap fibres are more susceptible to bend loss near the "blue" (high-frequency) edge of a low-loss range than near the "red" edge [8]. We also predicted that bend loss at the red edge would occur centripetally, to radiation at the inside of the bend, in contrast to the usual centrifugal bend loss of fibres. However, we had only indirect evidence for this.
In this paper we report an experimental study of propagation and bend loss in high-quality all-solid low-contrast bandgap fibres made from fused silica. The properties described above were indeed observed. However, certain features of the fibre's bend loss behaviour were unexpected and require explanation. This led us to a theoretical and conceptual study of guidance in these fibres, elaborating on the ARROW picture. The understanding we gained was confirmed by further careful experiments, opening the way to new designs of bandgap fibres with improved performance.
2. Fibre fabrication and optical characteristics
We fabricated all-solid-silica bandgap fibres with an index contrast of Δn0 = 2.03%. Our starting material was a germanium-doped silica rod overclad with a thin pure-silica jacket, the inner to outer diameter ratio d/D being 0.88. According to the manufacturer's data the refractive index profile within the doped region was Δn(r) = Δn0 [1 − (r/rd)
4.7], where Δn(r) is the offset above the background index nBG at radial position r, and rd = d/2 is the radius of the doped region. This preform was drawn down to canes with diameters of ~1 mm. The canes were then stacked alternately with undoped pure-silica canes of the same diameter, and the stack was jacketed and drawn down to form bandgap fibres such as the one shown in Fig. 1. The nominal ratio of the diameter of the raised-index rods to the pitch Λ was d/Λ = 0.44 in the final fibre. The core was formed by replacing a single doped cane and its six surrounding undoped canes with a single larger undoped cane. We drew fibres with outer diameters in the range 100 to 300 µm, and lengths of tens of metres. The fibre was coated in a polymer coating during the draw.
We measured the spectral transmission through our fibres using a fibre-based supercontinuum source [16]. We coupled the light into a short length of endlessly single-mode PCF, and butted the output against one end of the bandgap fibre. We then adjusted the alignment to maximise the power in the core at the other end of the bandgap fibre, and measured the transmitted spectrum using an optical spectrum analyser. Results are shown in Fig. 2 for 2 m of a fibre with Λ = 15.2 µm, held straight along the optical bench or bent in a single turn with a radius of curvature R of 15 or 7.5 cm. The transmission spectra are normalised to the output of the PCF, so the source spectrum is compensated but the coupling efficiency between the fibres (and its wavelength dependence) are not.
The spectrum for the straight fibre (black curve) exhibits a series of low-loss transmission windows. From the known parameters of the fibre we readily identified them with the photonic bandgaps of the cladding as expected. We confirmed that low-loss transmission corresponded to light guided in the core by imaging the near field at the fibre output and using spectral filters. We were able to observe transmission through the first 7 bandgaps, though not
#70120 - $15.00 USD Received 19 April 2006; revised 23 May 2006; accepted 23 May 2006
(C) 2006 OSA 12 June 2006 / Vol. 14, No. 12 / OPTICS EXPRESS 5690
all using a single fibre size. For the fibre of Fig. 1, transmission in the third bandgap is centred at 1250 nm, with gaps 4 to 7 at shorter wavelengths.
Fig. 1. SEM image of an all-solid silica bandgap fibre. The light-coloured regions are the Ge-doped raised-index rods. The fibre's bandgap-guiding core is the site of a missing rod in the centre.
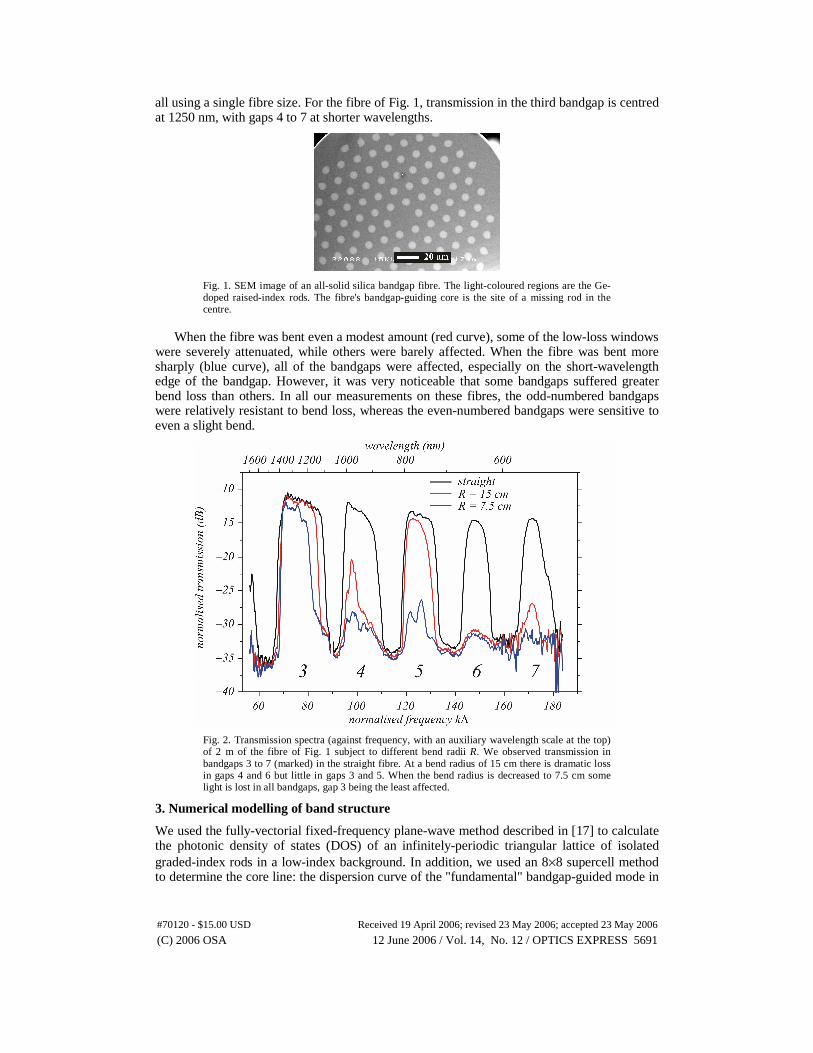
When the fibre was bent even a modest amount (red curve), some of the low-loss windows
were severely attenuated, while others were barely affected. When the fibre was bent more sharply (blue curve), all of the bandgaps were affected, especially on the short-wavelength edge of the bandgap. However, it was very noticeable that some bandgaps suffered greater bend loss than others. In all our measurements on these fibres, the odd-numbered bandgaps were relatively resistant to bend loss, whereas the even-numbered bandgaps were sensitive to even a slight bend.
Fig. 2. Transmission spectra (against frequency, with an auxiliary wavelength scale at the top) of 2 m of the fibre of Fig. 1 subject to different bend radii R. We observed transmission in bandgaps 3 to 7 (marked) in the straight fibre. At a bend radius of 15 cm there is dramatic loss in gaps 4 and 6 but little in gaps 3 and 5. When the bend radius is decreased to 7.5 cm some light is lost in all bandgaps, gap 3 being the least affected.
3. Numerical modelling of band structure
We used the fully-vectorial fixed-frequency plane-wave method described in [17] to calculate the photonic density of states (DOS) of an infinitely-periodic triangular lattice of isolated graded-index rods in a low-index background. In addition, we used an 8×8 supercell method to determine the core line: the dispersion curve of the "fundamental" bandgap-guided mode in
#70120 - $15.00 USD Received 19 April 2006; revised 23 May 2006; accepted 23 May 2006
(C) 2006 OSA 12 June 2006 / Vol. 14, No. 12 / OPTICS EXPRESS 5691
a core defect introduced by the absence of a single rod. The scale, index profile and pitch of the rods were chosen to match the experimental fibre of Section 2 as closely as possible. The background refractive index nBG is taken to be 1.458, representing undoped fused silica. (The frequency dependence of all refractive indices has no significant impact on our results and so is neglected.)
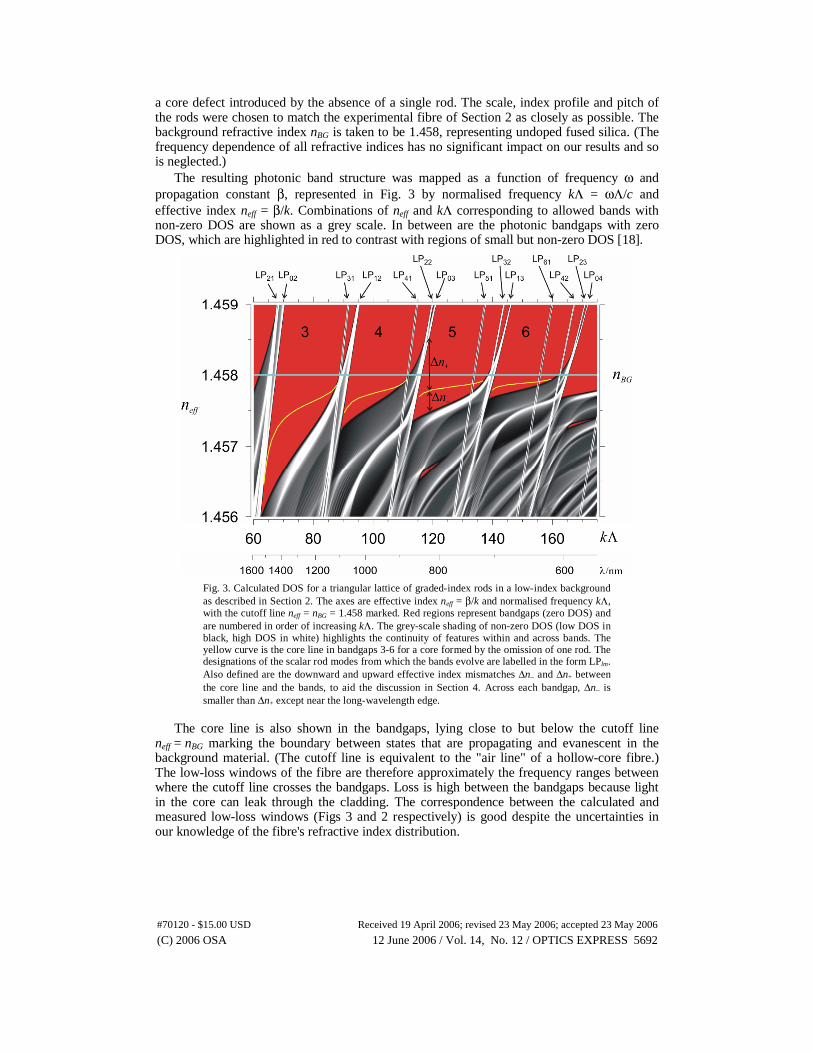
The resulting photonic band structure was mapped as a function of frequency ω and propagation constant β, represented in Fig. 3 by normalised frequency kΛ = ωΛ/c and effective index neff = β/k. Combinations of neff and kΛ corresponding to allowed bands with non-zero DOS are shown as a grey scale. In between are the photonic bandgaps with zero DOS, which are highlighted in red to contrast with regions of small but non-zero DOS [18].
Fig. 3. Calculated DOS for a triangular lattice of graded-index rods in a low-index background as described in Section 2. The axes are effective index neff = β/k and normalised frequency kΛ, with the cutoff line neff = nBG = 1.458 marked. Red regions represent bandgaps (zero DOS) and are numbered in order of increasing kΛ. The grey-scale shading of non-zero DOS (low DOS in black, high DOS in white) highlights the continuity of features within and across bands. The yellow curve is the core line in bandgaps 3-6 for a core formed by the omission of one rod. The designations of the scalar rod modes from which the bands evolve are labelled in the form LPlm. Also defined are the downward and upward effective index mismatches Δn− and Δn+ between the core line and the bands, to aid the discussion in Section 4. Across each bandgap, Δn− is smaller than Δn+ except near the long-wavelength edge.
The core line is also shown in the bandgaps, lying close to but below the cutoff line
neff = nBG marking the boundary between states that are propagating and evanescent in the background material. (The cutoff line is equivalent to the "air line" of a hollow-core fibre.) The low-loss windows of the fibre are therefore approximately the frequency ranges between where the cutoff line crosses the bandgaps. Loss is high between the bandgaps because light in the core can leak through the cladding. The correspondence between the calculated and measured low-loss windows (Figs 3 and 2 respectively) is good despite the uncertainties in our knowledge of the fibre's refractive index distribution.
#70120 - $15.00 USD Received 19 April 2006; revised 23 May 2006; accepted 23 May 2006
(C) 2006 OSA 12 June 2006 / Vol. 14, No. 12 / OPTICS EXPRESS 5692
4. Modelling of bend loss
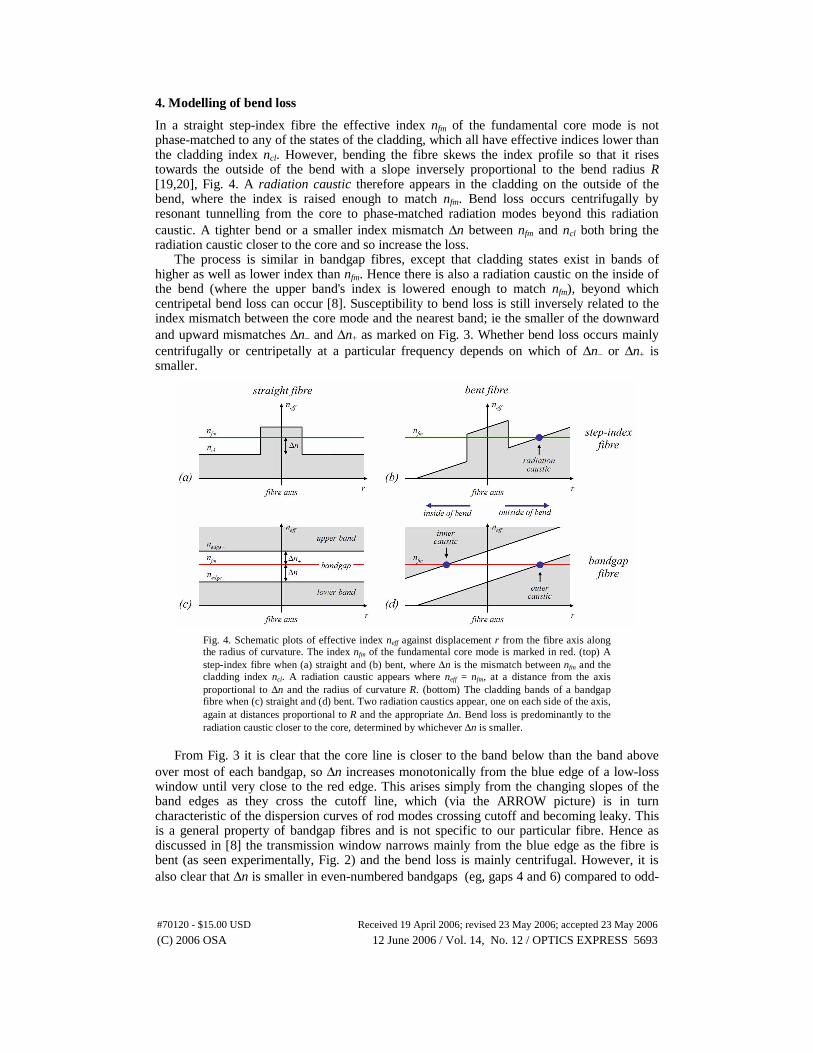
In a straight step-index fibre the effective index nfm of the fundamental core mode is not phase-matched to any of the states of the cladding, which all have effective indices lower than the cladding index ncl. However, bending the fibre skews the index profile so that it rises towards the outside of the bend with a slope inversely proportional to the bend radius R [19,20], Fig. 4. A radiation caustic therefore appears in the cladding on the outside of the bend, where the index is raised enough to match nfm. Bend loss occurs centrifugally by resonant tunnelling from the core to phase-matched radiation modes beyond this radiation caustic. A tighter bend or a smaller index mismatch Δn between nfm and ncl both bring the radiation caustic closer to the core and so increase the loss.
The process is similar in bandgap fibres, except that cladding states exist in bands of higher as well as lower index than nfm. Hence there is also a radiation caustic on the inside of the bend (where the upper band's index is lowered enough to match nfm), beyond which centripetal bend loss can occur [8]. Susceptibility to bend loss is still inversely related to the index mismatch between the core mode and the nearest band; ie the smaller of the downward and upward mismatches Δn− and Δn+ as marked on Fig. 3. Whether bend loss occurs mainly centrifugally or centripetally at a particular frequency depends on which of Δn− or Δn+ is smaller.
Fig. 4. Schematic plots of effective index neff against displacement r from the fibre axis along the radius of curvature. The index nfm of the fundamental core mode is marked in red. (top) A step-index fibre when (a) straight and (b) bent, where Δn is the mismatch between nfm and the cladding index ncl. A radiation caustic appears where neff = nfm, at a distance from the axis proportional to Δn and the radius of curvature R. (bottom) The cladding bands of a bandgap fibre when (c) straight and (d) bent. Two radiation caustics appear, one on each side of the axis, again at distances proportional to R and the appropriate Δn. Bend loss is predominantly to the radiation caustic closer to the core, determined by whichever Δn is smaller.
From Fig. 3 it is clear that the core line is closer to the band below than the band above
over most of each bandgap, so Δn increases monotonically from the blue edge of a low-loss window until very close to the red edge. This arises simply from the changing slopes of the band edges as they cross the cutoff line, which (via the ARROW picture) is in turn characteristic of the dispersion curves of rod modes crossing cutoff and becoming leaky. This is a general property of bandgap fibres and is not specific to our particular fibre. Hence as discussed in [8] the transmission window narrows mainly from the blue edge as the fibre is bent (as seen experimentally, Fig. 2) and the bend loss is mainly centrifugal. However, it is also clear that Δn is smaller in even-numbered bandgaps (eg, gaps 4 and 6) compared to odd-
#70120 - $15.00 USD Received 19 April 2006; revised 23 May 2006; accepted 23 May 2006
(C) 2006 OSA 12 June 2006 / Vol. 14, No. 12 / OPTICS EXPRESS 5693
numbered bandgaps (eg, gap 5), because the floor of the bandgap is higher in those windows. Hence the shallower even-numbered windows are more susceptible to bend loss, as found in the experiments described in Section 2.
The bandgap fibre of reference [9] had larger rods than ours relative to the pitch. Our band structure calculations for such a fibre (not shown) exhibit bandgaps with a significantly larger index mismatch between the core line and the floor of the bandgaps. We suggest this to be why the authors of that paper reported minimal bend loss in their fibre.
When comparing bend loss at different wavelengths the index mismatch Δn may not be the whole story, so it is worth considering bend loss more quantitatively. For a conventional weakly-guiding step-index fibre of core radius ρ the critical bend radius below which bend loss becomes large is approximately [21]:
2 2 3 2
3
8 clc
k nR
W
π ρ≈ , (1)
where W is the familiar waveguide parameter given by [20] W2 = ρ2k2(n2fm − n2
cl). In obtaining this expression, it is assumed that the decay of fields (eg hz) into the cladding has a characteristic length of ρ/W (ie hz ~ exp(−Wr/ρ)), which is always true in conventional fibres for sufficiently large r. Although Eq. (1) may not provide quantitatively accurate values of Rc, it does correctly account for the dependence of bend loss on the fibre parameters.
In low-contrast bandgap fibres the decay of fields into the cladding does not have a simple analytic form. Nevertheless, it is still possible to calculate a quantity like W with ncl replaced with the effective index nedge of the band edge nearest to the core line, which may be greater or less than nfm. We would expect the decay rate into the cladding to be dominated by the difference between nfm and nedge in an analogous way to the step-index fibre, giving
2
3 / 22 2
4 BGc
fm edge
nR
n n
πλ≈
−. (2)
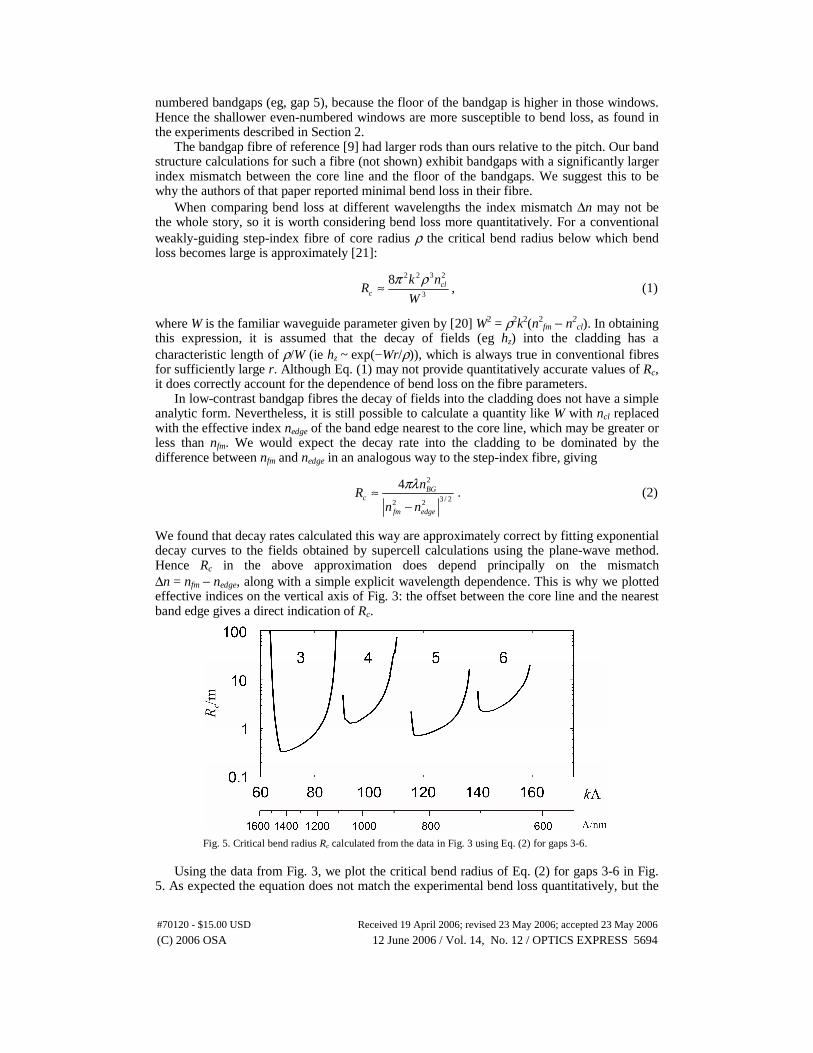
We found that decay rates calculated this way are approximately correct by fitting exponential decay curves to the fields obtained by supercell calculations using the plane-wave method. Hence Rc in the above approximation does depend principally on the mismatch Δn = nfm − nedge, along with a simple explicit wavelength dependence. This is why we plotted effective indices on the vertical axis of Fig. 3: the offset between the core line and the nearest band edge gives a direct indication of Rc.
Fig. 5. Critical bend radius Rc calculated from the data in Fig. 3 using Eq. (2) for gaps 3-6.
Using the data from Fig. 3, we plot the critical bend radius of Eq. (2) for gaps 3-6 in Fig. 5. As expected the equation does not match the experimental bend loss quantitatively, but the
#70120 - $15.00 USD Received 19 April 2006; revised 23 May 2006; accepted 23 May 2006
(C) 2006 OSA 12 June 2006 / Vol. 14, No. 12 / OPTICS EXPRESS 5694
general features observed experimentally are all correctly represented in this plot. In particular, gaps 3 and 5 are the least susceptible to bend loss (with gap 3 especially resistant), and gaps 4 and 6 are more susceptible.
Within each set of bandgaps (even- or odd-numbered) the susceptibility to bend loss increases steadily with frequency, as observed experimentally in Fig. 2 but unlike conventional step-index fibres. This matches the behaviour of index-guiding PCFs, which have a short-wavelength bend loss edge [22]. Indeed, when the rods of the bandgap fibre are at anti-resonance they expel light much as the holes of an index-guiding PCF do, so it is perhaps not surprising that the two types of fibre should share this characteristic.
5. Why even- and odd-numbered bandgaps are different
We have described the features of the calculated band structure that give rise to the experimentally-observed differences in bend-loss behaviour between different bandgaps. However, we also need to explain the fundamental origins of this behaviour if we are to control it by improved fibre design.
The key to understanding the enhanced susceptibility of the even-order bandgaps to bend loss is to consider in more detail how the bands form by the coupling together of the modes of the rods in the cladding [14]. The width of the bands in Fig. 3 is determined by the strength of the overlap between the modes of neighbouring rods, which obviously increases as frequency decreases and the rod modes pass through cutoff to become leaky. A band that is wider for a given neff (below cutoff) will have a bandgap on its low-frequency side that is shallower in neff and so more susceptible to bend loss. However, the strength of coupling also depends on the symmetry of the rod modes in question.
The low refractive index contrast in our fibres means the scalar "weak guidance" approximation [20] is valid and modal fields can be described by a single scalar function Ψ, though the following discussion holds qualitatively in any case. If the rods are circularly symmetric their modes are the familiar LPlm modes of conventional fibres. The integers l and m respectively describe the azimuthal and radial variations of the field in the rod.
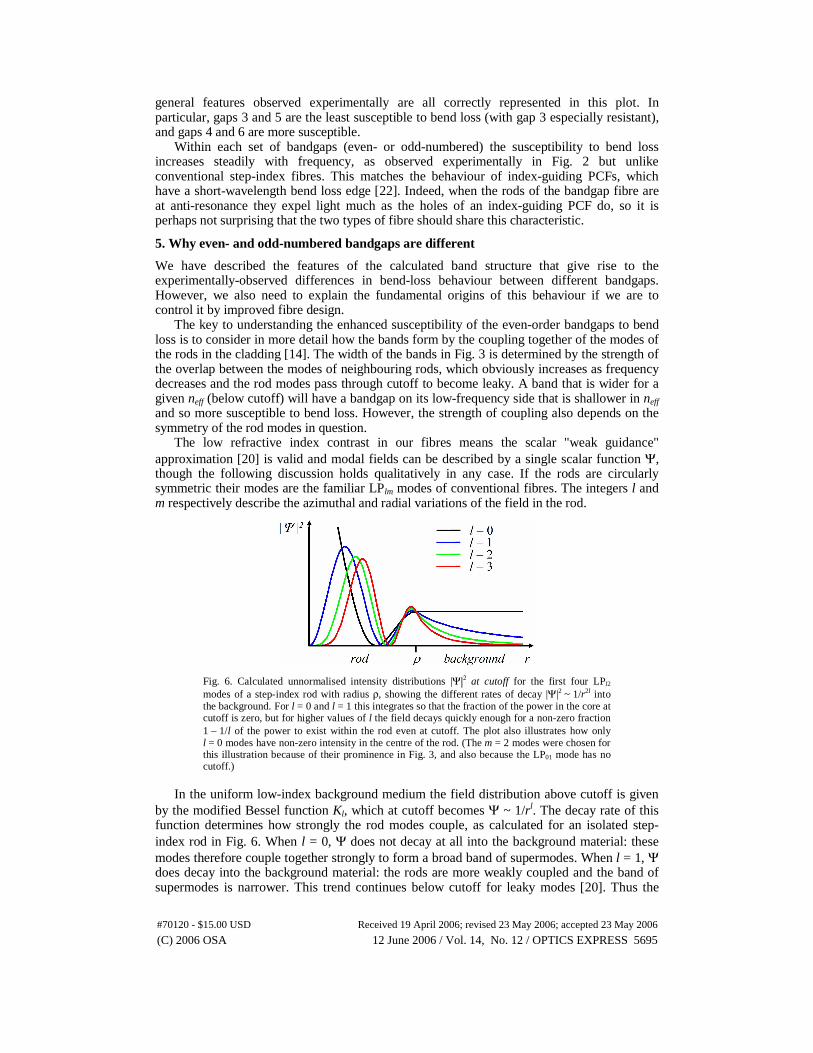
Fig. 6. Calculated unnormalised intensity distributions |Ψ|2 at cutoff for the first four LPl2 modes of a step-index rod with radius ρ, showing the different rates of decay |Ψ|2 ~ 1/r2l into the background. For l = 0 and l = 1 this integrates so that the fraction of the power in the core at cutoff is zero, but for higher values of l the field decays quickly enough for a non-zero fraction 1 − 1/l of the power to exist within the rod even at cutoff. The plot also illustrates how only l = 0 modes have non-zero intensity in the centre of the rod. (The m = 2 modes were chosen for this illustration because of their prominence in Fig. 3, and also because the LP01 mode has no cutoff.)
In the uniform low-index background medium the field distribution above cutoff is given
by the modified Bessel function Kl, which at cutoff becomes Ψ ~ 1/rl. The decay rate of this function determines how strongly the rod modes couple, as calculated for an isolated step-index rod in Fig. 6. When l = 0, Ψ does not decay at all into the background material: these modes therefore couple together strongly to form a broad band of supermodes. When l = 1, Ψ does decay into the background material: the rods are more weakly coupled and the band of supermodes is narrower. This trend continues below cutoff for leaky modes [20]. Thus the
#70120 - $15.00 USD Received 19 April 2006; revised 23 May 2006; accepted 23 May 2006
(C) 2006 OSA 12 June 2006 / Vol. 14, No. 12 / OPTICS EXPRESS 5695
floor of a bandgap will be higher if it is determined by coupled l = 0 rod modes than l = 1 rod modes. From the shapes of the bands manifested in Fig. 3 and arising from the dispersion curves of the rod modes, the floor and the blue edge of a bandgap are defined by the same rod modes. Since the cutoffs of l = 0 and l = 1 modes alternate with increasing frequency, bend loss in odd- and even-numbered bandgaps is determined by l = 1 and l = 0 bands respectively. Hence even-numbered bandgaps are more susceptible to bend loss than odd-numbered bandgaps.
The above discussion neglects coupled rod modes with l > 1. However, these are not expected to have much impact on bend loss. This is because their fields decay into the cladding so strongly that they have non-zero power in the core even at cutoff [20], making them particularly weakly coupled [14]. Hence they retain their identity and form straight narrow bands in Fig. 3 that persist well below cutoff. (Indeed, as l becomes large they become whispering gallery modes, which leak very little and interact very weakly with features any distance away from them [23].) These bands will at most cause narrow high-loss features in otherwise-continuous low-loss windows. In Fig. 3, note that the l = 5 and l = 6 bands scarcely perturb the yellow core line, and that the effects of l = 2 to l = 4 bands are masked by the dominant l = 0 and l = 1 bands, so no high-l features were unambiguously resolved in our experimental transmission curve in Fig. 2.
6. Guidance in bandgap fibres: further experiment
To confirm our theories about the origin of bend loss, we measured near-field patterns at the fibre's output face under different bending conditions. The output of the supercontinuum source was spectrally filtered using a scanning monochromator with a 3 nm passband, before being coupled into the bandgap fibre's core as described in Section 2. The fibre was 2 m long with a single turn of bend radius 20 cm. The output end of the fibre immediately followed the bend with no final straight section, and was imaged onto a CCD camera with appropriate magnification. The images therefore represented the light patterns in the bent fibre.
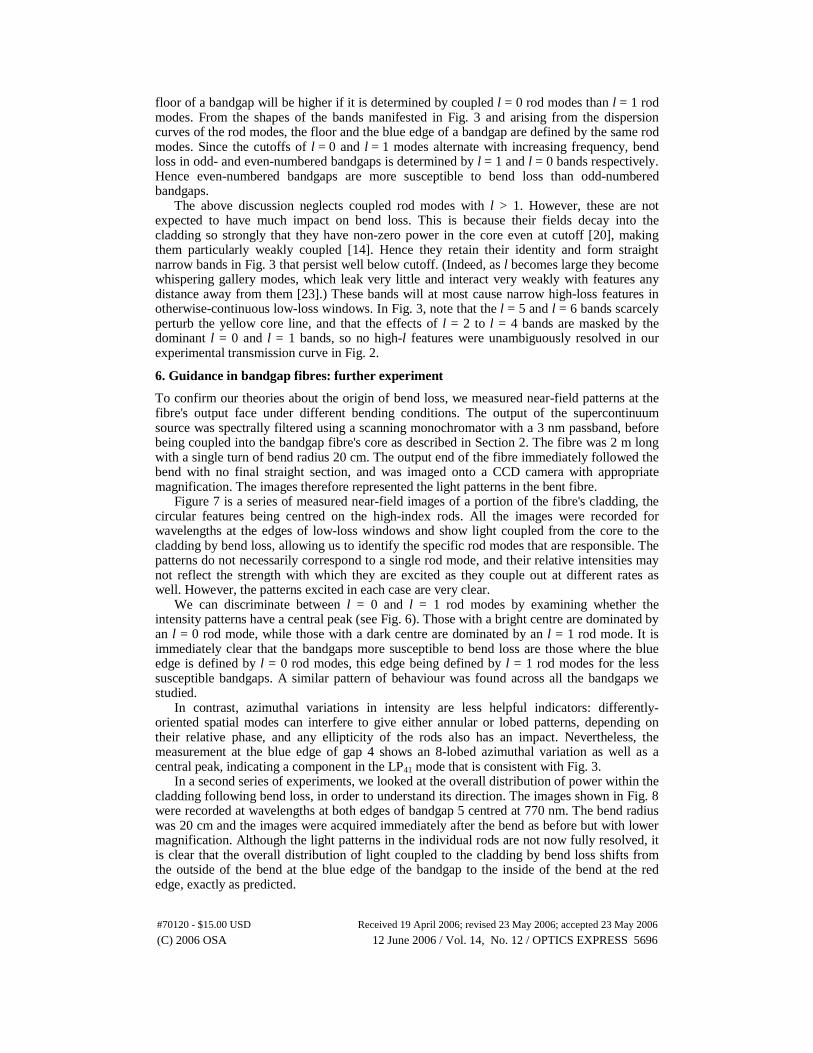
Figure 7 is a series of measured near-field images of a portion of the fibre's cladding, the circular features being centred on the high-index rods. All the images were recorded for wavelengths at the edges of low-loss windows and show light coupled from the core to the cladding by bend loss, allowing us to identify the specific rod modes that are responsible. The patterns do not necessarily correspond to a single rod mode, and their relative intensities may not reflect the strength with which they are excited as they couple out at different rates as well. However, the patterns excited in each case are very clear.
We can discriminate between l = 0 and l = 1 rod modes by examining whether the intensity patterns have a central peak (see Fig. 6). Those with a bright centre are dominated by an l = 0 rod mode, while those with a dark centre are dominated by an l = 1 rod mode. It is immediately clear that the bandgaps more susceptible to bend loss are those where the blue edge is defined by l = 0 rod modes, this edge being defined by l = 1 rod modes for the less susceptible bandgaps. A similar pattern of behaviour was found across all the bandgaps we studied.
In contrast, azimuthal variations in intensity are less helpful indicators: differently-oriented spatial modes can interfere to give either annular or lobed patterns, depending on their relative phase, and any ellipticity of the rods also has an impact. Nevertheless, the measurement at the blue edge of gap 4 shows an 8-lobed azimuthal variation as well as a central peak, indicating a component in the LP41 mode that is consistent with Fig. 3.
In a second series of experiments, we looked at the overall distribution of power within the cladding following bend loss, in order to understand its direction. The images shown in Fig. 8 were recorded at wavelengths at both edges of bandgap 5 centred at 770 nm. The bend radius was 20 cm and the images were acquired immediately after the bend as before but with lower magnification. Although the light patterns in the individual rods are not now fully resolved, it is clear that the overall distribution of light coupled to the cladding by bend loss shifts from the outside of the bend at the blue edge of the bandgap to the inside of the bend at the red edge, exactly as predicted.
#70120 - $15.00 USD Received 19 April 2006; revised 23 May 2006; accepted 23 May 2006
(C) 2006 OSA 12 June 2006 / Vol. 14, No. 12 / OPTICS EXPRESS 5696
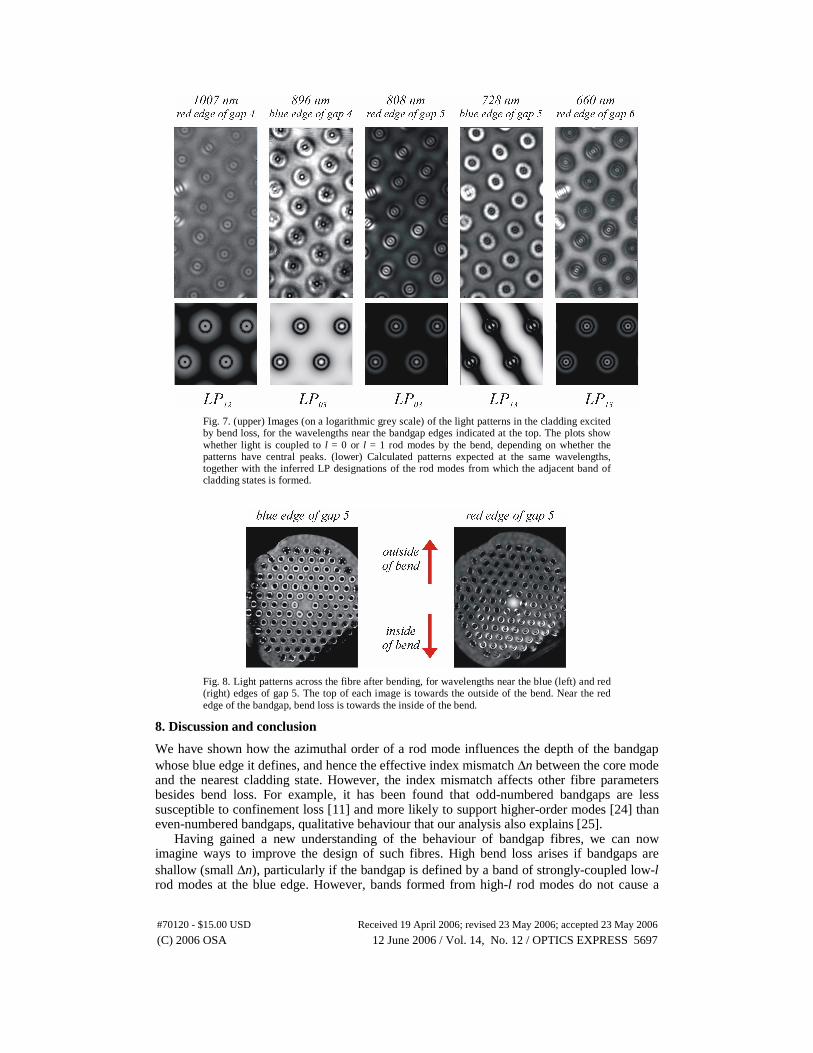
Fig. 7. (upper) Images (on a logarithmic grey scale) of the light patterns in the cladding excited by bend loss, for the wavelengths near the bandgap edges indicated at the top. The plots show whether light is coupled to l = 0 or l = 1 rod modes by the bend, depending on whether the patterns have central peaks. (lower) Calculated patterns expected at the same wavelengths, together with the inferred LP designations of the rod modes from which the adjacent band of cladding states is formed.
Fig. 8. Light patterns across the fibre after bending, for wavelengths near the blue (left) and red (right) edges of gap 5. The top of each image is towards the outside of the bend. Near the red edge of the bandgap, bend loss is towards the inside of the bend.
8. Discussion and conclusion
We have shown how the azimuthal order of a rod mode influences the depth of the bandgap whose blue edge it defines, and hence the effective index mismatch Δn between the core mode and the nearest cladding state. However, the index mismatch affects other fibre parameters besides bend loss. For example, it has been found that odd-numbered bandgaps are less susceptible to confinement loss [11] and more likely to support higher-order modes [24] than even-numbered bandgaps, qualitative behaviour that our analysis also explains [25].
Having gained a new understanding of the behaviour of bandgap fibres, we can now imagine ways to improve the design of such fibres. High bend loss arises if bandgaps are shallow (small Δn), particularly if the bandgap is defined by a band of strongly-coupled low-l rod modes at the blue edge. However, bands formed from high-l rod modes do not cause a
#70120 - $15.00 USD Received 19 April 2006; revised 23 May 2006; accepted 23 May 2006
(C) 2006 OSA 12 June 2006 / Vol. 14, No. 12 / OPTICS EXPRESS 5697
problem. One way to eliminate low-l modes from large frequency ranges would be to replace the rods with thin high-index tubular rings with low index (matching the background material) inside: removal of high-index material from the middle of the rods suppresses rod modes with higher radial orders m > 1, so there is only one rod mode in a suitable range of low frequencies for each l. The l = 0 rod mode forms the lowest-frequency band, so at higher frequencies there lies a succession of low-loss windows without l = 0 (or indeed l = 1) states at the blue edge, so we expect these to have much less bend loss. Analysis and fabrication of such a fibre is the next goal of our study of bandgap fibres.
The insights we have gained may also be generalisable to hollow-core bandgap fibres, where the guidance mechanism is similar and the band diagrams have common features even though the high-index resonators (being connected and non-circular) are more complicated [18,26]. For example, greater bend-loss susceptibility at the blue edges of bandgaps has also been observed experimentally in such fibres [15].
In conclusion, we have reached a qualitative and quantitative understanding of the guidance properties of bandgap fibres such as all-solid-silica bandgap fibres, including key features of their bend loss properties. This was based on numerical analysis, and also new experiments on fibres of high enough quality to observe mode patterns in the rods very clearly. This should lead to improvements in design to further control bend loss and other important fibre properties.
Acknowledgments
The authors would like to thank T. Taru, P. J. Roberts and A. Argyros for useful discussions at various times before and during this work. The work was supported by the UK Engineering and Physical Sciences Research Council. J. C. Knight is a Research Fellow of the Leverhulme Trust.
#70120 - $15.00 USD Received 19 April 2006; revised 23 May 2006; accepted 23 May 2006
(C) 2006 OSA 12 June 2006 / Vol. 14, No. 12 / OPTICS EXPRESS 5698