Embed Size (px)
Citation preview
BENEFICIARY SURVEY—KNOWLEDGE, ATTITUDE AND PRACTICE ABOUT WATER,
SEWERAGE, AND SANITATION IN INDORE CITY OF MADHYA PRADESH
A. Background of the Study
1. Introduction
1. The government of Madhya Pradesh implemented a project called Urban Water Supply and
Environmental Improvement Project in India, financed by the Asian Development Bank (ADB).1 The project
aimed to promote sustainable growth and poverty reduction by providing basic urban infrastructure and
services to all citizens and by strengthening institutional capacities to plan and manage the urban water
supply and sanitation system in a more effective, transparent, and sustainable manner. The project had
three components: (i) urban water supply and environmental improvement; (ii) awareness generation
and participatory involvement of beneficiaries in project implementation; and (iii) project implementation
assistance to project management units (PMUs) at state level and project implementation unit (PIU) at
city level. The project was executed in the four cities in Madhya Pradesh: Bhopal, Gwalior, Jabalpur, and
Indore. The Independent Evaluation Department (IED) of ADB has undertaken an evaluation of the urban
water sector in India which will feed into the country assistance program evaluation for India (planned
for 2017). As part of this, a beneficiary survey was conducted, covering water supply and sanitation,
knowledge, attitude, and practice (KAP) on safe drinking water, solid waste management and
wastewater, and willingness to pay and affordability for residents for water-related services. The findings
from the survey were used to assess the project effectiveness and sustainability of the project.
2. Objectives
2. The main objectives of the beneficiary survey were (i) to understand the KAP of the residents
with regard to safe drinking water, water supply and sanitation, solid waste management and
wastewater discharge, and their willingness to pay for the services provided, and (ii) to use the findings
from the survey to assess the effectiveness, impact, and sustainability of the project.
3. Scope
3. The beneficiary survey was conducted in the Indore municipal corporation area, Madhya Pradesh.
It covered slum improvement areas and residential areas in project areas, and slum areas and residential
areas outside the project area (control group). Focus group discussions were conducted in two project
areas.
B. Methodology
1. Sampling Method
4. The project was implemented in 27 municipal wards in Indore (out of a total of 85). Five wards
with similar demographics to the remaining 58 wards were randomly selected as controls. After the
selection of wards, households from each ward were selected using systematic sampling and different
stratifying variables. The stratification took into consideration: (i) locations within and nearby the
constructed overhead tanks (OHTs) in project areas; (ii) spread of population as per income and housing
typology; and (iii) urban service coverage (adequate and deficient area for water supply, sanitation and
other urban services). Additionally, focus group discussions were conducted in project areas of
1 Loan agreement reference number 2046-IND; additional Loan no. 2456-IND
2 Supplementary Linked Document 18
Veenanagar and Mahalakshmi Nagar for qualitative analysis. A total of 25 persons participated in
Veenanagar and 13 in Mahalakshmi Nagar. Most responses were recorded and transcripts are provided
in section III.
2. Sample Size
5. A total of 210 households (160 households from the project area and 50 households from the
control group area) were interviewed in Indore City.
3. Questionnaire Development
6. A draft questionnaire was developed by an IED evaluation specialist. The questionnaire was
developed in English and finalized after pre-testing in the field. It was translated into Hindi in the field.
The questionnaire format is provided in Appendix 2.
4. Quality Assurance
7. Fieldworker selection. The composition of the survey team took into account experience, amount
of work, and timeline. Qualified personnel experienced in conducting water, sewerage and sanitation
studies were recruited. The supervisor was a postgraduate with a minimum of 8 years of experience and
the investigators were qualified to at least graduate level with minimum of 3 years of experience.
8. Fieldworker training. A one-day training session was held at the Institute of Applied Statistics
and Development Studies (IASDS) in Lucknow. The orientation covered the objectives of the beneficiary
survey and research instruments to be utilized by the team. The method of conducting personal
interviews, in-depth interviews, and focus group discussions was discussed. Mock interview sessions were
held.
9. Field work and supervision. Effective monitoring and supervision were carried out to sort out
day-to-day problems. Quality assurance procedures included 10% back checks by field coordinator
supervisor.
10. Coordination with field staff and overall monitoring. Close coordination between the field
enumerators, field coordinator and the supervisor and team leader was established to ensure that the
maximum benefits could be achieved resulting in high-quality information.
C. Results and Discussion
1. Socioeconomic Characteristics of the Household Respondents
a. Category of Households and Type of Area
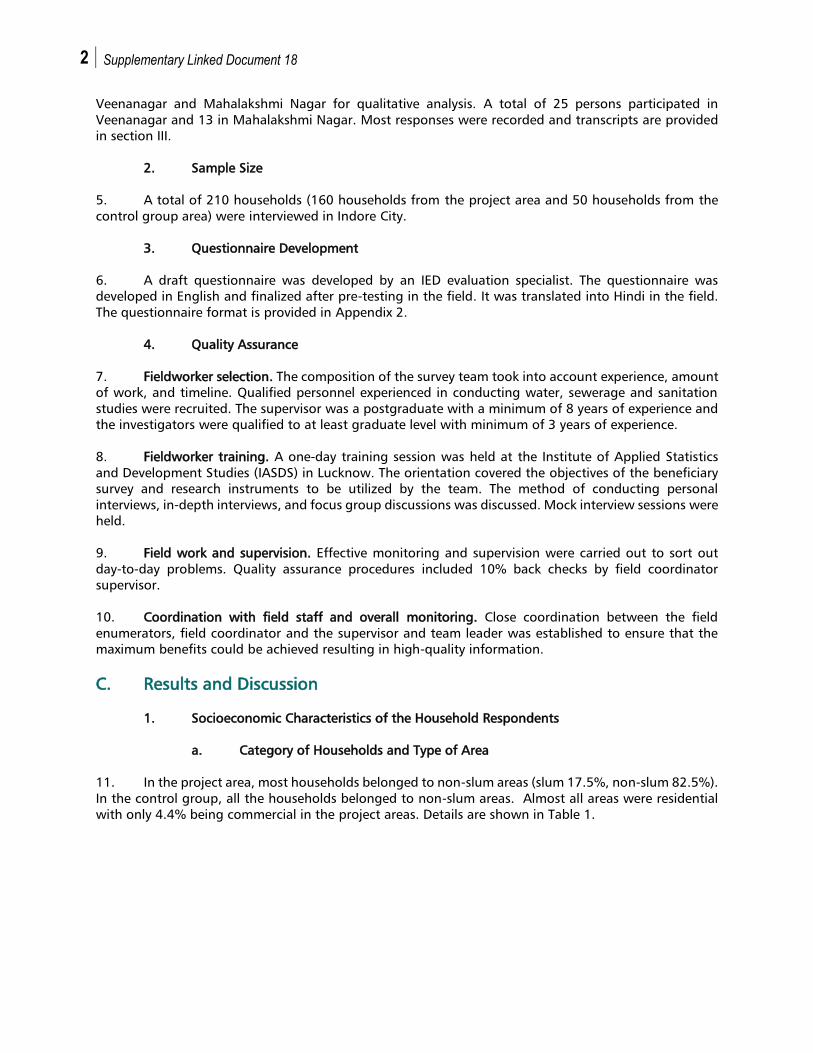
11. In the project area, most households belonged to non-slum areas (slum 17.5%, non-slum 82.5%).
In the control group, all the households belonged to non-slum areas. Almost all areas were residential
with only 4.4% being commercial in the project areas. Details are shown in Table 1.
Beneficiary Survey—Knowledge, Attitude, and Practice about Water, Sewerage, and Sanitation in Indore City of Madhya Pradesh
3
Table 1: Household Information
(%)
Item
Project Intervention
Area
(n=160)
Control
Group Area
(n=50)
Category of Household
Project slum improvement area with project
intervention
17.5 0.0
Project residential area with project intervention 82.5 0.0
Slum area with no project intervention 0.0 0.0
Residential area with no project intervention 0.0 100.0
Type of Area
Residential 92.5 100.0
Commercial 4.4 0.0
Industrial 3.1 0.0
Institutional 0.0 0.0
Source: Asian Development Bank Independent Evaluation Department.
b. Profile of Head of Households
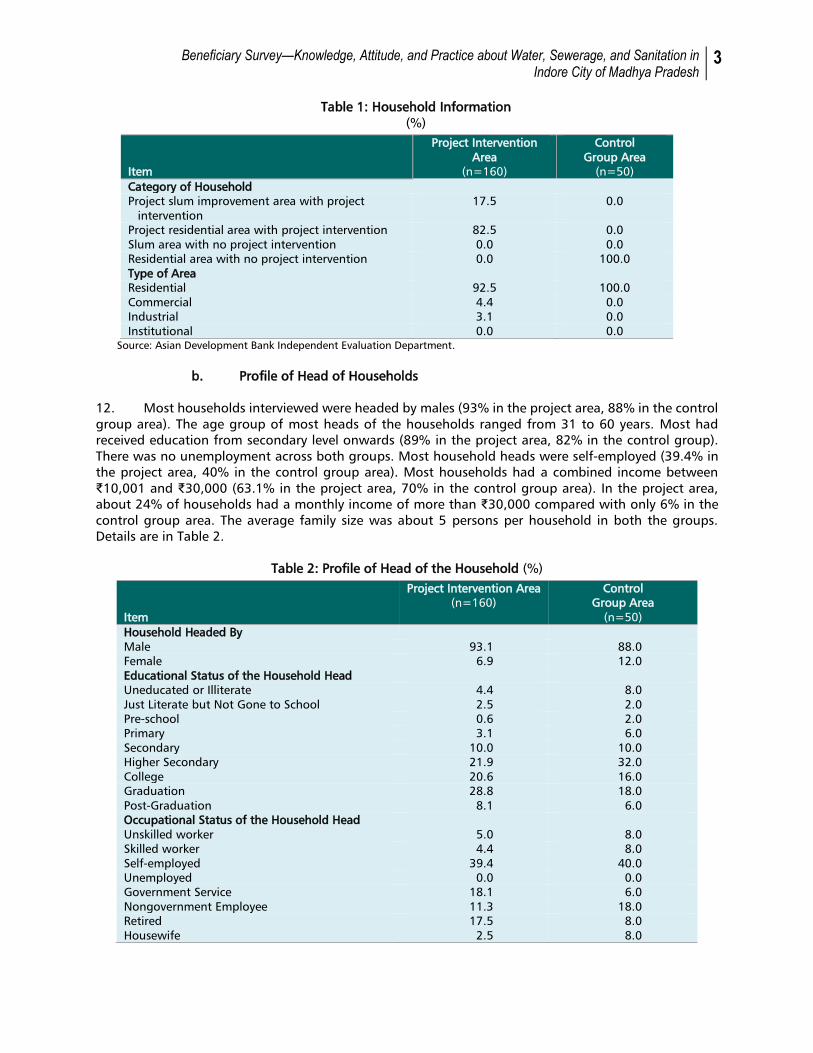
12. Most households interviewed were headed by males (93% in the project area, 88% in the control
group area). The age group of most heads of the households ranged from 31 to 60 years. Most had
received education from secondary level onwards (89% in the project area, 82% in the control group).
There was no unemployment across both groups. Most household heads were self-employed (39.4% in
the project area, 40% in the control group area). Most households had a combined income between
₹10,001 and ₹30,000 (63.1% in the project area, 70% in the control group area). In the project area,
about 24% of households had a monthly income of more than ₹30,000 compared with only 6% in the
control group area. The average family size was about 5 persons per household in both the groups.
Details are in Table 2.
Table 2: Profile of Head of the Household (%)
Item
Project Intervention Area
(n=160)
Control
Group Area
(n=50)
Household Headed By
Male 93.1 88.0
Female 6.9 12.0
Educational Status of the Household Head
Uneducated or Illiterate 4.4 8.0
Just Literate but Not Gone to School 2.5 2.0
Pre-school 0.6 2.0
Primary 3.1 6.0
Secondary 10.0 10.0
Higher Secondary 21.9 32.0
College 20.6 16.0
Graduation 28.8 18.0
Post-Graduation 8.1 6.0
Occupational Status of the Household Head
Unskilled worker 5.0 8.0
Skilled worker 4.4 8.0
Self-employed 39.4 40.0
Unemployed 0.0 0.0
Government Service 18.1 6.0
Nongovernment Employee 11.3 18.0
Retired 17.5 8.0
Housewife 2.5 8.0
4 Supplementary Linked Document 18
Item
Project Intervention Area
(n=160)
Control
Group Area
(n=50)
Others (Farmer) 1.3 4.0
Current Monthly Income of the Household from all Sources of Livelihood (₹)
Below 2000 0.0 0.0
2001–5,000 1.9 2.0
5,001–10,000 11.3 22.0
10,001–20,000 26.9 42.0
20,001– 0,000 36.2 28.0
More than 30,001 23.7 6.0
Number of Household Members Living in the House
Up to 2 members 5.6 8.0
3–5 members 60.6 52.0
More than 5 members 33.8 40.0
Average family size 5.3 5.5
Source: Asian Development Bank Independent Evaluation Department.
c. Profile of Respondents Who Were not the Head of Households
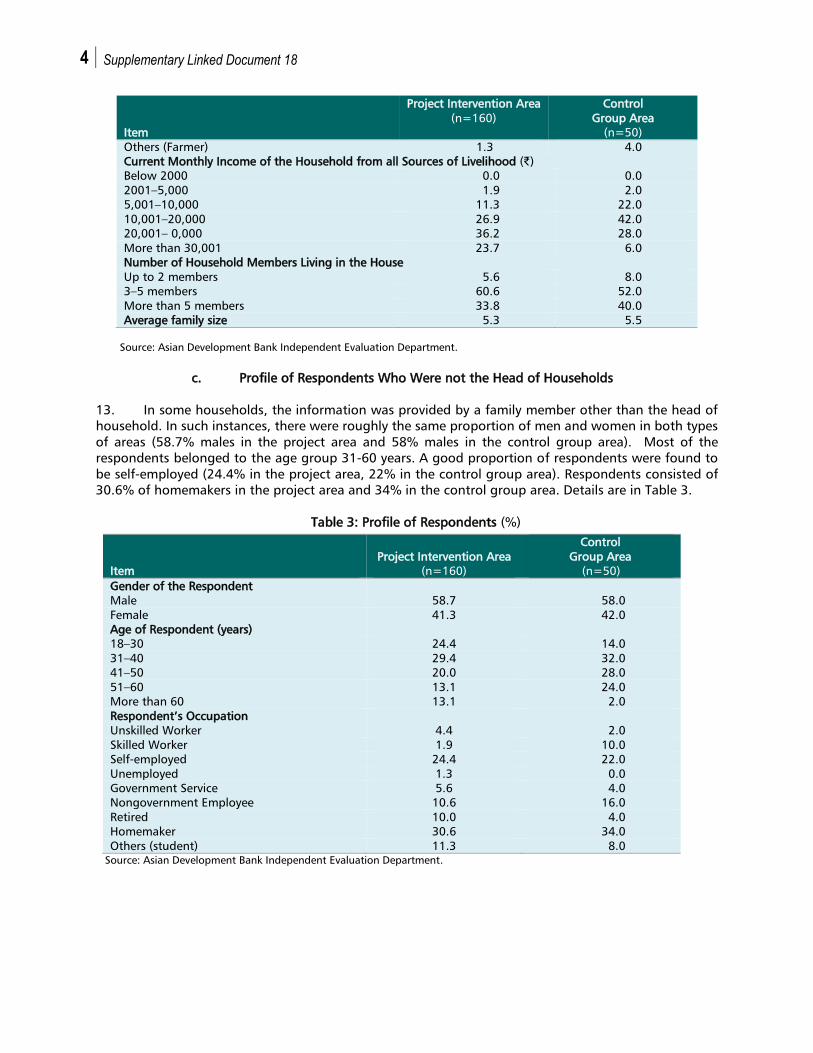
13. In some households, the information was provided by a family member other than the head of
household. In such instances, there were roughly the same proportion of men and women in both types
of areas (58.7% males in the project area and 58% males in the control group area). Most of the
respondents belonged to the age group 31-60 years. A good proportion of respondents were found to
be self-employed (24.4% in the project area, 22% in the control group area). Respondents consisted of
30.6% of homemakers in the project area and 34% in the control group area. Details are in Table 3.
Table 3: Profile of Respondents (%)
Item
Project Intervention Area
(n=160)
Control
Group Area
(n=50)
Gender of the Respondent
Male 58.7 58.0
Female 41.3 42.0
Age of Respondent (years)
18–30 24.4 14.0
31–40 29.4 32.0
41–50 20.0 28.0
51–60 13.1 24.0
More than 60 13.1 2.0
Respondent’s Occupation
Unskilled Worker 4.4 2.0
Skilled Worker 1.9 10.0
Self-employed 24.4 22.0
Unemployed 1.3 0.0
Government Service 5.6 4.0
Nongovernment Employee 10.6 16.0
Retired 10.0 4.0
Homemaker 30.6 34.0
Others (student) 11.3 8.0
Source: Asian Development Bank Independent Evaluation Department.
Beneficiary Survey—Knowledge, Attitude, and Practice about Water, Sewerage, and Sanitation in Indore City of Madhya Pradesh
5
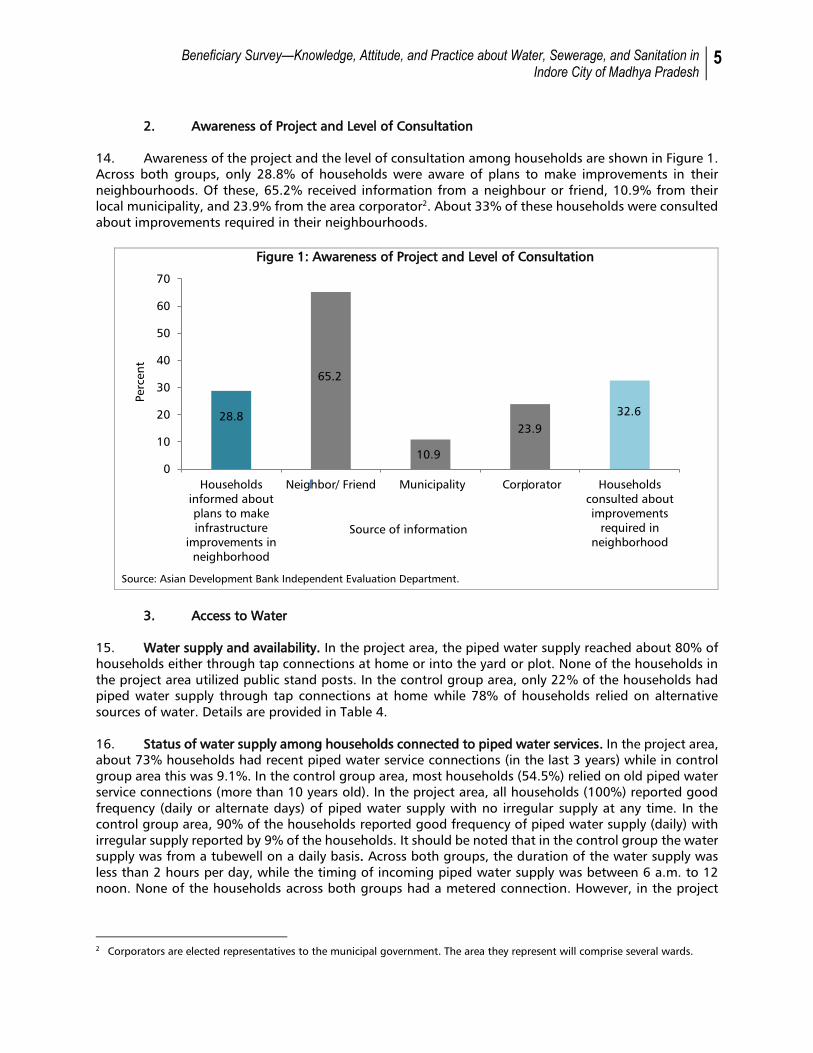
2. Awareness of Project and Level of Consultation
14. Awareness of the project and the level of consultation among households are shown in Figure 1.
Across both groups, only 28.8% of households were aware of plans to make improvements in their
neighbourhoods. Of these, 65.2% received information from a neighbour or friend, 10.9% from their
local municipality, and 23.9% from the area corporator2. About 33% of these households were consulted
about improvements required in their neighbourhoods.
Figure 1: Awareness of Project and Level of Consultation
Source: Asian Development Bank Independent Evaluation Department.
3. Access to Water
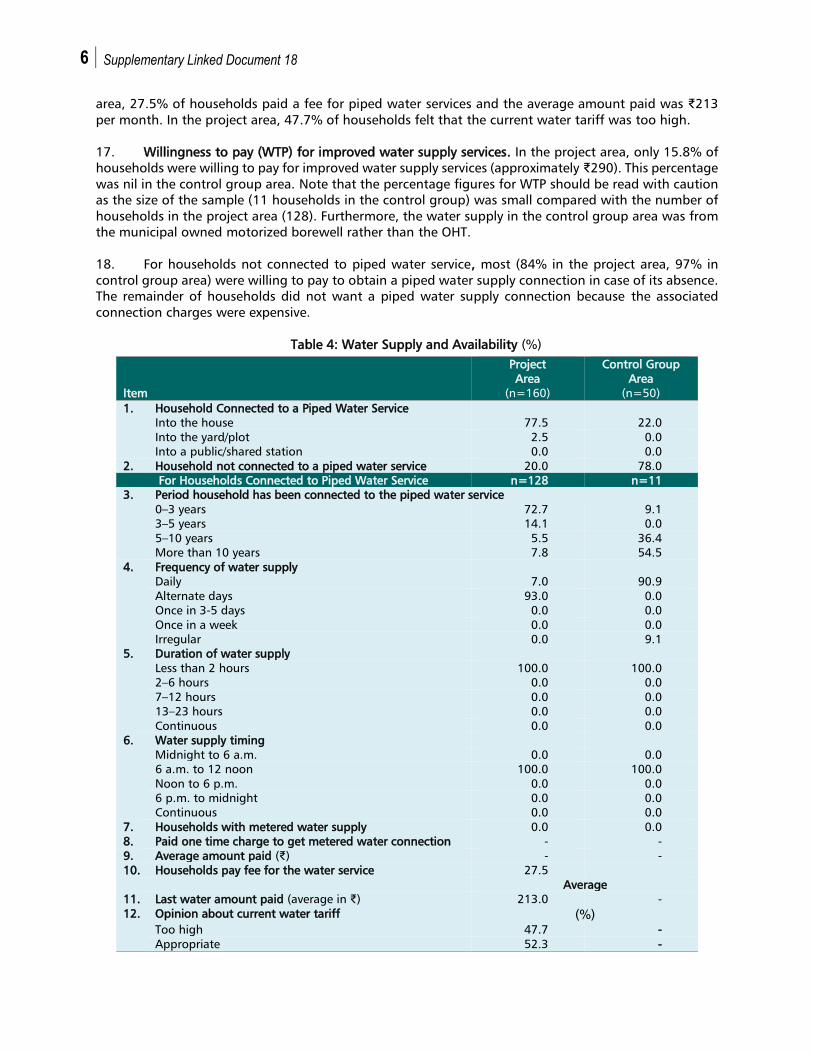
15. Water supply and availability. In the project area, the piped water supply reached about 80% of
households either through tap connections at home or into the yard or plot. None of the households in
the project area utilized public stand posts. In the control group area, only 22% of the households had
piped water supply through tap connections at home while 78% of households relied on alternative
sources of water. Details are provided in Table 4.
16. Status of water supply among households connected to piped water services. In the project area,
about 73% households had recent piped water service connections (in the last 3 years) while in control
group area this was 9.1%. In the control group area, most households (54.5%) relied on old piped water
service connections (more than 10 years old). In the project area, all households (100%) reported good
frequency (daily or alternate days) of piped water supply with no irregular supply at any time. In the
control group area, 90% of the households reported good frequency of piped water supply (daily) with
irregular supply reported by 9% of the households. It should be noted that in the control group the water
supply was from a tubewell on a daily basis. Across both groups, the duration of the water supply was
less than 2 hours per day, while the timing of incoming piped water supply was between 6 a.m. to 12
noon. None of the households across both groups had a metered connection. However, in the project
2 Corporators are elected representatives to the municipal government. The area they represent will comprise several wards.
28.8
65.2
10.9
23.9
32.6
0
10
20
30
40
50
60
70
Households
informed about
plans to make
infrastructure
improvements in
neighborhood
Neighbor/ Friend Municipality Corporator Households
consulted about
improvements
required in
neighborhood
Percen
t
Source of information
6 Supplementary Linked Document 18
area, 27.5% of households paid a fee for piped water services and the average amount paid was ₹213
per month. In the project area, 47.7% of households felt that the current water tariff was too high.
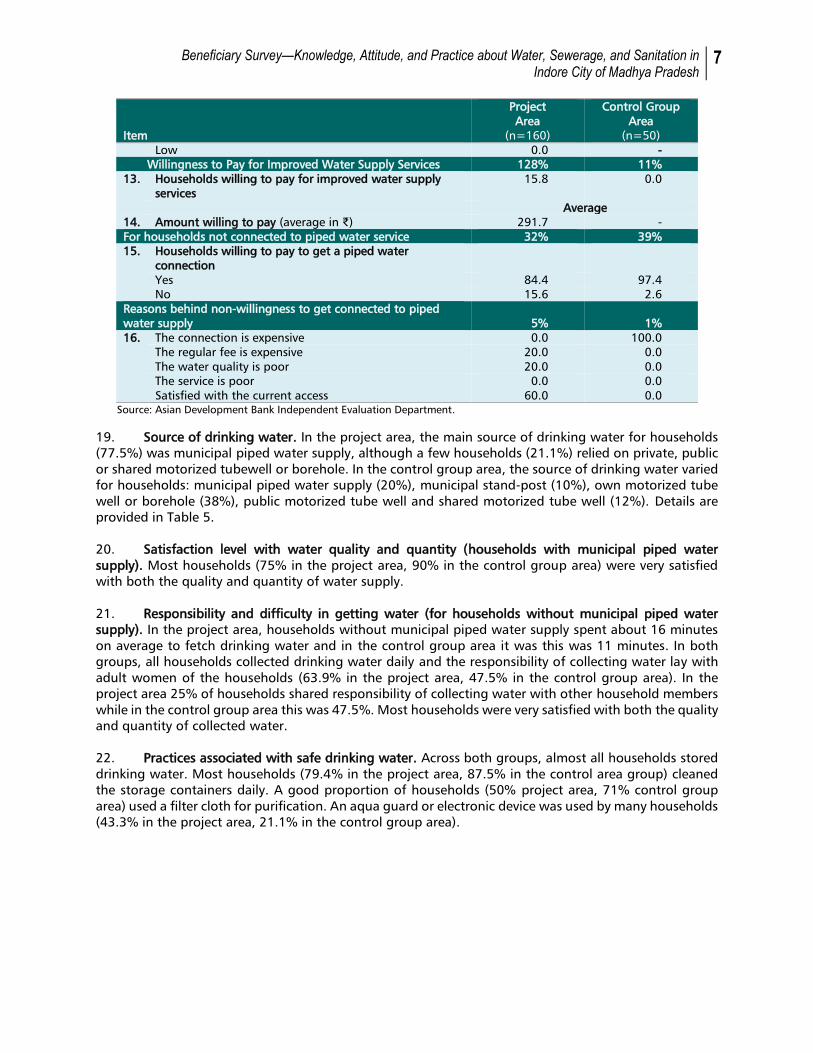
17. Willingness to pay (WTP) for improved water supply services. In the project area, only 15.8% of
households were willing to pay for improved water supply services (approximately ₹290). This percentage
was nil in the control group area. Note that the percentage figures for WTP should be read with caution
as the size of the sample (11 households in the control group) was small compared with the number of
households in the project area (128). Furthermore, the water supply in the control group area was from
the municipal owned motorized borewell rather than the OHT.
18. For households not connected to piped water service, most (84% in the project area, 97% in
control group area) were willing to pay to obtain a piped water supply connection in case of its absence.
The remainder of households did not want a piped water supply connection because the associated
connection charges were expensive.
Table 4: Water Supply and Availability (%)
Item
Project
Area
(n=160)
Control Group
Area
(n=50)
1. Household Connected to a Piped Water Service
Into the house 77.5 22.0
Into the yard/plot 2.5 0.0
Into a public/shared station 0.0 0.0
2. Household not connected to a piped water service 20.0 78.0
For Households Connected to Piped Water Service n=128 n=11
3. Period household has been connected to the piped water service
0–3 years 72.7 9.1
3–5 years 14.1 0.0
5–10 years 5.5 36.4
More than 10 years 7.8 54.5
4. Frequency of water supply
Daily 7.0 90.9
Alternate days 93.0 0.0
Once in 3-5 days 0.0 0.0
Once in a week 0.0 0.0
Irregular 0.0 9.1
5. Duration of water supply
Less than 2 hours 100.0 100.0
2–6 hours 0.0 0.0
7–12 hours 0.0 0.0
13–23 hours 0.0 0.0
Continuous 0.0 0.0
6. Water supply timing
Midnight to 6 a.m. 0.0 0.0
6 a.m. to 12 noon 100.0 100.0
Noon to 6 p.m. 0.0 0.0
6 p.m. to midnight 0.0 0.0
Continuous 0.0 0.0
7. Households with metered water supply 0.0 0.0
8. Paid one time charge to get metered water connection - -
9. Average amount paid (₹) - -
10. Households pay fee for the water service 27.5
Average
11. Last water amount paid (average in ₹) 213.0 -
12. Opinion about current water tariff (%)
Too high 47.7 -
Appropriate 52.3 -
Beneficiary Survey—Knowledge, Attitude, and Practice about Water, Sewerage, and Sanitation in Indore City of Madhya Pradesh
7
Item
Project
Area
(n=160)
Control Group
Area
(n=50)
Low 0.0 -
Willingness to Pay for Improved Water Supply Services 128% 11%
13. Households willing to pay for improved water supply
services
15.8 0.0
Average
14. Amount willing to pay (average in ₹) 291.7 -
For households not connected to piped water service 32% 39%
15. Households willing to pay to get a piped water
connection
Yes 84.4 97.4
No 15.6 2.6
Reasons behind non-willingness to get connected to piped
water supply 5% 1%
16. The connection is expensive 0.0 100.0
The regular fee is expensive 20.0 0.0
The water quality is poor 20.0 0.0
The service is poor 0.0 0.0
Satisfied with the current access 60.0 0.0
Source: Asian Development Bank Independent Evaluation Department.
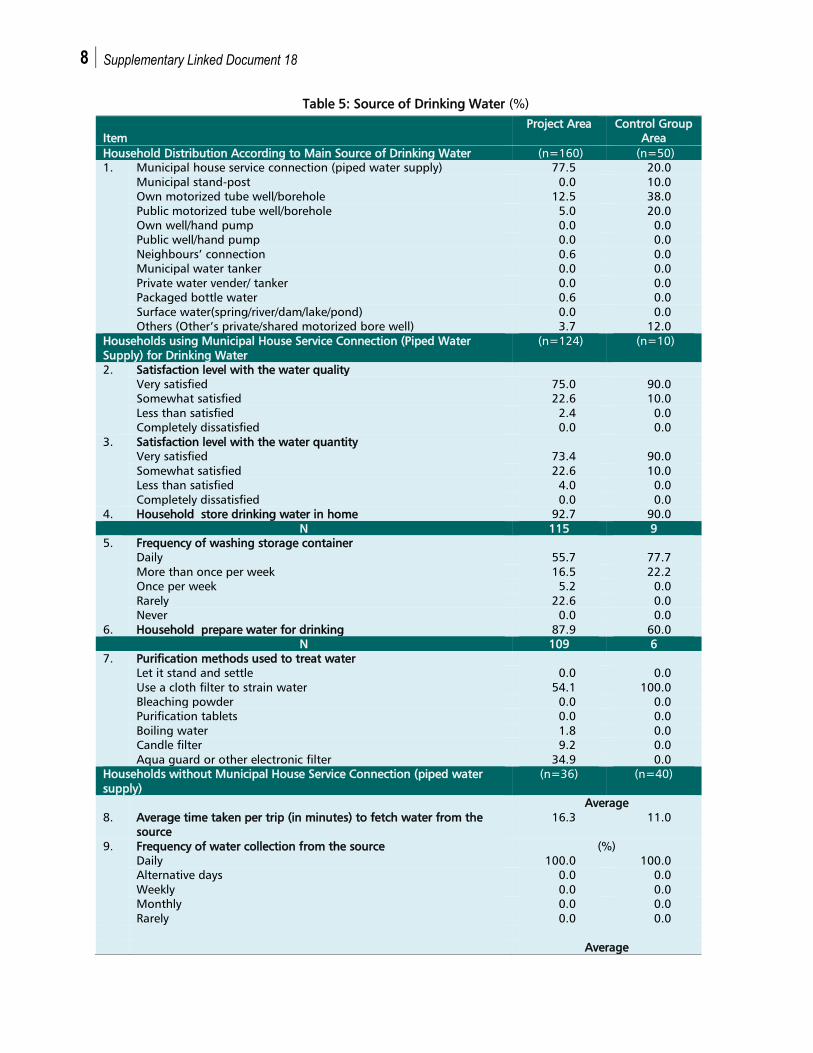
19. Source of drinking water. In the project area, the main source of drinking water for households
(77.5%) was municipal piped water supply, although a few households (21.1%) relied on private, public
or shared motorized tubewell or borehole. In the control group area, the source of drinking water varied
for households: municipal piped water supply (20%), municipal stand-post (10%), own motorized tube
well or borehole (38%), public motorized tube well and shared motorized tube well (12%). Details are
provided in Table 5.
20. Satisfaction level with water quality and quantity (households with municipal piped water
supply). Most households (75% in the project area, 90% in the control group area) were very satisfied
with both the quality and quantity of water supply.
21. Responsibility and difficulty in getting water (for households without municipal piped water
supply). In the project area, households without municipal piped water supply spent about 16 minutes
on average to fetch drinking water and in the control group area it was this was 11 minutes. In both
groups, all households collected drinking water daily and the responsibility of collecting water lay with
adult women of the households (63.9% in the project area, 47.5% in the control group area). In the
project area 25% of households shared responsibility of collecting water with other household members
while in the control group area this was 47.5%. Most households were very satisfied with both the quality
and quantity of collected water.
22. Practices associated with safe drinking water. Across both groups, almost all households stored
drinking water. Most households (79.4% in the project area, 87.5% in the control area group) cleaned
the storage containers daily. A good proportion of households (50% project area, 71% control group
area) used a filter cloth for purification. An aqua guard or electronic device was used by many households
(43.3% in the project area, 21.1% in the control group area).
8 Supplementary Linked Document 18
Table 5: Source of Drinking Water (%)
Item
Project Area Control Group
Area
Household Distribution According to Main Source of Drinking Water (n=160) (n=50)
1. Municipal house service connection (piped water supply) 77.5 20.0
Municipal stand-post 0.0 10.0
Own motorized tube well/borehole 12.5 38.0
Public motorized tube well/borehole 5.0 20.0
Own well/hand pump 0.0 0.0
Public well/hand pump 0.0 0.0
Neighbours’ connection 0.6 0.0
Municipal water tanker 0.0 0.0
Private water vender/ tanker 0.0 0.0
Packaged bottle water 0.6 0.0
Surface water(spring/river/dam/lake/pond) 0.0 0.0
Others (Other’s private/shared motorized bore well) 3.7 12.0
Households using Municipal House Service Connection (Piped Water
Supply) for Drinking Water
(n=124) (n=10)
2. Satisfaction level with the water quality
Very satisfied 75.0 90.0
Somewhat satisfied 22.6 10.0
Less than satisfied 2.4 0.0
Completely dissatisfied 0.0 0.0
3. Satisfaction level with the water quantity
Very satisfied 73.4 90.0
Somewhat satisfied 22.6 10.0
Less than satisfied 4.0 0.0
Completely dissatisfied 0.0 0.0
4. Household store drinking water in home 92.7 90.0
N 115 9
5. Frequency of washing storage container
Daily 55.7 77.7
More than once per week 16.5 22.2
Once per week 5.2 0.0
Rarely 22.6 0.0
Never 0.0 0.0
6. Household prepare water for drinking 87.9 60.0
N 109 6
7. Purification methods used to treat water
Let it stand and settle 0.0 0.0
Use a cloth filter to strain water 54.1 100.0
Bleaching powder 0.0 0.0
Purification tablets 0.0 0.0
Boiling water 1.8 0.0
Candle filter 9.2 0.0
Aqua guard or other electronic filter 34.9 0.0
Households without Municipal House Service Connection (piped water
supply)
(n=36) (n=40)
Average
8. Average time taken per trip (in minutes) to fetch water from the
source
16.3 11.0
9. Frequency of water collection from the source (%)
Daily 100.0 100.0
Alternative days 0.0 0.0
Weekly 0.0 0.0
Monthly 0.0 0.0
Rarely 0.0 0.0
Average
Beneficiary Survey—Knowledge, Attitude, and Practice about Water, Sewerage, and Sanitation in Indore City of Madhya Pradesh
9
Item
Project Area Control Group
Area
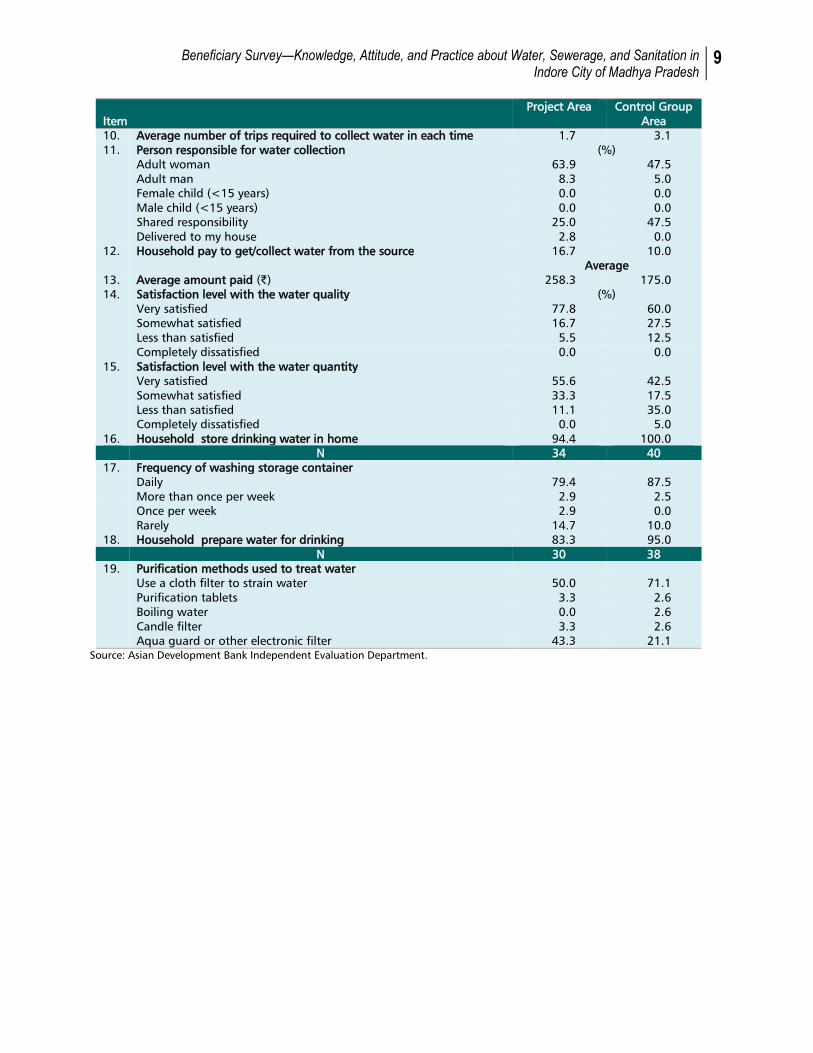
10. Average number of trips required to collect water in each time 1.7 3.1
11. Person responsible for water collection (%)
Adult woman 63.9 47.5
Adult man 8.3 5.0
Female child (<15 years) 0.0 0.0
Male child (<15 years) 0.0 0.0
Shared responsibility 25.0 47.5
Delivered to my house 2.8 0.0
12. Household pay to get/collect water from the source 16.7 10.0
Average
13. Average amount paid (₹) 258.3 175.0
14. Satisfaction level with the water quality (%)
Very satisfied 77.8 60.0
Somewhat satisfied 16.7 27.5
Less than satisfied 5.5 12.5
Completely dissatisfied 0.0 0.0
15. Satisfaction level with the water quantity
Very satisfied 55.6 42.5
Somewhat satisfied 33.3 17.5
Less than satisfied 11.1 35.0
Completely dissatisfied 0.0 5.0
16. Household store drinking water in home 94.4 100.0
N 34 40
17. Frequency of washing storage container
Daily 79.4 87.5
More than once per week 2.9 2.5
Once per week 2.9 0.0
Rarely 14.7 10.0
18. Household prepare water for drinking 83.3 95.0
N 30 38
19. Purification methods used to treat water
Use a cloth filter to strain water 50.0 71.1
Purification tablets 3.3 2.6
Boiling water 0.0 2.6
Candle filter 3.3 2.6
Aqua guard or other electronic filter 43.3 21.1
Source: Asian Development Bank Independent Evaluation Department.
10 Supplementary Linked Document 18
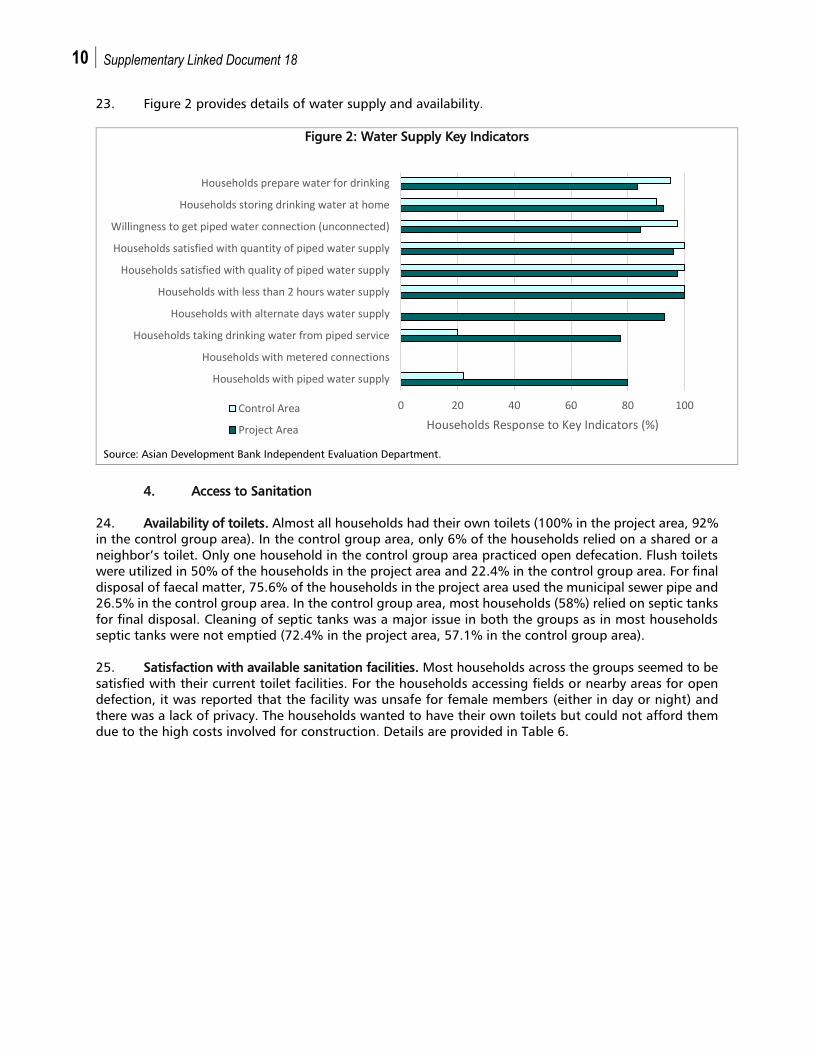
23. Figure 2 provides details of water supply and availability.
Figure 2: Water Supply Key Indicators
Source: Asian Development Bank Independent Evaluation Department.
4. Access to Sanitation
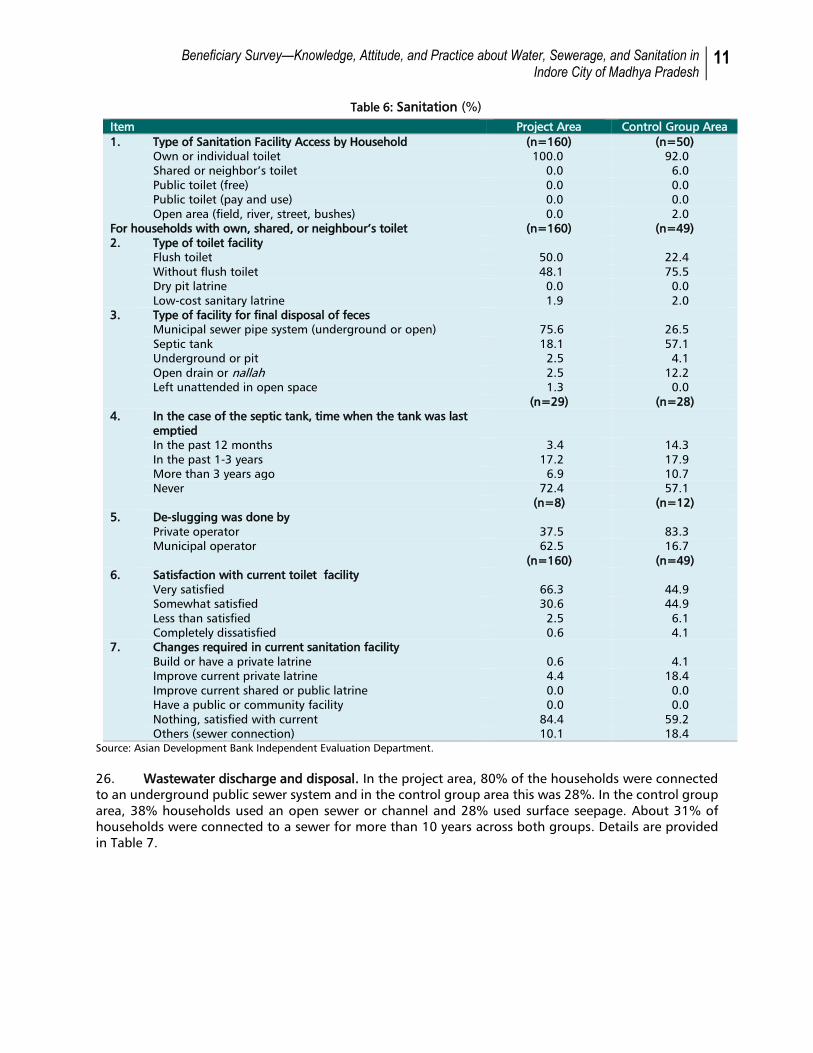
24. Availability of toilets. Almost all households had their own toilets (100% in the project area, 92%
in the control group area). In the control group area, only 6% of the households relied on a shared or a
neighbor’s toilet. Only one household in the control group area practiced open defecation. Flush toilets
were utilized in 50% of the households in the project area and 22.4% in the control group area. For final
disposal of faecal matter, 75.6% of the households in the project area used the municipal sewer pipe and
26.5% in the control group area. In the control group area, most households (58%) relied on septic tanks
for final disposal. Cleaning of septic tanks was a major issue in both the groups as in most households
septic tanks were not emptied (72.4% in the project area, 57.1% in the control group area).
25. Satisfaction with available sanitation facilities. Most households across the groups seemed to be
satisfied with their current toilet facilities. For the households accessing fields or nearby areas for open
defection, it was reported that the facility was unsafe for female members (either in day or night) and
there was a lack of privacy. The households wanted to have their own toilets but could not afford them
due to the high costs involved for construction. Details are provided in Table 6.
0 20 40 60 80 100
Households with piped water supply
Households with metered connections
Households taking drinking water from piped service
Households with alternate days water supply
Households with less than 2 hours water supply
Households satisfied with quality of piped water supply
Households satisfied with quantity of piped water supply
Willingness to get piped water connection (unconnected)
Households storing drinking water at home
Households prepare water for drinking
Households Response to Key Indicators (%)
Control Area
Project Area
Beneficiary Survey—Knowledge, Attitude, and Practice about Water, Sewerage, and Sanitation in Indore City of Madhya Pradesh
11
Table 6: Sanitation (%)
Item Project Area Control Group Area
1. Type of Sanitation Facility Access by Household (n=160) (n=50)
Own or individual toilet 100.0 92.0
Shared or neighbor’s toilet 0.0 6.0
Public toilet (free) 0.0 0.0
Public toilet (pay and use) 0.0 0.0
Open area (field, river, street, bushes) 0.0 2.0
For households with own, shared, or neighbour’s toilet (n=160) (n=49)
2. Type of toilet facility
Flush toilet 50.0 22.4
Without flush toilet 48.1 75.5
Dry pit latrine 0.0 0.0
Low-cost sanitary latrine 1.9 2.0
3. Type of facility for final disposal of feces
Municipal sewer pipe system (underground or open) 75.6 26.5
Septic tank 18.1 57.1
Underground or pit 2.5 4.1
Open drain or nallah 2.5 12.2
Left unattended in open space 1.3 0.0
(n=29) (n=28)
4. In the case of the septic tank, time when the tank was last
emptied
In the past 12 months 3.4 14.3
In the past 1-3 years 17.2 17.9
More than 3 years ago 6.9 10.7
Never 72.4 57.1
(n=8) (n=12)
5. De-slugging was done by
Private operator 37.5 83.3
Municipal operator 62.5 16.7
(n=160) (n=49)
6. Satisfaction with current toilet facility
Very satisfied 66.3 44.9
Somewhat satisfied 30.6 44.9
Less than satisfied 2.5 6.1
Completely dissatisfied 0.6 4.1
7. Changes required in current sanitation facility
Build or have a private latrine 0.6 4.1
Improve current private latrine 4.4 18.4
Improve current shared or public latrine 0.0 0.0
Have a public or community facility 0.0 0.0
Nothing, satisfied with current 84.4 59.2
Others (sewer connection) 10.1 18.4
Source: Asian Development Bank Independent Evaluation Department.
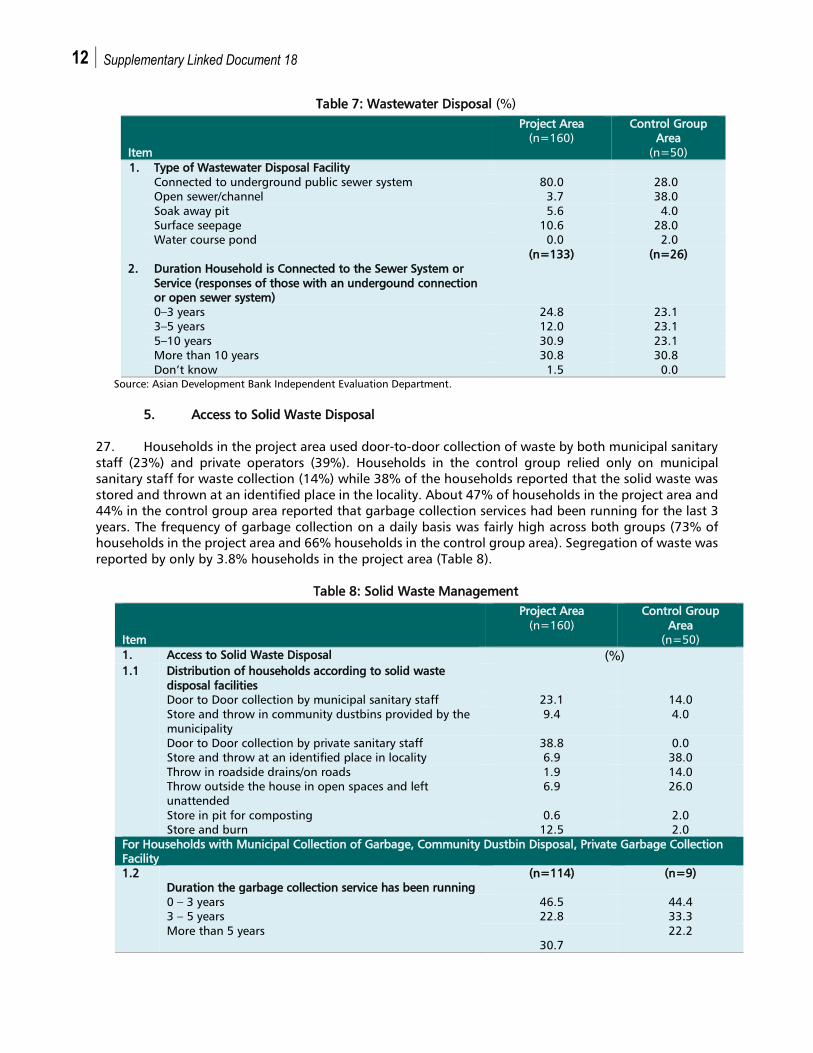
26. Wastewater discharge and disposal. In the project area, 80% of the households were connected
to an underground public sewer system and in the control group area this was 28%. In the control group
area, 38% households used an open sewer or channel and 28% used surface seepage. About 31% of
households were connected to a sewer for more than 10 years across both groups. Details are provided
in Table 7.
12 Supplementary Linked Document 18
Table 7: Wastewater Disposal (%)
Item
Project Area
(n=160)
Control Group
Area
(n=50)
1. Type of Wastewater Disposal Facility
Connected to underground public sewer system 80.0 28.0
Open sewer/channel 3.7 38.0
Soak away pit 5.6 4.0
Surface seepage 10.6 28.0
Water course pond 0.0 2.0
(n=133) (n=26)
2. Duration Household is Connected to the Sewer System or
Service (responses of those with an undergound connection
or open sewer system)
0–3 years 24.8 23.1
3–5 years 12.0 23.1
5–10 years 30.9 23.1
More than 10 years 30.8 30.8
Don’t know 1.5 0.0
Source: Asian Development Bank Independent Evaluation Department.
5. Access to Solid Waste Disposal
27. Households in the project area used door-to-door collection of waste by both municipal sanitary
staff (23%) and private operators (39%). Households in the control group relied only on municipal
sanitary staff for waste collection (14%) while 38% of the households reported that the solid waste was
stored and thrown at an identified place in the locality. About 47% of households in the project area and
44% in the control group area reported that garbage collection services had been running for the last 3
years. The frequency of garbage collection on a daily basis was fairly high across both groups (73% of
households in the project area and 66% households in the control group area). Segregation of waste was
reported by only by 3.8% households in the project area (Table 8).
Table 8: Solid Waste Management
Item
Project Area
(n=160)
Control Group
Area
(n=50)
1. Access to Solid Waste Disposal (%)
1.1 Distribution of households according to solid waste
disposal facilities
Door to Door collection by municipal sanitary staff 23.1 14.0
Store and throw in community dustbins provided by the
municipality
9.4 4.0
Door to Door collection by private sanitary staff 38.8 0.0
Store and throw at an identified place in locality 6.9 38.0
Throw in roadside drains/on roads 1.9 14.0
Throw outside the house in open spaces and left
unattended
6.9 26.0
Store in pit for composting 0.6 2.0
Store and burn 12.5 2.0
For Households with Municipal Collection of Garbage, Community Dustbin Disposal, Private Garbage Collection
Facility
1.2 (n=114) (n=9)
Duration the garbage collection service has been running
0 – 3 years 46.5 44.4
3 – 5 years 22.8 33.3
More than 5 years
30.7
22.2
Beneficiary Survey—Knowledge, Attitude, and Practice about Water, Sewerage, and Sanitation in Indore City of Madhya Pradesh
13
Item
Project Area
(n=160)
Control Group
Area
(n=50)
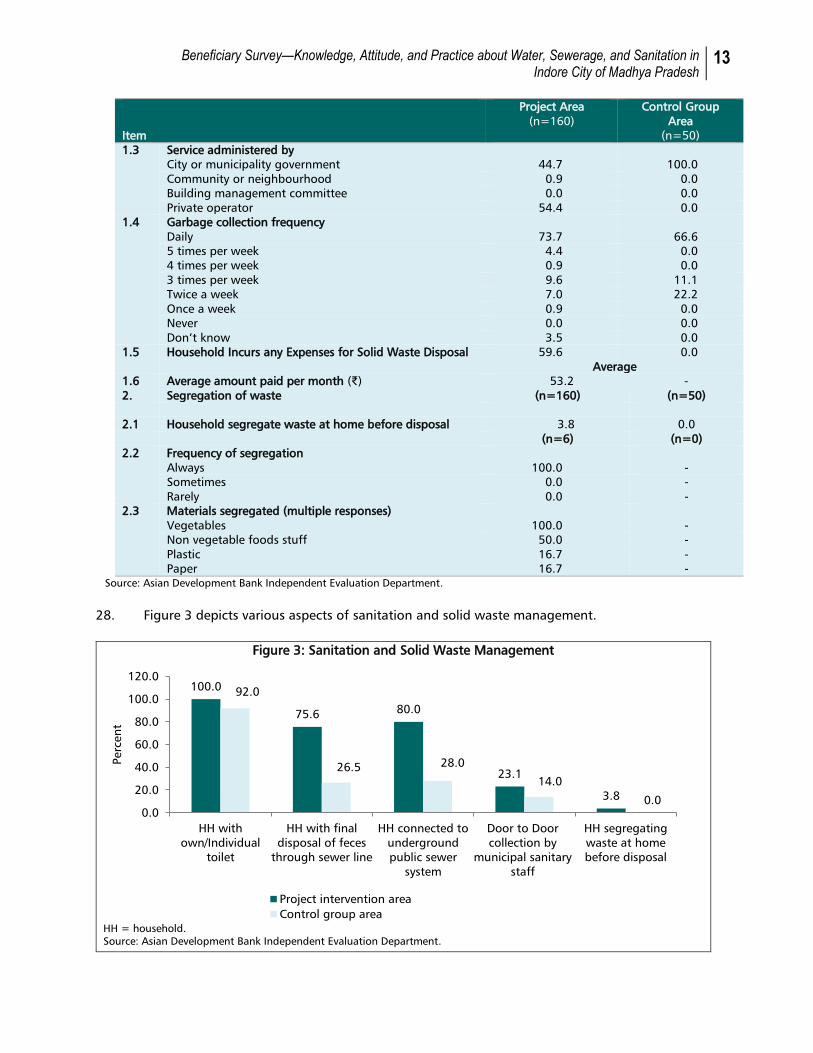
1.3 Service administered by
City or municipality government 44.7 100.0
Community or neighbourhood 0.9 0.0
Building management committee 0.0 0.0
Private operator 54.4 0.0
1.4 Garbage collection frequency
Daily 73.7 66.6
5 times per week 4.4 0.0
4 times per week 0.9 0.0
3 times per week 9.6 11.1
Twice a week 7.0 22.2
Once a week 0.9 0.0
Never 0.0 0.0
Don’t know 3.5 0.0
1.5 Household Incurs any Expenses for Solid Waste Disposal 59.6 0.0
Average
1.6 Average amount paid per month (₹) 53.2 -
2. Segregation of waste (n=160) (n=50)
2.1 Household segregate waste at home before disposal 3.8 0.0
(n=6) (n=0)
2.2 Frequency of segregation
Always 100.0 -
Sometimes 0.0 -
Rarely 0.0 -
2.3 Materials segregated (multiple responses)
Vegetables 100.0 -
Non vegetable foods stuff 50.0 -
Plastic 16.7 -
Paper 16.7 -
Source: Asian Development Bank Independent Evaluation Department.
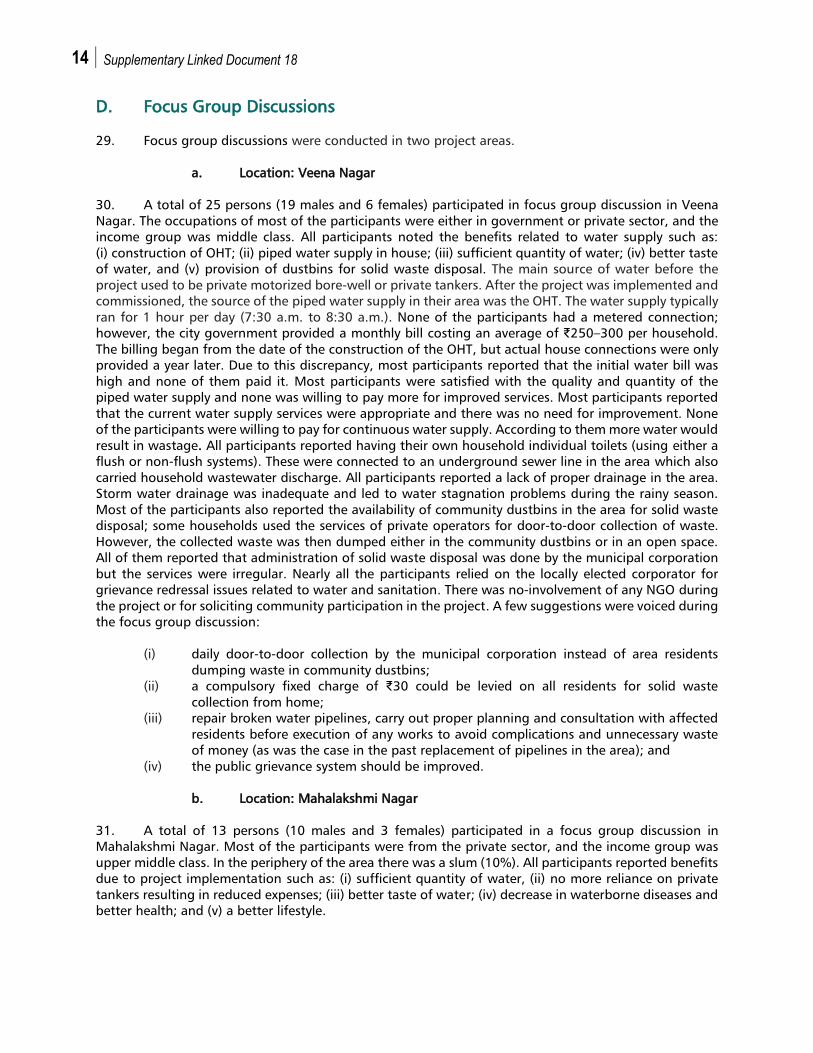
28. Figure 3 depicts various aspects of sanitation and solid waste management.
Figure 3: Sanitation and Solid Waste Management
HH = household.
Source: Asian Development Bank Independent Evaluation Department.
100.0
75.680.0
23.1
3.8
92.0
26.528.0
14.0
0.0
0.0
20.0
40.0
60.0
80.0
100.0
120.0
HH with
own/Individual
toilet
HH with final
disposal of feces
through sewer line
HH connected to
underground
public sewer
system
Door to Door
collection by
municipal sanitary
staff
HH segregating
waste at home
before disposal
Percen
t
Project intervention area
Control group area
14 Supplementary Linked Document 18
D. Focus Group Discussions
29. Focus group discussions were conducted in two project areas.
a. Location: Veena Nagar
30. A total of 25 persons (19 males and 6 females) participated in focus group discussion in Veena
Nagar. The occupations of most of the participants were either in government or private sector, and the
income group was middle class. All participants noted the benefits related to water supply such as:
(i) construction of OHT; (ii) piped water supply in house; (iii) sufficient quantity of water; (iv) better taste
of water, and (v) provision of dustbins for solid waste disposal. The main source of water before the
project used to be private motorized bore-well or private tankers. After the project was implemented and
commissioned, the source of the piped water supply in their area was the OHT. The water supply typically
ran for 1 hour per day (7:30 a.m. to 8:30 a.m.). None of the participants had a metered connection;
however, the city government provided a monthly bill costing an average of ₹250–300 per household.
The billing began from the date of the construction of the OHT, but actual house connections were only
provided a year later. Due to this discrepancy, most participants reported that the initial water bill was
high and none of them paid it. Most participants were satisfied with the quality and quantity of the
piped water supply and none was willing to pay more for improved services. Most participants reported
that the current water supply services were appropriate and there was no need for improvement. None
of the participants were willing to pay for continuous water supply. According to them more water would
result in wastage. All participants reported having their own household individual toilets (using either a
flush or non-flush systems). These were connected to an underground sewer line in the area which also
carried household wastewater discharge. All participants reported a lack of proper drainage in the area.
Storm water drainage was inadequate and led to water stagnation problems during the rainy season.
Most of the participants also reported the availability of community dustbins in the area for solid waste
disposal; some households used the services of private operators for door-to-door collection of waste.
However, the collected waste was then dumped either in the community dustbins or in an open space.
All of them reported that administration of solid waste disposal was done by the municipal corporation
but the services were irregular. Nearly all the participants relied on the locally elected corporator for
grievance redressal issues related to water and sanitation. There was no-involvement of any NGO during
the project or for soliciting community participation in the project. A few suggestions were voiced during
the focus group discussion:
(i) daily door-to-door collection by the municipal corporation instead of area residents
dumping waste in community dustbins;
(ii) a compulsory fixed charge of ₹30 could be levied on all residents for solid waste
collection from home;
(iii) repair broken water pipelines, carry out proper planning and consultation with affected
residents before execution of any works to avoid complications and unnecessary waste
of money (as was the case in the past replacement of pipelines in the area); and
(iv) the public grievance system should be improved.
b. Location: Mahalakshmi Nagar
31. A total of 13 persons (10 males and 3 females) participated in a focus group discussion in
Mahalakshmi Nagar. Most of the participants were from the private sector, and the income group was
upper middle class. In the periphery of the area there was a slum (10%). All participants reported benefits
due to project implementation such as: (i) sufficient quantity of water, (ii) no more reliance on private
tankers resulting in reduced expenses; (iii) better taste of water; (iv) decrease in waterborne diseases and
better health; and (v) a better lifestyle.
Beneficiary Survey—Knowledge, Attitude, and Practice about Water, Sewerage, and Sanitation in Indore City of Madhya Pradesh
15
32. The main source of water before the project was private motorized bore-wells or private tankers.
After the project was implemented and commissioned, the source of the piped water supply in their area
was the OHT. The water supply typically ran for 1 hour daily (8:30 a.m. to 9:30 a.m.). None of the
participants had a metered water supply connection. However, the city government provided a monthly
bill. As with Veena Nagar, the billing began from the date of the construction of the OHT, but actual
house connections were only provided a year later. Due to this discrepancy, most participants reported
that the initial water bill was high and none of them paid it. All participants were satisfied with the
quality and quantity of piped water supply and none of them were willing to pay more for improved
services. According to the participants, the current water supply services were appropriate and there was
no need for further improvement. None of the participants were willing to pay for continuous water
supply. All participants reported having their own household individual toilets (mostly using a flush
system). These were connected to an underground sewer line in the area which also carried household
wastewater discharge. All participants reported a lack of a proper drainage system in the area. Storm
water drainage was inadequate and this led to water stagnation problems during the rainy season. All
participants reported door-to-door waste collection by private staff that was later dumped in an open
area for further collection by municipal sanitary staff; the collection took place once every 3-4 days. While
some participants were aware of the municipal corporation’s webpage for tax-related issues, for
grievance redressal related to water issues nearly all participants said that they availed of the services of
the chief of Narmada Project (the main source of water). All participants reported that there was no
involvement of any NGO during project implementation. Suggestions voiced during the focus group
discussion related to making improvements to roads and storm water drains in the area.
E. Summary
1. Awareness of the Project
33. Awareness of the project was similar in the project area and the control group area. Only a
quarter of households were aware of plans to make improvements in their neighborhoods and more
than half of these households received information from a neighbor or friend.
2. Profile of Respondents
(i) Most households were headed by males.
(ii) Most households (89.4% in the intervention area, 82% in the control group area)
had education above secondary level.
3. Water Supply and Availability
(i) In the project area, the piped water supply reached about 80% of households
either through tap connections at home or into the yard or plot. None of the
households in the project area utilized public stand posts.
(ii) In the control group area, only 22% of households had piped water supply
through tap connections at home while 78% of the households relied on
alternative sources of water.
(iii) In the project area, all households (100%) reported good frequency of piped
water supply (daily to alternate days) with no irregular supply at any time. In the
control group area, most households (90%) reported good frequency of piped
water supply (daily) but 9% of households reported irregular piped water supply.
(iv) Across both groups, the duration of the water supply was less than 2 hours per
day, while the timing of the incoming piped water supply was between 6am to
12.00 noon.
(v) None of the households had a metered water supply.
16 Supplementary Linked Document 18
(vi) Most households (75% in the project area, 90% in the control group area) were
very satisfied with both quality and quantity of water supply.
(vii) Most households did not require water supply at continuously.
4. Sources of Drinking Water
34. The main source of drinking water for households in the project area was municipal piped water
supply (77.5%). In the control group area, the households relied on different sources of drinking water,
including municipal piped water (20%), municipal stand-post (10%), own motorized tube well or
borehole (38%), public motorized tube well and shared motorized tube well (12%).
5. Willingness to Pay for Improved Services
(i) In the project area, only 15.8% of the households were willing to pay for
improved water services while in the control group area it was 0%.
(ii) For households not connected to the piped water supply, 84% of households
(project area) and 97% (control group area) were willing to pay for obtaining
piped water supply connection in case of its absence.
6. Sanitation
(i) Almost all households had their own toilets (100% in the project area, 92% in
the control group area). In the control group area, only 6% of the households
relied on shared or a neighbour’s toilet. Only one household in the control group
area practiced open defecation.
(ii) Flush toilets were used in 50% of the households in the project area and 22.4%
in the control group area.
(iii) For final disposal of fecal matter, 75.6% of the households in the project area
used the municipal sewer pipe in the project area and 26.5% in the control group
area. In the control group area, most of the households (58%) relied on septic
tanks for final disposal.
7. Solid Waste Management
(i) Households in the project area used door-to-door collection of waste by both
municipal sanitary staff (23%) and private operators (39%). Households in the
control group relied only on municipal sanitary staff for waste collection (14%).
(ii) In the project area, 6.9% of households reported that the solid waste was stored
and thrown at identified place in the locality; this increased to 38% in the control
group area.
(iii) Waste segregation was practiced by only 3.8% households in the project area.
(iv) Frequency of garbage collection on daily basis was fairly high across both groups
(73% households in the project area and 66% of households in the control group
area).
8. Waste Water Disposal
35. In the project area, 80% of households were connected to an underground public sewer system
and in control group area, this was 28%.

Beneficiary Survey—Knowledge, Attitude, and Practice about Water, Sewerage, and Sanitation in Indore City of Madhya Pradesh
17
9. Focus Group Discussions
36. Focus group discussions were conducted in two project areas of Veena Nagar and Mahalakshmi
Nagar. A total of 38 persons, men and women, participated. Participants reported benefits due to project
implementation: (i) construction of overhead tanks and increased more reliable water supply, (ii) no
reliance on private water tankers, (iii) time saving from water collection due to piped water supply,
(iv) sewer line construction, (v) community dustbins and door-to-door waste collection, (vi) a decrease in
waterborne diseases and better health, and (vii) a better lifestyle.
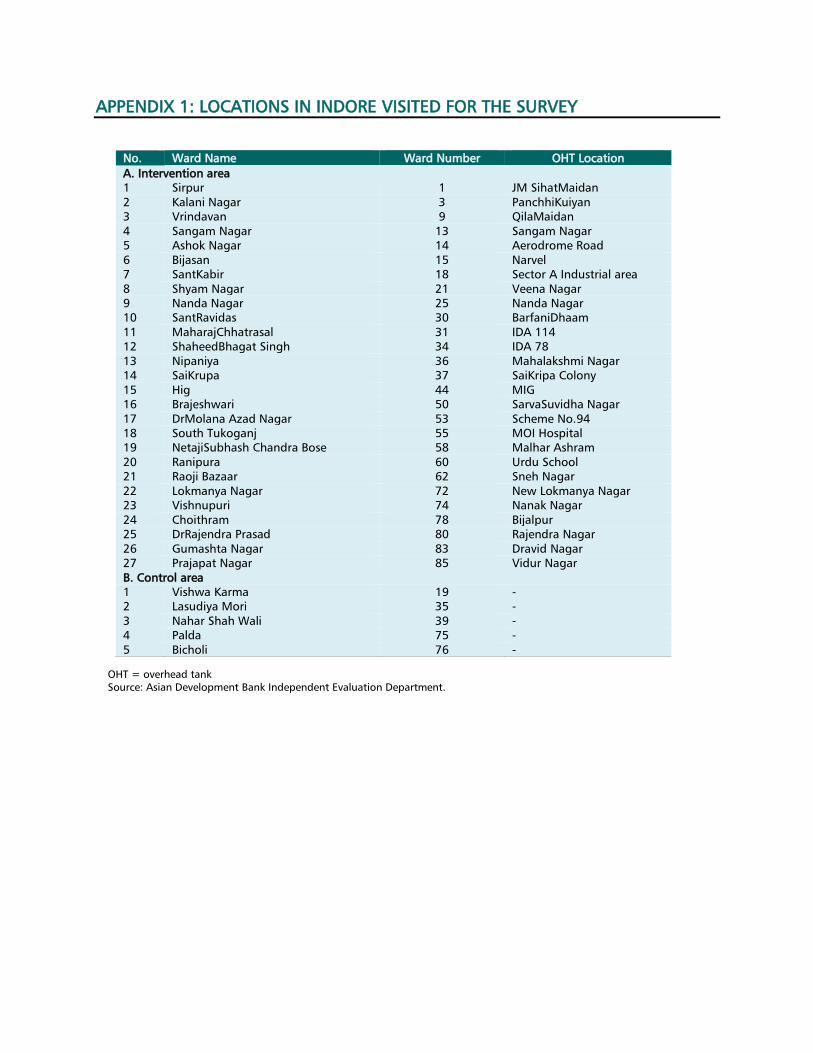
APPENDIX 1: LOCATIONS IN INDORE VISITED FOR THE SURVEY
OHT = overhead tank
Source: Asian Development Bank Independent Evaluation Department.
No. Ward Name Ward Number OHT Location
A. Intervention area
1 Sirpur 1 JM SihatMaidan
2 Kalani Nagar 3 PanchhiKuiyan
3 Vrindavan 9 QilaMaidan
4 Sangam Nagar 13 Sangam Nagar
5 Ashok Nagar 14 Aerodrome Road
6 Bijasan 15 Narvel
7 SantKabir 18 Sector A Industrial area
8 Shyam Nagar 21 Veena Nagar
9 Nanda Nagar 25 Nanda Nagar
10 SantRavidas 30 BarfaniDhaam
11 MaharajChhatrasal 31 IDA 114
12 ShaheedBhagat Singh 34 IDA 78
13 Nipaniya 36 Mahalakshmi Nagar
14 SaiKrupa 37 SaiKripa Colony
15 Hig 44 MIG
16 Brajeshwari 50 SarvaSuvidha Nagar
17 DrMolana Azad Nagar 53 Scheme No.94
18 South Tukoganj 55 MOI Hospital
19 NetajiSubhash Chandra Bose 58 Malhar Ashram
20 Ranipura 60 Urdu School
21 Raoji Bazaar 62 Sneh Nagar
22 Lokmanya Nagar 72 New Lokmanya Nagar
23 Vishnupuri 74 Nanak Nagar
24 Choithram 78 Bijalpur
25 DrRajendra Prasad 80 Rajendra Nagar
26 Gumashta Nagar 83 Dravid Nagar
27 Prajapat Nagar 85 Vidur Nagar
B. Control area
1 Vishwa Karma 19 -
2 Lasudiya Mori 35 -
3 Nahar Shah Wali 39 -
4 Palda 75 -
5 Bicholi 76 -
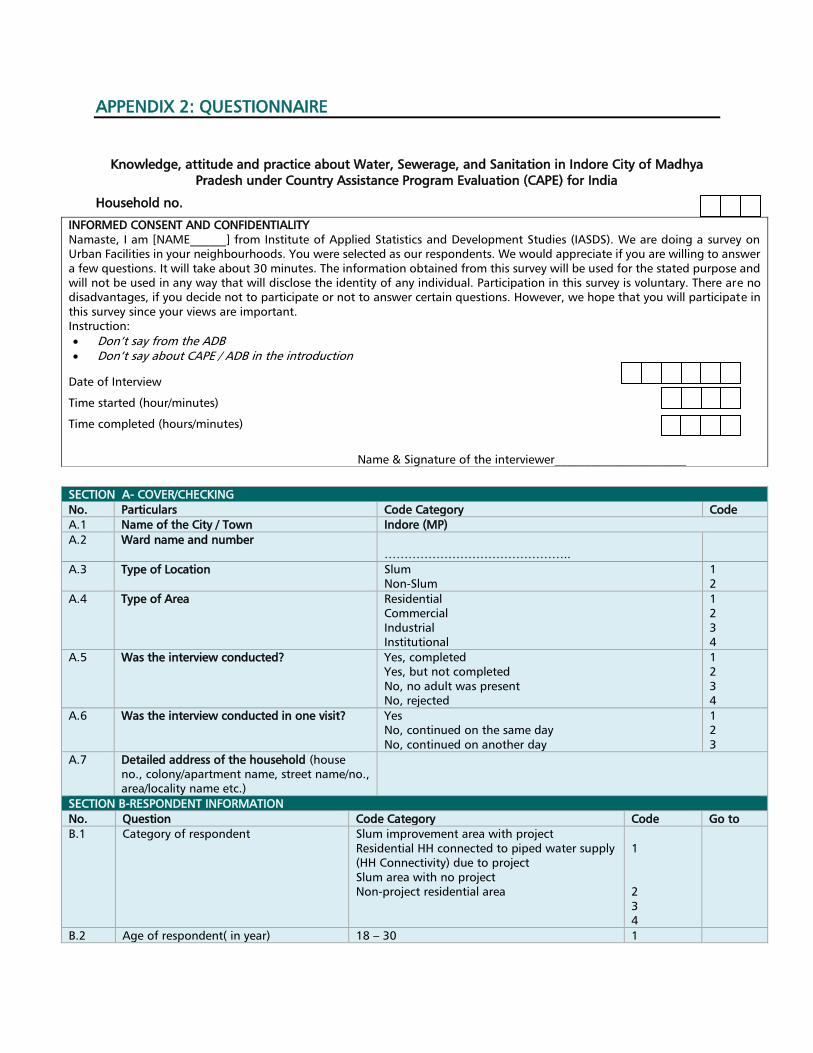
APPENDIX 2: QUESTIONNAIRE
Knowledge, attitude and practice about Water, Sewerage, and Sanitation in Indore City of Madhya
Pradesh under Country Assistance Program Evaluation (CAPE) for India
Household no.
INFORMED CONSENT AND CONFIDENTIALITY
Namaste, I am [NAME______] from Institute of Applied Statistics and Development Studies (IASDS). We are doing a survey on
Urban Facilities in your neighbourhoods. You were selected as our respondents. We would appreciate if you are willing to answer
a few questions. It will take about 30 minutes. The information obtained from this survey will be used for the stated purpose and
will not be used in any way that will disclose the identity of any individual. Participation in this survey is voluntary. There are no
disadvantages, if you decide not to participate or not to answer certain questions. However, we hope that you will participate in
this survey since your views are important.
Instruction:
Don’t say from the ADB
Don’t say about CAPE / ADB in the introduction
Date of Interview
Time started (hour/minutes)
Time completed (hours/minutes)
Name & Signature of the interviewer______________________
SECTION A- COVER/CHECKING
No. Particulars Code Category Code
A.1 Name of the City / Town Indore (MP)
A.2
Ward name and number
………………………………………..
A.3 Type of Location Slum
Non-Slum
1
2
A.4 Type of Area Residential
Commercial
Industrial
Institutional
1
2
3
4
A.5 Was the interview conducted?
Yes, completed
Yes, but not completed
No, no adult was present
No, rejected
1
2
3
4
A.6 Was the interview conducted in one visit?
Yes
No, continued on the same day
No, continued on another day
1
2
3
A.7 Detailed address of the household (house
no., colony/apartment name, street name/no.,
area/locality name etc.)
SECTION B-RESPONDENT INFORMATION
No. Question Code Category Code Go to
B.1 Category of respondent
Slum improvement area with project
Residential HH connected to piped water supply
(HH Connectivity) due to project
Slum area with no project
Non-project residential area
1
2
3
4
B.2 Age of respondent( in year) 18 – 30 1
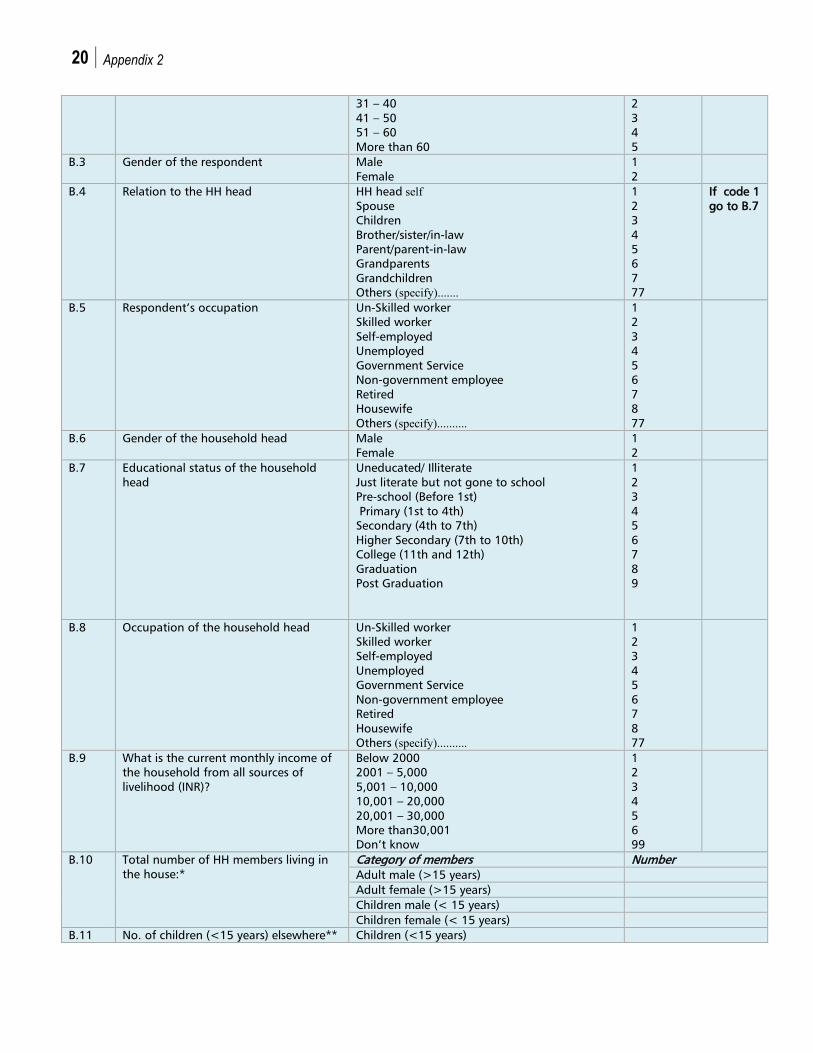
20 Appendix 2
31 – 40
41 – 50
51 – 60
More than 60
2
3
4
5
B.3 Gender of the respondent Male
Female
1
2
B.4 Relation to the HH head HH head self
Spouse
Children
Brother/sister/in-law
Parent/parent-in-law
Grandparents
Grandchildren
Others (specify).......
1
2
3
4
5
6
7
77
If code 1
go to B.7
B.5 Respondent’s occupation Un-Skilled worker
Skilled worker
Self-employed
Unemployed
Government Service
Non-government employee
Retired
Housewife
Others (specify)..........
1
2
3
4
5
6
7
8
77
B.6 Gender of the household head Male
Female
1
2
B.7 Educational status of the household
head
Uneducated/ Illiterate
Just literate but not gone to school
Pre-school (Before 1st)
Primary (1st to 4th)
Secondary (4th to 7th)
Higher Secondary (7th to 10th)
College (11th and 12th)
Graduation
Post Graduation
1
2
3
4
5
6
7
8
9
B.8 Occupation of the household head Un-Skilled worker
Skilled worker
Self-employed
Unemployed
Government Service
Non-government employee
Retired
Housewife
Others (specify)..........
1
2
3
4
5
6
7
8
77
B.9 What is the current monthly income of
the household from all sources of
livelihood (INR)?
Below 2000
2001 – 5,000
5,001 – 10,000
10,001 – 20,000
20,001 – 30,000
More than30,001
Don’t know
1
2
3
4
5
6
99
B.10 Total number of HH members living in
the house:*
Category of members Number
Adult male (>15 years)
Adult female (>15 years)
Children male (< 15 years)
Children female (< 15 years)
B.11 No. of children (<15 years) elsewhere** Children (<15 years)
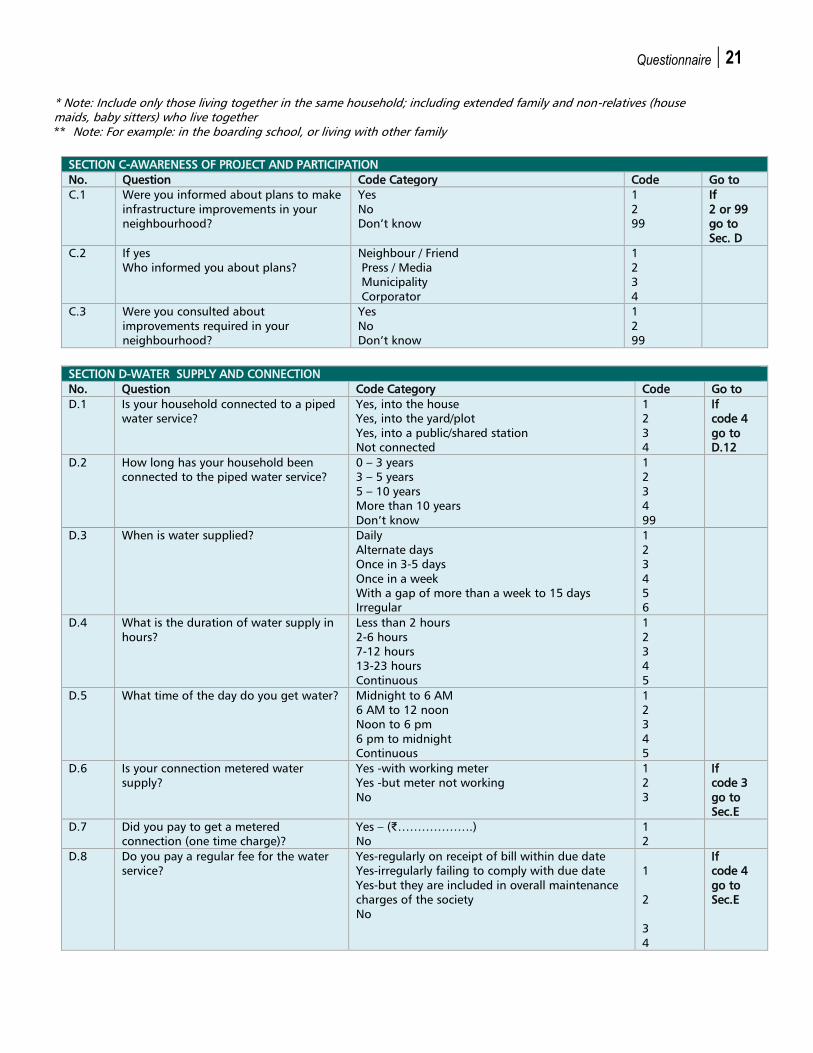
Questionnaire 21
* Note: Include only those living together in the same household; including extended family and non-relatives (house
maids, baby sitters) who live together
** Note: For example: in the boarding school, or living with other family
SECTION C-AWARENESS OF PROJECT AND PARTICIPATION
No. Question Code Category Code Go to
C.1 Were you informed about plans to make
infrastructure improvements in your
neighbourhood?
Yes
No
Don’t know
1
2
99
If
2 or 99
go to
Sec. D
C.2 If yes
Who informed you about plans?
Neighbour / Friend
Press / Media
Municipality
Corporator
1
2
3
4
C.3 Were you consulted about
improvements required in your
neighbourhood?
Yes
No
Don’t know
1
2
99
SECTION D-WATER SUPPLY AND CONNECTION
No. Question Code Category Code Go to
D.1 Is your household connected to a piped
water service?
Yes, into the house
Yes, into the yard/plot
Yes, into a public/shared station
Not connected
1
2
3
4
If
code 4
go to
D.12
D.2 How long has your household been
connected to the piped water service?
0 – 3 years
3 – 5 years
5 – 10 years
More than 10 years
Don’t know
1
2
3
4
99
D.3 When is water supplied?
Daily
Alternate days
Once in 3-5 days
Once in a week
With a gap of more than a week to 15 days
Irregular
1
2
3
4
5
6
D.4 What is the duration of water supply in
hours?
Less than 2 hours
2-6 hours
7-12 hours
13-23 hours
Continuous
1
2
3
4
5
D.5 What time of the day do you get water?
Midnight to 6 AM
6 AM to 12 noon
Noon to 6 pm
6 pm to midnight
Continuous
1
2
3
4
5
D.6 Is your connection metered water
supply?
Yes -with working meter
Yes -but meter not working
No
1
2
3
If
code 3
go to
Sec.E
D.7 Did you pay to get a metered
connection (one time charge)?
Yes – (₹……………….)
No
1
2
D.8 Do you pay a regular fee for the water
service?
Yes-regularly on receipt of bill within due date
Yes-irregularly failing to comply with due date
Yes-but they are included in overall maintenance
charges of the society
No
1
2
3
4
If
code 4
go to
Sec.E
22 Appendix 2
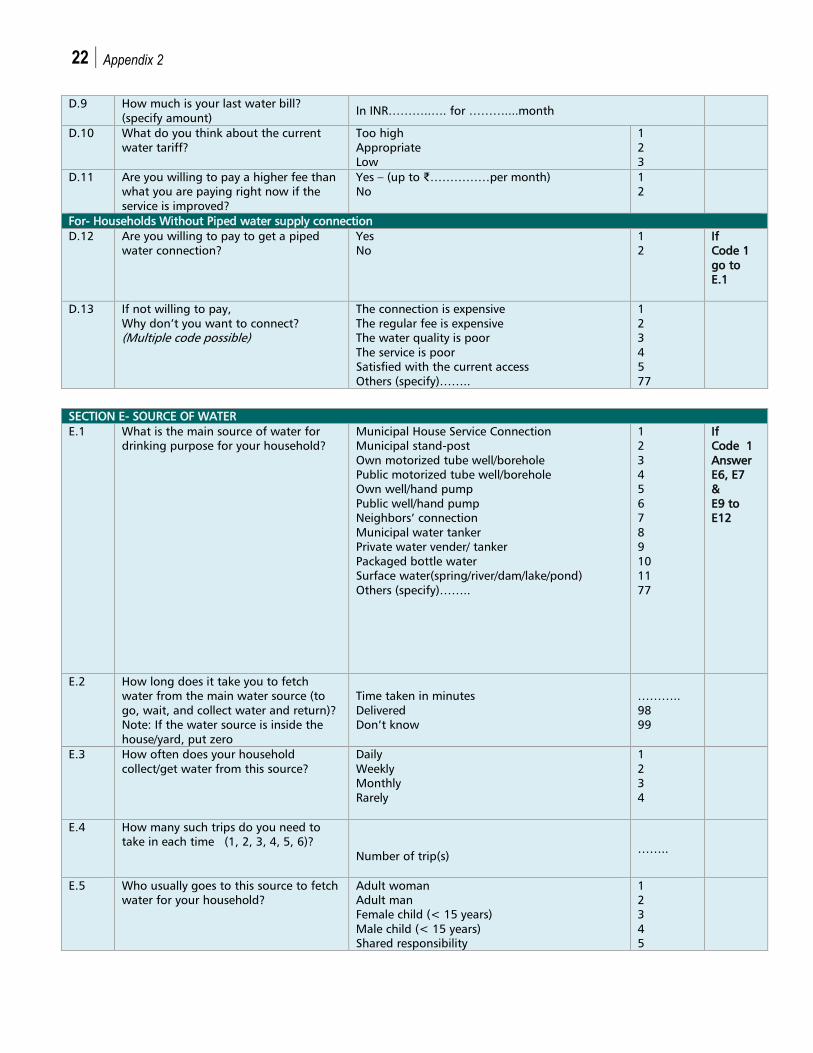
D.9 How much is your last water bill?
(specify amount) In INR………..…. for ………....month
D.10 What do you think about the current
water tariff?
Too high
Appropriate
Low
1
2
3
D.11 Are you willing to pay a higher fee than
what you are paying right now if the
service is improved?
Yes – (up to ₹……………per month)
No
1
2
For- Households Without Piped water supply connection
D.12 Are you willing to pay to get a piped
water connection?
Yes
No
1
2
If
Code 1
go to
E.1
D.13 If not willing to pay,
Why don’t you want to connect?
(Multiple code possible)
The connection is expensive
The regular fee is expensive
The water quality is poor
The service is poor
Satisfied with the current access
Others (specify)……..
1
2
3
4
5
77
SECTION E- SOURCE OF WATER
E.1 What is the main source of water for
drinking purpose for your household?
Municipal House Service Connection
Municipal stand-post
Own motorized tube well/borehole
Public motorized tube well/borehole
Own well/hand pump
Public well/hand pump
Neighbors’ connection
Municipal water tanker
Private water vender/ tanker
Packaged bottle water
Surface water(spring/river/dam/lake/pond)
Others (specify)……..
1
2
3
4
5
6
7
8
9
10
11
77
If
Code 1
Answer
E6, E7
&
E9 to
E12
E.2 How long does it take you to fetch
water from the main water source (to
go, wait, and collect water and return)?
Note: If the water source is inside the
house/yard, put zero
Time taken in minutes
Delivered
Don’t know
………..
98
99
E.3 How often does your household
collect/get water from this source?
Daily
Weekly
Monthly
Rarely
1
2
3
4
E.4 How many such trips do you need to
take in each time (1, 2, 3, 4, 5, 6)?
Number of trip(s)
……..
E.5 Who usually goes to this source to fetch
water for your household?
Adult woman
Adult man
Female child (< 15 years)
Male child (< 15 years)
Shared responsibility
1
2
3
4
5
Questionnaire 23
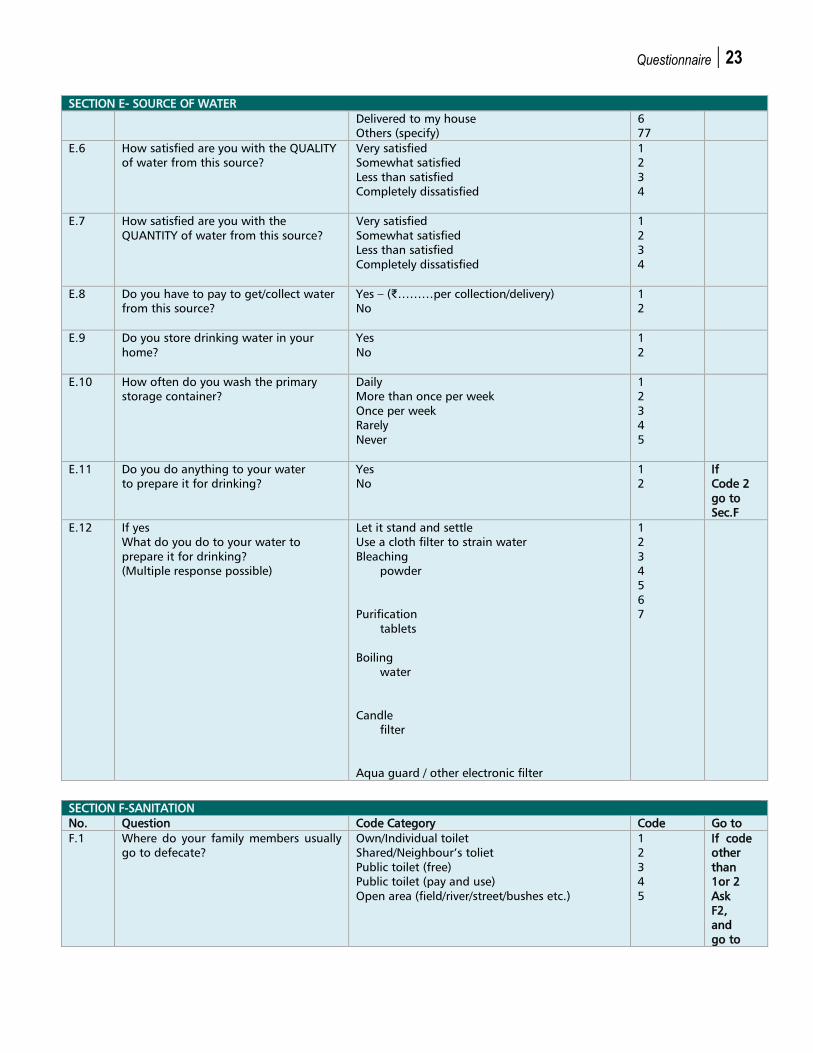
SECTION E- SOURCE OF WATER
Delivered to my house
Others (specify)
6
77
E.6 How satisfied are you with the QUALITY
of water from this source?
Very satisfied
Somewhat satisfied
Less than satisfied
Completely dissatisfied
1
2
3
4
E.7 How satisfied are you with the
QUANTITY of water from this source?
Very satisfied
Somewhat satisfied
Less than satisfied
Completely dissatisfied
1
2
3
4
E.8 Do you have to pay to get/collect water
from this source?
Yes – (₹………per collection/delivery)
No
1
2
E.9 Do you store drinking water in your
home?
Yes
No
1
2
E.10 How often do you wash the primary
storage container?
Daily
More than once per week
Once per week
Rarely
Never
1
2
3
4
5
E.11 Do you do anything to your water
to prepare it for drinking?
Yes
No
1
2
If
Code 2
go to
Sec.F
E.12 If yes
What do you do to your water to
prepare it for drinking?
(Multiple response possible)
Let it stand and settle
Use a cloth filter to strain water
Bleaching
powder
Purification
tablets
Boiling
water
Candle
filter
Aqua guard / other electronic filter
1
2
3
4
5
6
7
SECTION F-SANITATION
No. Question Code Category Code Go to
F.1 Where do your family members usually
go to defecate?
Own/Individual toilet
Shared/Neighbour’s toliet
Public toilet (free)
Public toilet (pay and use)
Open area (field/river/street/bushes etc.)
1
2
3
4
5
If code
other
than
1or 2
Ask
F2,
and
go to
24 Appendix 2
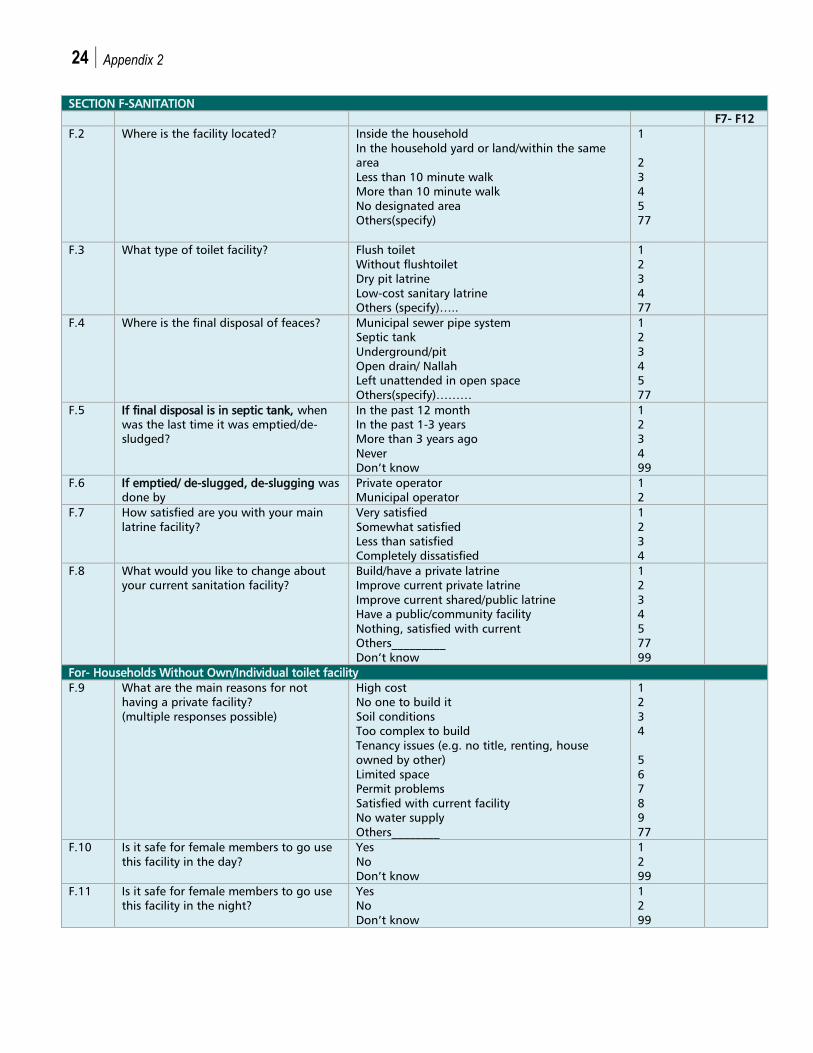
SECTION F-SANITATION
F7- F12
F.2 Where is the facility located?
Inside the household
In the household yard or land/within the same
area
Less than 10 minute walk
More than 10 minute walk
No designated area
Others(specify)
1
2
3
4
5
77
F.3 What type of toilet facility?
Flush toilet
Without flushtoilet
Dry pit latrine
Low-cost sanitary latrine
Others (specify)…..
1
2
3
4
77
F.4 Where is the final disposal of feaces? Municipal sewer pipe system
Septic tank
Underground/pit
Open drain/ Nallah
Left unattended in open space
Others(specify)………
1
2
3
4
5
77
F.5 If final disposal is in septic tank, when
was the last time it was emptied/de-
sludged?
In the past 12 month
In the past 1-3 years
More than 3 years ago
Never
Don’t know
1
2
3
4
99
F.6 If emptied/ de-slugged, de-slugging was
done by
Private operator
Municipal operator
1
2
F.7 How satisfied are you with your main
latrine facility?
Very satisfied
Somewhat satisfied
Less than satisfied
Completely dissatisfied
1
2
3
4
F.8 What would you like to change about
your current sanitation facility?
Build/have a private latrine
Improve current private latrine
Improve current shared/public latrine
Have a public/community facility
Nothing, satisfied with current
Others_________
Don’t know
1
2
3
4
5
77
99
For- Households Without Own/Individual toilet facility
F.9 What are the main reasons for not
having a private facility?
(multiple responses possible)
High cost
No one to build it
Soil conditions
Too complex to build
Tenancy issues (e.g. no title, renting, house
owned by other)
Limited space
Permit problems
Satisfied with current facility
No water supply
Others________
1
2
3
4
5
6
7
8
9
77
F.10 Is it safe for female members to go use
this facility in the day?
Yes
No
Don’t know
1
2
99
F.11 Is it safe for female members to go use
this facility in the night?
Yes
No
Don’t know
1
2
99
Questionnaire 25
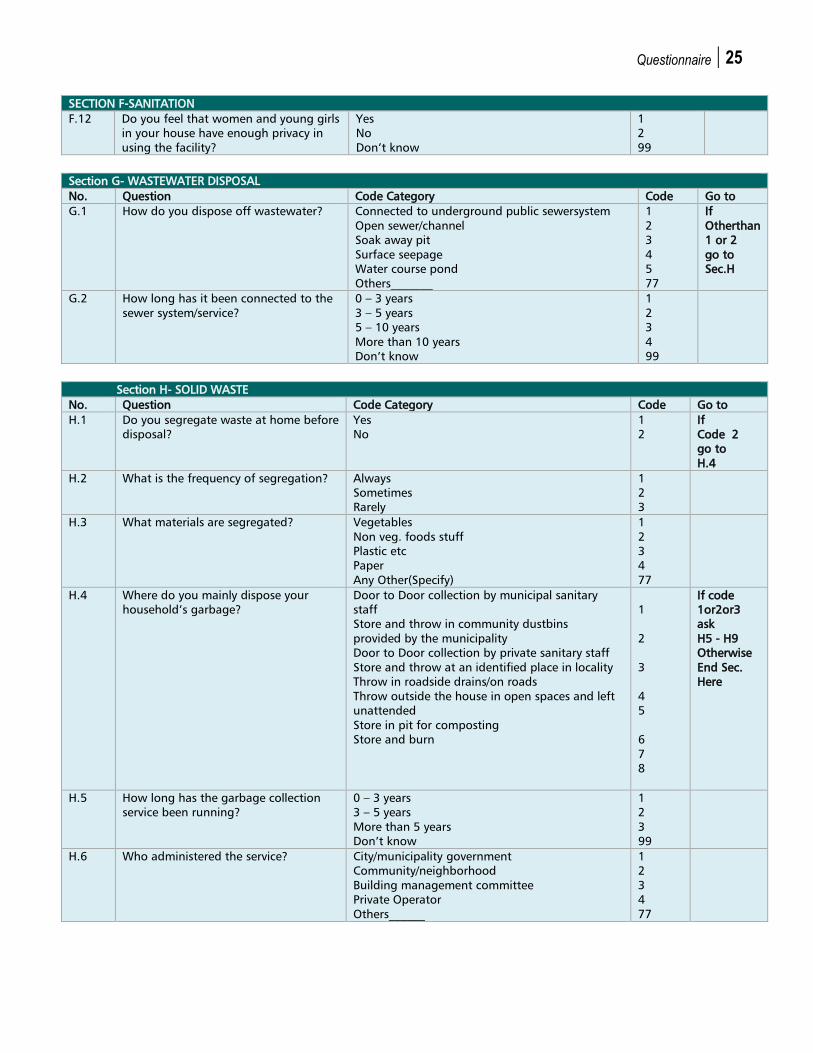
SECTION F-SANITATION
F.12 Do you feel that women and young girls
in your house have enough privacy in
using the facility?
Yes
No
Don’t know
1
2
99
Section G- WASTEWATER DISPOSAL
No. Question Code Category Code Go to
G.1 How do you dispose off wastewater? Connected to underground public sewersystem
Open sewer/channel
Soak away pit
Surface seepage
Water course pond
Others_______
1
2
3
4
5
77
If
Otherthan
1 or 2
go to
Sec.H
G.2 How long has it been connected to the
sewer system/service?
0 – 3 years
3 – 5 years
5 – 10 years
More than 10 years
Don’t know
1
2
3
4
99
Section H- SOLID WASTE
No. Question Code Category Code Go to
H.1 Do you segregate waste at home before
disposal?
Yes
No
1
2
If
Code 2
go to
H.4
H.2 What is the frequency of segregation? Always
Sometimes
Rarely
1
2
3
H.3 What materials are segregated?
Vegetables
Non veg. foods stuff
Plastic etc
Paper
Any Other(Specify)
1
2
3
4
77
H.4 Where do you mainly dispose your
household’s garbage?
Door to Door collection by municipal sanitary
staff
Store and throw in community dustbins
provided by the municipality
Door to Door collection by private sanitary staff
Store and throw at an identified place in locality
Throw in roadside drains/on roads
Throw outside the house in open spaces and left
unattended
Store in pit for composting
Store and burn
1
2
3
4
5
6
7
8
If code
1or2or3
ask
H5 - H9
Otherwise
End Sec.
Here
H.5 How long has the garbage collection
service been running?
0 – 3 years
3 – 5 years
More than 5 years
Don’t know
1
2
3
99
H.6 Who administered the service? City/municipality government
Community/neighborhood
Building management committee
Private Operator
Others______
1
2
3
4
77
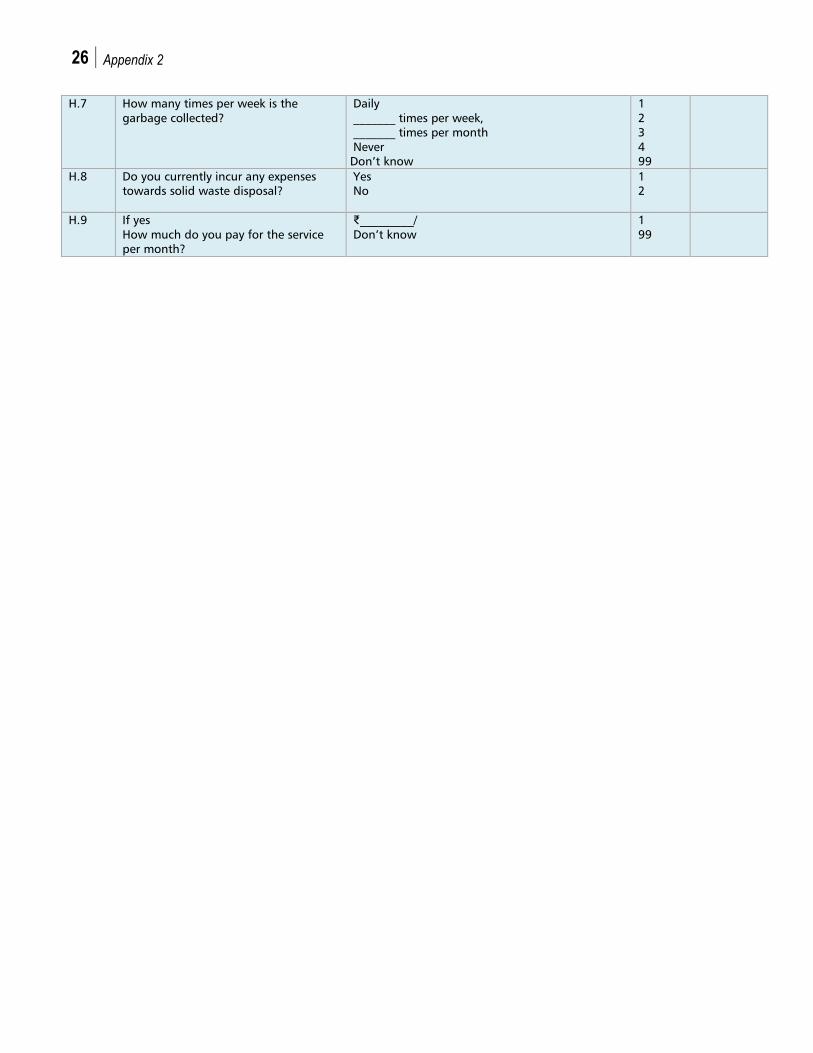
26 Appendix 2
H.7 How many times per week is the
garbage collected?
Daily
_______ times per week,
_______ times per month
Never
98. 99. Don’t know
1
2
3
4
99
H.8 Do you currently incur any expenses
towards solid waste disposal?
Yes
No
1
2
H.9 If yes
How much do you pay for the service
per month?
₹_________/
Don’t know
1
99
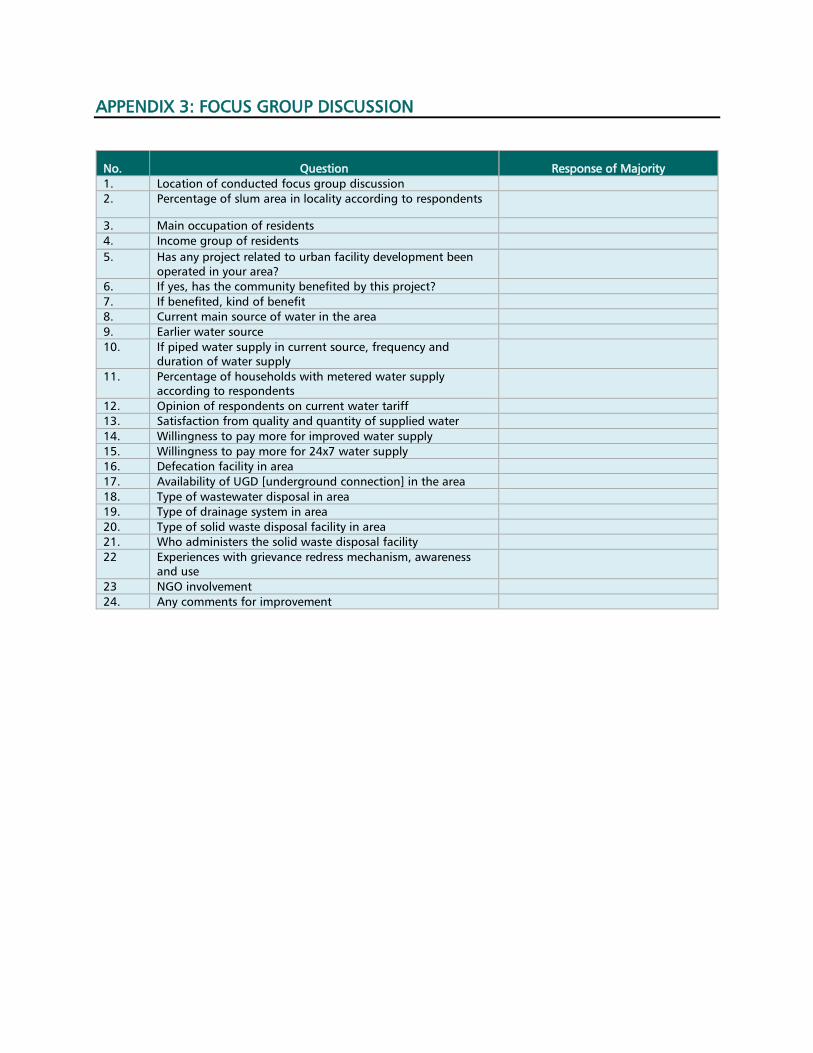
APPENDIX 3: FOCUS GROUP DISCUSSION
No. Question Response of Majority
1. Location of conducted focus group discussion
2. Percentage of slum area in locality according to respondents
3. Main occupation of residents
4. Income group of residents
5. Has any project related to urban facility development been
operated in your area?
6. If yes, has the community benefited by this project?
7. If benefited, kind of benefit
8. Current main source of water in the area
9. Earlier water source
10. If piped water supply in current source, frequency and
duration of water supply
11. Percentage of households with metered water supply
according to respondents
12. Opinion of respondents on current water tariff
13. Satisfaction from quality and quantity of supplied water
14. Willingness to pay more for improved water supply
15. Willingness to pay more for 24x7 water supply
16. Defecation facility in area
17. Availability of UGD [underground connection] in the area
18. Type of wastewater disposal in area
19. Type of drainage system in area
20. Type of solid waste disposal facility in area
21. Who administers the solid waste disposal facility
22
Experiences with grievance redress mechanism, awareness
and use
23 NGO involvement
24. Any comments for improvement