Embed Size (px)
Citation preview
Benefits of Leapfrogging to Superefficiency and Low Global Warming Potential Refrigerants in Room Air Conditioning
Nihar Shah, Max Wei, Virginie Letschert, Amol Phadke
Energy Technologies Area October 2015
This work performed through the U.S. Department of Energy under Lawrence Berkeley National Laboratory Contract No. DE-AC02- 05CH11231.
ERNEST ORLANDO LAWRENCE BERKELEY NATIONAL LABORATORY
LBNL-1003671
Disclaimer
While this document is believed to contain correct information, neither the Regents of the University of California, nor any of their employees, makes any warranty, express or implied, or assumes any legal responsibility for the accuracy, completeness, or usefulness of any information, apparatus, product, or process disclosed, or represents that its use would not infringe privately owned rights. Reference herein to any specific commercial product, process, or service by its trade name, trademark, manufacturer, or otherwise, does not necessarily constitute or imply its endorsement, recommendation, or favoring by the Regents of the University of California. The views and opinions of authors expressed herein do not necessarily state or reflect those of The Regents of the University of California. Ernest Orlando Lawrence Berkeley National Laboratory is an equal opportunity employer.
i
Benefits of Leapfrogging to Superefficiency and Low Global Warming Potential Refrigerants in Room Air Conditioning
Nihar Shah, Max Wei, Virginie Letschert, Amol Phadke
Ernest Orlando Lawrence Berkeley National Laboratory 1 Cyclotron Road, MS 90R4000
Berkeley CA 94720-8136
October 2015
ii
Acknowledgements
The authors would like to thank Omar Abdulaziz (Oak Ridge National Laboratory, USA), Stephen O. Andersen (IGSD), Steve Kujak (Ingersoll Rand/Trane, USA), Vaibhav Chaturvedi (Council on Energy, Environment and Water, CEEW, India), Rajendra Shende (TERRE Policy Center, India), Suely Carvalho (Instituto de Pesquisas Tecnológicas e Nucleares, IPEN, Brazil), Glenn Gallagher (California Air Resources Board, USA) and Karim Amrane (Airconditioning Heating and Refrigeration Institute, AHRI) for peer review of this work and providing very useful and constructive suggestions and comments.
iii
Table of Contents
Acknowledgements ....................................................................................................................... ii
Table of Contents .......................................................................................................................... iii
List of Figures and Tables ............................................................................................................. v
Abstract .......................................................................................................................................... v
Executive Summary ....................................................................................................................... 1 Significant Air Conditioner Market Growth .......................................................................... 1 Significant Peak Load Impact from Air Conditioning ........................................................... 2 Interest in Phasing Down HFC Refrigerants ......................................................................... 2 AHRI low-GWP Alternate Refrigerant Evaluation Program (AREP) ................................... 4 Efficient Air Conditioners Are Commercially Available ....................................................... 5 Methodology ............................................................................................................................ 6 Significant Emissions Abatement Potential From Efficiency Improvement and
Refrigerant Transition in Parallel ................................................................................ 7 Significant Peak Load Reduction and Avoided Power Generation...................................... 9
1. Introduction ............................................................................................................................. 1
Scope .............................................................................................................................................. 3
2. Base Case, Data and Methodology ......................................................................................... 5 Refrigerant Performance Data ............................................................................................... 5 Efficiency Improvement Data ................................................................................................. 6 Methodology ............................................................................................................................ 6
3. Alternate Low-GWP Refrigerants .......................................................................................... 9
4. Refrigerant Charge, Leakage and End-of-Life Loss ............................................................ 14 Refrigerant Charge size ......................................................................................................... 14 Refrigerant Leakage and End of Life Charge loss ............................................................... 14
5. National and Global Market Analysis ................................................................................... 16
6. Energy Use Analysis .............................................................................................................. 19
7. Electricity Grid CO2 Intensity ............................................................................................... 21
8. Results .................................................................................................................................... 23
iv
Emissions Abatement ........................................................................................................... 23 Peak Load Reduction ............................................................................................................. 28
9. Conclusion .............................................................................................................................. 31
References .................................................................................................................................... 33
Appendix A: Sensitivity Analysis ................................................................................................ 38
v
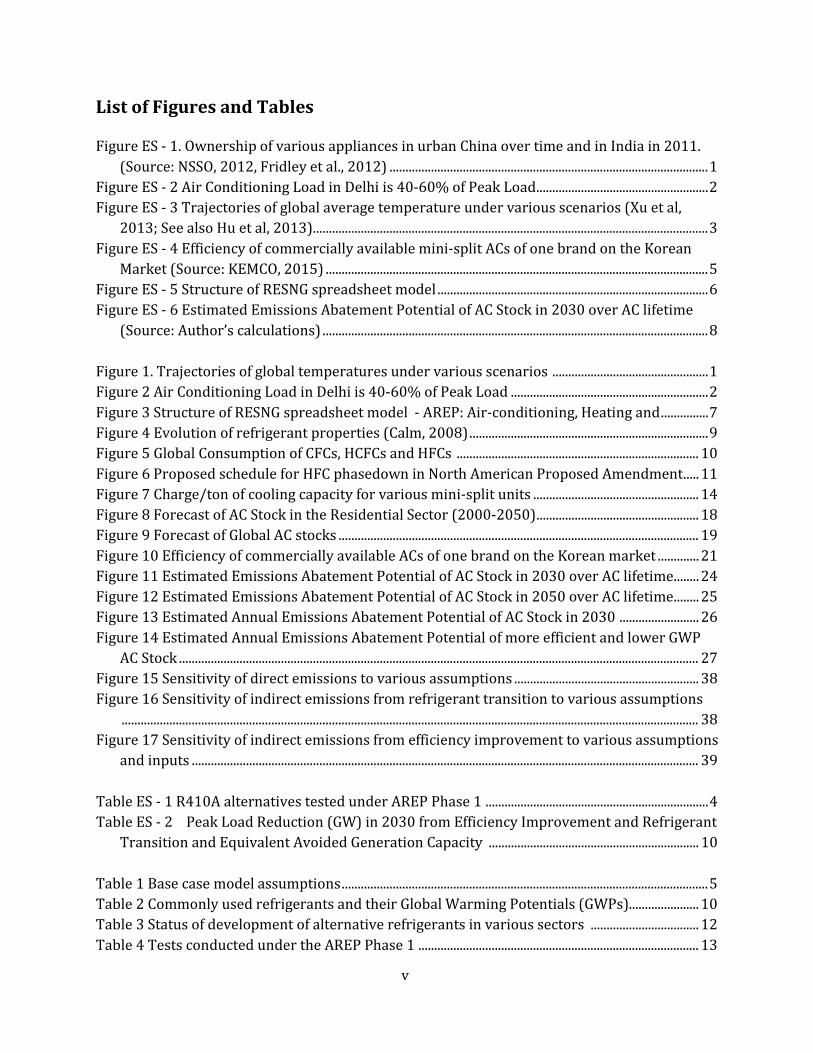
List of Figures and Tables
Figure ES - 1. Ownership of various appliances in urban China over time and in India in 2011. (Source: NSSO, 2012, Fridley et al., 2012) .................................................................................................... 1
Figure ES - 2 Air Conditioning Load in Delhi is 40-60% of Peak Load ...................................................... 2 Figure ES - 3 Trajectories of global average temperature under various scenarios (Xu et al,
2013; See also Hu et al, 2013)............................................................................................................................ 3 Figure ES - 4 Efficiency of commercially available mini-split ACs of one brand on the Korean
Market (Source: KEMCO, 2015) ........................................................................................................................ 5 Figure ES - 5 Structure of RESNG spreadsheet model ..................................................................................... 6 Figure ES - 6 Estimated Emissions Abatement Potential of AC Stock in 2030 over AC lifetime
(Source: Author’s calculations) ......................................................................................................................... 8 Figure 1. Trajectories of global temperatures under various scenarios ................................................. 1 Figure 2 Air Conditioning Load in Delhi is 40-60% of Peak Load .............................................................. 2 Figure 3 Structure of RESNG spreadsheet model - AREP: Air-conditioning, Heating and ............... 7 Figure 4 Evolution of refrigerant properties (Calm, 2008) ........................................................................... 9 Figure 5 Global Consumption of CFCs, HCFCs and HFCs ............................................................................ 10 Figure 6 Proposed schedule for HFC phasedown in North American Proposed Amendment ..... 11 Figure 7 Charge/ton of cooling capacity for various mini-split units .................................................... 14 Figure 8 Forecast of AC Stock in the Residential Sector (2000-2050) ................................................... 18 Figure 9 Forecast of Global AC stocks ................................................................................................................. 19 Figure 10 Efficiency of commercially available ACs of one brand on the Korean market ............. 21 Figure 11 Estimated Emissions Abatement Potential of AC Stock in 2030 over AC lifetime ........ 24 Figure 12 Estimated Emissions Abatement Potential of AC Stock in 2050 over AC lifetime ........ 25 Figure 13 Estimated Annual Emissions Abatement Potential of AC Stock in 2030 ......................... 26 Figure 14 Estimated Annual Emissions Abatement Potential of more efficient and lower GWP
AC Stock ................................................................................................................................................................... 27 Figure 15 Sensitivity of direct emissions to various assumptions .......................................................... 38 Figure 16 Sensitivity of indirect emissions from refrigerant transition to various assumptions
..................................................................................................................................................................................... 38 Figure 17 Sensitivity of indirect emissions from efficiency improvement to various assumptions
and inputs ............................................................................................................................................................... 39 Table ES - 1 R410A alternatives tested under AREP Phase 1 ...................................................................... 4 Table ES - 2 Peak Load Reduction (GW) in 2030 from Efficiency Improvement and Refrigerant
Transition and Equivalent Avoided Generation Capacity .................................................................. 10 Table 1 Base case model assumptions ................................................................................................................... 5 Table 2 Commonly used refrigerants and their Global Warming Potentials (GWPs)...................... 10 Table 3 Status of development of alternative refrigerants in various sectors .................................. 12 Table 4 Tests conducted under the AREP Phase 1 ........................................................................................ 13
iv
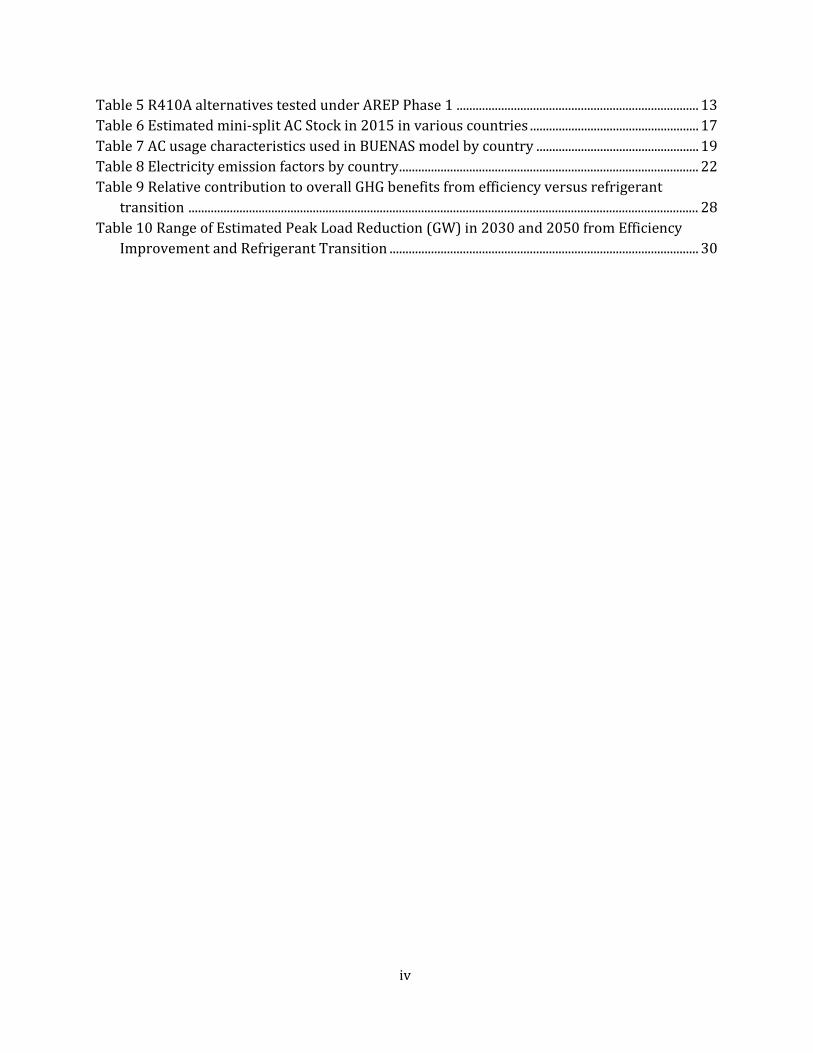
Table 5 R410A alternatives tested under AREP Phase 1 ............................................................................ 13 Table 6 Estimated mini-split AC Stock in 2015 in various countries ..................................................... 17 Table 7 AC usage characteristics used in BUENAS model by country ................................................... 19 Table 8 Electricity emission factors by country .............................................................................................. 22 Table 9 Relative contribution to overall GHG benefits from efficiency versus refrigerant
transition ................................................................................................................................................................ 28 Table 10 Range of Estimated Peak Load Reduction (GW) in 2030 and 2050 from Efficiency
Improvement and Refrigerant Transition ................................................................................................. 30
v
Abstract
Hydrofluorocarbons (HFCs) emitted from uses such as refrigerants and thermal insulating foam, are now the fastest growing greenhouse gases (GHGs), with global warming potentials (GWP) thousands of times higher than carbon dioxide (CO2). Because of the short lifetime of these molecules in the atmosphere,1 mitigating the amount of these short-lived climate pollutants (SLCPs) provides a faster path to climate change mitigation than control of CO2 alone. This has led to proposals from Africa, Europe, India, Island States, and North America to amend the Montreal Protocol on Substances that Deplete the Ozone Layer (Montreal Protocol) to phase-down high-GWP HFCs. Simultaneously, energy efficiency market transformation programs such as standards, labeling and incentive programs are endeavoring to improve the energy efficiency for refrigeration and air conditioning equipment to provide life cycle cost, energy, GHG, and peak load savings. In this paper we provide an estimate of the magnitude of such GHG and peak electric load savings potential, for room air conditioning, if the refrigerant transition and energy efficiency improvement policies are implemented either separately or in parallel. We find that implementing HFC refrigerant transition and energy efficiency improvement policies in parallel for room air conditioning, roughly doubles the benefit of either policy implemented separately. We estimate that shifting the 2030 world stock of room air conditioners from the low efficiency technology using high-GWP refrigerants to higher efficiency technology and low-GWP refrigerants in parallel would save between 340-790 gigawatts (GW) of peak load globally, which is roughly equivalent to avoiding 680-1550 peak power plants of 500MW each. This would save 0.85 GT/year annually in China equivalent to over 8 Three Gorges dams and over 0.32 GT/year annually in India equivalent to roughly twice India’s 100GW solar mission target. While there is some uncertainty associated with emissions and growth projections, moving to efficient room air conditioning (~30% more efficient than current technology) in parallel with low-GWP refrigerants in room air conditioning could avoid upto ~25 billion tonnes of CO2 in 2030, ~33 billion in 2040, and ~40 billion in 2050, i.e. cumulative savings upto 98 billion tonnes of CO2 by 2050. Therefore, superefficient room ACs using low-GWP refrigerants merit serious consideration to maximize peak load reduction and GHG savings.
1 HFCs, methane, black carbon, and tropospheric ozone are classified as “short-lived climate pollutants” (SLCPs) because they have relatively short lifetime in the atmosphere - a few days to a decade and a half for the most commonly used HFCs.
ES-1
Executive Summary
Significant Room Air Conditioner Market Growth
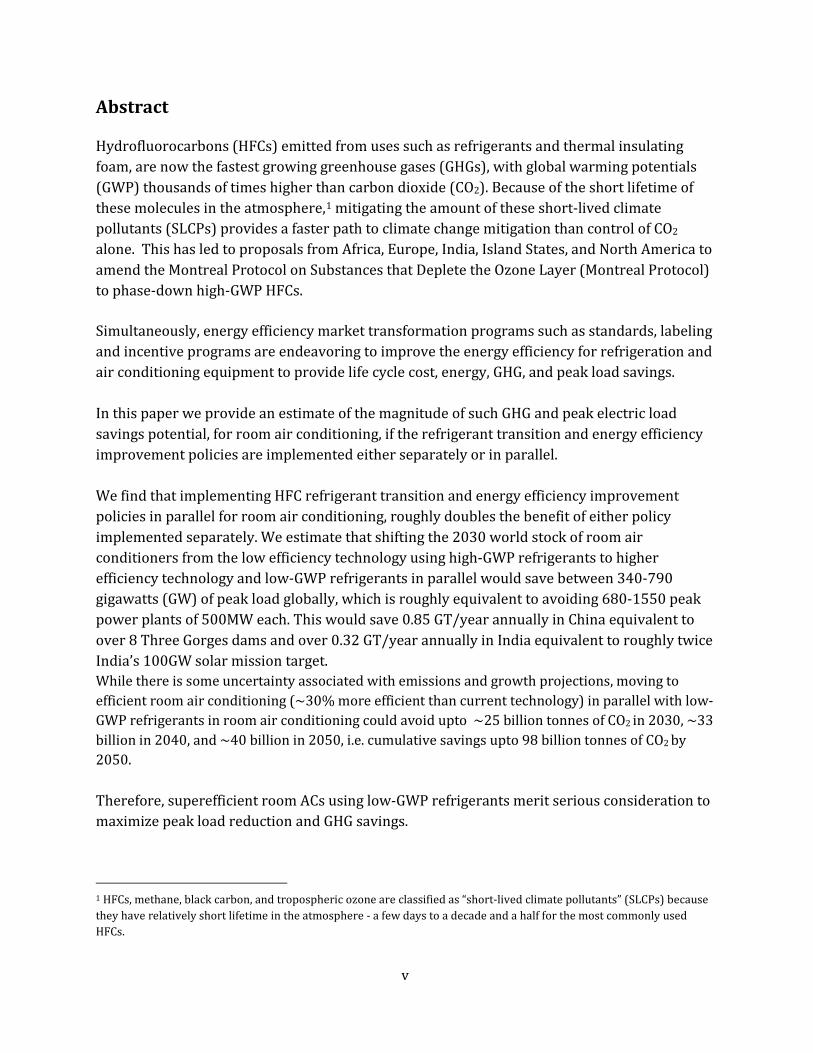
The world room air conditioner market is growing rapidly with increasing population, urbanization and electrification, and rising incomes. As shown in figure ES-1 room air-conditioner ownership in urban China went from a few percent to over 100% i.e. more than one room air conditioner (AC) per urban household, in about 15 years. Growth in sales continues in China with urbanization and with market penetration in non-urban areas.
Figure ES - 1. Ownership of various appliances in urban China over time and in India in 2011. (Source: NSSO, 2012, Fridley et al., 2012) Air conditioner sales in many emerging high population economies such as Brazil, India, and Indonesia are growing at 10-15% per year (Shah et al, 2013, BSRIA, 2014) and current penetration rates are still low. For example, Figure ES-1 shows the levels of AC penetration in India in 2011 at about 5%. These trends along with urbanization, electrification, increasing incomes and falling air conditioner prices are expected to have a large-scale impact on needed electricity generation capacity and peak load, particularly in economies with large populations and hot climates.
0
20
40
60
80
100
120
140
1981 1986 1991 1996 2001 2006 2011
Ow
ners
hip:
N
umbe
r of U
nits
per
100
Urb
an H
ouse
hold
s
Clothes Washers
Color TVs
Refrigerators
Room Air Conditioners
India2011
ES-2
Significant Peak Load Impact from Air Conditioning
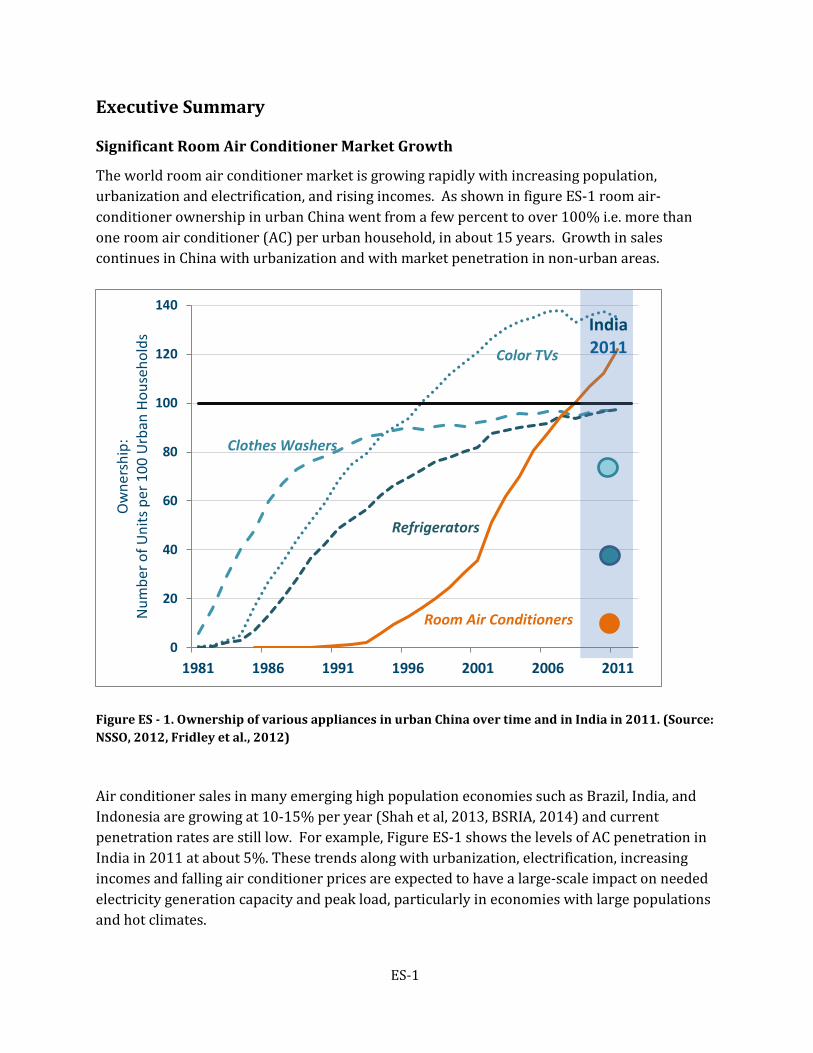
Energy efficiency market transformation programs are working to improve the energy efficiency for air conditioning equipment to provide life cycle cost, energy, GHG, and peak load savings (DOE, 2011, EuP, 2009). Air conditioning represents about 30% of current and forecasted summer load in warm climates such as California, about 40-60% of the total load in hot climates on typical summer days in metropolitan areas like Delhi, India compared to typical winter days (as shown in figure ES-2) and can even triple summer load in very hot areas such as New South Wales, Australia. (Itron and LBNL, 2012; DSLDC, 2012; Smith et al, 2013)
Figure ES - 2 Air Conditioning Load in Delhi is 40-60% of Peak Load (Source: Delhi State Load Dispatch Center (DSLDC), 2012) Interest in Phasing Down HFC Refrigerants
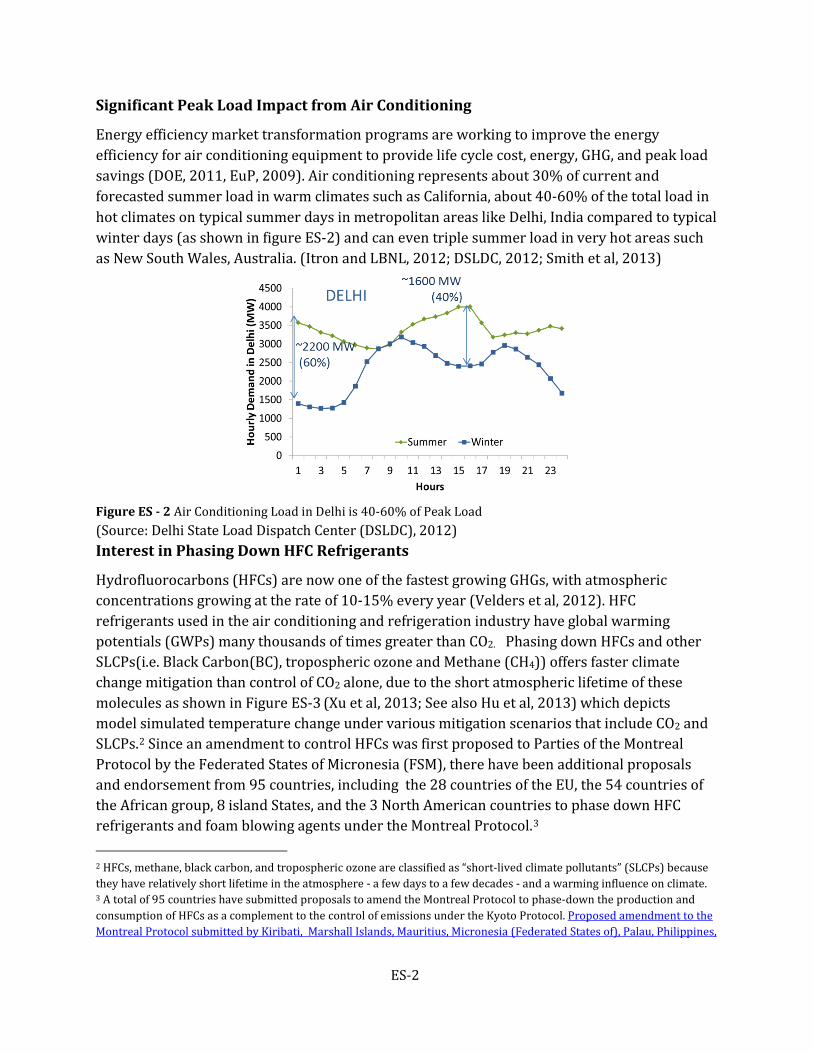
Hydrofluorocarbons (HFCs) are now one of the fastest growing GHGs, with atmospheric concentrations growing at the rate of 10-15% every year (Velders et al, 2012). HFC refrigerants used in the air conditioning and refrigeration industry have global warming potentials (GWPs) many thousands of times greater than CO2. Phasing down HFCs and other SLCPs(i.e. Black Carbon(BC), tropospheric ozone and Methane (CH4)) offers faster climate change mitigation than control of CO2 alone, due to the short atmospheric lifetime of these molecules as shown in Figure ES-3 (Xu et al, 2013; See also Hu et al, 2013) which depicts model simulated temperature change under various mitigation scenarios that include CO2 and SLCPs.2 Since an amendment to control HFCs was first proposed to Parties of the Montreal Protocol by the Federated States of Micronesia (FSM), there have been additional proposals and endorsement from 95 countries, including the 28 countries of the EU, the 54 countries of the African group, 8 island States, and the 3 North American countries to phase down HFC refrigerants and foam blowing agents under the Montreal Protocol.3 2 HFCs, methane, black carbon, and tropospheric ozone are classified as “short-lived climate pollutants” (SLCPs) because they have relatively short lifetime in the atmosphere - a few days to a few decades - and a warming influence on climate. 3 A total of 95 countries have submitted proposals to amend the Montreal Protocol to phase-down the production and consumption of HFCs as a complement to the control of emissions under the Kyoto Protocol. Proposed amendment to the Montreal Protocol submitted by Kiribati, Marshall Islands, Mauritius, Micronesia (Federated States of), Palau, Philippines,
ES-3
Figure ES - 3 Trajectories of global average temperature under various scenarios (Xu et al, 2013; See also Hu et al, 2013) As shown in figure ES-3, staying below 2 degrees C of global average temperature rise will require action on both CO2 mitigation and on mitigation of HFCs and other SLCPs. Phasing down high-GWP HFCs is calculated to provide 100 (87-146) GT-CO2-eq emissions reduction by 20504, and to avoid up to 0.5°C of warming by 2100.5 In addition, given the large and significant impacts of air conditioning on peak load and electricity consumption, in this report, we quantify the GHG reduction benefits of air conditioner efficiency improvement and of switching these air conditioners to low-GWP refrigerants, to illuminate a pathway for both CO2 mitigation and SLCP mitigation. We present the GHG benefits of implementing these policies both separately and in parallel for room ACs. Samoa and Solomon Islands, UNEP/OzL.Pro.WG.1/36/6 (30 April 2015);Proposed amendment to the Montreal Protocol submitted by the Federated States of Micronesia proposed amendment to the Montreal Protocol submitted by Canada, Mexico and the United States of America, UNEP/OzL.Pro.WG.1/35/3 (8 March 2015); and proposed amendment to the Montreal Protocol submitted by India, UNEP/OzL.Pro.WG.1/35/4 (17 April 2015). The Africa group of 54 countries also submitted a proposal in the form of a conference room paper. Process to regulate the production and consumption of hydrofluorocarbons under the Montreal Protocol on Substances that Deplete the Ozone Layer – Submission by Zimbabwe and Senegal on behalf of Africa States, UNEP/OzL.Pro.WG.1/35/CRP.1 (20 April 2015). 4 Velders, G. J. M. et al. (2009) The large contribution of projected HFC emissions to future climate forcing, PROC. NAT’L. ACAD. SCI. U.S.A. 106:10949-10954; and Velders G. J. M., et al. (2014) Growth of climate change commitments from HFC banks and emissions, ATMOS. CHEM. PHYS. DISCUSS. 14:4563-4572. 5 Xu Y., Zaelke D., Velders G. J. M., & Ramanathan V. (2013) The role of HFCs in mitigating 21st century climate change, ATMOS. CHEM. PHYS., 13:6083-6089; see also Hare, B. et al. (2013) CLOSING THE 2020 EMISSIONS GAP: ISSUES, OPTIONS AND
STRATEGIES.
ES-4
AHRI low-GWP Alternate Refrigerant Evaluation Program (AREP)
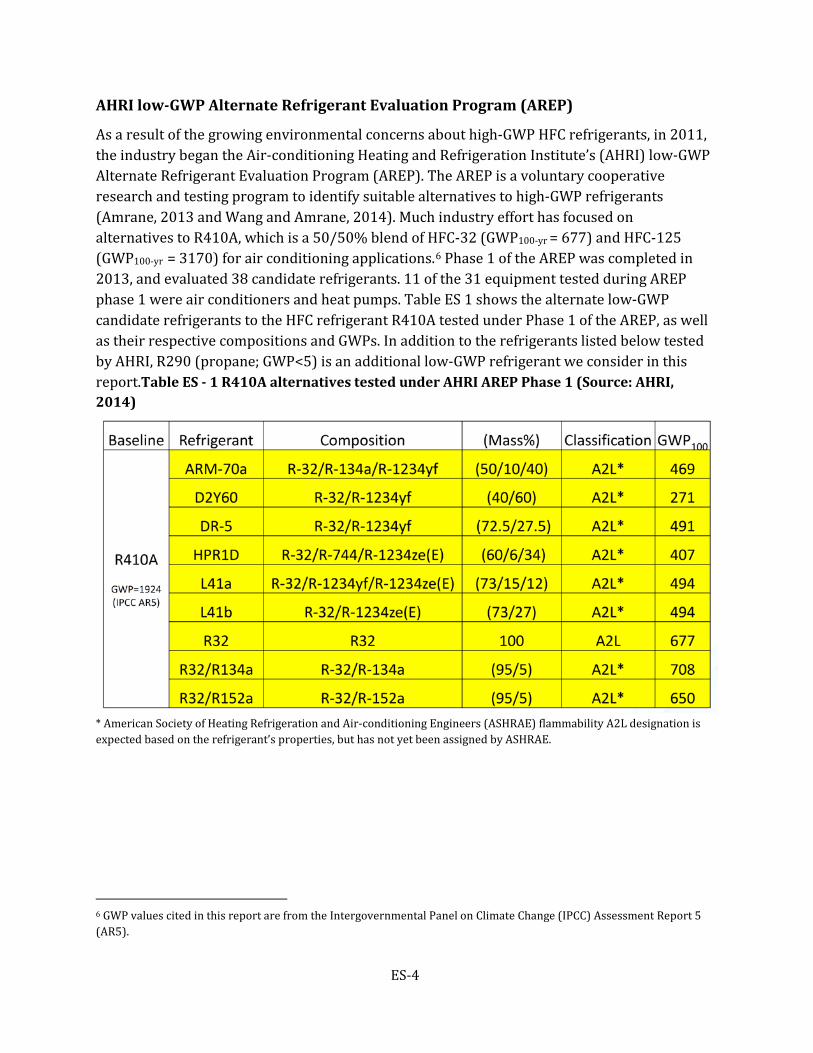
As a result of the growing environmental concerns about high-GWP HFC refrigerants, in 2011, the industry began the Air-conditioning Heating and Refrigeration Institute’s (AHRI) low-GWP Alternate Refrigerant Evaluation Program (AREP). The AREP is a voluntary cooperative research and testing program to identify suitable alternatives to high-GWP refrigerants (Amrane, 2013 and Wang and Amrane, 2014). Much industry effort has focused on alternatives to R410A, which is a 50/50% blend of HFC-32 (GWP100-yr = 677) and HFC-125 (GWP100-yr = 3170) for air conditioning applications.6 Phase 1 of the AREP was completed in 2013, and evaluated 38 candidate refrigerants. 11 of the 31 equipment tested during AREP phase 1 were air conditioners and heat pumps. Table ES 1 shows the alternate low-GWP candidate refrigerants to the HFC refrigerant R410A tested under Phase 1 of the AREP, as well as their respective compositions and GWPs. In addition to the refrigerants listed below tested by AHRI, R290 (propane; GWP<5) is an additional low-GWP refrigerant we consider in this report.Table ES - 1 R410A alternatives tested under AHRI AREP Phase 1 (Source: AHRI, 2014)
* American Society of Heating Refrigeration and Air-conditioning Engineers (ASHRAE) flammability A2L designation is expected based on the refrigerant’s properties, but has not yet been assigned by ASHRAE.
6 GWP values cited in this report are from the Intergovernmental Panel on Climate Change (IPCC) Assessment Report 5 (AR5).
ES-5
Efficient Air Conditioners Are Commercially Available
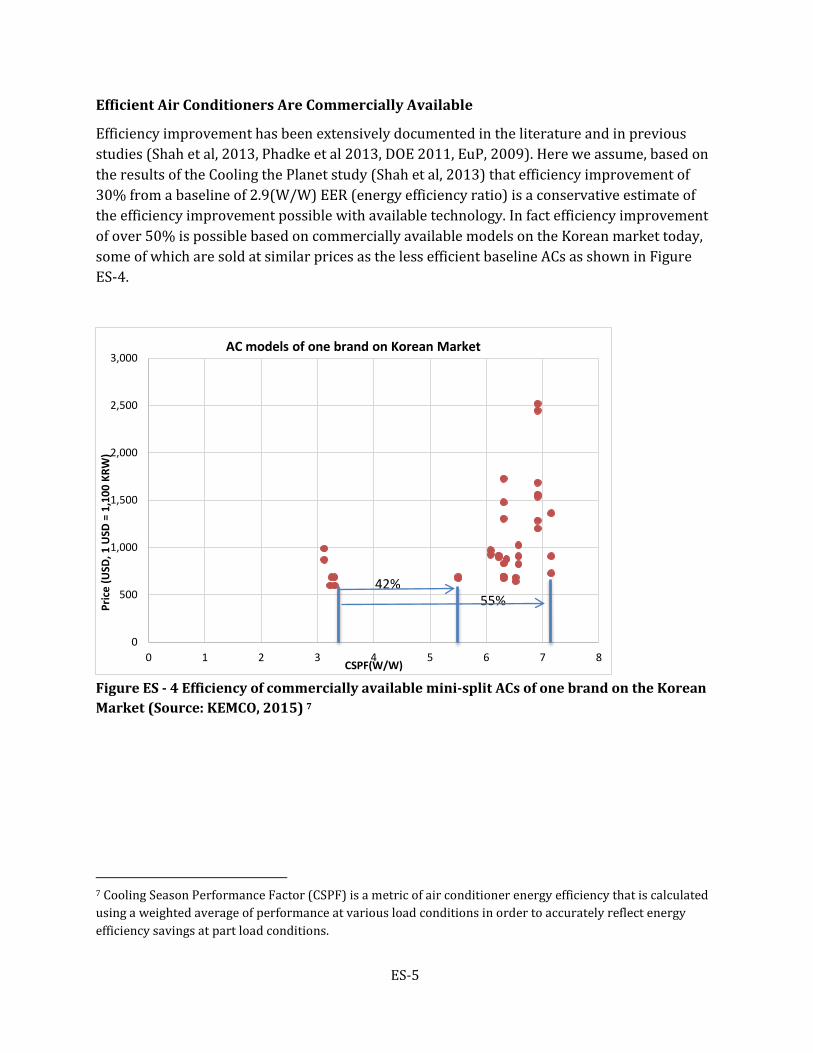
Efficiency improvement has been extensively documented in the literature and in previous studies (Shah et al, 2013, Phadke et al 2013, DOE 2011, EuP, 2009). Here we assume, based on the results of the Cooling the Planet study (Shah et al, 2013) that efficiency improvement of 30% from a baseline of 2.9(W/W) EER (energy efficiency ratio) is a conservative estimate of the efficiency improvement possible with available technology. In fact efficiency improvement of over 50% is possible based on commercially available models on the Korean market today, some of which are sold at similar prices as the less efficient baseline ACs as shown in Figure ES-4.
Figure ES - 4 Efficiency of commercially available mini-split ACs of one brand on the Korean Market (Source: KEMCO, 2015) 7
7 Cooling Season Performance Factor (CSPF) is a metric of air conditioner energy efficiency that is calculated using a weighted average of performance at various load conditions in order to accurately reflect energy efficiency savings at part load conditions.
0
500
1,000
1,500
2,000
2,500
3,000
0 1 2 3 4 5 6 7 8
Pric
e (U
SD, 1
USD
= 1
,100
KRW
)
CSPF(W/W)
AC models of one brand on Korean Market
42%55%
ES-6
Methodology
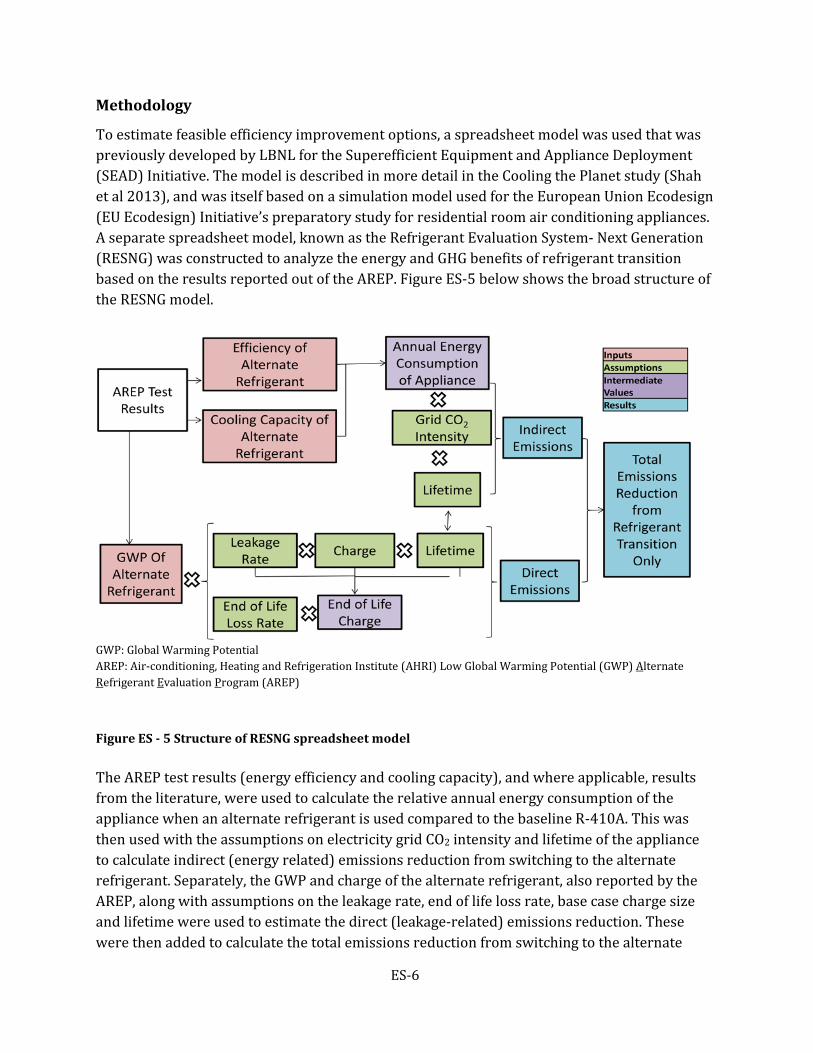
To estimate feasible efficiency improvement options, a spreadsheet model was used that was previously developed by LBNL for the Superefficient Equipment and Appliance Deployment (SEAD) Initiative. The model is described in more detail in the Cooling the Planet study (Shah et al 2013), and was itself based on a simulation model used for the European Union Ecodesign (EU Ecodesign) Initiative’s preparatory study for residential room air conditioning appliances. A separate spreadsheet model, known as the Refrigerant Evaluation System- Next Generation (RESNG) was constructed to analyze the energy and GHG benefits of refrigerant transition based on the results reported out of the AREP. Figure ES-5 below shows the broad structure of the RESNG model.
GWP: Global Warming Potential AREP: Air-conditioning, Heating and Refrigeration Institute (AHRI) Low Global Warming Potential (GWP) Alternate Refrigerant Evaluation Program (AREP) Figure ES - 5 Structure of RESNG spreadsheet model The AREP test results (energy efficiency and cooling capacity), and where applicable, results from the literature, were used to calculate the relative annual energy consumption of the appliance when an alternate refrigerant is used compared to the baseline R-410A. This was then used with the assumptions on electricity grid CO2 intensity and lifetime of the appliance to calculate indirect (energy related) emissions reduction from switching to the alternate refrigerant. Separately, the GWP and charge of the alternate refrigerant, also reported by the AREP, along with assumptions on the leakage rate, end of life loss rate, base case charge size and lifetime were used to estimate the direct (leakage-related) emissions reduction. These were then added to calculate the total emissions reduction from switching to the alternate
ES-7
refrigerant. The results from these two models (energy efficiency and transition to low-GWP refrigerants) were combined for each of the 11 countries listed on Table ES2 to give estimates of the greenhouse gas reduction benefits from:
1. Efficiency Improvement Only Cooling the Planet model results (Shah, et al, 2013).
2. Refrigerant Transition Only RESNG model results for both direct and indirect emissions from refrigerant transition.
3. Refrigerant transition and efficiency improvement implemented in parallel Combining the results of 1 and 2 above.8
Since the tests conducted by the AREP are “drop-in” or “soft-optimization” tests, the results of efficiency improvement options modeled in 1 are independent of the refrigerant transition modeled in 2. 9 Therefore, combining the results as discussed above is possible in order to show the combined effect of both policies in parallel. Significant Emissions Abatement Potential From Efficiency Improvement and Refrigerant Transition in Parallel
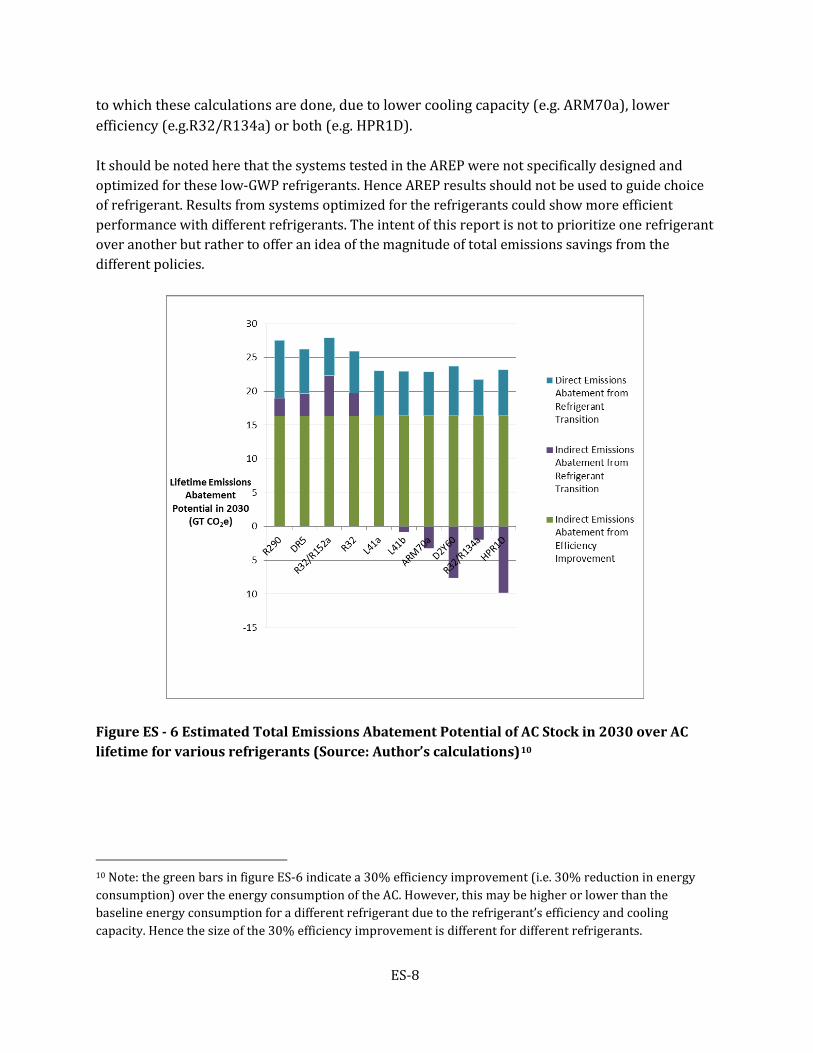
Figure ES-6 shows our estimates for emissions abatement over the lifetime of the AC if the global stock of ACs in 2030 is switched to more efficient ACs with lower GWP refrigerants could be over 25 gigatons (GT) of CO2 equivalent emissions. Note that these estimates show the emissions reduction potential that could be captured over the lifetime of the ACs for the global stock in 2030. The cumulative emissions reduction would be much higher than these estimates and would accrue even higher total benefits the earlier the policy is enacted. We find that implementing refrigerant transition and energy efficiency improvement policies in parallel for room ACs, roughly doubles the benefit of either policy implemented in isolation. Countries with higher hours of use due to higher ambient temperature or a more carbon intensive electricity grid benefit more from available improvements in energy efficiency. R32, R290 and some hydrofluoroolefin (HFO) blends such as DR5 all offer significant emissions abatement potential. Meanwhile, other HFO blends, offer reduction in emissions due to lower GWP, but increase indirect emissions compared to the baseline R410A, with respect
8 Note: results for the policies enacted in parallel are lower than simple addition of the results for the policies in isolation simply because the results are multiplicative and not additive. i.e. the results from efficiency improvement are multiplied to the results from refrigerant transition. For example an efficiency improvement of 30% along with a 5% improvement in efficiency from refrigerant transition will result in a 33.5% reduction in energy consumption as follows:[1-(1-0.3)x(1-0.05)]=[1-0.7x0.95]=1-0.665=0.335. 9 Soft optimization testing refers to tests done on systems that are modified for the alternate refrigerants using standard production-line components. It should be noted here that the systems tested in the AREP were not specifically designed and optimized for these low-GWP refrigerants. Results from systems optimized for the refrigerants could show more efficient performance with different refrigerants.
ES-8
to which these calculations are done, due to lower cooling capacity (e.g. ARM70a), lower efficiency (e.g.R32/R134a) or both (e.g. HPR1D). It should be noted here that the systems tested in the AREP were not specifically designed and optimized for these low-GWP refrigerants. Hence AREP results should not be used to guide choice of refrigerant. Results from systems optimized for the refrigerants could show more efficient performance with different refrigerants. The intent of this report is not to prioritize one refrigerant over another but rather to offer an idea of the magnitude of total emissions savings from the different policies.
Figure ES - 6 Estimated Total Emissions Abatement Potential of AC Stock in 2030 over AC lifetime for various refrigerants (Source: Author’s calculations)10
10 Note: the green bars in figure ES-6 indicate a 30% efficiency improvement (i.e. 30% reduction in energy consumption) over the energy consumption of the AC. However, this may be higher or lower than the baseline energy consumption for a different refrigerant due to the refrigerant’s efficiency and cooling capacity. Hence the size of the 30% efficiency improvement is different for different refrigerants.
ES-9
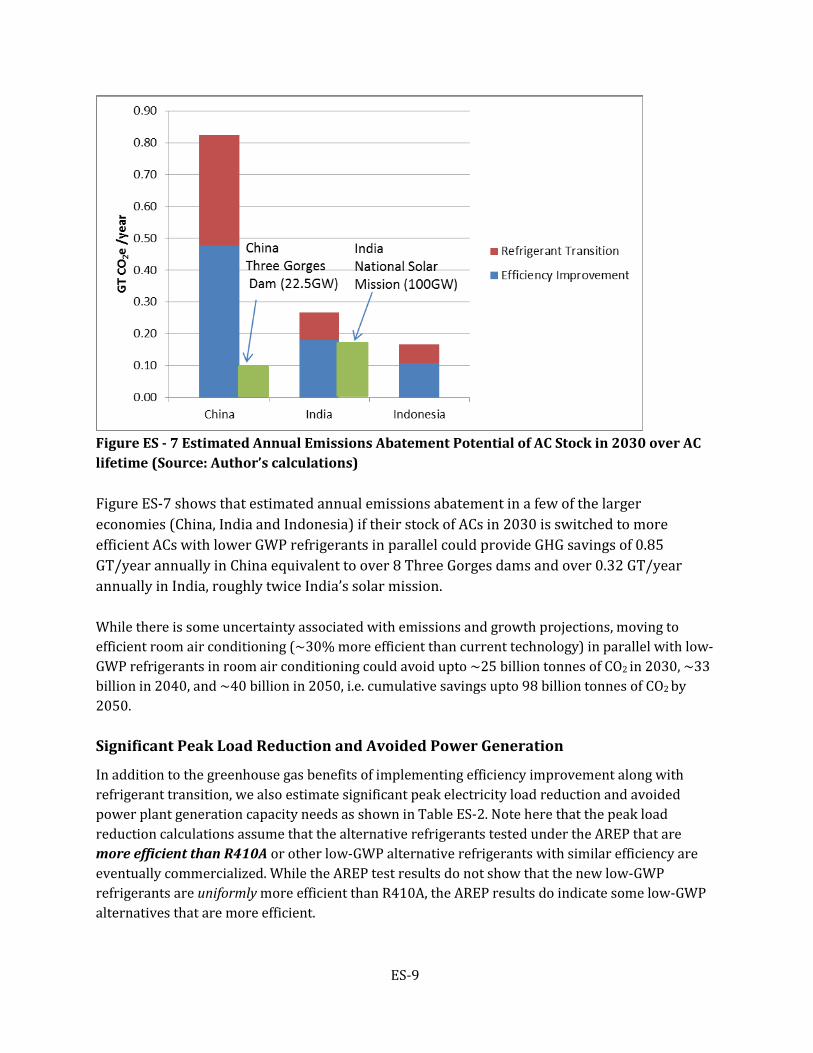
Figure ES - 7 Estimated Annual Emissions Abatement Potential of AC Stock in 2030 over AC lifetime (Source: Author’s calculations) Figure ES-7 shows that estimated annual emissions abatement in a few of the larger economies (China, India and Indonesia) if their stock of ACs in 2030 is switched to more efficient ACs with lower GWP refrigerants in parallel could provide GHG savings of 0.85 GT/year annually in China equivalent to over 8 Three Gorges dams and over 0.32 GT/year annually in India, roughly twice India’s solar mission. While there is some uncertainty associated with emissions and growth projections, moving to efficient room air conditioning (~30% more efficient than current technology) in parallel with low-GWP refrigerants in room air conditioning could avoid upto ~25 billion tonnes of CO2 in 2030, ~33 billion in 2040, and ~40 billion in 2050, i.e. cumulative savings upto 98 billion tonnes of CO2 by 2050. Significant Peak Load Reduction and Avoided Power Generation
In addition to the greenhouse gas benefits of implementing efficiency improvement along with refrigerant transition, we also estimate significant peak electricity load reduction and avoided power plant generation capacity needs as shown in Table ES-2. Note here that the peak load reduction calculations assume that the alternative refrigerants tested under the AREP that are more efficient than R410A or other low-GWP alternative refrigerants with similar efficiency are eventually commercialized. While the AREP test results do not show that the new low-GWP refrigerants are uniformly more efficient than R410A, the AREP results do indicate some low-GWP alternatives that are more efficient.
ES-10
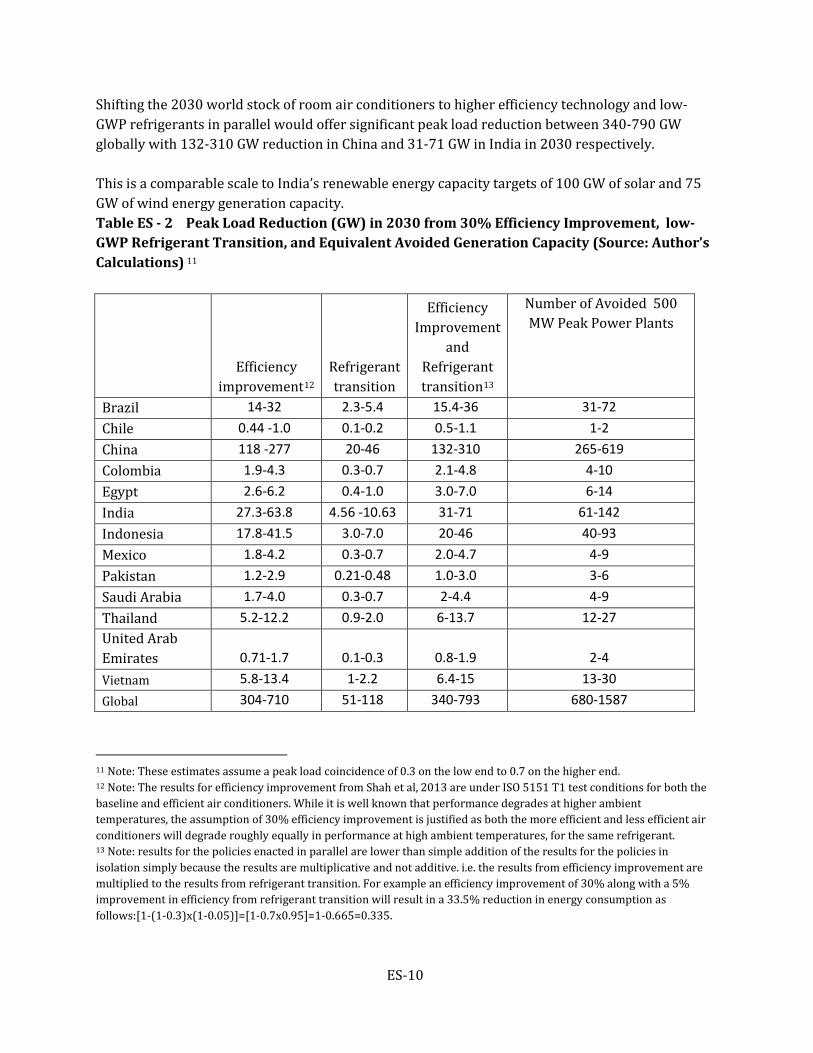
Shifting the 2030 world stock of room air conditioners to higher efficiency technology and low-GWP refrigerants in parallel would offer significant peak load reduction between 340-790 GW globally with 132-310 GW reduction in China and 31-71 GW in India in 2030 respectively. This is a comparable scale to India’s renewable energy capacity targets of 100 GW of solar and 75 GW of wind energy generation capacity. Table ES - 2 Peak Load Reduction (GW) in 2030 from 30% Efficiency Improvement, low-GWP Refrigerant Transition, and Equivalent Avoided Generation Capacity (Source: Author’s Calculations) 11
Efficiency
improvement12 Refrigerant transition
Efficiency Improvement
and Refrigerant transition13
Number of Avoided 500 MW Peak Power Plants
Brazil 14-32 2.3-5.4 15.4-36 31-72 Chile 0.44 -1.0 0.1-0.2 0.5-1.1 1-2 China 118 -277 20-46 132-310 265-619 Colombia 1.9-4.3 0.3-0.7 2.1-4.8 4-10 Egypt 2.6-6.2 0.4-1.0 3.0-7.0 6-14 India 27.3-63.8 4.56 -10.63 31-71 61-142 Indonesia 17.8-41.5 3.0-7.0 20-46 40-93 Mexico 1.8-4.2 0.3-0.7 2.0-4.7 4-9 Pakistan 1.2-2.9 0.21-0.48 1.0-3.0 3-6 Saudi Arabia 1.7-4.0 0.3-0.7 2-4.4 4-9 Thailand 5.2-12.2 0.9-2.0 6-13.7 12-27 United Arab Emirates 0.71-1.7 0.1-0.3 0.8-1.9 2-4 Vietnam 5.8-13.4 1-2.2 6.4-15 13-30 Global 304-710 51-118 340-793 680-1587
11 Note: These estimates assume a peak load coincidence of 0.3 on the low end to 0.7 on the higher end. 12 Note: The results for efficiency improvement from Shah et al, 2013 are under ISO 5151 T1 test conditions for both the baseline and efficient air conditioners. While it is well known that performance degrades at higher ambient temperatures, the assumption of 30% efficiency improvement is justified as both the more efficient and less efficient air conditioners will degrade roughly equally in performance at high ambient temperatures, for the same refrigerant. 13 Note: results for the policies enacted in parallel are lower than simple addition of the results for the policies in isolation simply because the results are multiplicative and not additive. i.e. the results from efficiency improvement are multiplied to the results from refrigerant transition. For example an efficiency improvement of 30% along with a 5% improvement in efficiency from refrigerant transition will result in a 33.5% reduction in energy consumption as follows:[1-(1-0.3)x(1-0.05)]=[1-0.7x0.95]=1-0.665=0.335.
1
1. Introduction
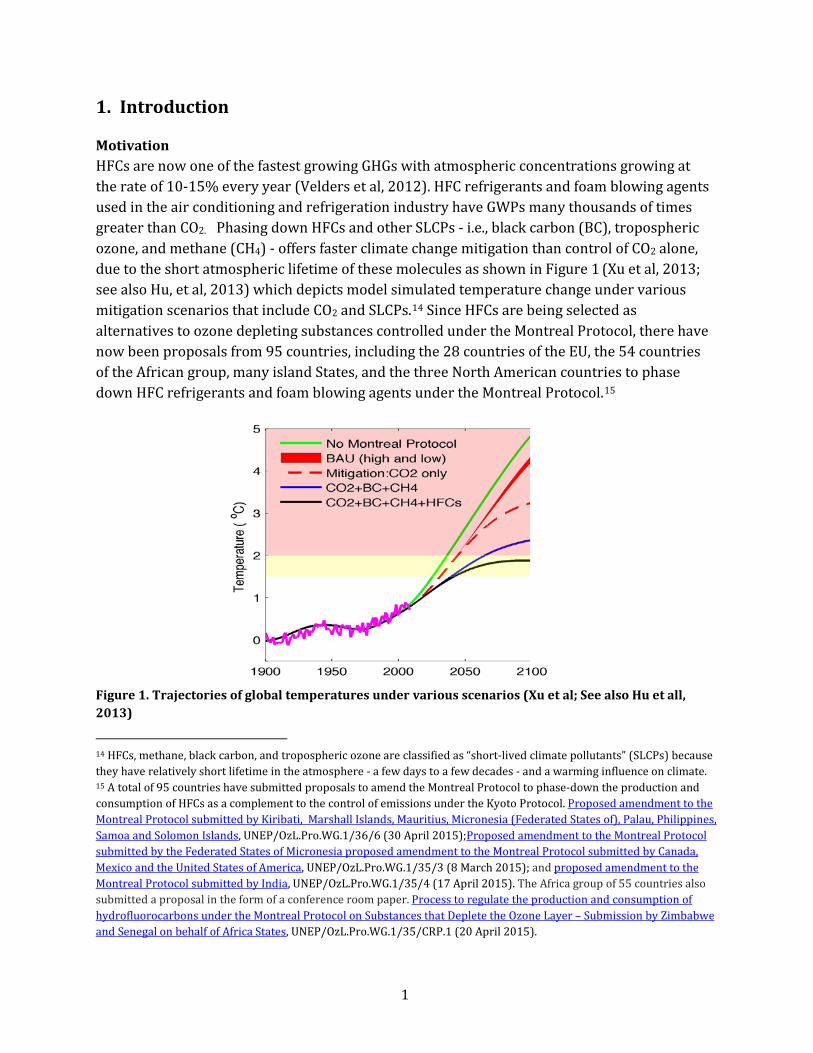
Motivation HFCs are now one of the fastest growing GHGs with atmospheric concentrations growing at the rate of 10-15% every year (Velders et al, 2012). HFC refrigerants and foam blowing agents used in the air conditioning and refrigeration industry have GWPs many thousands of times greater than CO2. Phasing down HFCs and other SLCPs - i.e., black carbon (BC), tropospheric ozone, and methane (CH4) - offers faster climate change mitigation than control of CO2 alone, due to the short atmospheric lifetime of these molecules as shown in Figure 1 (Xu et al, 2013; see also Hu, et al, 2013) which depicts model simulated temperature change under various mitigation scenarios that include CO2 and SLCPs.14 Since HFCs are being selected as alternatives to ozone depleting substances controlled under the Montreal Protocol, there have now been proposals from 95 countries, including the 28 countries of the EU, the 54 countries of the African group, many island States, and the three North American countries to phase down HFC refrigerants and foam blowing agents under the Montreal Protocol.15
Figure 1. Trajectories of global temperatures under various scenarios (Xu et al; See also Hu et all, 2013)
14 HFCs, methane, black carbon, and tropospheric ozone are classified as “short-lived climate pollutants” (SLCPs) because they have relatively short lifetime in the atmosphere - a few days to a few decades - and a warming influence on climate. 15 A total of 95 countries have submitted proposals to amend the Montreal Protocol to phase-down the production and consumption of HFCs as a complement to the control of emissions under the Kyoto Protocol. Proposed amendment to the Montreal Protocol submitted by Kiribati, Marshall Islands, Mauritius, Micronesia (Federated States of), Palau, Philippines, Samoa and Solomon Islands, UNEP/OzL.Pro.WG.1/36/6 (30 April 2015);Proposed amendment to the Montreal Protocol submitted by the Federated States of Micronesia proposed amendment to the Montreal Protocol submitted by Canada, Mexico and the United States of America, UNEP/OzL.Pro.WG.1/35/3 (8 March 2015); and proposed amendment to the Montreal Protocol submitted by India, UNEP/OzL.Pro.WG.1/35/4 (17 April 2015). The Africa group of 55 countries also submitted a proposal in the form of a conference room paper. Process to regulate the production and consumption of hydrofluorocarbons under the Montreal Protocol on Substances that Deplete the Ozone Layer – Submission by Zimbabwe and Senegal on behalf of Africa States, UNEP/OzL.Pro.WG.1/35/CRP.1 (20 April 2015).
2
As shown in figure 1, staying below 2 degrees C of global average temperature rise will require action on both CO2 mitigation and on mitigation of HFCs and other SLCPs. Phasing down high-GWP HFCs is calculated to provide 100 (87-146) GT-CO2-eq emissions reduction by 205016, and to avoid up to 0.5°C of warming by 2100.17 Simultaneously, energy efficiency market transformation programs such as standards, labeling and incentive programs are endeavoring to improve the energy efficiency for refrigeration and air conditioning equipment. These two related opportunities motivate this technical brief as follows:
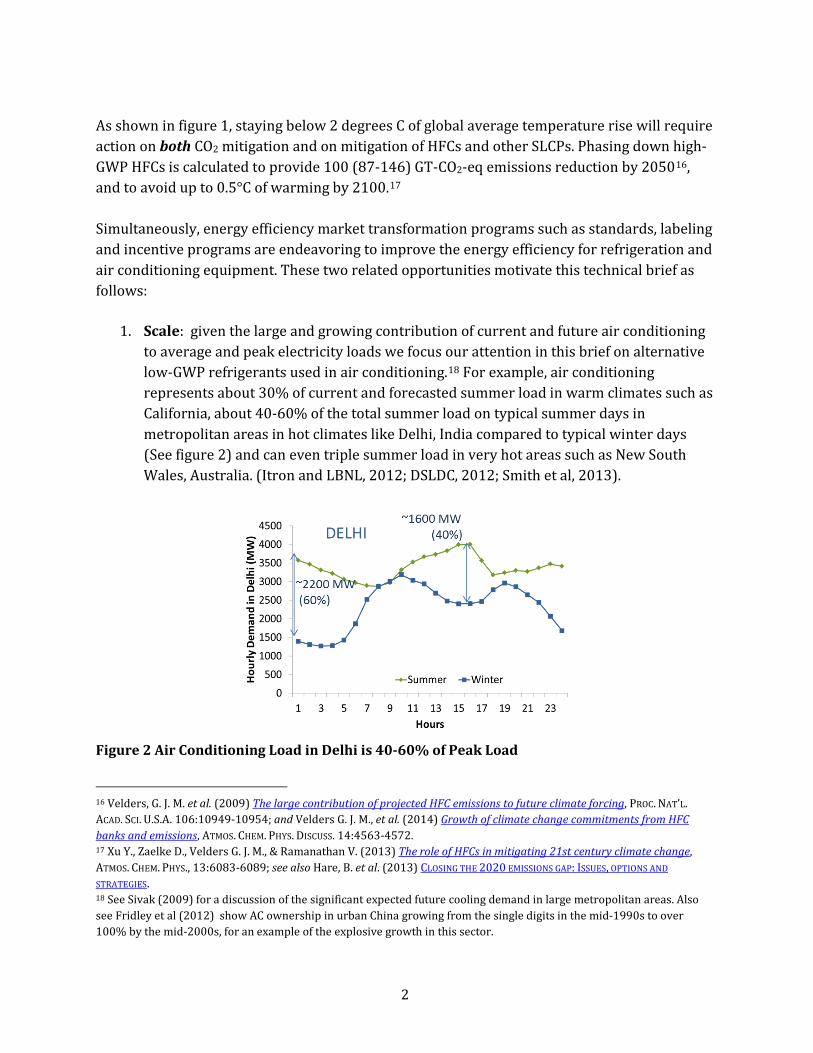
1. Scale: given the large and growing contribution of current and future air conditioning to average and peak electricity loads we focus our attention in this brief on alternative low-GWP refrigerants used in air conditioning.18 For example, air conditioning represents about 30% of current and forecasted summer load in warm climates such as California, about 40-60% of the total summer load on typical summer days in metropolitan areas in hot climates like Delhi, India compared to typical winter days (See figure 2) and can even triple summer load in very hot areas such as New South Wales, Australia. (Itron and LBNL, 2012; DSLDC, 2012; Smith et al, 2013).
Figure 2 Air Conditioning Load in Delhi is 40-60% of Peak Load
16 Velders, G. J. M. et al. (2009) The large contribution of projected HFC emissions to future climate forcing, PROC. NAT’L. ACAD. SCI. U.S.A. 106:10949-10954; and Velders G. J. M., et al. (2014) Growth of climate change commitments from HFC banks and emissions, ATMOS. CHEM. PHYS. DISCUSS. 14:4563-4572. 17 Xu Y., Zaelke D., Velders G. J. M., & Ramanathan V. (2013) The role of HFCs in mitigating 21st century climate change, ATMOS. CHEM. PHYS., 13:6083-6089; see also Hare, B. et al. (2013) CLOSING THE 2020 EMISSIONS GAP: ISSUES, OPTIONS AND
STRATEGIES. 18 See Sivak (2009) for a discussion of the significant expected future cooling demand in large metropolitan areas. Also see Fridley et al (2012) show AC ownership in urban China growing from the single digits in the mid-1990s to over 100% by the mid-2000s, for an example of the explosive growth in this sector.
3
(Source: Delhi State Load Dispatch Center (DSLDC), 2012)
2. Policy Convergence: the two types of policy (refrigerant transition, and energy efficiency improvement, respectively) and their associated communities of practice are aiming to transform the market for the same appliances and equipment. Hence, in this technical brief we quantify the GHG reduction benefits from implementing these policies both separately and in parallel.
3. Leapfrogging Opportunity: Beginning in the 1990’s, the Montreal Protocol successfully targeted the phase-out of all manufactured ozone-depleting substances (ODSs), including chlorofluorocarbons (CFCs) and hydrochlorofluorocarbons (HCFCs), chemicals used as refrigerants in most air conditioning and refrigeration appliances and equipment. CFCs and HCFCs are both ozone depleting substances (ODSs) and potent global warming gases. The global phase-out of CFCs s is now complete in all developing and developed countries. Developed countries have additionally phased out 90% of HCFC production and consumption by 2015 and will halt all HCFC use other than service by 2030. Developing countries began their HCFC phase-out with a freeze in 2013 and a 10% reduction in 2015 and will make further reductions to 35% in 2020, 67.5 in 2025, 97.5% in 2030 and 100% in 2040.19 This phase-out schedule for developing Parties offers the opportunity to leapfrog directly to superefficient air conditioners that also use an ozone-safe, low-GWP alternative refrigerants.
Given the large and significant impacts of air conditioning on GHGs, peak load and electricity consumption, in this report, we quantify the GHG and peak load reduction benefits of air conditioner efficiency improvement and of switching these air conditioners to low-GWP refrigerants, to illuminate a pathway for both CO2 mitigation and SLCP mitigation. We present the benefits of implementing these policies both separately and in parallel for room ACs. Scope
Our calculations assume un-ducted single-split ACs (mini-splits), which are the most common type sold on the global air conditioning market 20 However, our results would be similar for other types of vapor-compression type air conditioners. We assume R410A as the baseline because it was the global refrigerant-of-choice to replace R-22 in air conditioning applications by companies supplying non-A5 Party markets.21
19 A5 countries include China, India, and most of the countries in Africa and Latin America. The full list of all A5 countries is available here, while a graphical representation of the HCFC phase-out schedule for A5 countries is available here. 20 BSRIA data for 2012 showed 69.4% of the total number of 111.8 million air conditioning units sold globally were unducted standard split ACs. The type of AC with the next highest market share was window units with 13.1% of the global market. 21 While a comparison to R22 might provide useful information, R410A is considered as the baseline because non-A5
4
We focus on a representative sample of developing countries with hot climates and/or large mini-split air conditioner markets. However, in order to provide a fuller context, we also provide an estimate of the scale of potential for the various policy options globally. The full list of countries we focus on is: Brazil, Chile, China, Colombia, Egypt, India, Indonesia, Mexico, Pakistan, Saudi Arabia, Thailand, UAE, and Vietnam.
countries have already transitioned to R410A as refrigerant in air conditioning applications. Meanwhile, manufacturers in A5 country markets will likely be making a choice between the refrigerant R410A which would be required under the Montreal Protocol and some of the low-GWP refrigerants considered in this study, or other similar low-GWP alternatives.
5
2. Base Case, Data and Methodology
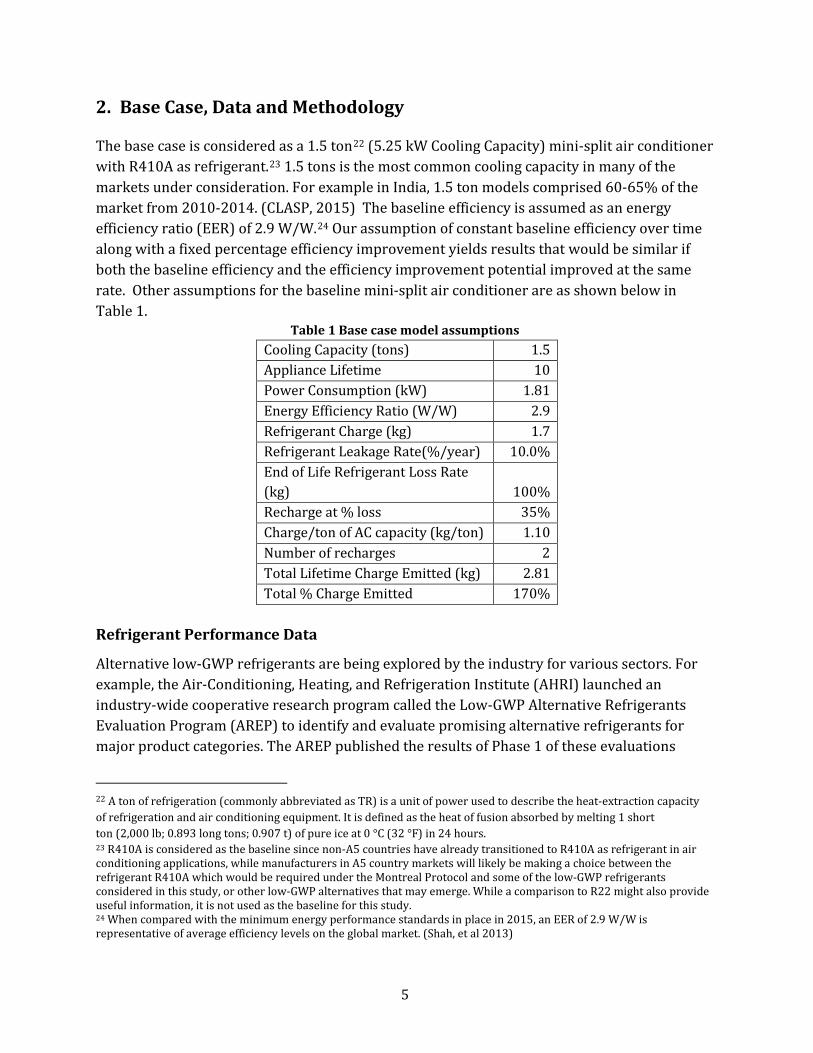
The base case is considered as a 1.5 ton22 (5.25 kW Cooling Capacity) mini-split air conditioner with R410A as refrigerant.23 1.5 tons is the most common cooling capacity in many of the markets under consideration. For example in India, 1.5 ton models comprised 60-65% of the market from 2010-2014. (CLASP, 2015) The baseline efficiency is assumed as an energy efficiency ratio (EER) of 2.9 W/W.24 Our assumption of constant baseline efficiency over time along with a fixed percentage efficiency improvement yields results that would be similar if both the baseline efficiency and the efficiency improvement potential improved at the same rate. Other assumptions for the baseline mini-split air conditioner are as shown below in Table 1.
Table 1 Base case model assumptions Cooling Capacity (tons) 1.5 Appliance Lifetime 10 Power Consumption (kW) 1.81 Energy Efficiency Ratio (W/W) 2.9 Refrigerant Charge (kg) 1.7 Refrigerant Leakage Rate(%/year) 10.0% End of Life Refrigerant Loss Rate (kg) 100% Recharge at % loss 35% Charge/ton of AC capacity (kg/ton) 1.10 Number of recharges 2 Total Lifetime Charge Emitted (kg) 2.81 Total % Charge Emitted 170%
Refrigerant Performance Data
Alternative low-GWP refrigerants are being explored by the industry for various sectors. For example, the Air-Conditioning, Heating, and Refrigeration Institute (AHRI) launched an industry-wide cooperative research program called the Low-GWP Alternative Refrigerants Evaluation Program (AREP) to identify and evaluate promising alternative refrigerants for major product categories. The AREP published the results of Phase 1 of these evaluations
22 A ton of refrigeration (commonly abbreviated as TR) is a unit of power used to describe the heat-extraction capacity of refrigeration and air conditioning equipment. It is defined as the heat of fusion absorbed by melting 1 short ton (2,000 lb; 0.893 long tons; 0.907 t) of pure ice at 0 °C (32 °F) in 24 hours. 23 R410A is considered as the baseline since non-A5 countries have already transitioned to R410A as refrigerant in air conditioning applications, while manufacturers in A5 country markets will likely be making a choice between the refrigerant R410A which would be required under the Montreal Protocol and some of the low-GWP refrigerants considered in this study, or other low-GWP alternatives that may emerge. While a comparison to R22 might also provide useful information, it is not used as the baseline for this study. 24 When compared with the minimum energy performance standards in place in 2015, an EER of 2.9 W/W is representative of average efficiency levels on the global market. (Shah, et al 2013)
6
online. Phase 2 of the AREP, focusing on new refrigerants and applications in high ambient temperatures, is currently ongoing and expected to be completed by the end of 2015. For the purposes of this study, we use the reported results on refrigerant performance from the AREP, augmented (where needed) by sources in the general literature. (Wang and Amrane, 2014; Schultz and Kujak, 2012; Tio et al 2012; Lim and Hern, 2013; Alabdulkarem et al 2013) The R410A alternative refrigerants whose results we report are: R32, DR5, R290, ARM70a, D2Y60, HPR1D, L41a, L41b and two blends of 95% R32 with 5% R134a and 5% R152a respectively. All of these refrigerants except R290 are tested under the AREP. Efficiency Improvement Data
Many standards and labeling programs aim to identify the range of efficiency improvement options and to quantify the total technically feasible potential and cost-effective potential for efficiency improvement in various appliances including air conditioners. Among these are the programs under United States Department of Energy (DOE, 2011), the European Commission’s Ecodesign process (EuP, 2009) and the Korean Energy Management Corporation (KEMCO). In addition, product rating websites such as topten.info also provide a good indication of the range of efficiency improvement available for air conditioners. We use these sources as well as a range of other sources such as product literature and interviews with industry experts to identify the total possible efficiency improvement potential. Methodology
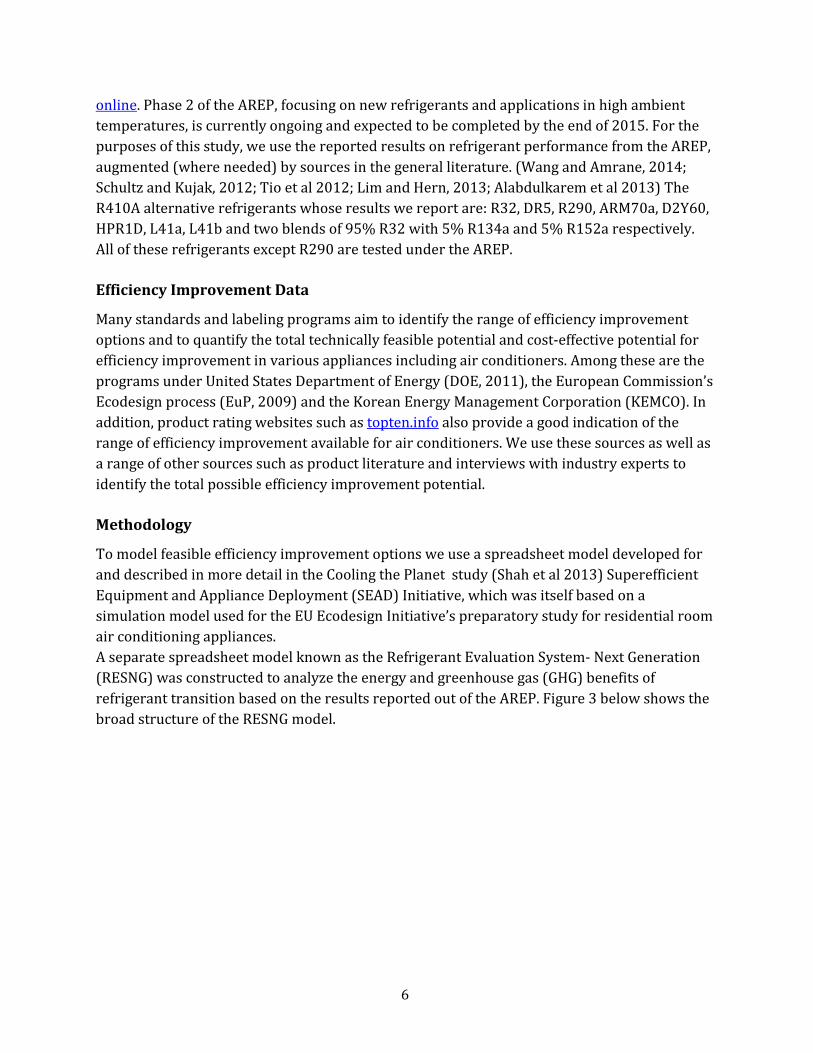
To model feasible efficiency improvement options we use a spreadsheet model developed for and described in more detail in the Cooling the Planet study (Shah et al 2013) Superefficient Equipment and Appliance Deployment (SEAD) Initiative, which was itself based on a simulation model used for the EU Ecodesign Initiative’s preparatory study for residential room air conditioning appliances. A separate spreadsheet model known as the Refrigerant Evaluation System- Next Generation (RESNG) was constructed to analyze the energy and greenhouse gas (GHG) benefits of refrigerant transition based on the results reported out of the AREP. Figure 3 below shows the broad structure of the RESNG model.
7
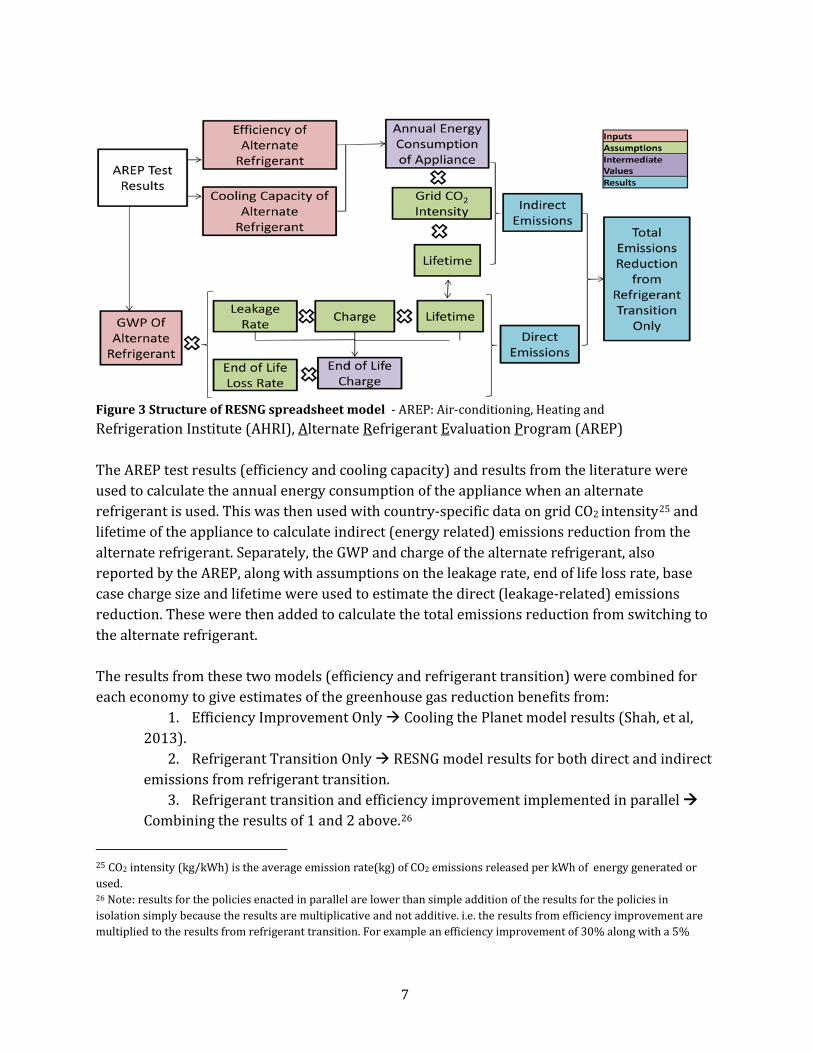
Figure 3 Structure of RESNG spreadsheet model - AREP: Air-conditioning, Heating and Refrigeration Institute (AHRI), Alternate Refrigerant Evaluation Program (AREP) The AREP test results (efficiency and cooling capacity) and results from the literature were used to calculate the annual energy consumption of the appliance when an alternate refrigerant is used. This was then used with country-specific data on grid CO2 intensity25 and lifetime of the appliance to calculate indirect (energy related) emissions reduction from the alternate refrigerant. Separately, the GWP and charge of the alternate refrigerant, also reported by the AREP, along with assumptions on the leakage rate, end of life loss rate, base case charge size and lifetime were used to estimate the direct (leakage-related) emissions reduction. These were then added to calculate the total emissions reduction from switching to the alternate refrigerant. The results from these two models (efficiency and refrigerant transition) were combined for each economy to give estimates of the greenhouse gas reduction benefits from:
1. Efficiency Improvement Only Cooling the Planet model results (Shah, et al, 2013).
2. Refrigerant Transition Only RESNG model results for both direct and indirect emissions from refrigerant transition.
3. Refrigerant transition and efficiency improvement implemented in parallel Combining the results of 1 and 2 above.26
25 CO2 intensity (kg/kWh) is the average emission rate(kg) of CO2 emissions released per kWh of energy generated or used. 26 Note: results for the policies enacted in parallel are lower than simple addition of the results for the policies in isolation simply because the results are multiplicative and not additive. i.e. the results from efficiency improvement are multiplied to the results from refrigerant transition. For example an efficiency improvement of 30% along with a 5%
8
Since the tests conducted by the AREP are “drop-in” or “soft-optimization” tests, the results of efficiency improvement options modeled in 1 are independent of the refrigerant transition modeled in 2. 27 Therefore, combining the results as discussed above is possible to show the combined effect of both policies.
improvement in efficiency from refrigerant transition will result in a 33.5% reduction in energy consumption as follows:[1-(1-0.3)x(1-0.05)]=[1-0.7x0.95]=1-0.665=0.335. 27 Soft optimization testing refers to tests done on systems that are modified for the alternate refrigerants using standard production-line components.
9
3. Alternate Low-GWP Refrigerants
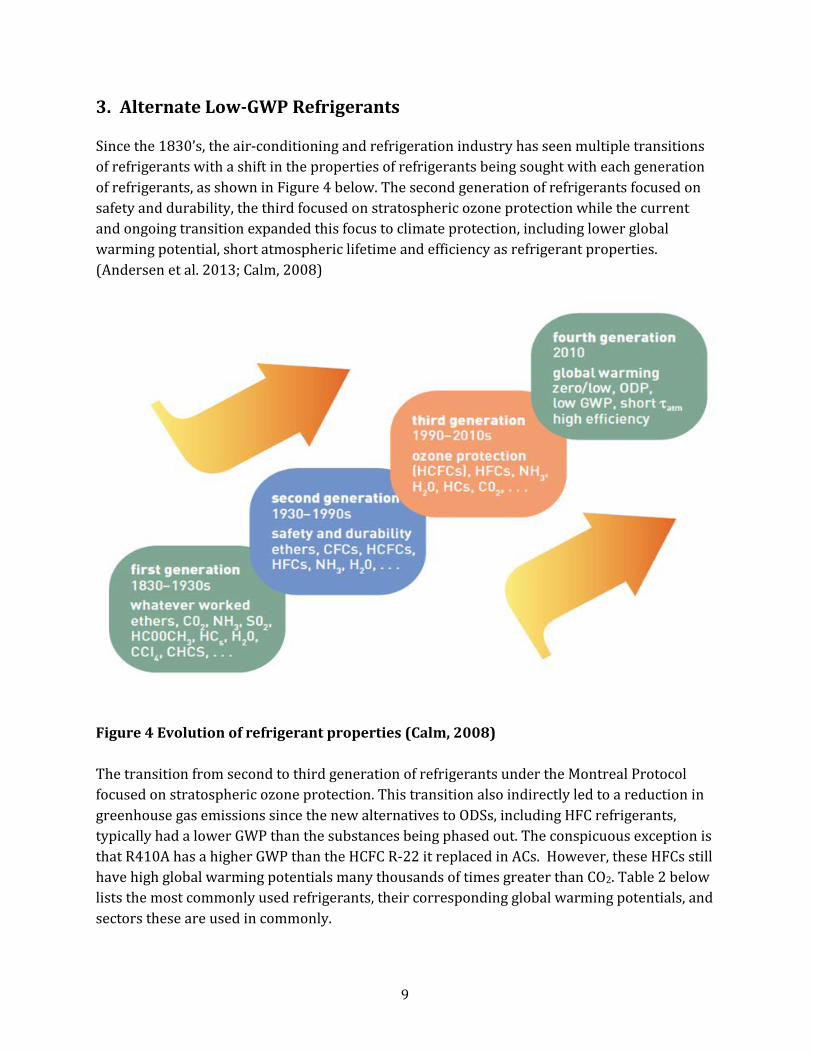
Since the 1830’s, the air-conditioning and refrigeration industry has seen multiple transitions of refrigerants with a shift in the properties of refrigerants being sought with each generation of refrigerants, as shown in Figure 4 below. The second generation of refrigerants focused on safety and durability, the third focused on stratospheric ozone protection while the current and ongoing transition expanded this focus to climate protection, including lower global warming potential, short atmospheric lifetime and efficiency as refrigerant properties. (Andersen et al. 2013; Calm, 2008)
Figure 4 Evolution of refrigerant properties (Calm, 2008) The transition from second to third generation of refrigerants under the Montreal Protocol focused on stratospheric ozone protection. This transition also indirectly led to a reduction in greenhouse gas emissions since the new alternatives to ODSs, including HFC refrigerants, typically had a lower GWP than the substances being phased out. The conspicuous exception is that R410A has a higher GWP than the HCFC R-22 it replaced in ACs. However, these HFCs still have high global warming potentials many thousands of times greater than CO2. Table 2 below lists the most commonly used refrigerants, their corresponding global warming potentials, and sectors these are used in commonly.
10
Table 2 Commonly used refrigerants and their Global Warming Potentials (GWPs)
Refrigerant IPCC AR5 Global Warming Potential (100-year)
Sectors
R22 1760 Most refrigeration & air conditioning sectors
R134a 1300 Large chillers, refrigeration, mobile air conditioning
R404A (HFC blend) 3943 Industrial, commercial refrigeration
R410A (HFC blend) 1924 Unitary and commercial ACs, small chillers
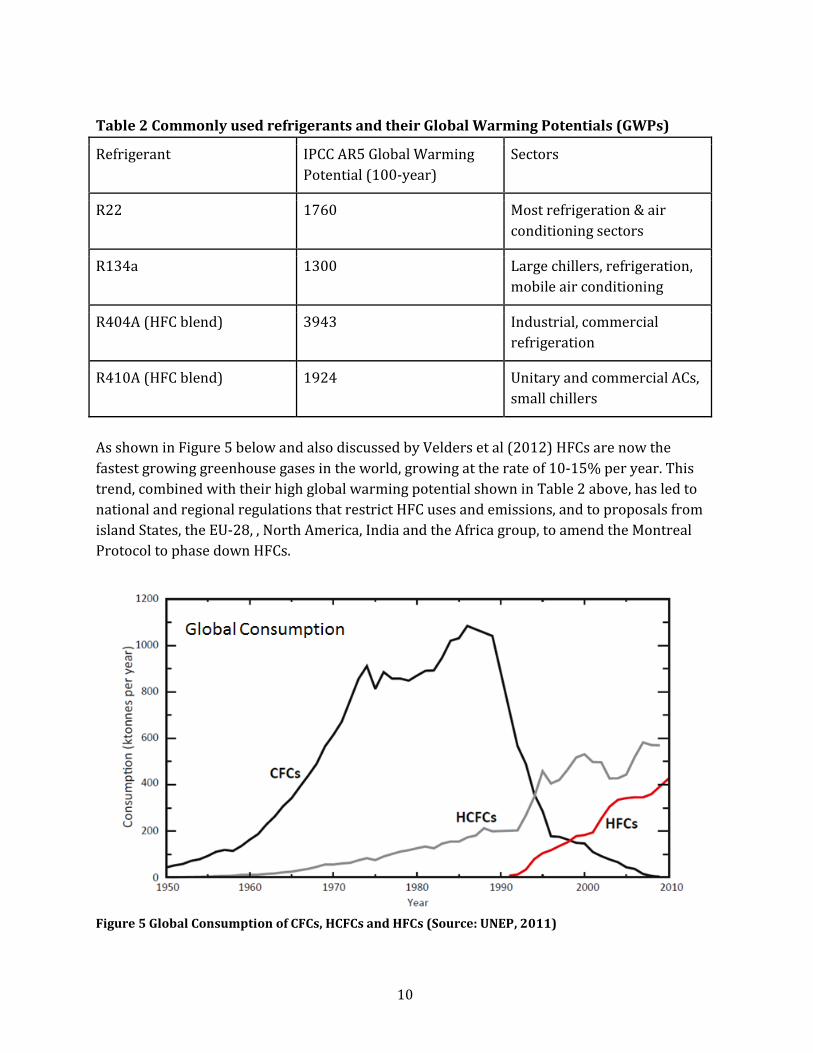
As shown in Figure 5 below and also discussed by Velders et al (2012) HFCs are now the fastest growing greenhouse gases in the world, growing at the rate of 10-15% per year. This trend, combined with their high global warming potential shown in Table 2 above, has led to national and regional regulations that restrict HFC uses and emissions, and to proposals from island States, the EU-28, , North America, India and the Africa group, to amend the Montreal Protocol to phase down HFCs.
Figure 5 Global Consumption of CFCs, HCFCs and HFCs (Source: UNEP, 2011)
11
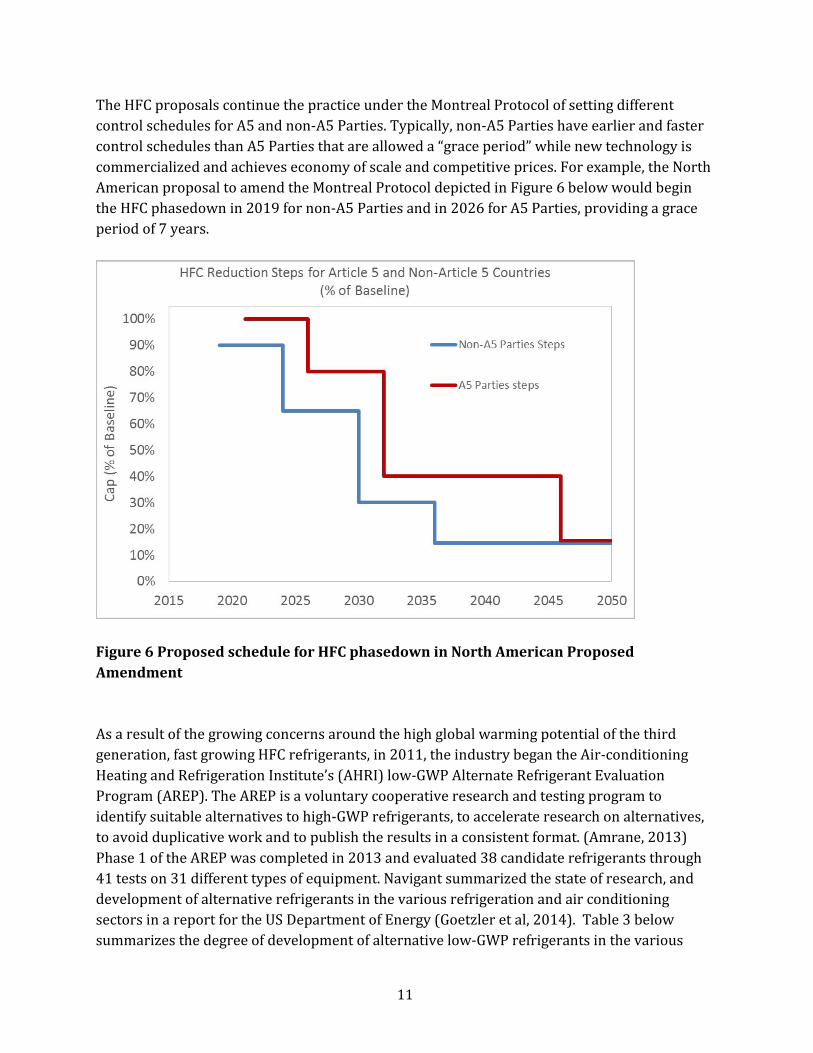
The HFC proposals continue the practice under the Montreal Protocol of setting different control schedules for A5 and non-A5 Parties. Typically, non-A5 Parties have earlier and faster control schedules than A5 Parties that are allowed a “grace period” while new technology is commercialized and achieves economy of scale and competitive prices. For example, the North American proposal to amend the Montreal Protocol depicted in Figure 6 below would begin the HFC phasedown in 2019 for non-A5 Parties and in 2026 for A5 Parties, providing a grace period of 7 years.
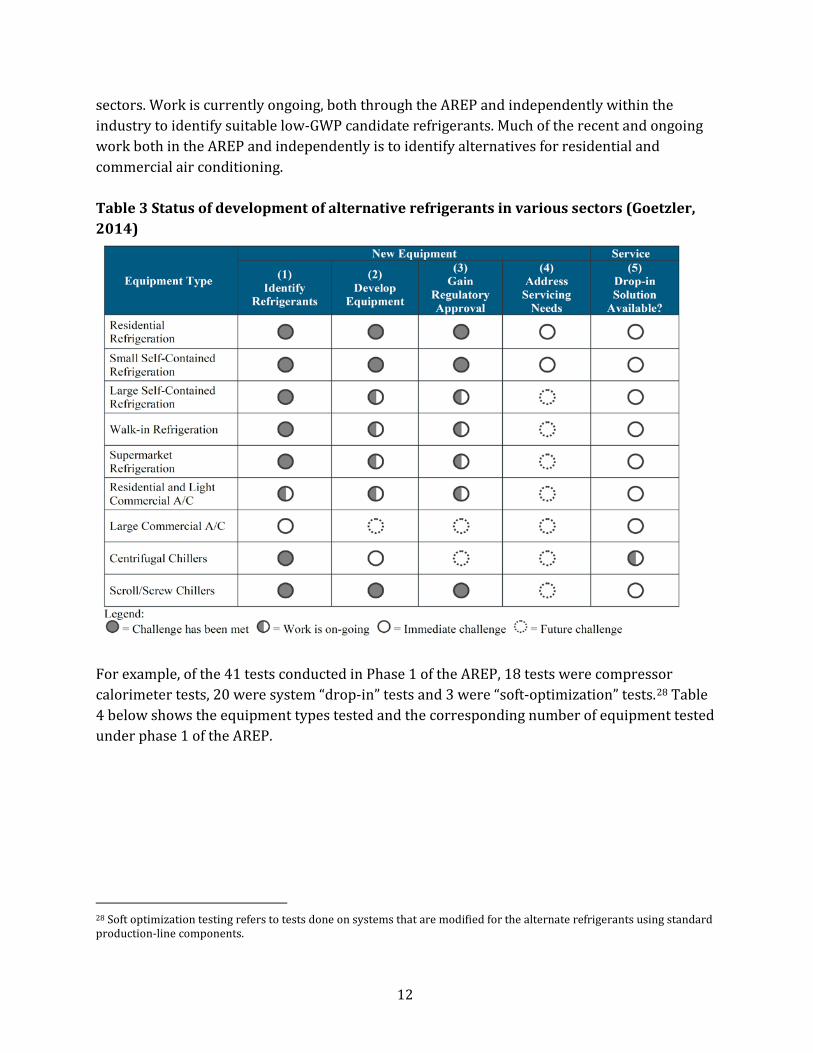
Figure 6 Proposed schedule for HFC phasedown in North American Proposed Amendment As a result of the growing concerns around the high global warming potential of the third generation, fast growing HFC refrigerants, in 2011, the industry began the Air-conditioning Heating and Refrigeration Institute’s (AHRI) low-GWP Alternate Refrigerant Evaluation Program (AREP). The AREP is a voluntary cooperative research and testing program to identify suitable alternatives to high-GWP refrigerants, to accelerate research on alternatives, to avoid duplicative work and to publish the results in a consistent format. (Amrane, 2013) Phase 1 of the AREP was completed in 2013 and evaluated 38 candidate refrigerants through 41 tests on 31 different types of equipment. Navigant summarized the state of research, and development of alternative refrigerants in the various refrigeration and air conditioning sectors in a report for the US Department of Energy (Goetzler et al, 2014). Table 3 below summarizes the degree of development of alternative low-GWP refrigerants in the various
12
sectors. Work is currently ongoing, both through the AREP and independently within the industry to identify suitable low-GWP candidate refrigerants. Much of the recent and ongoing work both in the AREP and independently is to identify alternatives for residential and commercial air conditioning. Table 3 Status of development of alternative refrigerants in various sectors (Goetzler, 2014)
For example, of the 41 tests conducted in Phase 1 of the AREP, 18 tests were compressor calorimeter tests, 20 were system “drop-in” tests and 3 were “soft-optimization” tests.28 Table 4 below shows the equipment types tested and the corresponding number of equipment tested under phase 1 of the AREP.
28 Soft optimization testing refers to tests done on systems that are modified for the alternate refrigerants using standard production-line components.
13
Table 4 Tests conducted under the AREP Phase 1 (Source: Amrane, 2013)
Equipment Type Number of Equipment Tested under AREP Phase 1
Air conditioners and heat pumps 11
Chillers 4
Refrigeration 3 (1 commercial refrigerator and 2 ice machines)
Transport refrigeration 1
Bus air conditioning 2
Compressors 10
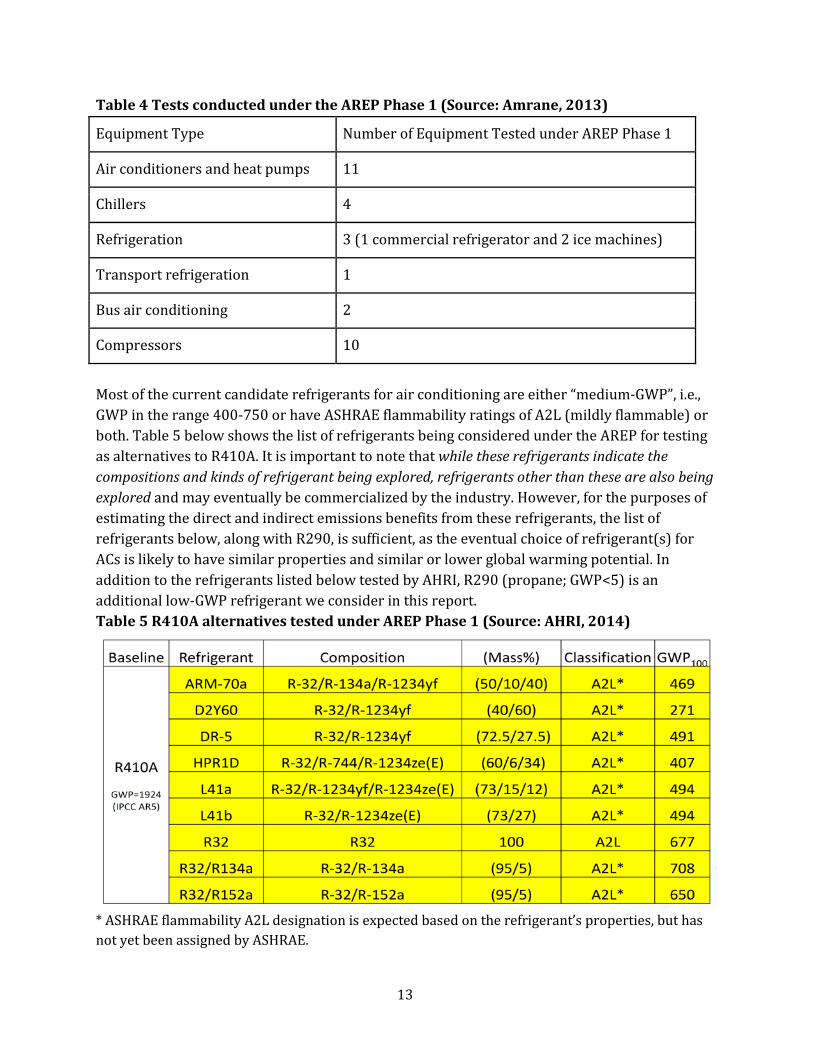
Most of the current candidate refrigerants for air conditioning are either “medium-GWP”, i.e., GWP in the range 400-750 or have ASHRAE flammability ratings of A2L (mildly flammable) or both. Table 5 below shows the list of refrigerants being considered under the AREP for testing as alternatives to R410A. It is important to note that while these refrigerants indicate the compositions and kinds of refrigerant being explored, refrigerants other than these are also being explored and may eventually be commercialized by the industry. However, for the purposes of estimating the direct and indirect emissions benefits from these refrigerants, the list of refrigerants below, along with R290, is sufficient, as the eventual choice of refrigerant(s) for ACs is likely to have similar properties and similar or lower global warming potential. In addition to the refrigerants listed below tested by AHRI, R290 (propane; GWP<5) is an additional low-GWP refrigerant we consider in this report. Table 5 R410A alternatives tested under AREP Phase 1 (Source: AHRI, 2014)
* ASHRAE flammability A2L designation is expected based on the refrigerant’s properties, but has not yet been assigned by ASHRAE.
14
4. Refrigerant Charge, Leakage and End-of-Life Loss
Refrigerant Charge size
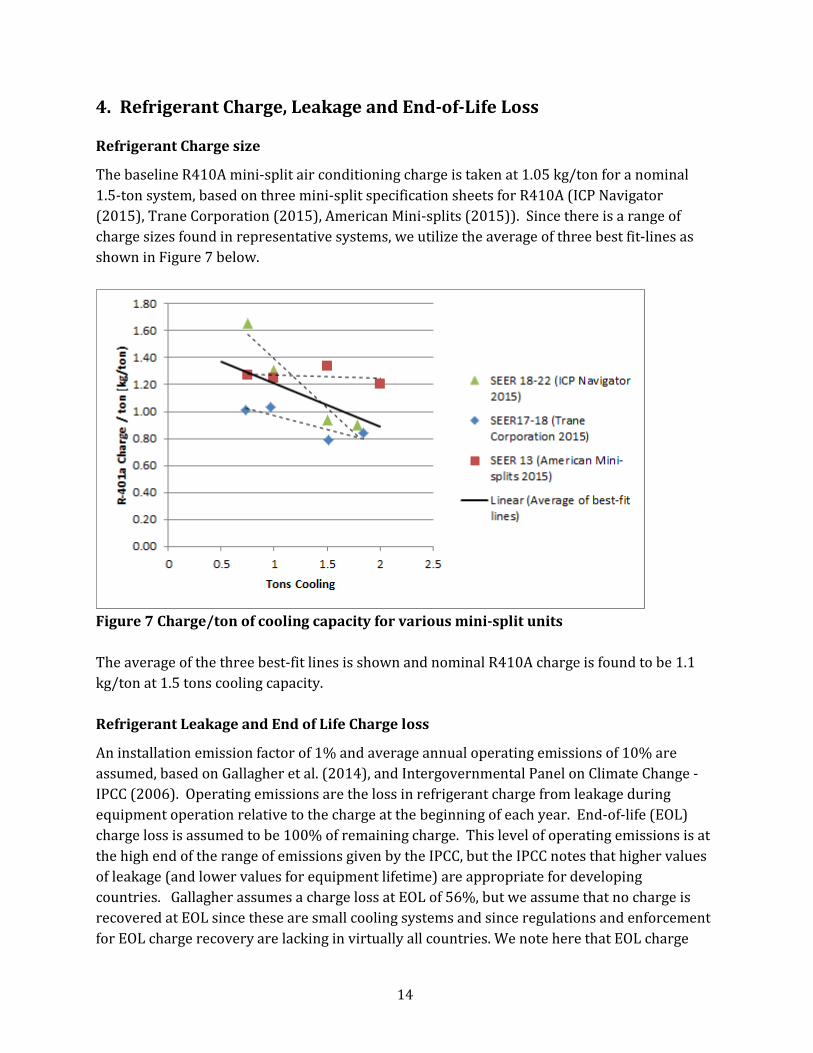
The baseline R410A mini-split air conditioning charge is taken at 1.05 kg/ton for a nominal 1.5-ton system, based on three mini-split specification sheets for R410A (ICP Navigator (2015), Trane Corporation (2015), American Mini-splits (2015)). Since there is a range of charge sizes found in representative systems, we utilize the average of three best fit-lines as shown in Figure 7 below.
Figure 7 Charge/ton of cooling capacity for various mini-split units The average of the three best-fit lines is shown and nominal R410A charge is found to be 1.1 kg/ton at 1.5 tons cooling capacity. Refrigerant Leakage and End of Life Charge loss
An installation emission factor of 1% and average annual operating emissions of 10% are assumed, based on Gallagher et al. (2014), and Intergovernmental Panel on Climate Change - IPCC (2006). Operating emissions are the loss in refrigerant charge from leakage during equipment operation relative to the charge at the beginning of each year. End-of-life (EOL) charge loss is assumed to be 100% of remaining charge. This level of operating emissions is at the high end of the range of emissions given by the IPCC, but the IPCC notes that higher values of leakage (and lower values for equipment lifetime) are appropriate for developing countries. Gallagher assumes a charge loss at EOL of 56%, but we assume that no charge is recovered at EOL since these are small cooling systems and since regulations and enforcement for EOL charge recovery are lacking in virtually all countries. We note here that EOL charge
15
recovery and handling are a very important and potentially powerful means of reducing direct emissions from refrigerants and could be pursued in parallel with efforts to reduce the GWP of the refrigerants themselves, and our assumption of EOL 100% loss is more an attempt to capture impact of current policies than an endorsement of them as such. We found that many references (e.g., IIR (2015) and EPA (2014)) refer back to the IPCC (2006) data and the sources described therein for their quoted leakage loss numbers. We present two analytical approaches for treating annual operating leakage as follows: Gradual refrigerant loss for typical unit: In the first approach, we assume that each unit has an average operating emission loss percentage as stated (10%). We also assume that the system is recharged at 35% initial charge loss due to discernable performance loss, amounting to two recharges over the assumed 10 year lifetime of the AC. With these assumptions, the average total lifetime charge loss is 169% of initial charge. Catastrophic refrigerant loss for a few units: In the second approach, operating emissions are assumed to be dominated by component failures such as corrosion, condenser failure, indoor or outdoor coil failure, etc. (see UNEP 2003, Section 10.3.2). The 10% annual operating emissions are thus attributed to 10% failure rate each year for an initial equipment population from a variety of failure mechanisms. When a component failure occurs, all refrigerant is assumed lost and subsequently the equipment is repaired and refrigerant is refilled to its initial value. With this set of assumptions, the average total refrigerant leakage loss is 160% of the initial refrigerant charge. Both approaches yield very similar results, and we adopt a total lifetime refrigerant loss of 170% of initial charge for new equipment. (A similar conclusion is found for a starting assumption of 5% annual operating emissions: 134% total charge loss over the equipment lifetime in the first approach and 137% in the second approach).
16
5. National and Global Market Analysis
We used the Bottom-Up Energy Analysis System (BUENAS) to estimate the national and global markets for split ACs that will be impacted by low-GWP refrigerant transitions.29 A detailed description of the general BUENAS methodology is available in (McNeil et al. 2012). The bottom-up approach allows for a detailed accounting of AC units in the stock and modeling of saturation effects. This version of BUENAS covers 16 major economies, representing 70% of the world’s economy (EIA, 2014) and includes a macroeconomic forecast to 2050. The following describes the model’s methodology, data, and assumptions to forecast stock of ACs in the relevant countries, and globally. In absence of sales or stock data, the BUENAS model relies on macro-economic drivers such as income, climate variables and electrification rates in order forecast appliance ownership. The general form of the diffusion relationship follows an S-shaped function. Air conditioners ownership is modeled using separate components: Availability and Climate Maximum, according to:
Diffc = Availability(Ic) x ClimateMaximum (CDDc)
where ClimateMaximum is a function of national average Cooling Degree Days (CDD), and Availability represents the affordability of air conditioning to households, and is a function of household income Ic, where c is the country index.
where γ = 126.85 and βinc-6.9E-05 (McNeil et al., 2012) As it is the case of past studies (Shah et al, 2013), LBNL has acquired proprietary data from the Building Services Research and Information Association (BSRIA) in order to gain further insight on current AC markets and calibrate the BUENAS model estimates (BSRIA, 2011) (BSRIA, 2014). The BSRIA reports provide an estimate of the units sold in every year from 2009 to 2017, along with the share of commercial vs. residential sales by product type. Once disaggregated between residential and commercial applications, the sales data are used to
29 http://www.superefficient.org/Tools/BUENAS
)00187.0exp(949.00.1 cCDDimumClimateMax ×−×−=
( )cincc I
ItyAvailabili×+
=βγα
exp1)(
17
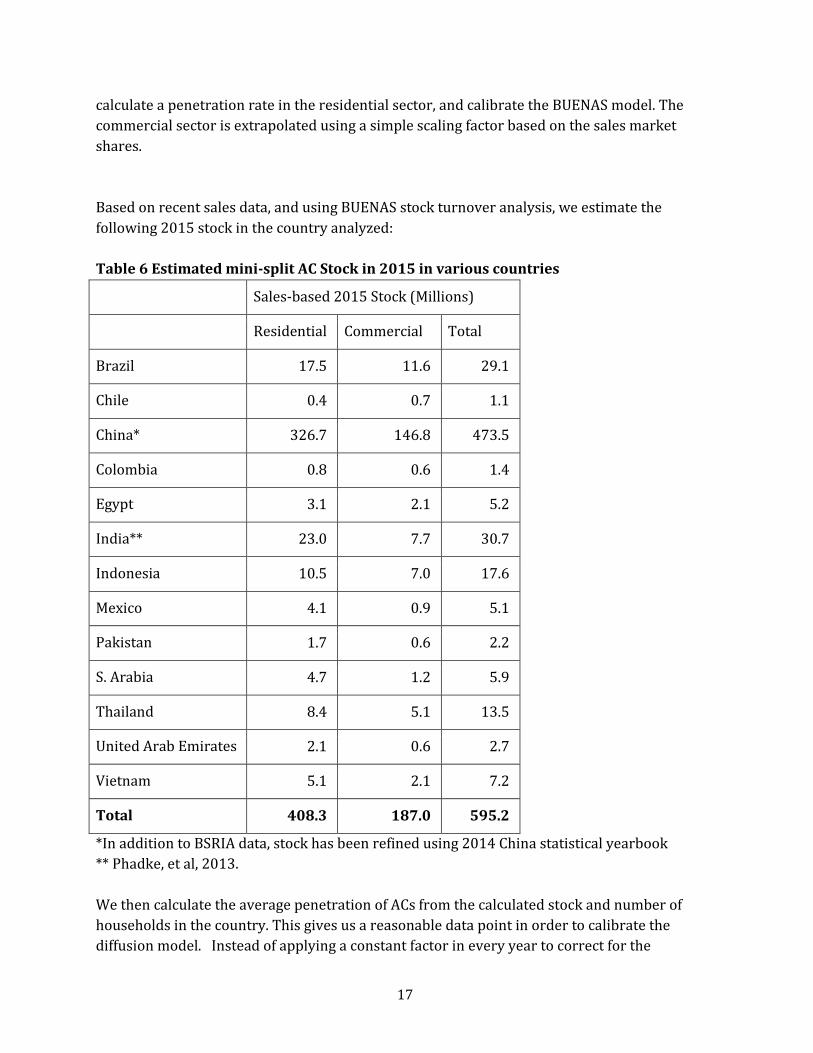
calculate a penetration rate in the residential sector, and calibrate the BUENAS model. The commercial sector is extrapolated using a simple scaling factor based on the sales market shares. Based on recent sales data, and using BUENAS stock turnover analysis, we estimate the following 2015 stock in the country analyzed: Table 6 Estimated mini-split AC Stock in 2015 in various countries
Sales-based 2015 Stock (Millions)
Residential Commercial Total
Brazil 17.5 11.6 29.1
Chile 0.4 0.7 1.1
China* 326.7 146.8 473.5
Colombia 0.8 0.6 1.4
Egypt 3.1 2.1 5.2
India** 23.0 7.7 30.7
Indonesia 10.5 7.0 17.6
Mexico 4.1 0.9 5.1
Pakistan 1.7 0.6 2.2
S. Arabia 4.7 1.2 5.9
Thailand 8.4 5.1 13.5
United Arab Emirates 2.1 0.6 2.7
Vietnam 5.1 2.1 7.2
Total 408.3 187.0 595.2
*In addition to BSRIA data, stock has been refined using 2014 China statistical yearbook ** Phadke, et al, 2013. We then calculate the average penetration of ACs from the calculated stock and number of households in the country. This gives us a reasonable data point in order to calibrate the diffusion model. Instead of applying a constant factor in every year to correct for the
18
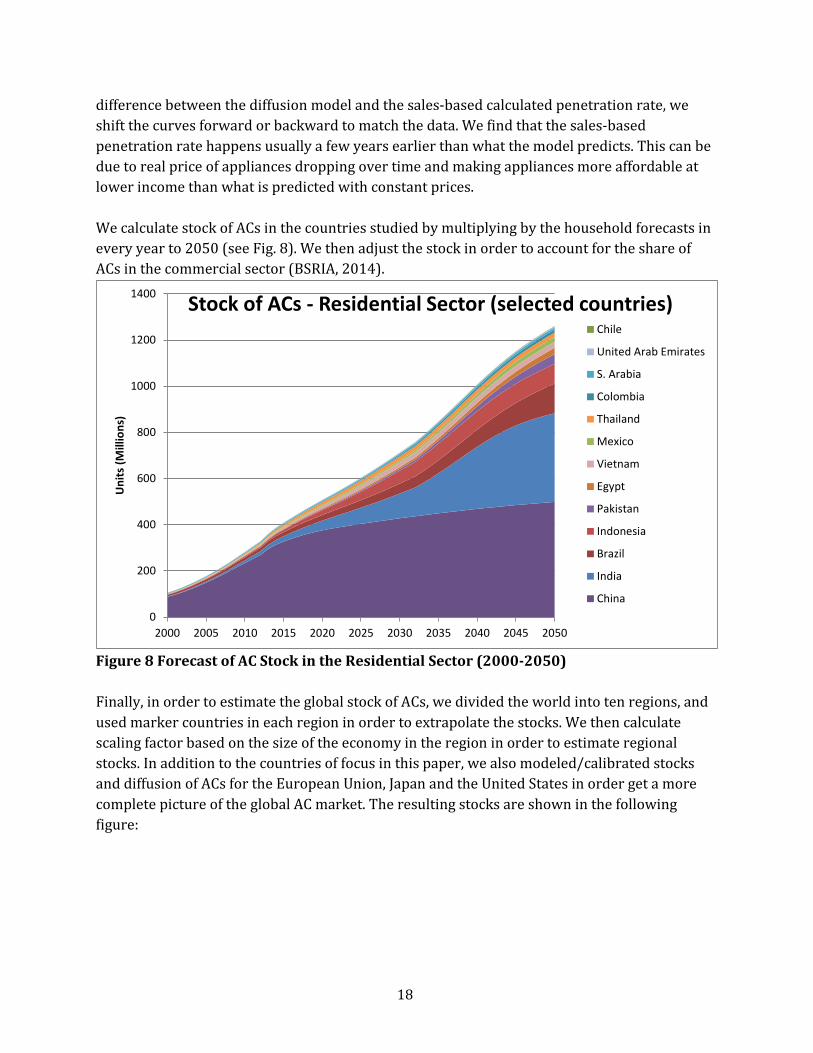
difference between the diffusion model and the sales-based calculated penetration rate, we shift the curves forward or backward to match the data. We find that the sales-based penetration rate happens usually a few years earlier than what the model predicts. This can be due to real price of appliances dropping over time and making appliances more affordable at lower income than what is predicted with constant prices. We calculate stock of ACs in the countries studied by multiplying by the household forecasts in every year to 2050 (see Fig. 8). We then adjust the stock in order to account for the share of ACs in the commercial sector (BSRIA, 2014).
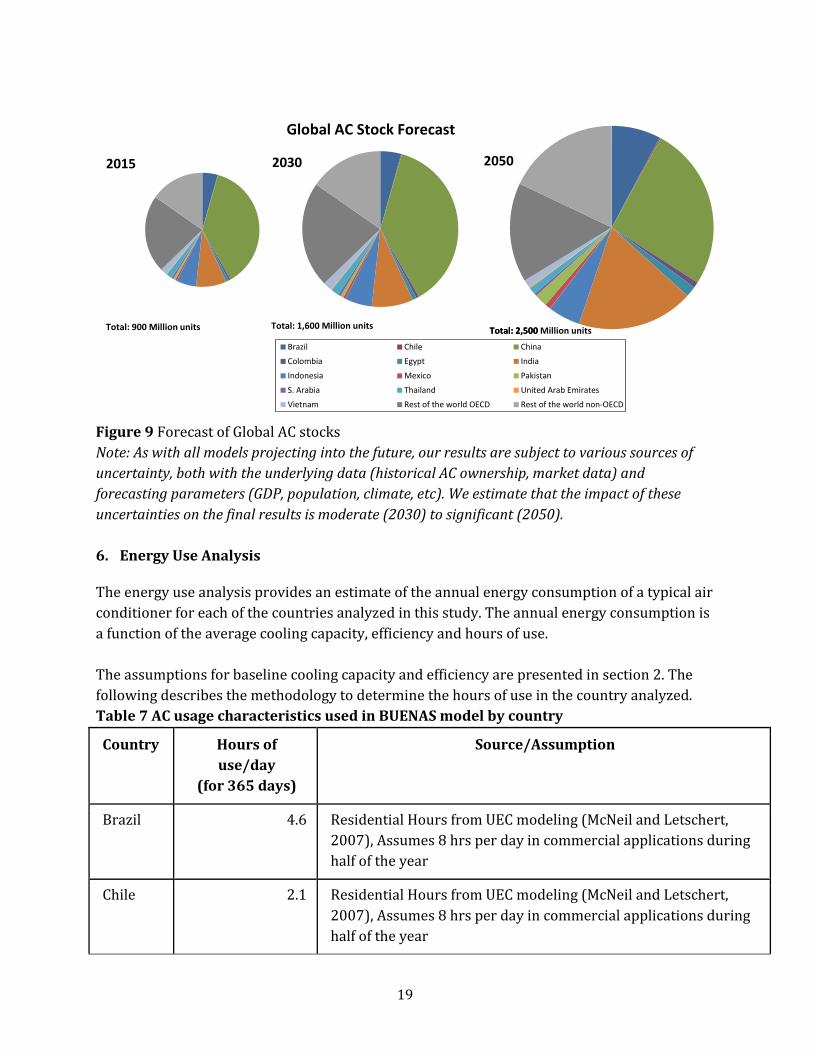
Figure 8 Forecast of AC Stock in the Residential Sector (2000-2050) Finally, in order to estimate the global stock of ACs, we divided the world into ten regions, and used marker countries in each region in order to extrapolate the stocks. We then calculate scaling factor based on the size of the economy in the region in order to estimate regional stocks. In addition to the countries of focus in this paper, we also modeled/calibrated stocks and diffusion of ACs for the European Union, Japan and the United States in order get a more complete picture of the global AC market. The resulting stocks are shown in the following figure:
0
200
400
600
800
1000
1200
1400
2000 2005 2010 2015 2020 2025 2030 2035 2040 2045 2050
Uni
ts (M
illio
ns)
Stock of ACs - Residential Sector (selected countries) Chile
United Arab Emirates
S. Arabia
Colombia
Thailand
Mexico
Vietnam
Egypt
Pakistan
Indonesia
Brazil
India
China
19
Figure 9 Forecast of Global AC stocks Note: As with all models projecting into the future, our results are subject to various sources of uncertainty, both with the underlying data (historical AC ownership, market data) and forecasting parameters (GDP, population, climate, etc). We estimate that the impact of these uncertainties on the final results is moderate (2030) to significant (2050). 6. Energy Use Analysis
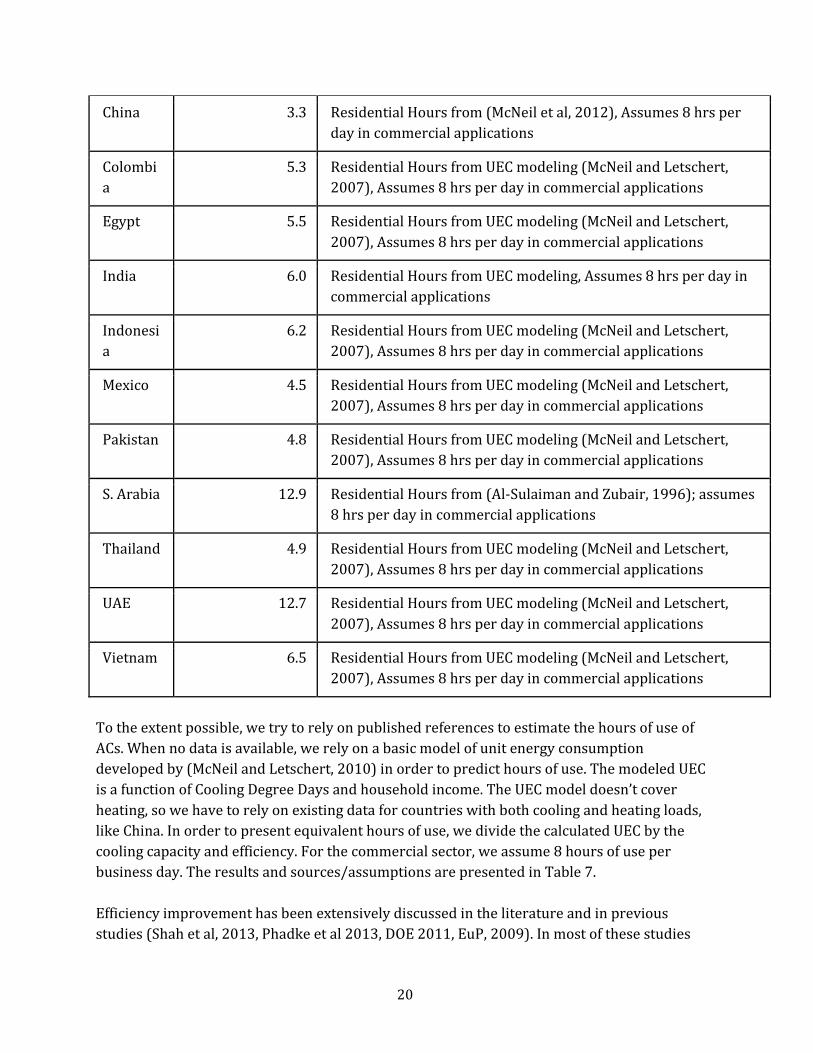
The energy use analysis provides an estimate of the annual energy consumption of a typical air conditioner for each of the countries analyzed in this study. The annual energy consumption is a function of the average cooling capacity, efficiency and hours of use. The assumptions for baseline cooling capacity and efficiency are presented in section 2. The following describes the methodology to determine the hours of use in the country analyzed. Table 7 AC usage characteristics used in BUENAS model by country
Country Hours of use/day
(for 365 days)
Source/Assumption
Brazil 4.6 Residential Hours from UEC modeling (McNeil and Letschert, 2007), Assumes 8 hrs per day in commercial applications during half of the year
Chile 2.1 Residential Hours from UEC modeling (McNeil and Letschert, 2007), Assumes 8 hrs per day in commercial applications during half of the year
2015
Total: 900 Million units
2030
BrazilChileChinaColombiaEgyptIndiaIndonesiaMexicoPakistanS. ArabiaThailandUnited Arab EmiratesVietnamRest of the world OECDRest of the world non-OECD
Total: 1,600 Million units
Global AC Stock Forecast
2050
Total: 2,500 Total: 2,500 Million units
Brazil Chile China
Colombia Egypt India
Indonesia Mexico Pakistan
S. Arabia Thailand United Arab Emirates
Vietnam Rest of the world OECD Rest of the world non-OECD
20
China 3.3 Residential Hours from (McNeil et al, 2012), Assumes 8 hrs per day in commercial applications
Colombia
5.3 Residential Hours from UEC modeling (McNeil and Letschert, 2007), Assumes 8 hrs per day in commercial applications
Egypt 5.5 Residential Hours from UEC modeling (McNeil and Letschert, 2007), Assumes 8 hrs per day in commercial applications
India 6.0 Residential Hours from UEC modeling, Assumes 8 hrs per day in commercial applications
Indonesia
6.2 Residential Hours from UEC modeling (McNeil and Letschert, 2007), Assumes 8 hrs per day in commercial applications
Mexico 4.5 Residential Hours from UEC modeling (McNeil and Letschert, 2007), Assumes 8 hrs per day in commercial applications
Pakistan 4.8 Residential Hours from UEC modeling (McNeil and Letschert, 2007), Assumes 8 hrs per day in commercial applications
S. Arabia 12.9 Residential Hours from (Al-Sulaiman and Zubair, 1996); assumes 8 hrs per day in commercial applications
Thailand 4.9 Residential Hours from UEC modeling (McNeil and Letschert, 2007), Assumes 8 hrs per day in commercial applications
UAE 12.7 Residential Hours from UEC modeling (McNeil and Letschert, 2007), Assumes 8 hrs per day in commercial applications
Vietnam 6.5 Residential Hours from UEC modeling (McNeil and Letschert, 2007), Assumes 8 hrs per day in commercial applications
To the extent possible, we try to rely on published references to estimate the hours of use of ACs. When no data is available, we rely on a basic model of unit energy consumption developed by (McNeil and Letschert, 2010) in order to predict hours of use. The modeled UEC is a function of Cooling Degree Days and household income. The UEC model doesn’t cover heating, so we have to rely on existing data for countries with both cooling and heating loads, like China. In order to present equivalent hours of use, we divide the calculated UEC by the cooling capacity and efficiency. For the commercial sector, we assume 8 hours of use per business day. The results and sources/assumptions are presented in Table 7. Efficiency improvement has been extensively discussed in the literature and in previous studies (Shah et al, 2013, Phadke et al 2013, DOE 2011, EuP, 2009). In most of these studies
21
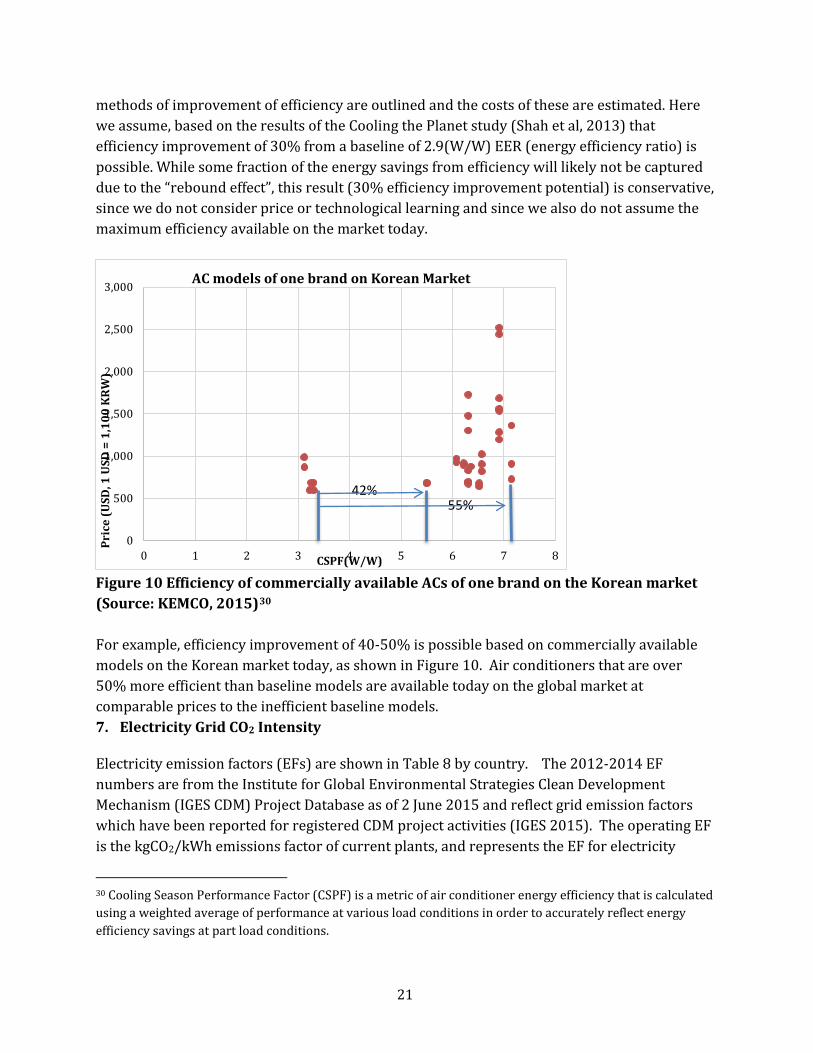
methods of improvement of efficiency are outlined and the costs of these are estimated. Here we assume, based on the results of the Cooling the Planet study (Shah et al, 2013) that efficiency improvement of 30% from a baseline of 2.9(W/W) EER (energy efficiency ratio) is possible. While some fraction of the energy savings from efficiency will likely not be captured due to the “rebound effect”, this result (30% efficiency improvement potential) is conservative, since we do not consider price or technological learning and since we also do not assume the maximum efficiency available on the market today.
Figure 10 Efficiency of commercially available ACs of one brand on the Korean market (Source: KEMCO, 2015)30 For example, efficiency improvement of 40-50% is possible based on commercially available models on the Korean market today, as shown in Figure 10. Air conditioners that are over 50% more efficient than baseline models are available today on the global market at comparable prices to the inefficient baseline models. 7. Electricity Grid CO2 Intensity
Electricity emission factors (EFs) are shown in Table 8 by country. The 2012-2014 EF numbers are from the Institute for Global Environmental Strategies Clean Development Mechanism (IGES CDM) Project Database as of 2 June 2015 and reflect grid emission factors which have been reported for registered CDM project activities (IGES 2015). The operating EF is the kgCO2/kWh emissions factor of current plants, and represents the EF for electricity
30 Cooling Season Performance Factor (CSPF) is a metric of air conditioner energy efficiency that is calculated using a weighted average of performance at various load conditions in order to accurately reflect energy efficiency savings at part load conditions.
0
500
1,000
1,500
2,000
2,500
3,000
0 1 2 3 4 5 6 7 8
Pric
e (U
SD, 1
USD
= 1
,100
KRW
)
CSPF(W/W)
AC models of one brand on Korean Market
42%55%
22
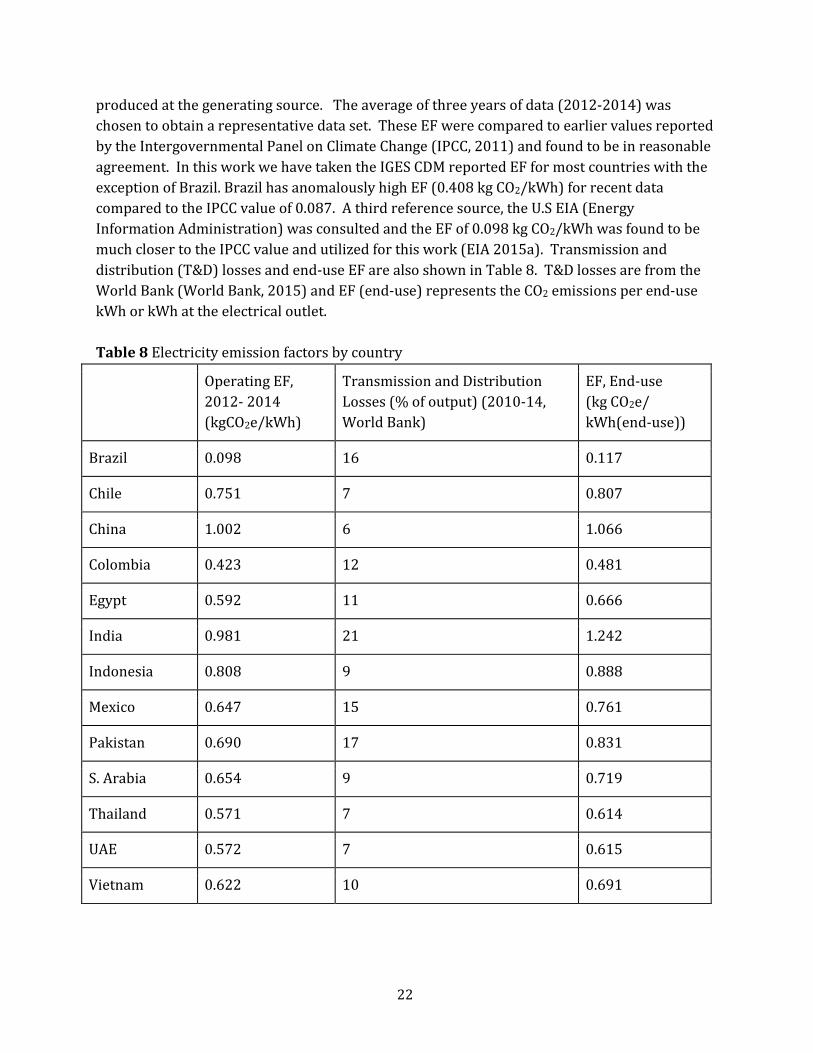
produced at the generating source. The average of three years of data (2012-2014) was chosen to obtain a representative data set. These EF were compared to earlier values reported by the Intergovernmental Panel on Climate Change (IPCC, 2011) and found to be in reasonable agreement. In this work we have taken the IGES CDM reported EF for most countries with the exception of Brazil. Brazil has anomalously high EF (0.408 kg CO2/kWh) for recent data compared to the IPCC value of 0.087. A third reference source, the U.S EIA (Energy Information Administration) was consulted and the EF of 0.098 kg CO2/kWh was found to be much closer to the IPCC value and utilized for this work (EIA 2015a). Transmission and distribution (T&D) losses and end-use EF are also shown in Table 8. T&D losses are from the World Bank (World Bank, 2015) and EF (end-use) represents the CO2 emissions per end-use kWh or kWh at the electrical outlet. Table 8 Electricity emission factors by country
Operating EF, 2012- 2014 (kgCO2e/kWh)
Transmission and Distribution Losses (% of output) (2010-14, World Bank)
EF, End-use (kg CO2e/ kWh(end-use))
Brazil 0.098 16 0.117
Chile 0.751 7 0.807
China 1.002 6 1.066
Colombia 0.423 12 0.481
Egypt 0.592 11 0.666
India 0.981 21 1.242
Indonesia 0.808 9 0.888
Mexico 0.647 15 0.761
Pakistan 0.690 17 0.831
S. Arabia 0.654 9 0.719
Thailand 0.571 7 0.614
UAE 0.572 7 0.615
Vietnam 0.622 10 0.691
23
8. Results
The data and methodology described above are used to calculate the emissions reduction from efficiency improvement only, from refrigerant transition only, and from implementation of these policies in parallel. We report the benefits of implementing both policies separately and in parallel, without addressing how these policies are enacted and implemented. Emissions Abatement
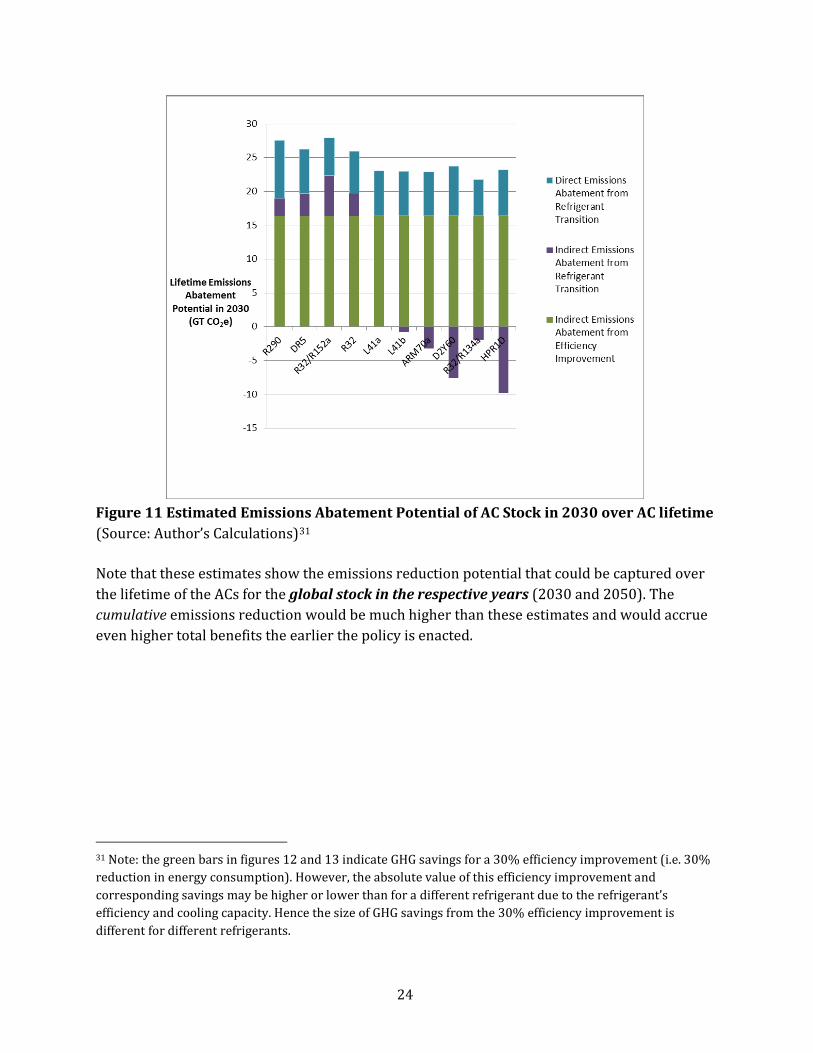
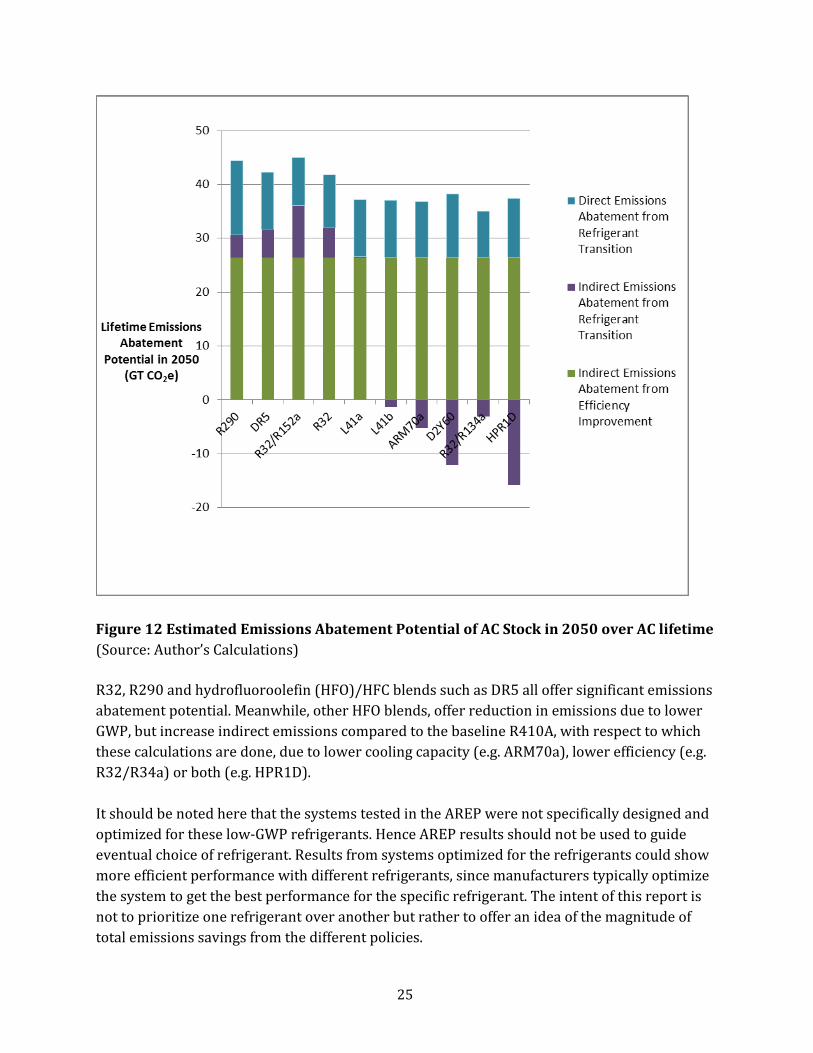
Figure 11 and Figure 12 show the estimated emissions abatement over the lifetime of the AC if the global stock of ACs (in 2030 and 2050 respectively) is switched to more efficient ACs with lower GWP refrigerants. The green bars in both charts indicate the emissions abatement over the lifetime of the AC if the global stock (in 2030 and 2050 respectively) is made 30% more efficient. The purple and blue bars indicate the indirect and direct emissions abatement over the lifetime of the AC if the global stock (in 2030 and 2050 respectively) is switched to the lower GWP refrigerant.
24
Figure 11 Estimated Emissions Abatement Potential of AC Stock in 2030 over AC lifetime (Source: Author’s Calculations)31 Note that these estimates show the emissions reduction potential that could be captured over the lifetime of the ACs for the global stock in the respective years (2030 and 2050). The cumulative emissions reduction would be much higher than these estimates and would accrue even higher total benefits the earlier the policy is enacted.
31 Note: the green bars in figures 12 and 13 indicate GHG savings for a 30% efficiency improvement (i.e. 30% reduction in energy consumption). However, the absolute value of this efficiency improvement and corresponding savings may be higher or lower than for a different refrigerant due to the refrigerant’s efficiency and cooling capacity. Hence the size of GHG savings from the 30% efficiency improvement is different for different refrigerants.
25
Figure 12 Estimated Emissions Abatement Potential of AC Stock in 2050 over AC lifetime (Source: Author’s Calculations) R32, R290 and hydrofluoroolefin (HFO)/HFC blends such as DR5 all offer significant emissions abatement potential. Meanwhile, other HFO blends, offer reduction in emissions due to lower GWP, but increase indirect emissions compared to the baseline R410A, with respect to which these calculations are done, due to lower cooling capacity (e.g. ARM70a), lower efficiency (e.g. R32/R34a) or both (e.g. HPR1D). It should be noted here that the systems tested in the AREP were not specifically designed and optimized for these low-GWP refrigerants. Hence AREP results should not be used to guide eventual choice of refrigerant. Results from systems optimized for the refrigerants could show more efficient performance with different refrigerants, since manufacturers typically optimize the system to get the best performance for the specific refrigerant. The intent of this report is not to prioritize one refrigerant over another but rather to offer an idea of the magnitude of total emissions savings from the different policies.
26
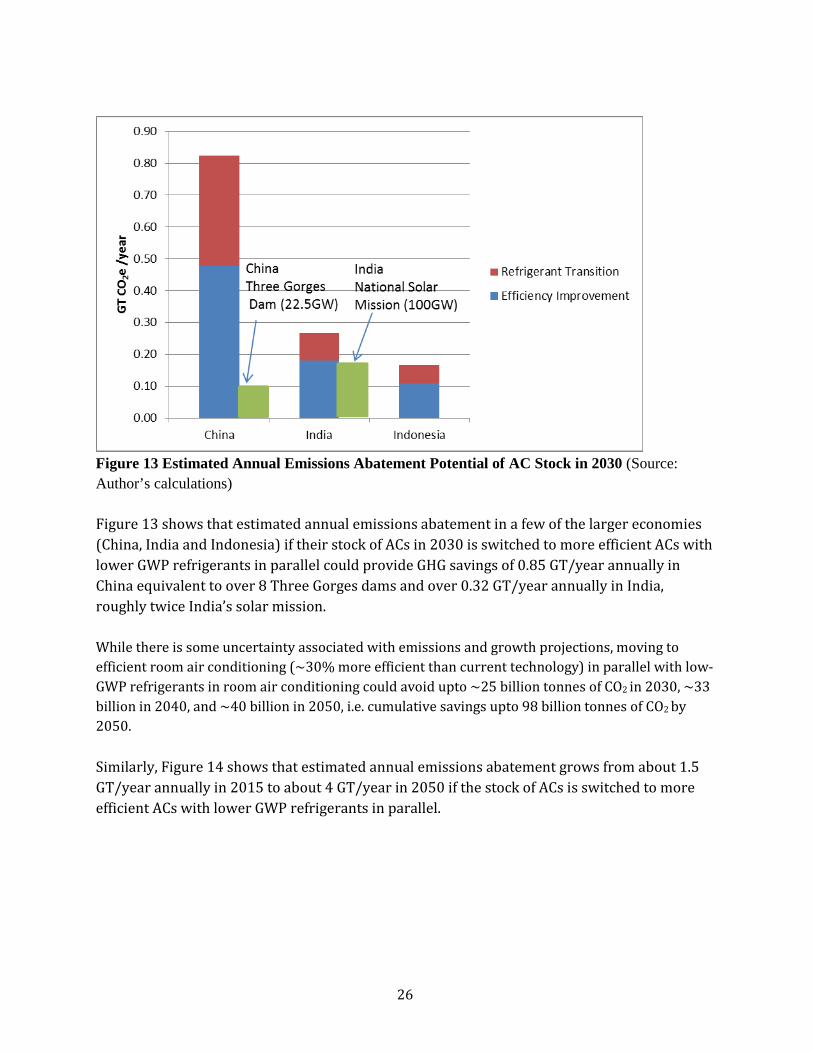
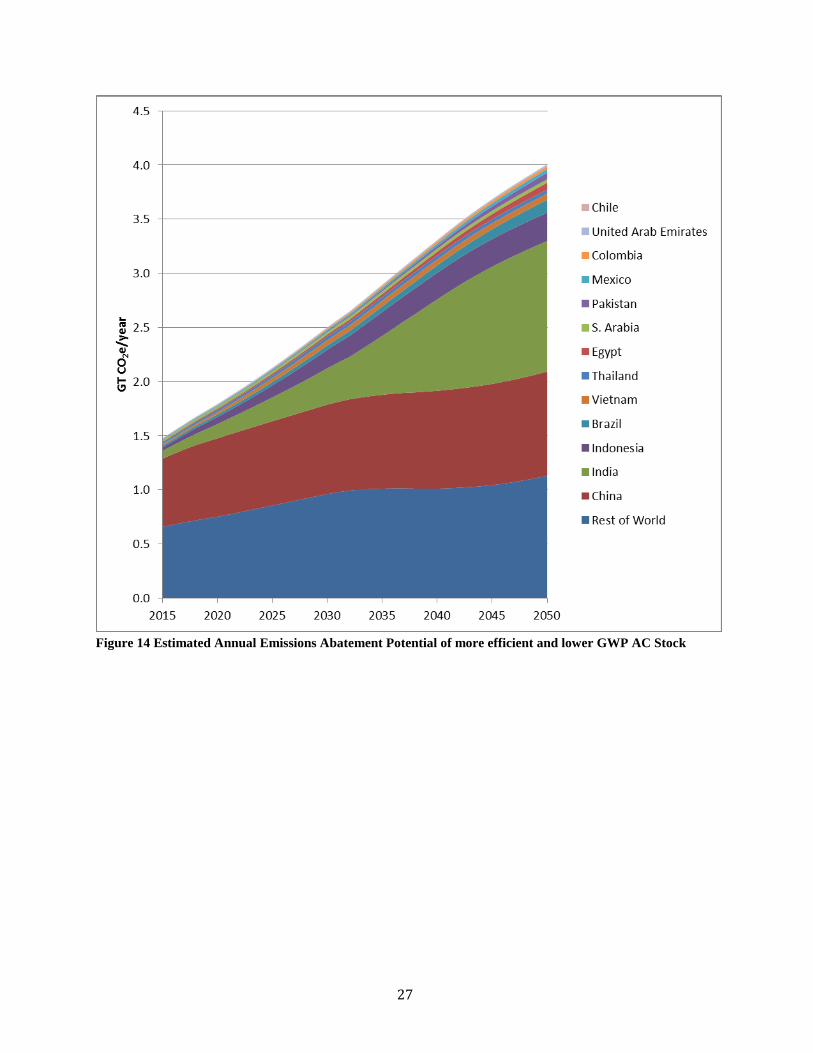
Figure 13 Estimated Annual Emissions Abatement Potential of AC Stock in 2030 (Source: Author’s calculations) Figure 13 shows that estimated annual emissions abatement in a few of the larger economies (China, India and Indonesia) if their stock of ACs in 2030 is switched to more efficient ACs with lower GWP refrigerants in parallel could provide GHG savings of 0.85 GT/year annually in China equivalent to over 8 Three Gorges dams and over 0.32 GT/year annually in India, roughly twice India’s solar mission. While there is some uncertainty associated with emissions and growth projections, moving to efficient room air conditioning (~30% more efficient than current technology) in parallel with low-GWP refrigerants in room air conditioning could avoid upto ~25 billion tonnes of CO2 in 2030, ~33 billion in 2040, and ~40 billion in 2050, i.e. cumulative savings upto 98 billion tonnes of CO2 by 2050. Similarly, Figure 14 shows that estimated annual emissions abatement grows from about 1.5 GT/year annually in 2015 to about 4 GT/year in 2050 if the stock of ACs is switched to more efficient ACs with lower GWP refrigerants in parallel.
27
Figure 14 Estimated Annual Emissions Abatement Potential of more efficient and lower GWP AC Stock
28
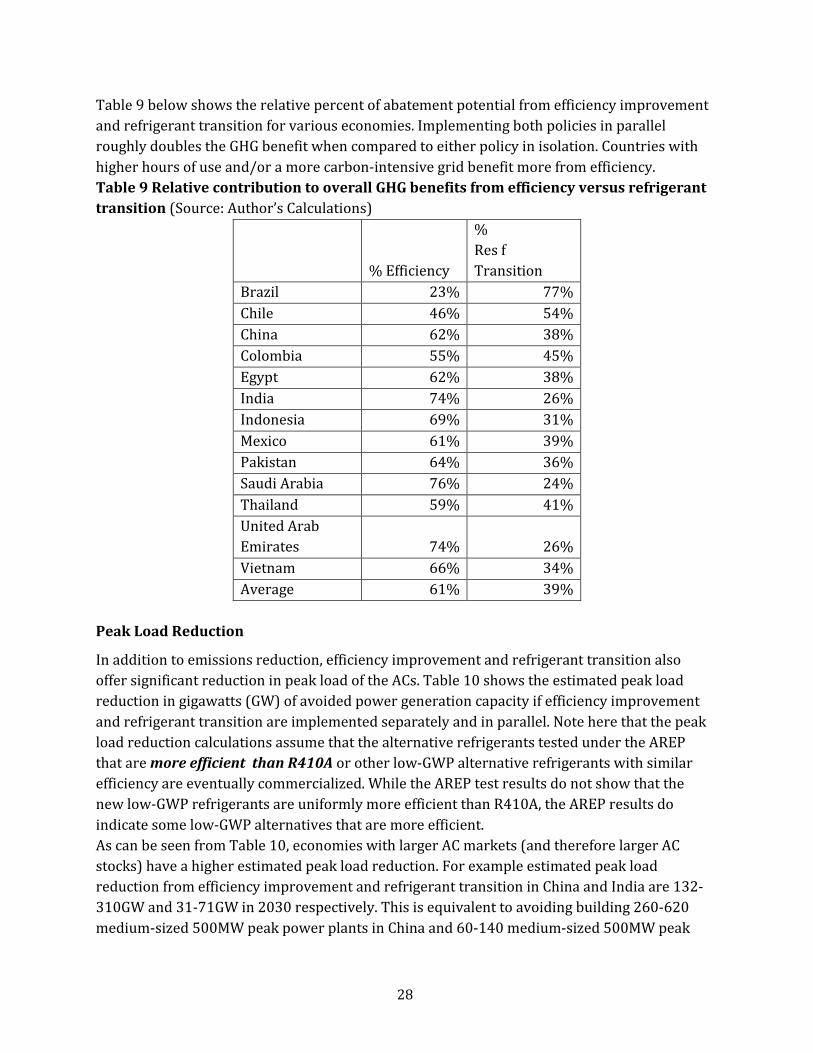
Table 9 below shows the relative percent of abatement potential from efficiency improvement and refrigerant transition for various economies. Implementing both policies in parallel roughly doubles the GHG benefit when compared to either policy in isolation. Countries with higher hours of use and/or a more carbon-intensive grid benefit more from efficiency. Table 9 Relative contribution to overall GHG benefits from efficiency versus refrigerant transition (Source: Author’s Calculations)
% Efficiency
% Res f Transition
Brazil 23% 77% Chile 46% 54% China 62% 38% Colombia 55% 45% Egypt 62% 38% India 74% 26% Indonesia 69% 31% Mexico 61% 39% Pakistan 64% 36% Saudi Arabia 76% 24% Thailand 59% 41% United Arab Emirates 74% 26% Vietnam 66% 34% Average 61% 39%
Peak Load Reduction
In addition to emissions reduction, efficiency improvement and refrigerant transition also offer significant reduction in peak load of the ACs. Table 10 shows the estimated peak load reduction in gigawatts (GW) of avoided power generation capacity if efficiency improvement and refrigerant transition are implemented separately and in parallel. Note here that the peak load reduction calculations assume that the alternative refrigerants tested under the AREP that are more efficient than R410A or other low-GWP alternative refrigerants with similar efficiency are eventually commercialized. While the AREP test results do not show that the new low-GWP refrigerants are uniformly more efficient than R410A, the AREP results do indicate some low-GWP alternatives that are more efficient. As can be seen from Table 10, economies with larger AC markets (and therefore larger AC stocks) have a higher estimated peak load reduction. For example estimated peak load reduction from efficiency improvement and refrigerant transition in China and India are 132-310GW and 31-71GW in 2030 respectively. This is equivalent to avoiding building 260-620 medium-sized 500MW peak power plants in China and 60-140 medium-sized 500MW peak
29
power plants in India respectively. This scale is comparable to India’s renewable energy capacity targets of 100GW of solar and 75GW of wind energy generation capacity.
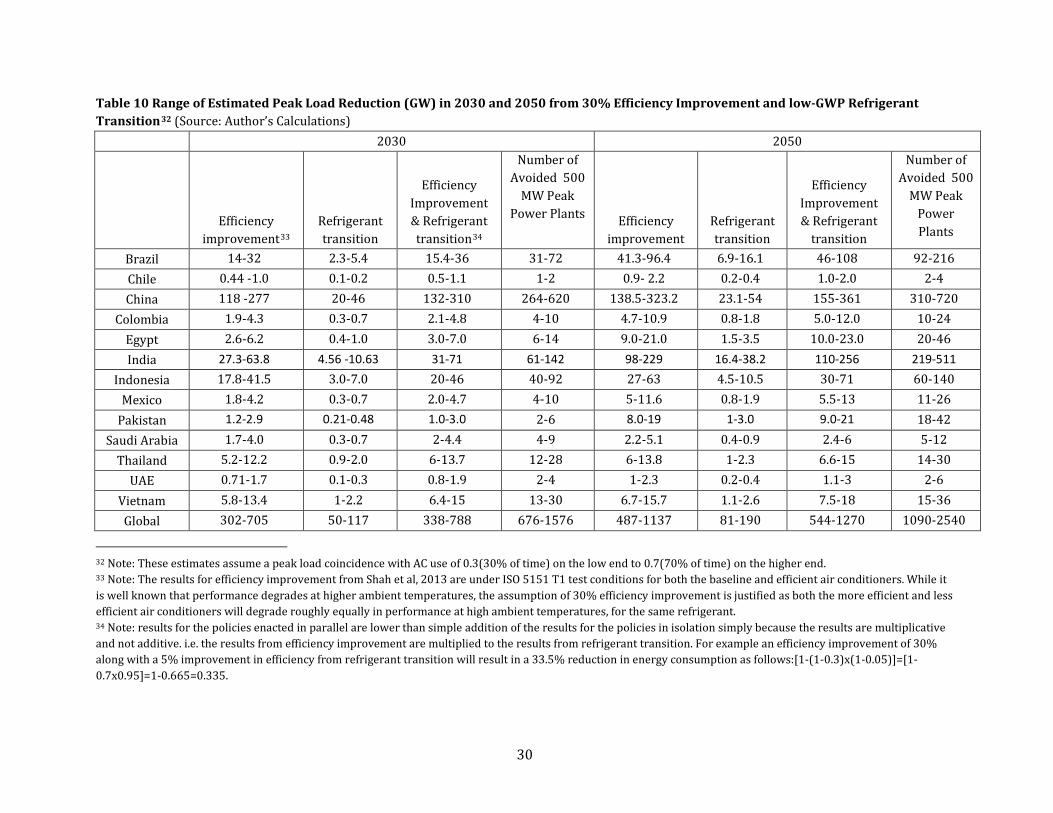
30
Table 10 Range of Estimated Peak Load Reduction (GW) in 2030 and 2050 from 30% Efficiency Improvement and low-GWP Refrigerant Transition32 (Source: Author’s Calculations)
2030 2050
Efficiency
improvement33 Refrigerant transition
Efficiency Improvement & Refrigerant transition34
Number of Avoided 500
MW Peak Power Plants Efficiency
improvement Refrigerant transition
Efficiency Improvement & Refrigerant
transition
Number of Avoided 500
MW Peak Power Plants
Brazil 14-32 2.3-5.4 15.4-36 31-72 41.3-96.4 6.9-16.1 46-108 92-216 Chile 0.44 -1.0 0.1-0.2 0.5-1.1 1-2 0.9- 2.2 0.2-0.4 1.0-2.0 2-4 China 118 -277 20-46 132-310 264-620 138.5-323.2 23.1-54 155-361 310-720
Colombia 1.9-4.3 0.3-0.7 2.1-4.8 4-10 4.7-10.9 0.8-1.8 5.0-12.0 10-24 Egypt 2.6-6.2 0.4-1.0 3.0-7.0 6-14 9.0-21.0 1.5-3.5 10.0-23.0 20-46 India 27.3-63.8 4.56 -10.63 31-71 61-142 98-229 16.4-38.2 110-256 219-511
Indonesia 17.8-41.5 3.0-7.0 20-46 40-92 27-63 4.5-10.5 30-71 60-140 Mexico 1.8-4.2 0.3-0.7 2.0-4.7 4-10 5-11.6 0.8-1.9 5.5-13 11-26
Pakistan 1.2-2.9 0.21-0.48 1.0-3.0 2-6 8.0-19 1-3.0 9.0-21 18-42 Saudi Arabia 1.7-4.0 0.3-0.7 2-4.4 4-9 2.2-5.1 0.4-0.9 2.4-6 5-12
Thailand 5.2-12.2 0.9-2.0 6-13.7 12-28 6-13.8 1-2.3 6.6-15 14-30 UAE 0.71-1.7 0.1-0.3 0.8-1.9 2-4 1-2.3 0.2-0.4 1.1-3 2-6
Vietnam 5.8-13.4 1-2.2 6.4-15 13-30 6.7-15.7 1.1-2.6 7.5-18 15-36 Global 302-705 50-117 338-788 676-1576 487-1137 81-190 544-1270 1090-2540
32 Note: These estimates assume a peak load coincidence with AC use of 0.3(30% of time) on the low end to 0.7(70% of time) on the higher end. 33 Note: The results for efficiency improvement from Shah et al, 2013 are under ISO 5151 T1 test conditions for both the baseline and efficient air conditioners. While it is well known that performance degrades at higher ambient temperatures, the assumption of 30% efficiency improvement is justified as both the more efficient and less efficient air conditioners will degrade roughly equally in performance at high ambient temperatures, for the same refrigerant. 34 Note: results for the policies enacted in parallel are lower than simple addition of the results for the policies in isolation simply because the results are multiplicative and not additive. i.e. the results from efficiency improvement are multiplied to the results from refrigerant transition. For example an efficiency improvement of 30% along with a 5% improvement in efficiency from refrigerant transition will result in a 33.5% reduction in energy consumption as follows:[1-(1-0.3)x(1-0.05)]=[1-0.7x0.95]=1-0.665=0.335.
31
9. Conclusion
The world room air conditioner market is growing fast with increasing urbanization, electrification, rising incomes and falling air conditioner prices in many developing economies. We estimate an additional 700 million units will be added to the global AC stock by 2030 and 1.6 billion by 2050 under current trends. In the absence of policy to mitigate the impact of this growth, it is expected to have a large-scale impact on electricity generation capacity and peak load particularly in economies with hot climates, and contribute significantly to GHG emissions. Hydrofluorocarbon (HFC) refrigerants are now the fastest growing greenhouse gases (GHGs growing at the rate of 10-15% every year, and summer peak load due to space cooling already comprises 40-60% of the total load in cities in hot climates such as Delhi. Phasing down HFCs and other short-lived climate pollutants (SLCPs) offers faster climate change mitigation than control of CO2 alone. This has led to many proposals and strong support for phasing down HFC refrigerants under the Montreal Protocol. Simultaneously, energy efficiency market transformation programs are endeavoring to improve the energy efficiency for refrigeration and air conditioning equipment to provide life cycle cost, energy, GHG, and peak load savings. These two trends offer an opportunity to implement energy efficiency and refrigerant transition policies in parallel. We find that implementing refrigerant transition and energy efficiency improvement policies in parallel for room air conditioners, roughly doubles the benefit of either policy implemented in isolation. Countries with higher hours of use or a more carbon intensive grid benefit more from efficiency. Shifting the 2030 world stock of room air conditioners from low efficiency technology using high-GWP refrigerants to higher efficiency technology and lower-GWP refrigerants in parallel would save over 25 GT of CO2 equivalent emissions over the lifetime of these air conditioners and would offer significant peak load reduction between 340-780 GW globally with 132-310 GW reduction in China and 31-71 GW in India in 2030 respectively. This is equivalent to avoiding building 260-620 medium-sized 500 MW peak power plants in China and 60-140 medium-sized 500 MW peak power plants in India respectively by 2030. This would save 0.85 GT/year annually in China equivalent to over 8 Three Gorges dams and over 0.32 GT/year annually in India, roughly twice India’s 100GW solar mission, and therefore merits similar serious consideration to maximize peak load reduction and GHG savings.
32
Globally, the estimated annual emissions abatement grows from about 1.5 GT/year annually in 2015 to about 4 GT/year in 2050 if the stock of ACs is switched to more efficient ACs with lower GWP refrigerants in parallel. While there is some uncertainty associated with emissions and growth projections, moving to efficient room air conditioning (~30% more efficient than current technology) in parallel with low-GWP refrigerants in room air conditioning could avoid upto ~25 billion tonnes of CO2 in 2030, ~33 billion in 2040, and ~40 billion in 2050, i.e. cumulative savings upto 98 billion tonnes of CO2 by 2050. Although quantification of the benefits of similar parallel energy efficiency improvement and refrigerant transition in other refrigerant-using sectors e.g. mobile air conditioning, commercial air conditioning and domestic and commercial refrigeration is beyond the scope of this study, it is possible that doing so could result in large additional energy savings/GHG mitigation and a significant percentage of the GHG mitigation required to avoid the 2° C threshold for increase in average global temperature, and should therefore be the subject of further study in the future.
33
References
Alabdulkarem A., Y. Hwang, R. Radermache. “System Drop - In Tests of Refrigerants R - 32, D2Y - 60, and L - 41a in Air Source Heat Pump” Air -Conditioning, Heating, and Refrigeration Institute (AHRI) Low - GWP Alternative Refrigerants Evaluation Program (Low - GWP AREP) Test Report #20, 2013 Al-Sulaiman, F.A. S.M. Zubair. “A survey of energy consumption and failure patterns of residential air-conditioning units in Eastern Saudi Arabia”, Energy, Volume 21, Issue 10, October 1996, Pages 967-975, ISSN 0360-5442 Air conditioning, Heating and Refrigeration Institute, (AHRI) 2014, “Overview of AHRI Low-GWP Alternative Refrigerants Evaluation Program (Low-GWP AREP)” Webinar for the Superefficient Equipment and Appliance Deployment(SEAD) Initiative, Phillip Johnson and Xudong Wang. 30th October 2014. American Mini-splits. “Mini-split Specifications.” Accessed 6 April 2015. http://www.americanminisplits.com/minisplitspecifications.html. Andersen, S.O., M.L. Halberstadt, N. Borgford-Parnell, Stratospheric ozone, global warming, and the principle of unintended consequences—An ongoing science and policy success story, Journal of the Air & Waste Management Association, 63:6, 607-647, DOI: 10.1080/10962247.2013.791349, 2013 ASHRAE, 2010, ASHRAE Standard 34: Designation and Safety Classification of Refrigerants, American Society of Heating, Refrigerating, and Air-Conditioning Engineers, Inc. BSRIA, 2011 “Split Systems”- Multi-client country studies, Building Services Research and Information Association. BSRIA, 2014 “Split Systems”- Multi-client country studies, Building Services Research and Information Association. Calm, J. 2008 , “The next generation of refrigerants- Historical review, considerations and outlook” International Journal of Refrigeration, http://www.sciencedirect.com/science/article/pii/S0140700708000261 CLASP, Technoeconomic Assessment, Revision and Ratcheting up of energy performance standards for room airconditioners <3TR, CLASP report (unpublished draft) De Blas, J., “Propane as a Refrigerant for Heat Pump Applications in Southern Europe”, IEA Heat Pump Center Newsletter, Vol. 18, No. 4, 2000 Devotta, S., Padalkar, A.S., and Sane, N.K., “Performance Assessment of HC-290 as a Drop-In Substitute for HCFC-22 in a Window Air Conditioner”, International Journal of Refrigeration, Vol.
34
28, Issue 4, June 2005, p. 594-604 DOE 2011, “Technical Support Document: Energy Efficiency Program for Consumer Products: Residential Central Air Conditioners, Heat Pumps, and Furnaces” available at:
http://www.regulations.gov/#!documentDetail;D=EERE-2011-BT-STD-0011-0012 DSLDC, “Hourly Demand Data from the State Load Dispatch Center” Delhi State Load Dispatch Center, 2012. EIA, Annual Energy Outlook 2014, DOE/EIA-0383(2014) (Washington, DC: May 2014); AEO2014 National Energy Information Administration (EIA) 2015a. “Brazil International Energy Data and Analysis.” Accessed 2 June 2015. http://www.eia.gov/beta/international/analysis.cfm?iso=BRA. Energy Information Administration (EIA) 2015b. “Japan International Energy Data and Analysis.” Accessed 2 June 2015. http://www.eia.gov/beta/international/analysis.cfm?iso=JPN. EPA 2014, Greenhouse Gas Inventory Guidance - Direct Fugitive Emissions from Refrigeration, Air Conditioning, Fire Suppression, and Industrial Gases, United States Environmental Protection Agency, November 2014. Available at http://www.epa.gov/climateleadership/documents/resources/mfgrfg.pdf, accessed 2 June 2015. EuP, 2009: “Preparatory study on the environmental performance of residential room conditioning appliances (air conditioning and ventilation)”, Tasks 1-8, ARMINES, Université de Liège, University of Porto, Austrian Energy Agency, BRE, IASA, December 2008 Fridley, D., N. Zheng, N. Zhou, J. Ke, . Hasanbeigi, W.R. Morrow, and L.K. Price. “China Energy and Emissions Paths to 2030”, Berkeley: LBNL 2012. Gallagher, G, T. Zhan, Y.K. Hsu, P. Gupta, J. Pederson, B. Croes, D.R. Blake, B. Barletta, S. Meinardi, P Ashford, A. Vetter S. Saba, R. Slim, L. Palandre, D. Clodic, P. Mathis, M. Wagner, J. Forgie, H. Dwyer, K. Wolf. “High-global warming potential F-gas emissions in California: comparison of ambient-based versus inventory-based emission estimates, and implications of refined estimates”, Environ Sci Technol. 2014 Jan 21;48(2):1084-93. doi: 10.1021/es403447v. Goetzler W., Sutherland, T., Rassi, M., Burgos, J. 2014 “Research & Development Roadmap for Next-Generation Low Global Warming Potential Refrigerants”, Navigant Consulting, November 2014 http://energy.gov/sites/prod/files/2014/12/f19/Refrigerants%20Roadmap%20Final%20Report%202014.pdf Hu A., Xu Y., Tebaldi C., Washington W.M., and Ramanathan, V. Mitigation of Short-Lived Climate
35
Pollutants Slows Sea-Level Rise, Nature Climate Change 2013. Intergovernmental Panel on Climate Change (IPCC), 2006, Emissions of Fluorinated Substitutes for Ozone Depleting Substances, 2006 IPCC Guidelines for National Greenhouse Gas Inventories, Volume 3: Industrial Processes and Product Use. Available at http://www.ipcc-nggip.iges.or.jp/public/2006gl/pdf/3_Volume3/V3_7_Ch7_ODS_Substitutes.pdf, accessed 3 June 2015. Intergovernmental Panel on Climate Change (IPCC) 2011. “Carbon dioxide intensities of fuels and electricity for regions and countries.” Accessed 20 March 2015. https://www.ipcc.ch/pdf/special-reports/sroc/Tables/t0305.pdf ICP Navigator Distributor Resources. “Service Manual R−410A Ductless Split System Air Conditioner and Heat Pump.” Accessed 6 April 2015. http://icpindexing.toddsit.com/documents/086477/42108920400.pdf. Institute for Global Environmental Strategies (IGES). “List of Grid Emission Factors.” Accessed 2 June 2015. http://enviroscope.iges.or.jp/modules/envirolib/view.php?docid=2136, International Institute of Refrigeration (IIR). “Containment of Refrigerants within Refrigeration, Air Conditioning and Heat Pump Systems.” Accessed 2 June 2015. http://www.iifiir.org/userfiles/file/publications/notes/NoteTech_24_EN.pdf Itron Inc and Lawrence Berkeley National Laboratory, “End-use Peak Load Forecast for the Western Electricity Coordinating Council”, unpublished, 2012. Korea Energy Management Corporation (KEMCO). Database of Products registered in Energy
Efficiency Standards and Labels. Accessed 15 June, 2015. http://bpms.kemco.or.kr/efficiency_system/product/pd0020.aspx
Lim E. and Hern S. “System Drop-in Test of Refrigerant Blend R-32/R-134a(95/5), R-32, and DR-5 in Water-To-Water Heat Pump” Air -Conditioning, Heating, and Refrigeration Institute (AHRI) Low - GWP Alternative Refrigerants Evaluation Program (Low - GWP AREP) Test Report #16, 2013. NBSC (2014). China Statistical Yearbook, National Bureau of Statistics of China McNeil, M.A, V.E. Letschert, S. de la Rue du Can, J. Ke , Bottom–Up Energy Analysis System (BUENAS)—an international appliance efficiency policy tool, Energy Efficiency, ISSN 1570-646X, Volume 6, Number 2, Energy Efficiency (2013) 6:191-217, DOI 10.1007/s12053-012-9182-6 McNeil, M. and V.E. Letschert, 2007, Future Air Conditioning Energy Consumption in Developing Countries and what can be done about it: The Potential of Efficiency in the Residential Sector, ECEEE NSSO, “Household Consumption of Various Goods and Services in India (2009-2010)” National
36
Sample Survey Organization, Ministry of Statistics and Program Implementation, Government of India, 2012. Phadke, A., N. Abhyankar, and N. Shah, 2013 “Avoiding 100 New Power Plants by Increasing Efficiency of Room Air Conditioners in India: Opportunities and Challenges” Presented at Energy Efficiency in Domestic Appliances and Lighting Conference, Coimbra, Portugal, 11-13 September, 2013. Available at:
https://ies.lbl.gov/publications/avoiding-100-new-power-plants-incre-0 Schultz, K. (2014) “Summary of Low-GWP AREP System Drop-in Tests of R410A Alternative Refrigerants”, AHRI Low-GWP AREP Conference, New York, USA, January 16, 2014. Lim and Hern, 2013; Schultz K, and Kujak S.” System Drop-in Test of R-410AAlternative Fluids (ARM-32a, ARM-70a,DR-5, HPR1D, L-41a, L-41b, and R-32)in a 5-RT Air-CooledWater Chiller (Cooling Mode) Air -Conditioning, Heating, and Refrigeration Institute (AHRI) Low - GWP Alternative Refrigerants Evaluation Program (Low - GWP AREP) Test Report #1, 2012. Shah, N., P. Waide and A. Phadke “Cooling the Planet: Opportunities for Deployment of Superefficient Room Air conditioners” Lawrence Berkeley National Laboratory and Navigant consulting, Inc., 2013. Sivak, M., “Potential energy demand for cooling in the 50 largest metropolitan areas of the world: Implications for developing countries”, Energy Policy, 2009 . Smith, R., K. Meng, Z. Dong, and R. Simpson, “Demand response: a strategy to address residential air-conditioning peak load in Australia”, J. Mod. Power Syst. Clean Energy, 2013. Tio E., Linkous R., Durfee, N., Abdelaziz O. “System Drop-in Test of R-32/R-152a (95/5) in a 5-ton Air Source Heat Pump” Air -Conditioning, Heating, and Refrigeration Institute (AHRI) Low - GWP Alternative Refrigerants Evaluation Program (Low - GWP AREP) Test Report #3, 2012. Trane Corporation. “Technical Service Manual R-410A Split System Single Split 16~18 SEER, Inverter Systems - 60 and 50 Hz.” Accessed 6 April 2015. http://www.trane.cl/catalogos/Split_muro_%20alta_eficiencia%20_inverter/Catalogo_Tecnico.pdf UNEP 2003, 2002 Report of the Refrigeration , Air Conditioning and Heat Pumps Technical Options Committee 2002 Assessment, Nairobi, January 2003 UNEP,2011 “HFCs: A Critical Link in Protecting Climate and the Ozone Layer” A UNEP Synthesis Report, United Nations Environment Program, 2011. http://www.unep.org/dewa/Portals/67/pdf/HFC_report.pdf Velders G.J. M., D.W. Fahey, J.S. Daniel, M. McFarland, S.O. Andersen . (2012) Preserving Montreal
37
Protocol Climate Benefits by Limiting HFCs, SCIENCE 335; World Bank. “Electric power transmission and distribution losses (% of output).” Accessed 8 June 2015. http://data.worldbank.org/indicator/EG.ELC.LOSS.ZS. Wang, X. and K. Amrane, "AHRI Low Global Warming Potential Alternative Refrigerants Evaluation Program (Low-GWP AREP) – Summary of Phase I Testing Results" (2014). International Refrigeration and Air Conditioning Conference. Paper 1416. http://docs.lib.purdue.edu/iracc/1416 Xu Y., Zaelke D., Velders G. J. M., & Ramanathan V. (2013) The role of HFCs in mitigating 21st century climate change, ATMOS. CHEM. PHYS., 13:6083-6089; Xu, B., Chen, J., Qi, Z., and Li, F., “Experimental Study of R-290 Enhanced System Performance in Residential Air-Conditioners and Heat Pumps”, International Congress of Refrigeration, Prague, Czech Republic, August 21-26 2011.
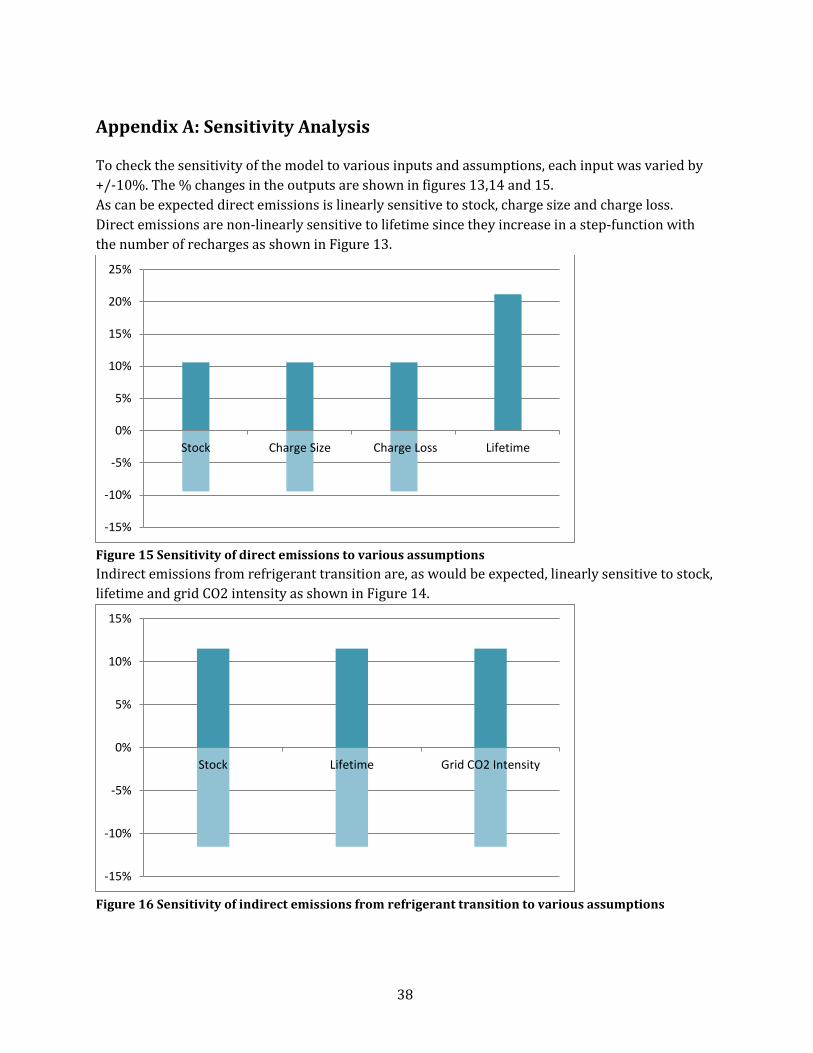
38
Appendix A: Sensitivity Analysis
To check the sensitivity of the model to various inputs and assumptions, each input was varied by +/-10%. The % changes in the outputs are shown in figures 13,14 and 15. As can be expected direct emissions is linearly sensitive to stock, charge size and charge loss. Direct emissions are non-linearly sensitive to lifetime since they increase in a step-function with the number of recharges as shown in Figure 13.
Figure 15 Sensitivity of direct emissions to various assumptions Indirect emissions from refrigerant transition are, as would be expected, linearly sensitive to stock, lifetime and grid CO2 intensity as shown in Figure 14.
Figure 16 Sensitivity of indirect emissions from refrigerant transition to various assumptions
-15%
-10%
-5%
0%
5%
10%
15%
20%
25%
Stock Charge Size Charge Loss Lifetime
-15%
-10%
-5%
0%
5%
10%
15%
Stock Lifetime Grid CO2 Intensity
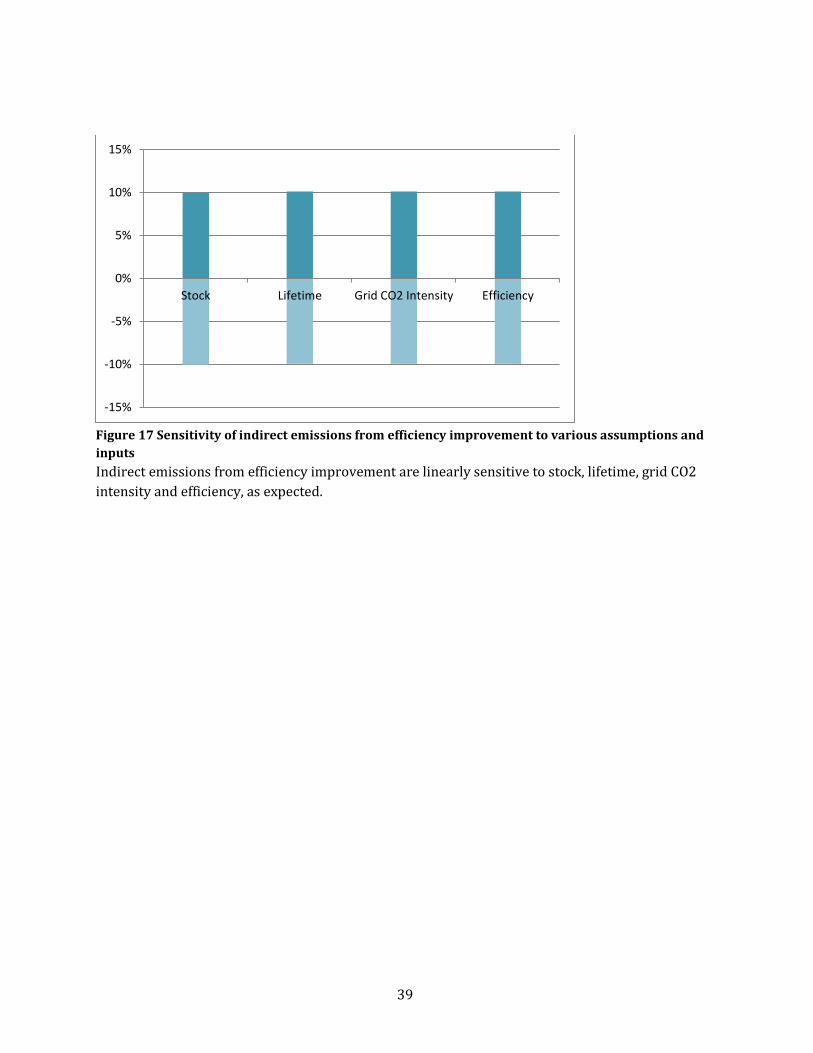
39
Figure 17 Sensitivity of indirect emissions from efficiency improvement to various assumptions and inputs Indirect emissions from efficiency improvement are linearly sensitive to stock, lifetime, grid CO2 intensity and efficiency, as expected.
-15%
-10%
-5%
0%
5%
10%
15%
Stock Lifetime Grid CO2 Intensity Efficiency


![[3] Health Systems Leapfrogging in Emerging Economies: Project](https://img.pdfslide.net/doc/110x75/586a34021a28abe7148be533/3-health-systems-leapfrogging-in-emerging-economies-project-.jpg)