Embed Size (px)
Citation preview
Benthic microbes – organisms and ecology
Helmut HillebrandPlankton Ecology Group
ICBM
Lecture aims
At the end of this lecture, students are supposed to
Know basic features of benthic microbial organisms and their substrataUnderstand the importance of ecological interactions in benthic microbial communitiesAre acquainted with experimental approaches to microbial ecology
Lecture structure
Introduction to microbial eukaryotes in the benthos and their substratumCompetitionGrazingNutrients and grazingConsumer versus resource control
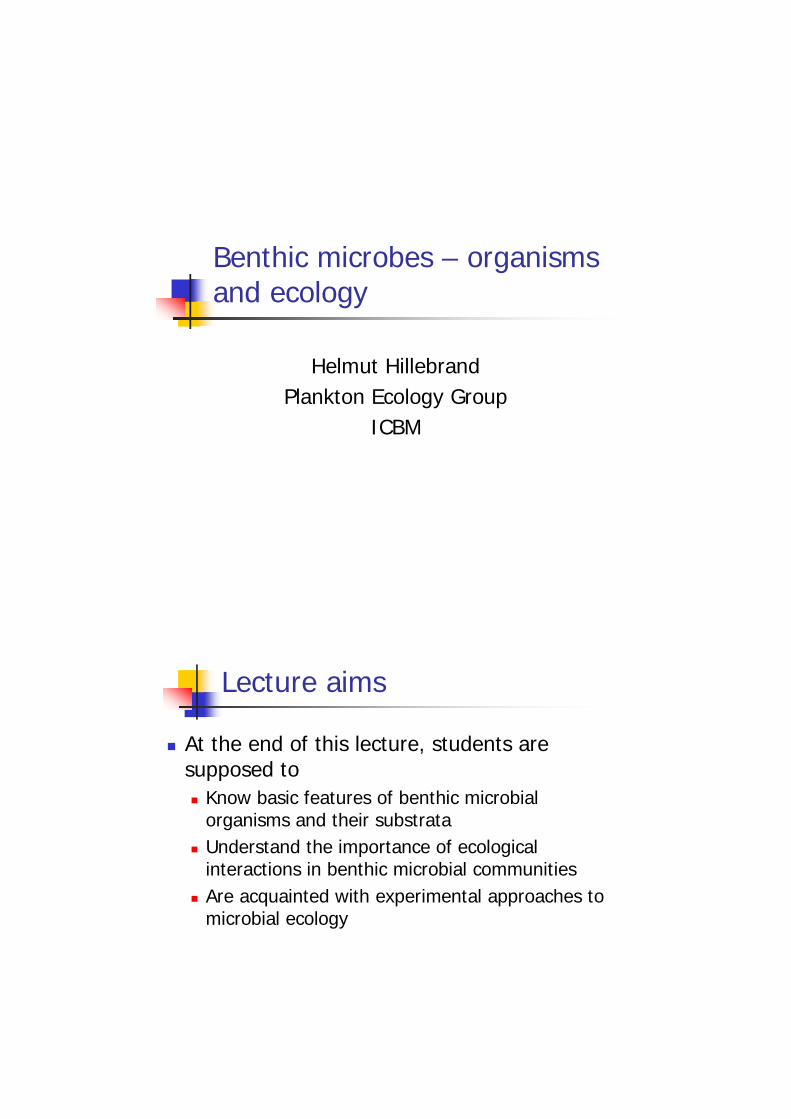
Benthic eukryotic miroorganisms encompass a majority of phylogenetic groups
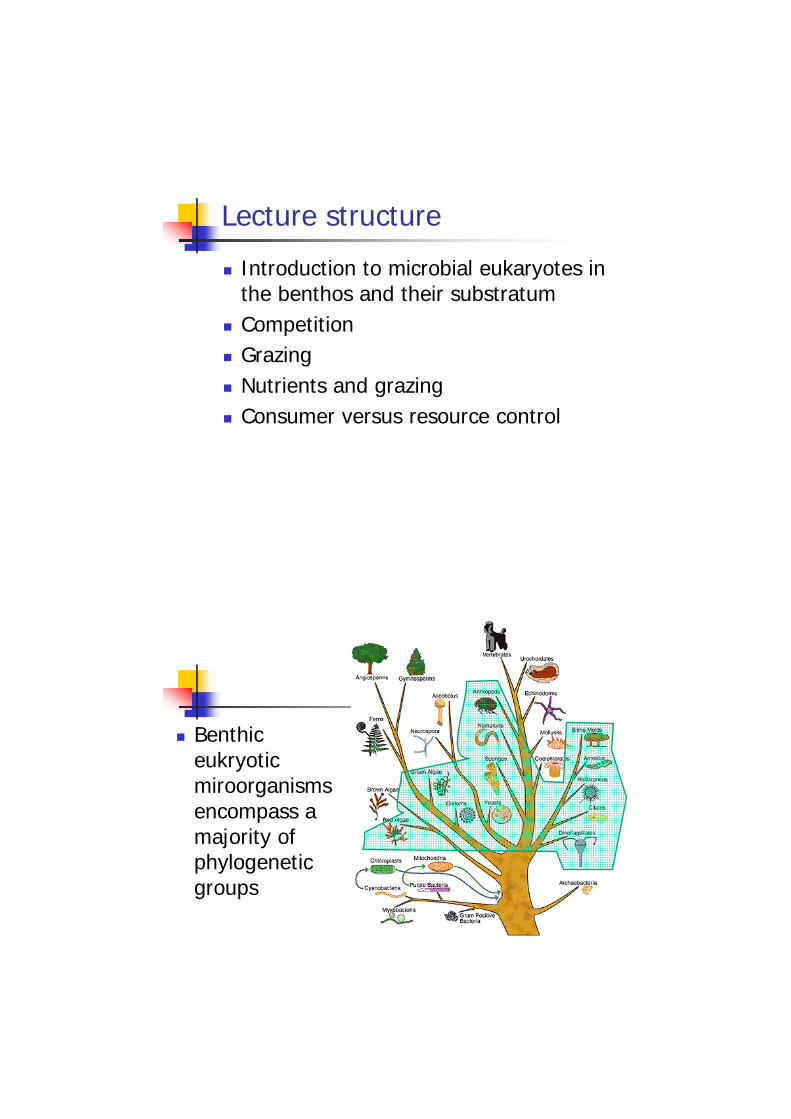
Autotrophic eukaryotes
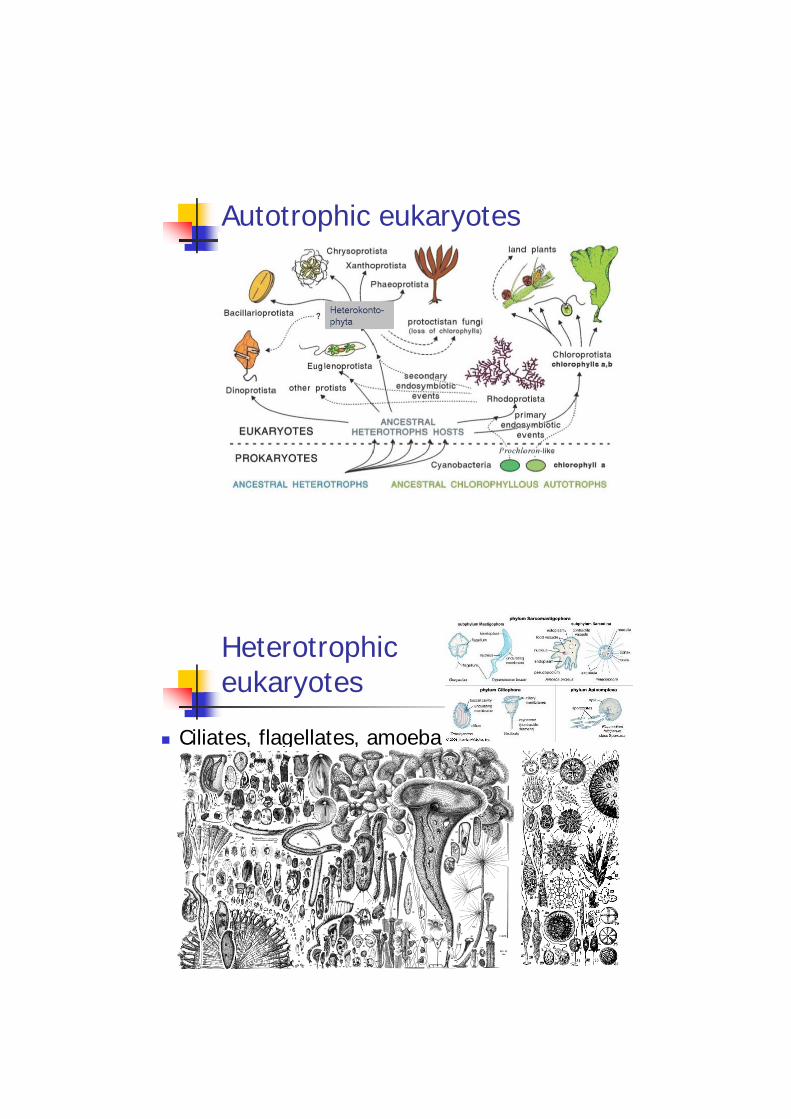
Heterotrophic eukaryotes
Ciliates, flagellates, amoeba
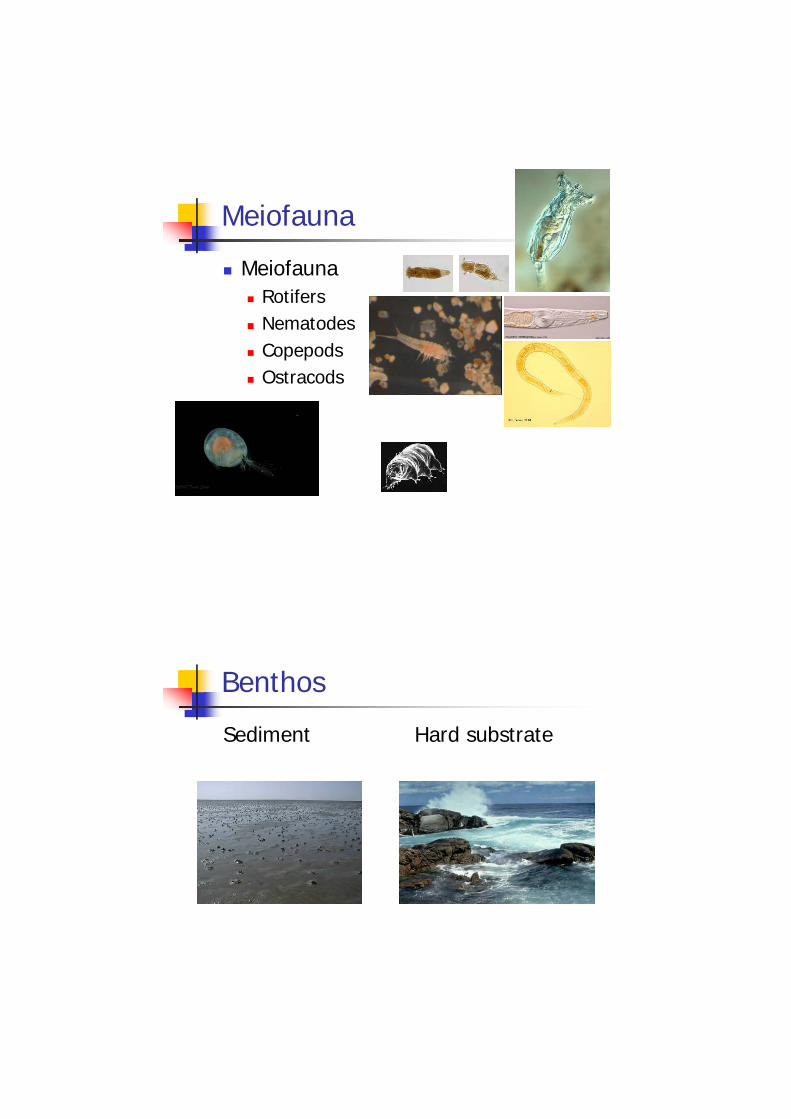
Meiofauna
MeiofaunaRotifersNematodesCopepodsOstracods
Benthos
Sediment Hard substrate
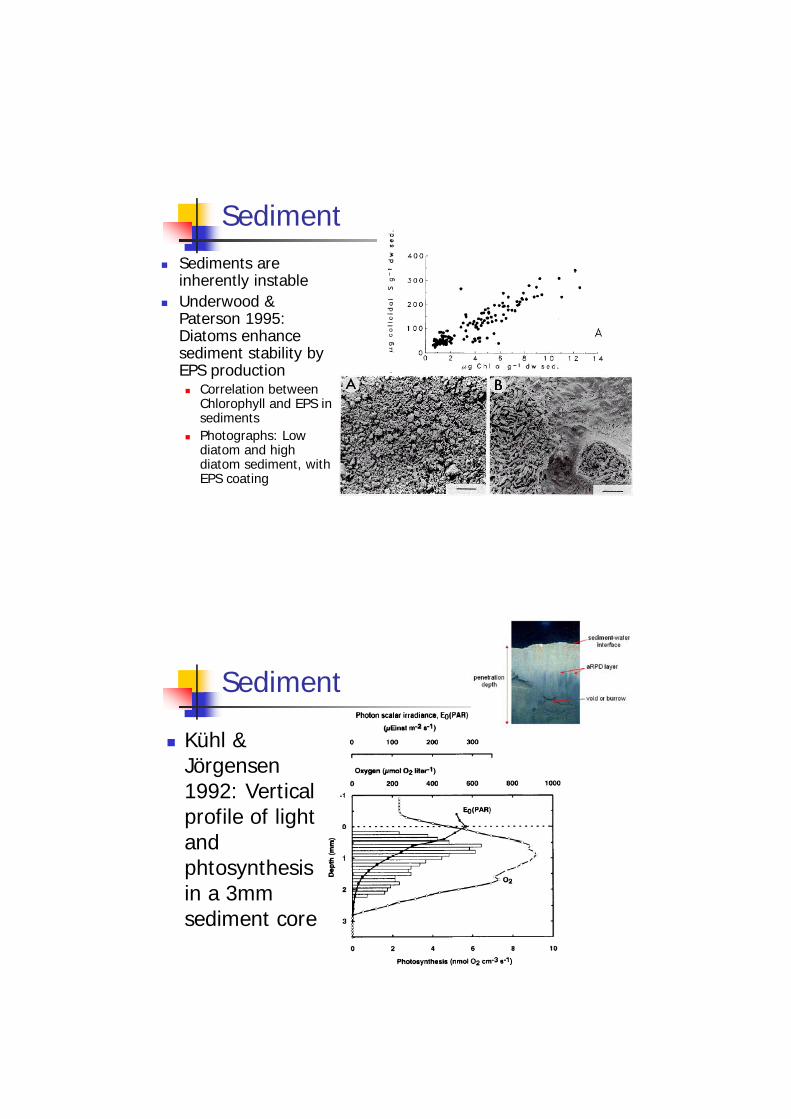
SedimentSediments areinherently instableUnderwood & Paterson 1995: Diatoms enhancesediment stability byEPS production
Correlation betweenChlorophyll and EPS in sedimentsPhotographs: Lowdiatom and high diatom sediment, withEPS coating
Sediment
Kühl & Jörgensen1992: Verticalprofile of light and phtosynthesisin a 3mmsediment core
Sediment
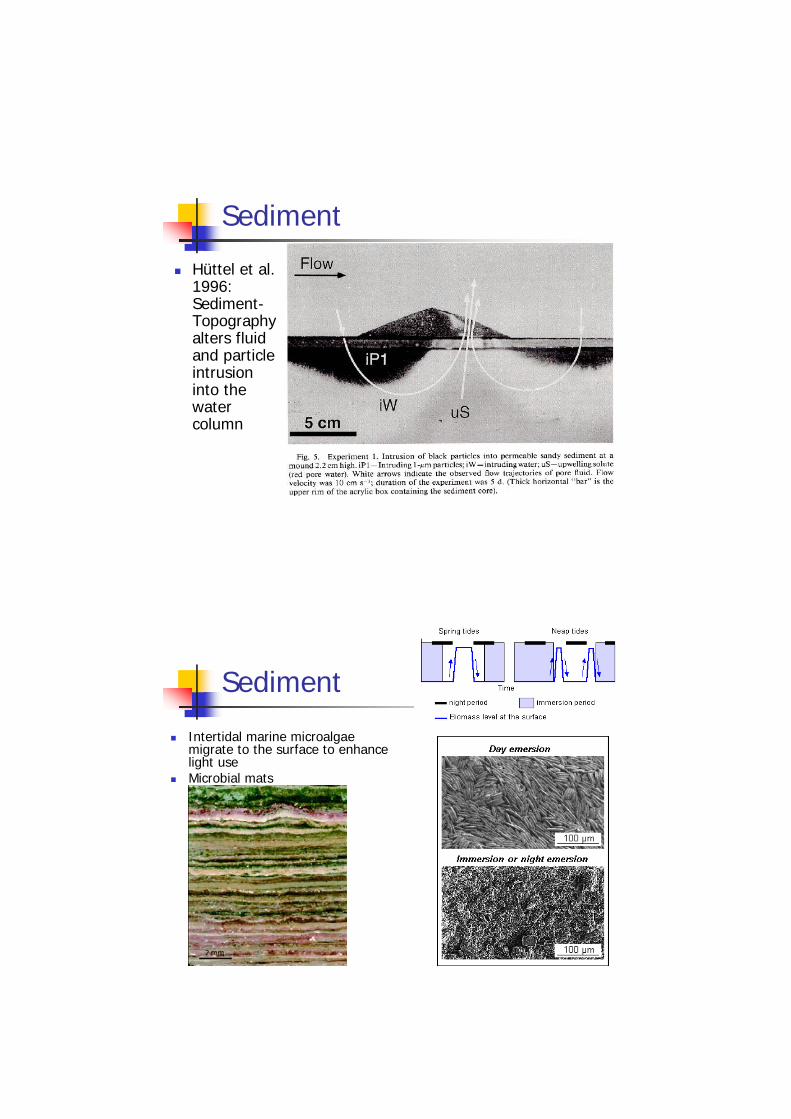
Hüttel et al. 1996: Sediment-Topographyalters fluidand particleintrusioninto thewatercolumn
Sediment
Intertidal marine microalgae migrate to the surface to enhance light useMicrobial mats
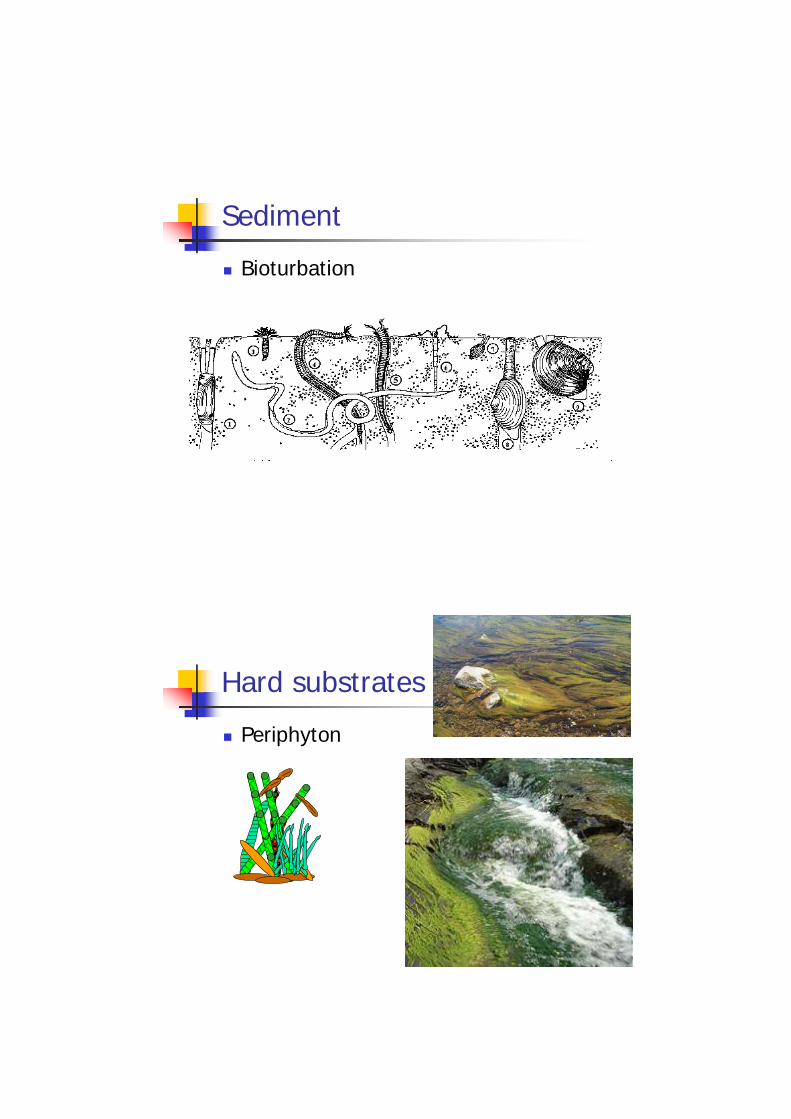
Sediment
Bioturbation
Hard substrates
Periphyton
Hard substrates
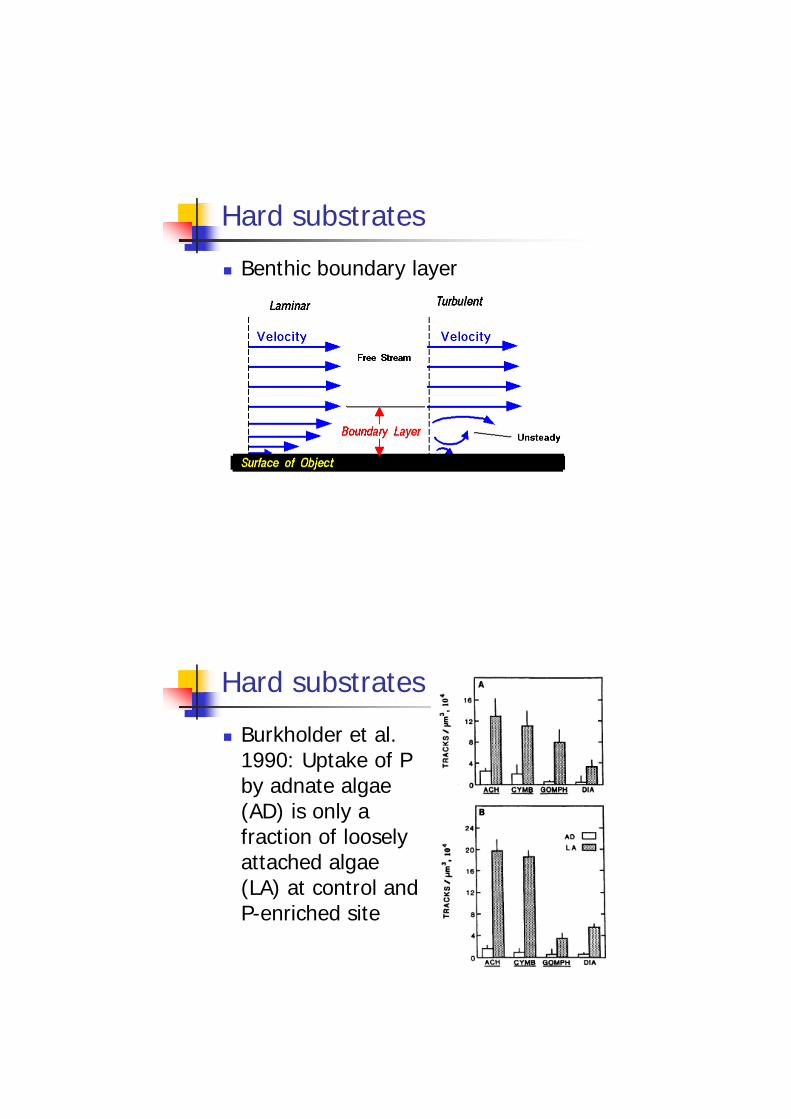
Benthic boundary layer
Hard substrates
Burkholder et al. 1990: Uptake of P by adnate algae (AD) is only a fraction of loosely attached algae (LA) at control and P-enriched site
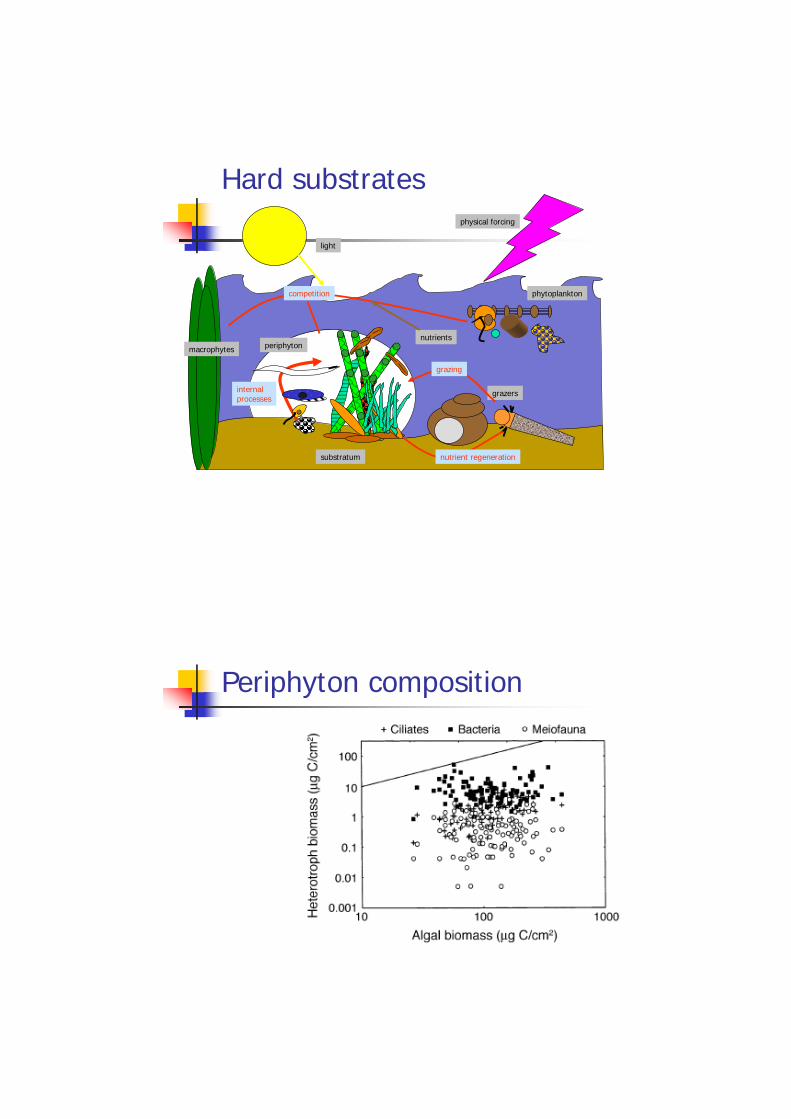
periphyton
grazers
phytoplankton
macrophytes
light
physical forcing
nutrients
substratum
competition
internal processes
nutrient regeneration
grazing
Hard substrates
Periphyton composition
Colonization
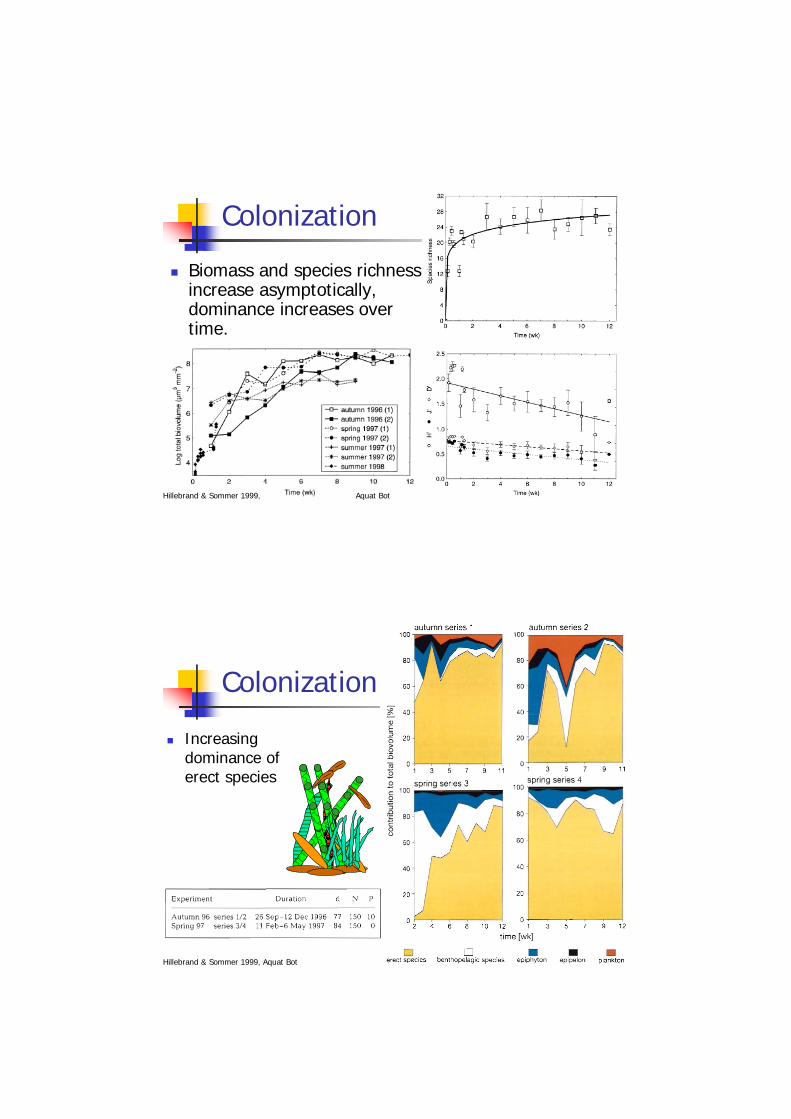
Biomass and species richness increase asymptotically, dominance increases over time.
Hillebrand & Sommer 1999, Aquat Bot
Colonization
Increasing dominance of erect species
Hillebrand & Sommer 1999, Aquat Bot
Competition on sediments
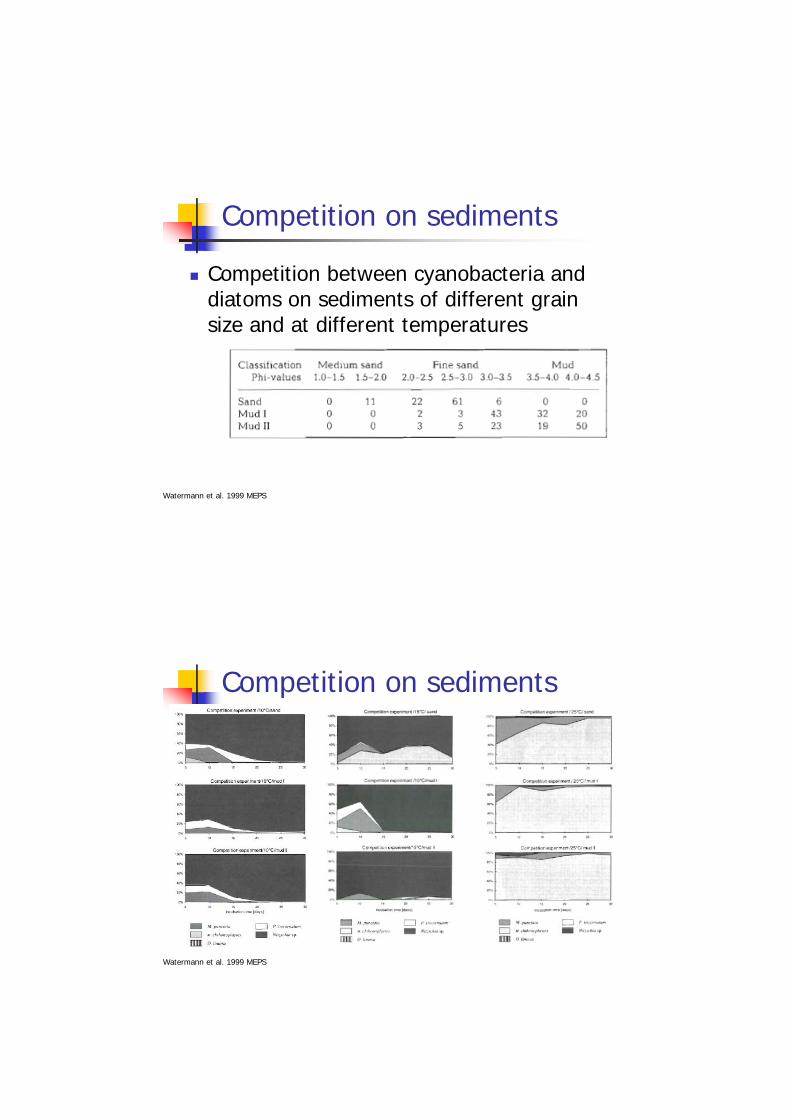
Competition between cyanobacteria and diatoms on sediments of different grain size and at different temperatures
Watermann et al. 1999 MEPS
Competition on sediments
Watermann et al. 1999 MEPS
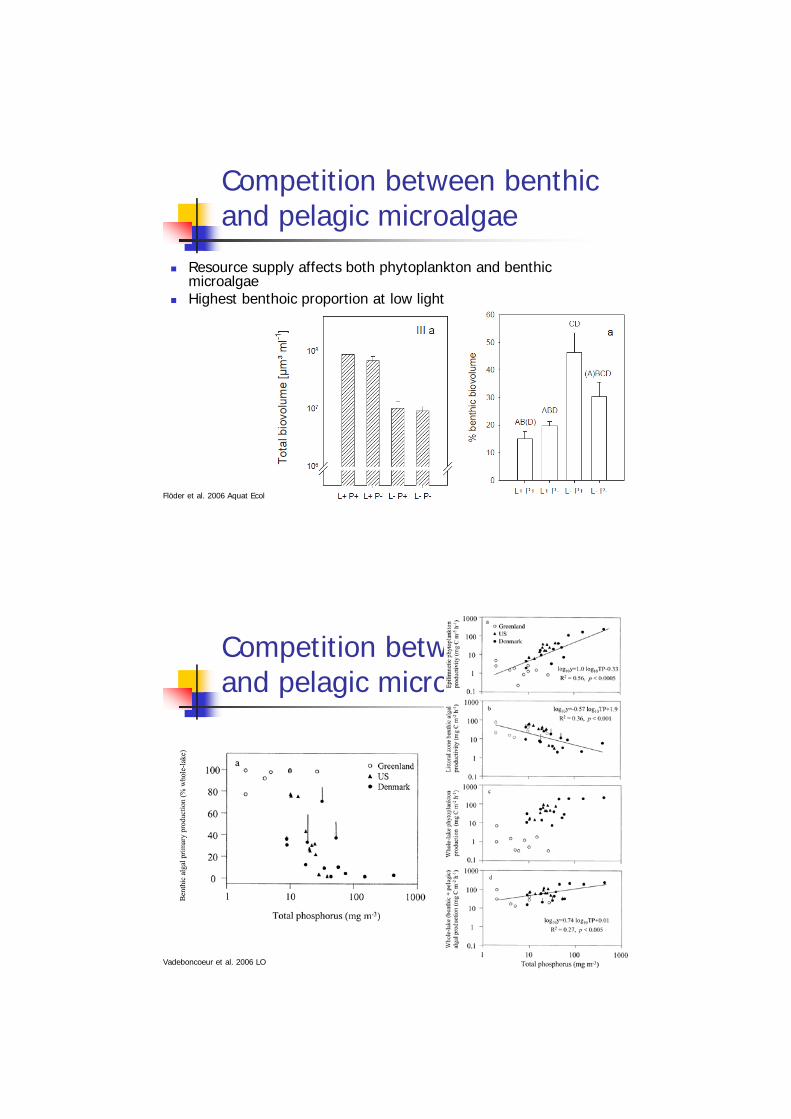
Competition between benthic and pelagic microalgae
Resource supply affects both phytoplankton and benthic microalgaeHighest benthoic proportion at low light
Flöder et al. 2006 Aquat Ecol
Competition between benthic and pelagic microalgae
Vadeboncoeur et al. 2006 LO
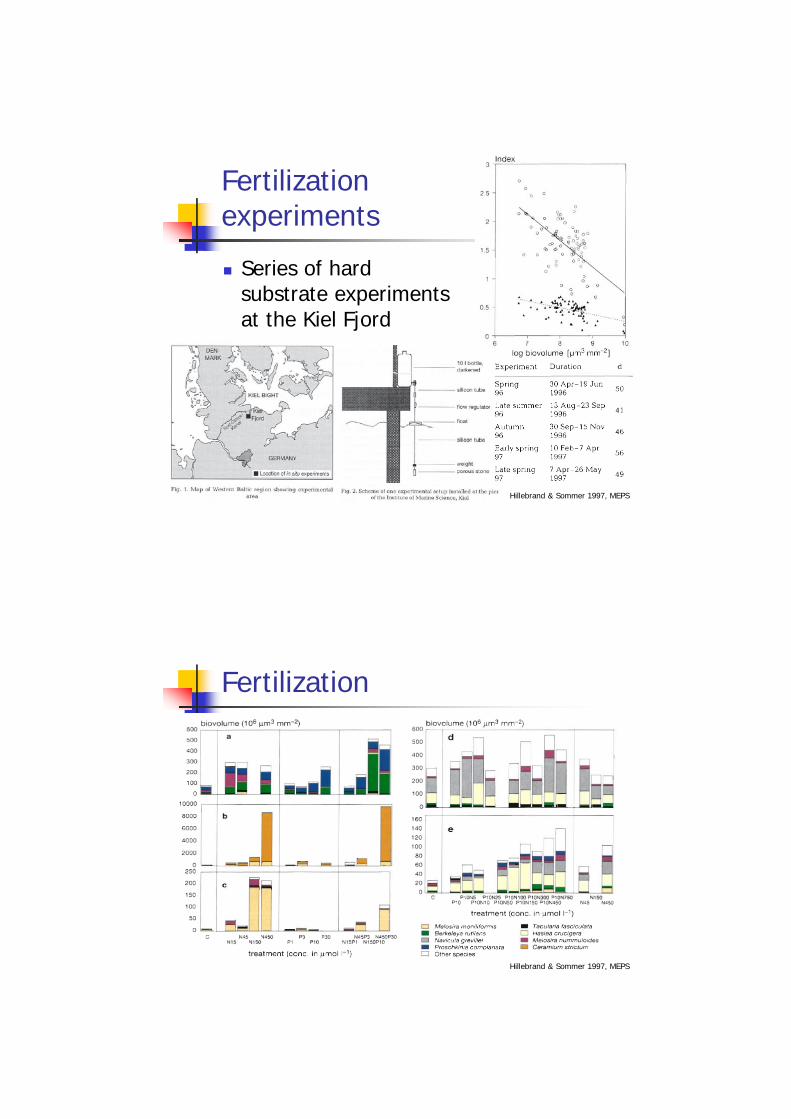
Fertilization experiments
Series of hard substrate experiments at the Kiel Fjord
Hillebrand & Sommer 1997, MEPS
Fertilization
Hillebrand & Sommer 1997, MEPS
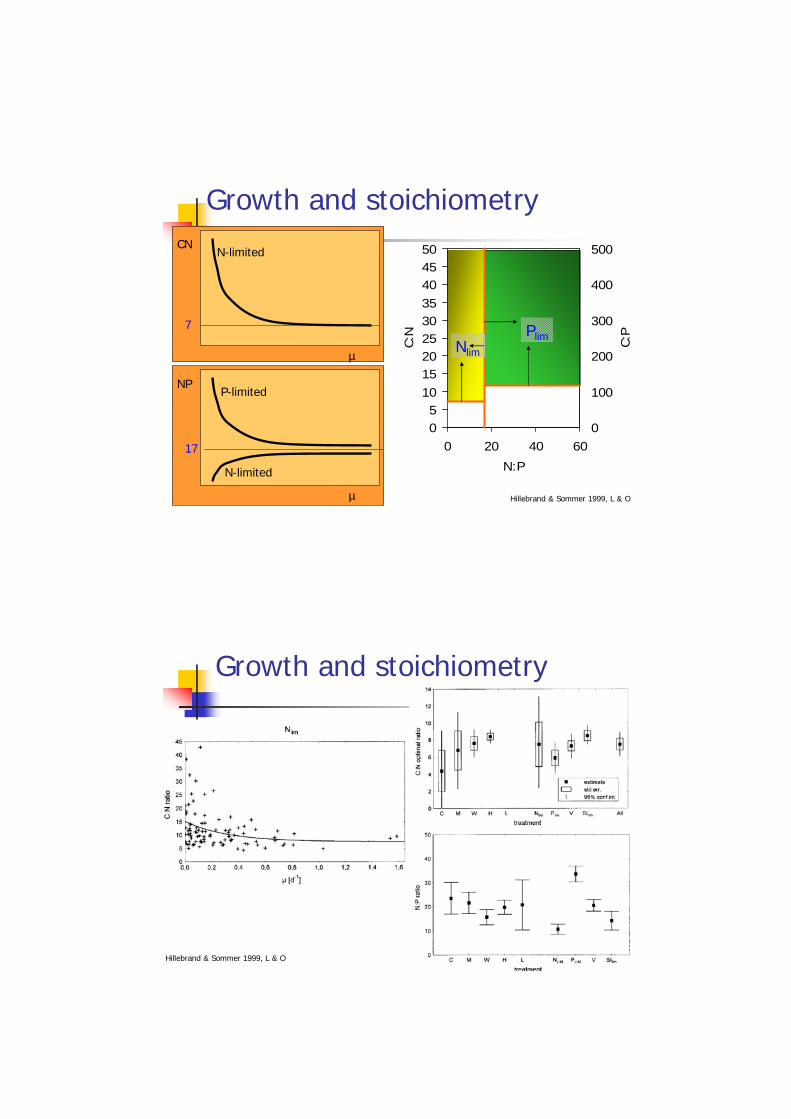
Growth and stoichiometryCN
µ
Hillebrand & Sommer 1999, L & O
NP
µ
N-limited
P-limited
N-limited
17
7
05
101520253035404550
0 20 40 60
N:P
C:N
0
100
200
300
400
500
C:PPlim
Nlim
Growth and stoichiometry
Hillebrand & Sommer 1999, L & O
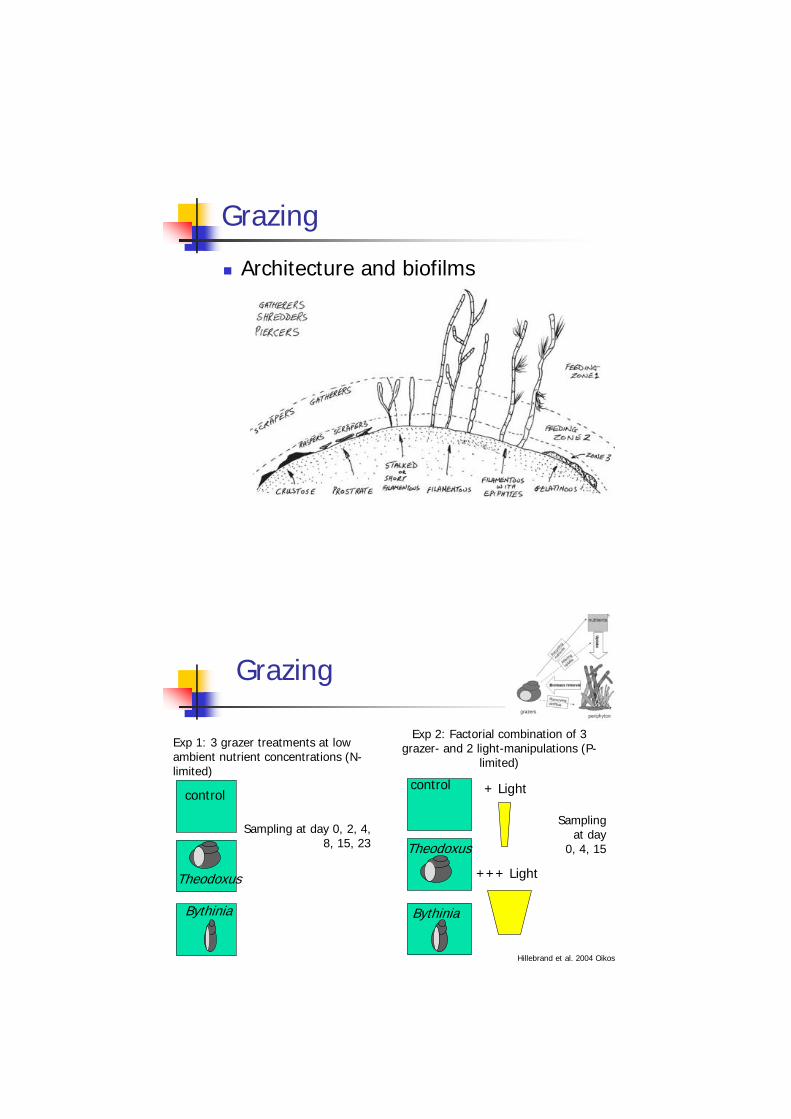
Grazing
Architecture and biofilms
Exp 1: 3 grazer treatments at low ambient nutrient concentrations (N-limited)
Sampling at day 0, 2, 4, 8, 15, 23
Grazing
control
Theodoxus
Bythinia
Theodoxus
Bythinia
Exp 2: Factorial combination of 3 grazer- and 2 light-manipulations (P-
limited)
Sampling at day
0, 4, 15
+ Light
+++ Light
control
Hillebrand et al. 2004 Oikos
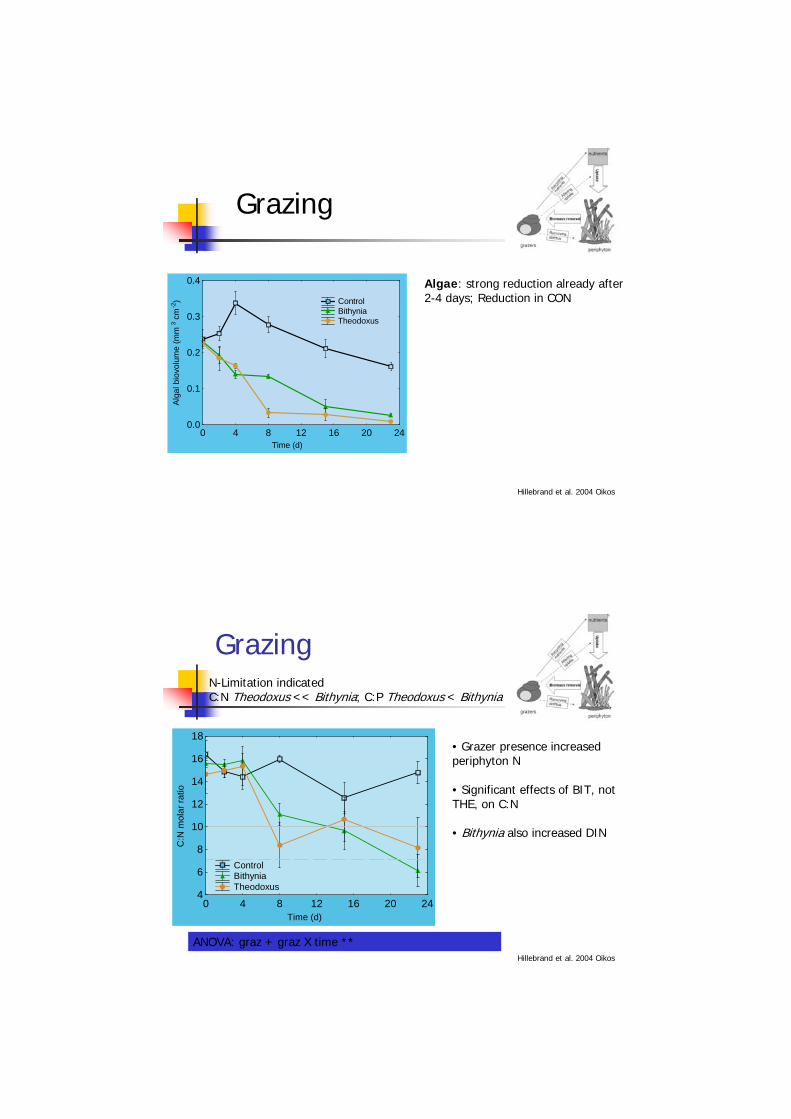
Algae: strong reduction already after 2-4 days; Reduction in CON
Hillebrand et al. 2004 Oikos
Time (d)0 4 8 12 16 20 24
0.0
0.1
0.2
0.3
0.4
Alga
l bio
volu
me
(mm
3 cm
-2) Control
Bithynia Theodoxus
Grazing
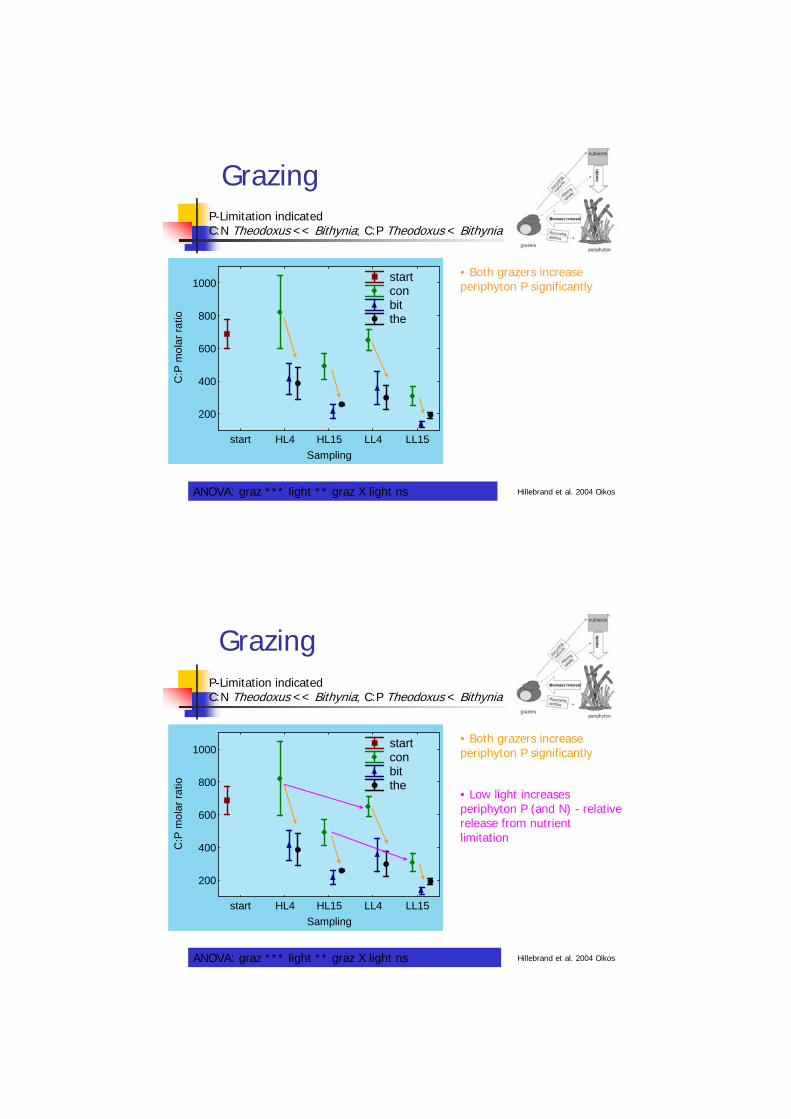
N-Limitation indicatedC:N Theodoxus << Bithynia; C:P Theodoxus < Bithynia
Time (d)0 4 8 12 16 20 24
4
6
8
10
12
14
16
18
C:N
mol
ar ra
tio
Control Bithynia Theodoxus
• Grazer presence increased periphyton N
• Significant effects of BIT, not THE, on C:N
• Bithynia also increased DIN
ANOVA: graz + graz X time **
Grazing
Hillebrand et al. 2004 Oikos
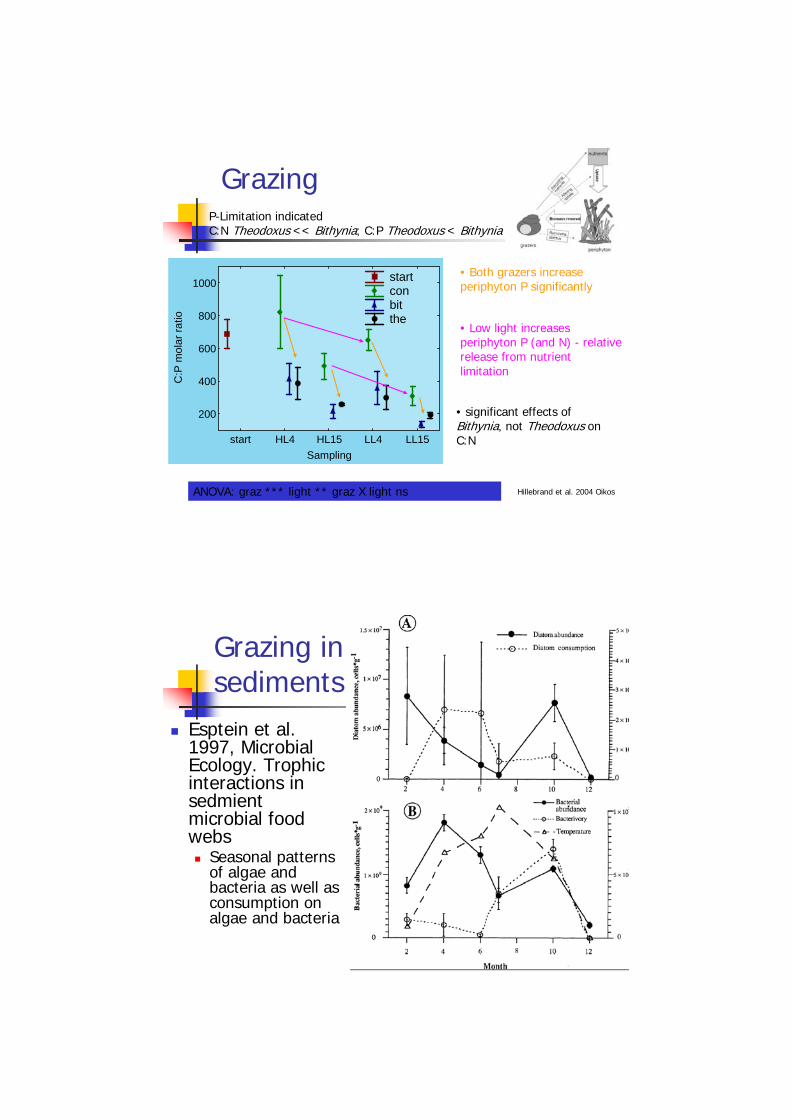
P-Limitation indicatedC:N Theodoxus << Bithynia; C:P Theodoxus < Bithynia
start HL4 HL15 LL4 LL15Sampling
200
400
600
800
1000
C:P
mol
ar ra
tio
start con bit the
• Both grazers increase periphyton P significantly
ANOVA: graz *** light ** graz X light ns
Grazing
Hillebrand et al. 2004 Oikos
P-Limitation indicatedC:N Theodoxus << Bithynia; C:P Theodoxus < Bithynia
start HL4 HL15 LL4 LL15Sampling
200
400
600
800
1000
C:P
mol
ar ra
tio
start con bit the
• Both grazers increase periphyton P significantly
• Low light increases periphyton P (and N) - relative release from nutrient limitation
ANOVA: graz *** light ** graz X light ns
Grazing
Hillebrand et al. 2004 Oikos
P-Limitation indicatedC:N Theodoxus << Bithynia; C:P Theodoxus < Bithynia
• significant effects of Bithynia, not Theodoxus on C:Nstart HL4 HL15 LL4 LL15
Sampling
200
400
600
800
1000
C:P
mol
ar ra
tio
start con bit the
• Both grazers increase periphyton P significantly
• Low light increases periphyton P (and N) - relative release from nutrient limitation
ANOVA: graz *** light ** graz X light ns
Grazing
Hillebrand et al. 2004 Oikos
Grazing in sediments
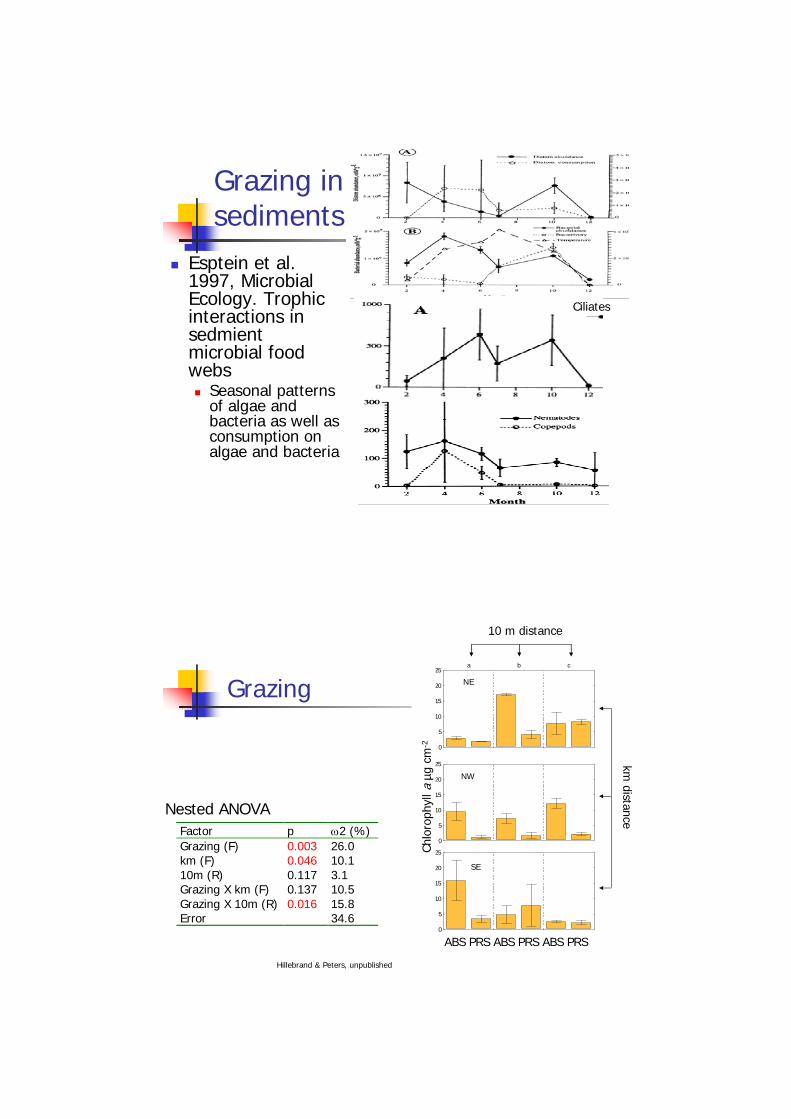
Esptein et al. 1997, Microbial Ecology. Trophic interactions in sedmient microbial food webs
Seasonal patterns of algae and bacteria as well as consumption on algae and bacteria
Esptein et al. 1997, Microbial Ecology. Trophic interactions in sedmient microbial food webs
Seasonal patterns of algae and bacteria as well as consumption on algae and bacteria
Ciliates
Grazing in sediments
Grazing
Factor p ω2 (%)Grazing (F) 0.003 26.0km (F) 0.046 10.110m (R) 0.117 3.1Grazing X km (F) 0.137 10.5Grazing X 10m (R) 0.016 15.8Error 34.6
Nested ANOVA
Hillebrand & Peters, unpublished
Chl
orop
hyll a
(µg
cm-2
)
a b c
0
5
10
15
20
25
NE
Chl
orop
hyll a
(µg
cm-2
)
0
5
10
15
20
25
NW
Chl
orop
hyll a
(µg
cm-2
)
0
5
10
15
20
25
ex op ex ep ex op
SE
10 m distance
km distance
ABS PRS ABS PRS ABS PRS
Chlo
roph
yll a
µg c
m-2
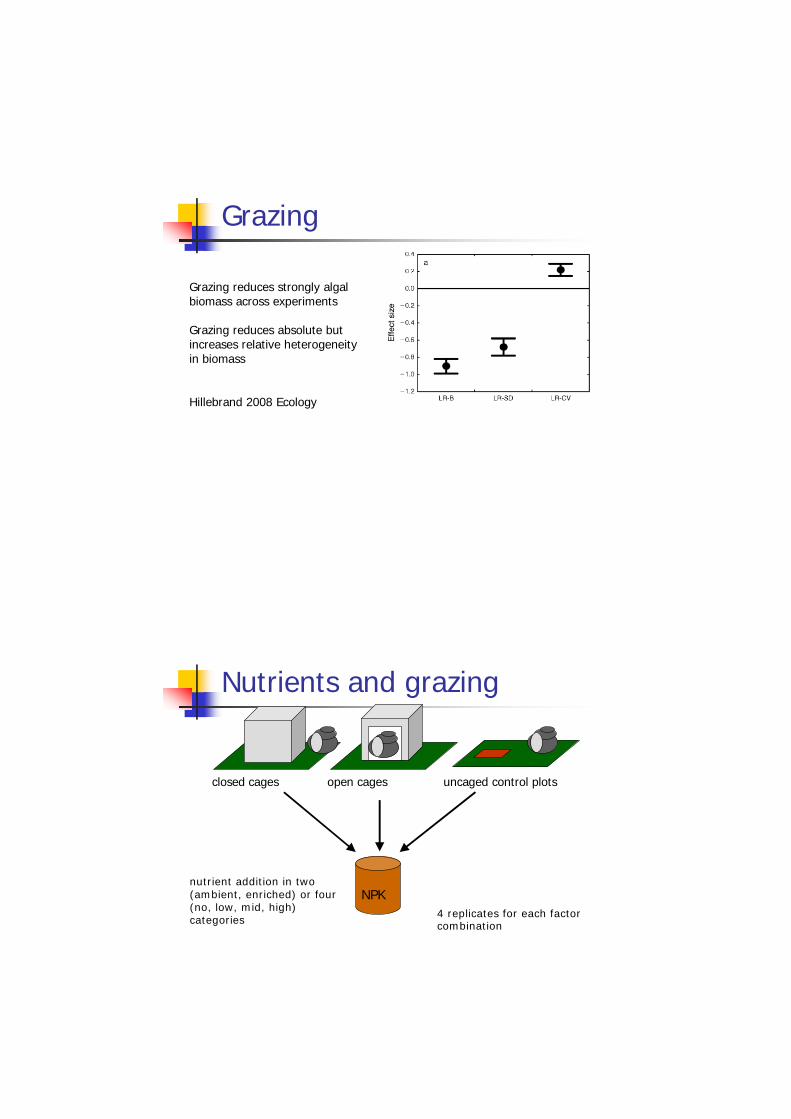
Grazing
Grazing reduces strongly algal biomass across experiments
Grazing reduces absolute but increases relative heterogeneity in biomass
Hillebrand 2008 Ecology
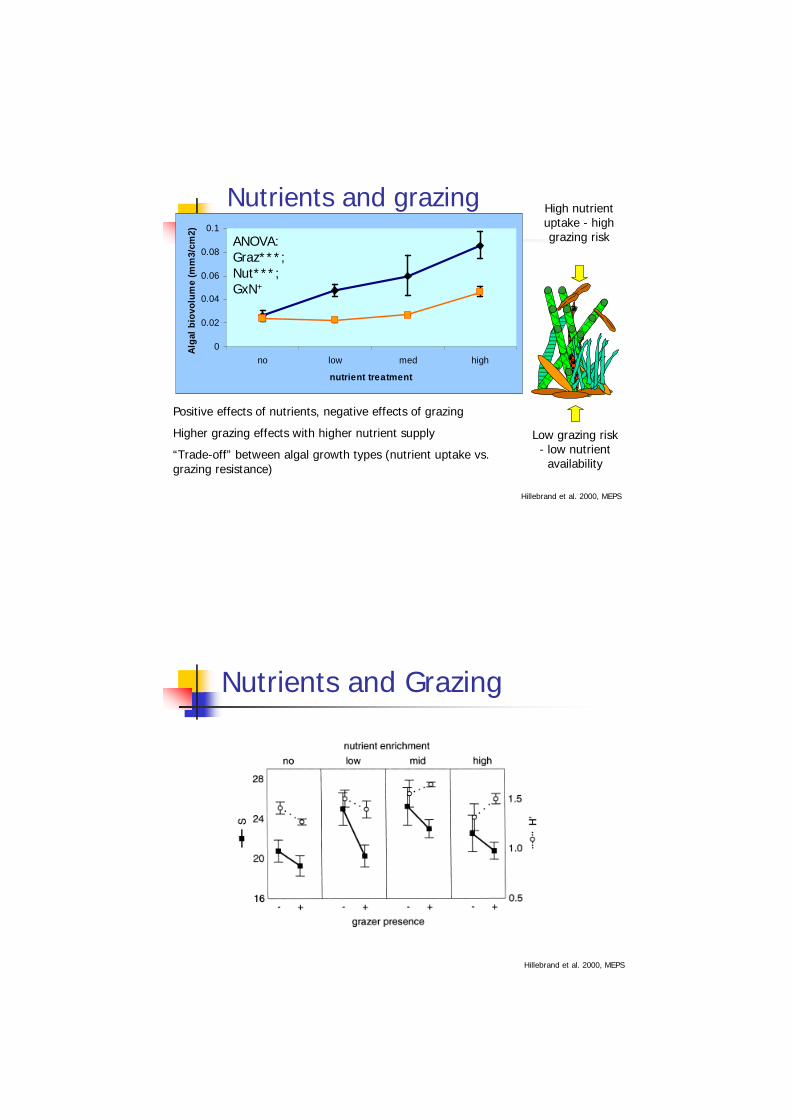
Nutrients and grazing
closed cages open cages uncaged control plots
4 replicates for each factor combination
NPKnutrient addition in two (ambient, enriched) or four (no, low, mid, high) categories
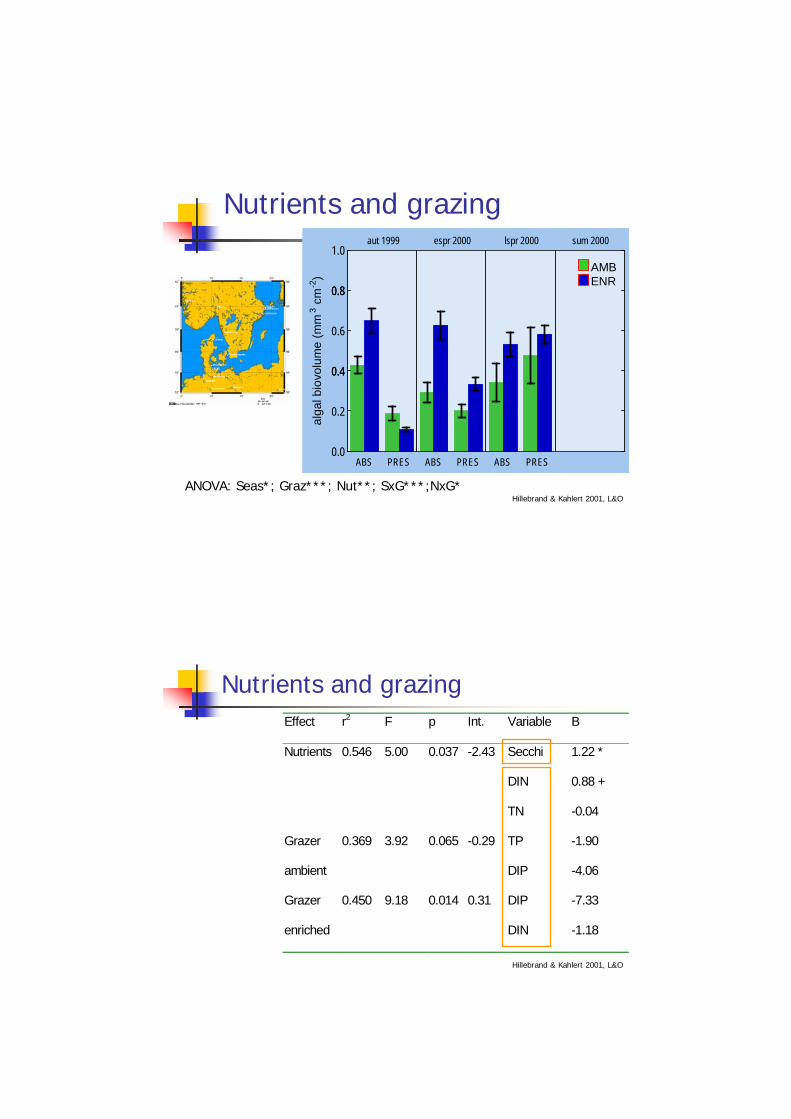
Nutrients and grazing
Hillebrand et al. 2000, MEPS
Positive effects of nutrients, negative effects of grazing
Higher grazing effects with higher nutrient supply
“Trade-off” between algal growth types (nutrient uptake vs. grazing resistance)
0
0.02
0.04
0.06
0.08
0.1
no low med high
nutrient treatment
Alga
l bio
volu
me
(mm
3/cm
2)
High nutrient uptake - high grazing risk
Low grazing risk - low nutrient
availability
ANOVA: Graz***; Nut***; GxN+
Nutrients and Grazing
Hillebrand et al. 2000, MEPS
Nutrients and grazing
Hillebrand & Kahlert 2001, L&OANOVA: Seas*; Graz***; Nut**; SxG***;NxG*
ABS PRES ABS PRES ABS PRES
aut 1999 espr 2000 lspr 2000 sum 2000
0.0
0.2
0.40.4
0.6
0.80.8
1.0
alga
l bio
volu
me
(mm
3 cm
-2)
AMBENR
Nutrients and grazingEffect r2 F p Int. Variable B
Nutrients 0.546 5.00 0.037 -2.43 Secchi
DIN
TN
1.22 *
0.88 +
-0.04
Grazer
ambient
0.369 3.92 0.065 -0.29 TP
DIP
-1.90
-4.06
Grazer
enriched
0.450 9.18 0.014 0.31 DIP
DIN
-7.33
-1.18
Hillebrand & Kahlert 2001, L&O
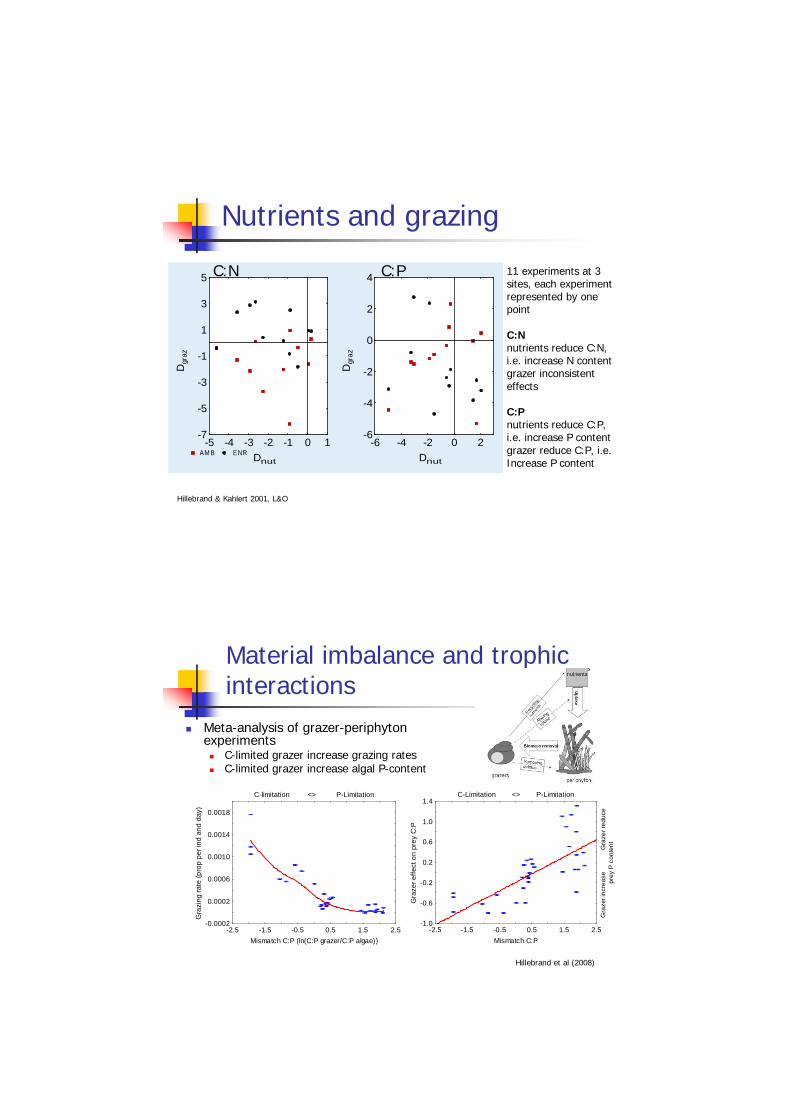
Nutrients and grazing
Dnut
Dgr
az
-7
-5
-3
-1
1
3
5
-5 -4 -3 -2 -1 0 1AM B ENR Dnut
Dgr
az
-6
-4
-2
0
2
4
-6 -4 -2 0 2
11 experiments at 3 sites, each experiment represented by one point
C:Nnutrients reduce C:N, i.e. increase N contentgrazer inconsistent effects
C:Pnutrients reduce C:P, i.e. increase P contentgrazer reduce C:P, i.e. Increase P content
C:N C:P
Hillebrand & Kahlert 2001, L&O
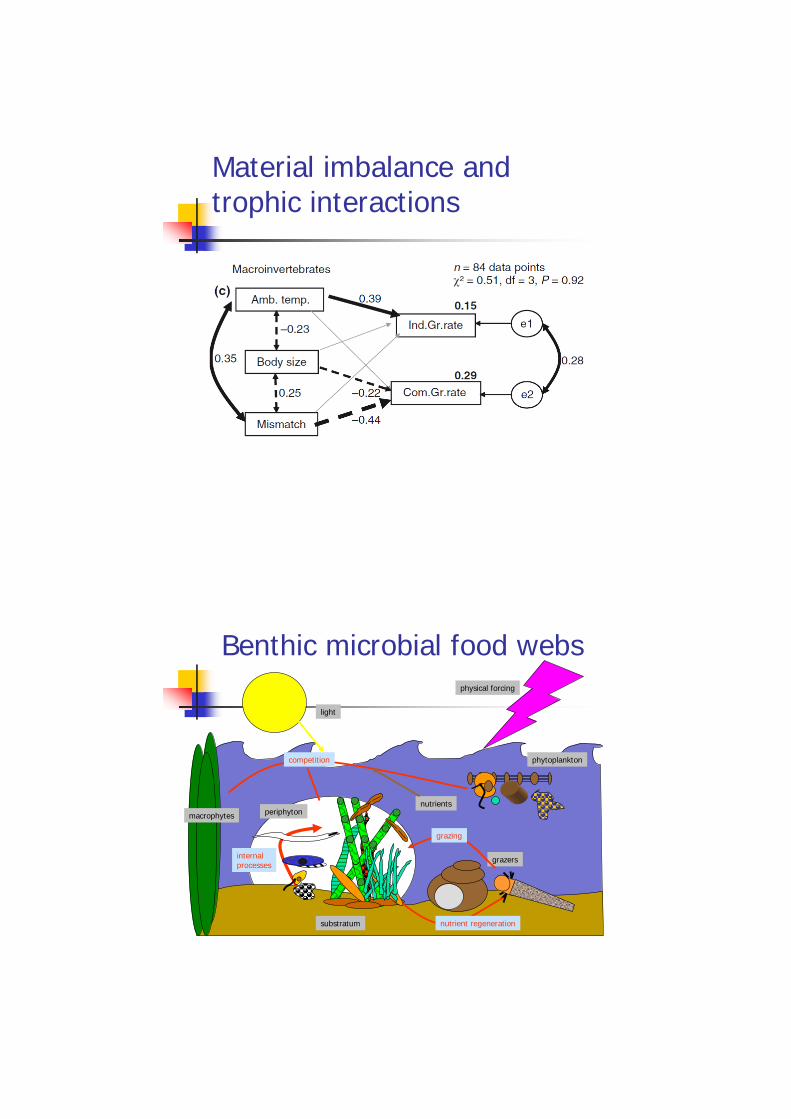
Material imbalance and trophic interactions
Meta-analysis of grazer-periphyton experiments
C-limited grazer increase grazing ratesC-limited grazer increase algal P-content
-2.5 -1.5 -0.5 0.5 1.5 2.5Mismatch C:P (ln(C:P grazer/C:P algae))
C-limitation <> P-Limitation
-0.0002
0.0002
0.0006
0.0010
0.0014
0.0018
Gra
zing
rate
(pro
p pe
r ind
and
day
)
Hillebrand et al (2008)
-2.5 -1.5 -0.5 0.5 1.5 2.5Mismatch C:P
C-Limitation <> P-Limitation
-1.0
-0.6
-0.2
0.2
0.6
1.0
1.4
Gra
zer e
ffect
on
prey
C:P
Gra
zer i
ncre
ase
Gra
zer r
educ
epr
ey P
con
tent
Material imbalance and trophic interactions
periphyton
grazers
phytoplankton
macrophytes
light
physical forcing
nutrients
substratum
competition
internal processes
nutrient regeneration
grazing
Benthic microbial food webs
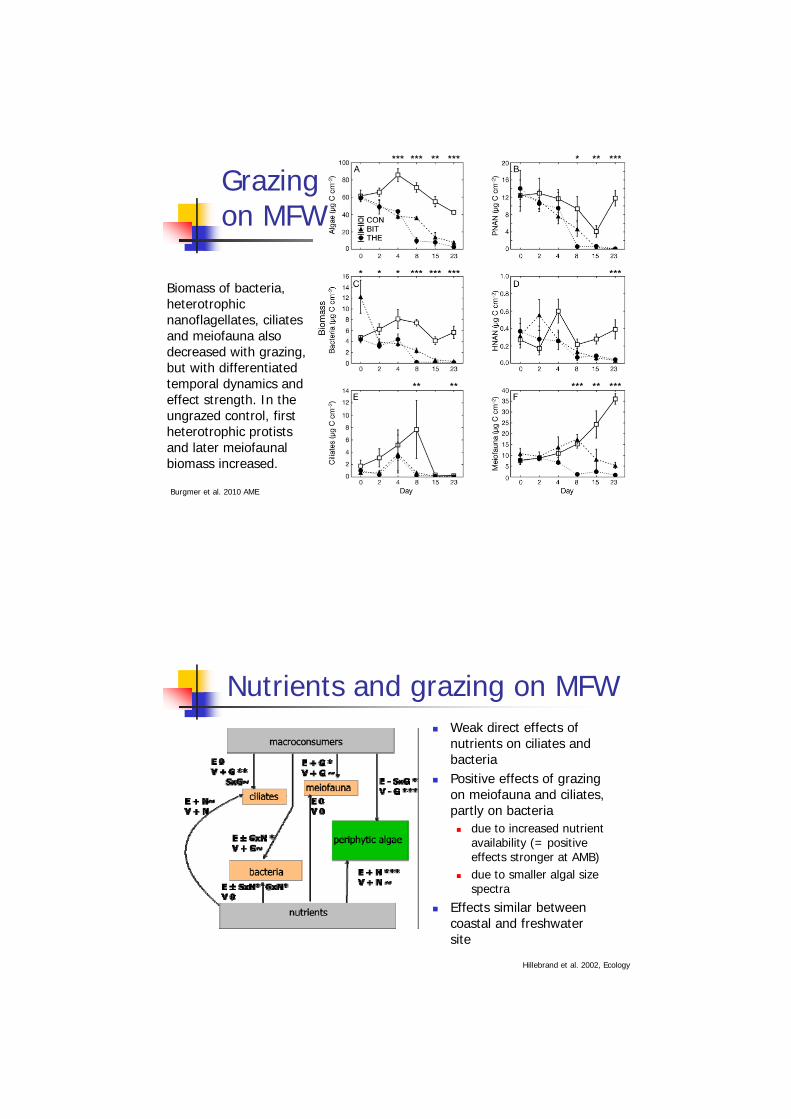
Biomass of bacteria, heterotrophic nanoflagellates, ciliates and meiofauna also decreased with grazing, but with differentiated temporal dynamics and effect strength. In the ungrazed control, first heterotrophic protists and later meiofaunal biomass increased.
Grazingon MFW
Burgmer et al. 2010 AME
Nutrients and grazing on MFWWeak direct effects of nutrients on ciliates and bacteriaPositive effects of grazing on meiofauna and ciliates, partly on bacteria
due to increased nutrient availability (= positive effects stronger at AMB)due to smaller algal size spectra
Effects similar between coastal and freshwater site
Hillebrand et al. 2002, Ecology
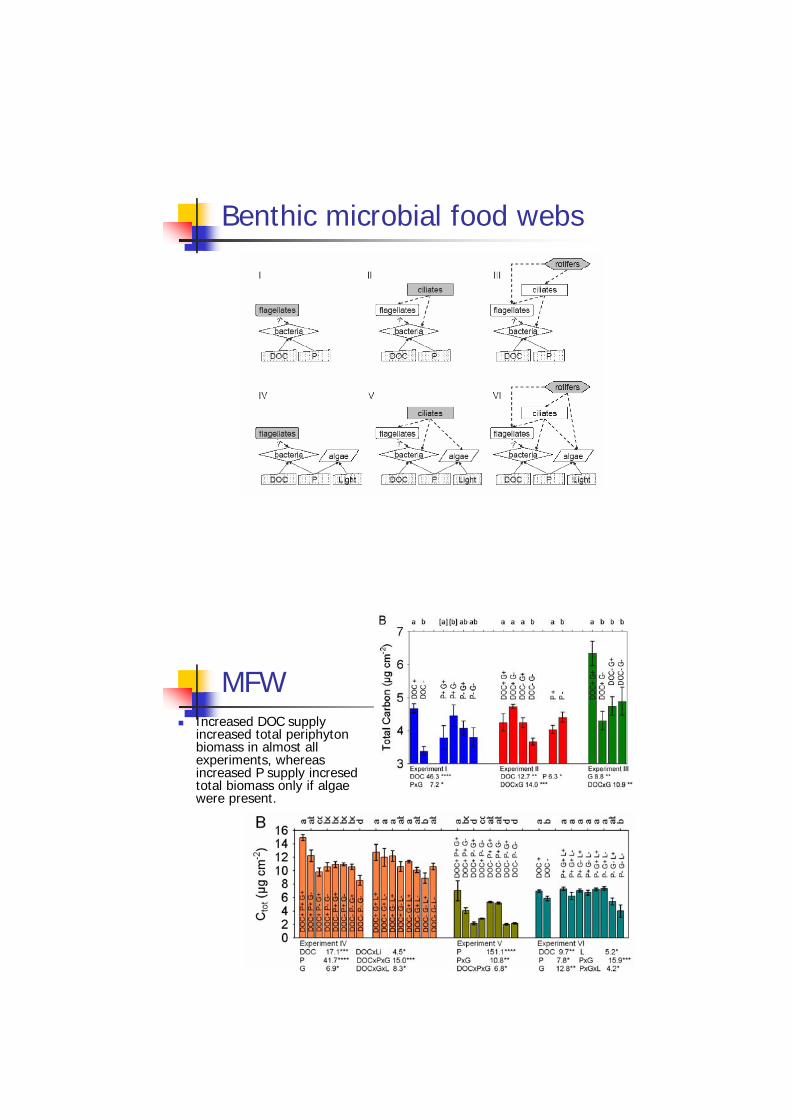
Benthic microbial food webs
MFWIncreased DOC supply increased total periphyton biomass in almost all experiments, whereas increased P supply incresed total biomass only if algae were present.
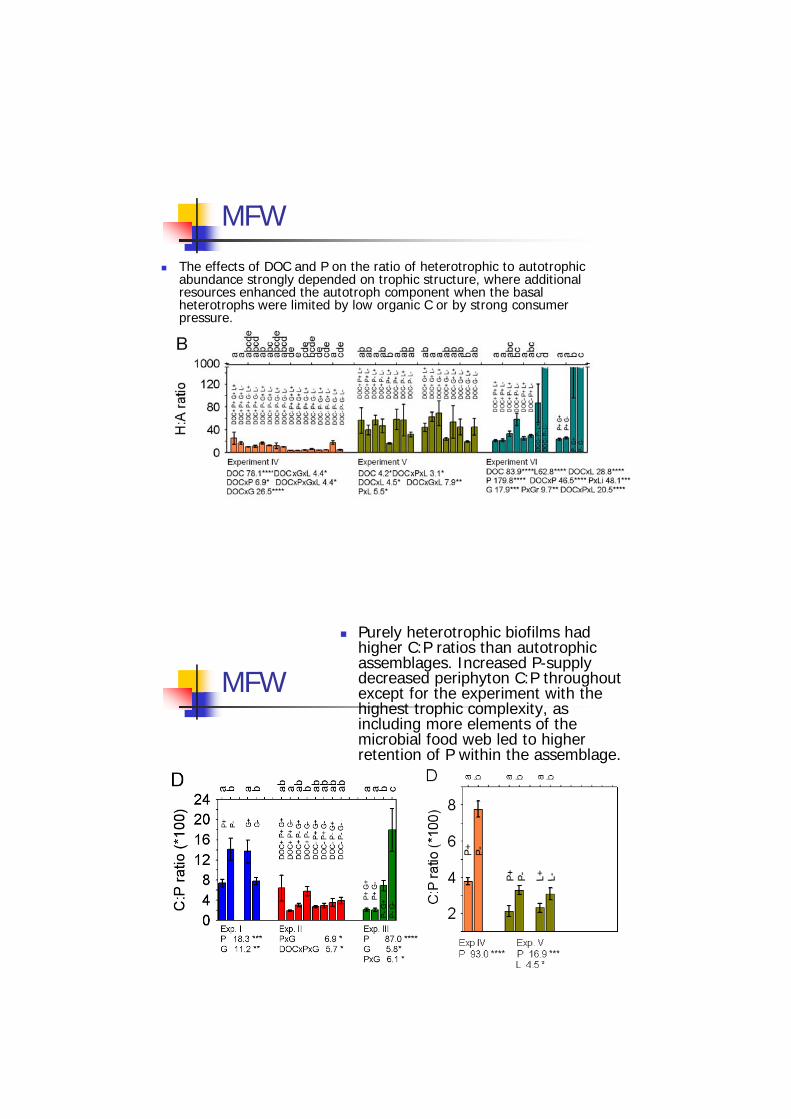
MFW
The effects of DOC and P on the ratio of heterotrophic to autotrophic abundance strongly depended on trophic structure, where additional resources enhanced the autotroph component when the basal heterotrophs were limited by low organic C or by strong consumerpressure.
MFW
Purely heterotrophic biofilms had higher C:P ratios than autotrophic assemblages. Increased P-supply decreased periphyton C:P throughout except for the experiment with the highest trophic complexity, as including more elements of the microbial food web led to higher retention of P within the assemblage.
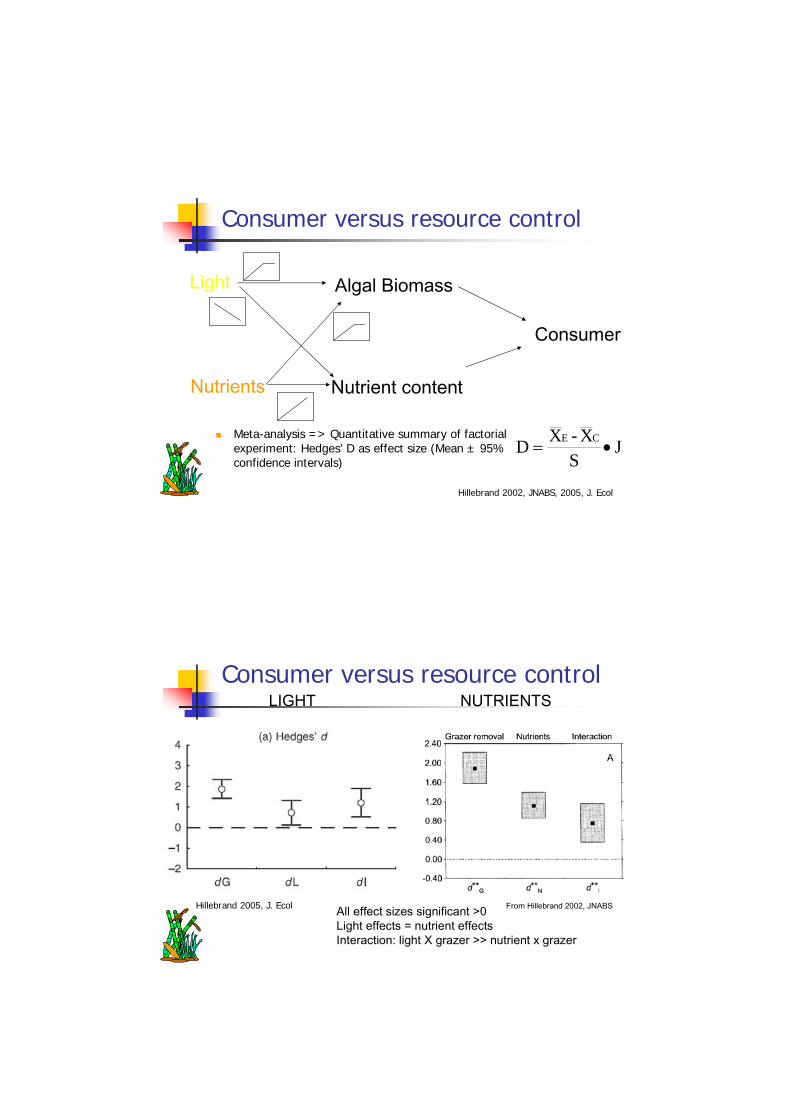
Consumer versus resource control
Algal Biomass
Nutrient content
Light
Consumer
Hillebrand 2002, JNABS, 2005, J. Ecol
Nutrients
Meta-analysis => Quantitative summary of factorial experiment: Hedges’ D as effect size (Mean ± 95% confidence intervals)
JS
X-XD CE•=
Consumer versus resource control
All effect sizes significant >0 Light effects = nutrient effectsInteraction: light X grazer >> nutrient x grazer
LIGHT NUTRIENTS
From Hillebrand 2002, JNABSHillebrand 2005, J. Ecol
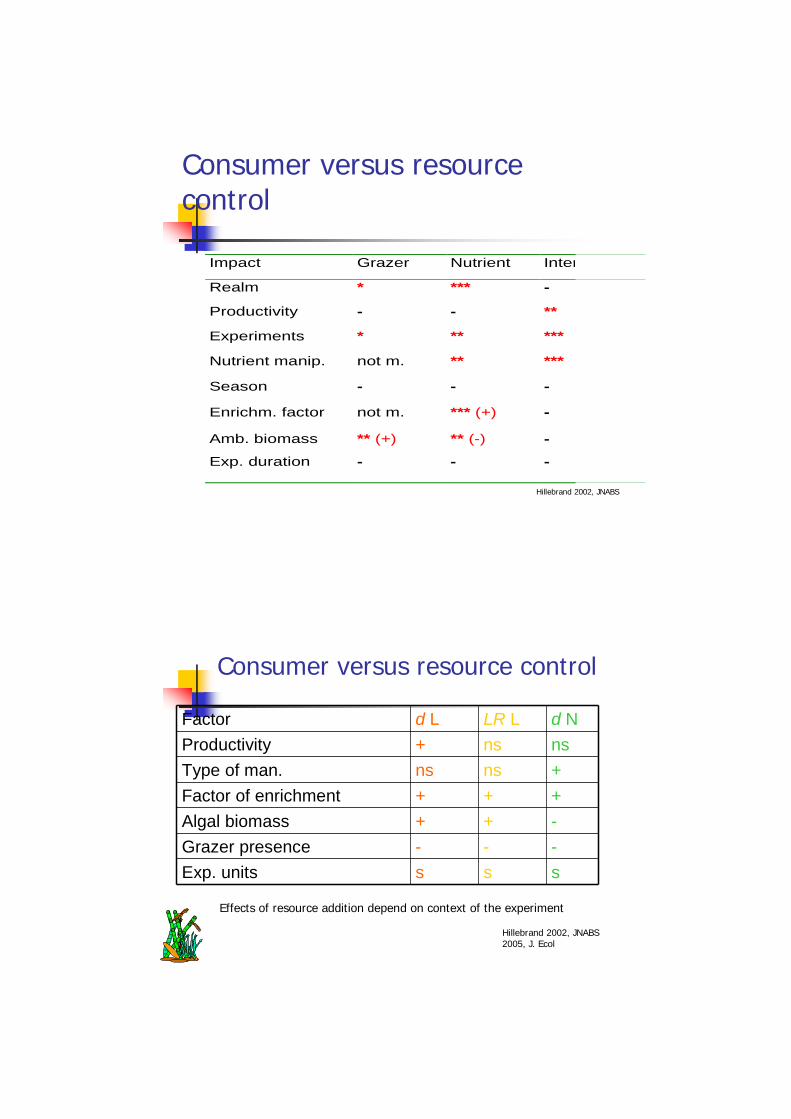
Consumer versus resource control
Impact Grazer Nutrient Inter
Realm * *** -
Productivity - - **
Experiments * ** ***
Nutrient manip. not m. ** ***
Season - - -
Enrichm. factor not m. *** (+) -
Amb. biomass ** (+) ** (-) -
Exp. duration - - -
Hillebrand 2002, JNABS
Consumer versus resource control
Factor d L LR L d NProductivity + ns nsType of man. ns ns +Factor of enrichment + + +Algal biomass + + -Grazer presence - - -Exp. units s s s
Hillebrand 2002, JNABS2005, J. Ecol
Effects of resource addition depend on context of the experiment
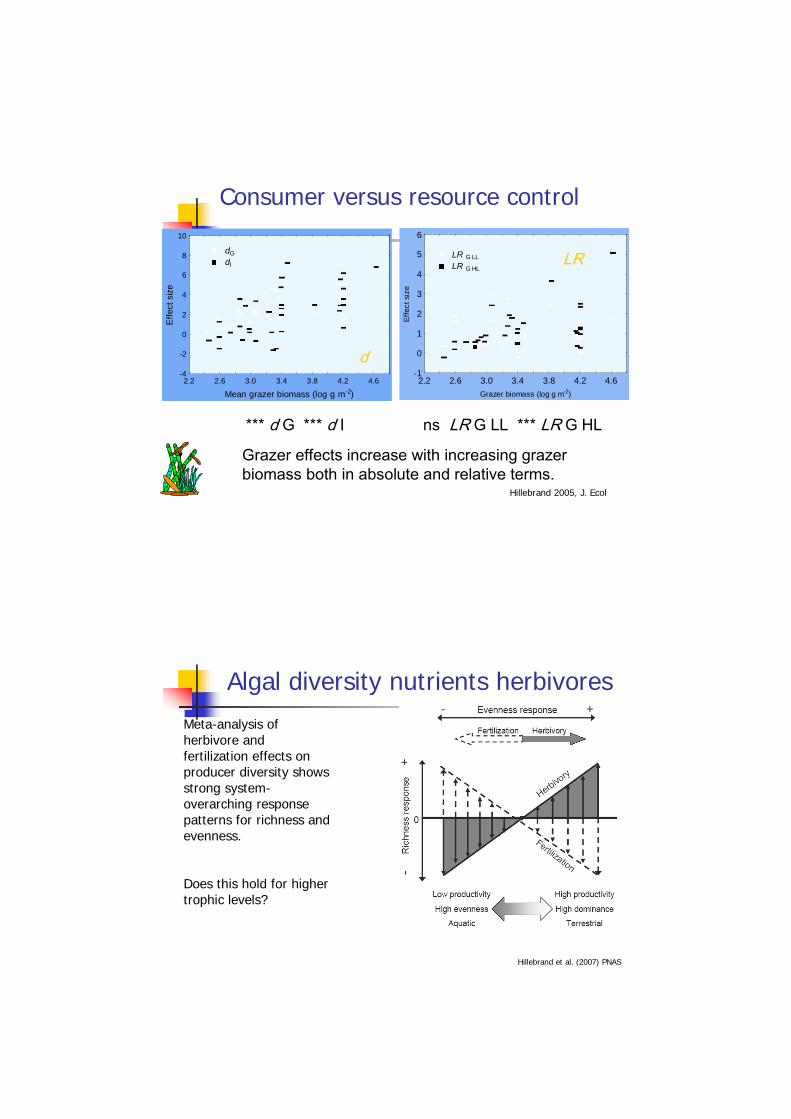
Consumer versus resource control
2.2 2.6 3.0 3.4 3.8 4.2 4.6
Mean grazer biomass (log g m-2)
-4
-2
0
2
4
6
8
10
Effe
ct s
ize
dG dI
*** d G *** d I
2.2 2.6 3.0 3.4 3.8 4.2 4.6Grazer biomass (log g m-2)
-1
0
1
2
3
4
5
6
Effe
ct s
ize
LR G LL LR G HL
ns LR G LL *** LR G HL
d
LR
Grazer effects increase with increasing grazer biomass both in absolute and relative terms.
Hillebrand 2005, J. Ecol
Meta-analysis of herbivore and fertilization effects on producer diversity shows strong system-overarching response patterns for richness and evenness.
Does this hold for higher trophic levels?
Hillebrand et al. (2007) PNAS
Algal diversity nutrients herbivores
Regulation of biodiversity
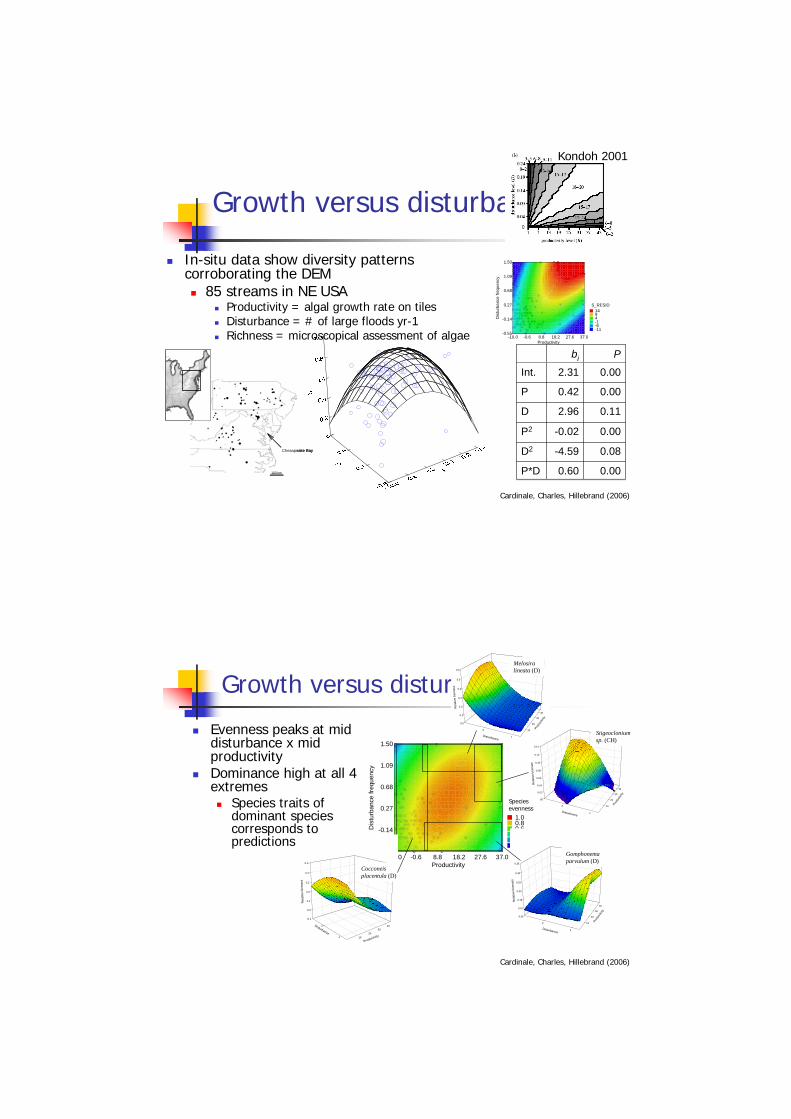
Growth versus disturbance
In-situ data show diversity patterns corroborating the DEM
85 streams in NE USAProductivity = algal growth rate on tilesDisturbance = # of large floods yr-1Richness = microscopical assessment of algae
Cardinale, Charles, Hillebrand (2006)
Chesapeake Bay
100 km
Chesapeake Bay
100 km
bi P
Int. 2.31 0.00
P 0.42 0.00
D 2.96 0.11
P2 -0.02 0.00
D2 -4.59 0.08
P*D 0.60 0.00
-10.0 -0.6 8.8 18.2 27.6 37.0Productivity
-0.55
-0.14
0.27
0.68
1.09
1.50
Dis
turb
ance
freq
uenc
y
-11-6-14914
S_RESID
Kondoh 2001
Growth versus disturbance
Evenness peaks at mid disturbance x mid productivityDominance high at all 4 extremes
Species traits of dominant species corresponds to predictions from DEM
-10.0 -0.6 8.8 18.2 27.6 37.0Productivity
-0.55
-0.14
0.27
0.68
1.09
1.50
Dis
turb
ance
freq
uenc
y
0.00.20.40.60.81.0
E_BIOM
0.00
0.02
0.04
0.06
0.08
0.10
0.12
0.14
10
20
30
40
1
2
Rel
ativ
e bi
omas
s
Produ
ctivit
y
Disturbance
Sp188
Speciesevenness
0.0
0.1
0.2
0.3
0.4
0.5
0.6
10
20
30
40
1
2
Rel
ativ
e bi
omas
s
Prod
uctiv
ity
Disturbance
sp 68Melosiralineata (D)
Stigeocloniumsp. (CH)
0.05
0.10
0.15
0.20
0.25
0.30
0.35
10
20
30
40
1
2
Rel
ativ
e bi
omas
s
Produ
ctivit
y
Disturbance
sp60Gomphonema parvulum (D)
-0.1
0.0
0.1
0.2
0.3
0.4
0.5
1020
3040
1
2
Rel
ativ
e bi
omas
s
Productivity
Disturbance
Sp16Cocconeis placentula (D)
Cardinale, Charles, Hillebrand (2006)
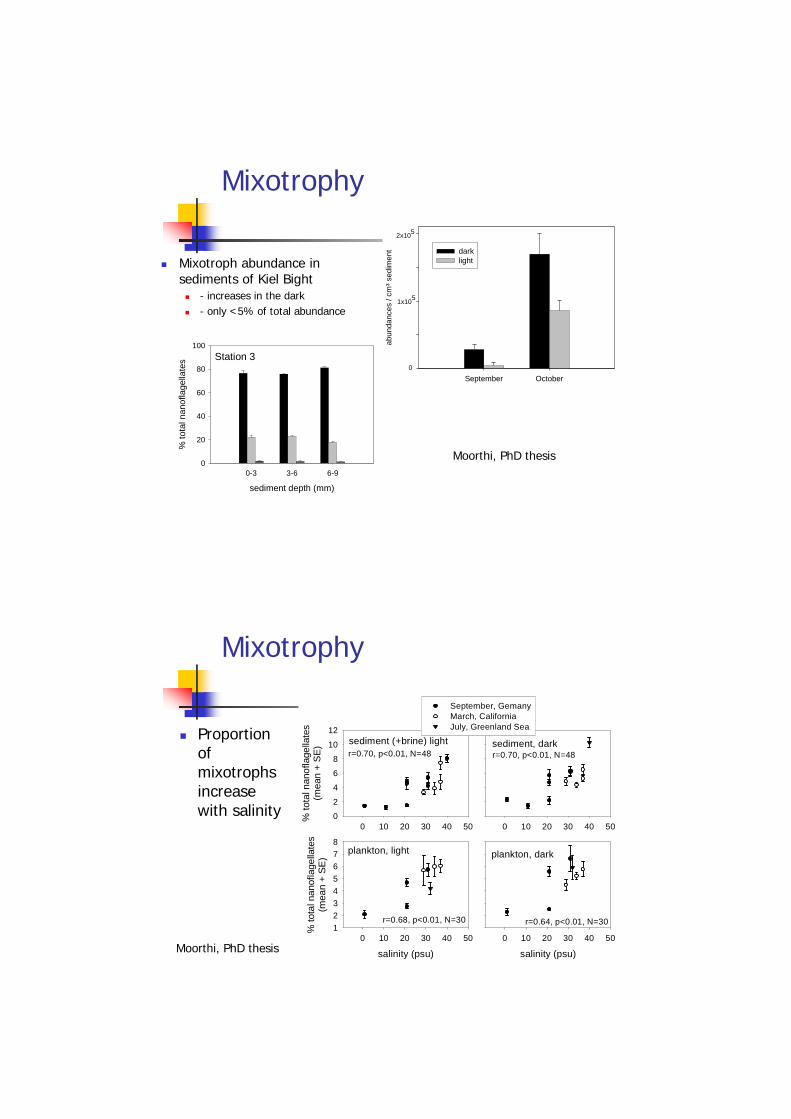
Mixotrophy
Mixotroph abundance in sediments of Kiel Bight
- increases in the dark- only <5% of total abundance
September Octoberab
unda
nces
/ cm
³ sed
imen
t darklight
0
1x10⁵
2x10⁵
Station 3
sediment depth (mm)
0-3 3-6 6-9
% to
tal n
anof
lage
llate
s
0
20
40
60
80
100
Moorthi, PhD thesis
Mixotrophy
Proportion of mixotrophs increase with salinity
0 10 20 30 40 50
salinity (psu)
0 10 20 30 40 50
% to
tal n
anof
lage
llate
s(m
ean
+ SE
)
12345678
0 10 20 30 40 50
% to
tal n
anof
lage
llate
s(m
ean
+ S
E)
0
2
4
6
8
10
12
September, GemanyMarch, CaliforniaJuly, Greenland Sea
sediment (+brine) light sediment, dark
salinity (psu)
0 10 20 30 40 50
plankton, light plankton, dark
r=0.70, p<0.01, N=48 r=0.70, p<0.01, N=48
r=0.68, p<0.01, N=30 r=0.64, p<0.01, N=30
Moorthi, PhD thesis
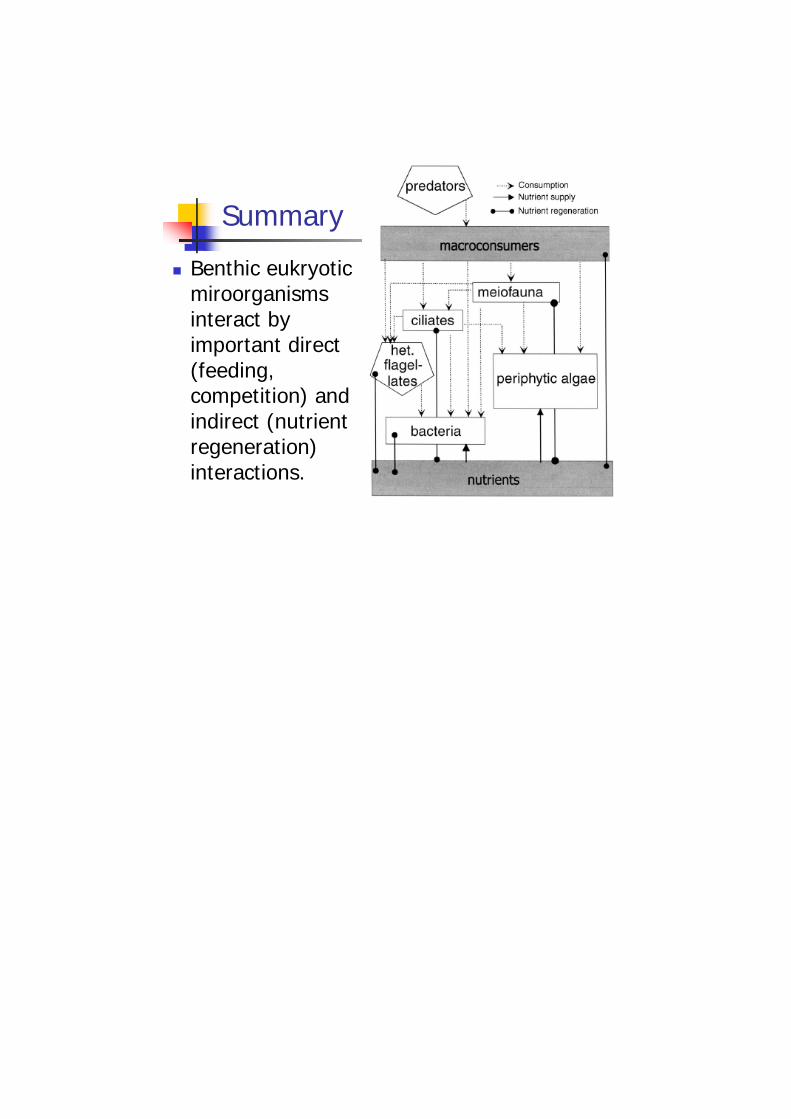
Summary
Benthic eukryotic miroorganisms interact by important direct (feeding, competition) and indirect (nutrient regeneration) interactions.