Embed Size (px)
Citation preview
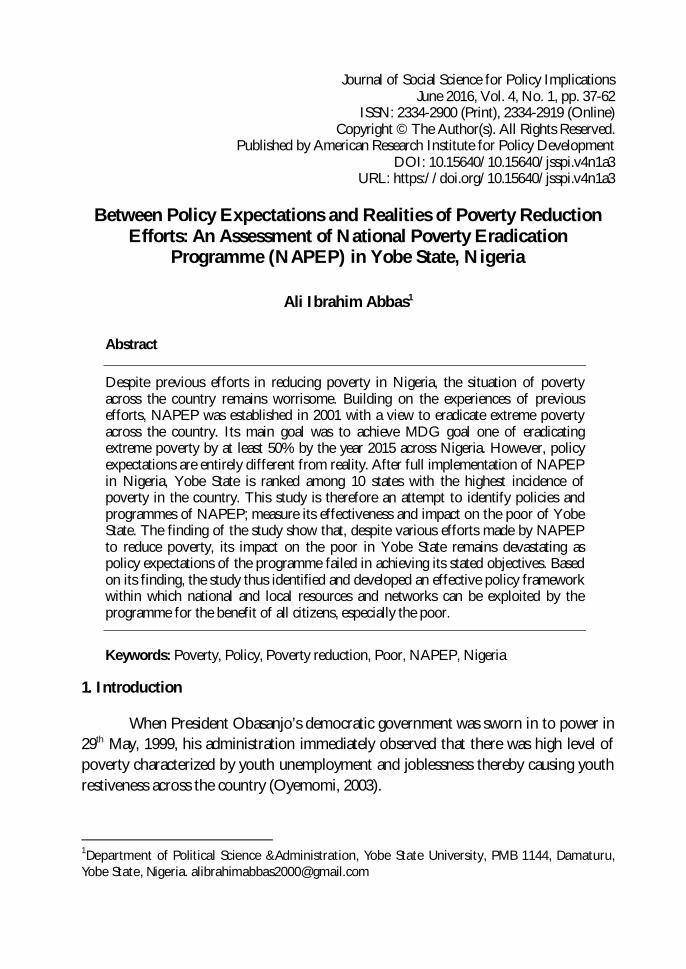
Journal of Social Science for Policy Implications June 2016, Vol. 4, No. 1, pp. 37-62
ISSN: 2334-2900 (Print), 2334-2919 (Online) Copyright © The Author(s). All Rights Reserved.
Published by American Research Institute for Policy Development DOI: 10.15640/10.15640/jsspi.v4n1a3
URL: https://doi.org/10.15640/jsspi.v4n1a3
Between Policy Expectations and Realities of Poverty Reduction Efforts: An Assessment of National Poverty Eradication
Programme (NAPEP) in Yobe State, Nigeria
Ali Ibrahim Abbas1
Abstract
Despite previous efforts in reducing poverty in Nigeria, the situation of poverty across the country remains worrisome. Building on the experiences of previous efforts, NAPEP was established in 2001 with a view to eradicate extreme poverty across the country. Its main goal was to achieve MDG goal one of eradicating extreme poverty by at least 50% by the year 2015 across Nigeria. However, policy expectations are entirely different from reality. After full implementation of NAPEP in Nigeria, Yobe State is ranked among 10 states with the highest incidence of poverty in the country. This study is therefore an attempt to identify policies and programmes of NAPEP; measure its effectiveness and impact on the poor of Yobe State. The finding of the study show that, despite various efforts made by NAPEP to reduce poverty, its impact on the poor in Yobe State remains devastating as policy expectations of the programme failed in achieving its stated objectives. Based on its finding, the study thus identified and developed an effective policy framework within which national and local resources and networks can be exploited by the programme for the benefit of all citizens, especially the poor.
Keywords: Poverty, Policy, Poverty reduction, Poor, NAPEP, Nigeria
1. Introduction
When President Obasanjo’s democratic government was sworn in to power in 29th May, 1999, his administration immediately observed that there was high level of poverty characterized by youth unemployment and joblessness thereby causing youth restiveness across the country (Oyemomi, 2003).
1Department of Political Science &Administration, Yobe State University, PMB 1144, Damaturu, Yobe State, Nigeria. [email protected]
38 Journal of Social Science for Policy Implications, Vol. 4(1), June 2016
Before the Obasanjo’s administration could finally settle down, the country also received disturbing World Bank 2000 report which indicated that more than 70% of Nigerian citizens were living below poverty line. Subsequently, as an interventionist programme, Poverty Alleviation Programme (PAP) was immediately established in 2000 and allocated N17 billion. According to Oyemomi (2003) and Oshewolo (2010), PAP was then primarily aimed at providing immediate job opportunities to some 200,000 jobless youths within the shortest possible time.
However, just four months after the implementation of PAP, the public were
not satisfied with its performance thus necessitating general outcry among public on its massive failures (Oyemomi, 2003; Anyebe, 2014). Consequently, in response to the dissatisfaction raised by the people, the government came up with a committee chaired by Prof. Ango Abdullahi to evaluate the alleged failures of the programme and recommend appropriately to the government for necessary actions (Aliyu, 2002; Oyemomi, 2003; Oshewolo, 2010). After thorough review of previous poverty reduction programmes in the country, Professor Ango Abdullahi committee working along other relevant presidential committees produced a blue print that recommended the formation of National Poverty Eradication Programme (NAPEP).
When NAPEP came in to being in 2001, its mandate was to eradicate poverty
across Nigeria by 50% by the year 2015 in line with MDG goal number 1 (Anyebe, 2014). NAPEP was also to serve as an apex national coordinating body for all poverty reduction bodies/agencies in the country (Aliyu, 2002). In what appears to be an attempt to show government’s determination to eradicating poverty across Nigeria, the National Poverty Eradication Council (NAPEC) was also established and headed by the President himself. The President also appointed a Senior Special Assistant (SSA) on poverty eradication who also serves as the National Coordinator NAPEP. The council membership whose mandate was to draw new approaches of best policy initiation, coordination, and monitoring was comprehensively drawn from seventeen 17 Federal Ministries of government considered to have direct impact on poverty reduction in Nigeria (Aliyu, 2002).
Unlike previous poverty reduction policies in Nigeria, Anyebe (2014) observes
that, NAPEP involves all arrays of major stakeholder’s interests in its formation including; Local, State, Federal Governments, organized private sectors, civil society organizations, research institutes, academia, labour unions, women groups, etc.
Ali Ibrahim Abbas 39
However, while policy process involves many important stages, it remains a mere statement if action in reality does not take place (Dlakwa, 2008). Thus, those who act become the real determiners of policy (Sapru, 2008:133). The importance of any public policy such as poverty reduction in Nigeria is the final result or outcome which can only be achieved, if its goals are properly implemented thereby yielding results to reality (Dlakwa, 2008). Recognising that the purpose of NAPEP such as poverty eradication, the impact of any policy according Sapru (2008) will thus rely on different alternatives between which the policy makers must choose, on those who must help carry it out; on all whose harmony is needed and to put it in to effect and thereby nursing or killing its chances of success.
In furtherance of achieving NAPEP’s policy objectives, Aliyu (2002) show
that the programme was organised in to four major schemes including; Youth Empowerment Scheme (YES); Natural Resources Development and Conservation Scheme (NRDCS); Social Welfare Service Scheme (SOWESS), and the Rural Infrastructure Development Scheme (RIDS).
In January 2001 alone, N6 billion was earmarked to the programme to set its
structures across 774 Local Government Authorities, 36 Federal states and the Federal Capital Territory, Abuja. Unfortunately, up to date, there exists pervasive rate of poverty, unemployment; illiteracy etc all over the nation (UNDP, 2015).The poverty situation is evident in Nigeria’s poor socio economic services and dilapidated or non-existent infrastructures. The most recent government’s official report on poverty released by National Bureau of Statistics (2010) have confirmed that Nigeria have not yet reached where it wanted to be in poverty reduction with 69% of the population still living as poor.
Yobe State remains among the 10 states with the highest incidence of poverty
in the 36 federal states of Nigeria (NBS, 2010). The data released by National Bureau of Statistics which is most recent in the country, show Yobe State with an incidence of poverty put at 79.6% which is far above the national average of 69% that should be worrisome to both government and policy makers. The first concern is that, poverty appears an irony especially by considering the unexplored vast agricultural and mineral potentials of the state in the country.
40 Journal of Social Science for Policy Implications, Vol. 4(1), June 2016
On the second concern, the level of poverty in the state has skyrocketed despite government’s claim of huge investment in both human and materials resource committed to the fight, yet without any tangible results of the programme.
It therefore became necessary to investigate whether or not the rise in
expectations of the poor visa-vi the realities on ground of poverty situation juxtapose the mandate and goals of NAPEP in Yobe state.
While previous studies (Ugoh & Ukpere, 2009, Anyebe, 2014) have
investigated NAPEP over the years, none of the above and other similar studies have however focus on the political understanding of its policies in their description, impact, analysis and explanations particularly in Yobe state, despite being one of the poorest state in Nigeria. It is observed that, achieving any significant result in poverty reduction efforts will depend on what is been done, how it is been done, when it is been done, where it is been done and whom it is been targeted at (Abbas (2013). To achieve the overall aim of the study, efforts will therefore be made to identify the particular policies and programmes of NAPEP since 2001; measure the effectiveness of NAPEP and its impact on the poor, identify the challenges faced by NAPEP and to finally make suitable and appropriate suggestions and recommendations on appropriate poverty reduction policies for Yobe State and Nigeria.
2.1 Conceptualizing Poverty
Poverty remains a major issue of policy concern that continues to draw public
attention. This is in view of the fact that, poverty usually affects almost all sides of human condition such as economic, social, physical, psychological, and political conditions but with particular specifics on every community (Oladeji & Abiola, 1998). Efforts are thus made by different writers to make conceptual meaning which accounted for each trying to relate the term to his/her perception or specialization.
This made Narayan and Petesch (2002:10) to observe that “poverty also may
look quite different, seen through the eyes of a poor man or woman.” The scholar’s thus observe that poor people themselves must and should be allowed to define poverty from their individual and community perspectives (Narayan & Petesch, 2002). It will therefore be elusive to arrive at a universally acceptable definition of poverty despite its contested context and situation, but a contextual meaning may suffice.
Ali Ibrahim Abbas 41
Aliyu (2003:2) observes that the most frequent approach is to view poverty as either relative or absolute. Absolute poverty means, the complete lack of or inadequate access to the basic means to achieving descent life; food, education, decent shelter, clothing, etc (Aliyu (2002).
An alternative is also to define poverty as being relative which is usually
perceived from the comparative judgment of poverty in relation to other persons or countries on a particular socially recognized standard of living. The problem with the above understandings of poverty by Aliyu (2002) however shows that, while both absolute and relative poverty discusses the dimension and classification of poverty in the society by focusing on the basis or indices of classification, the defination neglected other important classifications such that emanated as a result of causative and multi-dimensional factors.
Oladeji and Abiola (1998:8) thus categorized poverty along five dimensions;
economic, cultural, social, physical or personal and political deprivations. This thinking is also shared and advanced further by United Nations Development Programmes (UNDP) and the World Bank (WB) in an attempt to juxtapose its multi-dimensional nature especially by taking in to consideration human basic needs for descent living. While there is no denying the fact that the definition of poverty had drawn many controversies across places and time, for the purpose of this study and contextual relevance to Nigeria, the definition by the Central Bank of Nigeria (CBN) is hereby adopted. CBN (1999:1) defined poverty as;
a state where an individual is not able to carter adequately for his or her basic needs of food, clothing and shelter, is unable to meet social and economic obligations; lacks gainful employment, skills, assets and self-esteem; and has limited access to social and economic infrastructure such as education, health, portable water and sanitation and consequently has limited chances of advancing his or her welfare to the limit of his or her capabilities.
42 Journal of Social Science for Policy Implications, Vol. 4(1), June 2016
2.2 Poverty Magnitude and Trend in Nigeria In recent times, countries in South-East Asia and Sub-Saharan African regions
have the highest level of poverty constituting more than 80% of the global extreme poor people (MDG, 2015). The report however show that while the percentage of poor people that lives below absolute poverty index has drastically reduced by more than half in the globe, poverty situations still remains quite worrisome in some part of the world indicating unevenly distribution of extremely poor people among global regions (MDG, 2015).
Ranging from highest to lowest, the report further show that almost 60% of
the total world extreme poor are particularly found in India, Nigeria, China, Bangladesh and Democratic Republic of Congo thereby resulting in to unacceptable levels of social, economic and political developments of these countries.
In the particular case for Nigeria, the nation’s most recent survey shows that
69% of its population (112,518,507 people) lives in extreme poverty (NBS, 2010). The Nigeria’s poverty situation however contradicts government purported 7% growth rate and its latest position as the largest economy in Africa. The MDG’s 2013 report indicates that, with more than 69% of its population living below abject poverty, it is unlikely that the 2015 target of reducing 50% of poverty level in the nation will be achieved. Furthermore, Nigeria’s position in the UNDP 2015 Human Development Index had also been downgraded to 152th out of the 188 countries. The 2015 Human Development Index put at 0.514, the UNDP report thus placed Nigeria in the lowest level of human development category thereby indicating an increase in low standard of living of the nation’s citizens as evident in its perpetual social, economic, and political insecurity.
Ironically, Nigeria is abundantly blessed with all kinds of needed resources
that any nation could thrive on. Nigeria can for example boost of vast arable land with large deposits of natural gas, crude oil, iron ore, columbite, coal, tin, limestone, zinc, and lead among others. Nigeria is also ranked 6th and 7th as major oil producer and supplier respectively in the globe (World Bank, 2010). However, despite its abundance; its human development indicators are not impressive (MDG, 2015) as youth unemployment put at 38% placed the country with the highest record of youth unemployment in the African hemisphere (MDG, 2013).
Ali Ibrahim Abbas 43
These and many more contradictions in Nigeria’s abundance according to Abbas (2013) may however not be unconnected to the unfavourable political, social and economic environment in Nigeria that are linked to the actions and inactions of the policy makers which the Nigerian state as a policy matter must put right
Since independence in 1960, available data continue to show gradual increase
of poverty incidence in Nigeria (FOS, 1996; NBS, 2010). According Federal Office of Statistics, record shows that by the year 1960, poverty level was only at 15% of the population of Nigeria and it later grows to 28% by 1980.
While in 1985, the spate of increase in poverty levels reached 46% and later in
1996 jumped to an alarming rate of 66% of the population. Using the nation’s most recent survey, Nigeria is battling to reduce poverty from almost 70% of its current estimated population of over 176 million (NBS, 2010). It is observed thus, despite successive government efforts in reducing poverty in Nigeria, the story always seems to be gloomy as the current situation of poverty in the country is quite worrisome and disturbing (Abbas, 2013). The poverty situation in Nigeria thus remains an irony considering the efforts of successive government to reduce it, yet its people continue to wallow in poverty and penury.
Even though high incidence of poverty cut across the nation, another
dimension to understand poverty situation in Nigeria is through its political geography. Analyzing the northern and southern part of the country, NBS (2010) report indicates that northern axis of Nigeria is worst hit by poverty with specific regions of north western and north eastern zones having the maximum level of poor people (77.7 and 76.3% respectively). The poverty situation in the north is further justified in the lack of access to social amenities; health, education, capital and other important amenities that are lower in the region and thus indicating worst human development outcomes. However, despite the fact that south western region emerges with the lowest level of poverty in the country put at 59.1%; the situation is still unacceptable as more than half of its people are also considered poor.
Poverty incidence in Nigeria also exhibits disparities by states. Sokoto state is
topping the current list with a poverty incidence put at 86.4% as Niger state however ranks as the state with lowest poverty incidence put at 43.6% (NBS, 2010).
44 Journal of Social Science for Policy Implications, Vol. 4(1), June 2016
It is also observes that, there exists considerable higher incidence of poverty in the nation’s rural settlements than in its urban settlements (NBS, 2010). Studies also show that life is more difficult in rural Nigeria than its urban settlements as evident in the clear absence of potable water, access to education, sanitation services, and healthcare facilities, etc (UNDP, 2015; MDG, 2015). As poverty continues to be pervasive and intractable across all strata of Nigeria despite efforts made to reduce it, it thus becomes a problem not to the poor alone but a public problem that must be addressed through public policy matters in the public domain.
2.3 Public Policy and Poverty Reduction Efforts in Nigeria
Dlakwa (2008) defines public policy as “the principles, guidelines or
orientations adopted by a government body in guiding the affairs of people in a given polity” (pp.2). Public policy in this context thus remains an attempt by government to address public issues of concern through the adoption and implementation of desired goals and objectives in a given society (Dlakwa, 2008).Abbas (2013) thus observes that, since poverty generally permeates social, economic and political activities of every society, the phenomenon remain a concern that must be checked and addressed by all critical stakeholders. This will mean, identifying and developing an effective policy framework within international, national, and local resources for the benefit of all citizens, especially the poor.
In the case of Nigeria since independence, the hybridization of government’s
public policies and poverty reduction efforts in Nigeria show that no regime has come and gone without initiating and implementing a sort of poverty reduction policy in the country (Abbas, 2013). It is however important to note that, the use or misuse of power by stakeholders in the initiation or implementation of public policies of poverty reduction would advance or mar its successes (Dlakwa, 2008). The task of reducing poverty in any nation thus requires that the nation develop long range views of right policies and programmes to enhance the capacity of their government and its agencies in anticipating and influencing changes in both policy making and implementation in poverty reduction efforts for the betterment of the citizenry. In the case of Nigeria over the years, from their initiation down to implementation stages, government’s efforts in reducing poverty have always continue to raise the expectations of the poor across the country with the hope that their poverty situation will be remedied thereby giving them hope and succour (Abbas, 2013).
Ali Ibrahim Abbas 45
Most notable of these anti-poverty policies so far implemented by successive regimes in Nigeria include among others; Operation Feed the Nation (OFN), National Agricultural Land Development Authority (NALDA), National Directorate of Employment (NDE), Family Support Programme (FSP), Directorate of Food, Road and Rural Infrastructures (DFRRI).Others include; Family Economic Advancement Programme (FEAP), Better Life Programme (BLP), Peoples Bank and Community Banks initiatives, Green Revolution (GR), and National Poverty Eradication Programme (NAPEP), etc.
However, critical to achieving any policy goal like poverty reduction will
depend on the success of its implementation stage (Dlakwa, 2008). This is also relevant in poverty reduction efforts in Nigeria as Sapru (2008) argues that, policy would remain a mere statement, if action in reality does not take place.
Consequently, the success or failure of government’s poverty reduction policy
in Nigeria will rely on its implementation stage which according to Sapru (2008) is critical in managing cost, time, and solving the policy problem of poverty itself. It is also observed that, implementation stage in policy process usually remain challenging, difficult and critical as Dlakwa (2008) and Sapru (2008) observes it involves interactions among people, government agencies and their activities with each group having own political interest.
Subsequent to policy implementation stage, the basic premise of policy is its
result which can only be better achieved, if its goals are properly initiated and implemented thereby leading to better outcomes (Dlakwa, 2008; Sapru, 2008).When NAPEP was formed in 2001, many people believed the programme was designed to make a difference from all the previous poverty reduction effort in the country (Oyemomi, 2003). Unfortunately, after its full implementation NAPEP like its previous counterparts, scholars are somehow unanimous that its policy intension by government is without any tangible result across Nigeria (Oshewolo, 2010; Anyebe, 2014).However, valid investigations on NAPEP will only be proper if there is clear understanding of what such agencies of government do as public policy matters in addressing particular problems at a particular place and particular time such as poverty reduction in a vast country like Nigeria.
46 Journal of Social Science for Policy Implications, Vol. 4(1), June 2016
3. Study Area and Methodology Yobe State located in northern Nigeria was created on August 27, 1991 out of
old Borno State situated within latitude and longitude 11o N and 13.50 E. With 47,153 km 2 total land area, the State according 2006 national population data, has a population of 2,321,591 people spread across its 17 local councils with diverse ethnic compositions. Mostly dependent on monthly statutory transfers from the national government, Yobe State’s internally generated revenue only stand at 2.24% of the total contribution to the State’s expenditure considered even too meager to pay salaries of government’s employees.
Small scale agriculture constituting more than 80% of its populace remains the
main source of income and employment for a large population of the State. With almost 80% of its population living below poverty line, Yobe State according NBS (2010) is rated as the 10th poorest State in Nigeria.
The research design is mix method combing both quantitative and qualitative
methods. Data collection is achieved through both primary and secondary sources. Secondary sources relied on publications from National Bureau of Statistics, official records from NAPEP and other related literatures. The primary sources relied on the responses of respondents from questionnaires and qualitative interviews conducted with key informants. Through field survey method, 245 questionnaires were distributed to respondents and 202 were filled and returned. Using stratified quota sampling technique, the sample includes officials of NAPEP, its programme’s beneficiaries as well as the general public across Yobe state. Using the three Senatorial Districts in the State, three Local Government Councils from each of the three zones were selected. The questionnaires were thus distributed in Bade, Yusufari, Machina, Damaturu, Geidam, Yunusari, Nangere, Potiskum and Fune Local Government Areas in the State.
The responses obtained through questionnaire were later analysed using
simple description of tables, frequencies, and percentages to provide meaningful interpretation. Qualitative interviews were also conducted with Yobe State Coordinator of NAPEP, its Secretary and 5 selected beneficiaries spread across the major schemes of NAPEP to augment and validate the responses generated from the structured questionnaires.
Ali Ibrahim Abbas 47
Each of the interview sessions conducted in Damaturu with the 7 key informants lasted between 20 to 40 minutes and were recorded, transcribed and meanings extracted out of the conversations. Descriptive and explanatory data analysis techniques were adopted to answer the study’s problem statement and achieve its research objectives.
4. Results and Discussions
This section presents results and discussions from responses obtained through
questionnaire using simple and clear inferences and descriptions to tables, frequencies, and percentages in order to provide meaningful interpretation to data. Out of the 245 questionnaires distributed to respondents across the nine selected Local Government Areas in the state, 202 questionnaires were filled and returned which is 82.4% returned and therefore considered valid and reliable for data analysis in the study.
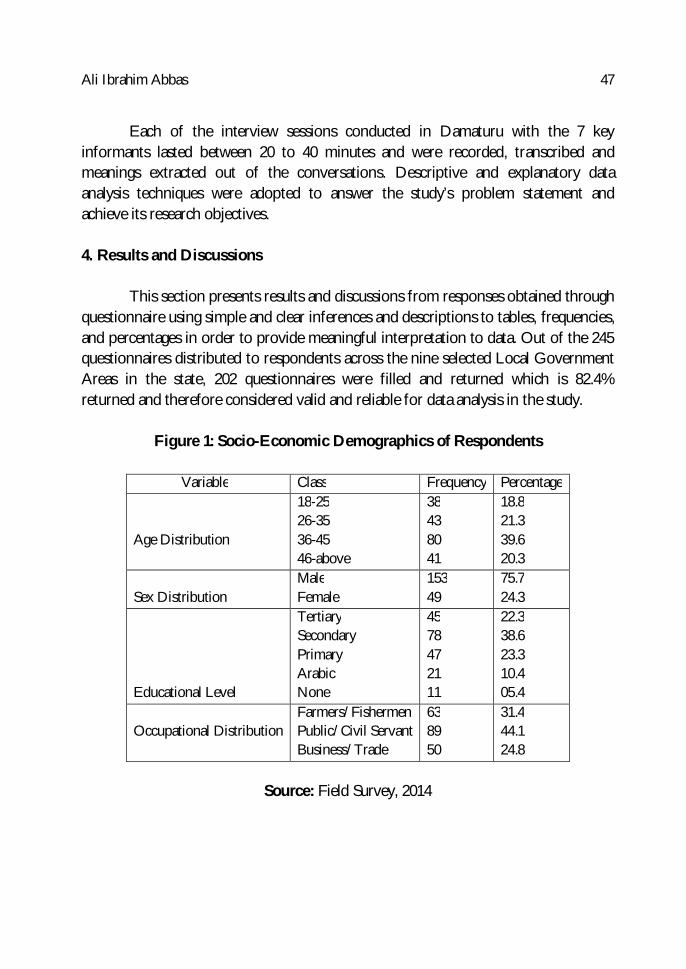
Figure 1: Socio-Economic Demographics of Respondents
Variable Class Frequency Percentage
Age Distribution
18-25 26-35 36-45 46-above
38 43 80 41
18.8 21.3 39.6 20.3
Sex Distribution
Male Female
153 49
75.7 24.3
Educational Level
Tertiary Secondary Primary Arabic None
45 78 47 21 11
22.3 38.6 23.3 10.4 05.4
Occupational Distribution
Farmers/Fishermen Public/Civil Servant Business/Trade
63 89 50
31.4 44.1 24.8
Source: Field Survey, 2014
48 Journal of Social Science for Policy Implications, Vol. 4(1), June 2016
Sex distributions of 153 respondents that represent 75.7% in the study were male participants (Figure 1). 49 respondents, representing 24.3% were female participants. Low percentage of female participants (24.3%) is thus observed which indicates lower participation of women in the programme and daily lives of people in the State. This may not be however be unconnected with the culture of women exclusion that is rampant in the northern part of Nigeria. The age bracket of the respondents ranges from 18 to 46 years. However majority of respondents (39.6%) and (21.3%) fall between the age brackets of 36–45 and 26-35 years respectively thus considered within the range of productive labour force in the study area thereby most likely to offer relevant information needed for the study.
In the educational levels, 38.6% hold Secondary School Certificate, 22.3%
hold higher education certificate, 23.3% hold Primary school certificates, 10.4% hold Arabic qualification while 05.4% have no any form of formal qualification.
The result thus demonstrate that a greater percentage of the respondents have
some school certificates believed to possess better knowledge and understanding of poverty situation and its reduction efforts by NAPEP in Yobe State. The occupational distributions of the respondents also show diversed occupations cutting across the various walks of life in Yobe State thereby reflecting diverse opinions on NAPEP. The study also captured different social groups; farmers and fisher men (31.2%), public and civil servants (44.1%) and 24.8% were selected from other various business and trade related professions in the State.
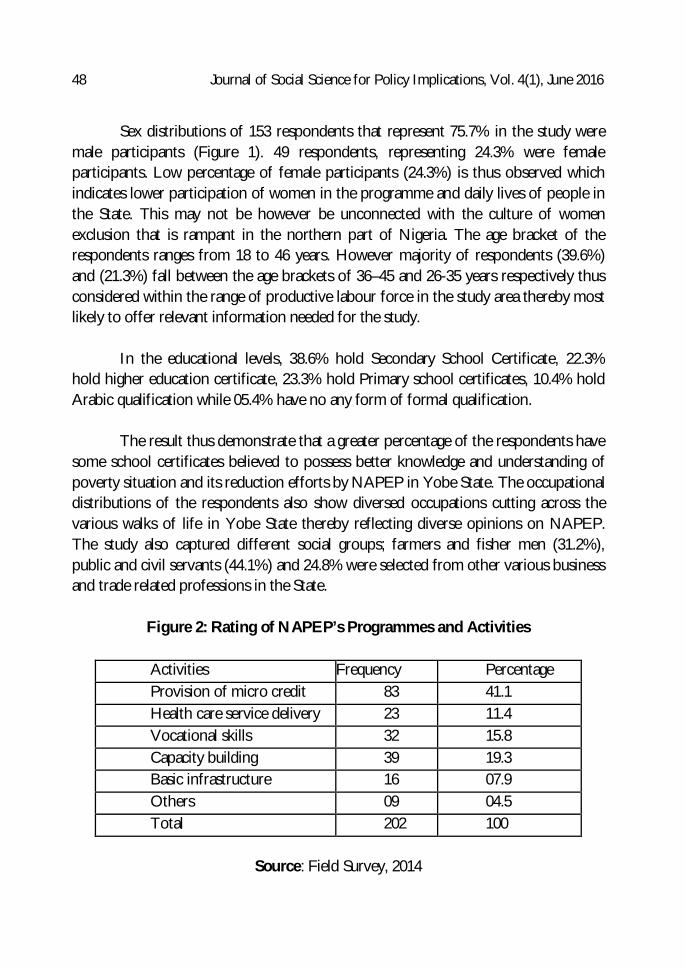
Figure 2: Rating of NAPEP’s Programmes and Activities
Activities Frequency Percentage Provision of micro credit 83 41.1 Health care service delivery 23 11.4 Vocational skills 32 15.8 Capacity building 39 19.3 Basic infrastructure 16 07.9 Others 09 04.5 Total 202 100
Source: Field Survey, 2014
Ali Ibrahim Abbas 49
Figure 2 above shows 41% of respondents totaling 83 indicate micro-credit as the most common programme of NAPEP. Some 11.4% of the respondents representing 23 however show that provision of health care services remain the most common programme of NAPEP. Training for vocational skills and development as part of NAPEP’s programmes was considered the most common by 32 respondents which represents 15.8% of the total. 39 and 16 respondents believe capacity building and basic infrastructure as NAPEP area of competence, representing 19.8% and 07.9% respectively. Finally, about 04.5% of respondents identified other activities as the area of NAPEP’s major programmes and activities.
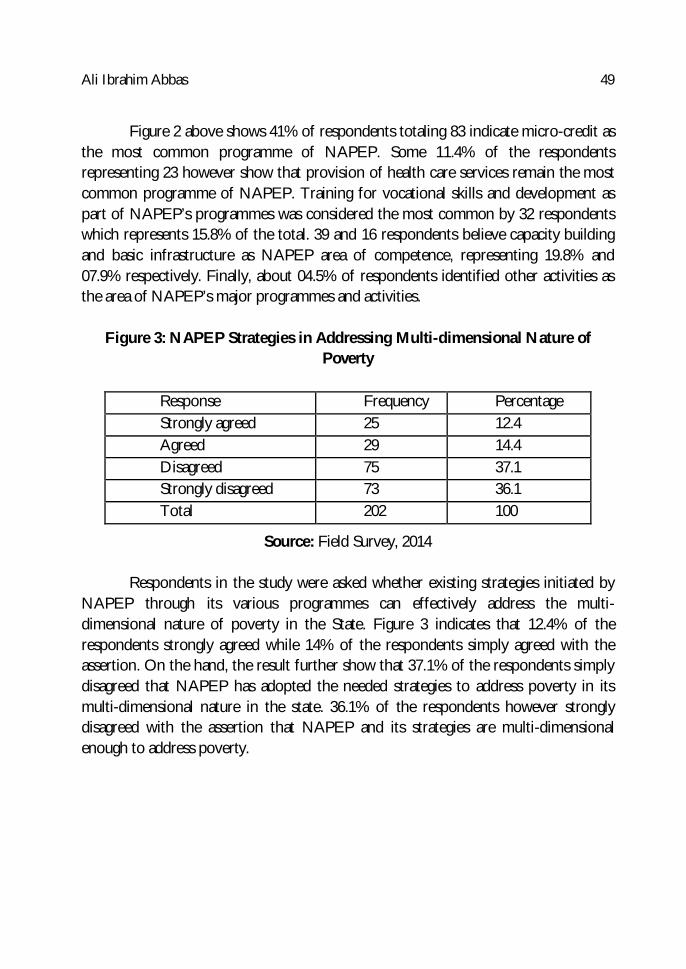
Figure 3: NAPEP Strategies in Addressing Multi-dimensional Nature of Poverty
Response Frequency Percentage Strongly agreed 25 12.4 Agreed 29 14.4 Disagreed 75 37.1 Strongly disagreed 73 36.1 Total 202 100
Source: Field Survey, 2014 Respondents in the study were asked whether existing strategies initiated by
NAPEP through its various programmes can effectively address the multi-dimensional nature of poverty in the State. Figure 3 indicates that 12.4% of the respondents strongly agreed while 14% of the respondents simply agreed with the assertion. On the hand, the result further show that 37.1% of the respondents simply disagreed that NAPEP has adopted the needed strategies to address poverty in its multi-dimensional nature in the state. 36.1% of the respondents however strongly disagreed with the assertion that NAPEP and its strategies are multi-dimensional enough to address poverty.
50 Journal of Social Science for Policy Implications, Vol. 4(1), June 2016
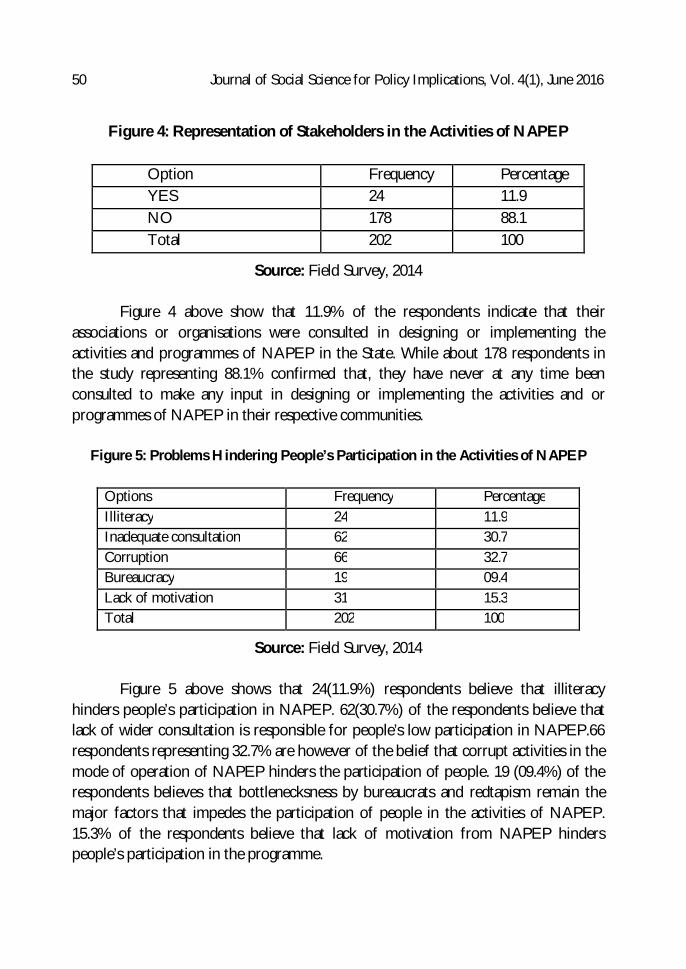
Figure 4: Representation of Stakeholders in the Activities of NAPEP
Option Frequency Percentage YES 24 11.9 NO 178 88.1 Total 202 100
Source: Field Survey, 2014 Figure 4 above show that 11.9% of the respondents indicate that their
associations or organisations were consulted in designing or implementing the activities and programmes of NAPEP in the State. While about 178 respondents in the study representing 88.1% confirmed that, they have never at any time been consulted to make any input in designing or implementing the activities and or programmes of NAPEP in their respective communities.
Figure 5: Problems Hindering People’s Participation in the Activities of NAPEP
Options Frequency Percentage Illiteracy 24 11.9 Inadequate consultation 62 30.7 Corruption 66 32.7 Bureaucracy 19 09.4 Lack of motivation 31 15.3 Total 202 100
Source: Field Survey, 2014 Figure 5 above shows that 24(11.9%) respondents believe that illiteracy
hinders people’s participation in NAPEP. 62(30.7%) of the respondents believe that lack of wider consultation is responsible for people’s low participation in NAPEP.66 respondents representing 32.7% are however of the belief that corrupt activities in the mode of operation of NAPEP hinders the participation of people. 19 (09.4%) of the respondents believes that bottlenecksness by bureaucrats and redtapism remain the major factors that impedes the participation of people in the activities of NAPEP. 15.3% of the respondents believe that lack of motivation from NAPEP hinders people’s participation in the programme.
Ali Ibrahim Abbas 51
The result thus shows that most respondents believe that poor consultation by NAPEP is the major problem hindering people’s participation in NAPEP.
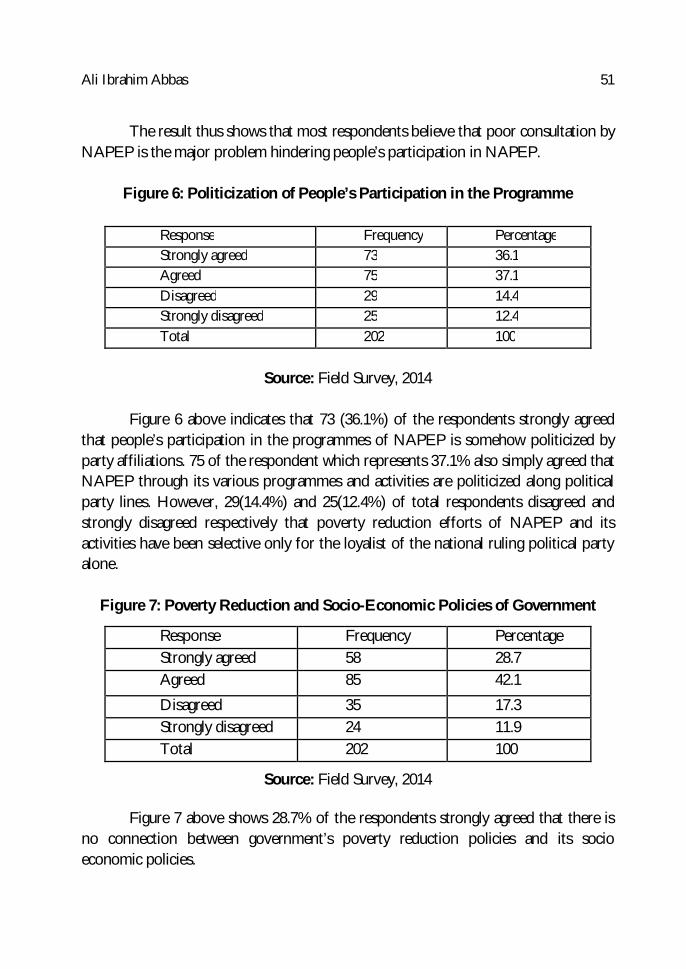
Figure 6: Politicization of People’s Participation in the Programme
Response Frequency Percentage Strongly agreed 73 36.1 Agreed 75 37.1 Disagreed 29 14.4 Strongly disagreed 25 12.4 Total 202 100
Source: Field Survey, 2014
Figure 6 above indicates that 73 (36.1%) of the respondents strongly agreed
that people’s participation in the programmes of NAPEP is somehow politicized by party affiliations. 75 of the respondent which represents 37.1% also simply agreed that NAPEP through its various programmes and activities are politicized along political party lines. However, 29(14.4%) and 25(12.4%) of total respondents disagreed and strongly disagreed respectively that poverty reduction efforts of NAPEP and its activities have been selective only for the loyalist of the national ruling political party alone.
Figure 7: Poverty Reduction and Socio-Economic Policies of Government
Response Frequency Percentage Strongly agreed 58 28.7 Agreed 85 42.1 Disagreed 35 17.3 Strongly disagreed 24 11.9 Total 202 100
Source: Field Survey, 2014 Figure 7 above shows 28.7% of the respondents strongly agreed that there is
no connection between government’s poverty reduction policies and its socio economic policies.
52 Journal of Social Science for Policy Implications, Vol. 4(1), June 2016
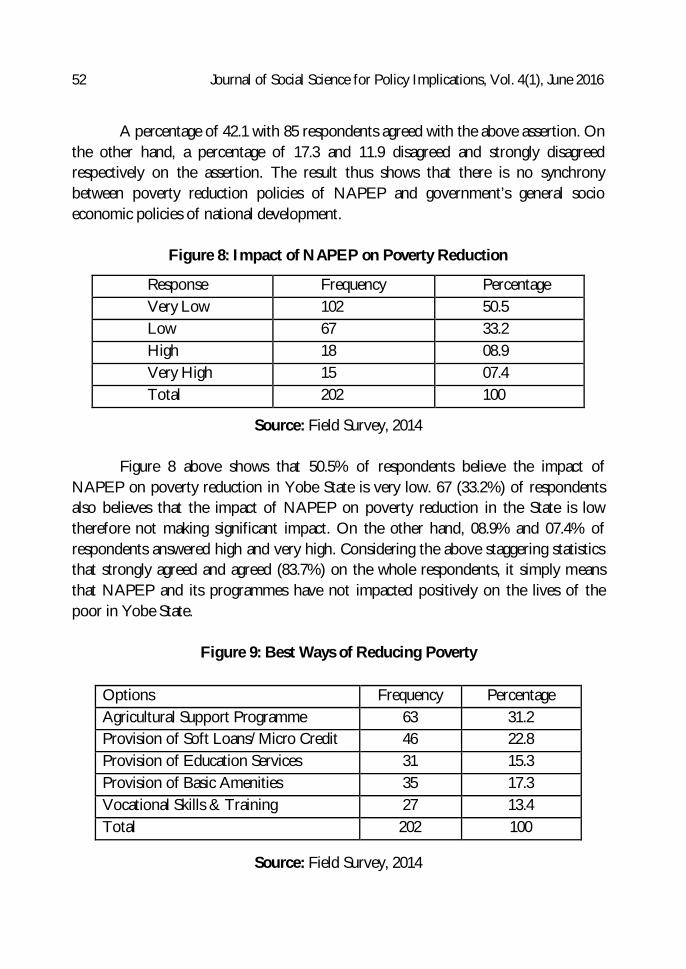
A percentage of 42.1 with 85 respondents agreed with the above assertion. On the other hand, a percentage of 17.3 and 11.9 disagreed and strongly disagreed respectively on the assertion. The result thus shows that there is no synchrony between poverty reduction policies of NAPEP and government’s general socio economic policies of national development.
Figure 8: Impact of NAPEP on Poverty Reduction
Response Frequency Percentage Very Low 102 50.5 Low 67 33.2 High 18 08.9 Very High 15 07.4 Total 202 100
Source: Field Survey, 2014
Figure 8 above shows that 50.5% of respondents believe the impact of NAPEP on poverty reduction in Yobe State is very low. 67 (33.2%) of respondents also believes that the impact of NAPEP on poverty reduction in the State is low therefore not making significant impact. On the other hand, 08.9% and 07.4% of respondents answered high and very high. Considering the above staggering statistics that strongly agreed and agreed (83.7%) on the whole respondents, it simply means that NAPEP and its programmes have not impacted positively on the lives of the poor in Yobe State.
Figure 9: Best Ways of Reducing Poverty
Options Frequency Percentage Agricultural Support Programme 63 31.2 Provision of Soft Loans/Micro Credit 46 22.8 Provision of Education Services 31 15.3 Provision of Basic Amenities 35 17.3 Vocational Skills & Training 27 13.4 Total 202 100
Source: Field Survey, 2014
Ali Ibrahim Abbas 53
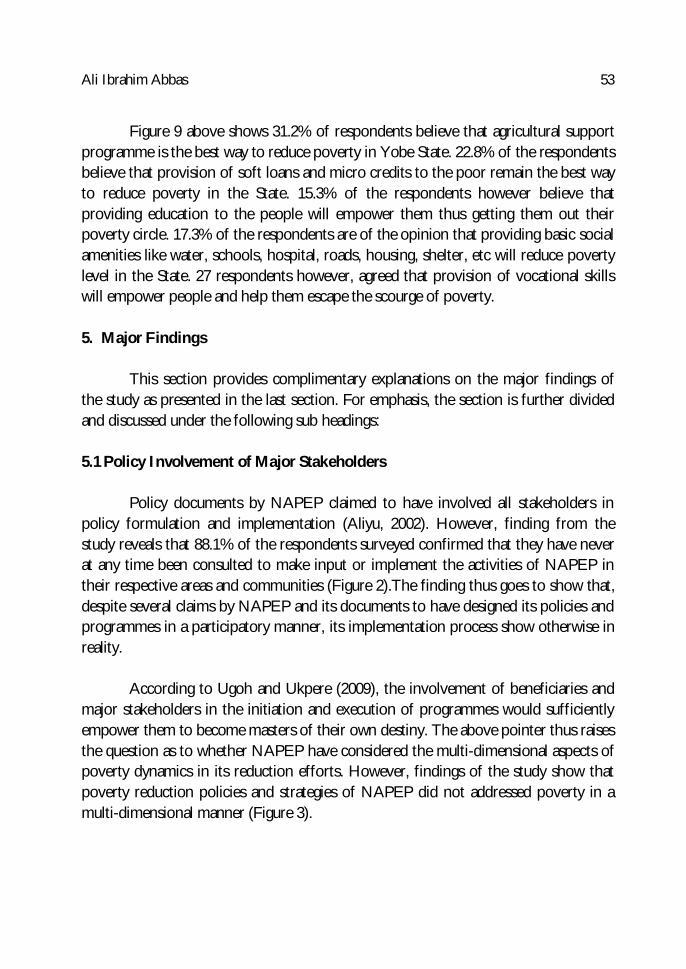
Figure 9 above shows 31.2% of respondents believe that agricultural support programme is the best way to reduce poverty in Yobe State. 22.8% of the respondents believe that provision of soft loans and micro credits to the poor remain the best way to reduce poverty in the State. 15.3% of the respondents however believe that providing education to the people will empower them thus getting them out their poverty circle. 17.3% of the respondents are of the opinion that providing basic social amenities like water, schools, hospital, roads, housing, shelter, etc will reduce poverty level in the State. 27 respondents however, agreed that provision of vocational skills will empower people and help them escape the scourge of poverty.
5. Major Findings
This section provides complimentary explanations on the major findings of
the study as presented in the last section. For emphasis, the section is further divided and discussed under the following sub headings: 5.1 Policy Involvement of Major Stakeholders
Policy documents by NAPEP claimed to have involved all stakeholders in
policy formulation and implementation (Aliyu, 2002). However, finding from the study reveals that 88.1% of the respondents surveyed confirmed that they have never at any time been consulted to make input or implement the activities of NAPEP in their respective areas and communities (Figure 2).The finding thus goes to show that, despite several claims by NAPEP and its documents to have designed its policies and programmes in a participatory manner, its implementation process show otherwise in reality.
According to Ugoh and Ukpere (2009), the involvement of beneficiaries and
major stakeholders in the initiation and execution of programmes would sufficiently empower them to become masters of their own destiny. The above pointer thus raises the question as to whether NAPEP have considered the multi-dimensional aspects of poverty dynamics in its reduction efforts. However, findings of the study show that poverty reduction policies and strategies of NAPEP did not addressed poverty in a multi-dimensional manner (Figure 3).
54 Journal of Social Science for Policy Implications, Vol. 4(1), June 2016
This also goes to show that NAPEP is missing an important point as poverty dynamics hinges on age, gender, culture among other socio-economic contexts (Narayan & Petesch, 2002) which the current programme failed to consider. Another finding of the study revealed the major reasons why there is general poor participation of people and major stakeholders in the activities and programmes of NAPEP. 32.7% of the respondents were of the belief that lack of accountability and transparency in the modus operandi of NAPEP hinders popular participation of the people in the programme (Figure 5).
Other major problems identified in descending order in hindering people and
major stakeholder’s participation in the activities and programmes of NAPEP includes; inadequate or poor consultation of major stakeholders, lack of motivation and complementariness, bureaucratic bottlenecks and redtapism in the conduct of doing government business, as well as illiteracy and lack of information. 5.2 Poverty Reduction and Socio Economic Policies of Government
The finding of the study shows that there is no clear and mutual relationship
between poverty reduction policies of government and its general socio economic policies (Figure 7). The failure of the needed connection has for-instance undermines needed social welfare or safety nets by poor, evidenced in high rate of unemployment, inequitable access to economic opportunities and social amenities needed for any societal decent living, therefore aggravating poverty. It is thus observed that, the existence of deep disconnect between government’s general socio-economic policies and its particular poverty reduction of NAPEP is a major challenge especially in the current face of perpetual darkness and insecurity.
Critical infrastructure remains central to any serious national development
agenda as well as addressing the problem of poverty in any society (Abbas, 2013). Unfortunately, the current situation in Nigeria shows a total collapse of basic infrastructures that continue to undermine and limits the capabilities of its people to advance their talent in such a challenging environment. It is thus practically impossible to address poverty in the current situation as unsustainable environment are oftentimes not favorable to small-scale business holders that are related to poverty reduction.
Ali Ibrahim Abbas 55
Oshewolo (2010) is thus right to observe that most poverty reduction programmes in Nigeria have not been successful over time, as they have failed to connect poverty reduction policies with general socio economic policies of the government for its overall national development. 5.3 NAPEP and Politics of Poverty Reduction
When NAPEP was established in 2001, its main objective was to coordinate
the eradication of poverty across the country towards achieving the MDG goal 1 of reducing poverty by 50% by the year 2015. The main target of the programme thus remains the poor especially the most vulnerable in the society. However, findings from the study show that 36.1% and 37.1% of the respondents strongly and simply agreed respectively that people’s participation in NAPEP’s programmes and its activities are politicised along party affiliations (Figure 6). The findings further show that members of the national ruling national party, People Democratic Party in Yobe State are oftentimes the beneficiaries of NAPEP’s programmes instead of targeting everyone irrespective of party affiliations.
The above finding is however further aggravated by the fact that, most top-
ranking officials of NAPEP are politically appointed by certain interest groups and are therefore subjected to behave in a loyal political manner to those who appointed them and not the interest of the poor person. Interestingly, in the case of Nigeria like in most developing nations, Abbas (2013) observes that the elites most especially the political appointees of government at higher levels of decision making are probably the main cause of the situation the poor find themselves today. The politics here is that the government and the ruling elites always claim to understand what poverty is, who the poor are and what is needed to be done to eradicate poverty, while in actual sense only the poor person really understands poverty and how it can best be eradicated. 5.4 NAPEP Programmes and its Impact in Reducing Poverty
In an effort to actualise its mandate in Yobe State, documents available in
Yobe State NAPEP’s office Damaturu show the following programmes were undertaken from 2001 to 2014. These programmes and activities according to officials of NAPEP interviewed are packaged through various schemes of the programme.
56 Journal of Social Science for Policy Implications, Vol. 4(1), June 2016
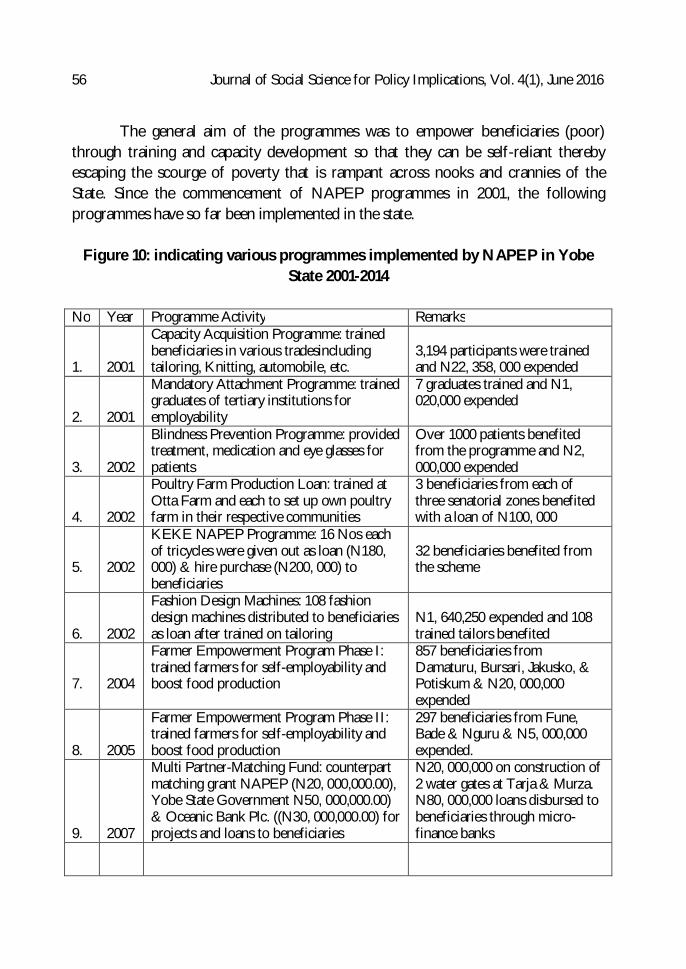
The general aim of the programmes was to empower beneficiaries (poor) through training and capacity development so that they can be self-reliant thereby escaping the scourge of poverty that is rampant across nooks and crannies of the State. Since the commencement of NAPEP programmes in 2001, the following programmes have so far been implemented in the state.
Figure 10: indicating various programmes implemented by NAPEP in Yobe State 2001-2014
No Year Programme Activity Remarks 1.
2001
Capacity Acquisition Programme: trained beneficiaries in various tradesincluding tailoring, Knitting, automobile, etc.
3,194 participants were trained and N22, 358, 000 expended
2.
2001
Mandatory Attachment Programme: trained graduates of tertiary institutions for employability
7 graduates trained and N1, 020,000 expended
3.
2002
Blindness Prevention Programme: provided treatment, medication and eye glasses for patients
Over 1000 patients benefited from the programme and N2, 000,000 expended
4.
2002
Poultry Farm Production Loan: trained at Otta Farm and each to set up own poultry farm in their respective communities
3 beneficiaries from each of three senatorial zones benefited with a loan of N100, 000
5.
2002
KEKE NAPEP Programme: 16 Nos each of tricycles were given out as loan (N180, 000) & hire purchase (N200, 000) to beneficiaries
32 beneficiaries benefited from the scheme
6.
2002
Fashion Design Machines: 108 fashion design machines distributed to beneficiaries as loan after trained on tailoring
N1, 640,250 expended and 108 trained tailors benefited
7.
2004
Farmer Empowerment Program Phase I: trained farmers for self-employability and boost food production
857 beneficiaries from Damaturu, Bursari, Jakusko, & Potiskum & N20, 000,000 expended
8.
2005
Farmer Empowerment Program Phase II: trained farmers for self-employability and boost food production
297 beneficiaries from Fune, Bade & Nguru & N5, 000,000 expended.
9.
2007
Multi Partner-Matching Fund: counterpart matching grant NAPEP (N20, 000,000.00), Yobe State Government N50, 000,000.00) & Oceanic Bank Plc. ((N30, 000,000.00) for projects and loans to beneficiaries
N20, 000,000 on construction of 2 water gates at Tarja & Murza. N80, 000,000 loans disbursed to beneficiaries through micro-finance banks
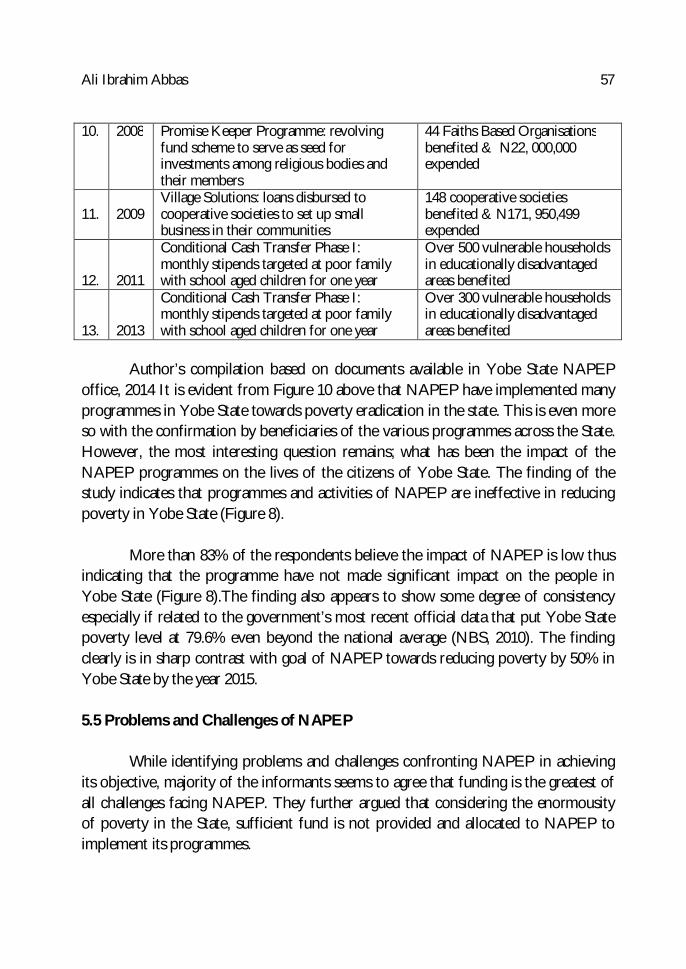
Ali Ibrahim Abbas 57
10. 2008 Promise Keeper Programme: revolving fund scheme to serve as seed for investments among religious bodies and their members
44 Faiths Based Organisations benefited & N22, 000,000 expended
11.
2009
Village Solutions: loans disbursed to cooperative societies to set up small business in their communities
148 cooperative societies benefited & N171, 950,499 expended
12.
2011
Conditional Cash Transfer Phase I: monthly stipends targeted at poor family with school aged children for one year
Over 500 vulnerable households in educationally disadvantaged areas benefited
13.
2013
Conditional Cash Transfer Phase I: monthly stipends targeted at poor family with school aged children for one year
Over 300 vulnerable households in educationally disadvantaged areas benefited
Author’s compilation based on documents available in Yobe State NAPEP
office, 2014 It is evident from Figure 10 above that NAPEP have implemented many programmes in Yobe State towards poverty eradication in the state. This is even more so with the confirmation by beneficiaries of the various programmes across the State. However, the most interesting question remains; what has been the impact of the NAPEP programmes on the lives of the citizens of Yobe State. The finding of the study indicates that programmes and activities of NAPEP are ineffective in reducing poverty in Yobe State (Figure 8).
More than 83% of the respondents believe the impact of NAPEP is low thus
indicating that the programme have not made significant impact on the people in Yobe State (Figure 8).The finding also appears to show some degree of consistency especially if related to the government’s most recent official data that put Yobe State poverty level at 79.6% even beyond the national average (NBS, 2010). The finding clearly is in sharp contrast with goal of NAPEP towards reducing poverty by 50% in Yobe State by the year 2015. 5.5 Problems and Challenges of NAPEP
While identifying problems and challenges confronting NAPEP in achieving
its objective, majority of the informants seems to agree that funding is the greatest of all challenges facing NAPEP. They further argued that considering the enormousity of poverty in the State, sufficient fund is not provided and allocated to NAPEP to implement its programmes.
58 Journal of Social Science for Policy Implications, Vol. 4(1), June 2016
Other major problems and challenges particularly identified by the officials of NAPEP include: non-payment of counterpart fund by Yobe State Government and other critical partners of NAPEP; non repayment of loans by beneficiaries; logistic problems such as lack of transportation and other supporting allowances that could serve as incentive for motivation; ill-timed release of funds by NAPEP headquarters in Abuja, among others.
Interview sessions with selected beneficiaries of the programme and other
critical stakeholders further revealed more problems and challenges not mentioned by NAPEP officials. The key informants are unanimous that NAPEP’s programmes are too narrow in scope for adopting general approach across the country despite marked differences in State’s socio-economic and political considerations thus making it unidirectional.
Other major challenges identified by the key informants includes; poor and
political targeting of the poor that is only selective to ruling party loyalist of the national government, corruption and mismanagement by NAPEP and other government officials, government’s policy and programme inconsistency, ineffective coordination and the general lack of sincere political will and commitment by the government to address the problem of poverty. Consequently, the problems and challenges identified in the study remain a stumbling block to NAPEP in achieving its stated goals and objectives.
6. Conclusion
It is evident that NAPEP have implemented many programmes in Yobe State
towards poverty eradication in the State. However, despite such various efforts made by NAPEP through its various programmes and activities to reduce poverty, its impact on the poor in Yobe State remains devastating as policy expectations of the programme failed in achieving its stated objectives in to reality. The poverty reduction policies and strategies put in place by NAPEP therefore remain a painful experience in both its policy conception as well as its implementation in Yobe State considering its poverty level even beyond the national average.
Ali Ibrahim Abbas 59
NAPEP’s unsuccessful outfit in Yobe State hinges on poor funding, non-payment of counterpart funding, non-repayment of loans, lack of incentives to officials, programme’s narrow scope, non-involvement of critical stakeholders, poor targeting of poor, politicisation, mismanagement, programme’s inconsistency, NAPEP’s disconnect with national development policies and the general lack of political commitment by government to sincerely address the scourge of poverty. 7. Recommendations
Based on the major findings of the study, the following policy recommendations are hereby put forward:
1. Poverty situation particularly in Yobe State and Nigeria in general remain
complex and complicated; therefore requires an integrated pragmatic approach that involves effective collaborations among various critical stakeholders such as the state, private sector and the civil society. Such involvement will also check the excess of corrupt government officials and their activities thus facilitating higher results.
2. Considering the enormousity of poverty prevalence in the society, current budgetary allocation to NAPEP and other poverty reduction related bodies is quite short of their expected demands by the poor. More funds and support are thus needed to allow NAPEP and other bodies achieve poverty reduction efforts.
3. Future efforts on poverty reduction should make efforts to integrate views and opinions of the poor on how best to improve their conditions. By adopting the bottom-up approach to policy, it is expected that the poor and all stakeholders would be mobilised to be party to and support the programmes towards its success and sustainability.
4. Future strategies should be consciously articulated to realistically reflect particular skills with particular community needs and demands such that efforts will be made to link up the apprentice when they finish learning the job. This approach will be useful for both creating self-employment as well as proper maintenance of existing community projects and facilities important for sustainability.
60 Journal of Social Science for Policy Implications, Vol. 4(1), June 2016
5. Existing social safety nets considered as social welfare programme for the poor needs to be reinforced and new ones introduced and included in socio-economic development agendas of federal, state, and local governments in the country. Focus should be made on addressing poverty comprehensively by provision of subsidies to the poor on food, education, housing, transport, etc thereby enhancing descent living.
6. It is a fact that poverty does not recognise political boundaries therefore
strategies should not be limited to any particular political party, loyalist, or affiliate. To achieve the desired objective, everyone should be carried along, irrespective of party affiliation and leaning.
7. Agriculture remains the main employer of labour in Nigeria and Yobe State in
particular. Agricultural supports and inputs such as machineries and implements, soft credits and loans, improved seedlings and breeds, storage and preservation facilities, accessible markets through rural networks would certainly increase agricultural productivity and facilitate incomes growth and wealth generation.
8. The current structure of the nation’s economy and its environment dependent on crude oil remain a major challenge to the diversification of Nigeria’s mono-political economy. The nation’s economy must be diversified through the creation of sustainable environment conducive towards increased investment in agriculture, power, renewable energy, solid minerals, tourism, and ICT that remain largely unexplored despite huge potentials to create employment and develop infrastructure.
9. Basic human needs for descent living such as portable clean water, food,
decent shelter, healthcare services and functional educational services are all integral to any meaningful poverty reduction efforts. A healthy and technically trained citizenry will certainly add value to productivity in the society. Government and all stakeholders should therefore prioritise on its allocation and implementation on basic socio-economic needs of the populace in order to achieve sustainable poverty reduction and national development.
Ali Ibrahim Abbas 61
References
Abbas, A. I. (2013). Appraising the policies and programmes of poverty reduction in Nigeria: A critical view point. International Journal of Administration and Development Studies (IJADS), 4(1) 88-110.
Aliyu, A. (2002). Re-structuring of the poverty alleviation activities of the federal government of Nigeria. Abuja; National Poverty Eradication Programme.
Anyebe, A.A. (2014). Poverty reduction in Nigeria via National Poverty Eradication Programme: Two decades of policy failure? Journal of Social Science for Policy Implications, 2(2) 19-35.
Central Bank of Nigeria (CBN).(1999). Nigeria’s development prospects: Poverty assessment and alleviation study. Abuja; Central Bank of Nigeria in Collaboration with the World Bank.
Dlakwa, H.D. (2008). Concepts and models in public policy formulation and analysis. Kaduna; Pyla- Mak Services Limited.
Federal Office of Statistics (FOS). (1996). Socio-economic profile of Nigeria 1996.Lagos; FOS.
National Bureau of Statistics (NBS).(2010). Poverty profile for Nigeria. Abuja; National Bureau of Statistics.
Narayan, D. & Petesch P. (2002).Voices of the poor: From many lands. New York; World Bank.
Millennium Development Goals (2013). Nigeria 2013 Millennium Development Goals Report. Retrieved from www.mdgs.gov.ng
Millennium Development Goals 2015 Report. New York: United Nations. Retrievedfromhttp://www.un.org/millenniumgoals/2015_MDG_Report/pdf/MDG%202015%20rev%20(July%201).pdf
Oladeji, S. I. & Abiola A. G. (1998). Poverty alleviation with economic growth strategy: Prospects and challenges in contemporary Nigeria. Nigerian Journal of Economic and Social Studies (NJESS), 40 (1).
Oshewolo, S. (2010).Galloping poverty in Nigeria: An appraisal of the government’s interventionist policies. Journal of Sustainable Development in Africa, 12 (6).
Oyemomi, E.O. (2003). An assessment of poverty reduction strategies in Nigeria (1983-2003). An unpublished Dissertation Submitted in Partial Fulfillment of the Requirements for the Award of the Ph.D. of St. Clement’s University.
Sapru, R.K. (2008). Public policy formulation: Implementation and evaluation. New Delhi; Sterling Publishers Pvt. Limited.
62 Journal of Social Science for Policy Implications, Vol. 4(1), June 2016
Ugoh, S.C. & Ukpere, W.I. (2009).Appraising the trend of policy on poverty alleviation programmes in Nigeria with emphasis on National Poverty Eradication Programme (NAPEP).Business Papers and Reports, Paper 13. Retrieved fromhttp://dk.cput.ac.za/bus_ papers/13
United Nations Development Programme (2015).Human development report: Work for human development. New York: UNDP. Retrieved from: http://hdr.undp.org/en/2015-report