Embed Size (px)
Citation preview
Beware the Share Market Bears!
They are never far away
The next bear market is just around the corner.
Brainy's 10 Key Lessons from the GFC*for investors and traders
August 2009
Edition 3.2
* GFC — Global Financial Crisis
© August 2009, R.B.Brain – Consulting
document filename: Brainy:...beware-the-bears.odtPrinted: 7/09/2009
“The share market can seem mystical and almost like black magic; but with the right support and assistance, it just seems like magic.”
Robert Brain
Beware the Share Market Bears! They are never far awayBrainy's 10 Key Lessons from the GFC for Investors and Traders
Important Notice (and disclaimer)Robert does not hold an AFS license. There is no intention with any of this material to provide investment advice. None of the information presented takes into account the investment objectives, financial situation and/or particular needs of any person or class of persons. The information is strictly for education and information only. To this end, it has to be said here that any product that is mentioned herein or referred to is not recommended by the author. The reader should seek professional advice to this end.
These notes do not contain any advice of any sort.
ABOUT THE AUTHOR — Robert Brain
Robert has a tertiary qualification in Engineering, and 30+ years experience in a number of industries using specialist skills and knowledge in the ICT field — Information and Communications Technology. He is a computer power user, and very proficient in a variety of desktop software products (including BullCharts charting software).
Robert became seriously interested in the stock market at about the time of the tech crash (March 2000), and he has been studying and applying Technical Analysis (charting) since then. He has been the convenor of the Melbourne BullCharts User Group since its inception in 2006. With the computer background, he is very knowledgeable in each of the share market, BullCharts software and technical analysis.
Robert now runs a business based on the Brainy's Share Market Toolbox web site (www.robertbrain.com) to provide ongoing support and tuition to share market investors and traders, and specialising in supporting BullCharts software users. Robert presents a variety of seminars and workshops, and writes various eNewsletters and Tip Sheets.
ABOUT THESE NOTESThese notes originally accompanied Robert's “10 Key Lessons from the Global Financial Crisis” seminar presented in May 2009. They are now expanded and adapted to form the basis of a pending publication entitled “Beware the Share Market Bears! - They are never far away”. And sub-titled “Brainy's 10 Key Lessons from the GFC for Investors and Traders”.
More information about both Robert, and Brainy's various seminars, workshops, and publications is available at Brainy's Share Market Toolbox web site: www.robertbrain.com
Acknowledgements
Phil Anderson of Economic Indicator Services (at http://www.businesscycles.biz/) has provided some research and information which is a real eye-opener. His book is highly recommended "The Secret Life of Real Estate". (Anderson, Phillip J, “The Secret Life of Real Estate — How it moves and why”, Shepheard-Walwyn, 2008)
Frank Watkins of ProTrader really tells it all in his book “Exploding the Myths”, which is a fantastic read. (Watkins, Frank, “Exploding the Myths”, Vocational Education & Training Publications, 2003) Visit www.protrader.com.au for more information.
Stan Weinstein's book “Secrets for Profiting in Bull and Bear Markets” (McGraw-Hill, 1988) is a classic that helps put a lot into perspective for anyone who is looking for answers when they start their investing journey.
These books are available from the Educated Investor bookshop (www.educatedinvestor.com.au) in Melbourne (tell Janene in the shop that Robert Brain sent you, and ask nicely for a 10% discount).
NOTE: This document does NOT contain any advice. Page 2 This entire document is for education only.There are NO recommendations in this document. © August 2009, R.B.Brain – Consulting
Beware the Share Market Bears! They are never far awayBrainy's 10 Key Lessons from the GFC for Investors and Traders
Table of ContentsIntroduction........................................................................................................................4
Your own notes.......................................................................................................................4
Recent history....................................................................................................................5From 1986 to 2009...................................................................................................................5Ups and downs — 1988 to 1998.............................................................................................6Ups and downs — 1993 to 2003.............................................................................................7The big picture — 1986 to 2009..............................................................................................8
Useful principles................................................................................................................9The trend is your friend..........................................................................................................9The stock market does rise over time...................................................................................9
The 10 Key Lessons........................................................................................................10Lesson #1 — Property values — they rise and they fall....................................................10Lesson #2 — Stock market corrections — How often? How long?..................................13Lesson #3 — Bear markets — share markets do fall (a long way)....................................15Lesson #4 — Financial advisors, brokers, bankers...........................................................16Lesson #5 — "Timing" the market? or "Time in" the market?..........................................16Lesson #6 — Your investments and capital-protected schemes — safe?.......................17Lesson #7 — Leveraged investments and derivatives (eg. CFDs)....................................18Lesson #8 — Margin lending — can it be safe?.................................................................18Lesson #9 — Can Blue Chip investments really fall 90% or more?..................................19Lesson #10 — The old "Buy and Hold" strategy is dead!..................................................20
Conclusion? — Is there one?.........................................................................................20Technical analysis (ie. Charting)...................................................................................21
Share price charts.................................................................................................................21Trends and Trend lines.........................................................................................................21The Moving Average (MA)....................................................................................................21Candlesticks..........................................................................................................................21Support and Resistance.......................................................................................................22Technical Analysis — in summary......................................................................................22
Share trading? — Stop! — Before you start!................................................................22Stop loss positions...............................................................................................................22Trading Plans and Strategies...............................................................................................22Money Management..............................................................................................................23Can you cope with the emotion?.........................................................................................23
What to do next?.............................................................................................................23Should I take some action, or no action?...........................................................................23Possible action steps...........................................................................................................24
More information and help.............................................................................................24Bibliography.....................................................................................................................24
NOTE: This document does NOT contain any advice. Page 3 This entire document is for education only.There are NO recommendations in this document. © August 2009, R.B.Brain – Consulting
Beware the Share Market Bears! They are never far awayBrainy's 10 Key Lessons from the GFC for Investors and Traders
IntroductionA lot of people have been suffering from the economic downturn in 2008-2009 — widely known as the Global Financial Crisis (GFC) . Perhaps this is an understatement for some people. And at the time of writing, the downturn and the pain has not yet finished. Perhaps you have been affected by some of the following:
Property values have fallen. Superannuation investments have fallen in value. Unemployment has increased. More retrenchments. Some investments have lost as much as 90% or more of their value. Some investments have been liquidated completely. Inappropriate lending - margin loans, etc. Issues with over-borrowing that has been encouraged by some lenders. Some questionable advice from some experts.
BUT!... a lot of people saw this GFC coming, and a lot of people have lost only a little, or almost nothing at all!! But how did they know? A number of answers are included in this seminar, and in these hand-out notes below.
Your own notesAt various places through these notes there are places where you can make your own notes. Of course, you can make notes anywhere you like on your own copy. That will make it more useful for future reference. But the following lines are a prompt to remind you that this is encouraged.
Your own notes and comments: ....................................................................................................
.....................................................................................................................................................
.....................................................................................................................................................
NOTE: This document does NOT contain any advice. Page 4 This entire document is for education only.There are NO recommendations in this document. © August 2009, R.B.Brain – Consulting
*** CAUTION ***
Investing in the share market (or various derivative markets) can result in loss of funds.
With CFDs it is possible to make large returns for a relatively low injection of cash.
With CFDs it is possible to lose a lot more than your initial deposit. There is no guarantee that any particular trading strategy might work or
not work. Success in the market does rely on an appropriate attitude and
psychology.
Beware the Share Market Bears! They are never far awayBrainy's 10 Key Lessons from the GFC for Investors and Traders
Recent historyLet's take a look at what has happened in share markets in the years leading up until the market peak in October / November of 2007.
[This whole section needs fleshing out with more samples and charts to demonstrate that the share market bears are very close by, including information on the US and European markets.]
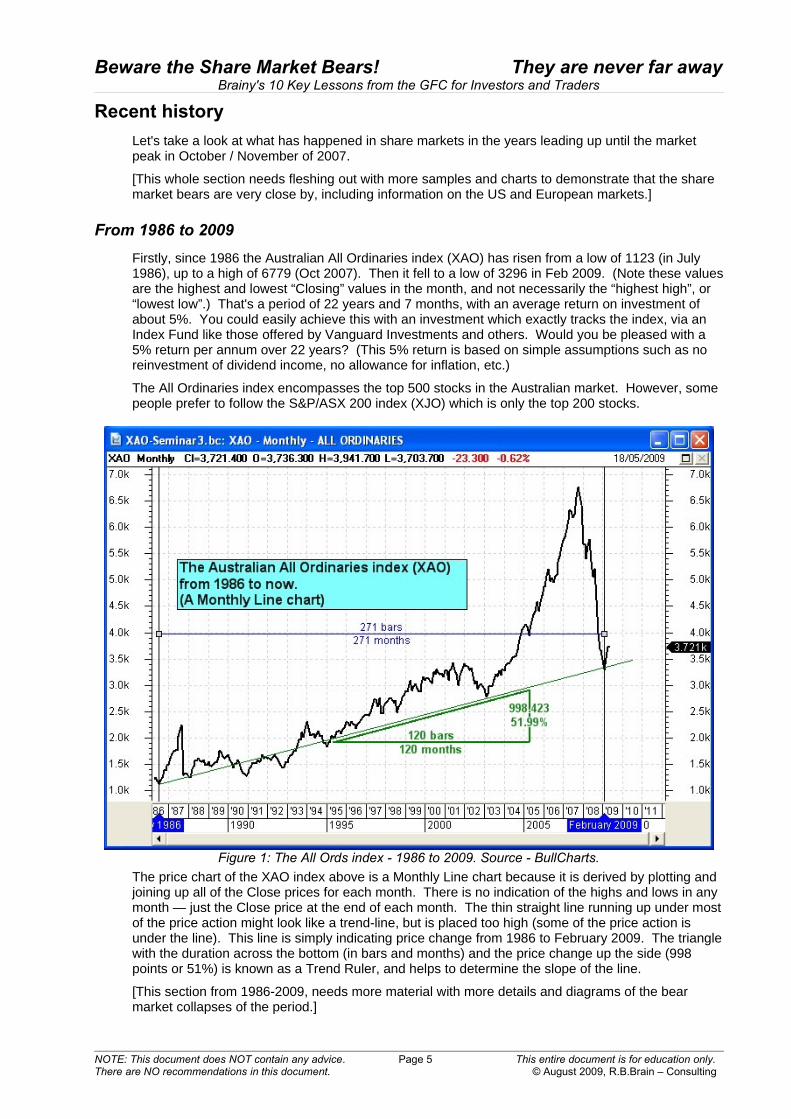
From 1986 to 2009Firstly, since 1986 the Australian All Ordinaries index (XAO) has risen from a low of 1123 (in July 1986), up to a high of 6779 (Oct 2007). Then it fell to a low of 3296 in Feb 2009. (Note these values are the highest and lowest “Closing” values in the month, and not necessarily the “highest high”, or “lowest low”.) That's a period of 22 years and 7 months, with an average return on investment of about 5%. You could easily achieve this with an investment which exactly tracks the index, via an Index Fund like those offered by Vanguard Investments and others. Would you be pleased with a 5% return per annum over 22 years? (This 5% return is based on simple assumptions such as no reinvestment of dividend income, no allowance for inflation, etc.)
The All Ordinaries index encompasses the top 500 stocks in the Australian market. However, some people prefer to follow the S&P/ASX 200 index (XJO) which is only the top 200 stocks.
The price chart of the XAO index above is a Monthly Line chart because it is derived by plotting and joining up all of the Close prices for each month. There is no indication of the highs and lows in any month — just the Close price at the end of each month. The thin straight line running up under most of the price action might look like a trend-line, but is placed too high (some of the price action is under the line). This line is simply indicating price change from 1986 to February 2009. The triangle with the duration across the bottom (in bars and months) and the price change up the side (998 points or 51%) is known as a Trend Ruler, and helps to determine the slope of the line.
[This section from 1986-2009, needs more material with more details and diagrams of the bear market collapses of the period.]
NOTE: This document does NOT contain any advice. Page 5 This entire document is for education only.There are NO recommendations in this document. © August 2009, R.B.Brain – Consulting
Figure 1: The All Ords index - 1986 to 2009. Source - BullCharts.
Beware the Share Market Bears! They are never far awayBrainy's 10 Key Lessons from the GFC for Investors and Traders
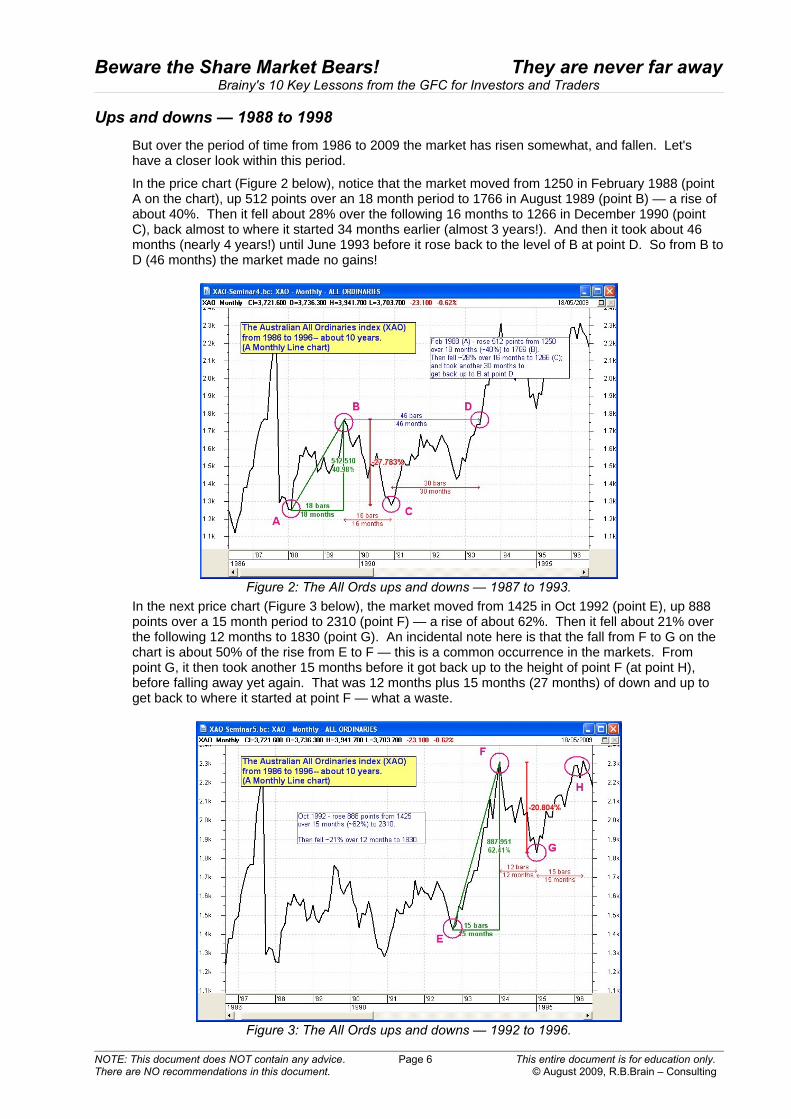
Ups and downs — 1988 to 1998But over the period of time from 1986 to 2009 the market has risen somewhat, and fallen. Let's have a closer look within this period.
In the price chart (Figure 2 below), notice that the market moved from 1250 in February 1988 (point A on the chart), up 512 points over an 18 month period to 1766 in August 1989 (point B) — a rise of about 40%. Then it fell about 28% over the following 16 months to 1266 in December 1990 (point C), back almost to where it started 34 months earlier (almost 3 years!). And then it took about 46 months (nearly 4 years!) until June 1993 before it rose back to the level of B at point D. So from B to D (46 months) the market made no gains!
In the next price chart (Figure 3 below), the market moved from 1425 in Oct 1992 (point E), up 888 points over a 15 month period to 2310 (point F) — a rise of about 62%. Then it fell about 21% over the following 12 months to 1830 (point G). An incidental note here is that the fall from F to G on the chart is about 50% of the rise from E to F — this is a common occurrence in the markets. From point G, it then took another 15 months before it got back up to the height of point F (at point H), before falling away yet again. That was 12 months plus 15 months (27 months) of down and up to get back to where it started at point F — what a waste.
NOTE: This document does NOT contain any advice. Page 6 This entire document is for education only.There are NO recommendations in this document. © August 2009, R.B.Brain – Consulting
Figure 2: The All Ords ups and downs — 1987 to 1993.
Figure 3: The All Ords ups and downs — 1992 to 1996.
Beware the Share Market Bears! They are never far awayBrainy's 10 Key Lessons from the GFC for Investors and Traders
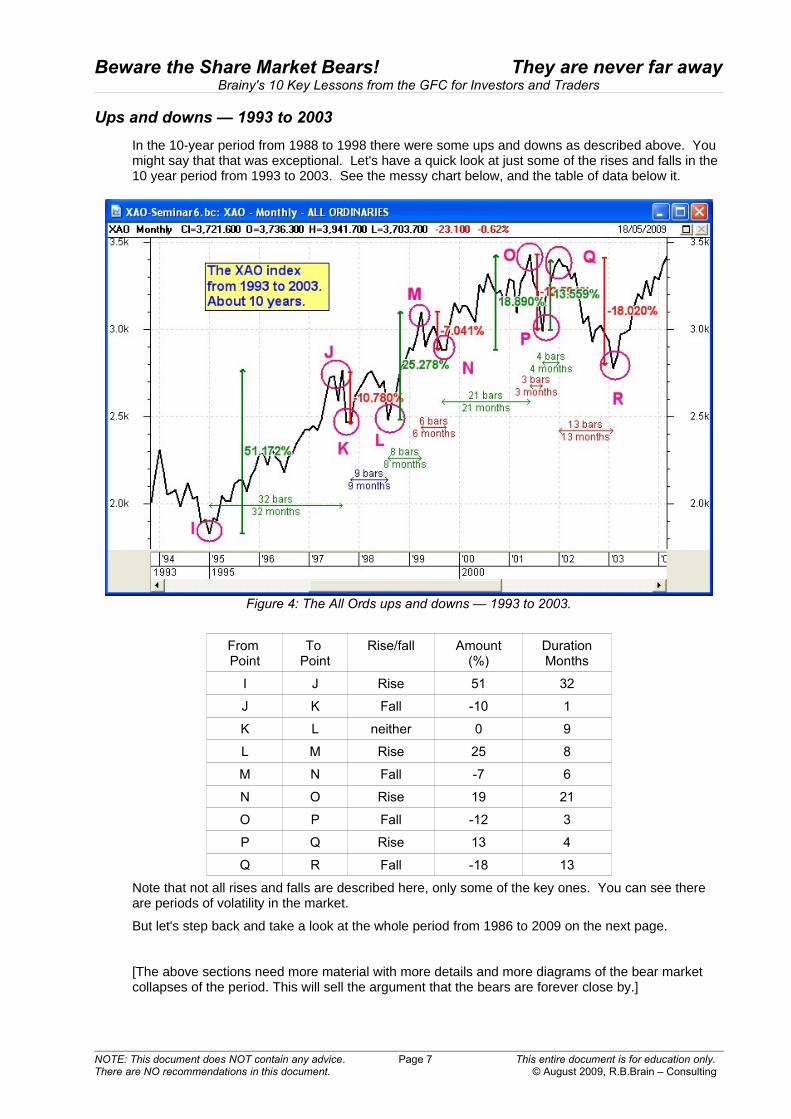
Ups and downs — 1993 to 2003In the 10-year period from 1988 to 1998 there were some ups and downs as described above. You might say that that was exceptional. Let's have a quick look at just some of the rises and falls in the 10 year period from 1993 to 2003. See the messy chart below, and the table of data below it.
From Point
To Point
Rise/fall Amount(%)
DurationMonths
I J Rise 51 32
J K Fall -10 1
K L neither 0 9
L M Rise 25 8
M N Fall -7 6
N O Rise 19 21
O P Fall -12 3
P Q Rise 13 4
Q R Fall -18 13
Note that not all rises and falls are described here, only some of the key ones. You can see there are periods of volatility in the market.
But let's step back and take a look at the whole period from 1986 to 2009 on the next page.
[The above sections need more material with more details and more diagrams of the bear market collapses of the period. This will sell the argument that the bears are forever close by.]
NOTE: This document does NOT contain any advice. Page 7 This entire document is for education only.There are NO recommendations in this document. © August 2009, R.B.Brain – Consulting
Figure 4: The All Ords ups and downs — 1993 to 2003.
Beware the Share Market Bears! They are never far awayBrainy's 10 Key Lessons from the GFC for Investors and Traders
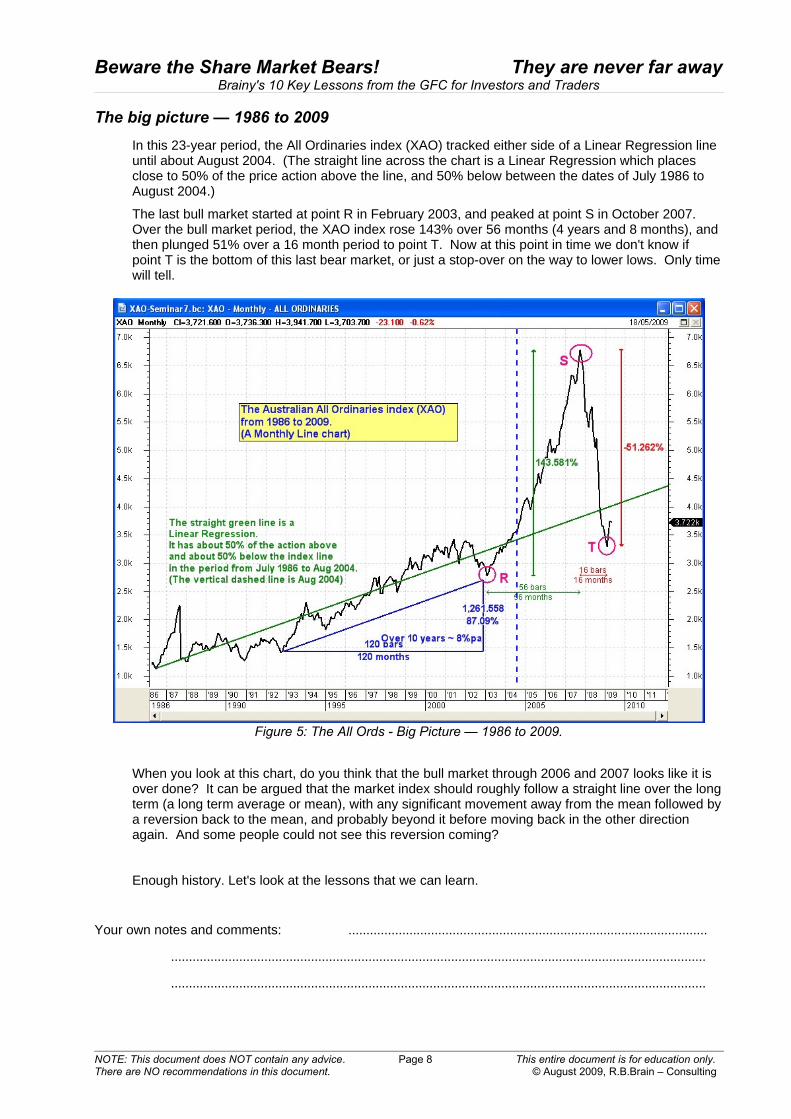
The big picture — 1986 to 2009In this 23-year period, the All Ordinaries index (XAO) tracked either side of a Linear Regression line until about August 2004. (The straight line across the chart is a Linear Regression which places close to 50% of the price action above the line, and 50% below between the dates of July 1986 to August 2004.)
The last bull market started at point R in February 2003, and peaked at point S in October 2007. Over the bull market period, the XAO index rose 143% over 56 months (4 years and 8 months), and then plunged 51% over a 16 month period to point T. Now at this point in time we don't know if point T is the bottom of this last bear market, or just a stop-over on the way to lower lows. Only time will tell.
When you look at this chart, do you think that the bull market through 2006 and 2007 looks like it is over done? It can be argued that the market index should roughly follow a straight line over the long term (a long term average or mean), with any significant movement away from the mean followed by a reversion back to the mean, and probably beyond it before moving back in the other direction again. And some people could not see this reversion coming?
Enough history. Let's look at the lessons that we can learn.
Your own notes and comments: ....................................................................................................
.....................................................................................................................................................
.....................................................................................................................................................
NOTE: This document does NOT contain any advice. Page 8 This entire document is for education only.There are NO recommendations in this document. © August 2009, R.B.Brain – Consulting
Figure 5: The All Ords - Big Picture — 1986 to 2009.
Beware the Share Market Bears! They are never far awayBrainy's 10 Key Lessons from the GFC for Investors and Traders
Useful principlesFirst a couple of very useful principles.
The trend is your friendThis might seem so obvious, but if you want to invest some money in order to make a profit, then it seems to be a good idea to buy shares in a company when the share price is rising. Conversely, why on earth would you buy the shares when the price is falling?
A number of people really stress this. Both Frank Watkins and Stan Weinstein talk at length about this in their respective books.
Frank states the obvious when he says that a company's share price is rising if you look at the share price chart and can see it starting near the bottom left hand corner, and finishing near the top right hand corner. It is often this easy, but not always.
Stan suggests one way to identify a trend is to look at the share price chart, and place a Moving Average (MA) curve on the chart. If the share price is below the MA, then don't buy it. If it is above the MA, then it is a candidate for purchase. He suggests a 30-week MA for long-term investors, and a 10-week MA for traders.
The stock market does rise over timeIt is true that the stock market does rise over time (well, it has so far). You can see this from some of the charts herein.
Is is often said that the market does rise around about 12% over the very very long term. But after you factor in inflation, and that the buying power of your money diminishes over time, the actual return is somewhat less than 12%.
Some people notice that the share market can rise significantly over relatively short periods, before falling to a degree. Some people think they can make money on these rallies, and sell before the fall. This is true, but many people come unstuck — either they just get it wrong, or their emotion takes over and leads to bad decisions. And often greed takes over, also leading to bad decisions.
Re: the Vanguard chart in the slides, the interactive charting tool is available on line here:http://www.vanguard.com.au/personal_investors/knowledge-centre/indexing/interactive-index-chart.cfm
Your own notes and comments: ....................................................................................................
.....................................................................................................................................................
.....................................................................................................................................................
NOTE: This document does NOT contain any advice. Page 9 This entire document is for education only.There are NO recommendations in this document. © August 2009, R.B.Brain – Consulting
Beware the Share Market Bears! They are never far awayBrainy's 10 Key Lessons from the GFC for Investors and Traders
The 10 Key LessonsHere is a brief summary of "The 10 Key Lessons from the Global Financial Crisis", or the real reasons why we should “Beware the Share Market Bears!”:
1. Property values - they rise and they fall.
2. Stock market corrections - How often? How long?
3. Bear markets — share markets do fall (a long way)
4. Financial advisors, brokers, bankers
5. "Timing" the market? or "Time in" the market?
6. Your investments and capital-protected schemes — safe?
7. Leveraged investments and derivatives (eg. CFDs)
8. Margin lending — can it be safe?
9. Can investments really fall 90% or more?
10. The old "Buy and Hold" strategy is dead!
These ten lessons are explained in more details in the following pages.
Lesson #1 — Property values — they rise and they fallProperty values rise and fall in varying amounts. They seem to rise over a long period, and then occasionally they fall. Some properties fluctuate in price more than others. Some properties seem to never fall in price.
In Australia in the latest GFC, property prices at the lower end, and perhaps the middle of the market have not shown much change; but many high end properties (eg. multi-million dollar) have experienced falls of 20% to 30% in value. A number of these sales have been forced due to the mortgagees suffering financial problems with investments, and with fewer buyers willing to pay such high prices.
In general, across the country and around the world, average property prices will probably fall every decade or two — following the major real estate cycle (more details coming below).
Some people have extensively studied the real estate cycles globally, and have concluded that real estate pricing runs in cycles of some where between 17 and 21 years, with about 18 years being the average.
Phil Anderson of Economic Indicator Services (at http://www.businesscycles.biz/) has extensively studied these cycles and their impacts for the period dating from 1800.
Based on material like this, as well as other earlier researchers and authors, there is a lot of evidence to support the theory of real estate cycles. Phil has put together the details of the 24 hour Real Estate Cycle Clock, as well as a lot of other evidence, in his 2008 book "The Secret Life of Real Estate". A very brief summary of this is presented here. More details can be found in Phil's book.
First, some high level observations over the years:
The Savings and Loan debacle — One recent bull market ended with a crash in October 1987. Within the next two years the US underwent the biggest bailout of banks and banking institutions generally in the so-called Savings and Loan (S&L) scandal of the 1980s. This marked the end of one real estate cycle, and the pending beginning of another. (See Phil's book for more details.)
The CDO debacle — the packaging up of sub-prime mortgages (and other debts) into a package of products to on-sell to someone else for a seemingly good return. As it turned out, these products contained a lot of what we now call “toxic debt”. This came to a head near the end of the bull market in 2003-7, with a crash in 2009-10.
These events have basically been clever use of government regulations of-the-day, in order to make money (albeit in a creative way). And the instigators usually make lots of money in these situations, and they tend to leave someone else to pick up the pieces while the government introduces more regulations to prevent a repeat. So, at some stage in the future when money is freely available
NOTE: This document does NOT contain any advice. Page 10 This entire document is for education only.There are NO recommendations in this document. © August 2009, R.B.Brain – Consulting
Beware the Share Market Bears! They are never far awayBrainy's 10 Key Lessons from the GFC for Investors and Traders
again, more creative people come along and dream up another way to separate innocent investors from their money.
The 10-year Investment Cycle
The first thing to understand is that economies, and markets, move in cycles. But each cycle is not the same as the previous one. As we go around the cycle, some asset classes perform better than others, or a little different to the last cycle.
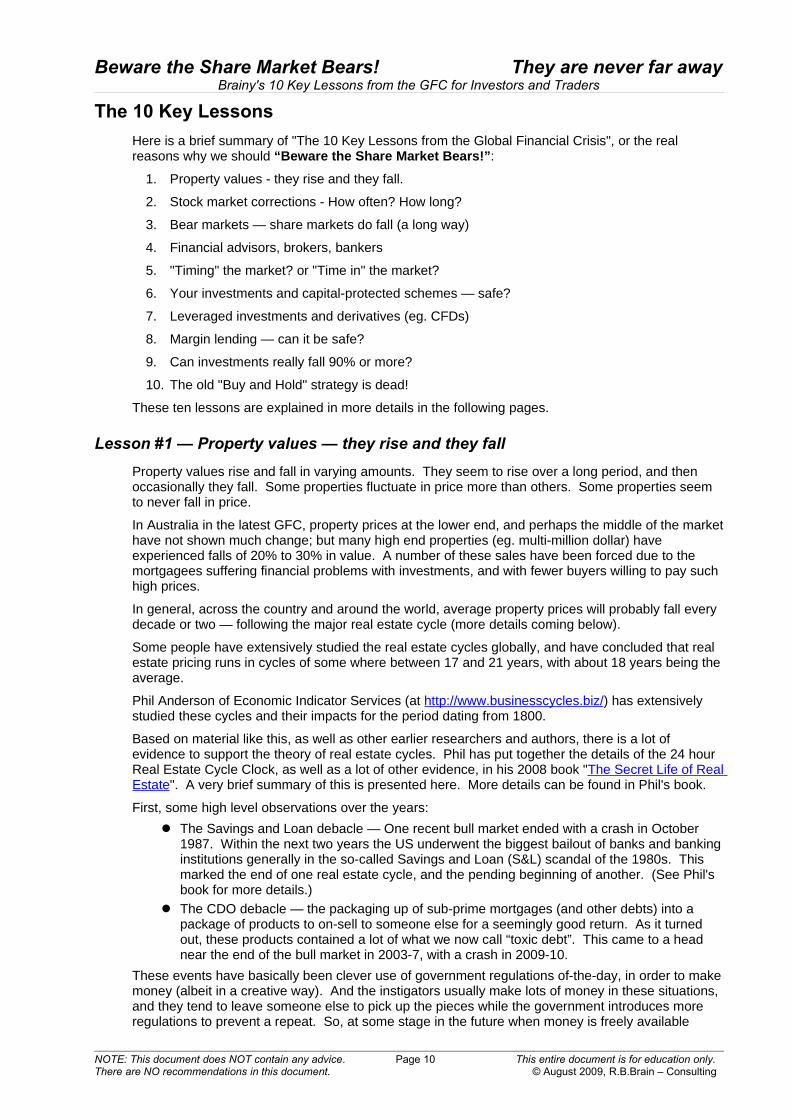
In spite of this, the cyclical nature of these events is remarkably similar, and the investment cycle can be broadly summarised in the following analogy to a clock.
The Investment Clock depicted here was first espoused by the London Evening Standard newspaper in 1937. The basis behind it is that each economic condition that appears on the clock tends to be impacted upon by the preceding economic condition. They tend to flow from one to the next around the clock.
Each complete cycle runs for somewhere between about 8 and 11 years (hence it is sometimes referred to as the “10-year cycle”). In general, progress around the clock comprises a relatively quick fall from about 12:30 to 6:30 (roughly between 2 to 5 years), and a relatively long time to rise from 6:30 to 12:30 (roughly between 5 to 8 years).
Basically, as we move around the clock, easy money (11 o'clock) results in borrowed monies being used to fund all sorts of things, including property. As the economy overheats, interest rates are raised to try to cool it down (1 o'clock). The share market starts to fall (2 o'clock). Money has been flowing out of the share market and into property. Demand falls, resulting in lower factory production and less demand for commodities (3 o'clock). Both shares and property tend to look bad, and money flows into fixed interest. Everyone starts hoarding their money, spending decreases, less consumption, less production, more unemployment, creates a vicious circle and we head towards recession. Real estate values fall (6 o'clock). And we reach the bottom of the cycle.
When everyone who is going to be retrenched has been, the employed people start to relax a bit. The falling interest rates encourage people to start buying again. They buy the things that they had put off buying when they thought they were going to lose their jobs (things like cars and various luxury items). More consumption slowly leads to greater production which slowly leads to greater employment, which slowly leads to greater consumption which leads to greater production to meet demand. Share prices start rising again (8 o'clock), and commodity prices follow (9 o'clock). Eventually money becomes easier again (11 o'clock), setting us up for another downward leg — and the cycle continues.
NOTE: This document does NOT contain any advice. Page 11 This entire document is for education only.There are NO recommendations in this document. © August 2009, R.B.Brain – Consulting
Figure 6: The 12-hour (10-year) Investment Clock. Source - www.businesscycles.biz
Beware the Share Market Bears! They are never far awayBrainy's 10 Key Lessons from the GFC for Investors and Traders
What is this 18-year property cycle?
Firstly, we need to understand that this 18-year property cycle is only evident in those countries where land property is permitted to be privately owned.
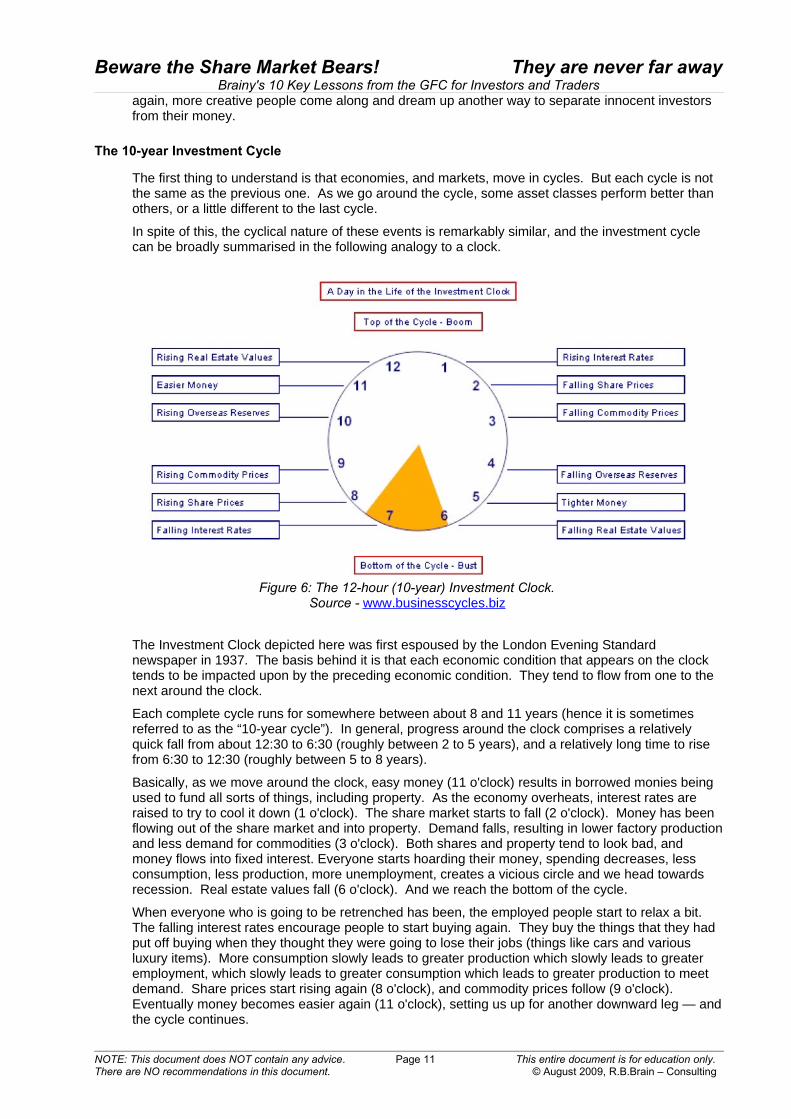
In Phil Anderson's book1 he starts out with an explanation of where and when this 18-year property cycle started — in the USA in May 1800, with the initial sell off of real estate. Phil has extensively studied property values/prices, and written a lot of his findings into his book. The chart below in Figure 7 is reproduced from his book and as a picture it tells a thousand words.
In the chart below, note that property prices cycled through peaks and troughs, with roughly 18 years between each peak.
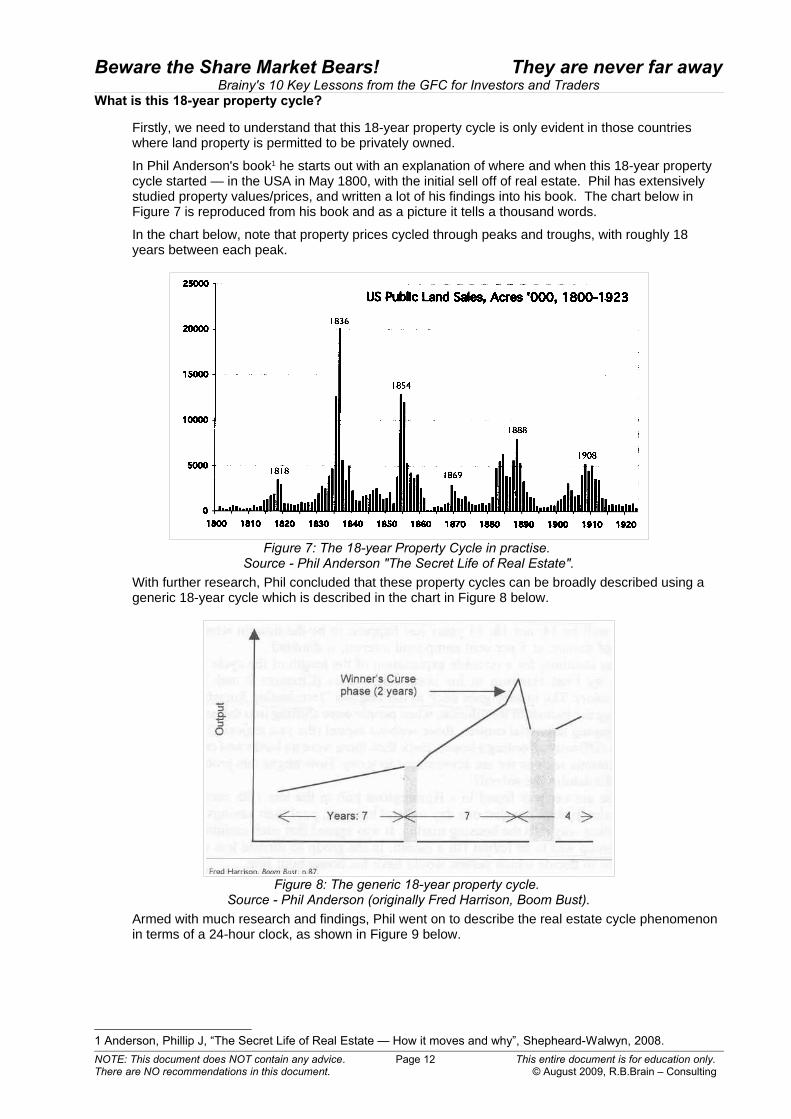
With further research, Phil concluded that these property cycles can be broadly described using a generic 18-year cycle which is described in the chart in Figure 8 below.
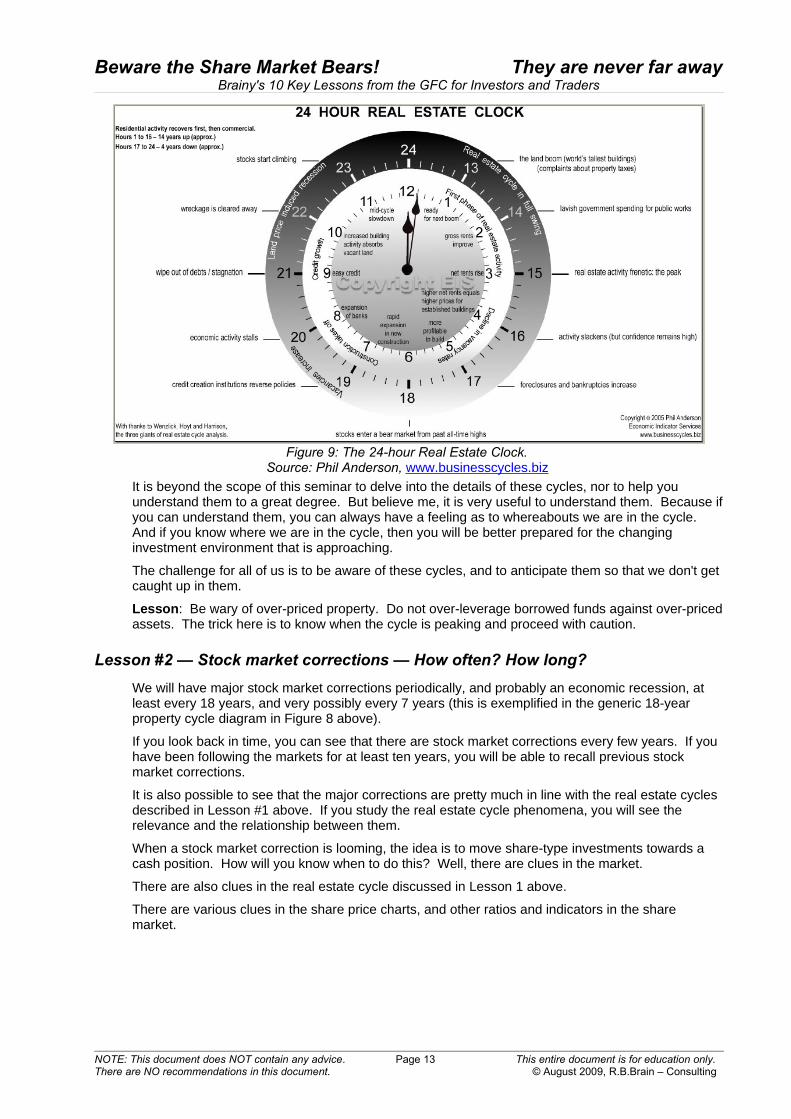
Armed with much research and findings, Phil went on to describe the real estate cycle phenomenon in terms of a 24-hour clock, as shown in Figure 9 below.
1 Anderson, Phillip J, “The Secret Life of Real Estate — How it moves and why”, Shepheard-Walwyn, 2008.NOTE: This document does NOT contain any advice. Page 12 This entire document is for education only.There are NO recommendations in this document. © August 2009, R.B.Brain – Consulting
Figure 7: The 18-year Property Cycle in practise. Source - Phil Anderson "The Secret Life of Real Estate".
Figure 8: The generic 18-year property cycle. Source - Phil Anderson (originally Fred Harrison, Boom Bust).
Beware the Share Market Bears! They are never far awayBrainy's 10 Key Lessons from the GFC for Investors and Traders
It is beyond the scope of this seminar to delve into the details of these cycles, nor to help you understand them to a great degree. But believe me, it is very useful to understand them. Because if you can understand them, you can always have a feeling as to whereabouts we are in the cycle. And if you know where we are in the cycle, then you will be better prepared for the changing investment environment that is approaching.
The challenge for all of us is to be aware of these cycles, and to anticipate them so that we don't get caught up in them.
Lesson: Be wary of over-priced property. Do not over-leverage borrowed funds against over-priced assets. The trick here is to know when the cycle is peaking and proceed with caution.
Lesson #2 — Stock market corrections — How often? How long?We will have major stock market corrections periodically, and probably an economic recession, at least every 18 years, and very possibly every 7 years (this is exemplified in the generic 18-year property cycle diagram in Figure 8 above).
If you look back in time, you can see that there are stock market corrections every few years. If you have been following the markets for at least ten years, you will be able to recall previous stock market corrections.
It is also possible to see that the major corrections are pretty much in line with the real estate cycles described in Lesson #1 above. If you study the real estate cycle phenomena, you will see the relevance and the relationship between them.
When a stock market correction is looming, the idea is to move share-type investments towards a cash position. How will you know when to do this? Well, there are clues in the market.
There are also clues in the real estate cycle discussed in Lesson 1 above.
There are various clues in the share price charts, and other ratios and indicators in the share market.
NOTE: This document does NOT contain any advice. Page 13 This entire document is for education only.There are NO recommendations in this document. © August 2009, R.B.Brain – Consulting
Figure 9: The 24-hour Real Estate Clock. Source: Phil Anderson, www.businesscycles.biz
Beware the Share Market Bears! They are never far awayBrainy's 10 Key Lessons from the GFC for Investors and Traders
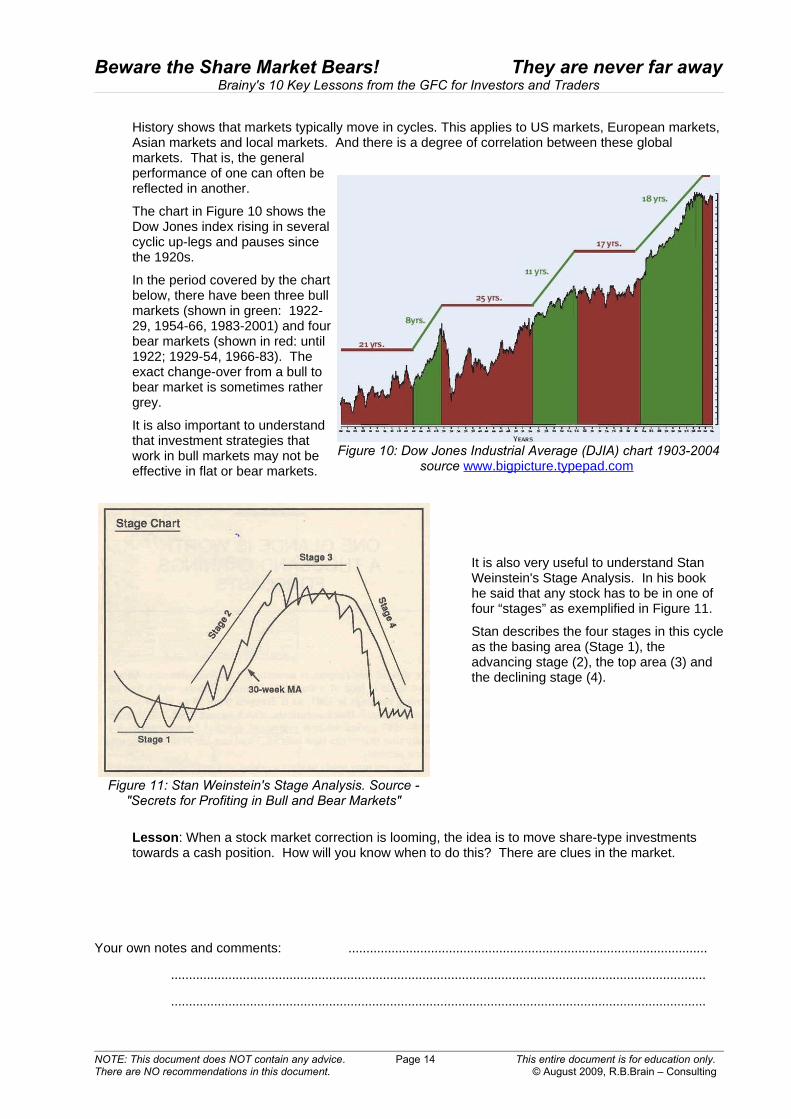
History shows that markets typically move in cycles. This applies to US markets, European markets, Asian markets and local markets. And there is a degree of correlation between these global markets. That is, the general performance of one can often be reflected in another.
The chart in Figure 10 shows the Dow Jones index rising in several cyclic up-legs and pauses since the 1920s.
In the period covered by the chart below, there have been three bull markets (shown in green: 1922-29, 1954-66, 1983-2001) and four bear markets (shown in red: until 1922; 1929-54, 1966-83). The exact change-over from a bull to bear market is sometimes rather grey.
It is also important to understand that investment strategies that work in bull markets may not be effective in flat or bear markets.
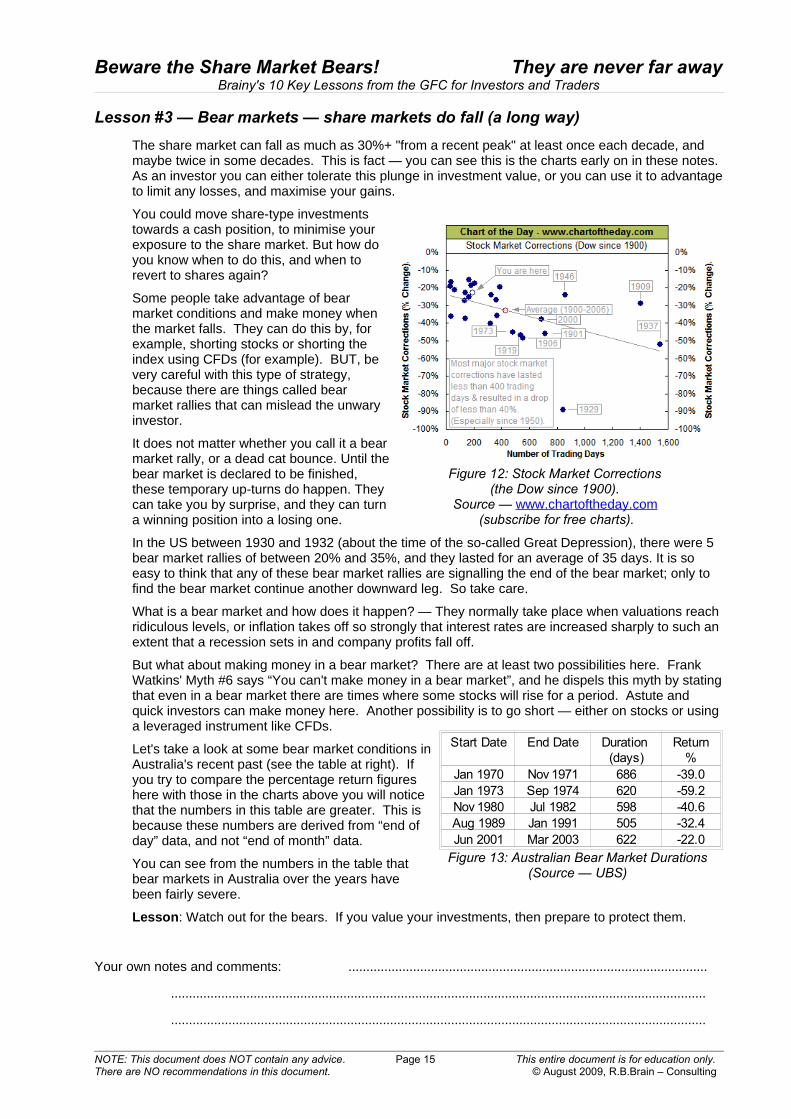
It is also very useful to understand Stan Weinstein's Stage Analysis. In his book he said that any stock has to be in one of four “stages” as exemplified in Figure 11.
Stan describes the four stages in this cycle as the basing area (Stage 1), the advancing stage (2), the top area (3) and the declining stage (4).
Lesson: When a stock market correction is looming, the idea is to move share-type investments towards a cash position. How will you know when to do this? There are clues in the market.
Your own notes and comments: ....................................................................................................
.....................................................................................................................................................
.....................................................................................................................................................
NOTE: This document does NOT contain any advice. Page 14 This entire document is for education only.There are NO recommendations in this document. © August 2009, R.B.Brain – Consulting
Figure 10: Dow Jones Industrial Average (DJIA) chart 1903-2004source www.bigpicture.typepad.com
Figure 11: Stan Weinstein's Stage Analysis. Source - "Secrets for Profiting in Bull and Bear Markets"
Beware the Share Market Bears! They are never far awayBrainy's 10 Key Lessons from the GFC for Investors and Traders
Lesson #3 — Bear markets — share markets do fall (a long way)The share market can fall as much as 30%+ "from a recent peak" at least once each decade, and maybe twice in some decades. This is fact — you can see this is the charts early on in these notes. As an investor you can either tolerate this plunge in investment value, or you can use it to advantage to limit any losses, and maximise your gains.
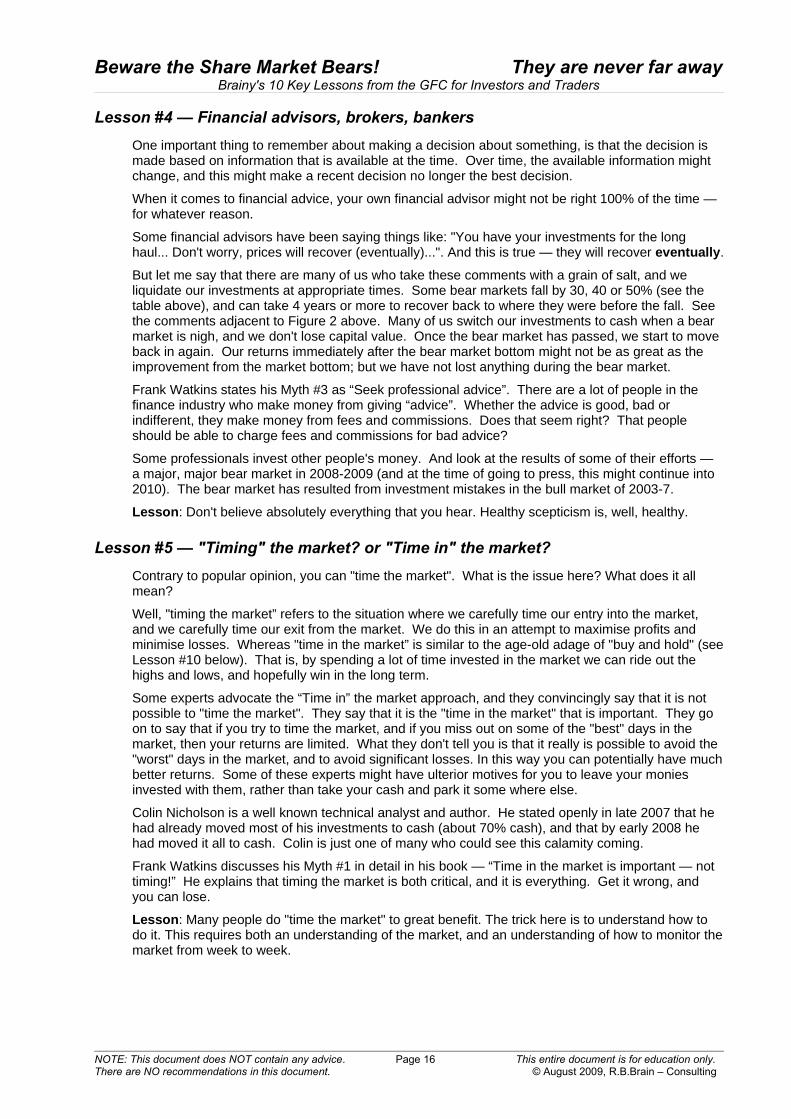
You could move share-type investments towards a cash position, to minimise your exposure to the share market. But how do you know when to do this, and when to revert to shares again?
Some people take advantage of bear market conditions and make money when the market falls. They can do this by, for example, shorting stocks or shorting the index using CFDs (for example). BUT, be very careful with this type of strategy, because there are things called bear market rallies that can mislead the unwary investor.
It does not matter whether you call it a bear market rally, or a dead cat bounce. Until the bear market is declared to be finished, these temporary up-turns do happen. They can take you by surprise, and they can turn a winning position into a losing one.
In the US between 1930 and 1932 (about the time of the so-called Great Depression), there were 5 bear market rallies of between 20% and 35%, and they lasted for an average of 35 days. It is so easy to think that any of these bear market rallies are signalling the end of the bear market; only to find the bear market continue another downward leg. So take care.
What is a bear market and how does it happen? — They normally take place when valuations reach ridiculous levels, or inflation takes off so strongly that interest rates are increased sharply to such an extent that a recession sets in and company profits fall off.
But what about making money in a bear market? There are at least two possibilities here. Frank Watkins' Myth #6 says “You can't make money in a bear market”, and he dispels this myth by stating that even in a bear market there are times where some stocks will rise for a period. Astute and quick investors can make money here. Another possibility is to go short — either on stocks or using a leveraged instrument like CFDs.
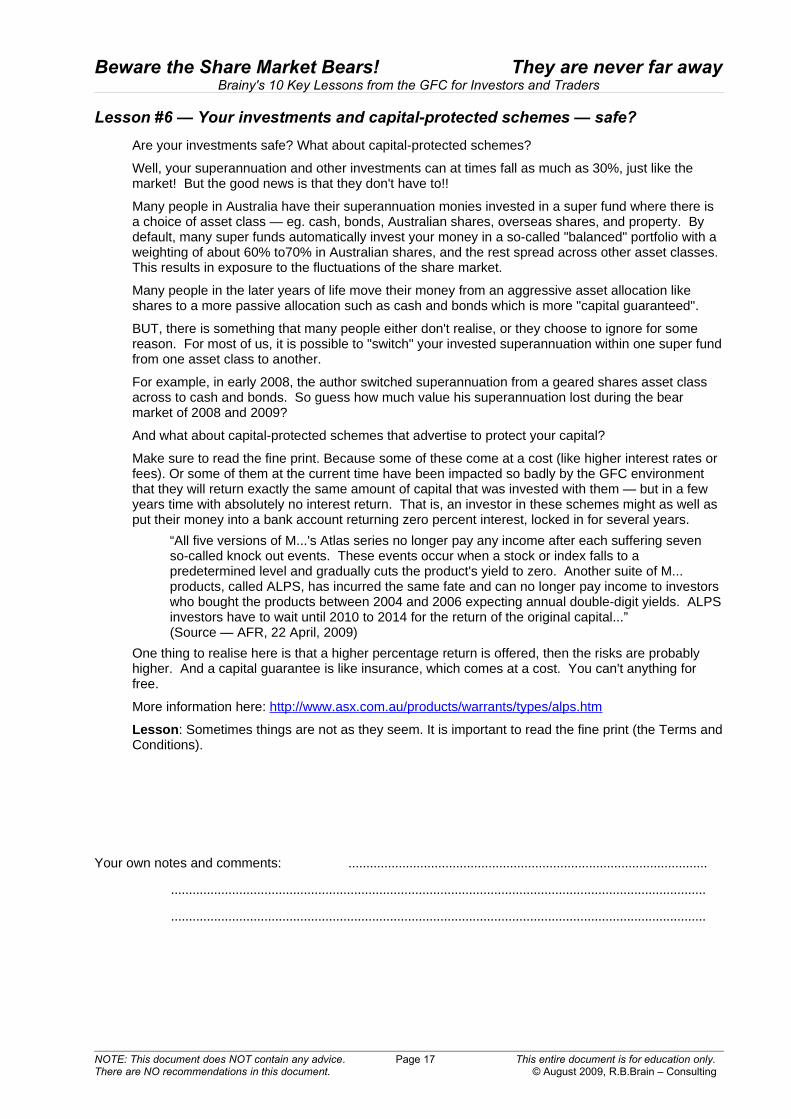
Let's take a look at some bear market conditions in Australia's recent past (see the table at right). If you try to compare the percentage return figures here with those in the charts above you will notice that the numbers in this table are greater. This is because these numbers are derived from “end of day” data, and not “end of month” data.
You can see from the numbers in the table that bear markets in Australia over the years have been fairly severe.
Lesson: Watch out for the bears. If you value your investments, then prepare to protect them.
Your own notes and comments: ....................................................................................................
.....................................................................................................................................................
.....................................................................................................................................................
NOTE: This document does NOT contain any advice. Page 15 This entire document is for education only.There are NO recommendations in this document. © August 2009, R.B.Brain – Consulting
Figure 12: Stock Market Corrections (the Dow since 1900).
Source — www.chartoftheday.com (subscribe for free charts).
Figure 13: Australian Bear Market Durations (Source — UBS)
Start Date End Date
Jan 1970 Nov 1971 686 -39.0Jan 1973 Sep 1974 620 -59.2Nov 1980 Jul 1982 598 -40.6Aug 1989 Jan 1991 505 -32.4Jun 2001 Mar 2003 622 -22.0
Duration (days)
Return%
Beware the Share Market Bears! They are never far awayBrainy's 10 Key Lessons from the GFC for Investors and Traders
Lesson #4 — Financial advisors, brokers, bankersOne important thing to remember about making a decision about something, is that the decision is made based on information that is available at the time. Over time, the available information might change, and this might make a recent decision no longer the best decision.
When it comes to financial advice, your own financial advisor might not be right 100% of the time — for whatever reason.
Some financial advisors have been saying things like: "You have your investments for the long haul... Don't worry, prices will recover (eventually)...". And this is true — they will recover eventually.
But let me say that there are many of us who take these comments with a grain of salt, and we liquidate our investments at appropriate times. Some bear markets fall by 30, 40 or 50% (see the table above), and can take 4 years or more to recover back to where they were before the fall. See the comments adjacent to Figure 2 above. Many of us switch our investments to cash when a bear market is nigh, and we don't lose capital value. Once the bear market has passed, we start to move back in again. Our returns immediately after the bear market bottom might not be as great as the improvement from the market bottom; but we have not lost anything during the bear market.
Frank Watkins states his Myth #3 as “Seek professional advice”. There are a lot of people in the finance industry who make money from giving “advice”. Whether the advice is good, bad or indifferent, they make money from fees and commissions. Does that seem right? That people should be able to charge fees and commissions for bad advice?
Some professionals invest other people's money. And look at the results of some of their efforts — a major, major bear market in 2008-2009 (and at the time of going to press, this might continue into 2010). The bear market has resulted from investment mistakes in the bull market of 2003-7.
Lesson: Don't believe absolutely everything that you hear. Healthy scepticism is, well, healthy.
Lesson #5 — "Timing" the market? or "Time in" the market?Contrary to popular opinion, you can "time the market". What is the issue here? What does it all mean?
Well, "timing the market” refers to the situation where we carefully time our entry into the market, and we carefully time our exit from the market. We do this in an attempt to maximise profits and minimise losses. Whereas "time in the market” is similar to the age-old adage of "buy and hold" (see Lesson #10 below). That is, by spending a lot of time invested in the market we can ride out the highs and lows, and hopefully win in the long term.
Some experts advocate the “Time in” the market approach, and they convincingly say that it is not possible to "time the market". They say that it is the "time in the market" that is important. They go on to say that if you try to time the market, and if you miss out on some of the "best" days in the market, then your returns are limited. What they don't tell you is that it really is possible to avoid the "worst" days in the market, and to avoid significant losses. In this way you can potentially have much better returns. Some of these experts might have ulterior motives for you to leave your monies invested with them, rather than take your cash and park it some where else.
Colin Nicholson is a well known technical analyst and author. He stated openly in late 2007 that he had already moved most of his investments to cash (about 70% cash), and that by early 2008 he had moved it all to cash. Colin is just one of many who could see this calamity coming.
Frank Watkins discusses his Myth #1 in detail in his book — “Time in the market is important — not timing!” He explains that timing the market is both critical, and it is everything. Get it wrong, and you can lose.
Lesson: Many people do "time the market" to great benefit. The trick here is to understand how to do it. This requires both an understanding of the market, and an understanding of how to monitor the market from week to week.
NOTE: This document does NOT contain any advice. Page 16 This entire document is for education only.There are NO recommendations in this document. © August 2009, R.B.Brain – Consulting
Beware the Share Market Bears! They are never far awayBrainy's 10 Key Lessons from the GFC for Investors and Traders
Lesson #6 — Your investments and capital-protected schemes — safe?Are your investments safe? What about capital-protected schemes?
Well, your superannuation and other investments can at times fall as much as 30%, just like the market! But the good news is that they don't have to!!
Many people in Australia have their superannuation monies invested in a super fund where there is a choice of asset class — eg. cash, bonds, Australian shares, overseas shares, and property. By default, many super funds automatically invest your money in a so-called "balanced" portfolio with a weighting of about 60% to70% in Australian shares, and the rest spread across other asset classes. This results in exposure to the fluctuations of the share market.
Many people in the later years of life move their money from an aggressive asset allocation like shares to a more passive allocation such as cash and bonds which is more "capital guaranteed".
BUT, there is something that many people either don't realise, or they choose to ignore for some reason. For most of us, it is possible to "switch" your invested superannuation within one super fund from one asset class to another.
For example, in early 2008, the author switched superannuation from a geared shares asset class across to cash and bonds. So guess how much value his superannuation lost during the bear market of 2008 and 2009?
And what about capital-protected schemes that advertise to protect your capital?
Make sure to read the fine print. Because some of these come at a cost (like higher interest rates or fees). Or some of them at the current time have been impacted so badly by the GFC environment that they will return exactly the same amount of capital that was invested with them — but in a few years time with absolutely no interest return. That is, an investor in these schemes might as well as put their money into a bank account returning zero percent interest, locked in for several years.
“All five versions of M...'s Atlas series no longer pay any income after each suffering seven so-called knock out events. These events occur when a stock or index falls to a predetermined level and gradually cuts the product's yield to zero. Another suite of M... products, called ALPS, has incurred the same fate and can no longer pay income to investors who bought the products between 2004 and 2006 expecting annual double-digit yields. ALPS investors have to wait until 2010 to 2014 for the return of the original capital...” (Source — AFR, 22 April, 2009)
One thing to realise here is that a higher percentage return is offered, then the risks are probably higher. And a capital guarantee is like insurance, which comes at a cost. You can't anything for free.
More information here: http://www.asx.com.au/products/warrants/types/alps.htm
Lesson: Sometimes things are not as they seem. It is important to read the fine print (the Terms and Conditions).
Your own notes and comments: ....................................................................................................
.....................................................................................................................................................
.....................................................................................................................................................
NOTE: This document does NOT contain any advice. Page 17 This entire document is for education only.There are NO recommendations in this document. © August 2009, R.B.Brain – Consulting
Beware the Share Market Bears! They are never far awayBrainy's 10 Key Lessons from the GFC for Investors and Traders
Lesson #7 — Leveraged investments and derivatives (eg. CFDs)Leveraged investments and derivatives can be safe under certain conditions. Many people invest in a variety of financial instruments (eg. CFDs, options, warrants, currencies). If there is not enough care taken with these, they can be disastrous. Losses can be magnified — in fact hugely magnified! It is possible to lose a lot, lot more than you started with.
When you buy shares in a company, the maximum amount of money that you can lose if it all goes sour is the total amount of money that you invested. However, with leveraged instruments like CFDs, or true margin loans, you are only putting up a fraction of the total value of the item you are buying. If things go bad, then you can lose all of the money that you invested (which is only a fraction of the investments original value), PLUS you could owe a lot of extra money up to the total real value of the investment. Unfortunately, many people have learnt this the hard way in the latest financial crisis.
BUT, under the right circumstances, each of these investment methods can potentially be safe — that is under the right circumstances! But this is not guaranteed, and it can be hard work.
You need to understand the investment product you are using, and tread very carefully. You need to take appropriate precautions to help prevent losses.
Lesson: If you don't understand the rules of the game, then don't play the game.
Lesson #8 — Margin lending — can it be safe?Margin lending can be safe over the long term under some circumstances.
Some people take out a margin loan, and borrow funds to the max so that they can highly leverage their available capital. Some people use the borrowed funds to buy an investment (like shares) for the long term. And then they park the investment and forget about it. And they might pre-pay a year's worth of interest expense to gain a tax advantage.
But, if the value of the shares they are holding starts to drop in value, then warning bells should be ringing to take some evasive action. If no remedial action is taken, then a calamity might be hiding just around the corner.
During the bull market of 2003-7 there were many company directors who borrowed money to buy shares in their own company. This can be a good indication of the faith of the director in their own business. But many of these directors borrowed very heavily to buy their shares. Many of them used margin lending facilities that were very heavily geared. That is, they might have put up something like $100,000 of their own funds to borrow perhaps $300,000 of someone else's funds (their margin lender). These figures result in an LVR (Loan to Valuation Ratio) of 75% — that is, they are being lent %75 of the total value of the shares that they are buying. In some cases the LVR reached upwards of 90%. When the market came off in late 2007 and early 2008, and share prices started falling, there were some “investors” (eg. traders, or various fund managers) who started to short-sell the stock. This resulted in the LVR on these margin loans rising towards 100% and beyond resulting in margin calls. This necessitated the selling of many shares in many companies which drove the share price down further and further.
ABC Learning Centres (ABS) was an early victim of this scenario in 2008. Allco Finance Group (AFG) was another, and there were many more.
If you are using a margin loan, also of the LVR (Loan to Valuation Ratio) value at all times (it can be recalculated daily by the lender). If you are borrowing more than about 50% of the total value of the portfolio, then you are potentially skating on thin ice. A value up to about 70% is getting dangerous and would need close attention and active management. A higher value is very dangerous.
Lesson: Using a margin loan to buy and park shares might work in a bull market — with the right precautions. But beware the end of the bull market.
Your own notes and comments: ....................................................................................................
.....................................................................................................................................................
.....................................................................................................................................................
NOTE: This document does NOT contain any advice. Page 18 This entire document is for education only.There are NO recommendations in this document. © August 2009, R.B.Brain – Consulting
Beware the Share Market Bears! They are never far awayBrainy's 10 Key Lessons from the GFC for Investors and Traders
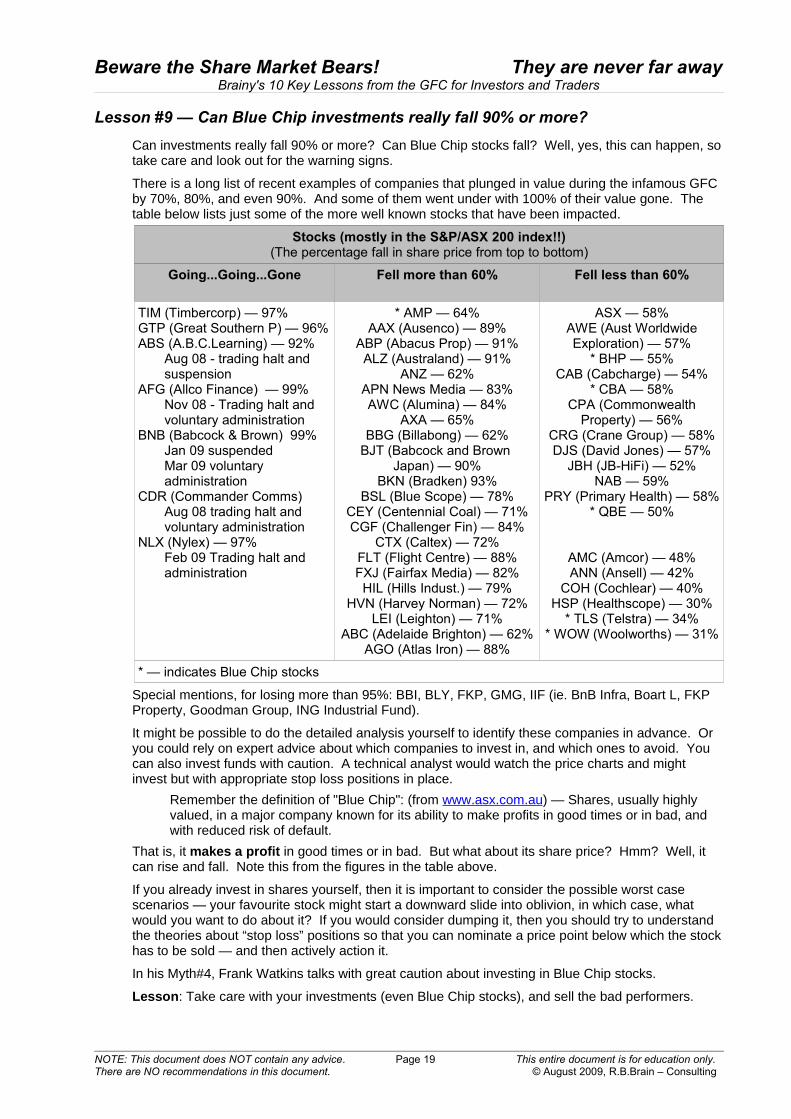
Lesson #9 — Can Blue Chip investments really fall 90% or more?Can investments really fall 90% or more? Can Blue Chip stocks fall? Well, yes, this can happen, so take care and look out for the warning signs.
There is a long list of recent examples of companies that plunged in value during the infamous GFC by 70%, 80%, and even 90%. And some of them went under with 100% of their value gone. The table below lists just some of the more well known stocks that have been impacted.
Stocks (mostly in the S&P/ASX 200 index!!)(The percentage fall in share price from top to bottom)
Going...Going...Gone Fell more than 60% Fell less than 60%
TIM (Timbercorp) — 97%GTP (Great Southern P) — 96%ABS (A.B.C.Learning) — 92%
Aug 08 - trading halt and suspension
AFG (Allco Finance) — 99%Nov 08 - Trading halt and voluntary administration
BNB (Babcock & Brown) 99%Jan 09 suspended Mar 09 voluntary administration
CDR (Commander Comms) Aug 08 trading halt and voluntary administration
NLX (Nylex) — 97%Feb 09 Trading halt and administration
* AMP — 64%AAX (Ausenco) — 89%
ABP (Abacus Prop) — 91%ALZ (Australand) — 91%
ANZ — 62%APN News Media — 83%AWC (Alumina) — 84%
AXA — 65%BBG (Billabong) — 62%
BJT (Babcock and Brown Japan) — 90%
BKN (Bradken) 93%BSL (Blue Scope) — 78%
CEY (Centennial Coal) — 71%CGF (Challenger Fin) — 84%
CTX (Caltex) — 72%FLT (Flight Centre) — 88%FXJ (Fairfax Media) — 82%HIL (Hills Indust.) — 79%
HVN (Harvey Norman) — 72%LEI (Leighton) — 71%
ABC (Adelaide Brighton) — 62%AGO (Atlas Iron) — 88%
ASX — 58%AWE (Aust Worldwide Exploration) — 57%
* BHP — 55%CAB (Cabcharge) — 54%
* CBA — 58%CPA (Commonwealth
Property) — 56%CRG (Crane Group) — 58%DJS (David Jones) — 57%
JBH (JB-HiFi) — 52%NAB — 59%
PRY (Primary Health) — 58%* QBE — 50%
AMC (Amcor) — 48%ANN (Ansell) — 42%
COH (Cochlear) — 40%HSP (Healthscope) — 30%
* TLS (Telstra) — 34%* WOW (Woolworths) — 31%
* — indicates Blue Chip stocks
Special mentions, for losing more than 95%: BBI, BLY, FKP, GMG, IIF (ie. BnB Infra, Boart L, FKP Property, Goodman Group, ING Industrial Fund).
It might be possible to do the detailed analysis yourself to identify these companies in advance. Or you could rely on expert advice about which companies to invest in, and which ones to avoid. You can also invest funds with caution. A technical analyst would watch the price charts and might invest but with appropriate stop loss positions in place.
Remember the definition of "Blue Chip": (from www.asx.com.au) — Shares, usually highly valued, in a major company known for its ability to make profits in good times or in bad, and with reduced risk of default.
That is, it makes a profit in good times or in bad. But what about its share price? Hmm? Well, it can rise and fall. Note this from the figures in the table above.
If you already invest in shares yourself, then it is important to consider the possible worst case scenarios — your favourite stock might start a downward slide into oblivion, in which case, what would you want to do about it? If you would consider dumping it, then you should try to understand the theories about “stop loss” positions so that you can nominate a price point below which the stock has to be sold — and then actively action it.
In his Myth#4, Frank Watkins talks with great caution about investing in Blue Chip stocks.
Lesson: Take care with your investments (even Blue Chip stocks), and sell the bad performers.
NOTE: This document does NOT contain any advice. Page 19 This entire document is for education only.There are NO recommendations in this document. © August 2009, R.B.Brain – Consulting
Beware the Share Market Bears! They are never far awayBrainy's 10 Key Lessons from the GFC for Investors and Traders
Lesson #10 — The old "Buy and Hold" strategy is dead!There are many people these days who buy shares in a company with the intention of holding onto them for the long term — "it's a long term investment" they say. This is what we call a “set and forget” strategy. Perhaps they have fallen in love with the company, and perhaps they will stay loyal through thick and thin. But would they sell these shares if they knew that the company was about to go bust and take all of their money with them? Remember, if a company goes bust, they typically owe more than they own (ie. they are insolvent), and the shareholders might get nothing in return while advisers, liquidators and others get fat fees to wind up the company.
Perhaps the investors just don't want to be bothered with reviewing their investment. Maybe they don't know how to review the performance of the investment, and how to take remedial action if something goes wrong. Maybe they just don't have the right tools to monitor the performance of their investment portfolio.
Whatever the reason, many people simply accept this "buy and hold" strategy. And they accept this same strategy with their superannuation investments.
Frank Watkins calls this the BHP method of investing — Buy, Hold and Pray.
With the latest financial crisis, there are now more doubts about the view that a diversified share portfolio that is held over the long term will provide a sound retirement.
Well, every few years there are people who do this, and who lose a lot of money. Some people say: "it is just a paper loss". Well, when they need the cash and they try to cash in their investment, then they will see how much of the investment is still left.
A key rule from Brainy's Traders Creed (a mini-poster) says: "Preserve capital, and maximise profits". The buy-and-hold strategy can be a good strategy during a bull market. But it is potentially a recipe for losses at other times.
Lesson: There are times when the shares in some companies should be converted to cold hard cash. Actively monitor your portfolio.
Conclusion? — Is there one?So, what conclusion can we draw from the material above?
Firstly, that in the recent past we can see a few serious lessons from the Global Financial Crisis that struck the whole world in 2008-2009. Ten key lessons from this crisis are described above.
Secondly, even though there are many different ways to invest our money in a variety of different asset classes, there are risks with every one of them. Even the most conservative investment methods can carry risks. And there is such a thing as the “share market bears” that do come out of hibernation from time to time, and which can inflict somewhat serious damage to many asset classes, and to many investment portfolios.
Now, once we acknowledge that these bears exist, we can take action to guard against their onslaught. There are things we can do to protect our capital.
“What can we do to protect our capital?” I hear you ask.
We can find someone who we truly trust, and whose judgement is proven to guard against the bears;or
We can listen to the qualified finance professionals with one ear and at the same time take at least a little interest in the overall economy, and be prepared to do something different.
Now, some people might feel that studying share price charts in a little detail might be worth the time and effort. In this case, the section on Technical Analysis below provides a brief overview of this fascinating topic.
Some people might think that they need to consider share trading themselves. In this case, the section on Share Trading below provides some serious words of warning.
NOTE: This document does NOT contain any advice. Page 20 This entire document is for education only.There are NO recommendations in this document. © August 2009, R.B.Brain – Consulting
Beware the Share Market Bears! They are never far awayBrainy's 10 Key Lessons from the GFC for Investors and Traders
Technical analysis (ie. Charting)Technical analysis is used by many people to maintain a good understanding of the markets, and where they might be headed. The subject of Technical Analysis is a huge one, and it can be rather complex; but there are some simple basic principles which could benefit the average investor significantly.
What is it? — Technical analysis is basically the study of share price charts using various analysis techniques to form a view as to likely future price action. The material below is just a very quick glance at technical analysis. Both Stan Weinstein and Frank Watkins explain these principles in more detail, and much more.
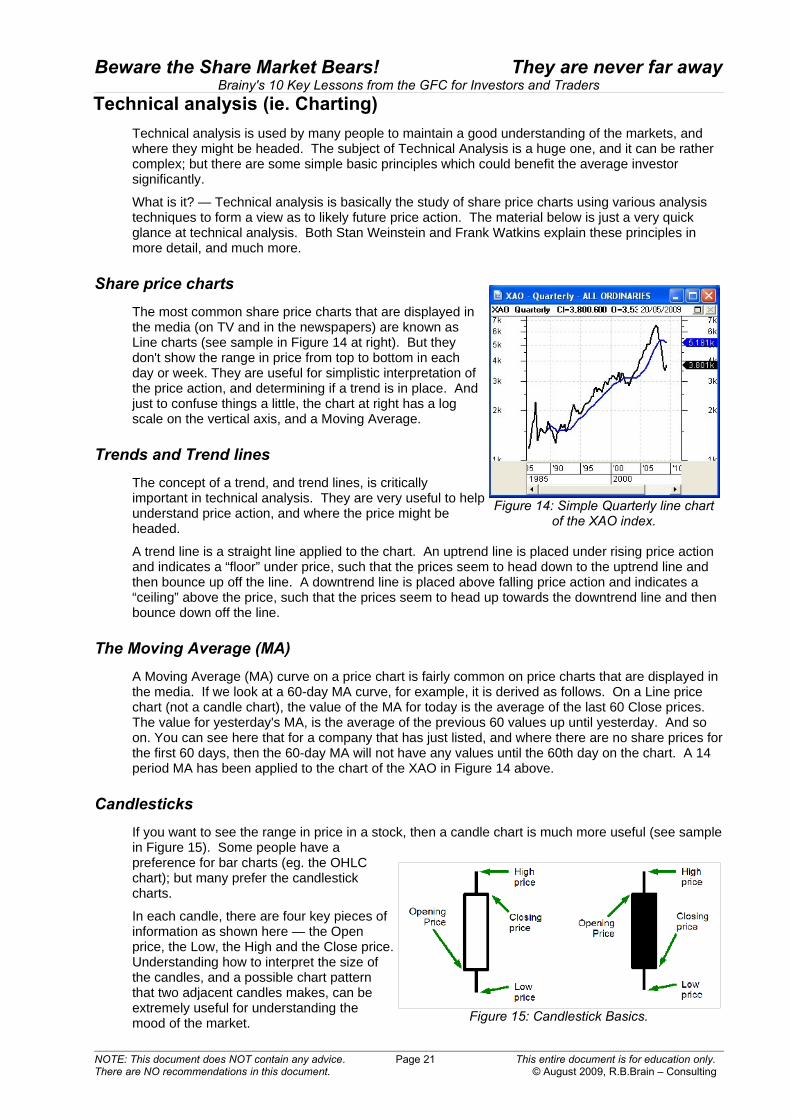
Share price chartsThe most common share price charts that are displayed in the media (on TV and in the newspapers) are known as Line charts (see sample in Figure 14 at right). But they don't show the range in price from top to bottom in each day or week. They are useful for simplistic interpretation of the price action, and determining if a trend is in place. And just to confuse things a little, the chart at right has a log scale on the vertical axis, and a Moving Average.
Trends and Trend linesThe concept of a trend, and trend lines, is critically important in technical analysis. They are very useful to help understand price action, and where the price might be headed.
A trend line is a straight line applied to the chart. An uptrend line is placed under rising price action and indicates a “floor” under price, such that the prices seem to head down to the uptrend line and then bounce up off the line. A downtrend line is placed above falling price action and indicates a “ceiling” above the price, such that the prices seem to head up towards the downtrend line and then bounce down off the line.
The Moving Average (MA)A Moving Average (MA) curve on a price chart is fairly common on price charts that are displayed in the media. If we look at a 60-day MA curve, for example, it is derived as follows. On a Line price chart (not a candle chart), the value of the MA for today is the average of the last 60 Close prices. The value for yesterday's MA, is the average of the previous 60 values up until yesterday. And so on. You can see here that for a company that has just listed, and where there are no share prices for the first 60 days, then the 60-day MA will not have any values until the 60th day on the chart. A 14 period MA has been applied to the chart of the XAO in Figure 14 above.
CandlesticksIf you want to see the range in price in a stock, then a candle chart is much more useful (see sample in Figure 15). Some people have a preference for bar charts (eg. the OHLC chart); but many prefer the candlestick charts.
In each candle, there are four key pieces of information as shown here — the Open price, the Low, the High and the Close price. Understanding how to interpret the size of the candles, and a possible chart pattern that two adjacent candles makes, can be extremely useful for understanding the mood of the market.
NOTE: This document does NOT contain any advice. Page 21 This entire document is for education only.There are NO recommendations in this document. © August 2009, R.B.Brain – Consulting
Figure 14: Simple Quarterly line chart of the XAO index.
Figure 15: Candlestick Basics.
Beware the Share Market Bears! They are never far awayBrainy's 10 Key Lessons from the GFC for Investors and Traders
Support and ResistanceThe concept of support and resistance is another critically important concept. Many professional share traders rely very heavily on this when forming a view of likely future price action.
Technical Analysis — in summaryTechnical analysis is a huge topic, but anyone who wants to make a start in understanding it and utilising this knowledge can start with the concepts mentioned above. But we limited to how much material we can include here, so the reader is encouraged to seek more information. The books referred to in this handout are a good place to start.
Share trading? — Stop! — Before you start!To be really ready for share trading, some of the things that you should research some more, or prepare, include:
Stops, stops and more stops — need to understand this topic, and use them. Trading Plan (and template). One or more Trading Strategies (and template). Trading Journal (and template). Trading Diary (and template).
Stop loss positionsThis is such an important topic that a little more detail is required.
Determine a stop loss position before you enter the trade. The initial value will be less than your entry price, so it is really a “limit loss” stop position.
Periodically review your positions, and raise the stop loss position to protect more profit. The actual stop loss position can be determined in a number of ways. If the price falls below your stop loss position, then make sure to act on it.
Frank Watkins discusses this topic in detail towards the end of his book.
Trading Plans and StrategiesIn the notes below there is just a very brief glimpse into the world of trading plans and strategies. More information on this is available from Robert's web site, and in his monthly eNewsletter articles.
Trading Plan
Firstly, it is important to note that there no hard and fast definition of a “Trading Plan”, or a “Trading Strategy”. There are a few varying views and definitions going around. In some cases it is referred to as an Investment and Trading Plan (ITP).
A very simplistic Trading Plan might contain the following (but this is NOT a proven nor successful plan, just a simplistic example):
I am serious about the trading and will approach it as though it is a profession. Trading Purpose — is for short term profits. Capital — $10,000 cash is available (currently safe in a bank account attracting interest). Days / hours — I am prepared to trade for 3 hours each evening. I will use a Trading Journal to record details of trades. I will make use of a Trading Diary to help me understand more about trading so that I can
progress and improve my trading.
NOTE: This document does NOT contain any advice. Page 22 This entire document is for education only.There are NO recommendations in this document. © August 2009, R.B.Brain – Consulting
Beware the Share Market Bears! They are never far awayBrainy's 10 Key Lessons from the GFC for Investors and Traders
Trading Strategy
It is vitally important to have at least one documented trading strategy on the table before you actually trade. Ideally the strategy will be back tested and/or paper traded over time to prove that it is profitable. This will also give you confidence that it works (or that it doesn't work). It is pretty much impossible to have a 100% success rate with trading. But provided the losses on losing trades are kept very small, and the profits on winners are allowed to run, then the overall result can be profitable.
Trading Journal
To make good progress with your trading journey, it is important to keep a Trading Journal. In the journal you can keep a record of key information about each trade. It is very useful to do this so that you can reflect on the amount of success or otherwise of your trading journey. You will also need some figures for income and taxation purposes.
Trading Diary
A Trading Diary is not essential, but it can be very useful to help you understand your emotions and reasons for trading decisions, especially early on in your trading journey. It is well known that emotions can easily come into play for a trader — but this is an understatement. It can be very useful for you to record how you feel when you initially place a trade (eg. reluctance, butterflies, confidence, etc.), and then your emotions when faced with a sizeable loss (eg. empty feeling, pain in the gut, disappointment, sadness, etc.). By recording these things in a proper place you will be better placed to manage the emotions are come to grips with them.
Money ManagementIt is so important to protect your capital. Should you consider putting 100% of your available capital into just one stock? Of course not!
It is wise to pre-determine a maximum percentage amount of capital that you are prepared to commit to one stock - it might be 25% for example.
Also, many people maintain the view that it is wise to limit the amount of capital "at risk" on a trade to only 2% of total capital. That is, in a share trade you can determine in advance that if the stock price falls to a certain point, and it is looking like a loss that is a dollar amount equal to 2% of your capital, then you should exit the trade. This concept of limiting risk to 2% of trading capital is covered in more detail in Frank's book.
Can you cope with the emotion?Many people are surprised at how much emotion comes into play when trading. It is one of those things that really needs to be experienced to believe it. Many people find it difficult to cope with the emotions involved.
What to do next?Okay, armed with this information and knowledge, what should you do next?
Should I take some action, or no action?The switched-on investor might now ask “what to do next?”
Well, there are some real strategic options to consider, including the following:
(a) Take no action — continue to invest the same as before (and suffer the same returns).
(b) Learn more about the share market and how it operates.
(c) Learn more about the market to understand why the market behaves the way it does.
NOTE: This document does NOT contain any advice. Page 23 This entire document is for education only.There are NO recommendations in this document. © August 2009, R.B.Brain – Consulting
Beware the Share Market Bears! They are never far awayBrainy's 10 Key Lessons from the GFC for Investors and Traders
(d) Make a conscious decision to start monitoring the share market on, say, a weekly basis. It doesn't have to take long.
(e) Decide whether to passively leave your superannuation investments in the current mix of asset class, or to consider re-weighting from time to time when the time is right (of course, in discussion with a licensed financial adviser).
(f) Consider whether to take a more active role in the investment world.
Possible action stepsMaking a decision to take some action is a step in the right direction towards being more in control of your investment decisions. Even so, there will still be a lot of people who will want to leave it to the so-called experts.
Some of the possible pathways that you can now tread include the following:
(a) Learn more about the market — from various sources, providers and trainers.
(b) Learn how to identify up trends and down trends on price charts.
(c) Learn how to interpret share price charts, and to anticipate problems with a stock, or with the market — using techniques like technical analysis.
(d) Learn more about candlestick charts and patterns and how to interpret them.
(e) Learn more about Trading Plans and Strategies.
(f) Try to find out if you are the suitable type of person to be an active investor (or maybe a trader) — either an end-of-week investor/trader who spends only an hour or so a week on it, or longer or shorter.
More information and helpFor more information and assistance, there are various sources available:-
ATAA (Australian Technical Analysts Association) Specialist text books from specialist book shops (eg. The Educated Investor bookshop in
Collins Street, Melbourne can be endorsed and recommended – tell the shop staff that Robert Brain sent you).
Seminars and workshops, and Brainy's eNewsletters — Robert Brain and Brainy's Share Market Toolbox web site: www.robertbrain.com
Other trainers, educators and service providers.
BibliographyThe following books are recommended reading.
Anderson, Phillip J, “The Secret Life of Real Estate — How it moves and why”, Shepheard-Walwyn, 2008 (RRP $74.95).Watkins, Frank, “Exploding the Myths”, Vocational Education & Training Publications, 2003 (RRP $34.95).Weinstein, Stan, “Secrets for Profiting in Bull and Bear Markets”, McGraw-Hill, 1988 (RRP $36).
These books are available from the Educated Investor bookshop ( www.educatedinvestor.com.au ) , 500 Collins Street, Melbourne — tell Janene in the shop that Robert Brain sent you, and ask nicely for a 10% discount off RRP.
NOTE: This document does NOT contain any advice. Page 24 This entire document is for education only.There are NO recommendations in this document. © August 2009, R.B.Brain – Consulting