Embed Size (px)
Citation preview

1
FILM AT THE CINEMA
2
CONTENTS
Cover image: Star Wars: The Last Jedi © 2017 Lucasfilm Ltd. & TM, All Rights Reserved.
Admissions .........................................................................................................................................................................04
UK box office earnings ........................................................................................................................................................08
Film releases and box office revenues in the UK and Republic of Ireland ............................................................................08
Widest point of release .......................................................................................................................................................12
Country of origin of film releases ........................................................................................................................................12
Top films at the box office ...................................................................................................................................................16
The top 3D films ..................................................................................................................................................................18
Best weekend performance of UK films .............................................................................................................................19
Top 20 films at the UK box office, 1975-2017 .......................................................................................................................19
Specialised releases: documentaries, foreign language films and re-releases at the UK box office in 2017 ...................................................................................22
Trends in specialised film ....................................................................................................................................................23
Non-English language films ................................................................................................................................................24
Documentaries ...................................................................................................................................................................27
Re-releases .........................................................................................................................................................................29
Releases and box office by genre .......................................................................................................................................30
Releases and box office by BBFC classification ..................................................................................................................35
3
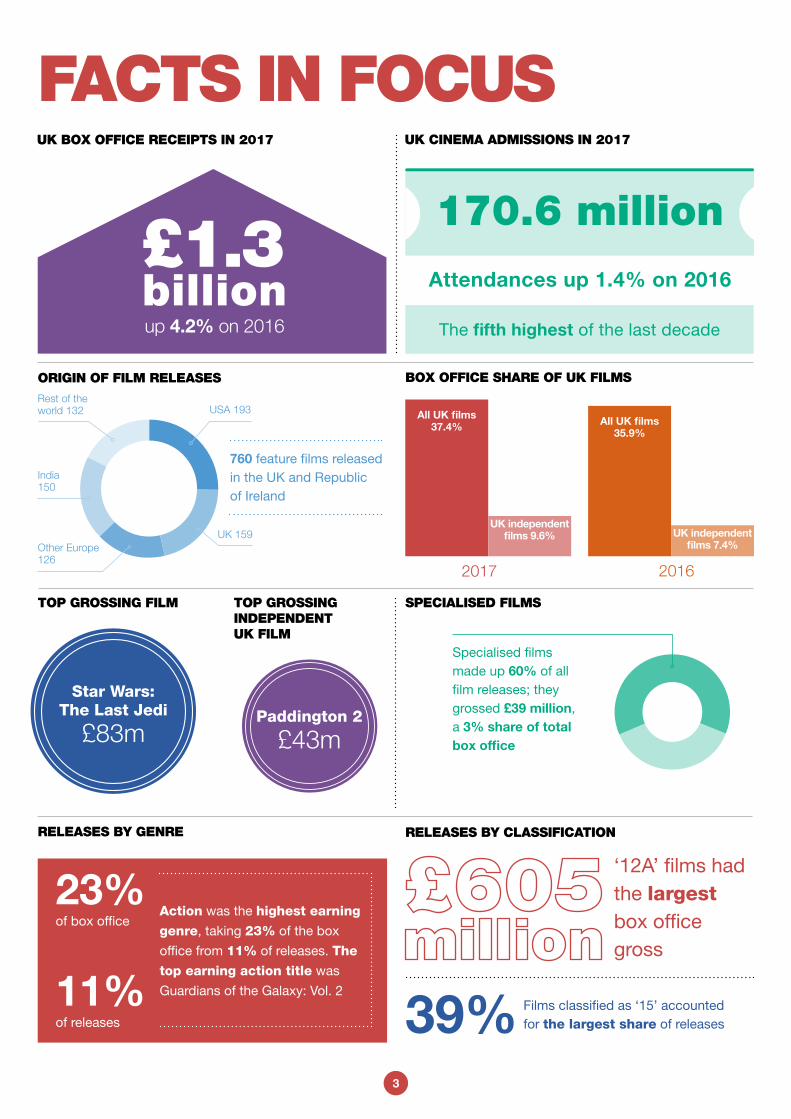
FACTS IN FOCUSUK BOX OFFICE RECEIPTS IN 2017
up 4.2% on 2016
UK CINEMA ADMISSIONS IN 2017
The fifth highest of the last decade
Attendances up 1.4% on 2016
170.6 million
Action was the highest earning
genre, taking 23% of the box
office from 11% of releases. The
top earning action title was
Guardians of the Galaxy: Vol. 2
‘12A’ films had the largest box office gross
ORIGIN OF FILM RELEASES
Films classified as ‘15’ accounted for the largest share of releases39%
RELEASES BY CLASSIFICATION
BOX OFFICE SHARE OF UK FILMS
Star Wars: The Last Jedi
£83m
TOP GROSSING FILM TOP GROSSING INDEPENDENT UK FILM
Paddington 2
£43m
RELEASES BY GENRE
SPECIALISED FILMS
760 feature films released in the UK and Republic of Ireland
11%of releases
23%of box office
Specialised films made up 60% of all film releases; they grossed £39 million, a 3% share of total box office
2016
USA 193Rest of the world 132
India 150
Other Europe 126
UK 159
2017
All UK films 37.4%
UK independent films 9.6%
All UK films 35.9%
UK independent films 7.4%
4
FILM AT THE CINEMAADMISSIONS
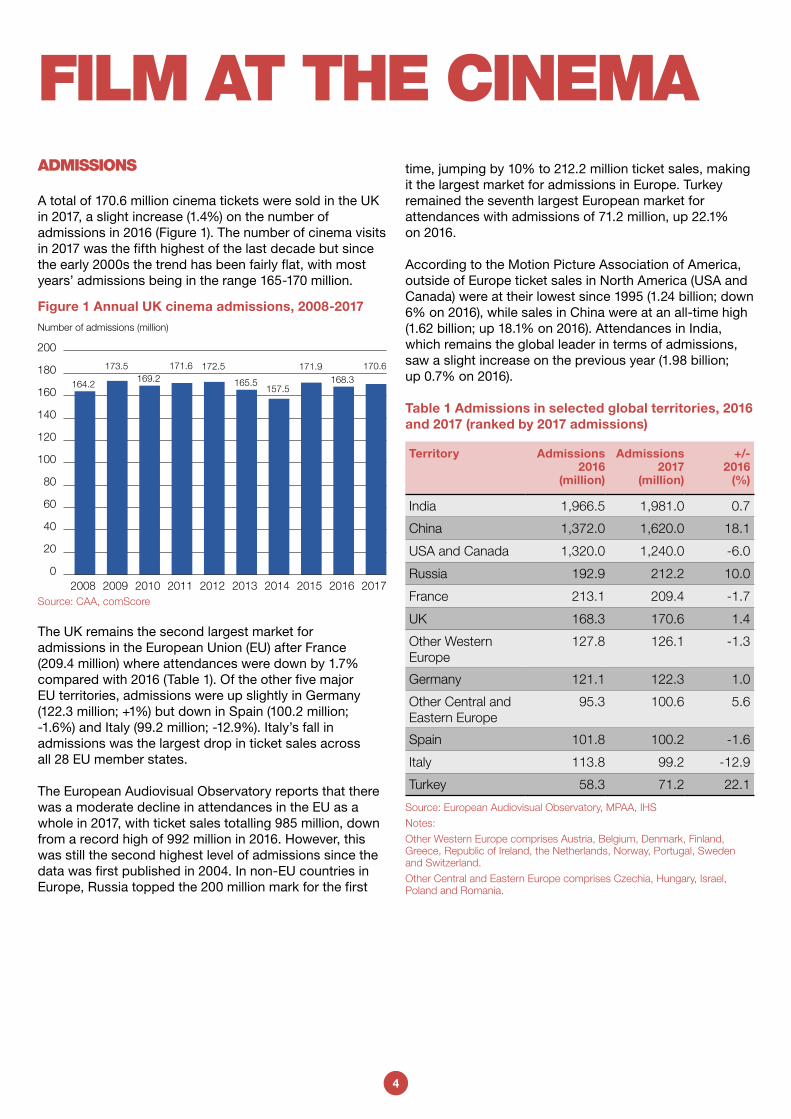
A total of 170.6 million cinema tickets were sold in the UK in 2017, a slight increase (1.4%) on the number of admissions in 2016 (Figure 1). The number of cinema visits in 2017 was the fifth highest of the last decade but since the early 2000s the trend has been fairly flat, with most years’ admissions being in the range 165-170 million.
Figure 1 Annual UK cinema admissions, 2008-2017
The UK remains the second largest market for admissions in the European Union (EU) after France (209.4 million) where attendances were down by 1.7% compared with 2016 (Table 1). Of the other five major EU territories, admissions were up slightly in Germany (122.3 million; +1%) but down in Spain (100.2 million; -1.6%) and Italy (99.2 million; -12.9%). Italy’s fall in admissions was the largest drop in ticket sales across all 28 EU member states.
The European Audiovisual Observatory reports that there was a moderate decline in attendances in the EU as a whole in 2017, with ticket sales totalling 985 million, down from a record high of 992 million in 2016. However, this was still the second highest level of admissions since the data was first published in 2004. In non-EU countries in Europe, Russia topped the 200 million mark for the first
time, jumping by 10% to 212.2 million ticket sales, making it the largest market for admissions in Europe. Turkey remained the seventh largest European market for attendances with admissions of 71.2 million, up 22.1% on 2016.
According to the Motion Picture Association of America, outside of Europe ticket sales in North America (USA and Canada) were at their lowest since 1995 (1.24 billion; down 6% on 2016), while sales in China were at an all-time high (1.62 billion; up 18.1% on 2016). Attendances in India, which remains the global leader in terms of admissions, saw a slight increase on the previous year (1.98 billion; up 0.7% on 2016).
Table 1 Admissions in selected global territories, 2016 and 2017 (ranked by 2017 admissions)
Territory Admissions 2016
(million)
Admissions 2017
(million)
+/- 2016
(%)
India 1,966.5 1,981.0 0.7
China 1,372.0 1,620.0 18.1
USA and Canada 1,320.0 1,240.0 -6.0
Russia 192.9 212.2 10.0
France 213.1 209.4 -1.7
UK 168.3 170.6 1.4
Other Western Europe
127.8 126.1 -1.3
Germany 121.1 122.3 1.0
Other Central and Eastern Europe
95.3 100.6 5.6
Spain 101.8 100.2 -1.6
Italy 113.8 99.2 -12.9
Turkey 58.3 71.2 22.1
Source: European Audiovisual Observatory, MPAA, IHS
Notes:
Other Western Europe comprises Austria, Belgium, Denmark, Finland, Greece, Republic of Ireland, the Netherlands, Norway, Portugal, Sweden and Switzerland.
Other Central and Eastern Europe comprises Czechia, Hungary, Israel, Poland and Romania.
Number of admissions (million)
0
20
40
60
80
100
120
140
160
180
200
2017201620152014201320122011201020092008
164.2
173.5169.2
171.6 172.5
165.5157.5
171.9168.3
170.6
Source: CAA, comScore
5
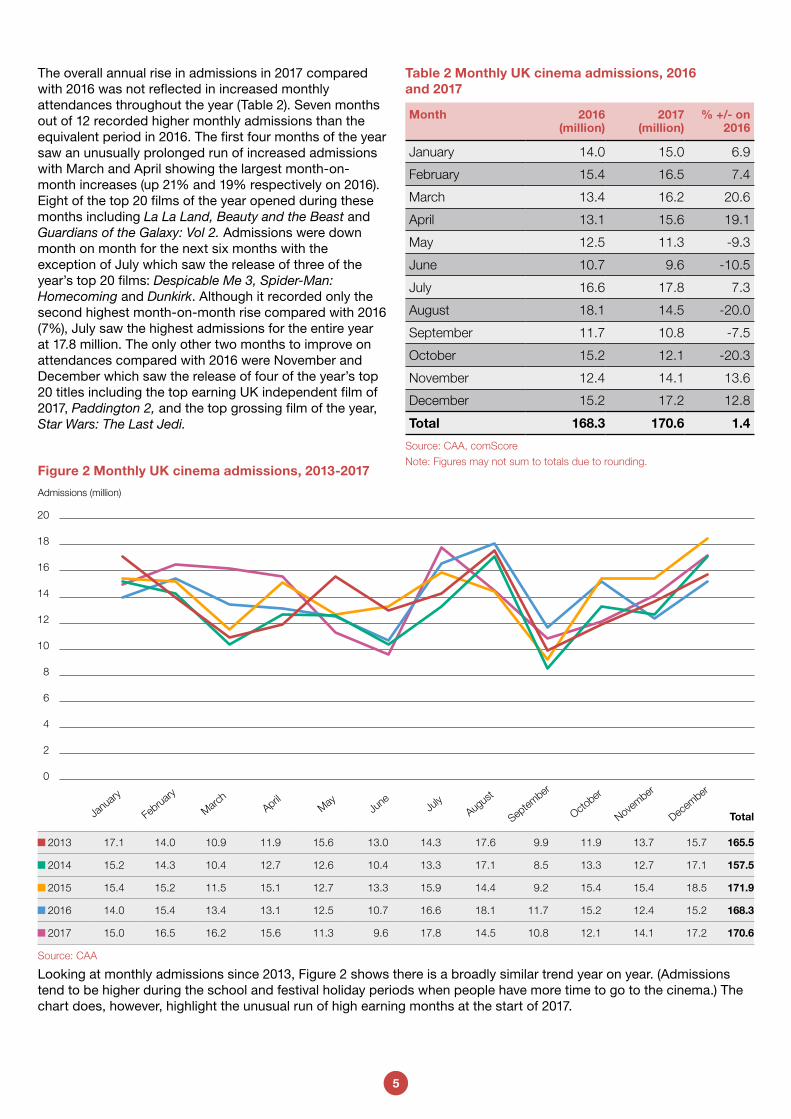
The overall annual rise in admissions in 2017 compared with 2016 was not reflected in increased monthly attendances throughout the year (Table 2). Seven months out of 12 recorded higher monthly admissions than the equivalent period in 2016. The first four months of the year saw an unusually prolonged run of increased admissions with March and April showing the largest month-on-month increases (up 21% and 19% respectively on 2016). Eight of the top 20 films of the year opened during these months including La La Land, Beauty and the Beast and Guardians of the Galaxy: Vol 2. Admissions were down month on month for the next six months with the exception of July which saw the release of three of the year’s top 20 films: Despicable Me 3, Spider-Man: Homecoming and Dunkirk. Although it recorded only the second highest month-on-month rise compared with 2016 (7%), July saw the highest admissions for the entire year at 17.8 million. The only other two months to improve on attendances compared with 2016 were November and December which saw the release of four of the year’s top 20 titles including the top earning UK independent film of 2017, Paddington 2, and the top grossing film of the year, Star Wars: The Last Jedi.
Table 2 Monthly UK cinema admissions, 2016 and 2017
Month 2016 (million)
2017 (million)
% +/- on 2016
January 14.0 15.0 6.9
February 15.4 16.5 7.4
March 13.4 16.2 20.6
April 13.1 15.6 19.1
May 12.5 11.3 -9.3
June 10.7 9.6 -10.5
July 16.6 17.8 7.3
August 18.1 14.5 -20.0
September 11.7 10.8 -7.5
October 15.2 12.1 -20.3
November 12.4 14.1 13.6
December 15.2 17.2 12.8
Total 168.3 170.6 1.4
Source: CAA, comScore
Note: Figures may not sum to totals due to rounding.
Looking at monthly admissions since 2013, Figure 2 shows there is a broadly similar trend year on year. (Admissions tend to be higher during the school and festival holiday periods when people have more time to go to the cinema.) The chart does, however, highlight the unusual run of high earning months at the start of 2017.
Figure 2 Monthly UK cinema admissions, 2013-2017
0
2
4
6
8
10
12
14
16
18
20
Decem
ber
November
October
Septem
ber
Augus
tJu
lyJu
neMayAprilMarc
h
Februa
ry
Janu
ary
Admissions (million)
2013 17.1 14.0 10.9 11.9 15.6 13.0 14.3 17.6 9.9 11.9 13.7 15.7 165.5
2014 15.2 14.3 10.4 12.7 12.6 10.4 13.3 17.1 8.5 13.3 12.7 17.1 157.5
2015 15.4 15.2 11.5 15.1 12.7 13.3 15.9 14.4 9.2 15.4 15.4 18.5 171.9
2016 14.0 15.4 13.4 13.1 12.5 10.7 16.6 18.1 11.7 15.2 12.4 15.2 168.3
2017 15.0 16.5 16.2 15.6 11.3 9.6 17.8 14.5 10.8 12.1 14.1 17.2 170.6
Source: CAA
Total
6
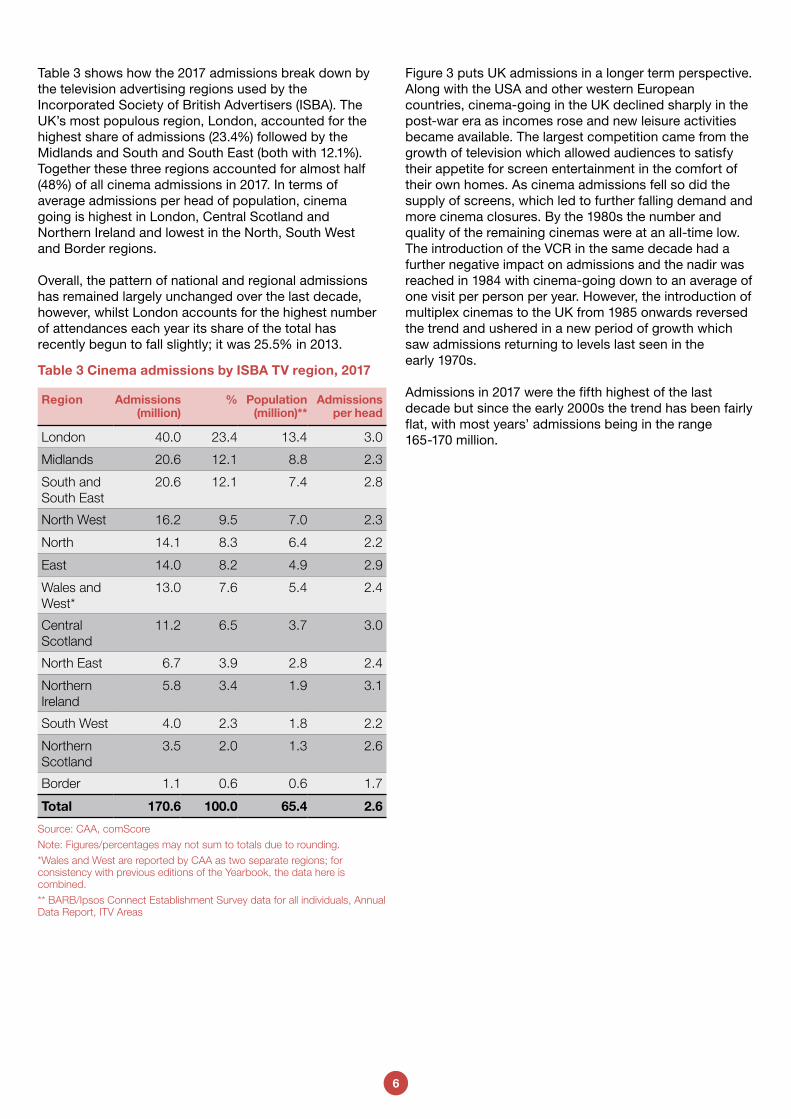
Table 3 shows how the 2017 admissions break down by the television advertising regions used by the Incorporated Society of British Advertisers (ISBA). The UK’s most populous region, London, accounted for the highest share of admissions (23.4%) followed by the Midlands and South and South East (both with 12.1%). Together these three regions accounted for almost half (48%) of all cinema admissions in 2017. In terms of average admissions per head of population, cinema going is highest in London, Central Scotland and Northern Ireland and lowest in the North, South West and Border regions.
Overall, the pattern of national and regional admissions has remained largely unchanged over the last decade, however, whilst London accounts for the highest number of attendances each year its share of the total has recently begun to fall slightly; it was 25.5% in 2013.
Table 3 Cinema admissions by ISBA TV region, 2017
Region Admissions (million)
% Population (million)**
Admissions per head
London 40.0 23.4 13.4 3.0
Midlands 20.6 12.1 8.8 2.3
South and South East
20.6 12.1 7.4 2.8
North West 16.2 9.5 7.0 2.3
North 14.1 8.3 6.4 2.2
East 14.0 8.2 4.9 2.9
Wales and West*
13.0 7.6 5.4 2.4
Central Scotland
11.2 6.5 3.7 3.0
North East 6.7 3.9 2.8 2.4
Northern Ireland
5.8 3.4 1.9 3.1
South West 4.0 2.3 1.8 2.2
Northern Scotland
3.5 2.0 1.3 2.6
Border 1.1 0.6 0.6 1.7
Total 170.6 100.0 65.4 2.6
Source: CAA, comScore
Note: Figures/percentages may not sum to totals due to rounding.
*Wales and West are reported by CAA as two separate regions; for consistency with previous editions of the Yearbook, the data here is combined.
** BARB/Ipsos Connect Establishment Survey data for all individuals, Annual Data Report, ITV Areas
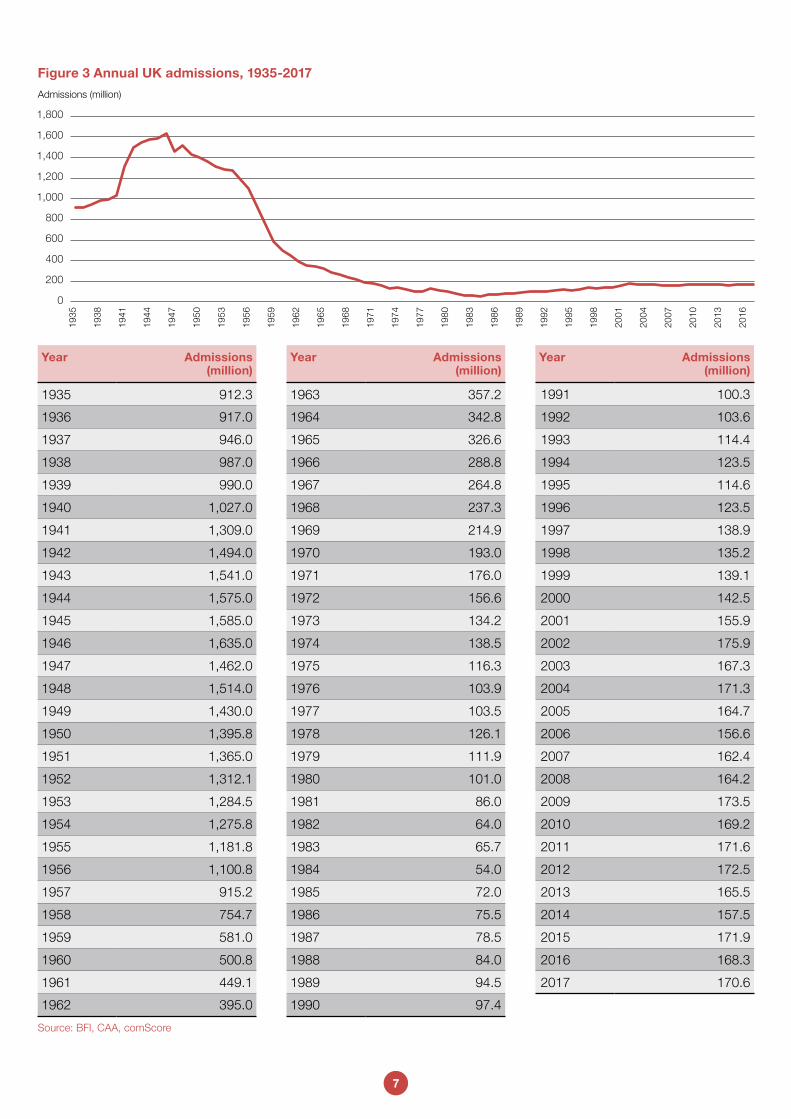
Figure 3 puts UK admissions in a longer term perspective. Along with the USA and other western European countries, cinema-going in the UK declined sharply in the post-war era as incomes rose and new leisure activities became available. The largest competition came from the growth of television which allowed audiences to satisfy their appetite for screen entertainment in the comfort of their own homes. As cinema admissions fell so did the supply of screens, which led to further falling demand and more cinema closures. By the 1980s the number and quality of the remaining cinemas were at an all-time low. The introduction of the VCR in the same decade had a further negative impact on admissions and the nadir was reached in 1984 with cinema-going down to an average of one visit per person per year. However, the introduction of multiplex cinemas to the UK from 1985 onwards reversed the trend and ushered in a new period of growth which saw admissions returning to levels last seen in the early 1970s.
Admissions in 2017 were the fifth highest of the last decade but since the early 2000s the trend has been fairly flat, with most years’ admissions being in the range 165-170 million.
7
Year Admissions (million)
Year Admissions (million)
Year Admissions (million)
1935 912.3 1963 357.2 1991 100.3
1936 917.0 1964 342.8 1992 103.6
1937 946.0 1965 326.6 1993 114.4
1938 987.0 1966 288.8 1994 123.5
1939 990.0 1967 264.8 1995 114.6
1940 1,027.0 1968 237.3 1996 123.5
1941 1,309.0 1969 214.9 1997 138.9
1942 1,494.0 1970 193.0 1998 135.2
1943 1,541.0 1971 176.0 1999 139.1
1944 1,575.0 1972 156.6 2000 142.5
1945 1,585.0 1973 134.2 2001 155.9
1946 1,635.0 1974 138.5 2002 175.9
1947 1,462.0 1975 116.3 2003 167.3
1948 1,514.0 1976 103.9 2004 171.3
1949 1,430.0 1977 103.5 2005 164.7
1950 1,395.8 1978 126.1 2006 156.6
1951 1,365.0 1979 111.9 2007 162.4
1952 1,312.1 1980 101.0 2008 164.2
1953 1,284.5 1981 86.0 2009 173.5
1954 1,275.8 1982 64.0 2010 169.2
1955 1,181.8 1983 65.7 2011 171.6
1956 1,100.8 1984 54.0 2012 172.5
1957 915.2 1985 72.0 2013 165.5
1958 754.7 1986 75.5 2014 157.5
1959 581.0 1987 78.5 2015 171.9
1960 500.8 1988 84.0 2016 168.3
1961 449.1 1989 94.5 2017 170.6
1962 395.0 1990 97.4
Source: BFI, CAA, comScore
Figure 3 Annual UK admissions, 1935-2017
0
200
400
600
800
1,000
1,200
1,400
1,600
1,800
2016
2013
2010
2007
2004
2001
1998
1995
1992
1989
1986
1983
1980
1977
1974
1971
1968
1965
1962
1959
1956
1953
1950
1947
1944
1941
1938
1935
Admissions (million)
8
UK BOX OFFICE EARNINGS
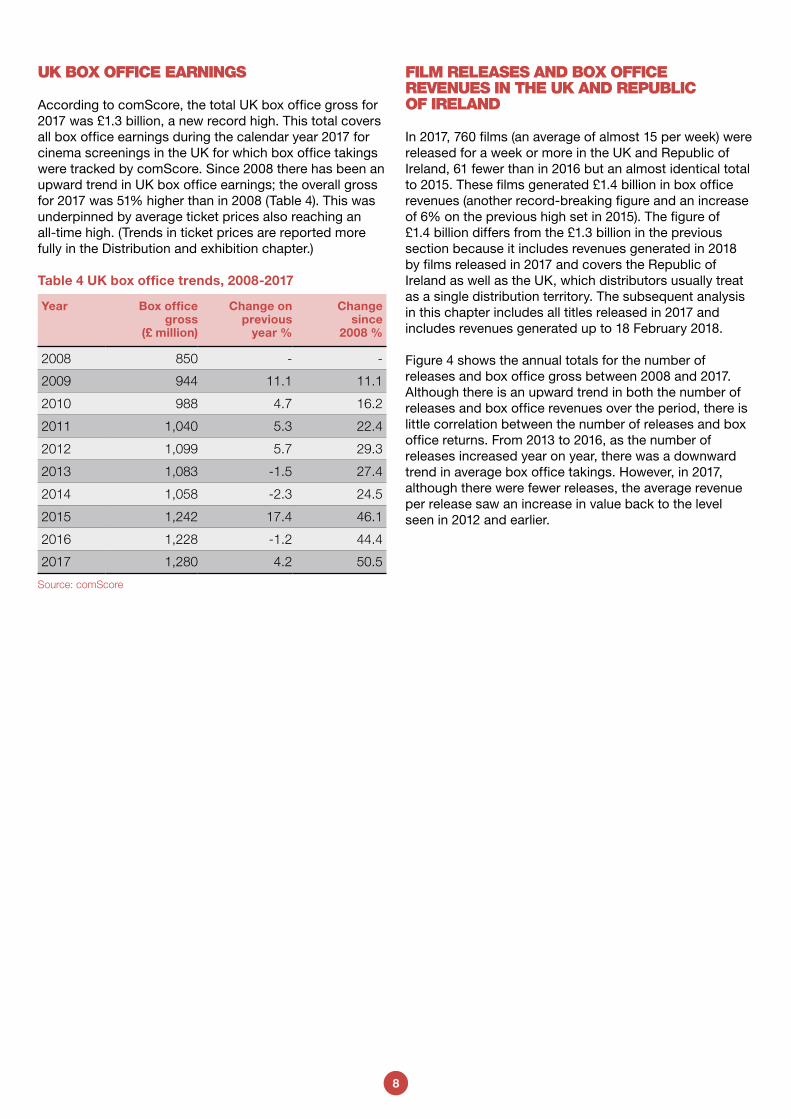
According to comScore, the total UK box office gross for 2017 was £1.3 billion, a new record high. This total covers all box office earnings during the calendar year 2017 for cinema screenings in the UK for which box office takings were tracked by comScore. Since 2008 there has been an upward trend in UK box office earnings; the overall gross for 2017 was 51% higher than in 2008 (Table 4). This was underpinned by average ticket prices also reaching an all-time high. (Trends in ticket prices are reported more fully in the Distribution and exhibition chapter.)
Table 4 UK box office trends, 2008-2017
Year Box office gross
(£ million)
Change on previous
year %
Change since
2008 %
2008 850 - -
2009 944 11.1 11.1
2010 988 4.7 16.2
2011 1,040 5.3 22.4
2012 1,099 5.7 29.3
2013 1,083 -1.5 27.4
2014 1,058 -2.3 24.5
2015 1,242 17.4 46.1
2016 1,228 -1.2 44.4
2017 1,280 4.2 50.5
Source: comScore
FILM RELEASES AND BOX OFFICE REVENUES IN THE UK AND REPUBLIC OF IRELAND
In 2017, 760 films (an average of almost 15 per week) were released for a week or more in the UK and Republic of Ireland, 61 fewer than in 2016 but an almost identical total to 2015. These films generated £1.4 billion in box office revenues (another record-breaking figure and an increase of 6% on the previous high set in 2015). The figure of £1.4 billion differs from the £1.3 billion in the previous section because it includes revenues generated in 2018 by films released in 2017 and covers the Republic of Ireland as well as the UK, which distributors usually treat as a single distribution territory. The subsequent analysis in this chapter includes all titles released in 2017 and includes revenues generated up to 18 February 2018.
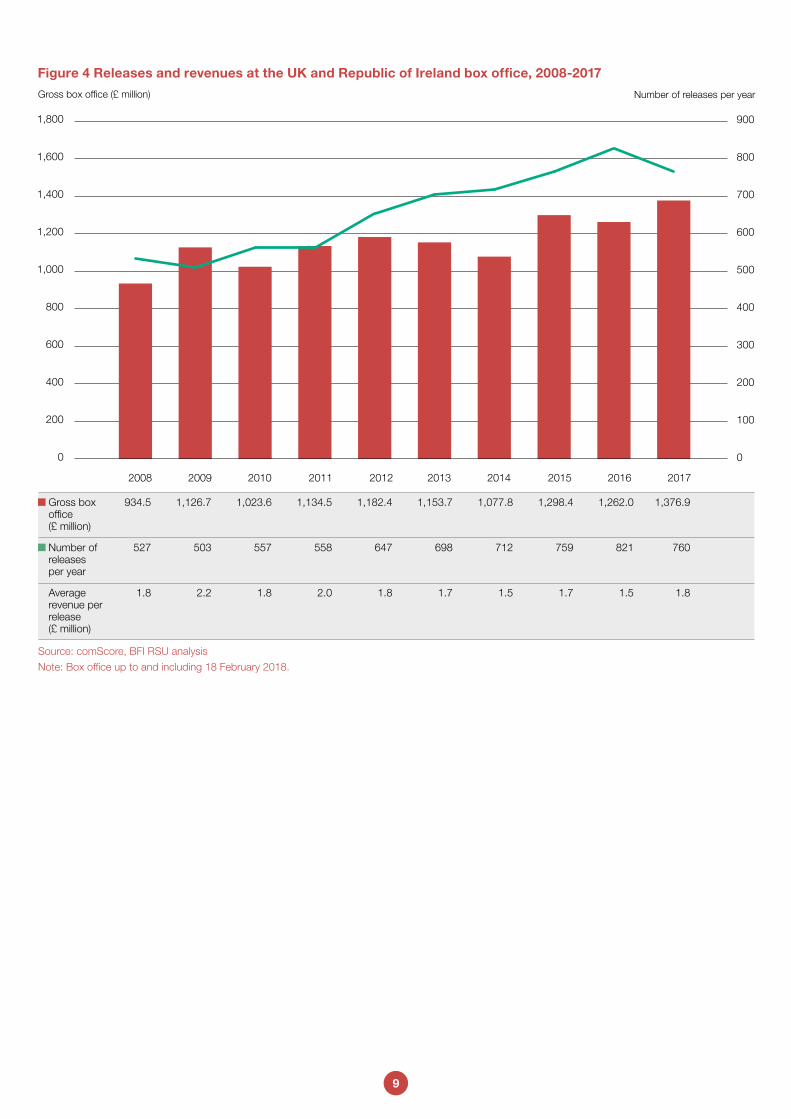
Figure 4 shows the annual totals for the number of releases and box office gross between 2008 and 2017. Although there is an upward trend in both the number of releases and box office revenues over the period, there is little correlation between the number of releases and box office returns. From 2013 to 2016, as the number of releases increased year on year, there was a downward trend in average box office takings. However, in 2017, although there were fewer releases, the average revenue per release saw an increase in value back to the level seen in 2012 and earlier.
9
Figure 4 Releases and revenues at the UK and Republic of Ireland box office, 2008-2017
0
100
200
300
400
500
600
700
800
900
0
200
400
600
800
1,000
1,200
1,400
1,600
1,800
2017201620152014201320122011201020092008
Gross box office (£ million) Number of releases per year
Gross box office (£ million)
934.5 1,126.7 1,023.6 1,134.5 1,182.4 1,153.7 1,077.8 1,298.4 1,262.0 1,376.9
Number of releases per year
527 503 557 558 647 698 712 759 821 760
Average revenue per release (£ million)
1.8 2.2 1.8 2.0 1.8 1.7 1.5 1.7 1.5 1.8
Source: comScore, BFI RSU analysis
Note: Box office up to and including 18 February 2018.
10
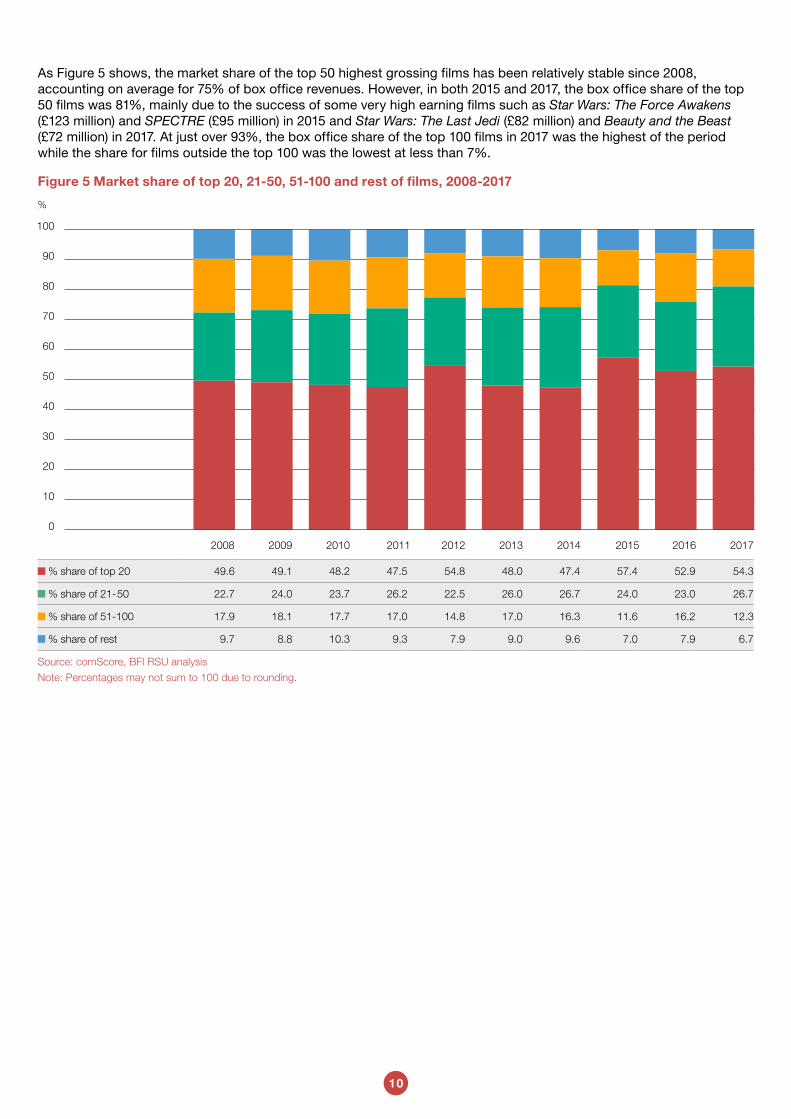
As Figure 5 shows, the market share of the top 50 highest grossing films has been relatively stable since 2008, accounting on average for 75% of box office revenues. However, in both 2015 and 2017, the box office share of the top 50 films was 81%, mainly due to the success of some very high earning films such as Star Wars: The Force Awakens (£123 million) and SPECTRE (£95 million) in 2015 and Star Wars: The Last Jedi (£82 million) and Beauty and the Beast (£72 million) in 2017. At just over 93%, the box office share of the top 100 films in 2017 was the highest of the period while the share for films outside the top 100 was the lowest at less than 7%.
% share of top 20 49.6 49.1 48.2 47.5 54.8 48.0 47.4 57.4 52.9 54.3
% share of 21-50 22.7 24.0 23.7 26.2 22.5 26.0 26.7 24.0 23.0 26.7
% share of 51-100 17.9 18.1 17.7 17.0 14.8 17.0 16.3 11.6 16.2 12.3
% share of rest 9.7 8.8 10.3 9.3 7.9 9.0 9.6 7.0 7.9 6.7
Source: comScore, BFI RSU analysis
Note: Percentages may not sum to 100 due to rounding.
0
10
20
30
40
50
60
70
80
90
100
2017201620152014201320122011201020092008
Figure 5 Market share of top 20, 21-50, 51-100 and rest of films, 2008-2017
%
11
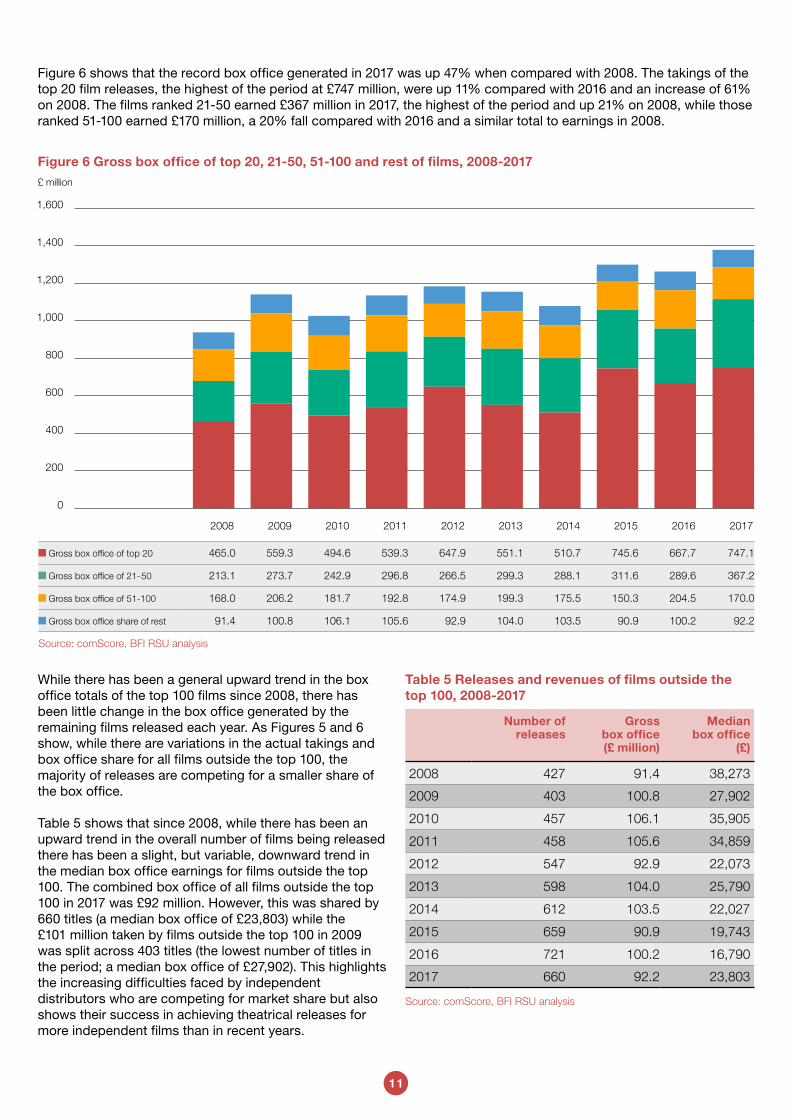
While there has been a general upward trend in the box office totals of the top 100 films since 2008, there has been little change in the box office generated by the remaining films released each year. As Figures 5 and 6 show, while there are variations in the actual takings and box office share for all films outside the top 100, the majority of releases are competing for a smaller share of the box office.
Table 5 shows that since 2008, while there has been an upward trend in the overall number of films being released there has been a slight, but variable, downward trend in the median box office earnings for films outside the top 100. The combined box office of all films outside the top 100 in 2017 was £92 million. However, this was shared by 660 titles (a median box office of £23,803) while the £101 million taken by films outside the top 100 in 2009 was split across 403 titles (the lowest number of titles in the period; a median box office of £27,902). This highlights the increasing difficulties faced by independent distributors who are competing for market share but also shows their success in achieving theatrical releases for more independent films than in recent years.
Table 5 Releases and revenues of films outside the top 100, 2008-2017
Number of releases
Gross box office(£ million)
Median box office
(£)
2008 427 91.4 38,273
2009 403 100.8 27,902
2010 457 106.1 35,905
2011 458 105.6 34,859
2012 547 92.9 22,073
2013 598 104.0 25,790
2014 612 103.5 22,027
2015 659 90.9 19,743
2016 721 100.2 16,790
2017 660 92.2 23,803
Source: comScore, BFI RSU analysis
£ million
0
200
400
600
800
1,000
1,200
1,400
1,600
2017201620152014201320122011201020092008
Gross box office of top 20 465.0 559.3 494.6 539.3 647.9 551.1 510.7 745.6 667.7 747.1
Gross box office of 21-50 213.1 273.7 242.9 296.8 266.5 299.3 288.1 311.6 289.6 367.2
Gross box office of 51-100 168.0 206.2 181.7 192.8 174.9 199.3 175.5 150.3 204.5 170.0
Gross box office share of rest 91.4 100.8 106.1 105.6 92.9 104.0 103.5 90.9 100.2 92.2
Source: comScore, BFI RSU analysis
Figure 6 Gross box office of top 20, 21-50, 51-100 and rest of films, 2008-2017
Figure 6 shows that the record box office generated in 2017 was up 47% when compared with 2008. The takings of the top 20 film releases, the highest of the period at £747 million, were up 11% compared with 2016 and an increase of 61% on 2008. The films ranked 21-50 earned £367 million in 2017, the highest of the period and up 21% on 2008, while those ranked 51-100 earned £170 million, a 20% fall compared with 2016 and a similar total to earnings in 2008.
12
WIDEST POINT OF RELEASE
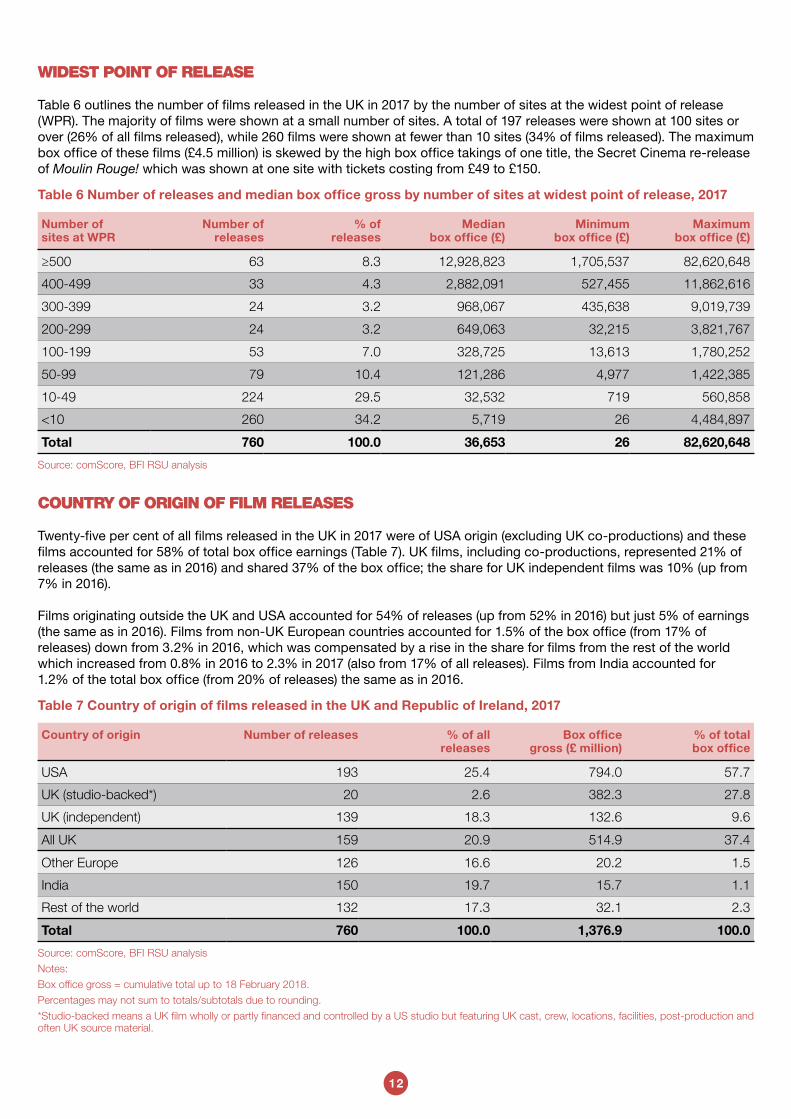
Table 6 outlines the number of films released in the UK in 2017 by the number of sites at the widest point of release (WPR). The majority of films were shown at a small number of sites. A total of 197 releases were shown at 100 sites or over (26% of all films released), while 260 films were shown at fewer than 10 sites (34% of films released). The maximum box office of these films (£4.5 million) is skewed by the high box office takings of one title, the Secret Cinema re-release of Moulin Rouge! which was shown at one site with tickets costing from £49 to £150.
Table 6 Number of releases and median box office gross by number of sites at widest point of release, 2017
Number of sites at WPR
Number of releases
% of releases
Median box office (£)
Minimum box office (£)
Maximum box office (£)
≥500 63 8.3 12,928,823 1,705,537 82,620,648
400-499 33 4.3 2,882,091 527,455 11,862,616
300-399 24 3.2 968,067 435,638 9,019,739
200-299 24 3.2 649,063 32,215 3,821,767
100-199 53 7.0 328,725 13,613 1,780,252
50-99 79 10.4 121,286 4,977 1,422,385
10-49 224 29.5 32,532 719 560,858
<10 260 34.2 5,719 26 4,484,897
Total 760 100.0 36,653 26 82,620,648
Source: comScore, BFI RSU analysis
COUNTRY OF ORIGIN OF FILM RELEASES
Twenty-five per cent of all films released in the UK in 2017 were of USA origin (excluding UK co-productions) and these films accounted for 58% of total box office earnings (Table 7). UK films, including co-productions, represented 21% of releases (the same as in 2016) and shared 37% of the box office; the share for UK independent films was 10% (up from 7% in 2016).
Films originating outside the UK and USA accounted for 54% of releases (up from 52% in 2016) but just 5% of earnings (the same as in 2016). Films from non-UK European countries accounted for 1.5% of the box office (from 17% of releases) down from 3.2% in 2016, which was compensated by a rise in the share for films from the rest of the world which increased from 0.8% in 2016 to 2.3% in 2017 (also from 17% of all releases). Films from India accounted for 1.2% of the total box office (from 20% of releases) the same as in 2016.
Table 7 Country of origin of films released in the UK and Republic of Ireland, 2017
Country of origin Number of releases % of all releases
Box office gross (£ million)
% of total box office
USA 193 25.4 794.0 57.7
UK (studio-backed*) 20 2.6 382.3 27.8
UK (independent) 139 18.3 132.6 9.6
All UK 159 20.9 514.9 37.4
Other Europe 126 16.6 20.2 1.5
India 150 19.7 15.7 1.1
Rest of the world 132 17.3 32.1 2.3
Total 760 100.0 1,376.9 100.0
Source: comScore, BFI RSU analysis
Notes:
Box office gross = cumulative total up to 18 February 2018.
Percentages may not sum to totals/subtotals due to rounding.
*Studio-backed means a UK film wholly or partly financed and controlled by a US studio but featuring UK cast, crew, locations, facilities, post-production and often UK source material.
13
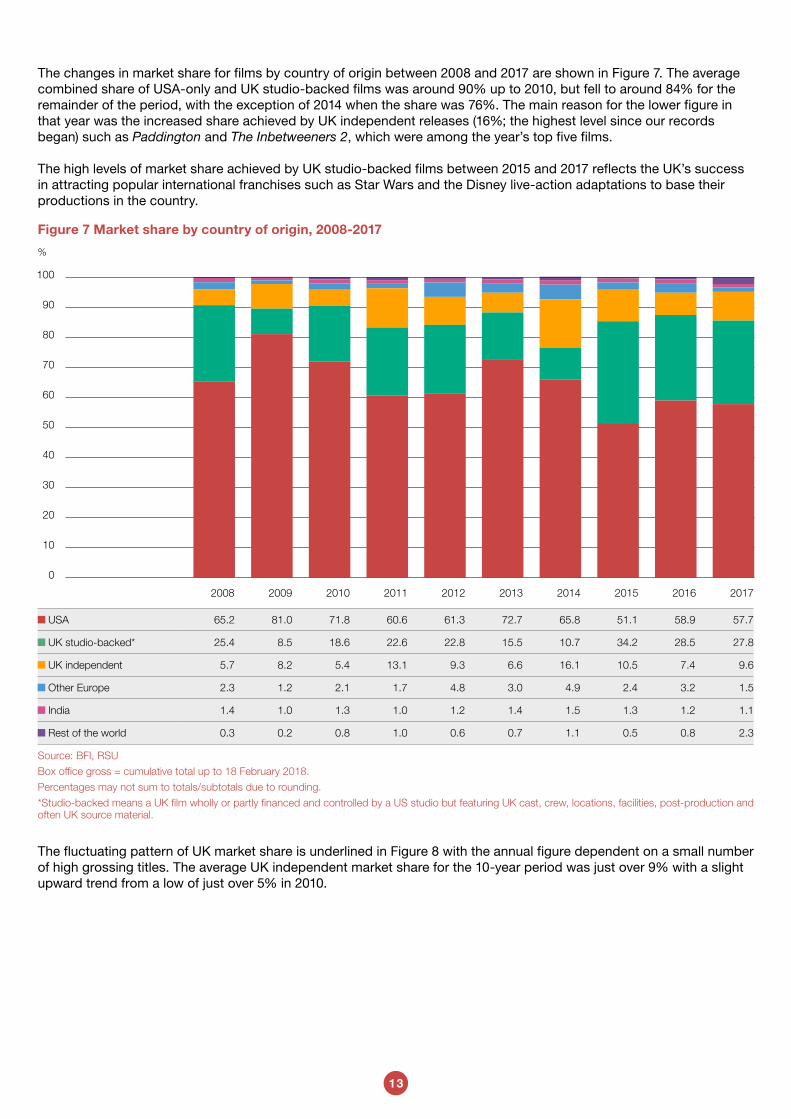
The changes in market share for films by country of origin between 2008 and 2017 are shown in Figure 7. The average combined share of USA-only and UK studio-backed films was around 90% up to 2010, but fell to around 84% for the remainder of the period, with the exception of 2014 when the share was 76%. The main reason for the lower figure in that year was the increased share achieved by UK independent releases (16%; the highest level since our records began) such as Paddington and The Inbetweeners 2, which were among the year’s top five films.
The high levels of market share achieved by UK studio-backed films between 2015 and 2017 reflects the UK’s success in attracting popular international franchises such as Star Wars and the Disney live-action adaptations to base their productions in the country.
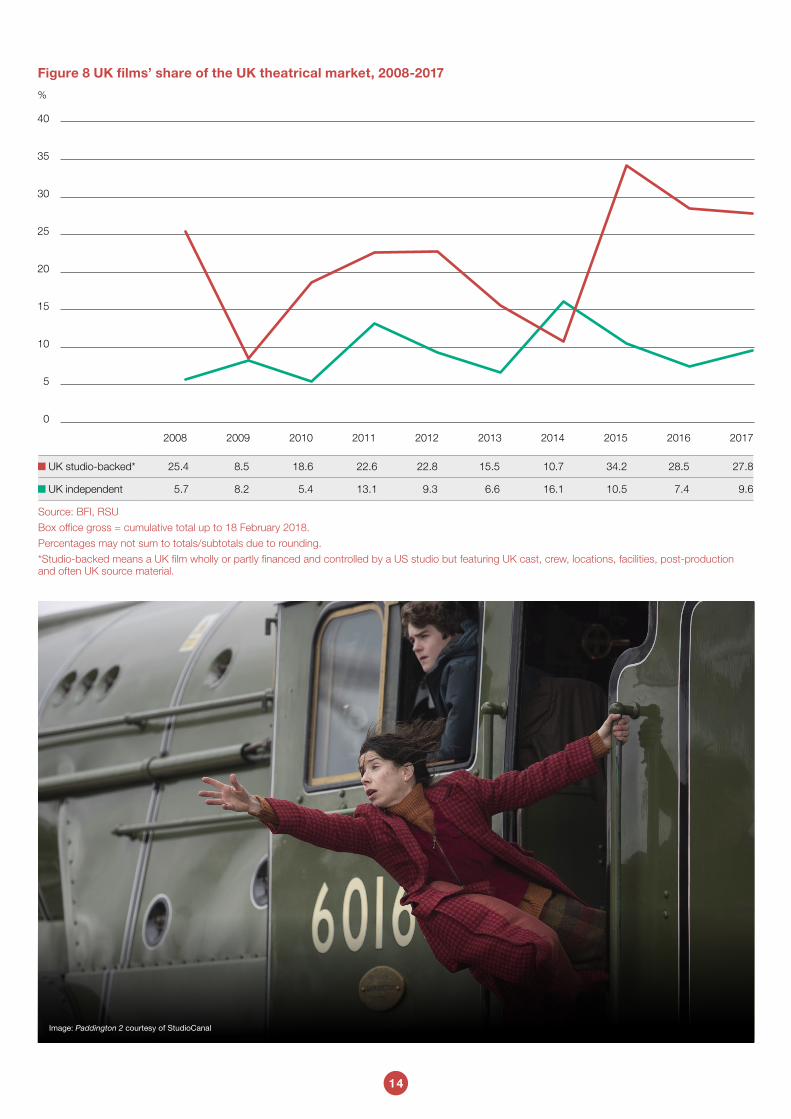
The fluctuating pattern of UK market share is underlined in Figure 8 with the annual figure dependent on a small number of high grossing titles. The average UK independent market share for the 10-year period was just over 9% with a slight upward trend from a low of just over 5% in 2010.
%
USA 65.2 81.0 71.8 60.6 61.3 72.7 65.8 51.1 58.9 57.7
UK studio-backed* 25.4 8.5 18.6 22.6 22.8 15.5 10.7 34.2 28.5 27.8
UK independent 5.7 8.2 5.4 13.1 9.3 6.6 16.1 10.5 7.4 9.6
Other Europe 2.3 1.2 2.1 1.7 4.8 3.0 4.9 2.4 3.2 1.5
India 1.4 1.0 1.3 1.0 1.2 1.4 1.5 1.3 1.2 1.1
Rest of the world 0.3 0.2 0.8 1.0 0.6 0.7 1.1 0.5 0.8 2.3
Source: BFI, RSU
Box office gross = cumulative total up to 18 February 2018.
Percentages may not sum to totals/subtotals due to rounding.
*Studio-backed means a UK film wholly or partly financed and controlled by a US studio but featuring UK cast, crew, locations, facilities, post-production and often UK source material.
0
10
20
30
40
50
60
70
80
90
100
2017201620152014201320122011201020092008
Figure 7 Market share by country of origin, 2008-2017
14
Figure 8 UK films’ share of the UK theatrical market, 2008-2017
%
UK studio-backed* 25.4 8.5 18.6 22.6 22.8 15.5 10.7 34.2 28.5 27.8
UK independent 5.7 8.2 5.4 13.1 9.3 6.6 16.1 10.5 7.4 9.6
Source: BFI, RSU
Box office gross = cumulative total up to 18 February 2018.
Percentages may not sum to totals/subtotals due to rounding.
*Studio-backed means a UK film wholly or partly financed and controlled by a US studio but featuring UK cast, crew, locations, facilities, post-production and often UK source material.
0
5
10
15
20
25
30
35
40
2017201620152014201320122011201020092008
Image: Paddington 2 courtesy of StudioCanal
15
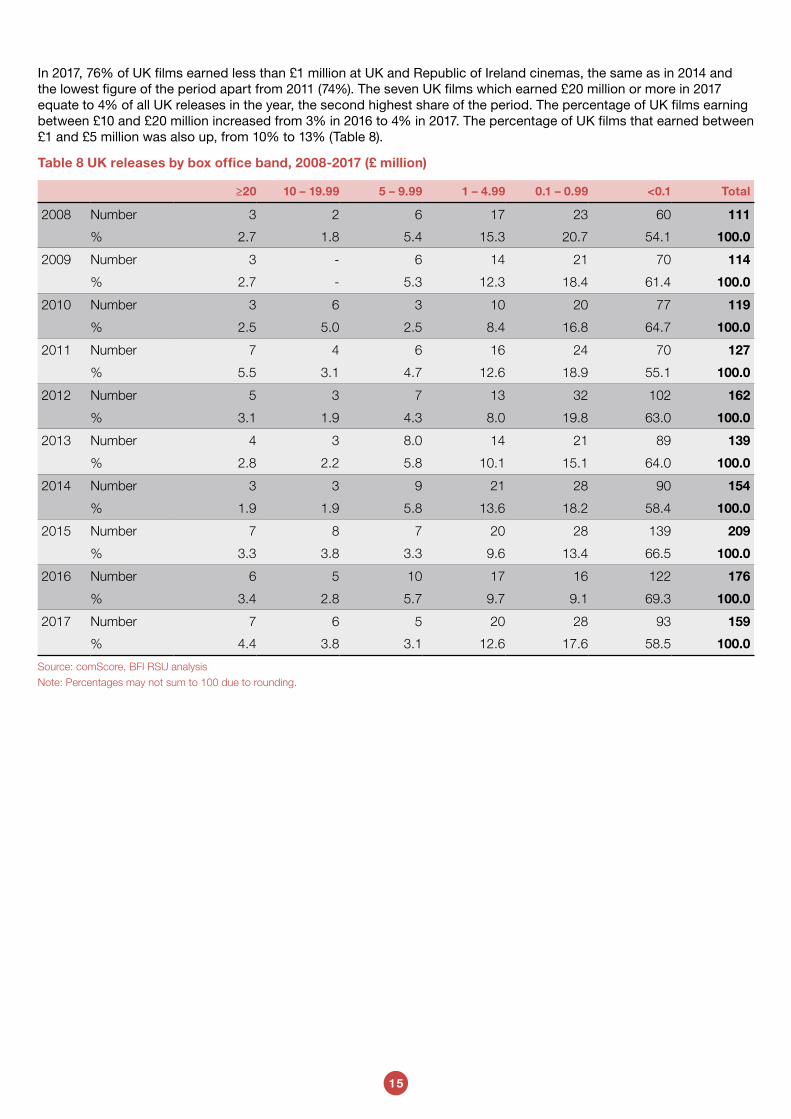
In 2017, 76% of UK films earned less than £1 million at UK and Republic of Ireland cinemas, the same as in 2014 and the lowest figure of the period apart from 2011 (74%). The seven UK films which earned £20 million or more in 2017 equate to 4% of all UK releases in the year, the second highest share of the period. The percentage of UK films earning between £10 and £20 million increased from 3% in 2016 to 4% in 2017. The percentage of UK films that earned between £1 and £5 million was also up, from 10% to 13% (Table 8).
Table 8 UK releases by box office band, 2008-2017 (£ million)
≥20 10 – 19.99 5 – 9.99 1 – 4.99 0.1 – 0.99 <0.1 Total
2008 Number 3 2 6 17 23 60 111
% 2.7 1.8 5.4 15.3 20.7 54.1 100.0
2009 Number 3 - 6 14 21 70 114
% 2.7 - 5.3 12.3 18.4 61.4 100.0
2010 Number 3 6 3 10 20 77 119
% 2.5 5.0 2.5 8.4 16.8 64.7 100.0
2011 Number 7 4 6 16 24 70 127
% 5.5 3.1 4.7 12.6 18.9 55.1 100.0
2012 Number 5 3 7 13 32 102 162
% 3.1 1.9 4.3 8.0 19.8 63.0 100.0
2013 Number 4 3 8.0 14 21 89 139
% 2.8 2.2 5.8 10.1 15.1 64.0 100.0
2014 Number 3 3 9 21 28 90 154
% 1.9 1.9 5.8 13.6 18.2 58.4 100.0
2015 Number 7 8 7 20 28 139 209
% 3.3 3.8 3.3 9.6 13.4 66.5 100.0
2016 Number 6 5 10 17 16 122 176
% 3.4 2.8 5.7 9.7 9.1 69.3 100.0
2017 Number 7 6 5 20 28 93 159
% 4.4 3.8 3.1 12.6 17.6 58.5 100.0
Source: comScore, BFI RSU analysis
Note: Percentages may not sum to 100 due to rounding.
16
TOP FILMS AT THE BOX OFFICE
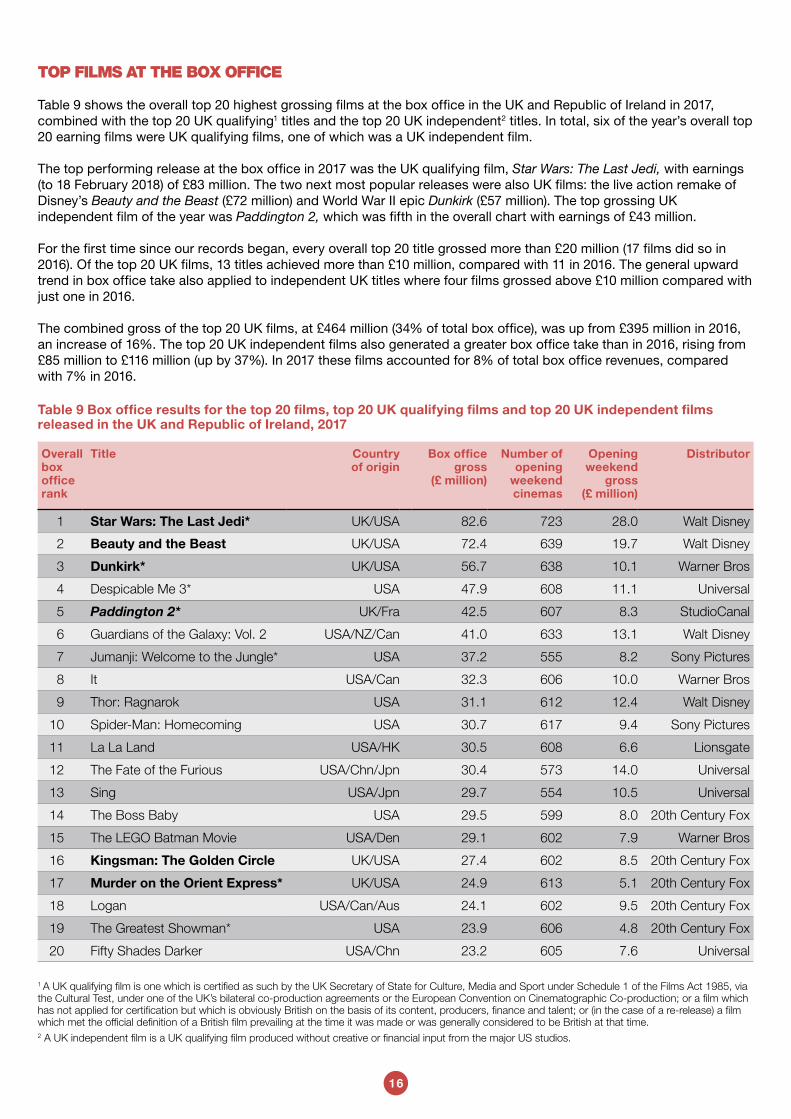
Table 9 shows the overall top 20 highest grossing films at the box office in the UK and Republic of Ireland in 2017, combined with the top 20 UK qualifying1 titles and the top 20 UK independent2 titles. In total, six of the year’s overall top 20 earning films were UK qualifying films, one of which was a UK independent film.
The top performing release at the box office in 2017 was the UK qualifying film, Star Wars: The Last Jedi, with earnings (to 18 February 2018) of £83 million. The two next most popular releases were also UK films: the live action remake of Disney’s Beauty and the Beast (£72 million) and World War II epic Dunkirk (£57 million). The top grossing UK independent film of the year was Paddington 2, which was fifth in the overall chart with earnings of £43 million.
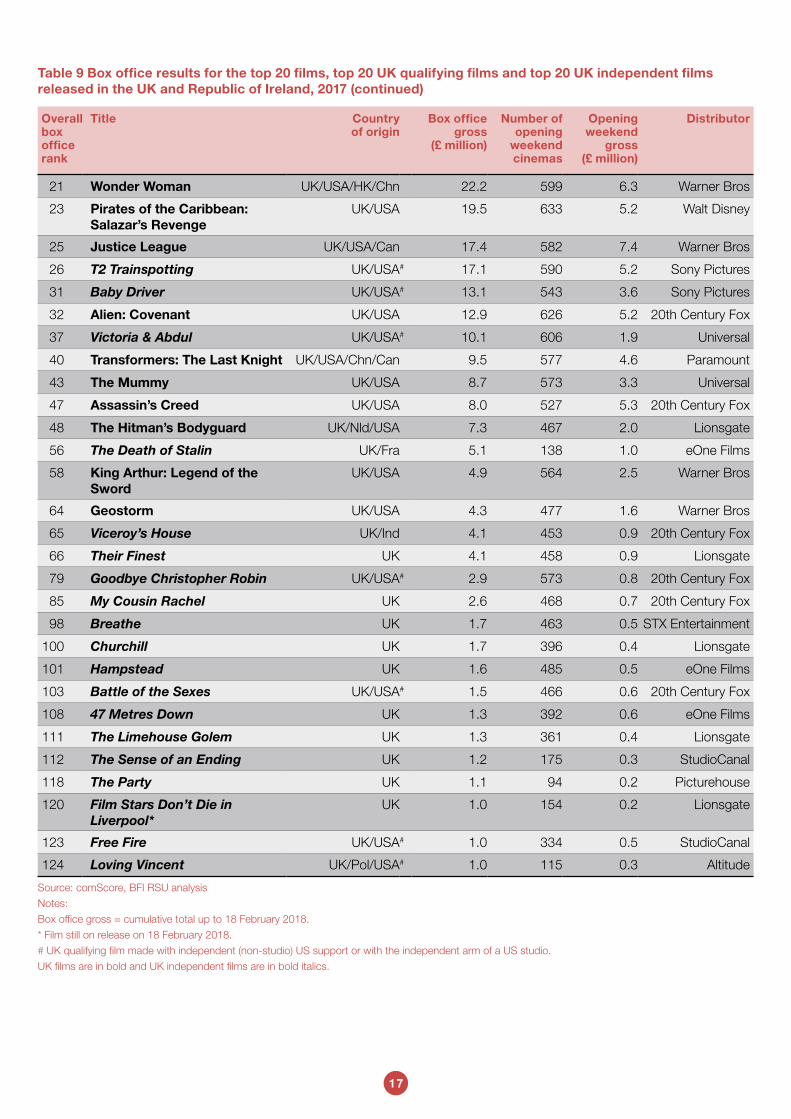
For the first time since our records began, every overall top 20 title grossed more than £20 million (17 films did so in 2016). Of the top 20 UK films, 13 titles achieved more than £10 million, compared with 11 in 2016. The general upward trend in box office take also applied to independent UK titles where four films grossed above £10 million compared with just one in 2016.
The combined gross of the top 20 UK films, at £464 million (34% of total box office), was up from £395 million in 2016, an increase of 16%. The top 20 UK independent films also generated a greater box office take than in 2016, rising from £85 million to £116 million (up by 37%). In 2017 these films accounted for 8% of total box office revenues, compared with 7% in 2016.
Table 9 Box office results for the top 20 films, top 20 UK qualifying films and top 20 UK independent films released in the UK and Republic of Ireland, 2017
Overall box office rank
Title Country of origin
Box office gross
(£ million)
Number of opening
weekend cinemas
Opening weekend
gross (£ million)
Distributor
1 Star Wars: The Last Jedi* UK/USA 82.6 723 28.0 Walt Disney
2 Beauty and the Beast UK/USA 72.4 639 19.7 Walt Disney
3 Dunkirk* UK/USA 56.7 638 10.1 Warner Bros
4 Despicable Me 3* USA 47.9 608 11.1 Universal
5 Paddington 2* UK/Fra 42.5 607 8.3 StudioCanal
6 Guardians of the Galaxy: Vol. 2 USA/NZ/Can 41.0 633 13.1 Walt Disney
7 Jumanji: Welcome to the Jungle* USA 37.2 555 8.2 Sony Pictures
8 It USA/Can 32.3 606 10.0 Warner Bros
9 Thor: Ragnarok USA 31.1 612 12.4 Walt Disney
10 Spider-Man: Homecoming USA 30.7 617 9.4 Sony Pictures
11 La La Land USA/HK 30.5 608 6.6 Lionsgate
12 The Fate of the Furious USA/Chn/Jpn 30.4 573 14.0 Universal
13 Sing USA/Jpn 29.7 554 10.5 Universal
14 The Boss Baby USA 29.5 599 8.0 20th Century Fox
15 The LEGO Batman Movie USA/Den 29.1 602 7.9 Warner Bros
16 Kingsman: The Golden Circle UK/USA 27.4 602 8.5 20th Century Fox
17 Murder on the Orient Express* UK/USA 24.9 613 5.1 20th Century Fox
18 Logan USA/Can/Aus 24.1 602 9.5 20th Century Fox
19 The Greatest Showman* USA 23.9 606 4.8 20th Century Fox
20 Fifty Shades Darker USA/Chn 23.2 605 7.6 Universal
1 A UK qualifying film is one which is certified as such by the UK Secretary of State for Culture, Media and Sport under Schedule 1 of the Films Act 1985, via the Cultural Test, under one of the UK’s bilateral co-production agreements or the European Convention on Cinematographic Co-production; or a film which has not applied for certification but which is obviously British on the basis of its content, producers, finance and talent; or (in the case of a re-release) a film which met the official definition of a British film prevailing at the time it was made or was generally considered to be British at that time.2 A UK independent film is a UK qualifying film produced without creative or financial input from the major US studios.
17
Overall box office rank
Title Country of origin
Box office gross
(£ million)
Number of opening
weekend cinemas
Opening weekend
gross (£ million)
Distributor
21 Wonder Woman UK/USA/HK/Chn 22.2 599 6.3 Warner Bros
23 Pirates of the Caribbean: Salazar’s Revenge
UK/USA 19.5 633 5.2 Walt Disney
25 Justice League UK/USA/Can 17.4 582 7.4 Warner Bros
26 T2 Trainspotting UK/USA# 17.1 590 5.2 Sony Pictures
31 Baby Driver UK/USA# 13.1 543 3.6 Sony Pictures
32 Alien: Covenant UK/USA 12.9 626 5.2 20th Century Fox
37 Victoria & Abdul UK/USA# 10.1 606 1.9 Universal
40 Transformers: The Last Knight UK/USA/Chn/Can 9.5 577 4.6 Paramount
43 The Mummy UK/USA 8.7 573 3.3 Universal
47 Assassin’s Creed UK/USA 8.0 527 5.3 20th Century Fox
48 The Hitman’s Bodyguard UK/Nld/USA 7.3 467 2.0 Lionsgate
56 The Death of Stalin UK/Fra 5.1 138 1.0 eOne Films
58 King Arthur: Legend of the Sword
UK/USA 4.9 564 2.5 Warner Bros
64 Geostorm UK/USA 4.3 477 1.6 Warner Bros
65 Viceroy’s House UK/Ind 4.1 453 0.9 20th Century Fox
66 Their Finest UK 4.1 458 0.9 Lionsgate
79 Goodbye Christopher Robin UK/USA# 2.9 573 0.8 20th Century Fox
85 My Cousin Rachel UK 2.6 468 0.7 20th Century Fox
98 Breathe UK 1.7 463 0.5 STX Entertainment
100 Churchill UK 1.7 396 0.4 Lionsgate
101 Hampstead UK 1.6 485 0.5 eOne Films
103 Battle of the Sexes UK/USA# 1.5 466 0.6 20th Century Fox
108 47 Metres Down UK 1.3 392 0.6 eOne Films
111 The Limehouse Golem UK 1.3 361 0.4 Lionsgate
112 The Sense of an Ending UK 1.2 175 0.3 StudioCanal
118 The Party UK 1.1 94 0.2 Picturehouse
120 Film Stars Don’t Die in Liverpool*
UK 1.0 154 0.2 Lionsgate
123 Free Fire UK/USA# 1.0 334 0.5 StudioCanal
124 Loving Vincent UK/Pol/USA# 1.0 115 0.3 Altitude
Source: comScore, BFI RSU analysis
Notes:
Box office gross = cumulative total up to 18 February 2018.
* Film still on release on 18 February 2018.
# UK qualifying film made with independent (non-studio) US support or with the independent arm of a US studio.
UK films are in bold and UK independent films are in bold italics.
Table 9 Box office results for the top 20 films, top 20 UK qualifying films and top 20 UK independent films released in the UK and Republic of Ireland, 2017 (continued)
18
THE TOP 3D FILMS
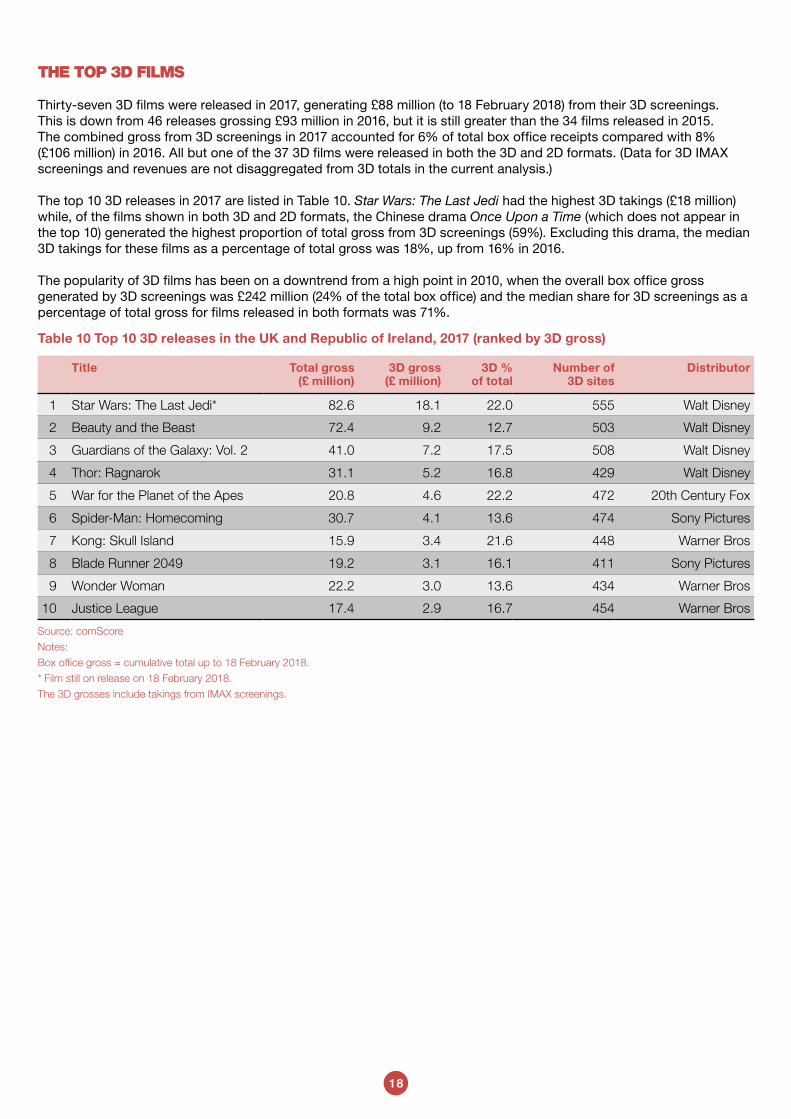
Thirty-seven 3D films were released in 2017, generating £88 million (to 18 February 2018) from their 3D screenings. This is down from 46 releases grossing £93 million in 2016, but it is still greater than the 34 films released in 2015. The combined gross from 3D screenings in 2017 accounted for 6% of total box office receipts compared with 8% (£106 million) in 2016. All but one of the 37 3D films were released in both the 3D and 2D formats. (Data for 3D IMAX screenings and revenues are not disaggregated from 3D totals in the current analysis.)
The top 10 3D releases in 2017 are listed in Table 10. Star Wars: The Last Jedi had the highest 3D takings (£18 million) while, of the films shown in both 3D and 2D formats, the Chinese drama Once Upon a Time (which does not appear in the top 10) generated the highest proportion of total gross from 3D screenings (59%). Excluding this drama, the median 3D takings for these films as a percentage of total gross was 18%, up from 16% in 2016.
The popularity of 3D films has been on a downtrend from a high point in 2010, when the overall box office gross generated by 3D screenings was £242 million (24% of the total box office) and the median share for 3D screenings as a percentage of total gross for films released in both formats was 71%.
Table 10 Top 10 3D releases in the UK and Republic of Ireland, 2017 (ranked by 3D gross)
Title Total gross (£ million)
3D gross (£ million)
3D % of total
Number of 3D sites
Distributor
1 Star Wars: The Last Jedi* 82.6 18.1 22.0 555 Walt Disney
2 Beauty and the Beast 72.4 9.2 12.7 503 Walt Disney
3 Guardians of the Galaxy: Vol. 2 41.0 7.2 17.5 508 Walt Disney
4 Thor: Ragnarok 31.1 5.2 16.8 429 Walt Disney
5 War for the Planet of the Apes 20.8 4.6 22.2 472 20th Century Fox
6 Spider-Man: Homecoming 30.7 4.1 13.6 474 Sony Pictures
7 Kong: Skull Island 15.9 3.4 21.6 448 Warner Bros
8 Blade Runner 2049 19.2 3.1 16.1 411 Sony Pictures
9 Wonder Woman 22.2 3.0 13.6 434 Warner Bros
10 Justice League 17.4 2.9 16.7 454 Warner Bros
Source: comScore
Notes:
Box office gross = cumulative total up to 18 February 2018.
* Film still on release on 18 February 2018.
The 3D grosses include takings from IMAX screenings.
19
BEST WEEKEND PERFORMANCE OF UK FILMS
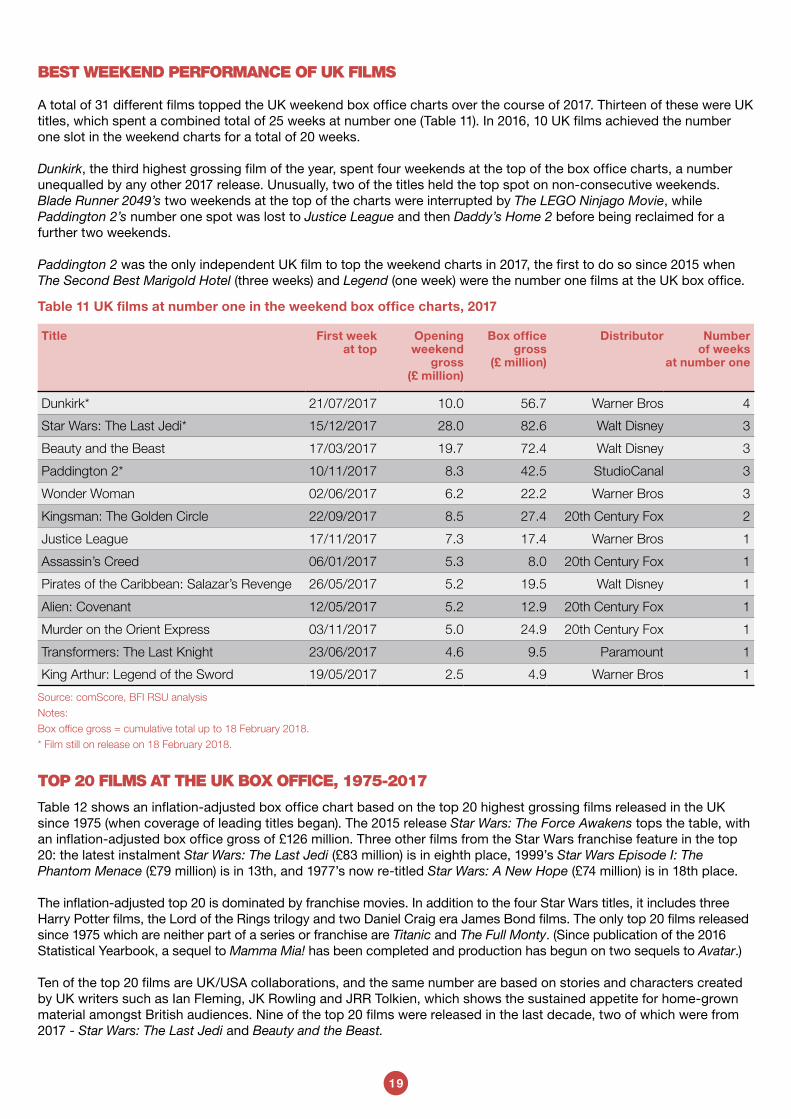
A total of 31 different films topped the UK weekend box office charts over the course of 2017. Thirteen of these were UK titles, which spent a combined total of 25 weeks at number one (Table 11). In 2016, 10 UK films achieved the number one slot in the weekend charts for a total of 20 weeks.
Dunkirk, the third highest grossing film of the year, spent four weekends at the top of the box office charts, a number unequalled by any other 2017 release. Unusually, two of the titles held the top spot on non-consecutive weekends. Blade Runner 2049’s two weekends at the top of the charts were interrupted by The LEGO Ninjago Movie, while Paddington 2’s number one spot was lost to Justice League and then Daddy’s Home 2 before being reclaimed for a further two weekends.
Paddington 2 was the only independent UK film to top the weekend charts in 2017, the first to do so since 2015 when The Second Best Marigold Hotel (three weeks) and Legend (one week) were the number one films at the UK box office.
Table 11 UK films at number one in the weekend box office charts, 2017
Title First week at top
Opening weekend
gross (£ million)
Box office gross
(£ million)
Distributor Number of weeks
at number one
Dunkirk* 21/07/2017 10.0 56.7 Warner Bros 4
Star Wars: The Last Jedi* 15/12/2017 28.0 82.6 Walt Disney 3
Beauty and the Beast 17/03/2017 19.7 72.4 Walt Disney 3
Paddington 2* 10/11/2017 8.3 42.5 StudioCanal 3
Wonder Woman 02/06/2017 6.2 22.2 Warner Bros 3
Kingsman: The Golden Circle 22/09/2017 8.5 27.4 20th Century Fox 2
Justice League 17/11/2017 7.3 17.4 Warner Bros 1
Assassin’s Creed 06/01/2017 5.3 8.0 20th Century Fox 1
Pirates of the Caribbean: Salazar’s Revenge 26/05/2017 5.2 19.5 Walt Disney 1
Alien: Covenant 12/05/2017 5.2 12.9 20th Century Fox 1
Murder on the Orient Express 03/11/2017 5.0 24.9 20th Century Fox 1
Transformers: The Last Knight 23/06/2017 4.6 9.5 Paramount 1
King Arthur: Legend of the Sword 19/05/2017 2.5 4.9 Warner Bros 1
Source: comScore, BFI RSU analysis
Notes:
Box office gross = cumulative total up to 18 February 2018.
* Film still on release on 18 February 2018.
TOP 20 FILMS AT THE UK BOX OFFICE, 1975-2017
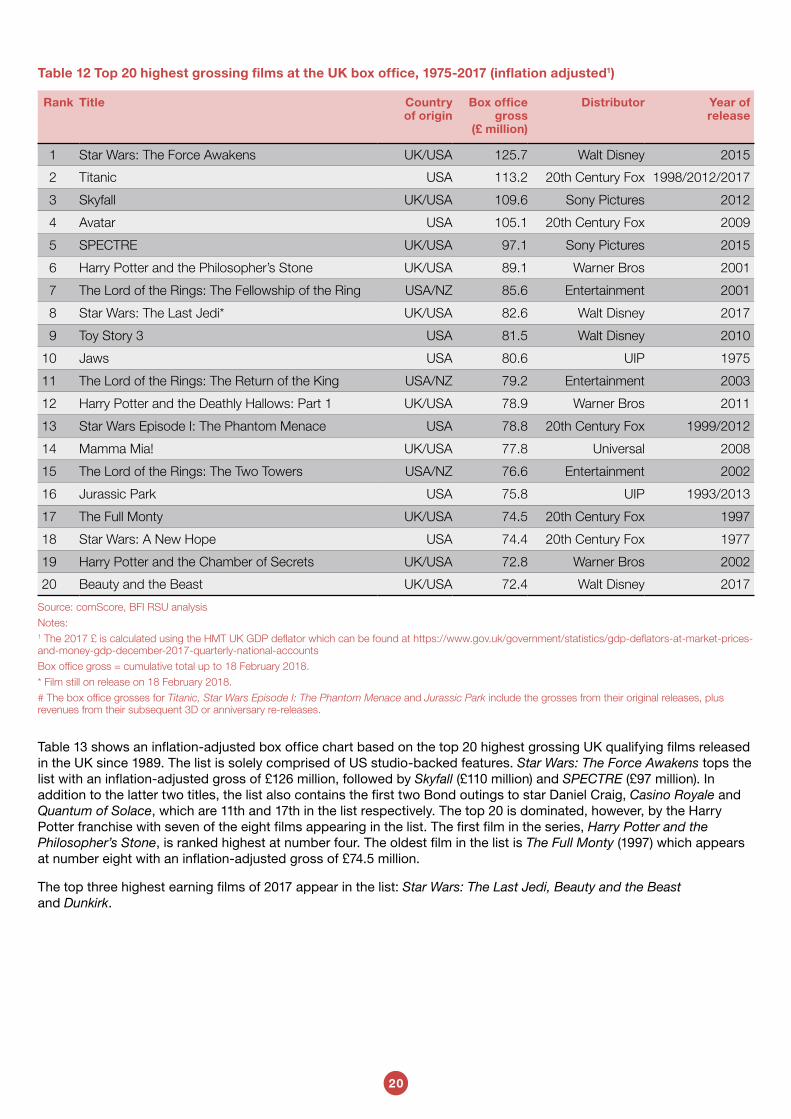
Table 12 shows an inflation-adjusted box office chart based on the top 20 highest grossing films released in the UK since 1975 (when coverage of leading titles began). The 2015 release Star Wars: The Force Awakens tops the table, with an inflation-adjusted box office gross of £126 million. Three other films from the Star Wars franchise feature in the top 20: the latest instalment Star Wars: The Last Jedi (£83 million) is in eighth place, 1999’s Star Wars Episode I: The Phantom Menace (£79 million) is in 13th, and 1977’s now re-titled Star Wars: A New Hope (£74 million) is in 18th place.
The inflation-adjusted top 20 is dominated by franchise movies. In addition to the four Star Wars titles, it includes three Harry Potter films, the Lord of the Rings trilogy and two Daniel Craig era James Bond films. The only top 20 films released since 1975 which are neither part of a series or franchise are Titanic and The Full Monty. (Since publication of the 2016 Statistical Yearbook, a sequel to Mamma Mia! has been completed and production has begun on two sequels to Avatar.)
Ten of the top 20 films are UK/USA collaborations, and the same number are based on stories and characters created by UK writers such as Ian Fleming, JK Rowling and JRR Tolkien, which shows the sustained appetite for home-grown material amongst British audiences. Nine of the top 20 films were released in the last decade, two of which were from 2017 - Star Wars: The Last Jedi and Beauty and the Beast.
20
Table 12 Top 20 highest grossing films at the UK box office, 1975-2017 (inflation adjusted1)
Rank Title Country of origin
Box office gross
(£ million)
Distributor Year of release
1 Star Wars: The Force Awakens UK/USA 125.7 Walt Disney 2015
2 Titanic USA 113.2 20th Century Fox 1998/2012/2017
3 Skyfall UK/USA 109.6 Sony Pictures 2012
4 Avatar USA 105.1 20th Century Fox 2009
5 SPECTRE UK/USA 97.1 Sony Pictures 2015
6 Harry Potter and the Philosopher’s Stone UK/USA 89.1 Warner Bros 2001
7 The Lord of the Rings: The Fellowship of the Ring USA/NZ 85.6 Entertainment 2001
8 Star Wars: The Last Jedi* UK/USA 82.6 Walt Disney 2017
9 Toy Story 3 USA 81.5 Walt Disney 2010
10 Jaws USA 80.6 UIP 1975
11 The Lord of the Rings: The Return of the King USA/NZ 79.2 Entertainment 2003
12 Harry Potter and the Deathly Hallows: Part 1 UK/USA 78.9 Warner Bros 2011
13 Star Wars Episode I: The Phantom Menace USA 78.8 20th Century Fox 1999/2012
14 Mamma Mia! UK/USA 77.8 Universal 2008
15 The Lord of the Rings: The Two Towers USA/NZ 76.6 Entertainment 2002
16 Jurassic Park USA 75.8 UIP 1993/2013
17 The Full Monty UK/USA 74.5 20th Century Fox 1997
18 Star Wars: A New Hope USA 74.4 20th Century Fox 1977
19 Harry Potter and the Chamber of Secrets UK/USA 72.8 Warner Bros 2002
20 Beauty and the Beast UK/USA 72.4 Walt Disney 2017
Source: comScore, BFI RSU analysis
Notes:1 The 2017 £ is calculated using the HMT UK GDP deflator which can be found at https://www.gov.uk/government/statistics/gdp-deflators-at-market-prices-and-money-gdp-december-2017-quarterly-national-accounts
Box office gross = cumulative total up to 18 February 2018.
* Film still on release on 18 February 2018.
# The box office grosses for Titanic, Star Wars Episode I: The Phantom Menace and Jurassic Park include the grosses from their original releases, plus revenues from their subsequent 3D or anniversary re-releases.
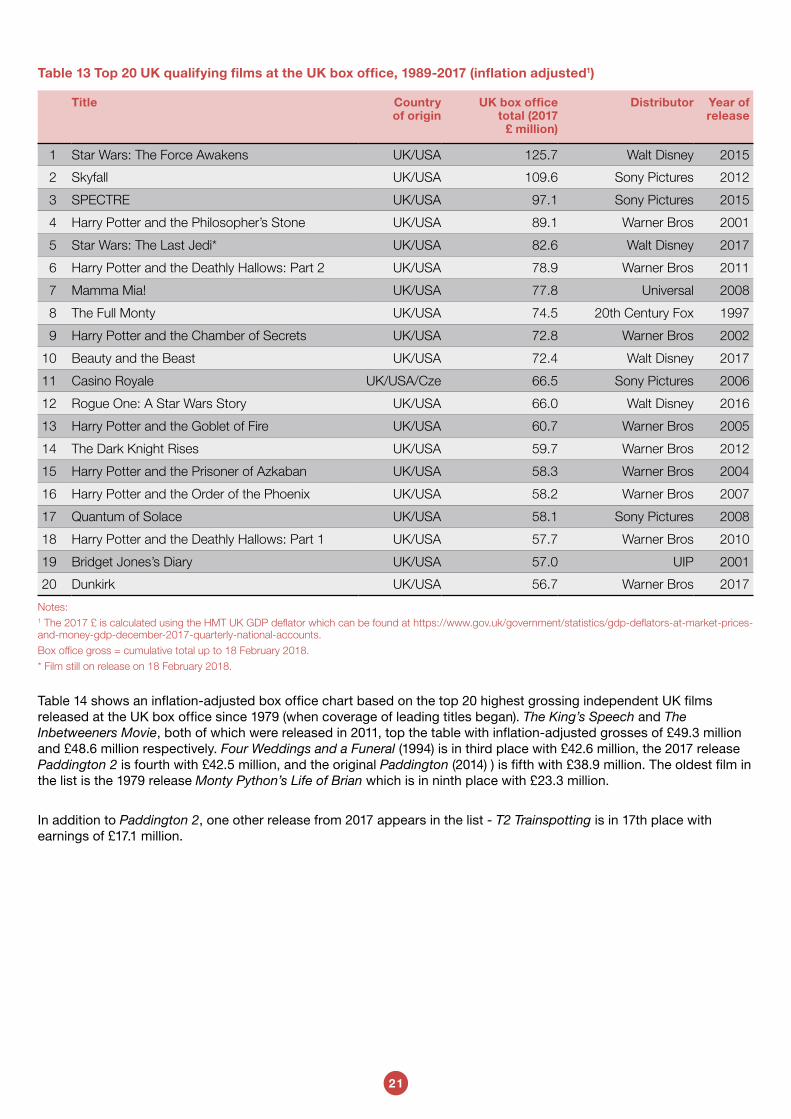
Table 13 shows an inflation-adjusted box office chart based on the top 20 highest grossing UK qualifying films released in the UK since 1989. The list is solely comprised of US studio-backed features. Star Wars: The Force Awakens tops the list with an inflation-adjusted gross of £126 million, followed by Skyfall (£110 million) and SPECTRE (£97 million). In addition to the latter two titles, the list also contains the first two Bond outings to star Daniel Craig, Casino Royale and Quantum of Solace, which are 11th and 17th in the list respectively. The top 20 is dominated, however, by the Harry Potter franchise with seven of the eight films appearing in the list. The first film in the series, Harry Potter and the Philosopher’s Stone, is ranked highest at number four. The oldest film in the list is The Full Monty (1997) which appears at number eight with an inflation-adjusted gross of £74.5 million.
The top three highest earning films of 2017 appear in the list: Star Wars: The Last Jedi, Beauty and the Beast and Dunkirk.
21
Table 13 Top 20 UK qualifying films at the UK box office, 1989-2017 (inflation adjusted1)
Title Country of origin
UK box office total (2017
£ million)
Distributor Year of release
1 Star Wars: The Force Awakens UK/USA 125.7 Walt Disney 2015
2 Skyfall UK/USA 109.6 Sony Pictures 2012
3 SPECTRE UK/USA 97.1 Sony Pictures 2015
4 Harry Potter and the Philosopher’s Stone UK/USA 89.1 Warner Bros 2001
5 Star Wars: The Last Jedi* UK/USA 82.6 Walt Disney 2017
6 Harry Potter and the Deathly Hallows: Part 2 UK/USA 78.9 Warner Bros 2011
7 Mamma Mia! UK/USA 77.8 Universal 2008
8 The Full Monty UK/USA 74.5 20th Century Fox 1997
9 Harry Potter and the Chamber of Secrets UK/USA 72.8 Warner Bros 2002
10 Beauty and the Beast UK/USA 72.4 Walt Disney 2017
11 Casino Royale UK/USA/Cze 66.5 Sony Pictures 2006
12 Rogue One: A Star Wars Story UK/USA 66.0 Walt Disney 2016
13 Harry Potter and the Goblet of Fire UK/USA 60.7 Warner Bros 2005
14 The Dark Knight Rises UK/USA 59.7 Warner Bros 2012
15 Harry Potter and the Prisoner of Azkaban UK/USA 58.3 Warner Bros 2004
16 Harry Potter and the Order of the Phoenix UK/USA 58.2 Warner Bros 2007
17 Quantum of Solace UK/USA 58.1 Sony Pictures 2008
18 Harry Potter and the Deathly Hallows: Part 1 UK/USA 57.7 Warner Bros 2010
19 Bridget Jones’s Diary UK/USA 57.0 UIP 2001
20 Dunkirk UK/USA 56.7 Warner Bros 2017
Notes:1 The 2017 £ is calculated using the HMT UK GDP deflator which can be found at https://www.gov.uk/government/statistics/gdp-deflators-at-market-prices-and-money-gdp-december-2017-quarterly-national-accounts.
Box office gross = cumulative total up to 18 February 2018.
* Film still on release on 18 February 2018.
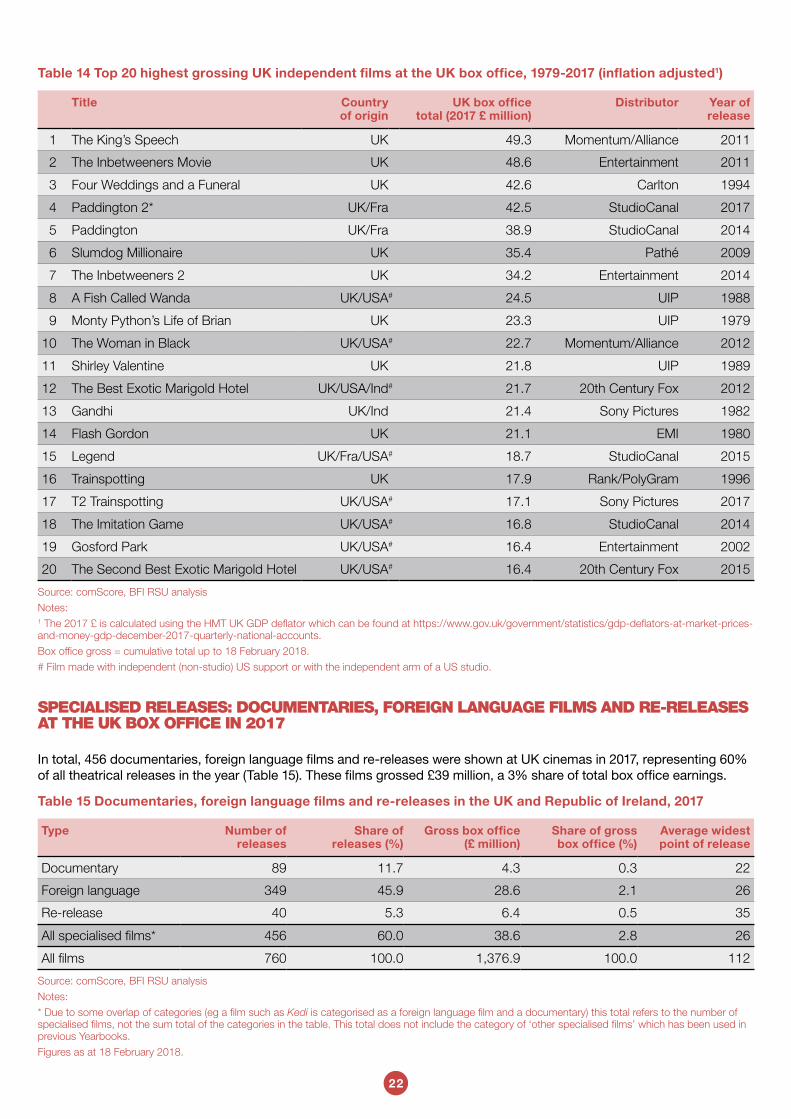
Table 14 shows an inflation-adjusted box office chart based on the top 20 highest grossing independent UK films released at the UK box office since 1979 (when coverage of leading titles began). The King’s Speech and The Inbetweeners Movie, both of which were released in 2011, top the table with inflation-adjusted grosses of £49.3 million and £48.6 million respectively. Four Weddings and a Funeral (1994) is in third place with £42.6 million, the 2017 release Paddington 2 is fourth with £42.5 million, and the original Paddington (2014) ) is fifth with £38.9 million. The oldest film in the list is the 1979 release Monty Python’s Life of Brian which is in ninth place with £23.3 million.
In addition to Paddington 2, one other release from 2017 appears in the list - T2 Trainspotting is in 17th place with earnings of £17.1 million.
22
Table 14 Top 20 highest grossing UK independent films at the UK box office, 1979-2017 (inflation adjusted1)
Title Country of origin
UK box office total (2017 £ million)
Distributor Year of release
1 The King’s Speech UK 49.3 Momentum/Alliance 2011
2 The Inbetweeners Movie UK 48.6 Entertainment 2011
3 Four Weddings and a Funeral UK 42.6 Carlton 1994
4 Paddington 2* UK/Fra 42.5 StudioCanal 2017
5 Paddington UK/Fra 38.9 StudioCanal 2014
6 Slumdog Millionaire UK 35.4 Pathé 2009
7 The Inbetweeners 2 UK 34.2 Entertainment 2014
8 A Fish Called Wanda UK/USA# 24.5 UIP 1988
9 Monty Python’s Life of Brian UK 23.3 UIP 1979
10 The Woman in Black UK/USA# 22.7 Momentum/Alliance 2012
11 Shirley Valentine UK 21.8 UIP 1989
12 The Best Exotic Marigold Hotel UK/USA/Ind# 21.7 20th Century Fox 2012
13 Gandhi UK/Ind 21.4 Sony Pictures 1982
14 Flash Gordon UK 21.1 EMI 1980
15 Legend UK/Fra/USA# 18.7 StudioCanal 2015
16 Trainspotting UK 17.9 Rank/PolyGram 1996
17 T2 Trainspotting UK/USA# 17.1 Sony Pictures 2017
18 The Imitation Game UK/USA# 16.8 StudioCanal 2014
19 Gosford Park UK/USA# 16.4 Entertainment 2002
20 The Second Best Exotic Marigold Hotel UK/USA# 16.4 20th Century Fox 2015
Source: comScore, BFI RSU analysis
Notes:1 The 2017 £ is calculated using the HMT UK GDP deflator which can be found at https://www.gov.uk/government/statistics/gdp-deflators-at-market-prices-and-money-gdp-december-2017-quarterly-national-accounts.
Box office gross = cumulative total up to 18 February 2018.
# Film made with independent (non-studio) US support or with the independent arm of a US studio.
SPECIALISED RELEASES: DOCUMENTARIES, FOREIGN LANGUAGE FILMS AND RE-RELEASES AT THE UK BOX OFFICE IN 2017
In total, 456 documentaries, foreign language films and re-releases were shown at UK cinemas in 2017, representing 60% of all theatrical releases in the year (Table 15). These films grossed £39 million, a 3% share of total box office earnings.
Table 15 Documentaries, foreign language films and re-releases in the UK and Republic of Ireland, 2017
Type Number of releases
Share of releases (%)
Gross box office (£ million)
Share of gross box office (%)
Average widest point of release
Documentary 89 11.7 4.3 0.3 22
Foreign language 349 45.9 28.6 2.1 26
Re-release 40 5.3 6.4 0.5 35
All specialised films* 456 60.0 38.6 2.8 26
All films 760 100.0 1,376.9 100.0 112
Source: comScore, BFI RSU analysis
Notes:
* Due to some overlap of categories (eg a film such as Kedi is categorised as a foreign language film and a documentary) this total refers to the number of specialised films, not the sum total of the categories in the table. This total does not include the category of ‘other specialised films’ which has been used in previous Yearbooks.
Figures as at 18 February 2018.
23
TRENDS IN SPECIALISED FILM
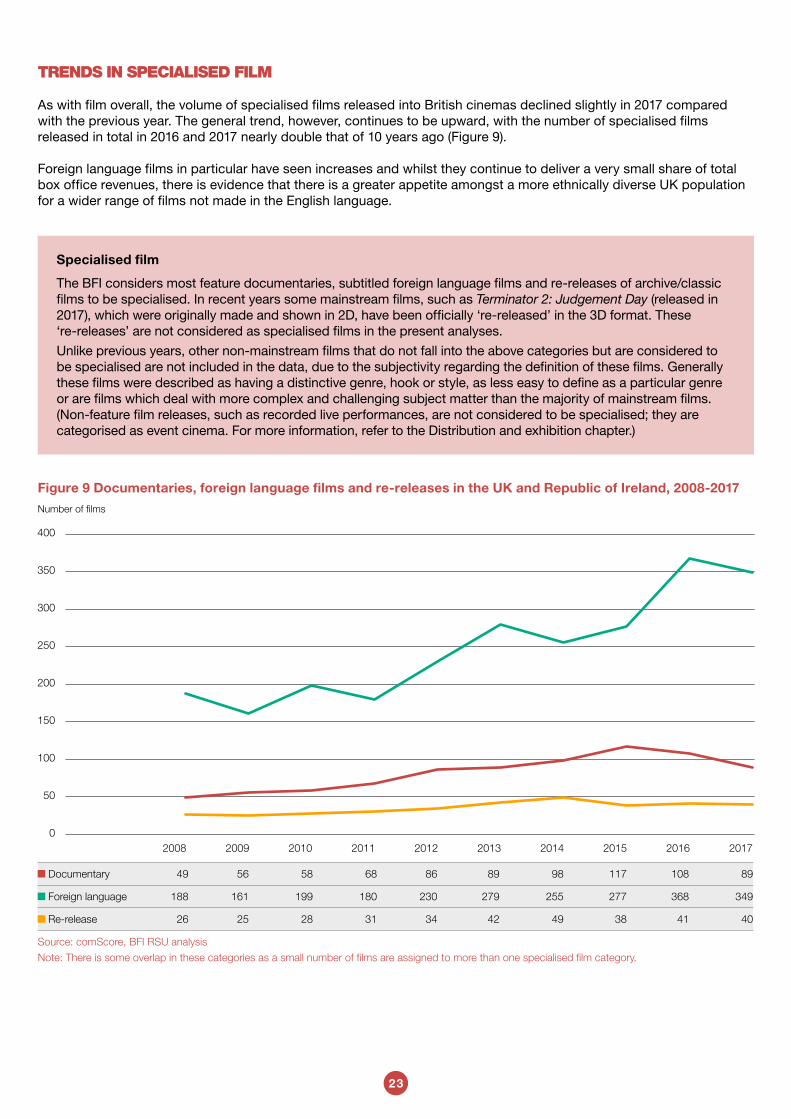
As with film overall, the volume of specialised films released into British cinemas declined slightly in 2017 compared with the previous year. The general trend, however, continues to be upward, with the number of specialised films released in total in 2016 and 2017 nearly double that of 10 years ago (Figure 9).
Foreign language films in particular have seen increases and whilst they continue to deliver a very small share of total box office revenues, there is evidence that there is a greater appetite amongst a more ethnically diverse UK population for a wider range of films not made in the English language.
Specialised film
The BFI considers most feature documentaries, subtitled foreign language films and re-releases of archive/classic films to be specialised. In recent years some mainstream films, such as Terminator 2: Judgement Day (released in 2017), which were originally made and shown in 2D, have been officially ‘re-released’ in the 3D format. These ‘re-releases’ are not considered as specialised films in the present analyses.
Unlike previous years, other non-mainstream films that do not fall into the above categories but are considered to be specialised are not included in the data, due to the subjectivity regarding the definition of these films. Generally these films were described as having a distinctive genre, hook or style, as less easy to define as a particular genre or are films which deal with more complex and challenging subject matter than the majority of mainstream films. (Non-feature film releases, such as recorded live performances, are not considered to be specialised; they are categorised as event cinema. For more information, refer to the Distribution and exhibition chapter.)
Figure 9 Documentaries, foreign language films and re-releases in the UK and Republic of Ireland, 2008-2017
Number of films
Documentary 49 56 58 68 86 89 98 117 108 89
Foreign language 188 161 199 180 230 279 255 277 368 349
Re-release 26 25 28 31 34 42 49 38 41 40
Source: comScore, BFI RSU analysis
Note: There is some overlap in these categories as a small number of films are assigned to more than one specialised film category.
0
50
100
150
200
250
300
350
400
2017201620152014201320122011201020092008
24
NON-ENGLISH LANGUAGE FILMS
Films in 39 different languages (including English) were released in the UK and Republic of Ireland in 2017, four fewer than in 2016. There were also two releases with no spoken dialogue: the re-release of Fritz Lang’s 1921 silent classic Der müde Tod and the first non-Japanese animated title produced by Studio Ghibli, The Red Turtle.
Foreign language films accounted for 46% of all theatrical releases in 2017 and earned £29 million (2% of overall box office gross). There were 349 foreign language film releases, down from 368 in 2016. In terms of both number of releases and box office gross, films in Hindi were the most popular non-English language releases in 2017, generating £11 million from 52 titles.
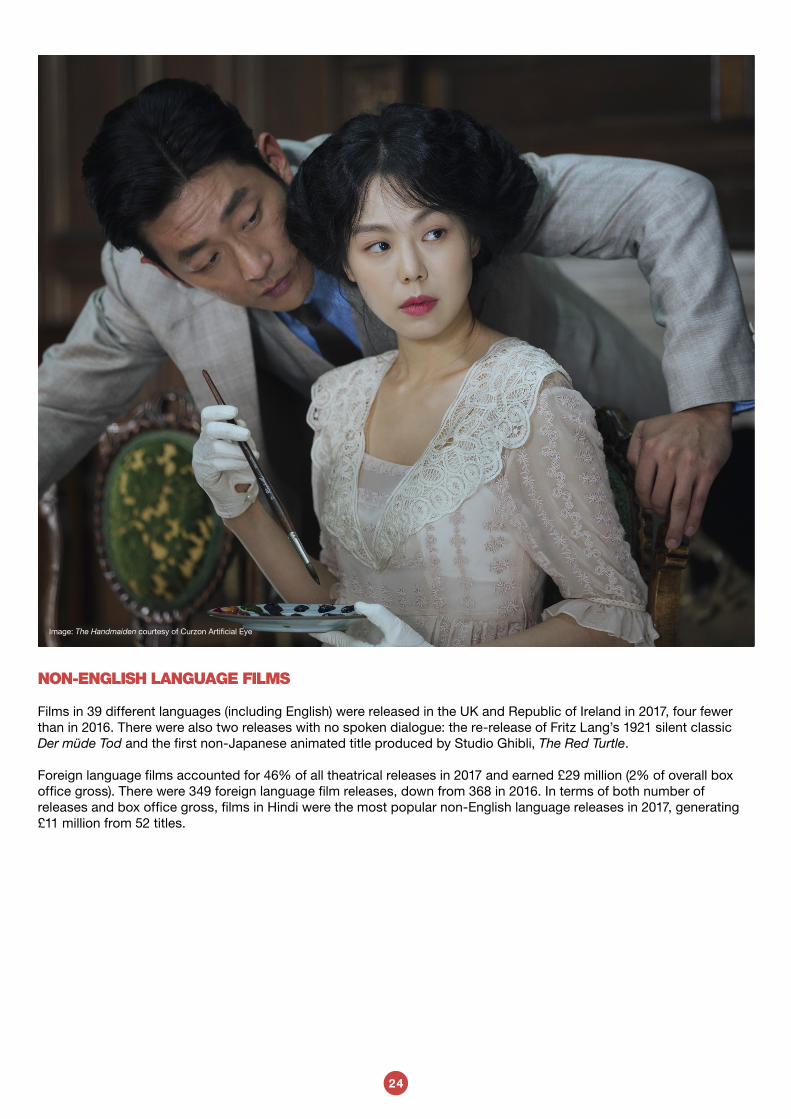
Image: The Handmaiden courtesy of Curzon Artificial Eye
25
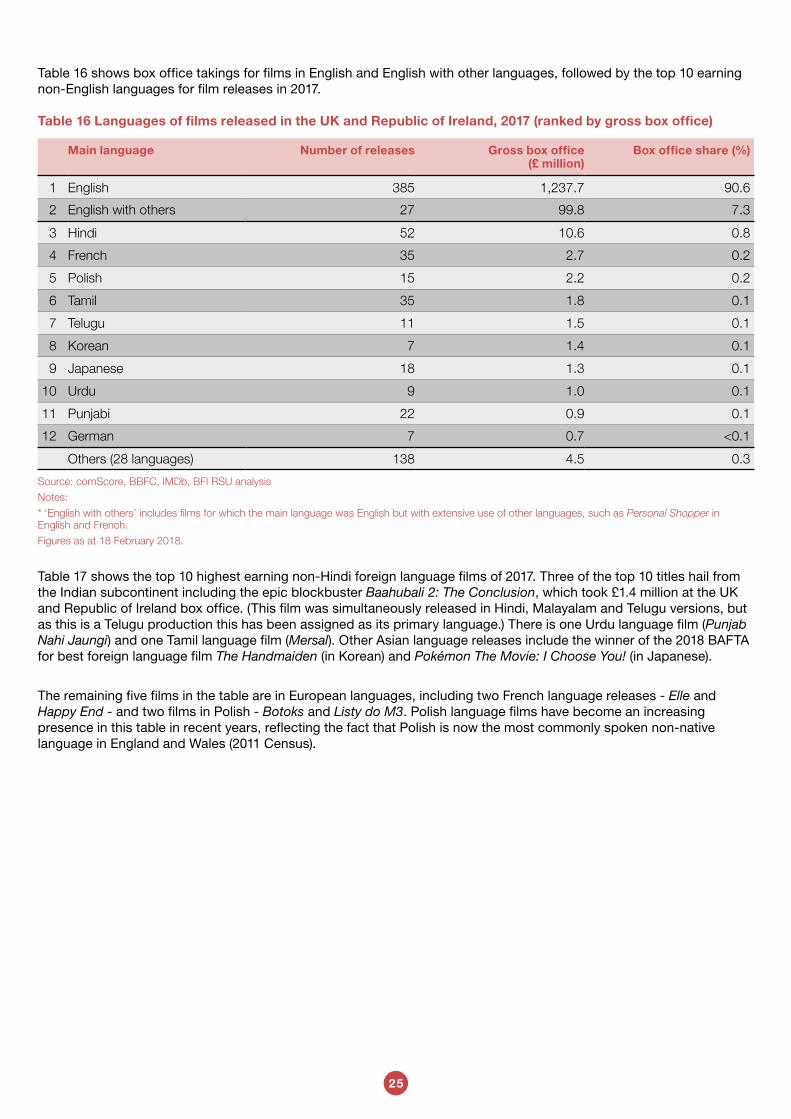
Table 16 shows box office takings for films in English and English with other languages, followed by the top 10 earning non-English languages for film releases in 2017.
Table 16 Languages of films released in the UK and Republic of Ireland, 2017 (ranked by gross box office)
Main language Number of releases Gross box office (£ million)
Box office share (%)
1 English 385 1,237.7 90.6
2 English with others 27 99.8 7.3
3 Hindi 52 10.6 0.8
4 French 35 2.7 0.2
5 Polish 15 2.2 0.2
6 Tamil 35 1.8 0.1
7 Telugu 11 1.5 0.1
8 Korean 7 1.4 0.1
9 Japanese 18 1.3 0.1
10 Urdu 9 1.0 0.1
11 Punjabi 22 0.9 0.1
12 German 7 0.7 <0.1
Others (28 languages) 138 4.5 0.3
Source: comScore, BBFC, IMDb, BFI RSU analysis
Notes:
* ‘English with others’ includes films for which the main language was English but with extensive use of other languages, such as Personal Shopper in English and French.
Figures as at 18 February 2018.
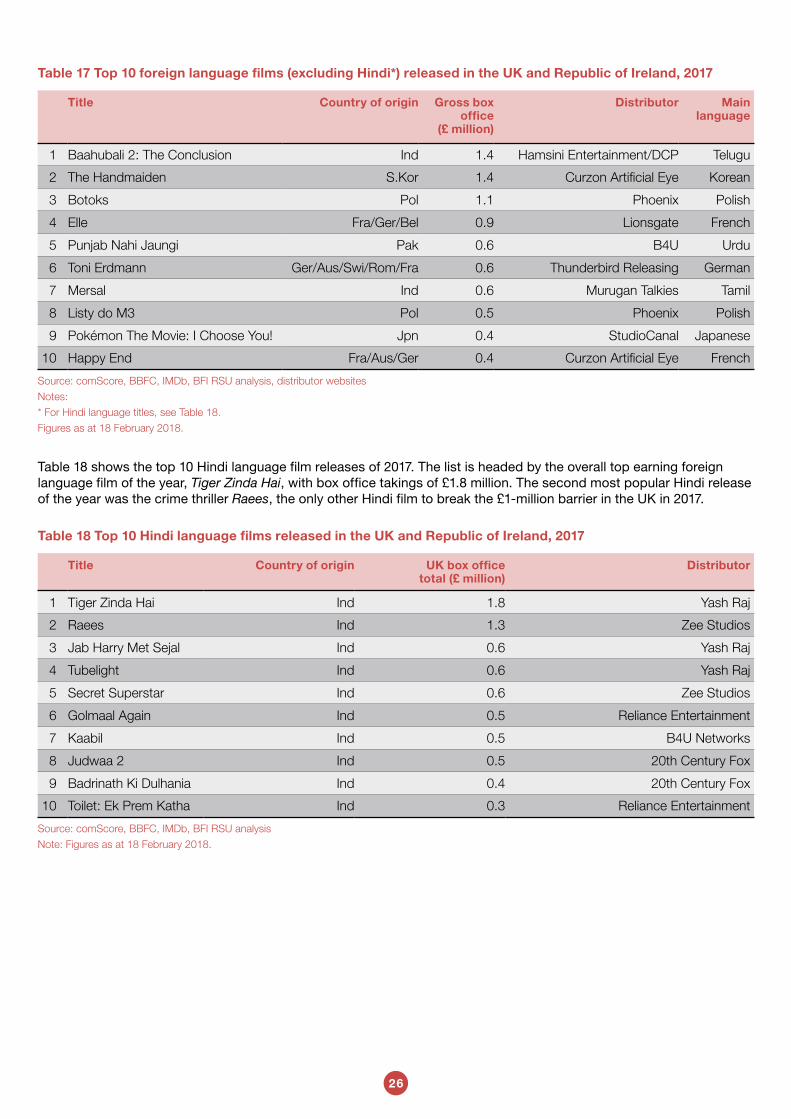
Table 17 shows the top 10 highest earning non-Hindi foreign language films of 2017. Three of the top 10 titles hail from the Indian subcontinent including the epic blockbuster Baahubali 2: The Conclusion, which took £1.4 million at the UK and Republic of Ireland box office. (This film was simultaneously released in Hindi, Malayalam and Telugu versions, but as this is a Telugu production this has been assigned as its primary language.) There is one Urdu language film (Punjab Nahi Jaungi) and one Tamil language film (Mersal). Other Asian language releases include the winner of the 2018 BAFTA for best foreign language film The Handmaiden (in Korean) and Pokémon The Movie: I Choose You! (in Japanese).
The remaining five films in the table are in European languages, including two French language releases - Elle and Happy End - and two films in Polish - Botoks and Listy do M3. Polish language films have become an increasing presence in this table in recent years, reflecting the fact that Polish is now the most commonly spoken non-native language in England and Wales (2011 Census).
26
Table 17 Top 10 foreign language films (excluding Hindi*) released in the UK and Republic of Ireland, 2017
Title Country of origin Gross box office
(£ million)
Distributor Main language
1 Baahubali 2: The Conclusion Ind 1.4 Hamsini Entertainment/DCP Telugu
2 The Handmaiden S.Kor 1.4 Curzon Artificial Eye Korean
3 Botoks Pol 1.1 Phoenix Polish
4 Elle Fra/Ger/Bel 0.9 Lionsgate French
5 Punjab Nahi Jaungi Pak 0.6 B4U Urdu
6 Toni Erdmann Ger/Aus/Swi/Rom/Fra 0.6 Thunderbird Releasing German
7 Mersal Ind 0.6 Murugan Talkies Tamil
8 Listy do M3 Pol 0.5 Phoenix Polish
9 Pokémon The Movie: I Choose You! Jpn 0.4 StudioCanal Japanese
10 Happy End Fra/Aus/Ger 0.4 Curzon Artificial Eye French
Source: comScore, BBFC, IMDb, BFI RSU analysis, distributor websites
Notes:
* For Hindi language titles, see Table 18.
Figures as at 18 February 2018.
Table 18 shows the top 10 Hindi language film releases of 2017. The list is headed by the overall top earning foreign language film of the year, Tiger Zinda Hai, with box office takings of £1.8 million. The second most popular Hindi release of the year was the crime thriller Raees, the only other Hindi film to break the £1-million barrier in the UK in 2017.
Table 18 Top 10 Hindi language films released in the UK and Republic of Ireland, 2017
Title Country of origin UK box office total (£ million)
Distributor
1 Tiger Zinda Hai Ind 1.8 Yash Raj
2 Raees Ind 1.3 Zee Studios
3 Jab Harry Met Sejal Ind 0.6 Yash Raj
4 Tubelight Ind 0.6 Yash Raj
5 Secret Superstar Ind 0.6 Zee Studios
6 Golmaal Again Ind 0.5 Reliance Entertainment
7 Kaabil Ind 0.5 B4U Networks
8 Judwaa 2 Ind 0.5 20th Century Fox
9 Badrinath Ki Dulhania Ind 0.4 20th Century Fox
10 Toilet: Ek Prem Katha Ind 0.3 Reliance Entertainment
Source: comScore, BBFC, IMDb, BFI RSU analysis
Note: Figures as at 18 February 2018.
27
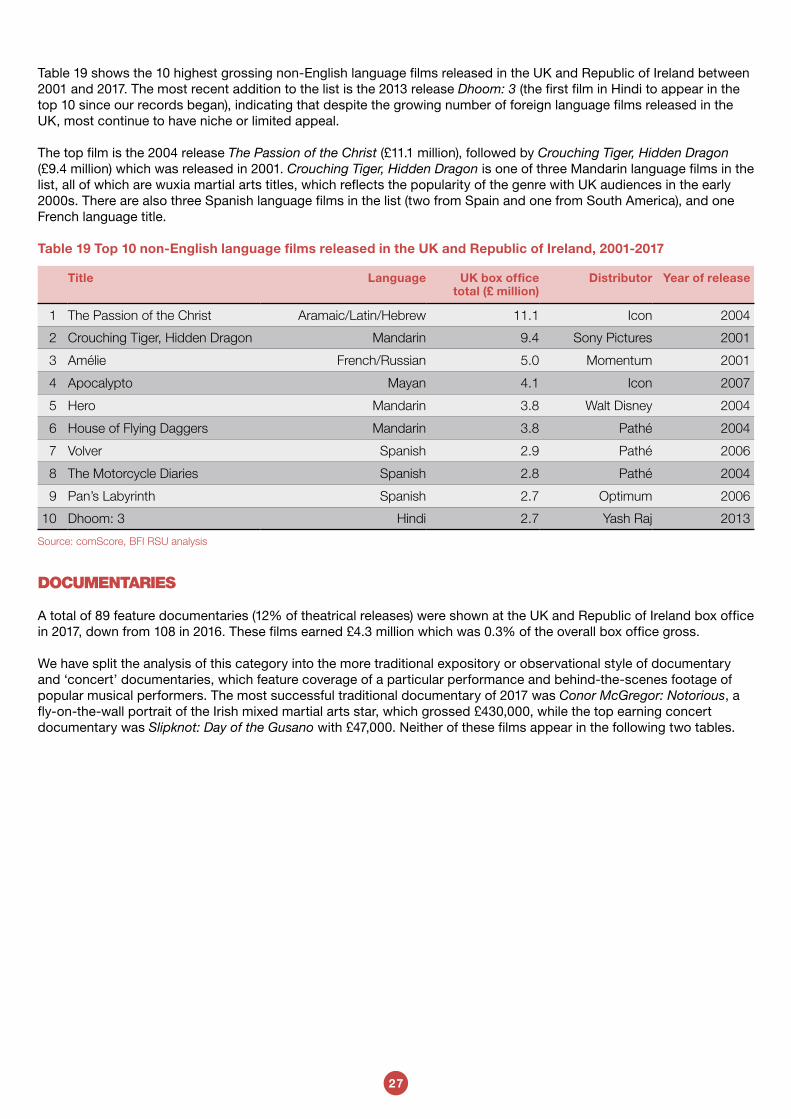
Table 19 shows the 10 highest grossing non-English language films released in the UK and Republic of Ireland between 2001 and 2017. The most recent addition to the list is the 2013 release Dhoom: 3 (the first film in Hindi to appear in the top 10 since our records began), indicating that despite the growing number of foreign language films released in the UK, most continue to have niche or limited appeal.
The top film is the 2004 release The Passion of the Christ (£11.1 million), followed by Crouching Tiger, Hidden Dragon (£9.4 million) which was released in 2001. Crouching Tiger, Hidden Dragon is one of three Mandarin language films in the list, all of which are wuxia martial arts titles, which reflects the popularity of the genre with UK audiences in the early 2000s. There are also three Spanish language films in the list (two from Spain and one from South America), and one French language title.
Table 19 Top 10 non-English language films released in the UK and Republic of Ireland, 2001-2017
Title Language UK box office total (£ million)
Distributor Year of release
1 The Passion of the Christ Aramaic/Latin/Hebrew 11.1 Icon 2004
2 Crouching Tiger, Hidden Dragon Mandarin 9.4 Sony Pictures 2001
3 Amélie French/Russian 5.0 Momentum 2001
4 Apocalypto Mayan 4.1 Icon 2007
5 Hero Mandarin 3.8 Walt Disney 2004
6 House of Flying Daggers Mandarin 3.8 Pathé 2004
7 Volver Spanish 2.9 Pathé 2006
8 The Motorcycle Diaries Spanish 2.8 Pathé 2004
9 Pan’s Labyrinth Spanish 2.7 Optimum 2006
10 Dhoom: 3 Hindi 2.7 Yash Raj 2013
Source: comScore, BFI RSU analysis
DOCUMENTARIES
A total of 89 feature documentaries (12% of theatrical releases) were shown at the UK and Republic of Ireland box office in 2017, down from 108 in 2016. These films earned £4.3 million which was 0.3% of the overall box office gross.
We have split the analysis of this category into the more traditional expository or observational style of documentary and ‘concert’ documentaries, which feature coverage of a particular performance and behind-the-scenes footage of popular musical performers. The most successful traditional documentary of 2017 was Conor McGregor: Notorious, a fly-on-the-wall portrait of the Irish mixed martial arts star, which grossed £430,000, while the top earning concert documentary was Slipknot: Day of the Gusano with £47,000. Neither of these films appear in the following two tables.
28
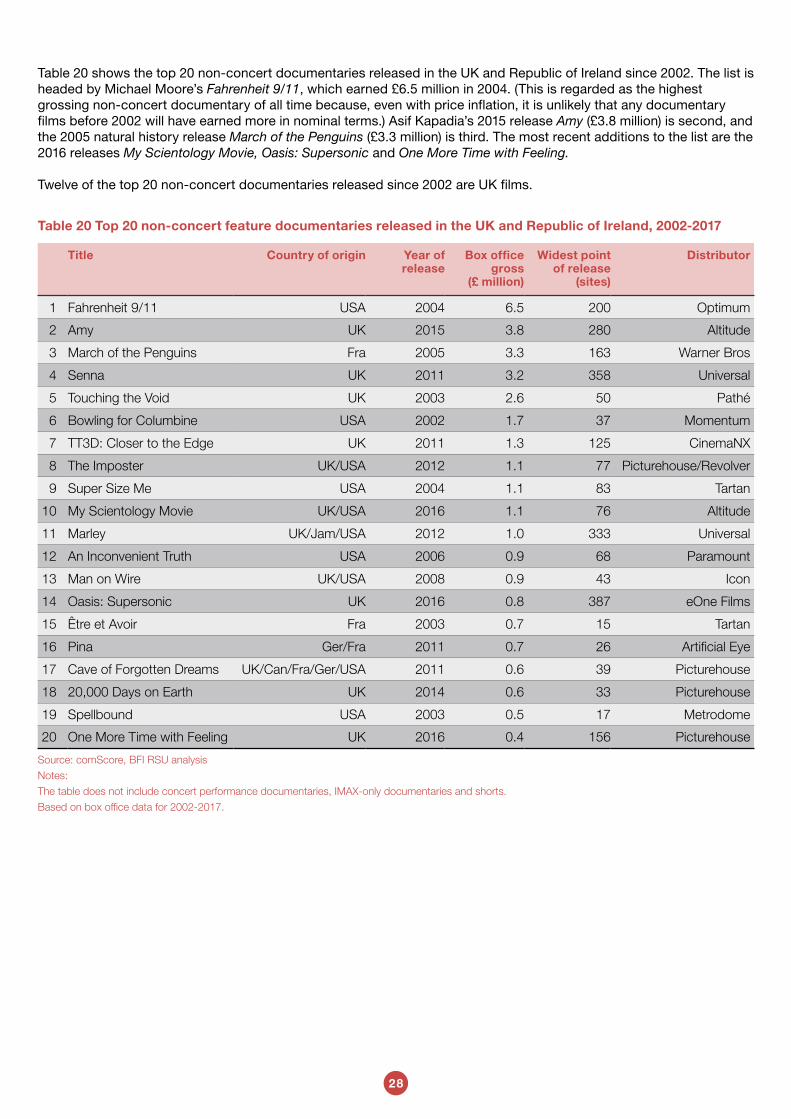
Table 20 shows the top 20 non-concert documentaries released in the UK and Republic of Ireland since 2002. The list is headed by Michael Moore’s Fahrenheit 9/11, which earned £6.5 million in 2004. (This is regarded as the highest grossing non-concert documentary of all time because, even with price inflation, it is unlikely that any documentary films before 2002 will have earned more in nominal terms.) Asif Kapadia’s 2015 release Amy (£3.8 million) is second, and the 2005 natural history release March of the Penguins (£3.3 million) is third. The most recent additions to the list are the 2016 releases My Scientology Movie, Oasis: Supersonic and One More Time with Feeling.
Twelve of the top 20 non-concert documentaries released since 2002 are UK films.
Table 20 Top 20 non-concert feature documentaries released in the UK and Republic of Ireland, 2002-2017
Title Country of origin Year of release
Box office gross
(£ million)
Widest point of release
(sites)
Distributor
1 Fahrenheit 9/11 USA 2004 6.5 200 Optimum
2 Amy UK 2015 3.8 280 Altitude
3 March of the Penguins Fra 2005 3.3 163 Warner Bros
4 Senna UK 2011 3.2 358 Universal
5 Touching the Void UK 2003 2.6 50 Pathé
6 Bowling for Columbine USA 2002 1.7 37 Momentum
7 TT3D: Closer to the Edge UK 2011 1.3 125 CinemaNX
8 The Imposter UK/USA 2012 1.1 77 Picturehouse/Revolver
9 Super Size Me USA 2004 1.1 83 Tartan
10 My Scientology Movie UK/USA 2016 1.1 76 Altitude
11 Marley UK/Jam/USA 2012 1.0 333 Universal
12 An Inconvenient Truth USA 2006 0.9 68 Paramount
13 Man on Wire UK/USA 2008 0.9 43 Icon
14 Oasis: Supersonic UK 2016 0.8 387 eOne Films
15 Être et Avoir Fra 2003 0.7 15 Tartan
16 Pina Ger/Fra 2011 0.7 26 Artificial Eye
17 Cave of Forgotten Dreams UK/Can/Fra/Ger/USA 2011 0.6 39 Picturehouse
18 20,000 Days on Earth UK 2014 0.6 33 Picturehouse
19 Spellbound USA 2003 0.5 17 Metrodome
20 One More Time with Feeling UK 2016 0.4 156 Picturehouse
Source: comScore, BFI RSU analysis
Notes:
The table does not include concert performance documentaries, IMAX-only documentaries and shorts.
Based on box office data for 2002-2017.
29
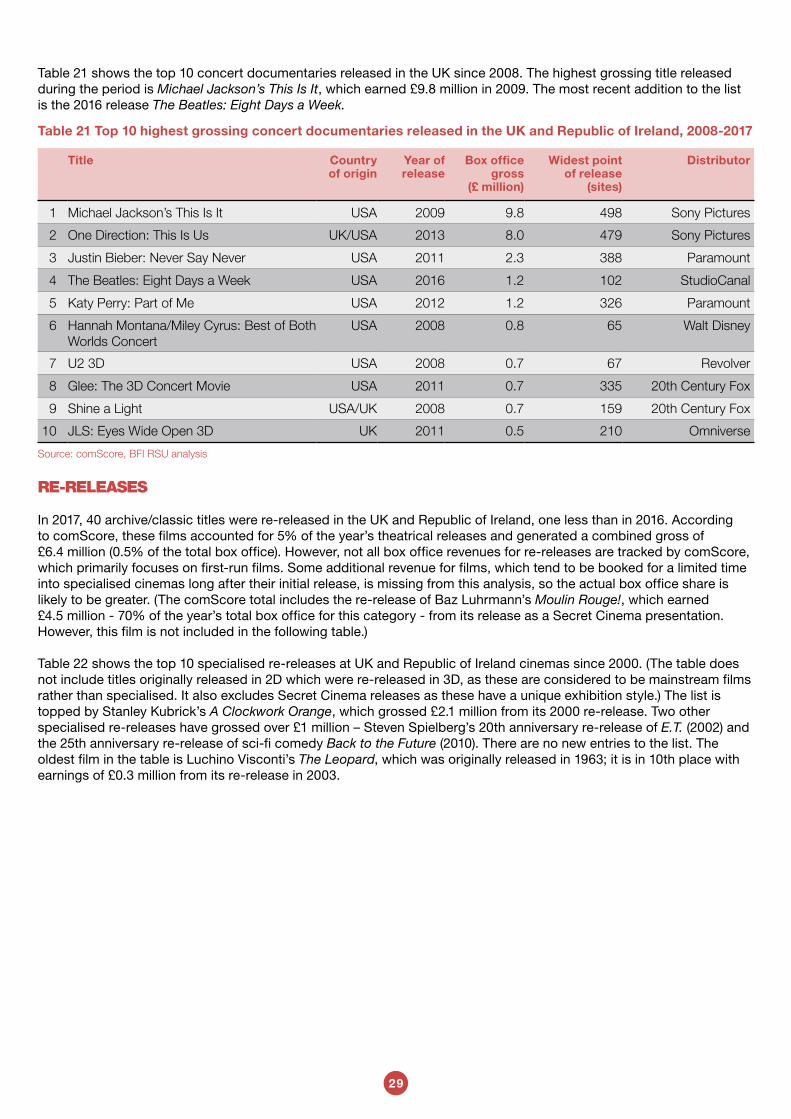
Table 21 shows the top 10 concert documentaries released in the UK since 2008. The highest grossing title released during the period is Michael Jackson’s This Is It, which earned £9.8 million in 2009. The most recent addition to the list is the 2016 release The Beatles: Eight Days a Week.
Table 21 Top 10 highest grossing concert documentaries released in the UK and Republic of Ireland, 2008-2017
Title Country of origin
Year of release
Box office gross
(£ million)
Widest point of release
(sites)
Distributor
1 Michael Jackson’s This Is It USA 2009 9.8 498 Sony Pictures
2 One Direction: This Is Us UK/USA 2013 8.0 479 Sony Pictures
3 Justin Bieber: Never Say Never USA 2011 2.3 388 Paramount
4 The Beatles: Eight Days a Week USA 2016 1.2 102 StudioCanal
5 Katy Perry: Part of Me USA 2012 1.2 326 Paramount
6 Hannah Montana/Miley Cyrus: Best of Both Worlds Concert
USA 2008 0.8 65 Walt Disney
7 U2 3D USA 2008 0.7 67 Revolver
8 Glee: The 3D Concert Movie USA 2011 0.7 335 20th Century Fox
9 Shine a Light USA/UK 2008 0.7 159 20th Century Fox
10 JLS: Eyes Wide Open 3D UK 2011 0.5 210 Omniverse
Source: comScore, BFI RSU analysis
RE-RELEASES
In 2017, 40 archive/classic titles were re-released in the UK and Republic of Ireland, one less than in 2016. According to comScore, these films accounted for 5% of the year’s theatrical releases and generated a combined gross of £6.4 million (0.5% of the total box office). However, not all box office revenues for re-releases are tracked by comScore, which primarily focuses on first-run films. Some additional revenue for films, which tend to be booked for a limited time into specialised cinemas long after their initial release, is missing from this analysis, so the actual box office share is likely to be greater. (The comScore total includes the re-release of Baz Luhrmann’s Moulin Rouge!, which earned £4.5 million - 70% of the year’s total box office for this category - from its release as a Secret Cinema presentation. However, this film is not included in the following table.)
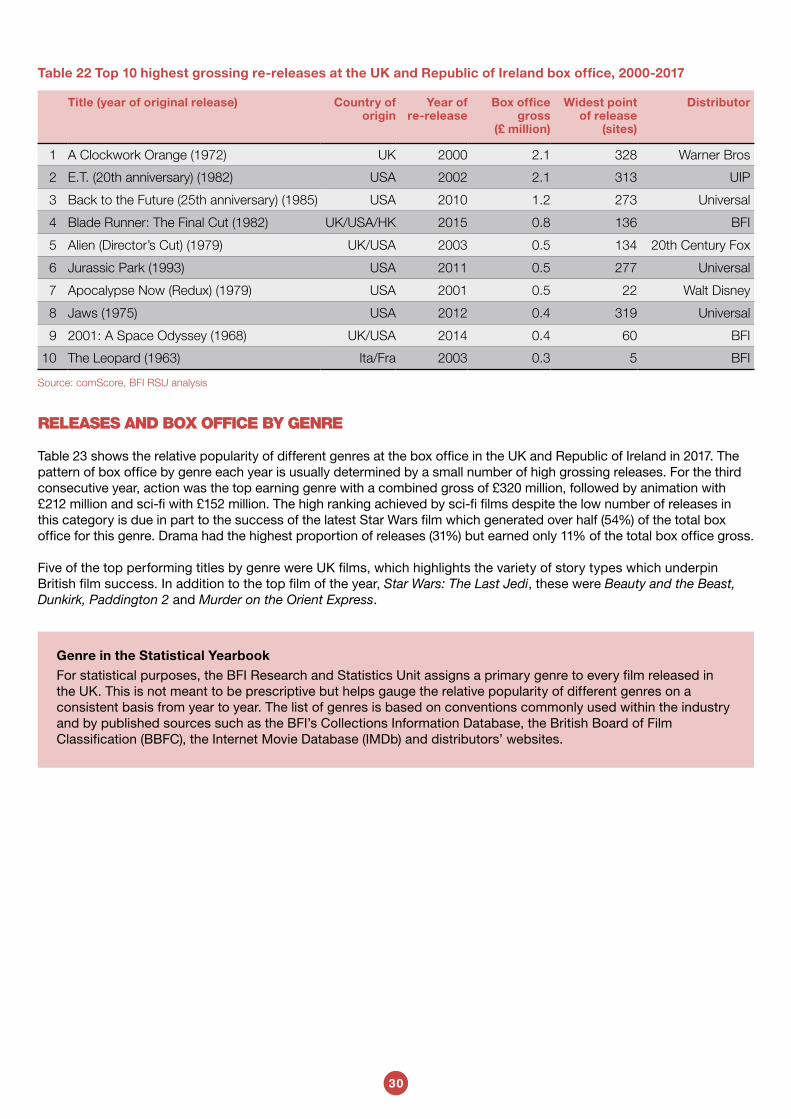
Table 22 shows the top 10 specialised re-releases at UK and Republic of Ireland cinemas since 2000. (The table does not include titles originally released in 2D which were re-released in 3D, as these are considered to be mainstream films rather than specialised. It also excludes Secret Cinema releases as these have a unique exhibition style.) The list is topped by Stanley Kubrick’s A Clockwork Orange, which grossed £2.1 million from its 2000 re-release. Two other specialised re-releases have grossed over £1 million – Steven Spielberg’s 20th anniversary re-release of E.T. (2002) and the 25th anniversary re-release of sci-fi comedy Back to the Future (2010). There are no new entries to the list. The oldest film in the table is Luchino Visconti’s The Leopard, which was originally released in 1963; it is in 10th place with earnings of £0.3 million from its re-release in 2003.
30
Table 22 Top 10 highest grossing re-releases at the UK and Republic of Ireland box office, 2000-2017
Title (year of original release) Country of origin
Year of re-release
Box office gross
(£ million)
Widest point of release
(sites)
Distributor
1 A Clockwork Orange (1972) UK 2000 2.1 328 Warner Bros
2 E.T. (20th anniversary) (1982) USA 2002 2.1 313 UIP
3 Back to the Future (25th anniversary) (1985) USA 2010 1.2 273 Universal
4 Blade Runner: The Final Cut (1982) UK/USA/HK 2015 0.8 136 BFI
5 Alien (Director’s Cut) (1979) UK/USA 2003 0.5 134 20th Century Fox
6 Jurassic Park (1993) USA 2011 0.5 277 Universal
7 Apocalypse Now (Redux) (1979) USA 2001 0.5 22 Walt Disney
8 Jaws (1975) USA 2012 0.4 319 Universal
9 2001: A Space Odyssey (1968) UK/USA 2014 0.4 60 BFI
10 The Leopard (1963) Ita/Fra 2003 0.3 5 BFI
Source: comScore, BFI RSU analysis
RELEASES AND BOX OFFICE BY GENRE
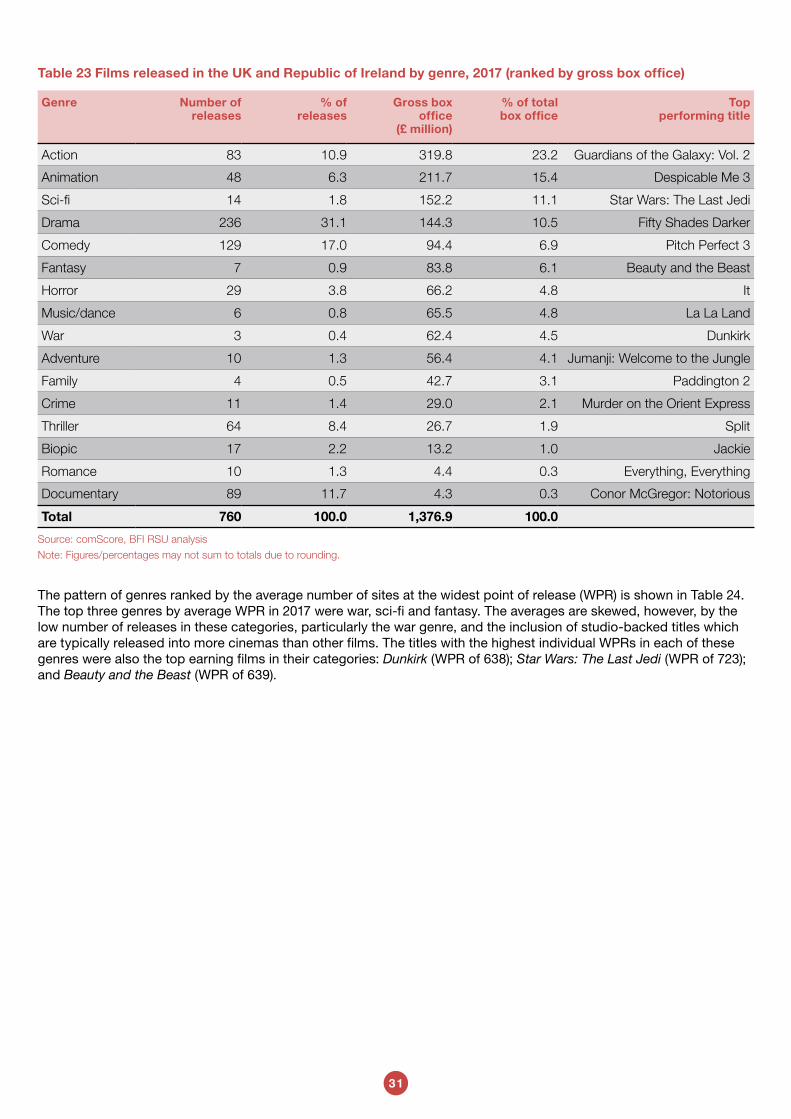
Table 23 shows the relative popularity of different genres at the box office in the UK and Republic of Ireland in 2017. The pattern of box office by genre each year is usually determined by a small number of high grossing releases. For the third consecutive year, action was the top earning genre with a combined gross of £320 million, followed by animation with £212 million and sci-fi with £152 million. The high ranking achieved by sci-fi films despite the low number of releases in this category is due in part to the success of the latest Star Wars film which generated over half (54%) of the total box office for this genre. Drama had the highest proportion of releases (31%) but earned only 11% of the total box office gross.
Five of the top performing titles by genre were UK films, which highlights the variety of story types which underpin British film success. In addition to the top film of the year, Star Wars: The Last Jedi, these were Beauty and the Beast, Dunkirk, Paddington 2 and Murder on the Orient Express.
Genre in the Statistical YearbookFor statistical purposes, the BFI Research and Statistics Unit assigns a primary genre to every film released in the UK. This is not meant to be prescriptive but helps gauge the relative popularity of different genres on a consistent basis from year to year. The list of genres is based on conventions commonly used within the industry and by published sources such as the BFI’s Collections Information Database, the British Board of Film Classification (BBFC), the Internet Movie Database (IMDb) and distributors’ websites.
31
Table 23 Films released in the UK and Republic of Ireland by genre, 2017 (ranked by gross box office)
Genre Number of releases
% of releases
Gross box office
(£ million)
% of total box office
Top performing title
Action 83 10.9 319.8 23.2 Guardians of the Galaxy: Vol. 2
Animation 48 6.3 211.7 15.4 Despicable Me 3
Sci-fi 14 1.8 152.2 11.1 Star Wars: The Last Jedi
Drama 236 31.1 144.3 10.5 Fifty Shades Darker
Comedy 129 17.0 94.4 6.9 Pitch Perfect 3
Fantasy 7 0.9 83.8 6.1 Beauty and the Beast
Horror 29 3.8 66.2 4.8 It
Music/dance 6 0.8 65.5 4.8 La La Land
War 3 0.4 62.4 4.5 Dunkirk
Adventure 10 1.3 56.4 4.1 Jumanji: Welcome to the Jungle
Family 4 0.5 42.7 3.1 Paddington 2
Crime 11 1.4 29.0 2.1 Murder on the Orient Express
Thriller 64 8.4 26.7 1.9 Split
Biopic 17 2.2 13.2 1.0 Jackie
Romance 10 1.3 4.4 0.3 Everything, Everything
Documentary 89 11.7 4.3 0.3 Conor McGregor: Notorious
Total 760 100.0 1,376.9 100.0
Source: comScore, BFI RSU analysis
Note: Figures/percentages may not sum to totals due to rounding.
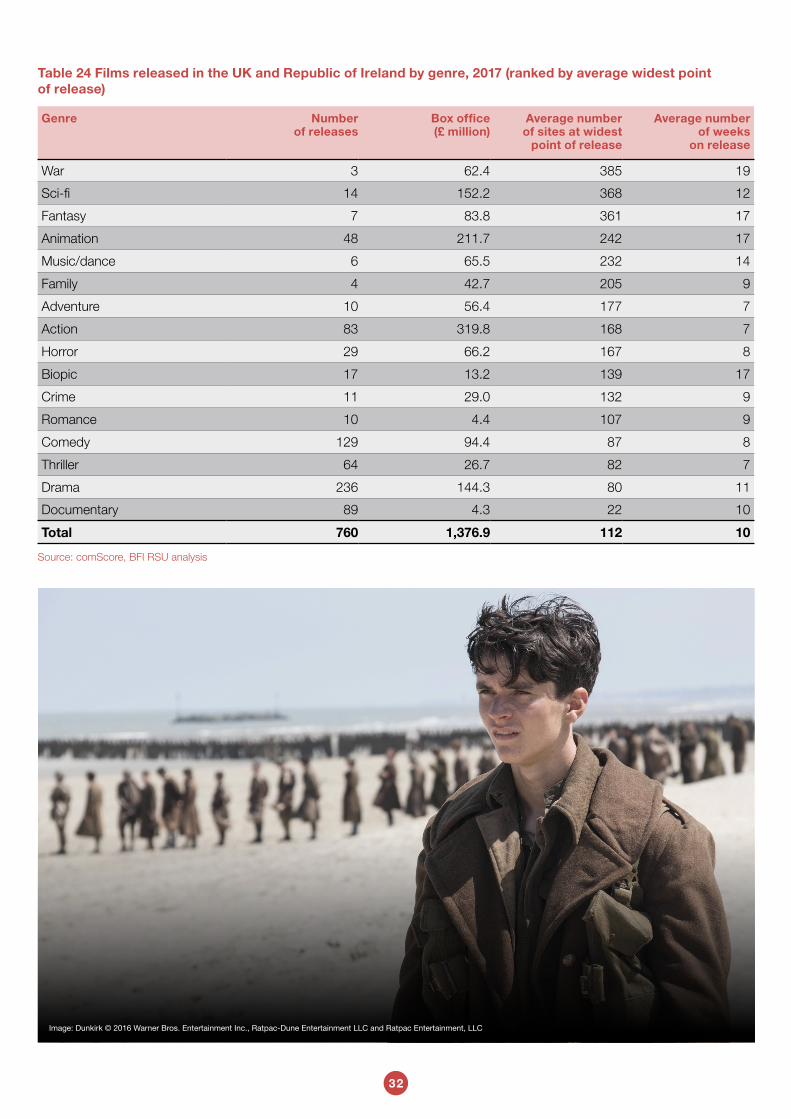
The pattern of genres ranked by the average number of sites at the widest point of release (WPR) is shown in Table 24. The top three genres by average WPR in 2017 were war, sci-fi and fantasy. The averages are skewed, however, by the low number of releases in these categories, particularly the war genre, and the inclusion of studio-backed titles which are typically released into more cinemas than other films. The titles with the highest individual WPRs in each of these genres were also the top earning films in their categories: Dunkirk (WPR of 638); Star Wars: The Last Jedi (WPR of 723); and Beauty and the Beast (WPR of 639).
32
Table 24 Films released in the UK and Republic of Ireland by genre, 2017 (ranked by average widest point of release)
Genre Number of releases
Box office (£ million)
Average number of sites at widest
point of release
Average number of weeks
on release
War 3 62.4 385 19
Sci-fi 14 152.2 368 12
Fantasy 7 83.8 361 17
Animation 48 211.7 242 17
Music/dance 6 65.5 232 14
Family 4 42.7 205 9
Adventure 10 56.4 177 7
Action 83 319.8 168 7
Horror 29 66.2 167 8
Biopic 17 13.2 139 17
Crime 11 29.0 132 9
Romance 10 4.4 107 9
Comedy 129 94.4 87 8
Thriller 64 26.7 82 7
Drama 236 144.3 80 11
Documentary 89 4.3 22 10
Total 760 1,376.9 112 10
Source: comScore, BFI RSU analysis
Image: Dunkirk © 2016 Warner Bros. Entertainment Inc., Ratpac-Dune Entertainment LLC and Ratpac Entertainment, LLC
33
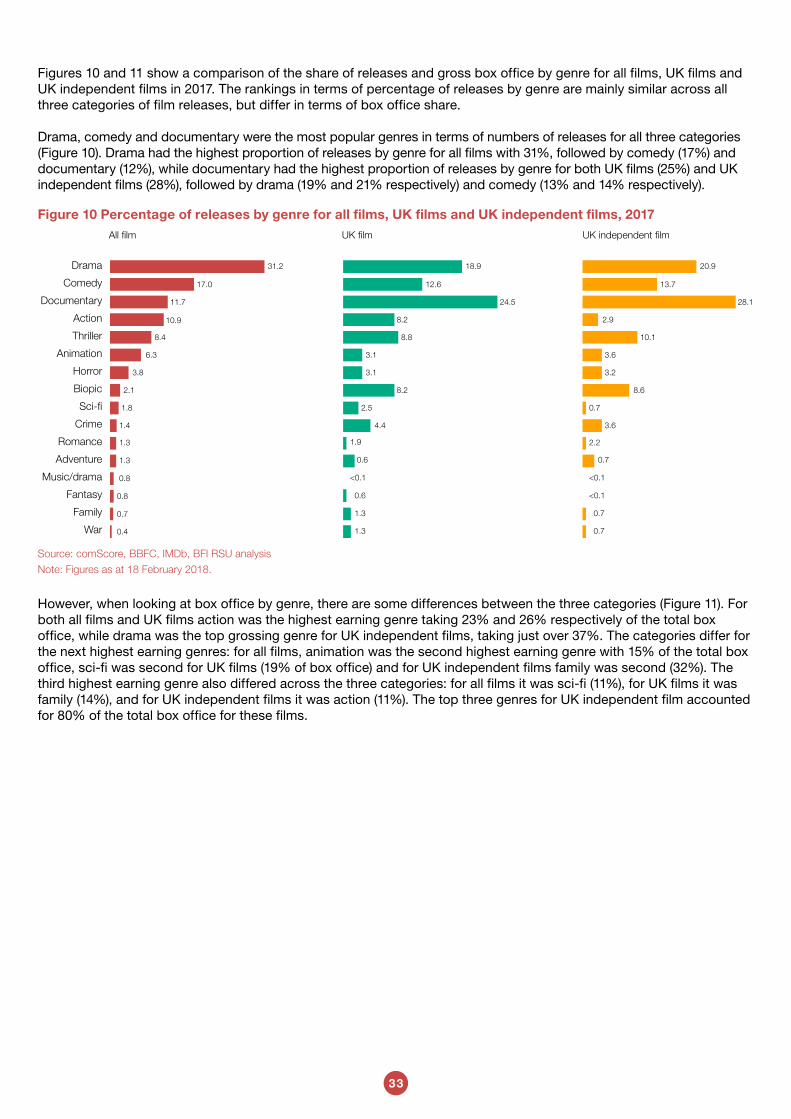
Figures 10 and 11 show a comparison of the share of releases and gross box office by genre for all films, UK films and UK independent films in 2017. The rankings in terms of percentage of releases by genre are mainly similar across all three categories of film releases, but differ in terms of box office share.
Drama, comedy and documentary were the most popular genres in terms of numbers of releases for all three categories (Figure 10). Drama had the highest proportion of releases by genre for all films with 31%, followed by comedy (17%) and documentary (12%), while documentary had the highest proportion of releases by genre for both UK films (25%) and UK independent films (28%), followed by drama (19% and 21% respectively) and comedy (13% and 14% respectively).
All film UK film UK independent film
Drama
Comedy
Documentary
Action
Thriller
Animation
Horror
Biopic
Sci-fi
Crime
Romance
Adventure
Music/drama
Fantasy
Family
War
31.2
17.0
11.7
10.9
8.4
6.3
3.8
2.1
1.8
1.4
1.3
1.3
0.8
0.8
0.7
0.4
18.9
12.6
24.5
8.2
8.8
3.1
3.1
8.2
2.5
4.4
1.9
0.6
<0.1
0.6
1.3
1.3
20.9
13.7
28.1
2.9
10.1
3.6
3.2
8.6
0.7
3.6
2.2
0.7
<0.1
<0.1
0.7
0.7
Figure 10 Percentage of releases by genre for all films, UK films and UK independent films, 2017
Source: comScore, BBFC, IMDb, BFI RSU analysis
Note: Figures as at 18 February 2018.
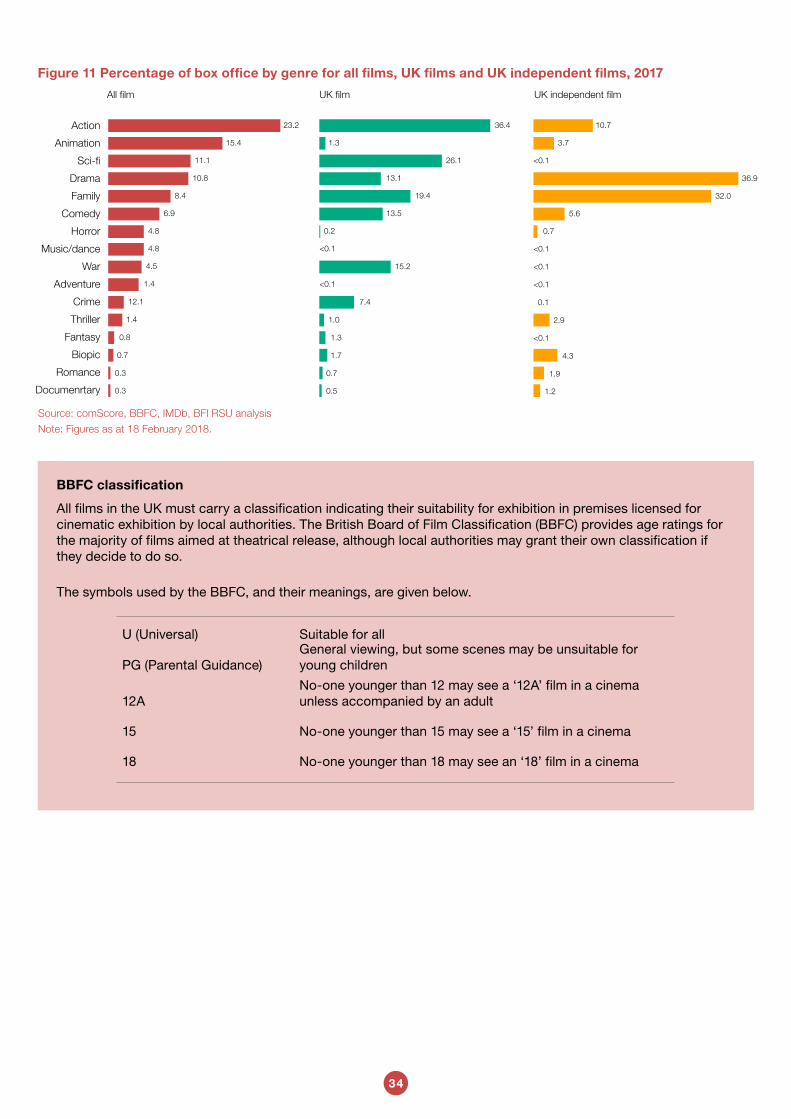
However, when looking at box office by genre, there are some differences between the three categories (Figure 11). For both all films and UK films action was the highest earning genre taking 23% and 26% respectively of the total box office, while drama was the top grossing genre for UK independent films, taking just over 37%. The categories differ for the next highest earning genres: for all films, animation was the second highest earning genre with 15% of the total box office, sci-fi was second for UK films (19% of box office) and for UK independent films family was second (32%). The third highest earning genre also differed across the three categories: for all films it was sci-fi (11%), for UK films it was family (14%), and for UK independent films it was action (11%). The top three genres for UK independent film accounted for 80% of the total box office for these films.
34
All film UK film UK independent film
Figure 11 Percentage of box office by genre for all films, UK films and UK independent films, 2017
Action
Animation
Sci-fi
Drama
Family
Comedy
Horror
Music/dance
War
Adventure
Crime
Thriller
Fantasy
Biopic
Romance
Documenrtary
23.2
15.4
11.1
10.8
8.4
6.9
4.8
4.8
4.5
1.4
12.1
1.4
0.8
0.7
0.3
0.3
36.4
1.3
26.1
13.1
19.4
13.5
0.2
<0.1
15.2
<0.1
7.4
1.0
1.3
1.7
0.7
0.5
10.7
3.7
<0.1
36.9
32.0
5.6
0.7
<0.1
<0.1
<0.1
0.1
2.9
<0.1
4.3
1.9
1.2
Source: comScore, BBFC, IMDb, BFI RSU analysis
Note: Figures as at 18 February 2018.
BBFC classification
All films in the UK must carry a classification indicating their suitability for exhibition in premises licensed for cinematic exhibition by local authorities. The British Board of Film Classification (BBFC) provides age ratings for the majority of films aimed at theatrical release, although local authorities may grant their own classification if they decide to do so.
The symbols used by the BBFC, and their meanings, are given below.
U (Universal) Suitable for all
PG (Parental Guidance)General viewing, but some scenes may be unsuitable for young children
12ANo-one younger than 12 may see a ‘12A’ film in a cinema unless accompanied by an adult
15 No-one younger than 15 may see a ‘15’ film in a cinema
18 No-one younger than 18 may see an ‘18’ film in a cinema
35
RELEASES AND BOX OFFICE BY CLASSIFICATION
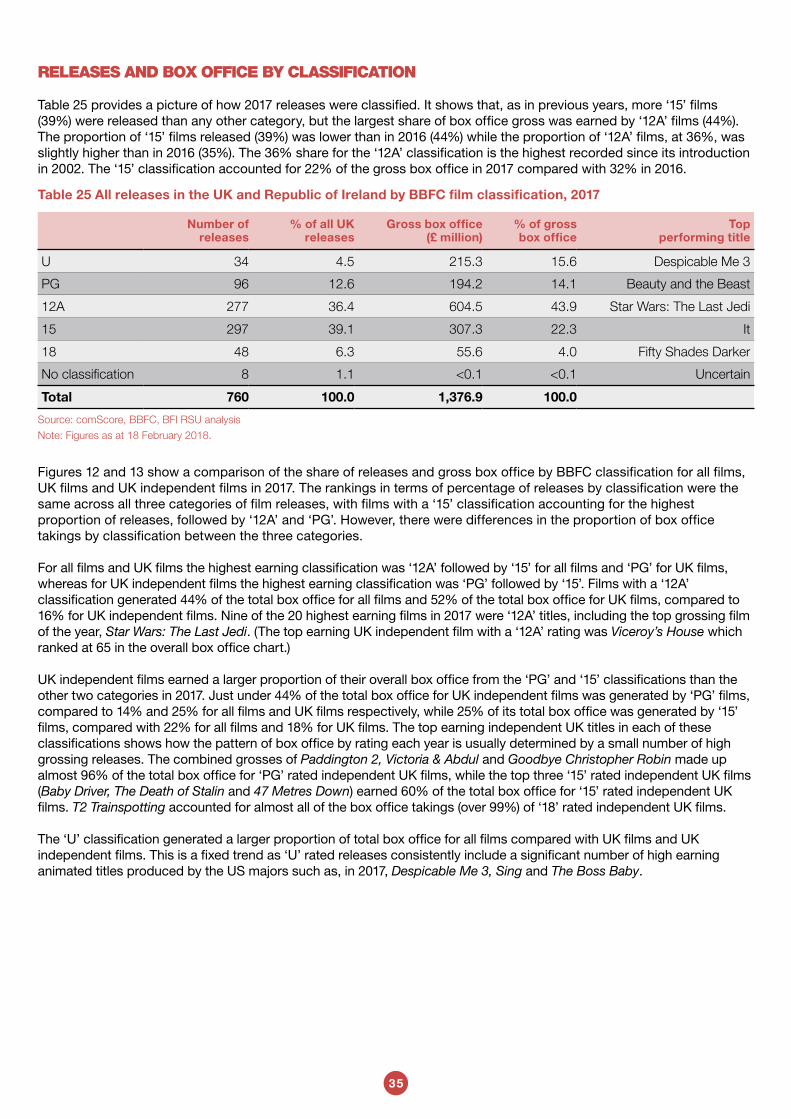
Table 25 provides a picture of how 2017 releases were classified. It shows that, as in previous years, more ‘15’ films (39%) were released than any other category, but the largest share of box office gross was earned by ‘12A’ films (44%). The proportion of ‘15’ films released (39%) was lower than in 2016 (44%) while the proportion of ‘12A’ films, at 36%, was slightly higher than in 2016 (35%). The 36% share for the ‘12A’ classification is the highest recorded since its introduction in 2002. The ‘15’ classification accounted for 22% of the gross box office in 2017 compared with 32% in 2016.
Table 25 All releases in the UK and Republic of Ireland by BBFC film classification, 2017
Number of releases
% of all UK releases
Gross box office (£ million)
% of gross box office
Top performing title
U 34 4.5 215.3 15.6 Despicable Me 3
PG 96 12.6 194.2 14.1 Beauty and the Beast
12A 277 36.4 604.5 43.9 Star Wars: The Last Jedi
15 297 39.1 307.3 22.3 It
18 48 6.3 55.6 4.0 Fifty Shades Darker
No classification 8 1.1 <0.1 <0.1 Uncertain
Total 760 100.0 1,376.9 100.0
Source: comScore, BBFC, BFI RSU analysis
Note: Figures as at 18 February 2018.
Figures 12 and 13 show a comparison of the share of releases and gross box office by BBFC classification for all films, UK films and UK independent films in 2017. The rankings in terms of percentage of releases by classification were the same across all three categories of film releases, with films with a ‘15’ classification accounting for the highest proportion of releases, followed by ‘12A’ and ‘PG’. However, there were differences in the proportion of box office takings by classification between the three categories.
For all films and UK films the highest earning classification was ‘12A’ followed by ‘15’ for all films and ‘PG’ for UK films, whereas for UK independent films the highest earning classification was ‘PG’ followed by ‘15’. Films with a ‘12A’ classification generated 44% of the total box office for all films and 52% of the total box office for UK films, compared to 16% for UK independent films. Nine of the 20 highest earning films in 2017 were ‘12A’ titles, including the top grossing film of the year, Star Wars: The Last Jedi. (The top earning UK independent film with a ‘12A’ rating was Viceroy’s House which ranked at 65 in the overall box office chart.)
UK independent films earned a larger proportion of their overall box office from the ‘PG’ and ‘15’ classifications than the other two categories in 2017. Just under 44% of the total box office for UK independent films was generated by ‘PG’ films, compared to 14% and 25% for all films and UK films respectively, while 25% of its total box office was generated by ‘15’ films, compared with 22% for all films and 18% for UK films. The top earning independent UK titles in each of these classifications shows how the pattern of box office by rating each year is usually determined by a small number of high grossing releases. The combined grosses of Paddington 2, Victoria & Abdul and Goodbye Christopher Robin made up almost 96% of the total box office for ‘PG’ rated independent UK films, while the top three ‘15’ rated independent UK films (Baby Driver, The Death of Stalin and 47 Metres Down) earned 60% of the total box office for ‘15’ rated independent UK films. T2 Trainspotting accounted for almost all of the box office takings (over 99%) of ‘18’ rated independent UK films.
The ‘U’ classification generated a larger proportion of total box office for all films compared with UK films and UK independent films. This is a fixed trend as ‘U’ rated releases consistently include a significant number of high earning animated titles produced by the US majors such as, in 2017, Despicable Me 3, Sing and The Boss Baby.
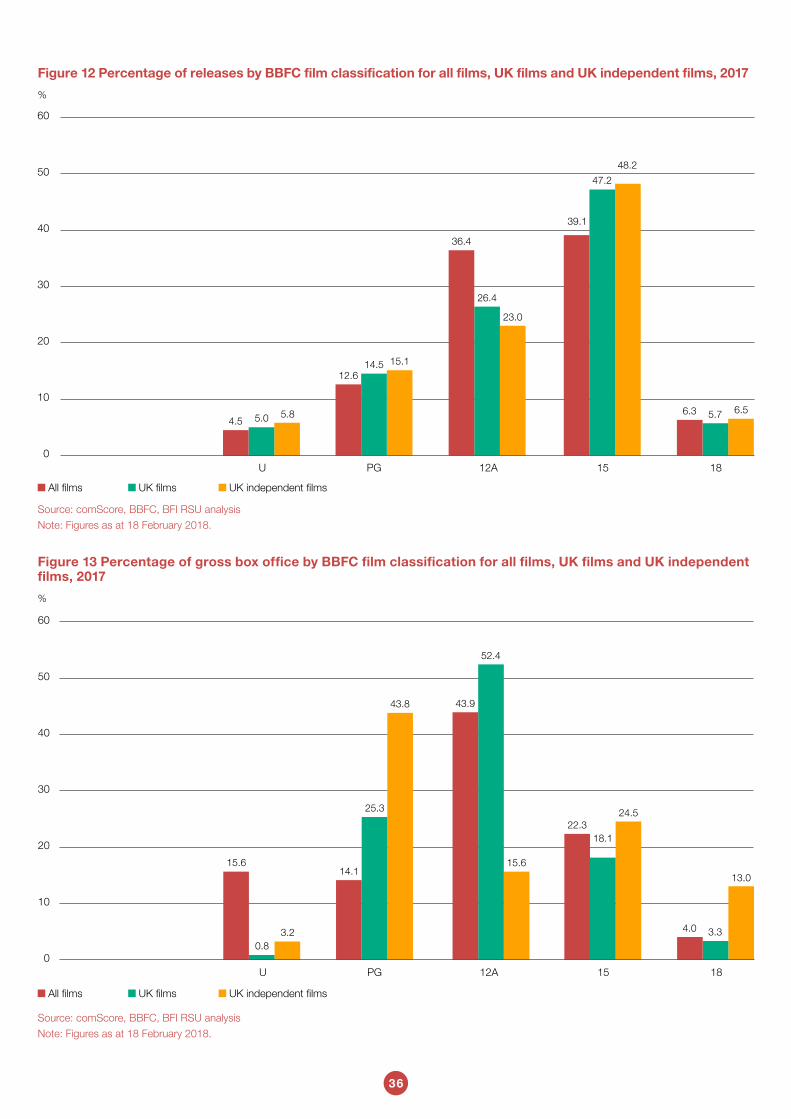
36
All films UK films UK independent films
%
0
10
20
30
40
50
60
U PG 12A 15 18
Source: comScore, BBFC, BFI RSU analysis
Note: Figures as at 18 February 2018.
4.5 5.0 5.8
12.614.5 15.1
36.4
26.4
23.0
39.1
47.2
48.2
6.3 5.7 6.5
Figure 12 Percentage of releases by BBFC film classification for all films, UK films and UK independent films, 2017
%
0
10
20
30
40
50
60
U PG 12A 15 18
15.6
Source: comScore, BBFC, BFI RSU analysis
Note: Figures as at 18 February 2018.
Figure 13 Percentage of gross box office by BBFC film classification for all films, UK films and UK independent films, 2017
0.83.2
14.1
25.3
43.8 43.9
52.4
15.6
22.318.1
24.5
4.0 3.3
13.0
All films UK films UK independent films
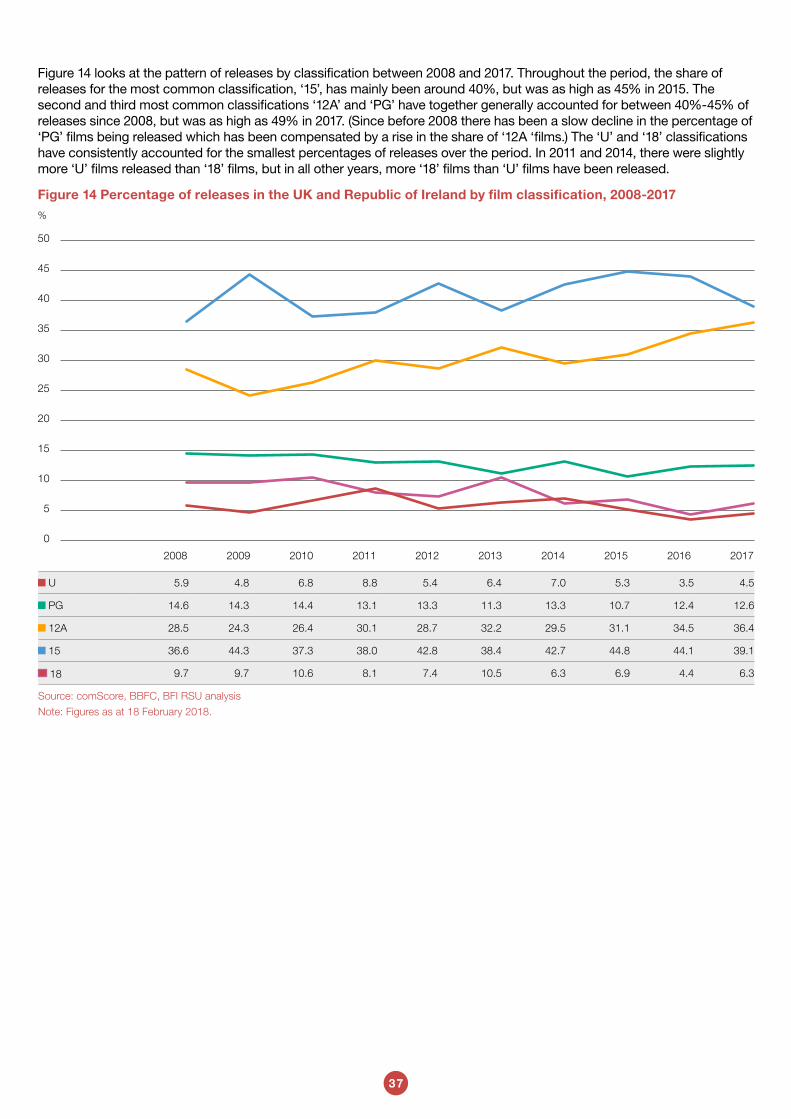
37
Figure 14 looks at the pattern of releases by classification between 2008 and 2017. Throughout the period, the share of releases for the most common classification, ‘15’, has mainly been around 40%, but was as high as 45% in 2015. The second and third most common classifications ‘12A’ and ‘PG’ have together generally accounted for between 40%-45% of releases since 2008, but was as high as 49% in 2017. (Since before 2008 there has been a slow decline in the percentage of ‘PG’ films being released which has been compensated by a rise in the share of ‘12A ‘films.) The ‘U’ and ‘18’ classifications have consistently accounted for the smallest percentages of releases over the period. In 2011 and 2014, there were slightly more ‘U’ films released than ‘18’ films, but in all other years, more ‘18’ films than ‘U’ films have been released.
%
0
5
10
15
20
25
30
35
40
45
50
U 5.9 4.8 6.8 8.8 5.4 6.4 7.0 5.3 3.5 4.5
PG 14.6 14.3 14.4 13.1 13.3 11.3 13.3 10.7 12.4 12.6
12A 28.5 24.3 26.4 30.1 28.7 32.2 29.5 31.1 34.5 36.4
15 36.6 44.3 37.3 38.0 42.8 38.4 42.7 44.8 44.1 39.1
18 9.7 9.7 10.6 8.1 7.4 10.5 6.3 6.9 4.4 6.3
Source: comScore, BBFC, BFI RSU analysis
Note: Figures as at 18 February 2018.
2017201620152014201320122011201020092008
Figure 14 Percentage of releases in the UK and Republic of Ireland by film classification, 2008-2017
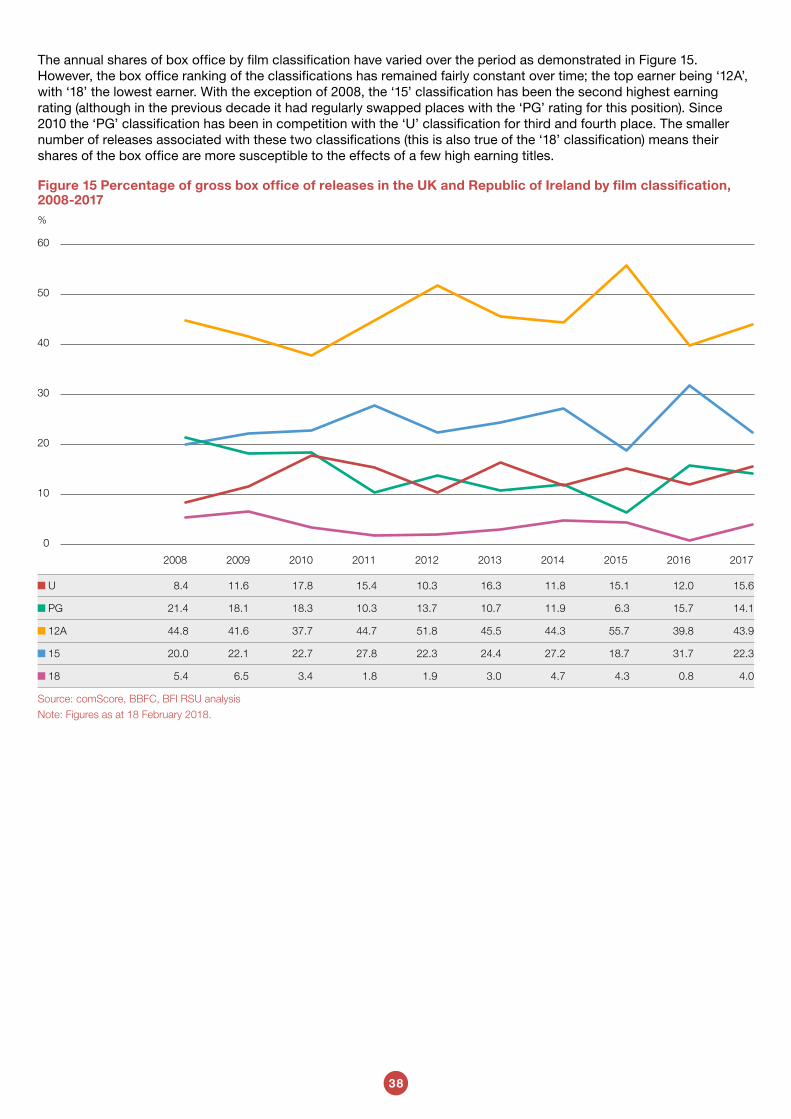
38
The annual shares of box office by film classification have varied over the period as demonstrated in Figure 15. However, the box office ranking of the classifications has remained fairly constant over time; the top earner being ‘12A’, with ‘18’ the lowest earner. With the exception of 2008, the ‘15’ classification has been the second highest earning rating (although in the previous decade it had regularly swapped places with the ‘PG’ rating for this position). Since 2010 the ‘PG’ classification has been in competition with the ‘U’ classification for third and fourth place. The smaller number of releases associated with these two classifications (this is also true of the ‘18’ classification) means their shares of the box office are more susceptible to the effects of a few high earning titles.
Figure 15 Percentage of gross box office of releases in the UK and Republic of Ireland by film classification, 2008-2017%
U 8.4 11.6 17.8 15.4 10.3 16.3 11.8 15.1 12.0 15.6
PG 21.4 18.1 18.3 10.3 13.7 10.7 11.9 6.3 15.7 14.1
12A 44.8 41.6 37.7 44.7 51.8 45.5 44.3 55.7 39.8 43.9
15 20.0 22.1 22.7 27.8 22.3 24.4 27.2 18.7 31.7 22.3
18 5.4 6.5 3.4 1.8 1.9 3.0 4.7 4.3 0.8 4.0
Source: comScore, BBFC, BFI RSU analysis
Note: Figures as at 18 February 2018.
0
10
20
30
40
50
60
2017201620152014201320122011201020092008

Research & Statistics Unit21 Stephen Street, London W1T 1LN
bfi.org.uk/statistics