Embed Size (px)
Citation preview
SBICAP Securities Limited 2nd Floor, A Wing, Mafatlal Chambers, Lower Parel, Mumbai - 400013 E-mail: [email protected]
Rabindra Nath Nayak Securities Research 91-22-42273310 [email protected]
Nirav Vasa Securities Research 91-22-42273460 [email protected]
Alok Ramachandran Securities Research 91-22-42273478 [email protected]
(For Private circulation only) Please refer to our disclaimer given at the back cover page
We find value in BHEL, despite the decline in revenue visibility as:(1) the company’s current underperformance compared to Sensexover the last three quarters is overdone, (2) revenue visibility is thehighest among its peers, (3) growth potential of the industrial andinternational orders remains untapped, and (4) despite pricingpressure, BHEL will continue to show positive margin surprisesdue to multiple operating and financial levers.
In our view, the current underperformance has been priced in allthe near-term negatives concerning growth. The stock is trading atits lowest 2-year forward P/E of 12.6x FY13E EPS of `152. We feelthe stock warrants value at this price for its business andfinancial strength. We initiate our coverage with an ADD ratingwith a target price of `2167.
Investment Rationale
Visibility is down but still the highest among its peers: Despitenegative sectoral headwinds of the power equipment sector, at3.7xFY11 revenues, BHEL still holds the highest visibility in thesector. Given the order quality, we feel the current order bookyields strong revenue CAGR of 9% in FY11-FY14E. Consideringthe revenue base, (~10% of the country’s infrastructure spent) wefeel the growth is commendable.
Pick up in industrial capex to see gradual shift from power toindustry segment: We expect stagnation of incremental thermalpower capacity post-FY17E. Increase in BTG capacities by newplayers would challenge BHEL’s dominance in power space. Butthe proven technological base of BHEL will stand out well inproviding good order traction from the industry, which isundergoing a declining phase. We expect the industry segment toreport 49% revenue in FY17E against 25% in FY11.
Still have margin levers to play out well in competition: Despitecompetition from Chinese manufacturers, margin threat for BHELis limited. With increasing backward integration (at 67% currently)and wage cost settled until FY17, BHEL holds operating levers toprotect margins despite a potential compromise due tocompetition. Lower operational capex and higher R&D expense(2.5% of the turnover) to yield financial levers in sustaining healthymargin at the net level.
Valuation is at two-year low, attractive for business strength.Initiate with an ADD rating: Sectoral headwinds like (1) pooravailability of domestic coal and rising international coal prices, (2)poor availability of gas, and (3) poor health of SEBs are leading tothe possible project deferment for BHEL. Nevertheless, at two-yearlow valuation on the back of three quarters of underperformancehas put BHEL a good value play at the CMP of `1,930. We initiatewith an ADD rating with a target price of `2,167.
(` bn) Key Financials FY10 FY11 FY12E FY13E
Total Revenue 334 422 462 512 Growth % 24.8 26.6 9.4 10.8 EBITDA 59.2 87.0 97.7 107.0 EBITDA % 17.7 20.6 21.2 20.9 Net Profit 43.0 60.1 67.6 74.1 EPS (In `) 88 123 138 151 CEPS (In `) 97 134 152 167 EV/EBITDA 12.3 9.1 7.8 6.8 EV/Sales 2.6 2.1 1.8 1.5 RoE % 27.0 29.8 26.6 23.8 ROCE % 27.0 29.8 26.7 23.8
Stock Info Face Value (`) 10 Shares O/S (mn) 490 Market Cap (` bn) 944.4 52-Week Range(H/L) 2695 / 1871.55 1-Year Avg Vol (mn) 0.8 Nifty 5,581 Bloomberg Code BHEL IN
Year End Mar
Shareholding Pattern (%) (June' 11)
Foreign 13.2
Institutions 12.7
Corporate Holding 4.2
Promoters 67.7
Public & Others 2.2
Relative Price Performance
CMP: `1,930 Target: `2,167 Upside: 12% Rating: ADD
Initiating Coverage
BHEL India Equity
Capital Good
14 July 2011
BHEL SBICAP Securities Ltd
2 Please refer to our disclaimer give at the last page
Securities Research
Table of Contents
Investment Rationale .................................................................................................................... 3
Valuation ......................................................................................................................................... 8
Financial Analysis ........................................................................................................................ 12
Industry Snapshot ........................................................................................................................ 15
Summary ....................................................................................................................................... 16
Industry Concern .......................................................................................................................... 17
Company Profile ........................................................................................................................... 17
Financial Statements .................................................................................................................... 19
SBICAP Securities Ltd BHEL
Securities Research Please refer to our disclaimer give at the last page 3
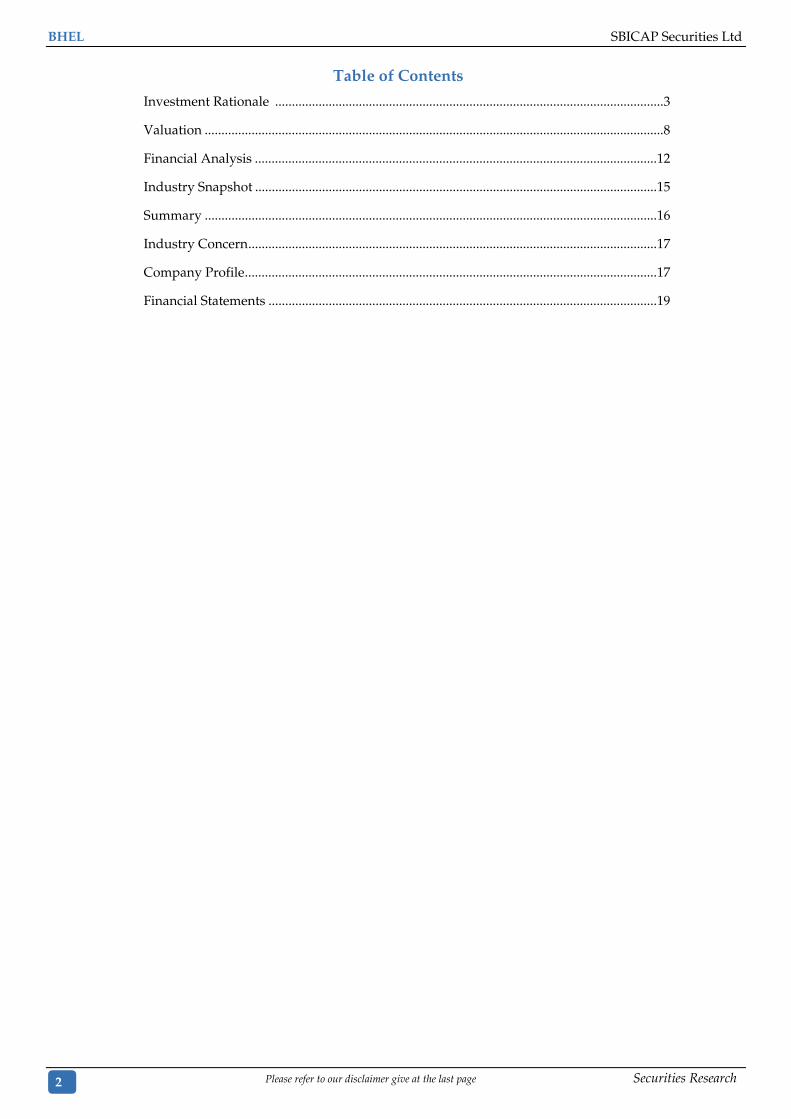
INVESTMENT RATIONALE Despite decline in order visibility, the revenue visibility is highest among its peers We understand that the valuation of BHEL has contracted due to decline in visibility of order inflows. The 2-year forward P/E has contracted from 20x in FY09 to 13x in FY11. Fuel-related concerns are leading to deferment of power projects by the customers; thus, impacting the valuation of BHEL’s power business. However, BHEL’s current order backlog has the highest visibility among its peers (the book-to-bill ratio of 3.7x). The current order book presents a revenue visibility until FY14.
Visibility is set to decline with flat growth in order book, but…
0
1
2
3
4
5
0
500
1,000
1,500
2,000
FY01
FY02
FY03
FY04
FY05
FY06
FY07
FY08
FY09
FY10
FY11
FY12
E
FY13
E
FY14
E
FY15
E
FY16
E
FY17
E
Revenues in Rs Bn Total Orderbook in Rs Bn
Total Inflow in Rs Bn Visibility (Total Orderbook/Revenue) Source: SBICAP Securities Research
…the current visibility is still the highest among its peers Order backlog (Rs bn) Book-to-bill (x)
Thermax 72 1.6
Crompton Greaves 71 0.7
ABB 84 1.3
L&T 1149 2.7
Siemens India 151 1.5 Source: SBICAP Securities Research
Power segment orders to stagnate and visibility to decline… Currently, power sector constitutes 70% of the total revenues of BHEL. Going ahead, the growth in thermal generation projects in India is expected to stagnate. The new BTG manufacturers would be aggressively bid to capture market share, despite a lull in the generation capex in the country. These companies will find little potential in export business in the initial years of manufacturing. On this backdrop, we understand that the order inflows in the power segment will decline. We have incorporated the bulk tendering of NTPC and the order inflows of the super-critical projects from its JVs with states into our estimates. Through this, BHEL will continue to maintain satisfactory order inflows during the next two years.
The 2-year forward P/E has contracted from 20x in FY09 to 13x in FY11.
We have incorporated the bulk tendering of NTPC and the order inflows of the super-critical projects from its JVs with states into our estimates.
BHEL SBICAP Securities Ltd
4 Please refer to our disclaimer give at the last page
Securities Research
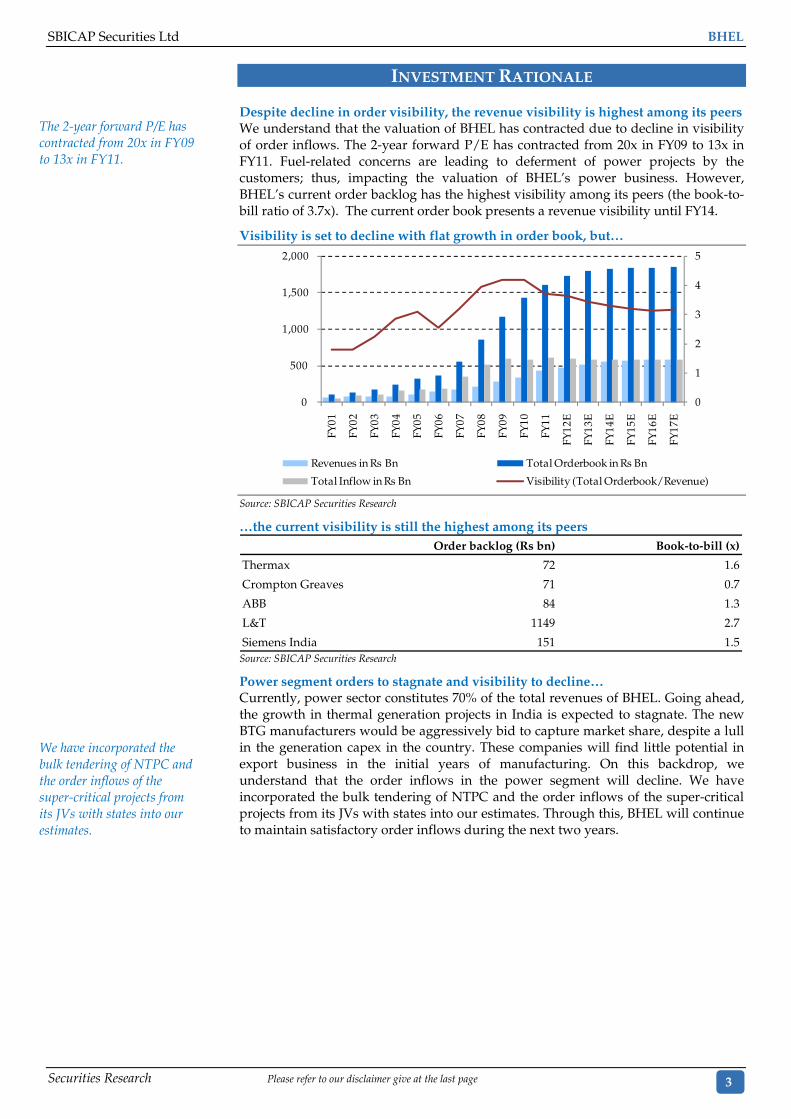
Power segment revenue visibility is declining
0.0
1.2
2.4
3.6
4.8
-12
0
12
24
36
48
FY05
FY06
FY07
FY08
FY09
FY10
FY11
FY12
E
FY13
E
FY14
E
FY15
E
FY16
E
FY17
E
Power Segment Visibility Industry Segment VisibilityYoY Revenue Growth (Power,LHS) YoY Revenue Growth (Industry,LHS)
Source: SBICAP Securities Research
BHEL commands 100% share in the repairs and maintenance (R&M) works of the thermal power plants. We expect the R&M and after sales service businesses to grow as the company commissions projects.
Sales after sales (SAS) revenue to see good traction in the power segment
0
5
9
14
18
0
125
250
375
500
FY03
FY04
FY05
FY06
FY07
FY08
FY09
FY10
FY11
FY12
E
FY13
E
FY14
E
FY15
E
FY16
E
FY17
E
SAS order Inflow in Rs Bn (LHS)Total Order Inflow in The Power Segment in Rs Bn(LHS)
SAS % in total Power Segment Order (RHS)
Source: SBICAP Securities Research
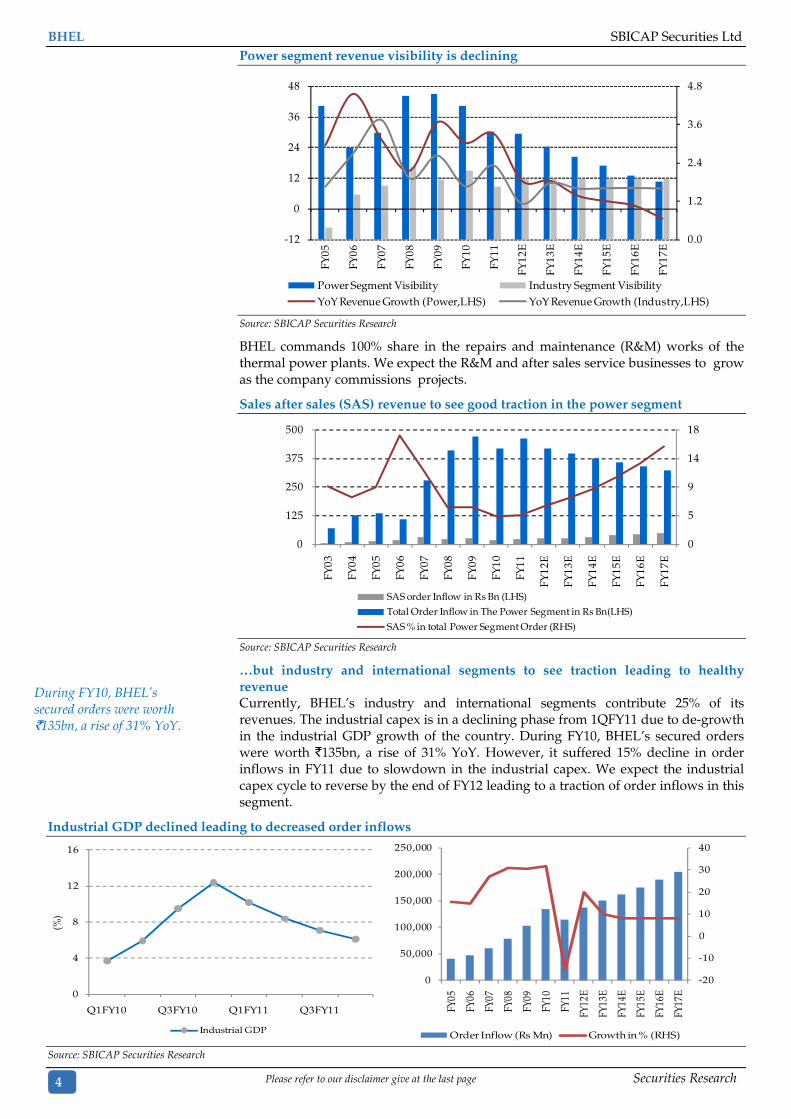
…but industry and international segments to see traction leading to healthy revenue Currently, BHEL’s industry and international segments contribute 25% of its revenues. The industrial capex is in a declining phase from 1QFY11 due to de-growth in the industrial GDP growth of the country. During FY10, BHEL’s secured orders were worth `135bn, a rise of 31% YoY. However, it suffered 15% decline in order inflows in FY11 due to slowdown in the industrial capex. We expect the industrial capex cycle to reverse by the end of FY12 leading to a traction of order inflows in this segment.
Industrial GDP declined leading to decreased order inflows
0
4
8
12
16
Q1FY10 Q3FY10 Q1FY11 Q3FY11
(%)
Industrial GDP
-20
-10
0
10
20
30
40
0
50,000
100,000
150,000
200,000
250,000
FY05
FY06
FY07
FY08
FY09
FY10
FY11
FY12
E
FY13
E
FY14
E
FY15
E
FY16
E
FY17
E
Order Inflow (Rs Mn) Growth in % (RHS) Source: SBICAP Securities Research
During FY10, BHEL’s secured orders were worth `135bn, a rise of 31% YoY.
SBICAP Securities Ltd BHEL
Securities Research Please refer to our disclaimer give at the last page 5
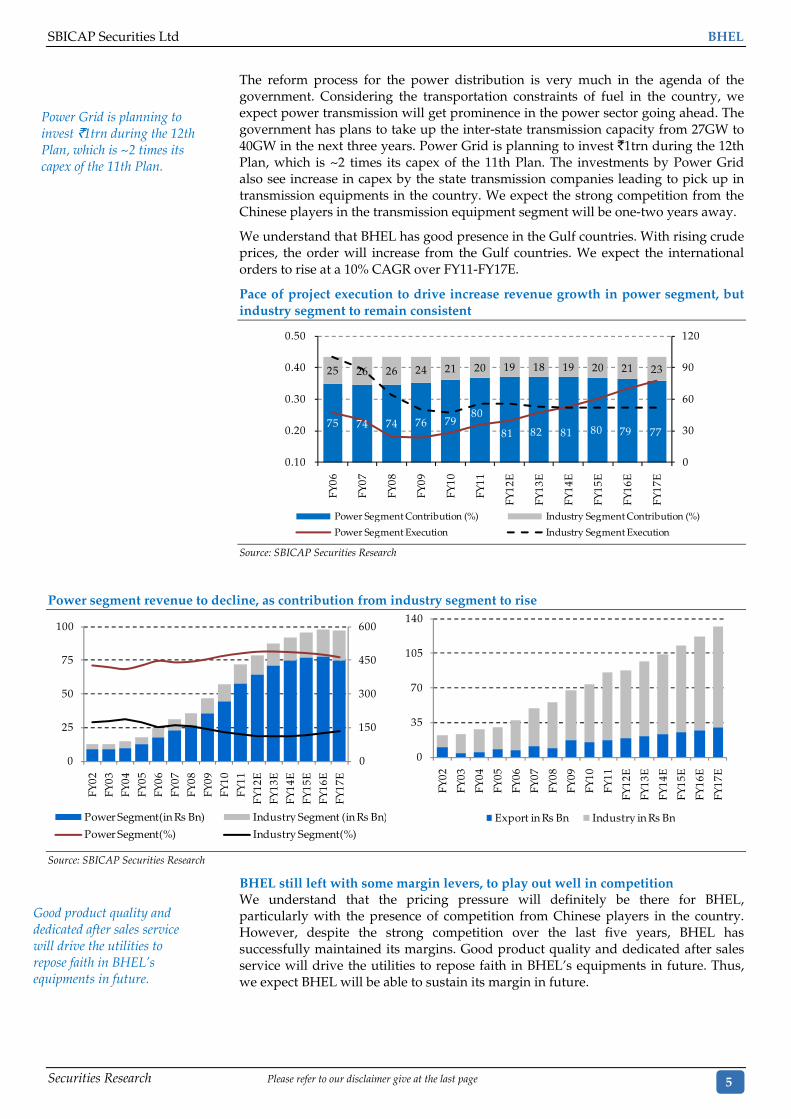
The reform process for the power distribution is very much in the agenda of the government. Considering the transportation constraints of fuel in the country, we expect power transmission will get prominence in the power sector going ahead. The government has plans to take up the inter-state transmission capacity from 27GW to 40GW in the next three years. Power Grid is planning to invest `1trn during the 12th Plan, which is ~2 times its capex of the 11th Plan. The investments by Power Grid also see increase in capex by the state transmission companies leading to pick up in transmission equipments in the country. We expect the strong competition from the Chinese players in the transmission equipment segment will be one-two years away.
We understand that BHEL has good presence in the Gulf countries. With rising crude prices, the order will increase from the Gulf countries. We expect the international orders to rise at a 10% CAGR over FY11-FY17E.
Pace of project execution to drive increase revenue growth in power segment, but industry segment to remain consistent
75 74 74 76 7980
81 82 81 80 79 77
25 26 26 24 21 20 19 18 19 20 21 23
0
30
60
90
120
0.10
0.20
0.30
0.40
0.50 FY
06
FY07
FY08
FY09
FY10
FY11
FY12
E
FY13
E
FY14
E
FY15
E
FY16
E
FY17
E
Power Segment Contribution (%) Industry Segment Contribution (%)
Power Segment Execution Industry Segment Execution
Source: SBICAP Securities Research
Power segment revenue to decline, as contribution from industry segment to rise
0
150
300
450
600
0
25
50
75
100
FY02
FY03
FY04
FY05
FY06
FY07
FY08
FY09
FY10
FY11
FY12
EFY
13E
FY14
EFY
15E
FY16
EFY
17E
Power Segment(in Rs Bn) Industry Segment (in Rs Bn)
Power Segment(%) Industry Segment(%)
0
35
70
105
140
FY02
FY03
FY04
FY05
FY06
FY07
FY08
FY09
FY10
FY11
FY12
E
FY13
E
FY14
E
FY15
E
FY16
E
FY17
E
Export in Rs Bn Industry in Rs Bn
Source: SBICAP Securities Research
BHEL still left with some margin levers, to play out well in competition We understand that the pricing pressure will definitely be there for BHEL, particularly with the presence of competition from Chinese players in the country. However, despite the strong competition over the last five years, BHEL has successfully maintained its margins. Good product quality and dedicated after sales service will drive the utilities to repose faith in BHEL’s equipments in future. Thus, we expect BHEL will be able to sustain its margin in future.
Power Grid is planning to invest `1trn during the 12th Plan, which is ~2 times its capex of the 11th Plan.
Good product quality and dedicated after sales service will drive the utilities to repose faith in BHEL’s equipments in future.
BHEL SBICAP Securities Ltd
6 Please refer to our disclaimer give at the last page
Securities Research
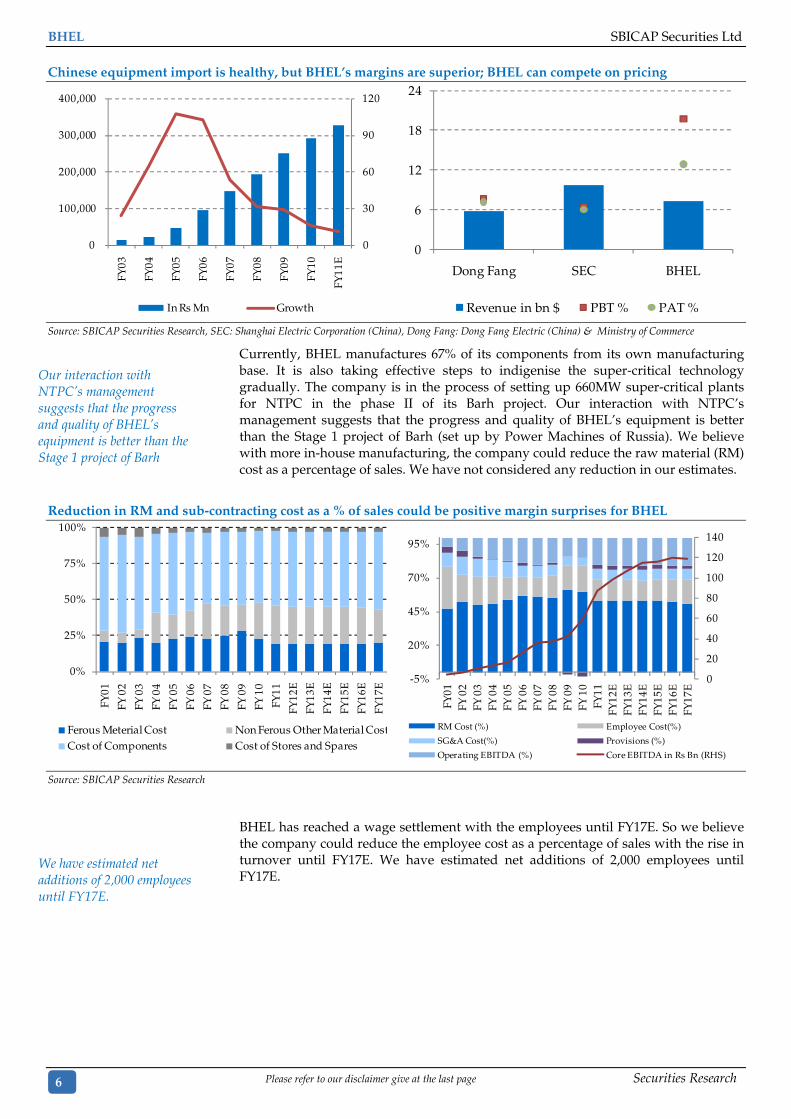
Chinese equipment import is healthy, but BHEL’s margins are superior; BHEL can compete on pricing
0
30
60
90
120
0
100,000
200,000
300,000
400,000
FY03
FY04
FY05
FY06
FY07
FY08
FY09
FY10
FY11
E
In Rs Mn Growth
0
6
12
18
24
Dong Fang SEC BHEL
Revenue in bn $ PBT % PAT % Source: SBICAP Securities Research, SEC: Shanghai Electric Corporation (China), Dong Fang: Dong Fang Electric (China) & Ministry of Commerce
Currently, BHEL manufactures 67% of its components from its own manufacturing base. It is also taking effective steps to indigenise the super-critical technology gradually. The company is in the process of setting up 660MW super-critical plants for NTPC in the phase II of its Barh project. Our interaction with NTPC’s management suggests that the progress and quality of BHEL’s equipment is better than the Stage 1 project of Barh (set up by Power Machines of Russia). We believe with more in-house manufacturing, the company could reduce the raw material (RM) cost as a percentage of sales. We have not considered any reduction in our estimates.
Reduction in RM and sub-contracting cost as a % of sales could be positive margin surprises for BHEL
0%
25%
50%
75%
100%
FY01
FY 0
2
FY 0
3
FY 0
4
FY 0
5
FY 0
6
FY 0
7
FY 0
8
FY 0
9
FY 1
0
FY11
FY12
E
FY13
E
FY14
E
FY15
E
FY16
E
FY17
E
Ferous Meterial Cost Non Ferous Other Material CostCost of Components Cost of Stores and Spares
0
20
40
60
80
100
120
140
-5%
20%
45%
70%
95%
FY01
FY 0
2FY
03
FY 0
4FY
05
FY 0
6FY
07
FY 0
8FY
09
FY 1
0FY
11FY
12E
FY13
EFY
14E
FY15
EFY
16E
FY17
E
RM Cost (%) Employee Cost(%)
SG&A Cost(%) Provisions (%)
Operating EBITDA (%) Core EBITDA in Rs Bn (RHS) Source: SBICAP Securities Research
BHEL has reached a wage settlement with the employees until FY17E. So we believe the company could reduce the employee cost as a percentage of sales with the rise in turnover until FY17E. We have estimated net additions of 2,000 employees until FY17E.
Our interaction with NTPC’s management suggests that the progress and quality of BHEL’s equipment is better than the Stage 1 project of Barh
We have estimated net additions of 2,000 employees until FY17E.
SBICAP Securities Ltd BHEL
Securities Research Please refer to our disclaimer give at the last page 7
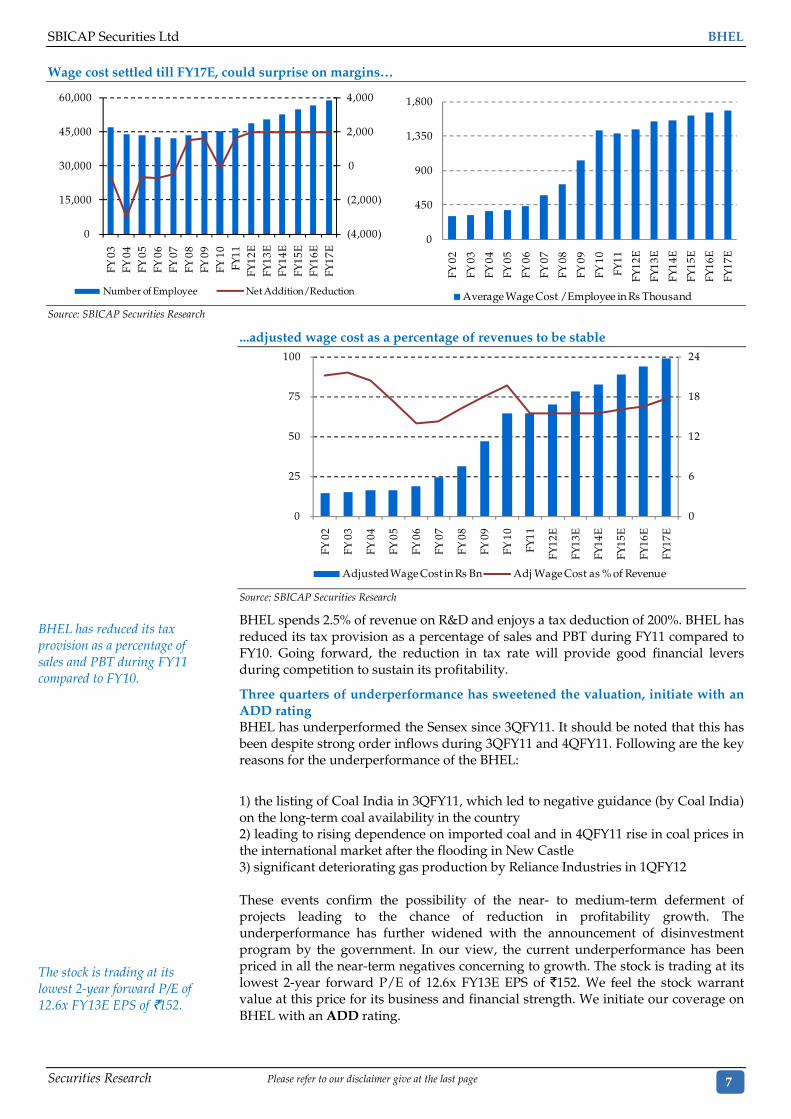
Wage cost settled till FY17E, could surprise on margins…
(4,000)
(2,000)
0
2,000
4,000
0
15,000
30,000
45,000
60,000 FY
03
FY 0
4FY
05
FY 0
6FY
07
FY 0
8FY
09
FY 1
0FY
11FY
12E
FY13
EFY
14E
FY15
EFY
16E
FY17
E
Number of Employee Net Addition/Reduction
0
450
900
1,350
1,800
FY 0
2
FY 0
3
FY 0
4
FY 0
5
FY 0
6
FY 0
7
FY 0
8
FY 0
9
FY 1
0
FY11
FY12
E
FY13
E
FY14
E
FY15
E
FY16
E
FY17
E
Average Wage Cost /Employee in Rs Thousand Source: SBICAP Securities Research
...adjusted wage cost as a percentage of revenues to be stable
0
6
12
18
24
0
25
50
75
100
FY 0
2
FY 0
3
FY 0
4
FY 0
5
FY 0
6
FY 0
7
FY 0
8
FY 0
9
FY 1
0
FY11
FY12
E
FY13
E
FY14
E
FY15
E
FY16
E
FY17
E
Adjusted Wage Cost in Rs Bn Adj Wage Cost as % of Revenue
Source: SBICAP Securities Research
BHEL spends 2.5% of revenue on R&D and enjoys a tax deduction of 200%. BHEL has reduced its tax provision as a percentage of sales and PBT during FY11 compared to FY10. Going forward, the reduction in tax rate will provide good financial levers during competition to sustain its profitability.
Three quarters of underperformance has sweetened the valuation, initiate with an ADD rating BHEL has underperformed the Sensex since 3QFY11. It should be noted that this has been despite strong order inflows during 3QFY11 and 4QFY11. Following are the key reasons for the underperformance of the BHEL:
1) the listing of Coal India in 3QFY11, which led to negative guidance (by Coal India) on the long-term coal availability in the country 2) leading to rising dependence on imported coal and in 4QFY11 rise in coal prices in the international market after the flooding in New Castle 3) significant deteriorating gas production by Reliance Industries in 1QFY12 These events confirm the possibility of the near- to medium-term deferment of projects leading to the chance of reduction in profitability growth. The underperformance has further widened with the announcement of disinvestment program by the government. In our view, the current underperformance has been priced in all the near-term negatives concerning to growth. The stock is trading at its lowest 2-year forward P/E of 12.6x FY13E EPS of `152. We feel the stock warrant value at this price for its business and financial strength. We initiate our coverage on BHEL with an ADD rating.
BHEL has reduced its tax provision as a percentage of sales and PBT during FY11 compared to FY10.
The stock is trading at its lowest 2-year forward P/E of 12.6x FY13E EPS of `152.
BHEL SBICAP Securities Ltd
8 Please refer to our disclaimer give at the last page
Securities Research
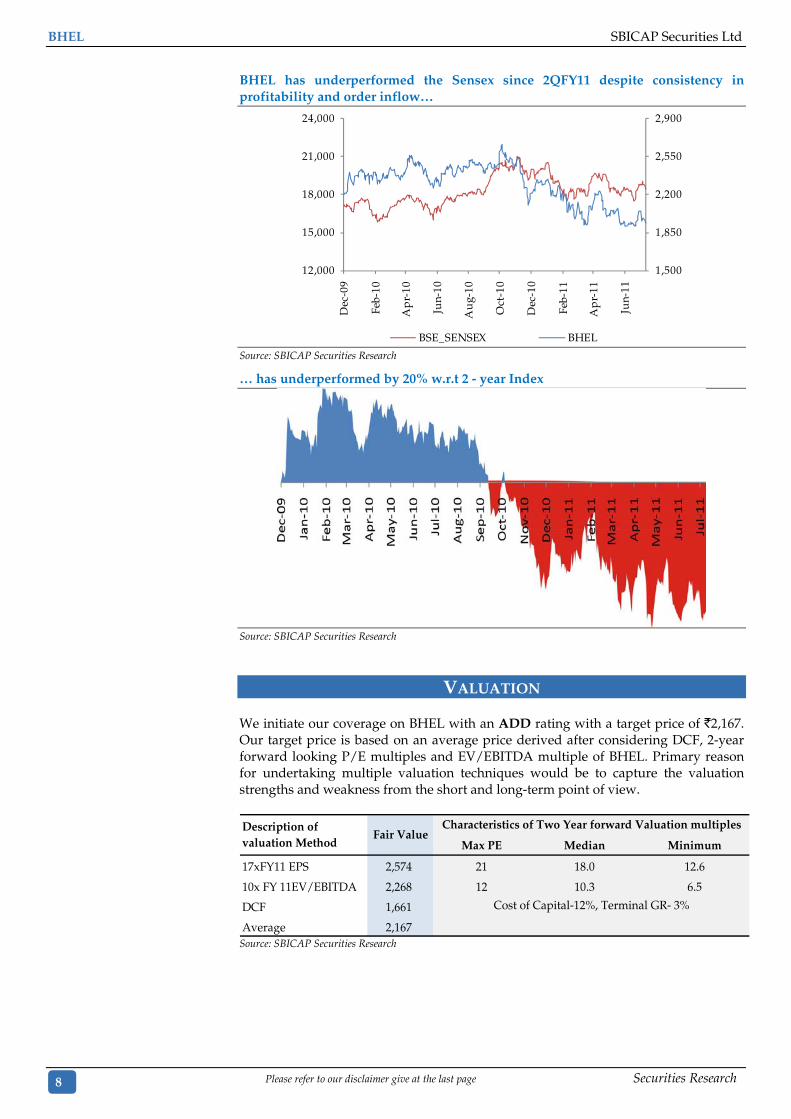
BHEL has underperformed the Sensex since 2QFY11 despite consistency in profitability and order inflow…
1,500
1,850
2,200
2,550
2,900
12,000
15,000
18,000
21,000
24,000
Dec
-09
Feb-
10
Ap
r-10
Jun-
10
Au
g-10
Oct
-10
Dec
-10
Feb-
11
Ap
r-11
Jun-
11
BSE_SENSEX BHEL Source: SBICAP Securities Research
… has underperformed by 20% w.r.t 2 - year Index
Source: SBICAP Securities Research
VALUATION
We initiate our coverage on BHEL with an ADD rating with a target price of `2,167. Our target price is based on an average price derived after considering DCF, 2-year forward looking P/E multiples and EV/EBITDA multiple of BHEL. Primary reason for undertaking multiple valuation techniques would be to capture the valuation strengths and weakness from the short and long-term point of view.
Max PE Median Minimum
17xFY11 EPS 2,574 21 18.0 12.6
10x FY 11EV/EBITDA 2,268 12 10.3 6.5
DCF 1,661
Average 2,167
Description of valuation Method
Fair Value
Cost of Capital-12%, Terminal GR- 3%
Characteristics of Two Year forward Valuation multiples
Source: SBICAP Securities Research
SBICAP Securities Ltd BHEL
Securities Research Please refer to our disclaimer give at the last page 9
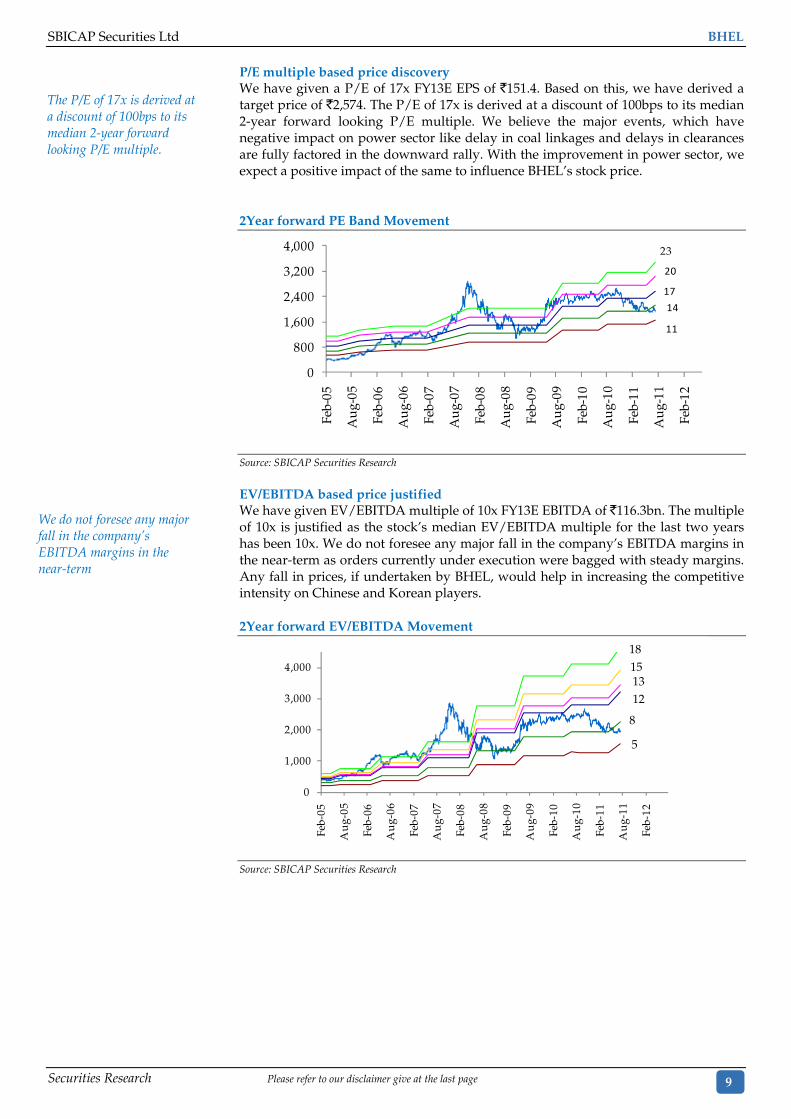
P/E multiple based price discovery We have given a P/E of 17x FY13E EPS of `151.4. Based on this, we have derived a target price of `2,574. The P/E of 17x is derived at a discount of 100bps to its median 2-year forward looking P/E multiple. We believe the major events, which have negative impact on power sector like delay in coal linkages and delays in clearances are fully factored in the downward rally. With the improvement in power sector, we expect a positive impact of the same to influence BHEL’s stock price. 2Year forward PE Band Movement
0
800
1,600
2,400
3,200
4,000
Feb-
05
Au
g-05
Feb-
06
Au
g-06
Feb-
07
Au
g-07
Feb-
08
Au
g-08
Feb-
09
Au
g-09
Feb-
10
Au
g-10
Feb-
11
Au
g-11
Feb-
12
23
20
17
14
11
Source: SBICAP Securities Research EV/EBITDA based price justified We have given EV/EBITDA multiple of 10x FY13E EBITDA of `116.3bn. The multiple of 10x is justified as the stock’s median EV/EBITDA multiple for the last two years has been 10x. We do not foresee any major fall in the company’s EBITDA margins in the near-term as orders currently under execution were bagged with steady margins. Any fall in prices, if undertaken by BHEL, would help in increasing the competitive intensity on Chinese and Korean players. 2Year forward EV/EBITDA Movement
0
1,000
2,000
3,000
4,000
Feb-
05
Au
g-05
Feb-
06
Au
g-06
Feb-
07
Au
g-07
Feb-
08
Au
g-08
Feb-
09
Au
g-09
Feb-
10
Au
g-10
Feb-
11
Au
g-11
Feb-
1218151312
8
5
Source: SBICAP Securities Research
The P/E of 17x is derived at a discount of 100bps to its median 2-year forward looking P/E multiple.
We do not foresee any major fall in the company’s EBITDA margins in the near-term
BHEL SBICAP Securities Ltd
10 Please refer to our disclaimer give at the last page
Securities Research
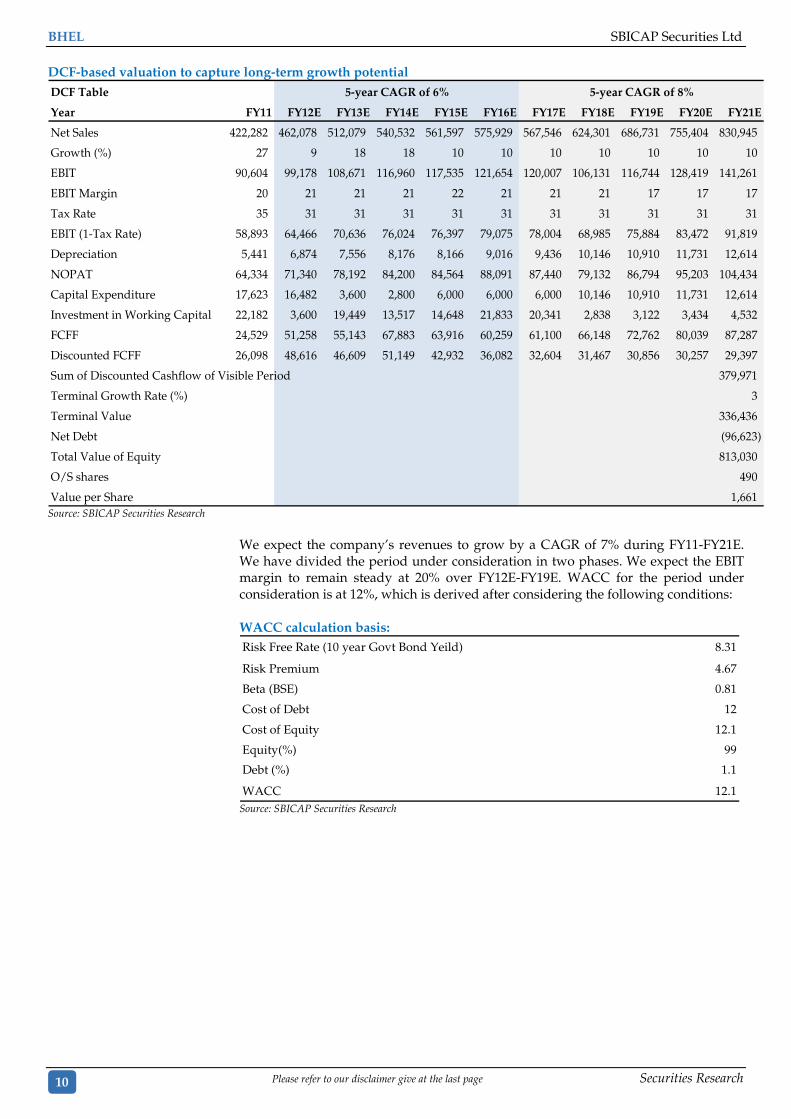
DCF-based valuation to capture long-term growth potential DCF Table
Year FY11 FY12E FY13E FY14E FY15E FY16E FY17E FY18E FY19E FY20E FY21E
Net Sales 422,282 462,078 512,079 540,532 561,597 575,929 567,546 624,301 686,731 755,404 830,945
Growth (%) 27 9 18 18 10 10 10 10 10 10 10
EBIT 90,604 99,178 108,671 116,960 117,535 121,654 120,007 106,131 116,744 128,419 141,261
EBIT Margin 20 21 21 21 22 21 21 21 17 17 17
Tax Rate 35 31 31 31 31 31 31 31 31 31 31
EBIT (1-Tax Rate) 58,893 64,466 70,636 76,024 76,397 79,075 78,004 68,985 75,884 83,472 91,819
Depreciation 5,441 6,874 7,556 8,176 8,166 9,016 9,436 10,146 10,910 11,731 12,614
NOPAT 64,334 71,340 78,192 84,200 84,564 88,091 87,440 79,132 86,794 95,203 104,434
Capital Expenditure 17,623 16,482 3,600 2,800 6,000 6,000 6,000 10,146 10,910 11,731 12,614
Investment in Working Capital 22,182 3,600 19,449 13,517 14,648 21,833 20,341 2,838 3,122 3,434 4,532
FCFF 24,529 51,258 55,143 67,883 63,916 60,259 61,100 66,148 72,762 80,039 87,287
Discounted FCFF 26,098 48,616 46,609 51,149 42,932 36,082 32,604 31,467 30,856 30,257 29,397
Sum of Discounted Cashflow of Visible Period 379,971
Terminal Growth Rate (%) 3
Terminal Value 336,436
Net Debt (96,623)
Total Value of Equity 813,030
O/S shares 490
Value per Share 1,661
5-year CAGR of 6% 5-year CAGR of 8%
Source: SBICAP Securities Research
We expect the company’s revenues to grow by a CAGR of 7% during FY11-FY21E. We have divided the period under consideration in two phases. We expect the EBIT margin to remain steady at 20% over FY12E-FY19E. WACC for the period under consideration is at 12%, which is derived after considering the following conditions: WACC calculation basis: Risk Free Rate (10 year Govt Bond Yeild) 8.31
Risk Premium 4.67
Beta (BSE) 0.81
Cost of Debt 12
Cost of Equity 12.1
Equity(%) 99
Debt (%) 1.1
WACC 12.1 Source: SBICAP Securities Research
SBICAP Securities Ltd BHEL
Securities Research Please refer to our disclaimer give at the last page 11
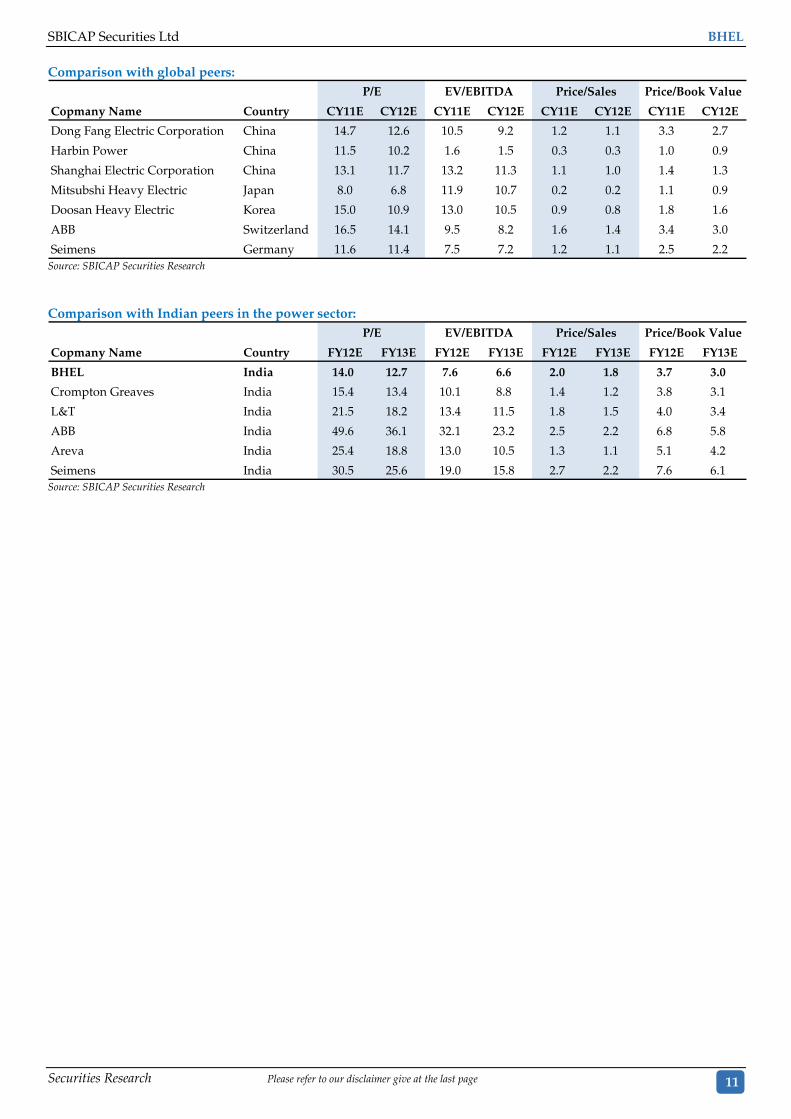
Comparison with global peers:
Copmany Name Country CY11E CY12E CY11E CY12E CY11E CY12E CY11E CY12E
Dong Fang Electric Corporation China 14.7 12.6 10.5 9.2 1.2 1.1 3.3 2.7
Harbin Power China 11.5 10.2 1.6 1.5 0.3 0.3 1.0 0.9
Shanghai Electric Corporation China 13.1 11.7 13.2 11.3 1.1 1.0 1.4 1.3
Mitsubshi Heavy Electric Japan 8.0 6.8 11.9 10.7 0.2 0.2 1.1 0.9
Doosan Heavy Electric Korea 15.0 10.9 13.0 10.5 0.9 0.8 1.8 1.6
ABB Switzerland 16.5 14.1 9.5 8.2 1.6 1.4 3.4 3.0
Seimens Germany 11.6 11.4 7.5 7.2 1.2 1.1 2.5 2.2
P/E EV/EBITDA Price/Sales Price/Book Value
Source: SBICAP Securities Research
Comparison with Indian peers in the power sector:
Copmany Name Country FY12E FY13E FY12E FY13E FY12E FY13E FY12E FY13E
BHEL India 14.0 12.7 7.6 6.6 2.0 1.8 3.7 3.0
Crompton Greaves India 15.4 13.4 10.1 8.8 1.4 1.2 3.8 3.1
L&T India 21.5 18.2 13.4 11.5 1.8 1.5 4.0 3.4
ABB India 49.6 36.1 32.1 23.2 2.5 2.2 6.8 5.8
Areva India 25.4 18.8 13.0 10.5 1.3 1.1 5.1 4.2
Seimens India 30.5 25.6 19.0 15.8 2.7 2.2 7.6 6.1
P/E EV/EBITDA Price/Sales Price/Book Value
Source: SBICAP Securities Research
BHEL SBICAP Securities Ltd
12 Please refer to our disclaimer give at the last page
Securities Research
FINANCIAL ANALYSIS
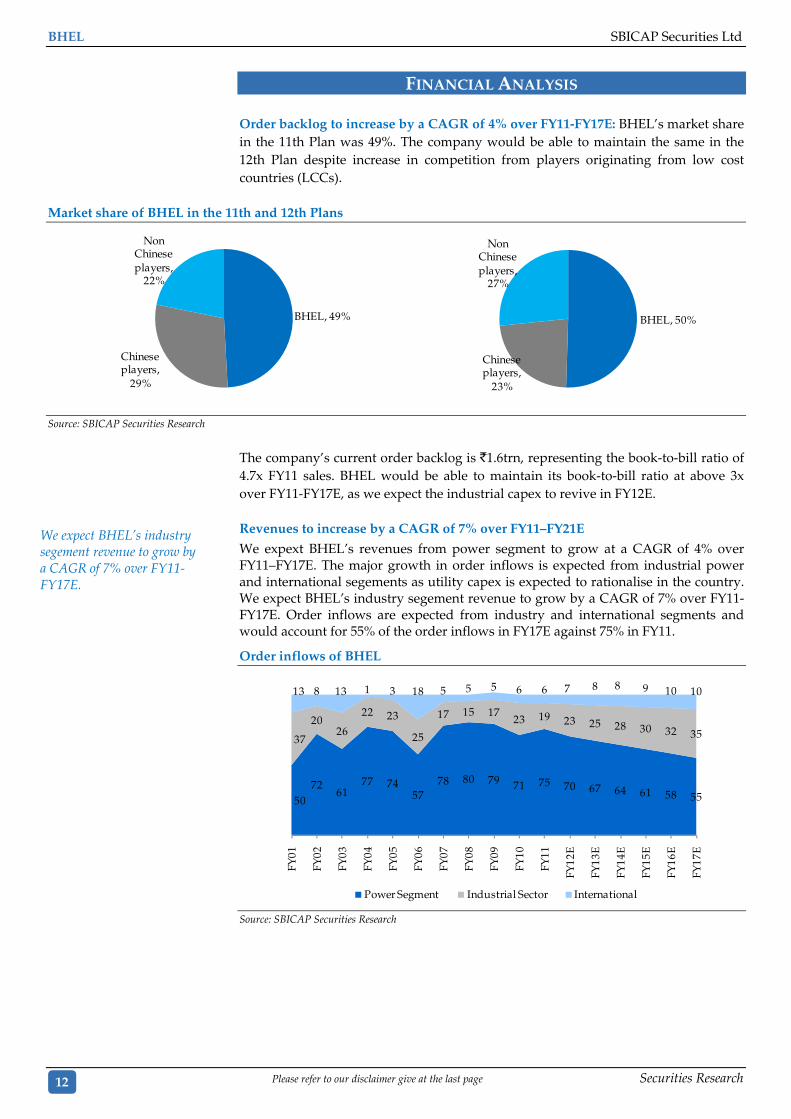
Order backlog to increase by a CAGR of 4% over FY11-FY17E: BHEL’s market share in the 11th Plan was 49%. The company would be able to maintain the same in the 12th Plan despite increase in competition from players originating from low cost countries (LCCs).
Market share of BHEL in the 11th and 12th Plans
BHEL, 49%
Chinese players,
29%
Non Chinese players,
22%
BHEL, 50%
Chinese players,
23%
Non Chinese players,
27%
Source: SBICAP Securities Research
The company’s current order backlog is `1.6trn, representing the book‐to‐bill ratio of 4.7x FY11 sales. BHEL would be able to maintain its book‐to‐bill ratio at above 3x over FY11‐FY17E, as we expect the industrial capex to revive in FY12E. Revenues to increase by a CAGR of 7% over FY11–FY21E
We expext BHEL’s revenues from power segment to grow at a CAGR of 4% over FY11–FY17E. The major growth in order inflows is expected from industrial power and international segements as utility capex is expected to rationalise in the country. We expect BHEL’s industry segement revenue to grow by a CAGR of 7% over FY11-FY17E. Order inflows are expected from industry and international segments and would account for 55% of the order inflows in FY17E against 75% in FY11.
Order inflows of BHEL
5072
6177 74
5778 80 79 71 75 70 67 64 61 58 55
37
2026
22 23
25
17 15 1723 19 23 25 28 30 32 35
13 8 13 1 3 18 5 5 5 6 6 7 8 8 9 10 10
FY01
FY02
FY03
FY04
FY05
FY06
FY07
FY08
FY09
FY10
FY11
FY12
E
FY13
E
FY14
E
FY15
E
FY16
E
FY17
E
Power Segment Industrial Sector International
Source: SBICAP Securities Research
We expect BHEL’s industry segement revenue to grow by a CAGR of 7% over FY11-FY17E.
SBICAP Securities Ltd BHEL
Securities Research Please refer to our disclaimer give at the last page 13
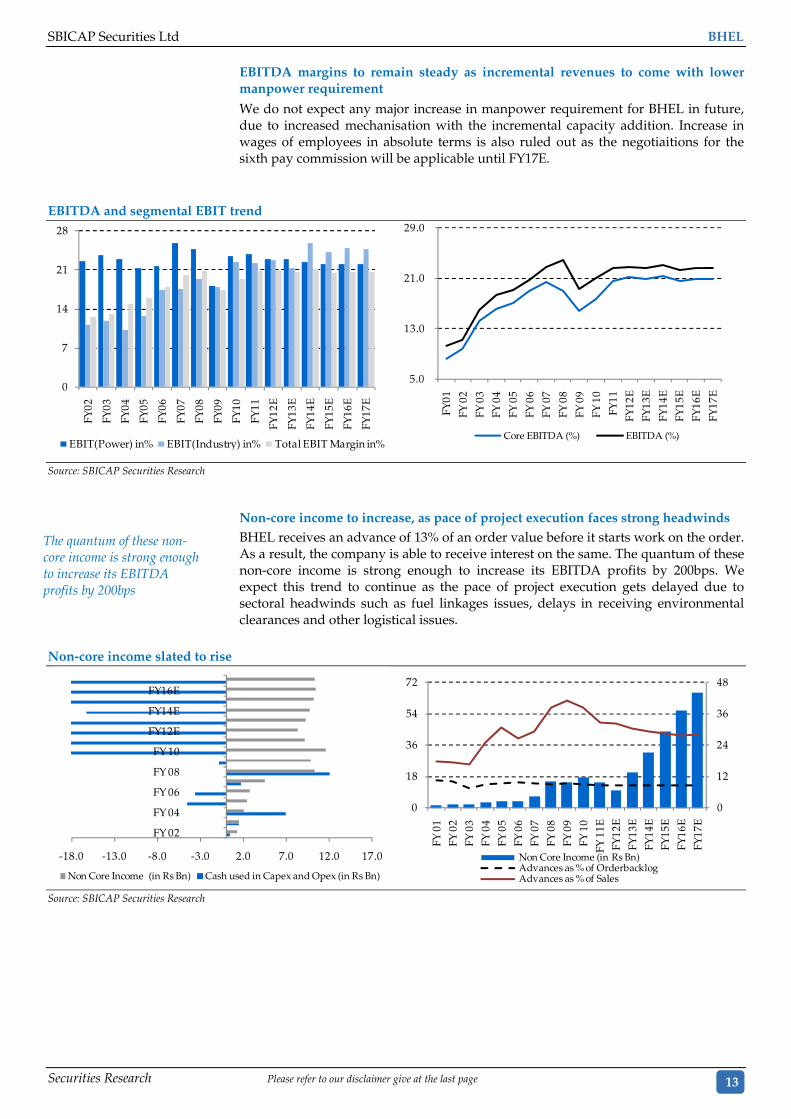
EBITDA margins to remain steady as incremental revenues to come with lower manpower requirement
We do not expect any major increase in manpower requirement for BHEL in future, due to increased mechanisation with the incremental capacity addition. Increase in wages of employees in absolute terms is also ruled out as the negotiaitions for the sixth pay commission will be applicable until FY17E.
EBITDA and segmental EBIT trend
0
7
14
21
28
FY02
FY03
FY04
FY05
FY06
FY07
FY08
FY09
FY10
FY11
FY12
E
FY13
E
FY14
E
FY15
E
FY16
E
FY17
E
EBIT(Power) in% EBIT(Industry) in% Total EBIT Margin in%
5.0
13.0
21.0
29.0
FY01
FY 0
2
FY 0
3
FY 0
4
FY 0
5
FY 0
6
FY 0
7
FY 0
8
FY 0
9
FY 1
0
FY11
FY12
E
FY13
E
FY14
E
FY15
E
FY16
E
FY17
E
Core EBITDA (%) EBITDA (%)
Source: SBICAP Securities Research
Non-core income to increase, as pace of project execution faces strong headwinds BHEL receives an advance of 13% of an order value before it starts work on the order. As a result, the company is able to receive interest on the same. The quantum of these non-core income is strong enough to increase its EBITDA profits by 200bps. We expect this trend to continue as the pace of project execution gets delayed due to sectoral headwinds such as fuel linkages issues, delays in receiving environmental clearances and other logistical issues.
Non-core income slated to rise
-18.0 -13.0 -8.0 -3.0 2.0 7.0 12.0 17.0
FY 02
FY 04
FY 06
FY 08
FY 10
FY12E
FY14E
FY16E
Non Core Income (in Rs Bn) Cash used in Capex and Opex (in Rs Bn)
0
12
24
36
48
0
18
36
54
72
FY 0
1FY
02
FY 0
3FY
04
FY 0
5FY
06
FY 0
7FY
08
FY 0
9FY
10
FY 1
1EFY
12E
FY13
EFY
14E
FY15
EFY
16E
FY17
E
Non Core Income (in Rs Bn)Advances as % of OrderbacklogAdvances as % of Sales
Source: SBICAP Securities Research
The quantum of these non-core income is strong enough to increase its EBITDA profits by 200bps
BHEL SBICAP Securities Ltd
14 Please refer to our disclaimer give at the last page
Securities Research
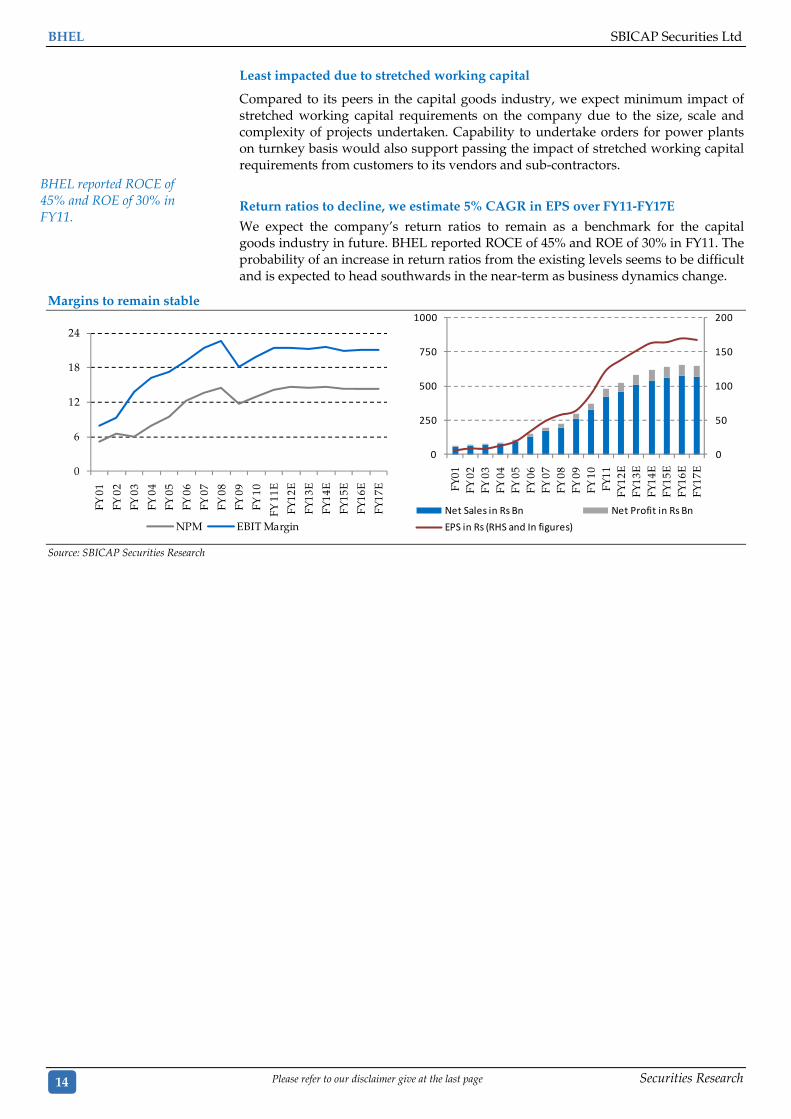
Least impacted due to stretched working capital
Compared to its peers in the capital goods industry, we expect minimum impact of stretched working capital requirements on the company due to the size, scale and complexity of projects undertaken. Capability to undertake orders for power plants on turnkey basis would also support passing the impact of stretched working capital requirements from customers to its vendors and sub-contractors.
Return ratios to decline, we estimate 5% CAGR in EPS over FY11-FY17E
We expect the company’s return ratios to remain as a benchmark for the capital goods industry in future. BHEL reported ROCE of 45% and ROE of 30% in FY11. The probability of an increase in return ratios from the existing levels seems to be difficult and is expected to head southwards in the near-term as business dynamics change.
Margins to remain stable
0
6
12
18
24
FY 0
1
FY 0
2
FY 0
3
FY 0
4
FY 0
5
FY 0
6
FY 0
7
FY 0
8
FY 0
9
FY 1
0
FY 1
1E
FY12
E
FY13
E
FY14
E
FY15
E
FY16
E
FY17
E
NPM EBIT Margin
0
50
100
150
200
0
250
500
750
1000
FY01
FY 0
2FY
03
FY 0
4FY
05
FY 0
6FY
07
FY 0
8FY
09
FY 1
0FY
11FY
12E
FY13
EFY
14E
FY15
EFY
16E
FY17
E
Net Sales in Rs Bn Net Profit in Rs Bn
EPS in Rs (RHS and In figures) Source: SBICAP Securities Research
BHEL reported ROCE of 45% and ROE of 30% in FY11.
SBICAP Securities Ltd BHEL
Securities Research Please refer to our disclaimer give at the last page 15
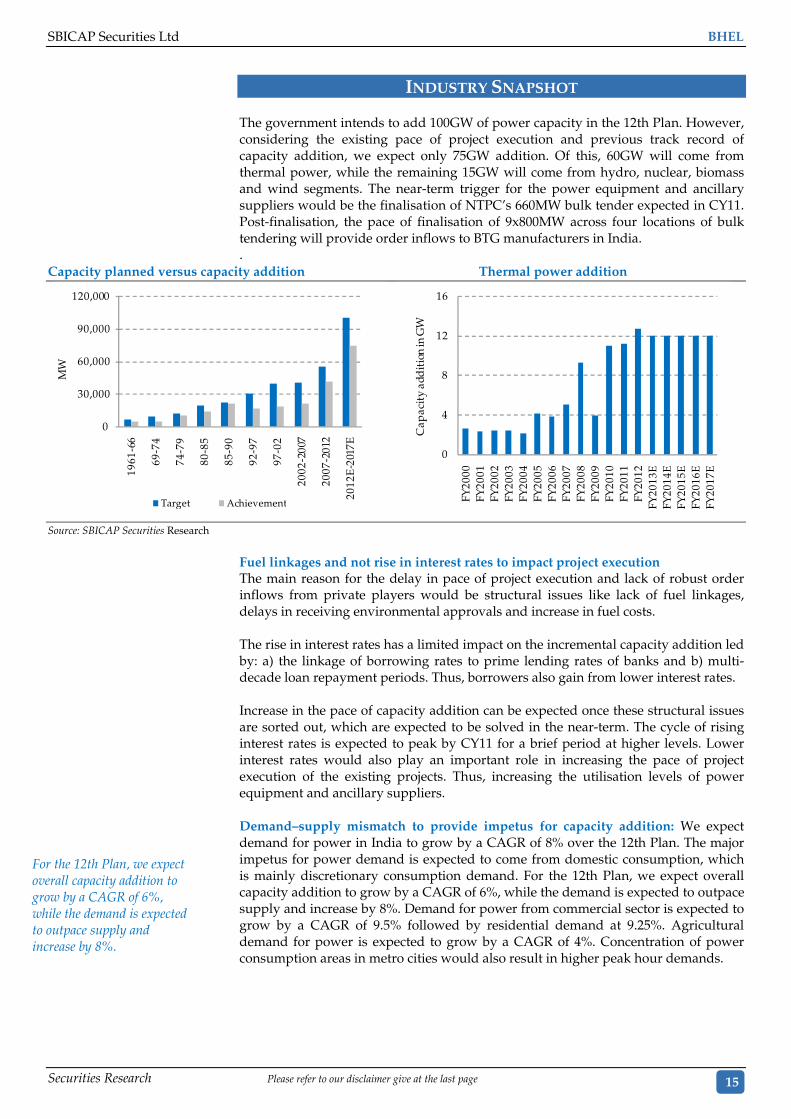
INDUSTRY SNAPSHOT
The government intends to add 100GW of power capacity in the 12th Plan. However, considering the existing pace of project execution and previous track record of capacity addition, we expect only 75GW addition. Of this, 60GW will come from thermal power, while the remaining 15GW will come from hydro, nuclear, biomass and wind segments. The near-term trigger for the power equipment and ancillary suppliers would be the finalisation of NTPC’s 660MW bulk tender expected in CY11. Post-finalisation, the pace of finalisation of 9x800MW across four locations of bulk tendering will provide order inflows to BTG manufacturers in India. .
Capacity planned versus capacity addition Thermal power addition
0
30,000
60,000
90,000
120,000
1961
-66
69-7
4
74-7
9
80-8
5
85-9
0
92-9
7
97-0
2
2002
-200
7
2007
-201
2
2012
E-2
017E
MW
Target Achievement
0
4
8
12
16
FY20
00FY
2001
FY20
02FY
2003
FY20
04FY
2005
FY20
06FY
2007
FY20
08FY
2009
FY20
10FY
2011
FY20
12FY
2013
EFY
2014
EFY
2015
EFY
2016
EFY
2017
E
Cap
acit
y ad
dit
ion
in G
W
Source: SBICAP Securities Research
Fuel linkages and not rise in interest rates to impact project execution The main reason for the delay in pace of project execution and lack of robust order inflows from private players would be structural issues like lack of fuel linkages, delays in receiving environmental approvals and increase in fuel costs. The rise in interest rates has a limited impact on the incremental capacity addition led by: a) the linkage of borrowing rates to prime lending rates of banks and b) multi-decade loan repayment periods. Thus, borrowers also gain from lower interest rates. Increase in the pace of capacity addition can be expected once these structural issues are sorted out, which are expected to be solved in the near-term. The cycle of rising interest rates is expected to peak by CY11 for a brief period at higher levels. Lower interest rates would also play an important role in increasing the pace of project execution of the existing projects. Thus, increasing the utilisation levels of power equipment and ancillary suppliers. Demand–supply mismatch to provide impetus for capacity addition: We expect demand for power in India to grow by a CAGR of 8% over the 12th Plan. The major impetus for power demand is expected to come from domestic consumption, which is mainly discretionary consumption demand. For the 12th Plan, we expect overall capacity addition to grow by a CAGR of 6%, while the demand is expected to outpace supply and increase by 8%. Demand for power from commercial sector is expected to grow by a CAGR of 9.5% followed by residential demand at 9.25%. Agricultural demand for power is expected to grow by a CAGR of 4%. Concentration of power consumption areas in metro cities would also result in higher peak hour demands.
For the 12th Plan, we expect overall capacity addition to grow by a CAGR of 6%, while the demand is expected to outpace supply and increase by 8%.
BHEL SBICAP Securities Ltd
16 Please refer to our disclaimer give at the last page
Securities Research
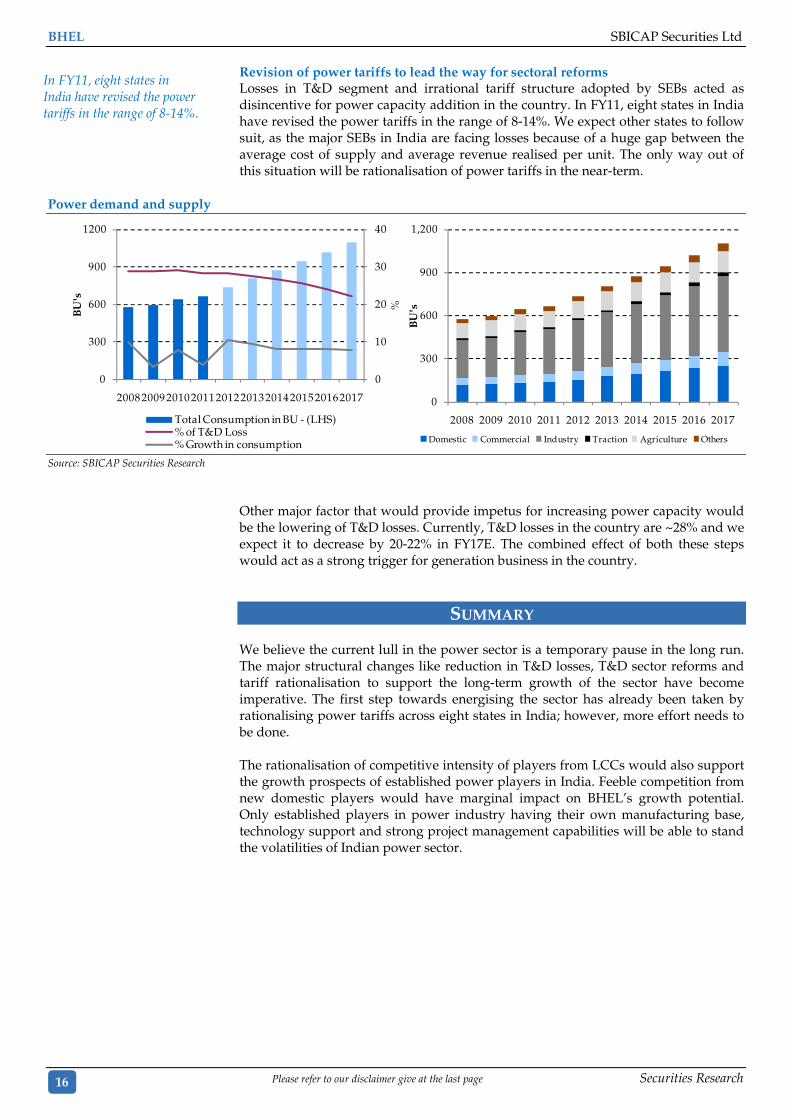
Revision of power tariffs to lead the way for sectoral reforms Losses in T&D segment and irrational tariff structure adopted by SEBs acted as disincentive for power capacity addition in the country. In FY11, eight states in India have revised the power tariffs in the range of 8-14%. We expect other states to follow suit, as the major SEBs in India are facing losses because of a huge gap between the average cost of supply and average revenue realised per unit. The only way out of this situation will be rationalisation of power tariffs in the near-term.
Power demand and supply
0
10
20
30
40
0
300
600
900
1200
2008200920102011 2012201320142015 20162017%
BU
's
Total Consumption in BU - (LHS)% of T&D Loss% Growth in consumption
0
300
600
900
1,200
2008 2009 2010 2011 2012 2013 2014 2015 2016 2017B
U's
Domestic Commercial Industry Traction Agriculture Others
Source: SBICAP Securities Research
Other major factor that would provide impetus for increasing power capacity would be the lowering of T&D losses. Currently, T&D losses in the country are ~28% and we expect it to decrease by 20-22% in FY17E. The combined effect of both these steps would act as a strong trigger for generation business in the country.
SUMMARY
We believe the current lull in the power sector is a temporary pause in the long run. The major structural changes like reduction in T&D losses, T&D sector reforms and tariff rationalisation to support the long-term growth of the sector have become imperative. The first step towards energising the sector has already been taken by rationalising power tariffs across eight states in India; however, more effort needs to be done. The rationalisation of competitive intensity of players from LCCs would also support the growth prospects of established power players in India. Feeble competition from new domestic players would have marginal impact on BHEL’s growth potential. Only established players in power industry having their own manufacturing base, technology support and strong project management capabilities will be able to stand the volatilities of Indian power sector.
In FY11, eight states in India have revised the power tariffs in the range of 8-14%.
SBICAP Securities Ltd BHEL
Securities Research Please refer to our disclaimer give at the last page 17
INDUSTRY CONCERNS Rise in coal prices and delay in fuel linkages We believe one of the reasons for delay in capacity addition would be increase in coal prices. The impact of the same will be felt by most IPPs, who are setting up their power plants on case 1 bidding and have applied for revision of PPA.
Delay in pace of project execution Lack of fuel linkages is one of the main issues, which has delayed the financial closure for multiple projects. Consistent delays in fuel linkages from domestic mines and increased logistical cost of importing coal have also acted as major concerns for the entire industry.
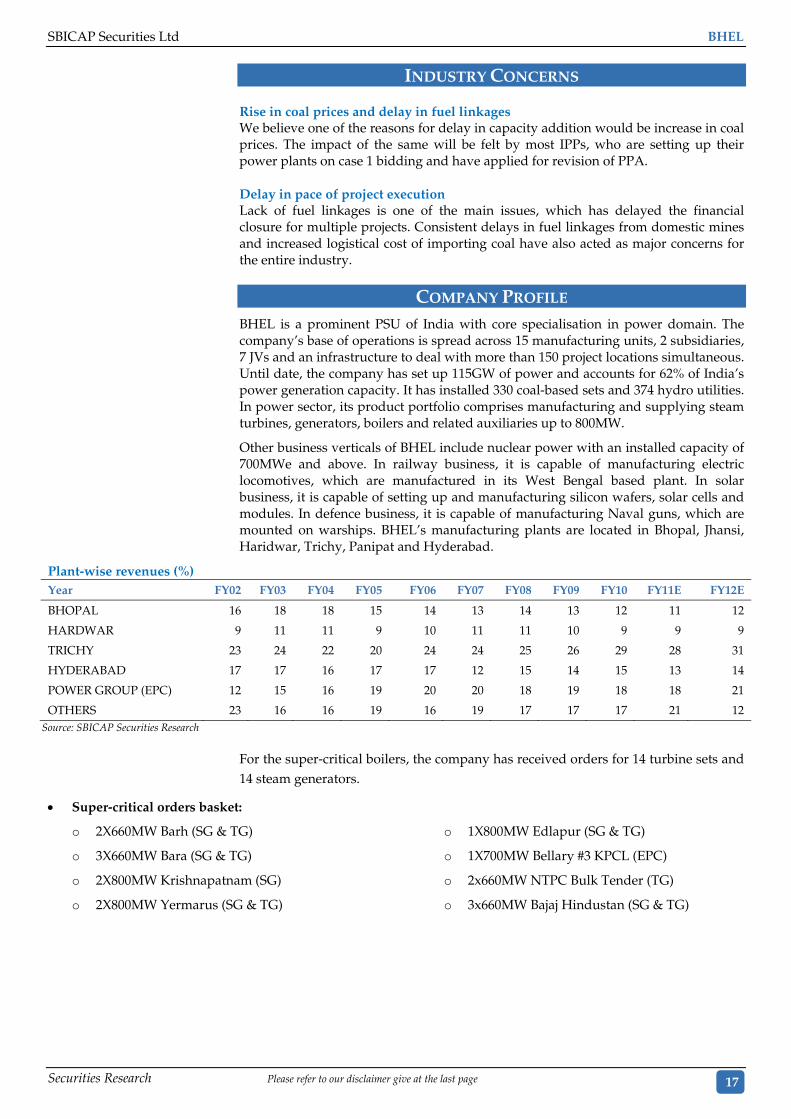
COMPANY PROFILE BHEL is a prominent PSU of India with core specialisation in power domain. The company’s base of operations is spread across 15 manufacturing units, 2 subsidiaries, 7 JVs and an infrastructure to deal with more than 150 project locations simultaneous. Until date, the company has set up 115GW of power and accounts for 62% of India’s power generation capacity. It has installed 330 coal-based sets and 374 hydro utilities. In power sector, its product portfolio comprises manufacturing and supplying steam turbines, generators, boilers and related auxiliaries up to 800MW.
Other business verticals of BHEL include nuclear power with an installed capacity of 700MWe and above. In railway business, it is capable of manufacturing electric locomotives, which are manufactured in its West Bengal based plant. In solar business, it is capable of setting up and manufacturing silicon wafers, solar cells and modules. In defence business, it is capable of manufacturing Naval guns, which are mounted on warships. BHEL’s manufacturing plants are located in Bhopal, Jhansi, Haridwar, Trichy, Panipat and Hyderabad.
Plant-wise revenues (%) Year FY02 FY03 FY04 FY05 FY06 FY07 FY08 FY09 FY10 FY11E FY12E
BHOPAL 16 18 18 15 14 13 14 13 12 11 12
HARDWAR 9 11 11 9 10 11 11 10 9 9 9
TRICHY 23 24 22 20 24 24 25 26 29 28 31
HYDERABAD 17 17 16 17 17 12 15 14 15 13 14
POWER GROUP (EPC) 12 15 16 19 20 20 18 19 18 18 21
OTHERS 23 16 16 19 16 19 17 17 17 21 12 Source: SBICAP Securities Research
For the super-critical boilers, the company has received orders for 14 turbine sets and 14 steam generators.
• Super-critical orders basket:
o 2X660MW Barh (SG & TG)
o 3X660MW Bara (SG & TG)
o 2X800MW Krishnapatnam (SG)
o 2X800MW Yermarus (SG & TG)
o 1X800MW Edlapur (SG & TG)
o 1X700MW Bellary #3 KPCL (EPC)
o 2x660MW NTPC Bulk Tender (TG)
o 3x660MW Bajaj Hindustan (SG & TG)
BHEL SBICAP Securities Ltd
18 Please refer to our disclaimer give at the last page
Securities Research
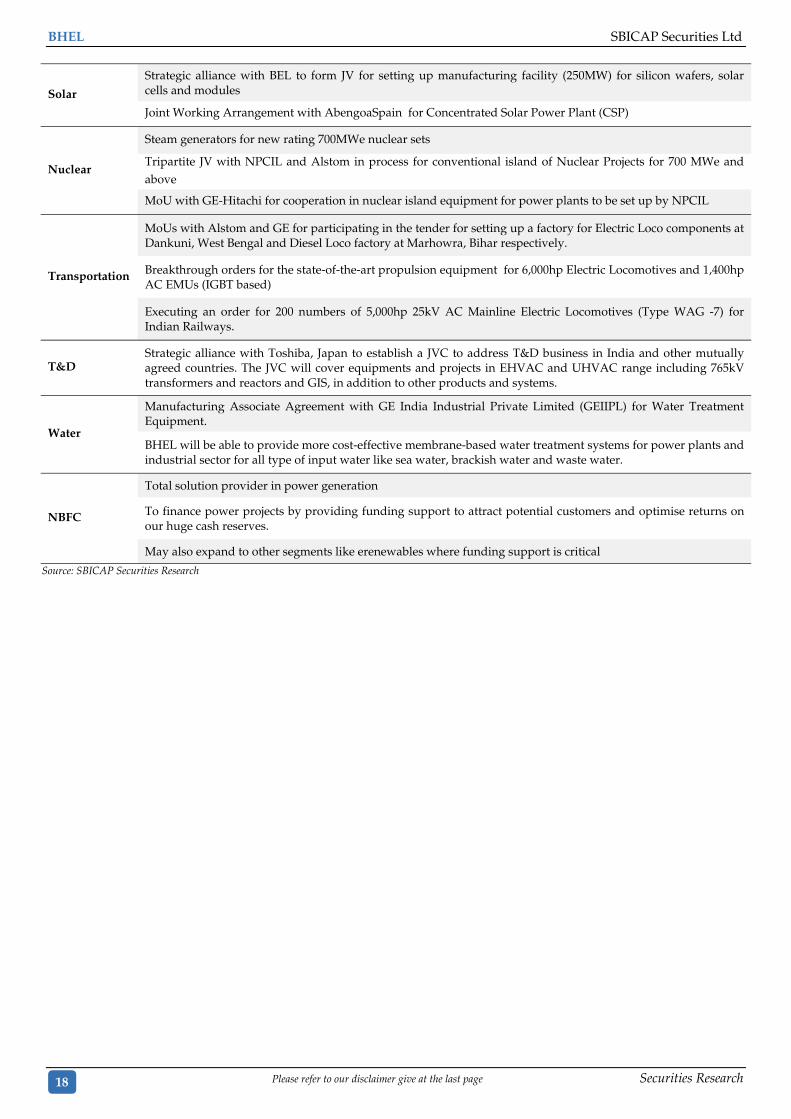
Solar
Strategic alliance with BEL to form JV for setting up manufacturing facility (250MW) for silicon wafers, solar cells and modules Joint Working Arrangement with AbengoaSpain for Concentrated Solar Power Plant (CSP)
Nuclear
Steam generators for new rating 700MWe nuclear sets
Tripartite JV with NPCIL and Alstom in process for conventional island of Nuclear Projects for 700 MWe and above
MoU with GE-Hitachi for cooperation in nuclear island equipment for power plants to be set up by NPCIL
Transportation
MoUs with Alstom and GE for participating in the tender for setting up a factory for Electric Loco components at Dankuni, West Bengal and Diesel Loco factory at Marhowra, Bihar respectively.
Breakthrough orders for the state-of-the-art propulsion equipment for 6,000hp Electric Locomotives and 1,400hp AC EMUs (IGBT based)
Executing an order for 200 numbers of 5,000hp 25kV AC Mainline Electric Locomotives (Type WAG -7) for Indian Railways.
T&D Strategic alliance with Toshiba, Japan to establish a JVC to address T&D business in India and other mutually agreed countries. The JVC will cover equipments and projects in EHVAC and UHVAC range including 765kV transformers and reactors and GIS, in addition to other products and systems.
Water
Manufacturing Associate Agreement with GE India Industrial Private Limited (GEIIPL) for Water Treatment Equipment.
BHEL will be able to provide more cost-effective membrane-based water treatment systems for power plants and industrial sector for all type of input water like sea water, brackish water and waste water.
NBFC
Total solution provider in power generation
To finance power projects by providing funding support to attract potential customers and optimise returns on our huge cash reserves.
May also expand to other segments like erenewables where funding support is critical
Source: SBICAP Securities Research
SBICAP Securities Ltd BHEL
Securities Research Please refer to our disclaimer give at the last page 19
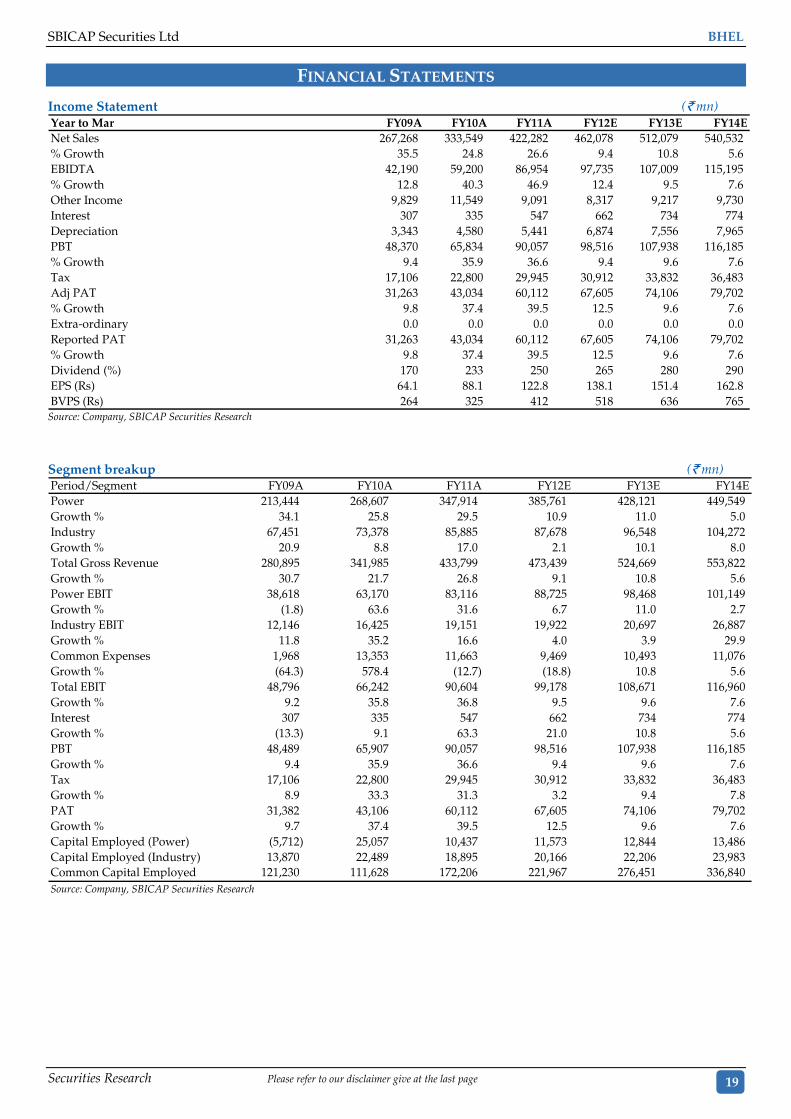
FINANCIAL STATEMENTS
Income Statement (` mn) Year to Mar FY09A FY10A FY11A FY12E FY13E FY14ENet Sales 267,268 333,549 422,282 462,078 512,079 540,532% Growth 35.5 24.8 26.6 9.4 10.8 5.6EBIDTA 42,190 59,200 86,954 97,735 107,009 115,195% Growth 12.8 40.3 46.9 12.4 9.5 7.6Other Income 9,829 11,549 9,091 8,317 9,217 9,730Interest 307 335 547 662 734 774Depreciation 3,343 4,580 5,441 6,874 7,556 7,965PBT 48,370 65,834 90,057 98,516 107,938 116,185% Growth 9.4 35.9 36.6 9.4 9.6 7.6Tax 17,106 22,800 29,945 30,912 33,832 36,483Adj PAT 31,263 43,034 60,112 67,605 74,106 79,702% Growth 9.8 37.4 39.5 12.5 9.6 7.6Extra-ordinary 0.0 0.0 0.0 0.0 0.0 0.0Reported PAT 31,263 43,034 60,112 67,605 74,106 79,702% Growth 9.8 37.4 39.5 12.5 9.6 7.6Dividend (%) 170 233 250 265 280 290EPS (Rs) 64.1 88.1 122.8 138.1 151.4 162.8BVPS (Rs) 264 325 412 518 636 765
Source: Company, SBICAP Securities Research
Segment breakup (` mn) Period/Segment FY09A FY10A FY11A FY12E FY13E FY14EPower 213,444 268,607 347,914 385,761 428,121 449,549Growth % 34.1 25.8 29.5 10.9 11.0 5.0Industry 67,451 73,378 85,885 87,678 96,548 104,272Growth % 20.9 8.8 17.0 2.1 10.1 8.0Total Gross Revenue 280,895 341,985 433,799 473,439 524,669 553,822Growth % 30.7 21.7 26.8 9.1 10.8 5.6Power EBIT 38,618 63,170 83,116 88,725 98,468 101,149Growth % (1.8) 63.6 31.6 6.7 11.0 2.7Industry EBIT 12,146 16,425 19,151 19,922 20,697 26,887Growth % 11.8 35.2 16.6 4.0 3.9 29.9Common Expenses 1,968 13,353 11,663 9,469 10,493 11,076Growth % (64.3) 578.4 (12.7) (18.8) 10.8 5.6Total EBIT 48,796 66,242 90,604 99,178 108,671 116,960Growth % 9.2 35.8 36.8 9.5 9.6 7.6Interest 307 335 547 662 734 774Growth % (13.3) 9.1 63.3 21.0 10.8 5.6PBT 48,489 65,907 90,057 98,516 107,938 116,185Growth % 9.4 35.9 36.6 9.4 9.6 7.6Tax 17,106 22,800 29,945 30,912 33,832 36,483Growth % 8.9 33.3 31.3 3.2 9.4 7.8PAT 31,382 43,106 60,112 67,605 74,106 79,702Growth % 9.7 37.4 39.5 12.5 9.6 7.6Capital Employed (Power) (5,712) 25,057 10,437 11,573 12,844 13,486Capital Employed (Industry) 13,870 22,489 18,895 20,166 22,206 23,983Common Capital Employed 121,230 111,628 172,206 221,967 276,451 336,840
Source: Company, SBICAP Securities Research
BHEL SBICAP Securities Ltd
20 Please refer to our disclaimer give at the last page
Securities Research
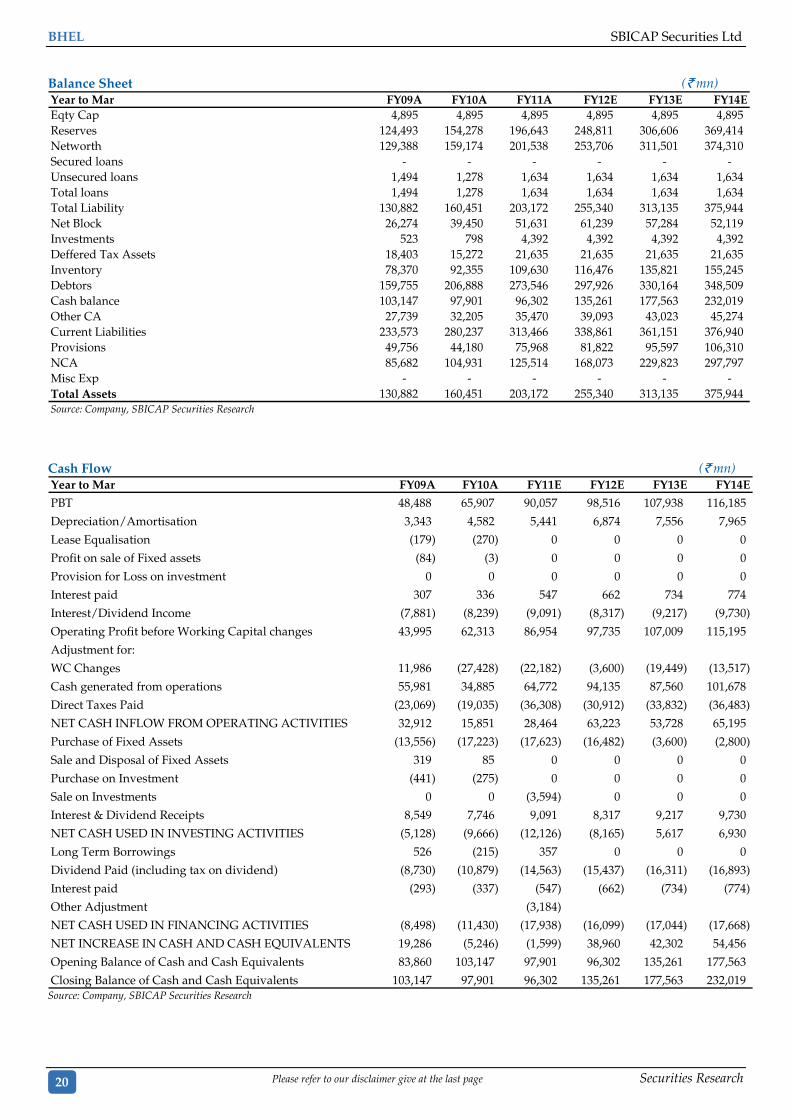
Balance Sheet (` mn) Year to Mar FY09A FY10A FY11A FY12E FY13E FY14EEqty Cap 4,895 4,895 4,895 4,895 4,895 4,895 Reserves 124,493 154,278 196,643 248,811 306,606 369,414 Networth 129,388 159,174 201,538 253,706 311,501 374,310 Secured loans - - - - - - Unsecured loans 1,494 1,278 1,634 1,634 1,634 1,634 Total loans 1,494 1,278 1,634 1,634 1,634 1,634 Total Liability 130,882 160,451 203,172 255,340 313,135 375,944 Net Block 26,274 39,450 51,631 61,239 57,284 52,119 Investments 523 798 4,392 4,392 4,392 4,392 Deffered Tax Assets 18,403 15,272 21,635 21,635 21,635 21,635 Inventory 78,370 92,355 109,630 116,476 135,821 155,245 Debtors 159,755 206,888 273,546 297,926 330,164 348,509 Cash balance 103,147 97,901 96,302 135,261 177,563 232,019 Other CA 27,739 32,205 35,470 39,093 43,023 45,274 Current Liabilities 233,573 280,237 313,466 338,861 361,151 376,940 Provisions 49,756 44,180 75,968 81,822 95,597 106,310 NCA 85,682 104,931 125,514 168,073 229,823 297,797 Misc Exp - - - - - - Total Assets 130,882 160,451 203,172 255,340 313,135 375,944
Source: Company, SBICAP Securities Research
Cash Flow (` mn)
Year to Mar FY09A FY10A FY11E FY12E FY13E FY14E
PBT 48,488 65,907 90,057 98,516 107,938 116,185
Depreciation/Amortisation 3,343 4,582 5,441 6,874 7,556 7,965
Lease Equalisation (179) (270) 0 0 0 0
Profit on sale of Fixed assets (84) (3) 0 0 0 0
Provision for Loss on investment 0 0 0 0 0 0
Interest paid 307 336 547 662 734 774
Interest/Dividend Income (7,881) (8,239) (9,091) (8,317) (9,217) (9,730)
Operating Profit before Working Capital changes 43,995 62,313 86,954 97,735 107,009 115,195
Adjustment for:
WC Changes 11,986 (27,428) (22,182) (3,600) (19,449) (13,517)
Cash generated from operations 55,981 34,885 64,772 94,135 87,560 101,678
Direct Taxes Paid (23,069) (19,035) (36,308) (30,912) (33,832) (36,483)
NET CASH INFLOW FROM OPERATING ACTIVITIES 32,912 15,851 28,464 63,223 53,728 65,195
Purchase of Fixed Assets (13,556) (17,223) (17,623) (16,482) (3,600) (2,800)
Sale and Disposal of Fixed Assets 319 85 0 0 0 0
Purchase on Investment (441) (275) 0 0 0 0
Sale on Investments 0 0 (3,594) 0 0 0
Interest & Dividend Receipts 8,549 7,746 9,091 8,317 9,217 9,730
NET CASH USED IN INVESTING ACTIVITIES (5,128) (9,666) (12,126) (8,165) 5,617 6,930
Long Term Borrowings 526 (215) 357 0 0 0
Dividend Paid (including tax on dividend) (8,730) (10,879) (14,563) (15,437) (16,311) (16,893)
Interest paid (293) (337) (547) (662) (734) (774)
Other Adjustment (3,184)
NET CASH USED IN FINANCING ACTIVITIES (8,498) (11,430) (17,938) (16,099) (17,044) (17,668)
NET INCREASE IN CASH AND CASH EQUIVALENTS 19,286 (5,246) (1,599) 38,960 42,302 54,456
Opening Balance of Cash and Cash Equivalents 83,860 103,147 97,901 96,302 135,261 177,563
Closing Balance of Cash and Cash Equivalents 103,147 97,901 96,302 135,261 177,563 232,019Source: Company, SBICAP Securities Research
SBICAP Securities Ltd BHEL
Securities Research Please refer to our disclaimer give at the last page 21
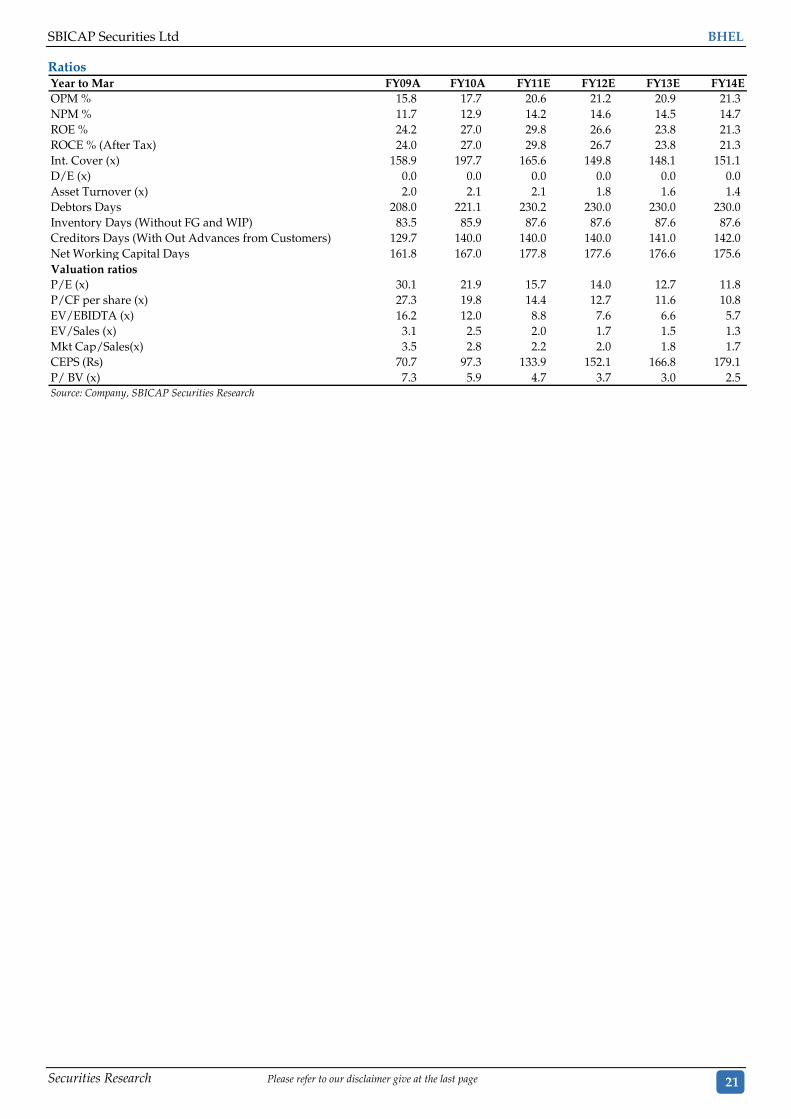
Ratios Year to Mar FY09A FY10A FY11E FY12E FY13E FY14EOPM % 15.8 17.7 20.6 21.2 20.9 21.3 NPM % 11.7 12.9 14.2 14.6 14.5 14.7 ROE % 24.2 27.0 29.8 26.6 23.8 21.3 ROCE % (After Tax) 24.0 27.0 29.8 26.7 23.8 21.3 Int. Cover (x) 158.9 197.7 165.6 149.8 148.1 151.1 D/E (x) 0.0 0.0 0.0 0.0 0.0 0.0 Asset Turnover (x) 2.0 2.1 2.1 1.8 1.6 1.4 Debtors Days 208.0 221.1 230.2 230.0 230.0 230.0 Inventory Days (Without FG and WIP) 83.5 85.9 87.6 87.6 87.6 87.6 Creditors Days (With Out Advances from Customers) 129.7 140.0 140.0 140.0 141.0 142.0 Net Working Capital Days 161.8 167.0 177.8 177.6 176.6 175.6 Valuation ratios P/E (x) 30.1 21.9 15.7 14.0 12.7 11.8 P/CF per share (x) 27.3 19.8 14.4 12.7 11.6 10.8 EV/EBIDTA (x) 16.2 12.0 8.8 7.6 6.6 5.7 EV/Sales (x) 3.1 2.5 2.0 1.7 1.5 1.3 Mkt Cap/Sales(x) 3.5 2.8 2.2 2.0 1.8 1.7 CEPS (Rs) 70.7 97.3 133.9 152.1 166.8 179.1 P/ BV (x) 7.3 5.9 4.7 3.7 3.0 2.5
Source: Company, SBICAP Securities Research
SBICAP Securities Limited
Corporate Office: Mafatlal Chambers, A-Wing, 2nd Floor, N.M. Joshi Marg, Lower Parel , Mumbai -400013. Tel.: 91-22-42273300/01 Fax: 91-22-42273334 Web: www.sbicapsec.com
Name Designation Phone E-mail
Sanjay Vaid SVP & Co-Head (Equities) 42273343 [email protected]
Hemant.Thukral Deputy Head - Derivatives 42273483 [email protected]
Sriram N.S. Deputy Head - Sales Trading 42273318 [email protected]
INSTITUTIONAL SALES
Sidharth Agrawal Assistant Vice President 42273481 sidharth.agrawal@ sbicapsec.com
Pankaj Karde Sr. Manager 42273488 pankaj.karde@ sbicapsec.com
Kishor Binwal Sr. Manager 42273480 [email protected]
Nishit Paleja Manager 42273479 [email protected]
Piyush Khandelwal Manager – Business Development 42273489 [email protected]
Kunal Sukhani Manager 42273485 [email protected]
INSTITUTIONAL DEALING
Arundhati Parab Sr. Sales Trader 42273434 [email protected]
Vikas Nathani Sr. Sales Trader 42273433 [email protected]
INSTITUTIONAL RESEARCH [email protected]
Rabindranath Nayak Lead Analyst Power & Capital Goods 42273410 [email protected]
Alok Ramachandran Associate Power 42273478 [email protected]
Nirav Vasa Associate Capital Goods 42273460 [email protected]
Ravikant Bhat Analyst Banking 42273349 [email protected]
Divyanshi Dayanand Analyst Banking 42273385 [email protected]
Aayush Dureha Trainee Banking 42273456 [email protected]
Manish Kumar Analyst Infrastructure/Construction 42273388 [email protected]
Vishnu Das Trainee Infrastructure/Construction 42273459 [email protected]
Vivek Kumar Analyst Pharma 42273312 [email protected]
Akshit Shah Analyst Realty 42273329 [email protected]
Sagarika Mukherjee Analyst FMCG 42273386 [email protected]
Vaishali Parkar Analyst Auto 42273364 [email protected]
Rahul Kundnani Analyst Media 42273387 [email protected]
Dipesh Mehta Analyst IT 42273311 [email protected]
Ankit Pande Associate IT 42273458 [email protected]
Jatin Damania Analyst Metal, Mining & Pipes 42273361 [email protected]
Gunjan Poddar Associate Oil & Gas 42273363 [email protected]
Milind Raginwar Analyst Cement 42273362 [email protected]
Sanjay Bhansali Production in Charge 42273313 [email protected]
Key to investment Ratings
Guide to the expected return over the next 12 months. 1=BUY (expected to give absolute returns of 20 or more percentage points); 2= ACCUMULATE/ADD (expected to give absolute returns between 10 to 20 percentage points); 3=REDUCE (expected to give absolute returns between 0 to 10 percentage points); 4=SELL (expected to give absolute negative returns)
DISCLAIMER SBICAP Securities Limited is a full service, Stock Broking Company and is a member of Bombay Stock Exchange Ltd. (BSE) and National Stock Exchange of India Ltd. (NSE). It is a wholly owned subsidiary of SBI Capital Markets Ltd. (SBICAP), which is an integrated investment banker. SBICAP also is an underwriter of securities. ("SBICAP and SBICAP Securities Ltd. are collectively referred to as SBICAP Group") SBICAP has Investment Banking, Advisory and other business relationships with a significant percentage of the companies covered by our Research Group. Our research professionals provide important inputs into our Investment Banking and other business selection processes. Recipients of this report should assume that SBICAP Group is seeking or may seek or will seek Investment Banking, advisory, project finance or other businesses and may receive commission, brokerage, fees or other compensation from the company or companies that are the subject of this material/ report. SBICAP group and its officers, directors and employees, including the analysts and others involved in the preparation or issuance of this materialand their dependant, may on the date of this report or from, time to time have "long" or "short" positions in, act as principal in, and buy or sell the securities or derivatives thereof of companies mentioned herein. Our sales people, dealers, traders and other professionals may provide oral or written market commentary or trading strategies to our clients that reflect opinion that are contrary to the opinions expressed herein, and our proprietary trading and investing businesses may make investment decisions that are inconsistent with the recommendations expressed herein. SBICAP Group may have earlier issued or may issue in future reports on the companies covered herein with recommendations/ information inconsistent or different from those made in this report. In reviewing this document, you should be aware that any or all of the foregoing, among other things, may give rise to potential conflicts of interest. SBICAP Group may rely on information barriers, such as "Chinese Walls" to control the flow of information contained in one or more areas within SBICAP Group into other areas, units, groups or affiliates of SBICAP Group. The projections and forecasts describe in this report were based upon a number of estimates and assumptions and are inherently subject to significant uncertainties and contingencies. Projections and forecasts are necessarily speculative in nature, and it can be expected that one or more of the estimates on which the projections and forecasts were based will not materialize or will vary significantly from actual results, and such variances will likely increase over time. All projections and forecasts described in this report have been prepared solely by the authors of this report independently of the Bank. These projections and forecasts were not prepared with a view toward compliance with published guidelines or generally accepted accounting principles. No independent accountants have expressed an opinion or any other form of assurance on these projections or forecasts. You should not regard the inclusion of the projections and forecasts described herein as a representation or warranty by or on behalf of the Bank, SBICAP, the authors of this report or any other person that these projections or forecasts or their underlying assumptions will be achieved. For these reasons, you should only consider the projections and forecasts described in this report after carefully evaluating all of the information in this report, including the assumption underlying such projections and forecasts. This report is for information purposes only and this document/material should not be construed as an offer to sell or the solicitation of an offer to buy, purchase or subscribe to any securities, and neither this document nor anything contained herein shall form the basis of or be relied upon in connection with any contract or commitment whatsoever. This document does not solicit any action based on the material contained herein. It is for the general information of the clients of SBICAP Group. Though disseminated to clients simultaneously, not all clients may receive this report at the same time. SBICAP Group will not treat recipients as clients by virtue of their receiving this report. It does not constitute a personal recommendation or take into account the particular investment objectives, financial situations, or needs of individual clients. Similarly, this document does not have regard to the specific investment objectives, financial situation/circumstances and the particular needs of any specific person who may receive this document. The securities discussed in this report may not be sui for all the investors. The securities described herein may not be eligible for sale in all jurisdictions or to all categories of investors. The countries in which the companies mentioned in this report are organized may have restrictions on investments, voting rights or dealings in securities by nationals of other countries. The appropriateness of a particular investment or strategy will depend on an investor's individual circumstances and objectives. Persons who may receives this document should consider and independently evaluate whether it is sui for his/ her/their particular circumstances and, if necessary, seek professional/financial advice. Any such person shall be responsible for conducting his/her/their own investigation and analysis of the information contained or referred to in this document and of evaluating the merits and risks involved in the securities forming the subject matter of this document. The price and value of the investments referred to in this document/material and the income from them may go down as well as up, and investors may realize losses on any investments. Past performance is not a guide for future performance. Future returns are not guaranteed and a loss of original capital may occur. Actual results may differ materially from those set forth in projections. Forward-looking statements are not predictions and may be subject to change without notice. SBICAP Group does not provide tax advise to its clients, and all investors are strongly advised to consult regarding any potential investment. SBICAP Group and its affiliates accept no liabilities for any loss or damage of any kind arising out of the use of this report. Foreign currency denominated securities are subject to fluctuations in exchange rates that could have an adverse effect on the value or price of or income derived from the investment. In addition, investors in securities such as ADRs, the value of which are influenced by foreign currencies effectively assume currency risk. Certain transactions including those involving futures, options, and other derivatives as well as non-investment grade securities give rise to substantial risk and are not sui for all investors. Please ensure that you have read and understood the current risk disclosure documents before entering into any derivative transactions. This report/document has been prepared by the SBICAP Group based upon information available to the public and sources, believed to be reliable. Though utmost care has been taken to ensure its accuracy, no representation or warranty, express or implied is made that it is accurate or complete. SBICAP Group has reviewed the report and, in so far as it includes current or historical information, it is believed to be reliable, although its accuracy and completeness cannot be guaranteed. SBICAP Group endeavors to update on a reasonable basis the information discussed in this document/material, but regulatory, compliance or other reasons may prevent us from doing so. The opinions expressed in this document/material are subject to change without notice and have no obligation to tell the clients when opinions or information in this report change. This report or recommendations or information contained herein do/does not constitute or purport to constitute investment advice in publicly accessible media and should not be reproduced, transmitted or published by the recipient. The report is for the use and consumption of the recipient only. This publication may not be distributed to the public used by the public media without the express written consent of SBICAP Group. This report or any portion hereof may not be printed, sold or distributed without the written consent of SBICAP Group. Neither this document nor any copy of it may be taken, transmitted or sent into the United States, Canada, Japan or to any U.S. persons or distributed, directly or indirectly, in the United States or Canada or distributed or redistributed in Japan or to any resident thereof. The distribution of this document in other jurisdictions may be restricted by law, and persons into whose possession this document comes should inform themselves about, and observe, any such restrictions. Failure to comply with this restriction may constitute a violation of U.S., Canada or Japanese securities laws. Neither SBICAP Group nor its directors, employees, agents or representatives shall be liable for any damages whether direct or indirect, incidental, special or consequential including lost revenue or lost profits that may arise from or in connection with the use of the information.