Embed Size (px)
Citation preview
Vol.13, No.1 EARTHQUAKE ENGINEERING AND ENGINEERING VIBRATION March, 2014
Earthq Eng & Eng Vib (2014) 13: 125-135 DOI: 10.1007/s11803-014-0217-1
Bi-normalized response spectra and seismic intensity in Bucharest for 1986 and 1990 Vrancea seismic events
Florin Pavel1†, Radu Vacareanu1‡, Cristian Neagu1§ and Andrei Pricopie2†
1. Department of Reinforced Concrete Structures, Technical University of Civil Engineering Bucharest, Romania
2. Department of Strength of Materials, Bridges and Tunnels, Technical University of Civil Engineering Bucharest, Romania
Abstract: The Vrancea subcrustal earthquakes of August 30, 1986 and May 30, 1990 are the two most recent seismic events that have occurred in Romania with moment magnitudes MW ≥ 6.9. The spectral analysis of the strong ground motions recorded in Bucharest reveals that despite small differences in magnitude between the 1986 and 1990 earthquakes, their frequency contents are very different, sometimes even opposing. The main focus of this study is to conduct a comparative analysis of the response spectra in terms of the bi-normalized response spectra (BNRS) proposed by Xu and Xie (2004 and 2007) for strong ground motions recorded in Bucharest during these two seismic events. The mean absolute acceleration and relative velocity response spectra for the two earthquakes are discussed and compared. Furthermore, the mean bi-normalized absolute acceleration and normalized relative velocity response spectra with respect to the control period TC are computed for the ground motions recorded in Bucharest in 1986 and 1990. The predominant period TP is also used in this study for the normalization of the spectral period axis. Subsequently, the methodology proposed by Martinez-Perreira and Bommer (1998) is applied in order to estimate the seismic intensity of the two events. The results are discussed and several conclusions regarding the possibility of using the bi-normalized response spectra (BNRS) are given.
Keywords: response spectra; bi-normalized response spectra; dynamic amplifi cation factor; control period; damage potential parameters
Correspondence to: F. Pavel, Faculty of Civil, Industrial and Agricultural Buildings, Technical University of Civil Engineering Bucharest, Bucharest, RomaniaTel: +40 212421208; Fax: +40 212420781E-mail: fl [email protected]
†Assistant Professor/Research Assistant; ‡Professor, §PhD candidate Received Feburary 4, 2013; Accepted September 30, 2013
1 Introduction
Generally speaking, strong ground motions show various frequency contents from wide and intermediate frequency bandwidth for recordings obtained in hard to medium soil conditions to narrow frequency bandwidth signals (records in soft soil condition).
An assessment of the frequency content of strong ground motions using the power spectral density (PSD) and its related indicators: the dimensionless frequency bandwidth indicators ε (Cartwright and Longuet-Higgins, 1956) and q (Vanmarcke, 1976), as well as the fractile frequencies f10, f50 and f90, was presented by Lungu et al. (1992).
Amongst the deterministic indicators of the frequency contents of strong ground motion records, Newmark and Hall (1969 and 1982) proposed the control periods of structural response spectra. An evolution of this concept was summarized by Pavel and Lungu1(2012) for the period 1978 – 2010. Other deterministic indicators of the frequency contents are the mean period TM defi ned
by Rathje et al. (1998) or the predominant period TP at which the maximum spectral acceleration occurs.
The bi-normalized response spectrum concept was originally introduced by Xu and Xie (2004) and is generated stems from a normalized absolute acceleration response spectrum by normalizing also the period axis with respect to a specifi ed period. Utilizing the strong ground motions recorded from the 1999 Chi-Chi earthquake, Xu and Xie (2004) derived bi-normalized response spectra for four different soil conditions, defi ned according to spectral predominant period TP. The maximum values of the ratio between spectral acceleration and PGA, i.e., the dynamic amplifi cation factor (DAF), is in the range of 3.4 – 3.8, with a mean value of 3.5.
In Addition, Xu and Xie (2007) developed bi-normalized pseudo velocity response spectra by using a database of 53 near-fault ground motions. In Xu et al. (2010), the near-fault ground recorded on rock were used to compute the bi-normalized response spectra (BNRS), normalized with respect to the control periods TC and TD specifi ed by Newmark and Hall (1969 and 1982). Ziotopoulou and Gazetas (2010) and Gazetas (2012) performed a comparison of the maximum values of the dynamic amplifi cation factor (DAF) obtained from both the normalized response spectra and the bi-normalized response spectra and concluded that the current code value of 2.5 underestimates the real ratio SA / PGA,
126 EARTHQUAKE ENGINEERING AND ENGINEERING VIBRATION Vol.13
especially in the spectral region close to the predominant period of the strong ground motions, where the ratio SA / PGA is about 3.75. This value is very similar to that obtained previously by Xu and Xie (2004).
Ziotopoulou and Gazetas (2010) also proposed a relation for computation of the BNRS as a function of the ratio T / Tp.
Maniatakis and Spyrakos (2012) proposed a new methodology to determine the design displacement response spectrum for the near-fault region. The bi-normalized displacement spectrum is constructed with respect to the dominant period of the displacement response spectrum Td-P, computed from the period corresponding to the maximum spectral displacement for ξ = 0.
Note that the use of the predominant period Tp is straightforward, especially in the case of strong ground motions with a clear single peak visible in the absolute acceleration response spectrum. But for strong ground motions with multiple peaks in the spectrum, the use of the predominant period is not as straightforward. As outlined in Kramer (1996), the predominant period can offer information regarding the frequency content of the ground motion, but it is also clear that different strong ground motions with different frequency contents can have the same predominant period.
This study focuses on the application of the BNRS to the strong ground motions recorded in Bucharest during the 1986 and 1990 Vrancea subcrustal earthquakes. A different period is used to characterize the frequency content - the control period TC, which is currently used in many force-based seismic design regulations such as the EN 1998-1 (2004). Subsequently the seismic intensity in Bucharest is evaluated using instrumental data according to the procedure given by Martinez-Perreira and Bommer (1998).
2 Characterization of the frequency content
The control period of response spectra TC (Newmark and Hall, 1982) represents the border between the maximum acceleration region and the maximum velocity region of a response spectrum defi ned as:
TC
EPVEPA
= 2π
(1)
where EPA and EPV are the effective peak acceleration and the effective peak velocity, respectively, which are obtained by averaging the spectral accelerations and velocities on a mobile window of 0.4 s width (Lunguet al., 1997):
EPA = max
..SA0 4
2 5 (2)
EPV = max.
.SV 0 4
2 5 (3)
The selection of the moving average procedure in this study is based on the fact that this method can capture all the spectral peaks in the response spectra, irrespective of their location on the period axis, while the original method can only capture the spectral peaks within a predefi ned period range (0.1–0.5 s or 0.8–1.2 s).
The predominant period TP of the acceleration response spectrum refers to the period at which the maximum spectral acceleration is encountered.
The dimensionless indicator ε is defi ned in Eq. (4) as a function of the spectral moments of the unilateral PSD for the stationary process of the ground acceleration (Cartwright and Longuet-Higgins, 1956):
0 1 122
0 4≤ = − ≤
(4)
where λi is the i-th order spectral moment.
ii
xS=−∞
+∞
∫ ( )d (5)
The recommended guidance values for ε in the case of strong ground motions are (Lungu et al., 2000):
• 2/3 < ε < 0.85 for wide frequency band processes;
• 0.85 < ε < 0.95 for intermediate frequency band processes;
• ε > 0.95 for narrow low frequency band processes superimposed with wide frequency band “noises”.
3 Strong ground motion database
In this research, the BNRS is studied and the seismic intensities for Bucharest are evaluated using a strong ground motion database compiled from recordings obtained during the Vrancea intermediate-depth earthquakes of August 30, 1986 and May 30, 1990. The characteristics of the 1986 and 1990 seismic events are shown in Table 1 (Ganaset al., 2010).
Note that the epicenter locations and depths of the 1986 and 1990 events are different, but the focal mechanisms are similar.
Table 1 Characteristics of the considered Vrancea subcrustal earthquakes
Event Lat. (°) Long. (°) Depth (km) Magn. MW Strike (°) Dip (°)Aug 30, 1986 45.5 26.5 131 7.1 227 65May 30, 1990 45.9 26.9 89 6.9 232 58
No.1 Florin Pavel et al.: Bi-normalized response spectra and seismic intensity in Bucharest for 1986 and 1990 Vrancea seismic events 127
The strong ground motion dataset includes 46 free-fi eld horizontal components recorded in the Bucharest area during the Vrancea subcrustal earthquakes of August 30, 1986 (MW = 7.1) and May 30, 1990 (MW =
6.9). The characteristics of the analyzed strong ground motions are taken from Pavel (2012) and are shown in Tables 2 and 3 below.
The soil conditions in Bucharest can be regarded
Table 2 Characteristics of the 1986 strong ground motion records
Station Epic. dist. (km) Comp. PGA (cm/s2) PGV (cm/s) TC (s)Bucharest INCERC
123 NS 97.0 15.5 1.45EW 109.1 11.3 0.97
Bucharest Titulescu
124 N55W 83.8 7.5 0.62N145W 87.54 15.4 1.16
Bucharest EREN
121 N72E 105.80 14.5 0.76N162E 161.1 15.1 0.75
Bucharest Metalurgiei
131 N37W 40.7 4.8 0.76N127W 71.7 14.8 1.51
Bucharest Militari
127 N02W 72.1 8.4 0.69N92W 100.6 14.0 0.96
Bucharest IMGB
132 N30W 69.3 12.8 1.51N120W 59.5 7.1 0.89
Bucharest Panduri
127 N49W 89.4 8.2 0.68N139W 96.2 15.0 1.10
Bucharest Magurele
134 N-S 135.5 22.3 1.06E-W 114.7 16.3 1.02
Bolintin-Vale 133 N65E 90.2 14.5 1.59N155E 83.7 9.1 0.64
Peris 101 N10W 116.7 10.5 0.87N100W 150.1 23.8 0.99
Branesti 119 N17W 75.3 13.3 0.85N107W 93.3 16.8 1.14
Otopeni 113 N-S 123.6 11.2 0.47E-W 219.8 26.3 0.67
Table 3 Characteristics of the 1990 strong ground motion records
Station Epic. dist. (km) Comp. PGA (cm/s2) PGV (cm/s) TC (s)Bucharest INCERC 164 NS 66.2 6.4 0.50
EW 98.9 17.0 0.82Bucharest Titulescu 166 N55W 67.4 9.6 0.72
N145W 56.8 6.7 0.57Bucharest Metalurgiei 172 N37W 74.9 10.2 0.92
N127W 55.4 8.9 0.77Bucharest Militari 169 N02W 83.9 10.1 0.67
N92W 50.6 3.8 0.47Bucharest IMGB 172 N30W 82.7 11.4 0.79
N120W 59.9 8.3 0.76Bucharest Panduri 168 N49W 131.3 9.6 0.44
N139W 151.1 10.6 0.38Bucharest Magurele 174 N-S 89.6 4.7 0.32
E-W 87.1 16.2 0.83Bucharest Drumul Sarii 169 N65E 97.9 5.4 0.37
N155E 112.5 13.8 0.66Bolintin-Vale 177 N65E 218.4 12.8 0.43
N155E 215.0 13.8 0.44Peris 145 N10W 184.8 9.3 0.35
N100W 241.4 14.9 0.35Branesti 157 N17W 126.0 13.1 0.41
N107W 142.2 11.6 0.41

128 EARTHQUAKE ENGINEERING AND ENGINEERING VIBRATION Vol.13
as rather uniform. Pavel et al. (2013b), based on a database of 38 boreholes, concluded that the average soil in the Bucharest area can be classifi ed as a soil class C according to EN 1998-1. This conclusion is also presented by Lang et al. (2012).
The absolute frequency histograms of PGA and TC for the two earthquakes are shown in Fig. 1.
Note from Figs. 1 – 2 that although the mean PGA
for the two Vrancea subcrustal events is similar, the frequency contents characterized here by the values of the control period TC have signifi cant differences. Moreover, in a previous study of Pavel et al. (2013b), the mean PSD function for the two seismic events also revealed the contrasting characteristics of the two seismic events.
A comparison of histograms for the values of ε for the two considered seismic events is illustrated in Fig. 3.
Fig. 1 Absolute frequency of PGA for (a) the 1986 event and (b) the 1990 event
Fig. 2 Absolute frequency of TC for (a) the 1986 and (b) the 1990 event
Fig. 3 Absolute frequency of ε for (a) the 1986 event and (b) the 1990 event
12
9
6
3
040 70 100 130 160 190 220 250
PGA (cm/s2)(a)
No.
of r
econ
ds (1
986
earth
quak
e)
8
6
4
2
00.2 0.4 0.6 0.8 1.0 1.2 1.4 1.6
TC (s)(a)
No.
of r
econ
ds (1
986
earth
quak
e)
10
8
6
4
2
00.70 0.75 0.80 0.85 0.90 0.95 1.00
ε(a)
No.
of r
econ
ds (1
986
earth
quak
e)
8
6
4
2
040 70 100 130 160 190 220 250
PGA (cm/s2)(b)
No.
of r
econ
ds (1
986
earth
quak
e)
8
6
4
2
0 0.2 0.4 0.6 0.8 1.0 1.2 1.4 1.6TC (s)
(b)
No.
of r
econ
ds (1
990
earth
quak
e)
8
6
4
2
0 0.70 0.75 0.80 0.85 0.90 0.95 1.00ε
(b)
No.
of r
econ
ds (1
990
earth
quak
e)
Mean =0.90COV = 0.0524 records
Mean =0.84COV = 0.0622 records
Mean = 0.56COV = 0.3422 records
Mean = 0.96 sCOV = 0.3224 records
Mean = 102 cm/s2
COV = 0.3724 records
Mean = 113 cm/s2
COV = 0.5022 records
No.1 Florin Pavel et al.: Bi-normalized response spectra and seismic intensity in Bucharest for 1986 and 1990 Vrancea seismic events 129
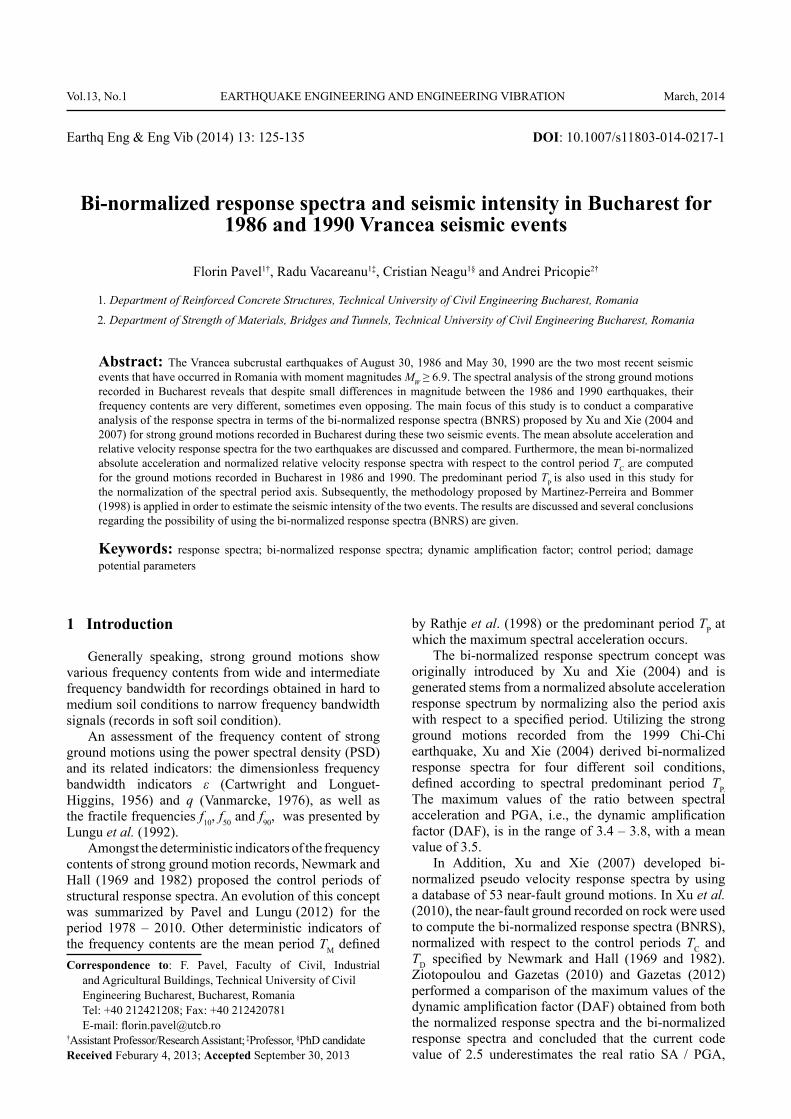
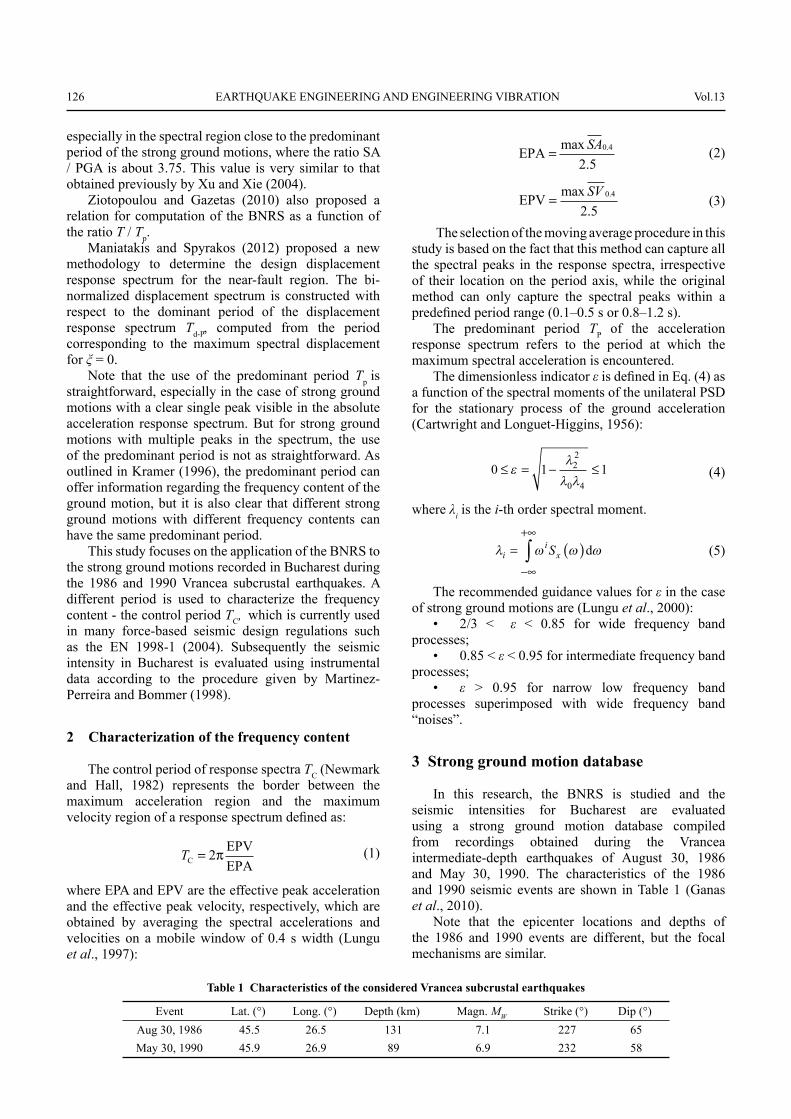
The mean response spectra of normalized absolute acceleration and relative velocity are shown in Figs. 4 and 5, respectively.
Note that the differences in the frequency content for the two seismic events are clearly illustrated through Figs. 2–5.
4 Bi-normalized response spectra
In order to obtain the BNRS, the dataset of strong ground motions is divided into several different categories. The parameter used to characterize the selected ground motions is the control period TC of the response spectrum.
The strong ground motion records of the 1986 event in the Bucharest area (Table 1) are divided into three categories as a function of the control period TC:
• 6 horizontal components with TC ≤ 0.7 s;• 9 horizontal components with 0.7 s < TC ≤ 1.0 s;• 9 horizontal components with TC > 1.0 s.The strong ground motion records of the 1990 event
(Table 2) are divided into only two categories as a function of the control period TC:
• 15 horizontal components with TC ≤ 0.7 s;• 7 horizontal components with 0.7 s < TC ≤ 1.0 s.The mean values of PGA for the three categories of
accelerograms of the 1986 event are:• 112 cm/s2 for the seismic records with TC ≤ 0.7 s;• 102 cm/s2 for the seismic records with 0.7 s < TC ≤
1.0 s;• 95 cm/s2 for the seismic records with TC > 1.0 s.The mean values of PGA for the two categories of
accelerograms of the 1990 earthquake are:• 132 cm/s2 for the seismic records with TC ≤ 0.7 s;• 75 cm/s2 for the seismic records with 0.7 s < TC≤
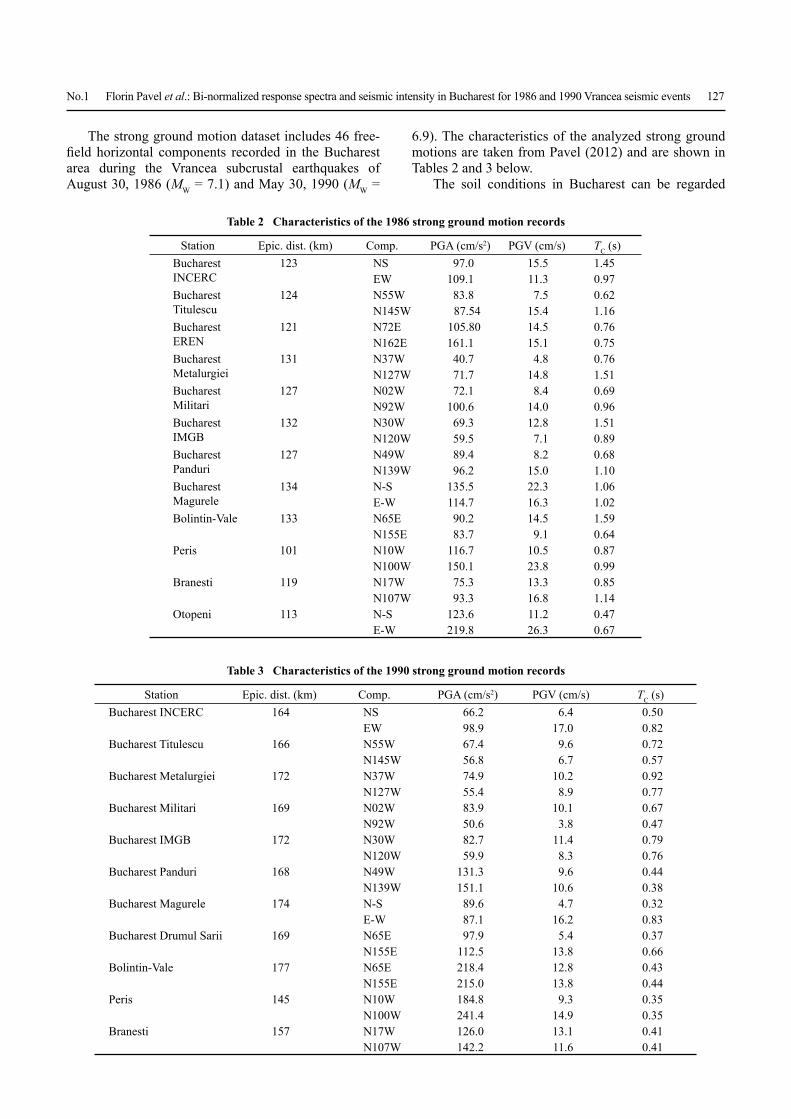
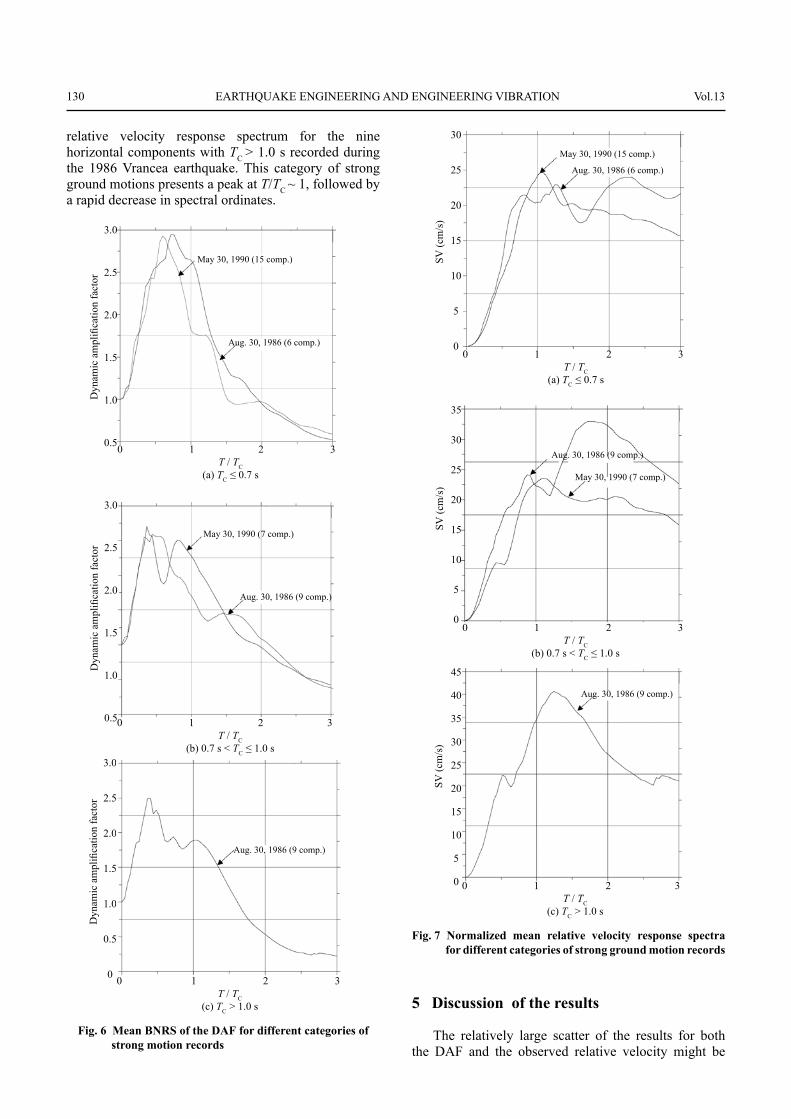
1.0 s.The BNRS for the DAF are plotted in Fig. 6. Figure 6(a) shows the mean BNRS for the strong
ground motions having the control period TC ≤ 0.7 s. The results show very similar spectral shapes and maximum values of the DAF for the two sets of strong ground motion records.
In the case of strong ground motions with 0.7 s < TC≤ 1.0 s shown in Fig. 6(b), only the maximum values of the DAF are similar, while the spectral shapes are different. In the case of the mean spectrum for the 1990 seismic event, there are two peaks located at T/TC = 0.4 and 0.8. The peak at T/TC = 1.5, observed in the BNRS of the August 30, 1986 earthquake.
For strong ground motions with TC > 1.0 s shown in Fig. 6(c), only the 1986 event is plotted, since there are no recordings with TC > 1.0 s in the 1990 event set.
The mean BNRS of the strong ground motions with the longest control periods TC shows a peak at T/TC = 0.4, which is similar to the previous case.
From the BNRS shown in Fig. 6, it can be concluded that the maximum values of the DAFs are quite similar (in the range 2.5 – 3) for the three TC based categories of strong ground motions, despite their different spectral shapes.
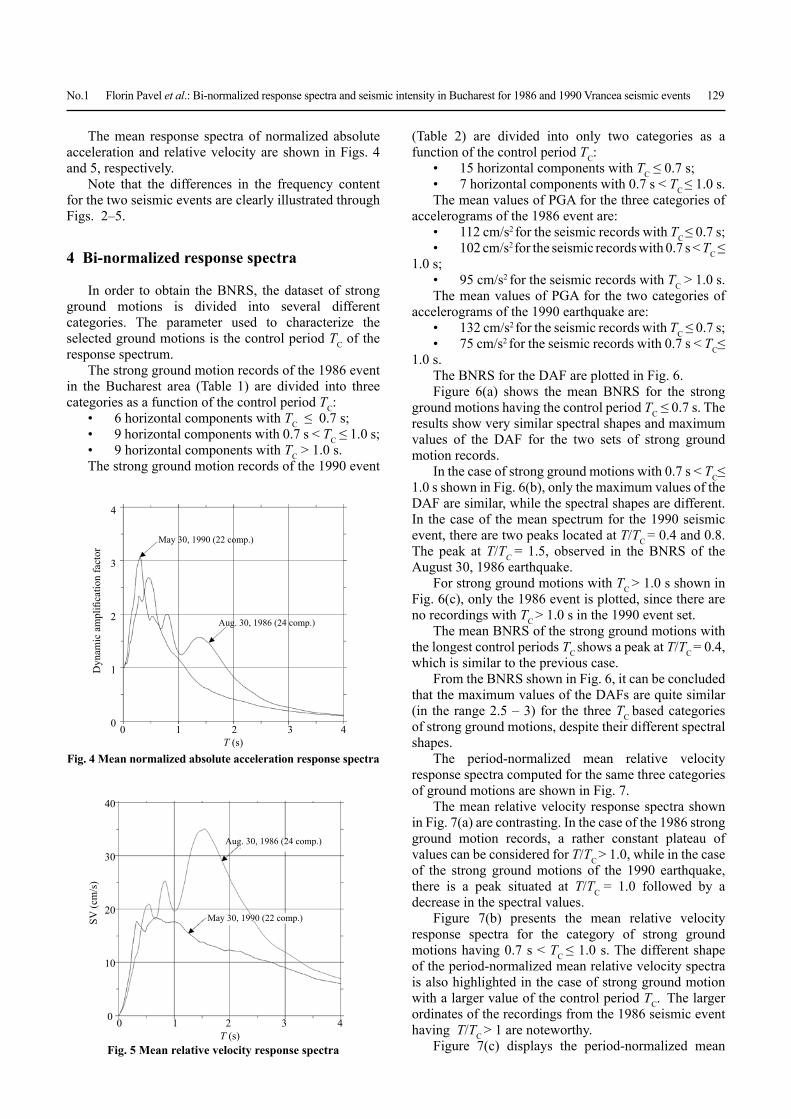
The period-normalized mean relative velocity response spectra computed for the same three categories of ground motions are shown in Fig. 7.
The mean relative velocity response spectra shown in Fig. 7(a) are contrasting. In the case of the 1986 strong ground motion records, a rather constant plateau of values can be considered for T/TC > 1.0, while in the case of the strong ground motions of the 1990 earthquake, there is a peak situated at T/TC = 1.0 followed by a decrease in the spectral values.
Figure 7(b) presents the mean relative velocity response spectra for the category of strong ground motions having 0.7 s < TC ≤ 1.0 s. The different shape of the period-normalized mean relative velocity spectra is also highlighted in the case of strong ground motion with a larger value of the control period TC. The larger ordinates of the recordings from the 1986 seismic event having T/TC > 1 are noteworthy.
Figure 7(c) displays the period-normalized mean
Fig. 4 Mean normalized absolute acceleration response spectra
Fig. 5 Mean relative velocity response spectra
4
3
2
1
0 0 1 2 3 4T (s)
Dyn
amic
am
plifi
catio
n fa
ctor
40
30
20
10
0 0 1 2 3 4T (s)
SV (c
m/s
)
May 30, 1990 (22 comp.)
Aug. 30, 1986 (24 comp.)
May 30, 1990 (22 comp.)
Aug. 30, 1986 (24 comp.)
130 EARTHQUAKE ENGINEERING AND ENGINEERING VIBRATION Vol.13
relative velocity response spectrum for the nine horizontal components with TC > 1.0 s recorded during the 1986 Vrancea earthquake. This category of strong ground motions presents a peak at T/TC ~ 1, followed by a rapid decrease in spectral ordinates.
Fig. 6 Mean BNRS of the DAF for different categories of strong motion records
3.0
2.5
2.0
1.5
1.0
0.50 1 2 3T / TC
(a) TC ≤ 0.7 s
Dyn
amic
am
plifi
catio
n fa
ctor
3.0
2.5
2.0
1.5
1.0
0.5
0 0 1 2 3T / TC
(c) TC > 1.0 s
Dyn
amic
am
plifi
catio
n fa
ctor
3.0
2.5
2.0
1.5
1.0
0.50 1 2 3T / TC
(b) 0.7 s < TC ≤ 1.0 s
Dyn
amic
am
plifi
catio
n fa
ctor
5 Discussion of the results
The relatively large scatter of the results for both the DAF and the observed relative velocity might be
Fig. 7 Normalized mean relative velocity response spectra for different categories of strong ground motion records
30
25
20
15
10
5
00 1 2 3
T / TC(a) TC ≤ 0.7 s
SV (c
m/s
)
0 1 2 3T / TC
(c) TC > 1.0 s
SV
(cm
/s)
35
30
25
20
15
10
5
00 1 2 3
T / TC(b) 0.7 s < TC ≤ 1.0 s
SV
(cm
/s)
45
40
35
30
25
20
15
10
5
0
May 30, 1990 (15 comp.)
Aug. 30, 1986 (6 comp.)
Aug. 30, 1986 (9 comp.)
May 30, 1990 (7 comp.)
Aug. 30, 1986 (9 comp.)
Aug. 30, 1986 (9 comp.)
May 30, 1990 (7 comp.)
Aug. 30, 1986 (9 comp.)
May 30, 1990 (15 comp.)
Aug. 30, 1986 (6 comp.)
No.1 Florin Pavel et al.: Bi-normalized response spectra and seismic intensity in Bucharest for 1986 and 1990 Vrancea seismic events 131
attributed (i) the sample size (relatively reduced strong ground motion database used in the analysis) and (ii) the use of the control period TC instead of the predominant period TP as a normalizing parameter.
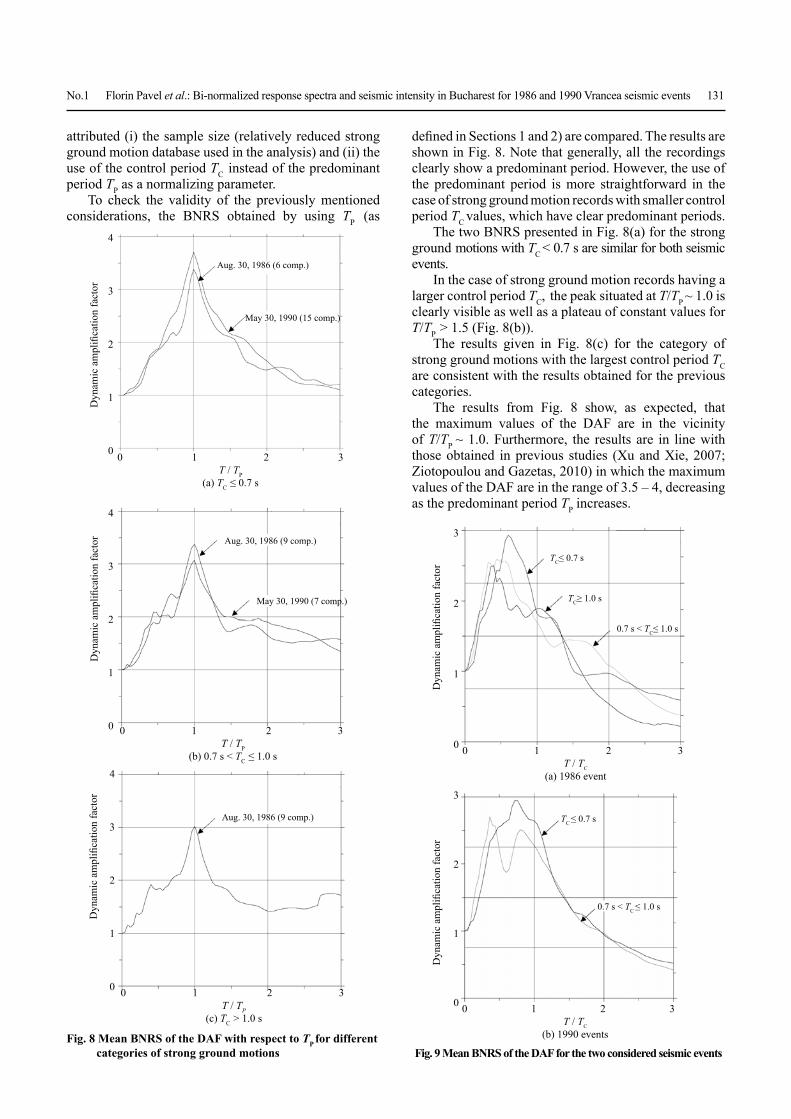
To check the validity of the previously mentioned considerations, the BNRS obtained by using TP (as
defi ned in Sections 1 and 2) are compared. The results are shown in Fig. 8. Note that generally, all the recordings clearly show a predominant period. However, the use of the predominant period is more straightforward in the case of strong ground motion records with smaller control period TC values, which have clear predominant periods.
The two BNRS presented in Fig. 8(a) for the strong ground motions with TC < 0.7 s are similar for both seismic events.
In the case of strong ground motion records having a larger control period TC, the peak situated at T/TP ~ 1.0 is clearly visible as well as a plateau of constant values for T/TP > 1.5 (Fig. 8(b)).
The results given in Fig. 8(c) for the category of strong ground motions with the largest control period TC are consistent with the results obtained for the previous categories.
The results from Fig. 8 show, as expected, that the maximum values of the DAF are in the vicinity of T/TP ~ 1.0. Furthermore, the results are in line with those obtained in previous studies (Xu and Xie, 2007; Ziotopoulou and Gazetas, 2010) in which the maximum values of the DAF are in the range of 3.5 – 4, decreasing as the predominant period TP increases.
Fig. 8 Mean BNRS of the DAF with respect to TP for different categories of strong ground motions
4
3
2
1
0 0 1 2 3T / TP
(a) TC ≤ 0.7 s
Dyn
amic
am
plifi
catio
n fa
ctor
0 1 2 3T / TP
(c) TC > 1.0 s
Dyn
amic
am
plifi
catio
n fa
ctor
4
3
2
1
0 0 1 2 3T / TP
(b) 0.7 s < TC ≤ 1.0 s
Dyn
amic
am
plifi
catio
n fa
ctor
4
3
2
1
0
May 30, 1990 (15 comp.)
Aug. 30, 1986 (6 comp.)
Aug. 30, 1986 (9 comp.)
May 30, 1990 (7 comp.)
Aug. 30, 1986 (9 comp.)
Fig. 9 Mean BNRS of the DAF for the two considered seismic events
0 1 2 3T / TC
(b) 1990 events
Dyn
amic
am
plifi
catio
n fa
ctor
3
2
1
0 0 1 2 3T / TC
(a) 1986 event
Dyn
amic
am
plifi
catio
n fa
ctor
3
2
1
0
TC≤ 0.7 s
TC≥ 1.0 s
0.7 s < TC≤ 1.0 s
TC ≤ 0.7 s
0.7 s < TC ≤ 1.0 s
132 EARTHQUAKE ENGINEERING AND ENGINEERING VIBRATION Vol.13
Subsequently to evaluate the infl uence of the control period TC , the mean response spectra for the seismic events of 1986 and 1990 are compared; the results are plotted in Fig. 9.
It appears from Fig. 9(a) that the control period affects both the spectral shape and the DAF values. The second remark can be attributed to the limited structure of the database which contains many strong ground motion records with smaller PGA values and which have smaller control period TC values. Moreover, these same strong ground motions have large values of the DAFs. This observation is also highlighted by the mean spectra of the 1990 seismic event in Fig. 9(b).
Another observation from the analysis of the results is that the response spectra are not smooth. The spectral peaks and valleys can be attributed to the fact that the strong ground motion database employed in the calculations is limited with regard to the number of recordings and geographical spreading of the recording stations. Moreover, it is clear from Fig. 9 that the mean values of the DAF are close to the value of 2.75 enforced in the current version of the Romanian seismic design code P100-1 (2006).
The study of the response spectra of strong ground motions recorded in the Bucharest area will be revisited as new strong ground motion records become available.
6 Evaluation of seismic intensity using damage potential parameters
In order to evaluate the seismic intensity based on the characteristics of the strong ground motions recorded in Bucharest area during the Vrancea subcrustal earthquakes of August 30, 1986 and May 30, 1990, the methodology proposed by Martinez-Perreira and Bommer (1998) is adopted, in which several parameters are introduced to characterize the seismic intensity (including lower bound values for seven damage potential parameters) which can be used to select strong ground motions able to produce seismic intensities ≥ VIII (MMI scale). The selected parameters are: peak ground acceleration (PGA), peak ground velocity (PGV), Arias intensity (IA), cumulative absolute velocity (CAV), damage potential parameter Pd (Araya and Saragoni, 1984), damage potential parameter I (Fajfar et al., 1990) and the mean root square of the acceleration arms. The defi nition of these parameters are as follows:
For the Arias intensity IA (Arias, 1970) :
I a t tt
A gdtot= ∫
π2
2
0( ) (6)
For the cumulative absolute velocity CAV:
CAV dtot= ∫ a t tt
( )0
(7)
For the damage potential parameter Pd (Araya and Saragoni, 1984) which represents the ratio between the
Arias intensity and the square value of zero crossings per second:
P I
dA=0
2 (8)For the damage parameter I proposed by Fajfar et al.
(1990):I t= ⋅PGV r
0 25. (9)
where tr is the signifi cant duration of the strong ground motion.
Finally, for the root mean square acceleration arms:
at t
a t tt
t
rms d=− ∫1
2 1
2
1
2 ( ) (10)
where t1 and t2 are the limits of the strong shaking part of the recording.
The lower-bound values for a seismic intensity MMI ≥ VIII are given in Table 4.
Table 4 Lower-bound values for different damage potential parameters for MMI ≥ VIII (Martinez-Perreira and Bommer, 1998)
Parameter Lower-bound valuePGA 0.2 gPGV 20 cm/s
IA 0.4 m/sCAV 0.3 g/s
Pd 0.005 m·sI 0.3 m·s0.75
arms 0.5 m/s2
The USGS site (www.usgs.gov) lists the PGA and PGV values corresponding to MMI = VI and MMI = VII, which are given in Table 5.
In Sokolov et al. (2008) the seismic intensity assigned to the region of Bucharest is MMI = VI–VII for the 1986 event earthquake and MMI = VII for the 1990 event. USGS assigns MMI = VI–VII for both seismic events in the Bucharest region.
The EEFIT earthquake report (Pomonis et al., 1990) assigns a seismic intensity MMI = VII+ for the 1986 earthquake and MMI = VII for the 1990 seismic event in Bucharest.
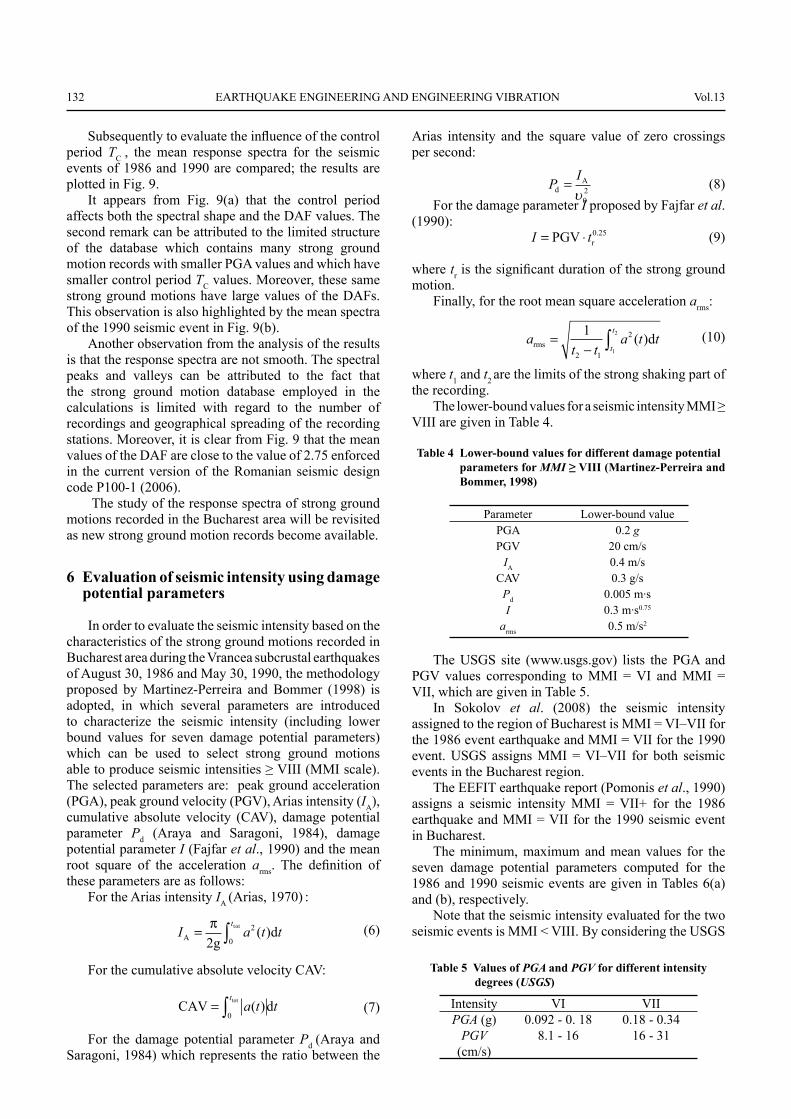
The minimum, maximum and mean values for the seven damage potential parameters computed for the 1986 and 1990 seismic events are given in Tables 6(a) and (b), respectively.
Note that the seismic intensity evaluated for the two seismic events is MMI < VIII. By considering the USGS
Table 5 Values of PGA and PGV for different intensity degrees (USGS)
Intensity VI VIIPGA (g) 0.092 - 0. 18 0.18 - 0.34
PGV (cm/s)
8.1 - 16 16 - 31
No.1 Florin Pavel et al.: Bi-normalized response spectra and seismic intensity in Bucharest for 1986 and 1990 Vrancea seismic events 133
criteria, the seismic intensity for Bucharest is MMI = VI–VII for both earthquakes.
Also, one can notice that all the mean parameters, except for the mean PGA, are larger in the case of the 1986 seismic event. Also, a closer look at the results shows that the most restrictive parameter appears to be arms, while the rest of the parameters exhibit some individual (very few) values that rank the 1986 earthquake as having MMI ~ VIII.
In Table 7, the parameters for the NS component of the seismic ground motion recorded at the INCERC station during the March 4, 1977 Vrancea subcrustal earthquake are given. For this earthquake, a seismic intensity MMI = VIII was assigned to the Bucharest region (Lungu et al., 2000).
Note that the root mean square acceleration arms is the most restrictive parameter. Thus, the NS component of the 1977 Vrancea earthquake recorded at the INCERC seismic station fulfi lls six of the seven criteria given by Martinez-Perreira and Bommer (1998) for MMI = VIII.
If the USGS criteria of MMI = VIII were considered, namely PGA between 0.34–0.65 g and PGV is between 31–60 cm/s, the same component fulfi lls only one criterion.
The analysis of the seismic intensity in Bucharest during the Vrancea 1977 earthquake based on a single free-fi eld recorded strong ground motion might be misleading because the major damage, including building collapses, occurred in some other parts of the city (central region of Bucharest). Furthermore, only slight to moderate damage to buildings in the area close to the INCERC seismic station was observed (observed damage was mostly to the nonstructural elements). Both previous remarks have to be put in the context with the location of the most vulnerable buildings in Bucharest. It is noticed that the heaviest damage occurred in 1977 in the downtown area of Bucharest, where most of the seismically vulnerable buildings are located. The INCERC seismic station is also located several kilometers away from this area. Thus, neither the seismic damage nor the strong ground motion itself are to be extrapolated and overlapped in the same location in order to make a proper judgment on the seismic intensity. Consequently, in this particular case, the correlation between observed intensity and computed intensity is weak.
The Japan Meteorological Agency (JMA) seismic intensity IJMA represents an intensity scale based on all three recorded components of the strong ground motion (two horizonal and one vertical). A description of this intensity scale and of the computation methodology can be found in Shabestari and Yamazaki (2001). In the case of the 1986 earthquake, the IJMA values are in the range 4.4–5 (maximum value computed for Otopeni seismic station). For the 1990 seismic event, the range of IJMA values is 4.2–5 (maximum value computed for the Bolintin-Vale seismic station). The mean value of IJMA is again larger in the case of the 1986 earthquake (4.63 versus 4.52). Nevertheless, these values are much smaller than the value IJMA = 5.6 computed for the strong ground motion recorded at the INCERC station during the 1977 earthquake (the largest computed IJMA for Romania, as well).
Consequently, by considering the values of all seven damage potential parameters, it can be concluded that a seismic intensity of MMI = VI–VII can be assigned for both the 1986 and 1990 Vrancea subcrustal earthquakes. However, in both cases, there are isolated sites for which it appears that a seismic intensity of MMI = VII is more appropriate.
A more comprehensive study on the evaluation of the seismic intensities for the Southern and Eastern part of Romania can be found in Pavel el al. (2013a), where more than 130 horizontal components recorded in Romania during fi ve Vrancea intermediate-depth seismic events - March 4, 1977 (MW = 7.4), August 30, 1986 (MW = 7.1), May 30, 1990 (MW = 6.9), May 31, 1990 (MW = 6.4) and October 27, 2004 (MW = 6.0)
Table 6(b) Computed values of different damage potential parameters for the 1990 event
Parameter min max meanPGA (g) 0.06 0.24 0.11
PGV (cm/s) 3.8 17.0 10.4IA (m/s) 0.06 0.46 0.16
CAV (m/s) 0.26 0.61 0.38Pd (m·s) 0.001 0.008 0.003
I (cm·s0.75) 0.09 0.38 0.22arms (m/s2) 0.08 0.25 0.13
Table 7 Values of different damage potential parameters for the NS component recorded at INCERC station during 1977 Vrancea subcrustal earthquake
Parameter ValuePGA 0.21gPGV 70.5 cm/s
IA 0.89 m/sCAV 0.91 g/s
Pd 0.077 m·sI 1.42 m·s0.75
arms 0.3 m/s2
Table 6(a) Computed values of different damage potential parameters for the 1986 event
Parameter min max meanPGA (g) 0.04 0.22 0.10
PGV (cm/s) 4.8 26.2 13.7IA (m/s) 0.06 0.40 0.16
CAV (m/s) 0.25 0.67 0.41Pd (m·s) 0.002 0.013 0.005
I (cm·s0.75) 0.12 0.51 0.27arms (m/s2) 0.07 0.3 0.14
134 EARTHQUAKE ENGINEERING AND ENGINEERING VIBRATION Vol.13
- are used. An attempt to produce a magnitude-distance space for defi ning near-fi eld conditions is made. In addition to the Modifi ed Mercalli Intensity (MMI), the Japanese Meteorological Agency Intensity (IJMA) is also used in Pavel el al. (2013a) for the evaluation of seismic intensity. The study reveals that the maximum IJMA values were not obtained in the epicentral area in the case of the August 30, 1986, May 30, 1990 and October 27, 2004 Vrancea earthquakes.
7 Conclusions In this study, a comparative analysis of the bi-
normalized response spectra (BNRS) for strong ground motions recorded in the Bucharest region during the 1986 and 1990 major Vrancea intermediate-depth earthquakes is conducted. In addition, the seismic intensity during the two earthquakes is estimated by using various damage potential parameters. The most important conclusions of this study are summarized as follows:
• The frequency contents of the 1986 and 1990 Vrancea subcrustal earthquakes are different, with the larger 1986 event producing more narrow frequency bandwidth strong ground motion records as compared to the smaller magnitude 1990 event.
• The BNRS show similar spectral shapes for ground motions with lower control periods TC.
• The control period TC affects both the DAF values and the amplitude of the relative velocity response spectra.
• The maximum mean value of the dynamic amplifi cation factor (DAF) at T/TP = 1.0 is in the range of 3–4; it is comparable with the values obtained in other studies.
• The mean values of the DAF obtained from the BNRS with respect to the control period TC are in the range of 2.5–3, equal to or larger than the usual code-based value of 2.5 and very similar to the value of 2.75 enforced in the current Romanian seismic design code P100-1(2006).
• The bi-normalized response spectrum can be considered as a reliable candidate for the code-based design spectrum. However, in order to be implemented, the spectrum must be accompanied by site-dependent control periods. This approach is able to effectively capture the site-dependent amplifi cations of response spectra, but requires reliable estimates of the expected relevant periods (their maximum and minimum values as well as the most likely values) for both the soil and the buildings to be considered.
• A seismic intensity MMI = VI–VII can be assigned to the Bucharest region for the two seismic events of 1986 and 1990. Also, it can be concluded based on the values of the computed damage potential parameters that generally, the estimated seismic intensity is larger for the 1986 seismic event than for the 1990 earthquake.
Acknowledgement
Funding for this research was provided by the Romanian National Authority for Scientifi c Research (ANCS) under Grant Number 72/2012. This support is gratefully acknowledged. The constructive feedback from three anonymous reviewers is greatly appreciated. Their comments and suggestions assisted us in considerably improving the quality of the manuscript.
References
Araya R and Saragoni GR (1984), “Earthquake Accelerogram Destructiveness Potential Factor,” Proceedings of the 8th World Conference on Earthquake Engineering, San Francisco, USA, pp. 835–842.Arias A (1970), “A Measure of Earthquake Intensity,” In RJ Hansen, ed., Seismic Design for Nuclear Power Plants, MIT Press, Cambridge, Massachusetts, pp. 438–483. Cartwright DE and Longuet-Higgins MS (1956), “The Statistical Distribution of the Maxima of a Random Function”, Proceedings of the Royal Society of London. Series A, Mathematical and Physical Sciences, 237(1209): 212–232.Eurocode 8 (2004), Design of Structures for Earthquake Resistance – Part 1: General Rules, Seismic Actions and Rules for Buildings.Fajfar P, Vidic T and Fischinger M (1990), “A Measure of Earthquake Motion Capacity to Damage medium-period Structures,” Soil Dynamics and Earthquake Engineering, 9(5): 236–242.Ganas A, Grecu B, Batsi E and Radulian M (2010), “Vrancea Slab Earthquakes Triggered by Static Stress Transfer,” Natural Hazards and Earth Systems Sciences, 10: 2565–2577.Gazetas G (2012), “Some Presumptions on the Nature of Base Excitation May Erroneously Affect the Response of Strongly Inelastic Systems,” Proceedings of the 15th World Conference on Earthquake Engineering, Lisbon, Portugal, Keynote & invited lecture.Kramer S (1996), Geotechnical Earthquake Engineering, Prentice-Hall, Upper Saddle River, New Jersey 07458.Lang D, Molina-Palacios S, Lindholm C and Balan S (2012), “Deterministic Earthquake Damage and Loss Assessment for the City of Bucharest, Romania,” Journal of Seismology, 16: 67–88.Lungu D, Cornea T, Aldea A and Zaicenco A (1997), “Basic Representation of Seismic Action” in Lungu D, Mazzolani F and Savidis S, eds, Design of Structures in Seismic Zones: Eurocode 8 – Worked Examples. (TEMPUS PHARE CM Project 01198: Implementiong of structural Eurocodes in Romanian Civil Engineering standards) Bridgeman Ltd., Timisoara, Romania, pp. 1–60.Lungu D, Demetriu S and Cornea T (1992), “Frequency
No.1 Florin Pavel et al.: Bi-normalized response spectra and seismic intensity in Bucharest for 1986 and 1990 Vrancea seismic events 135
bandwidth of Vrancea Earthquakes and the 1991 Edition of Seismic Code in Romania,” Proceedings of the 10th World Conference on Earthquake Engineering, Madrid, Spain, 10: 5633–5638.Lungu D, Vacareanu R, Aldea A and Arion C (2000), Advanced Structural analysis, Conspress, Bucharest.Maniatakis C and Spyrakos C (2012), “A New Methodology to Determine Elastic Displacement Spectra in the Near-fault Region,” Soil Dynamics and Earthquake Engineering, 35: 41–58.Martinez-Pereira A and Bommer J (1998), “What is the Near-fi eld?”, In: E Booth, ed., Seismic Design Practice into the Next Century, Balkema, Rotterdam, pp. 245–252.Newmark N and Hall WJ (1969), “Seismic Design Criteria for Nuclear Reactor Facilities,” Proceedings of the 4th World Conference on Earthquake Engineering, Santiago de Chile, Chile, 2: B5.1–12.Newmark N and Hall WJ (1982), “Earthquake Spectra and Design,” Earthquake Engineering Research Institute, Berkeley, California.P100-1/2006 (2006): Code for Seismic Design – Part I – Design Prescriptions for Buildings, Ministry of Transports, Constructions and Tourism.Pavel F (2012), “The Effects of the Intensity and of the Frequency Contents of Seismic Motions on the Nonlinear Structural Response,” PhD thesis, Technical University of Civil Engineering Bucharest (in Romanian).Pavel F, Aldea A and Vacareanu R (2013a), “Near-fi eld Strong Ground Motion Records from Vrancea Earthquakes,” Proceedings of the International Conference on Earthquake Engineering SE-50EEE, Skopje, Macedonia, Paper No. 190.Pavel F and Lungu D (2012), “Frequency Content Indicators of Strong Ground Motions,” Proceedings of the 15th World Conference on Earthquake Engineering, Lisbon, Portugal. Paper no. 2372.Pavel F, Vacareanu R, Aldea A and Arion C (2013b), “Source Effects on the Spectral Characteristics of Ground Motions Recorded in Bucharest Area during
Vrancea Earthquakes of 1986 and 1990,” Journal of Earthquake Engineering, 17(8): 1192-1211.Pomonis A, Coburn A and Ledbetter S (1990), “The Vrancea, Romania Earthquakes of 30-31 May 1990 - A Field Report by E.E.F.I.T.,” E.E.F.I.T., London, U.K.Rathje E, Abrahamson N and Bray J (1998), “Simplifi ed Frequency Content Estimates of Earthquake Ground Motions,” Journal of Geotechnical and Geoenvironmental Engineering, 124(2): 150–159.Shabestari K and Yamazaki F (2001), “A Proposal of Instrumental Seismic Intensity Scale Compatible with MMI Evaluated from Three-component Acceleration Records,” Earthquake Spectra, 17(4): 711–723.ShakeMapAt l a s , h t t p : / / e a r t hquake .u sgs .gov /earthquakes/shakemap/atlas.php.Sokolov V, Boese M and Wenzel F (2008), “Shakemap Methodology Based on Fourier Amplitude Spectra and Its Application for the Case of Vrancea Earthquakes in Romania,” Proceedings of the 14th World Conference on Earthquake Engineering, Beijing, China.Vanmarcke EH (1976), “Structural Response to Earthquakes,” In C Lomnitz, E Rosenblueth, eds, Seismic Risk and Engineering Decisions, Elsevier, Amsterdam, pp. 287–338.Xu L, Shengchao Y and Xie L (2010), “Response Spectra for Nuclear Structures on Rock Sites Considering Near-Fault Directivity Effect,” Earthquake Engineering and Engineering Vibrations, 9(2): 357–365.Xu L and Xie L (2004), “Bi-normalized Response Spectral Characteristics of the 1999 Chi-Chi earthquake,” Earthquake Engineering and Engineering Vibrations, 3(2): 147–155.Xu L and Xie L (2007), “Near-fault Ground Motion Bi-normalized Pseudo-velocity Spectra and Its Applications,” Acta Seismologica Sinica, 20(5): 544–552.Ziotopoulou A and Gazetas G (2010), “Are Current Design Spectra Suffi cient for Soil-structure Systems on Soft Soils?” In: M Fardis, ed., Advances in Performance-based Earthquake Engineering, Springer, pp. 79–87.