Embed Size (px)
Citation preview
Bibi S. Naz
03/10/2009
Glacier changes in the Western Karakoram Himalaya
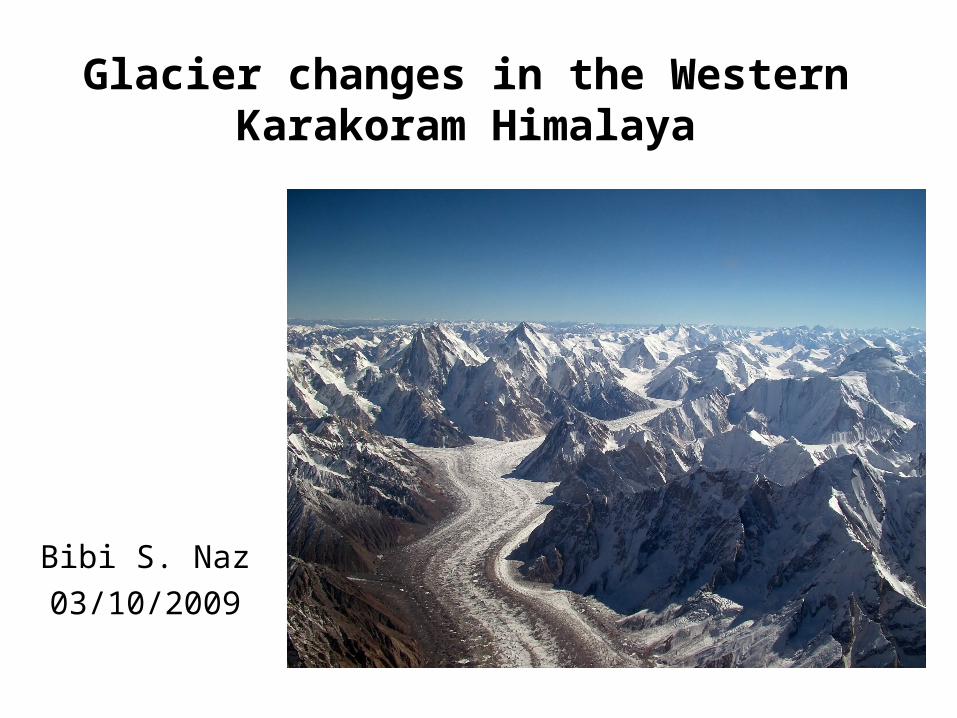
Global climate change
250
275
300
325
350
375
1000 1100 1200 1300 1400 1500 1600 1700 1800 1900 2000
Atm
osp
heric C
O2 (p
pm
)
Time (100 years)
Source: IPCC Report 2007
Law Dome ice core Etheridge et al (1999)
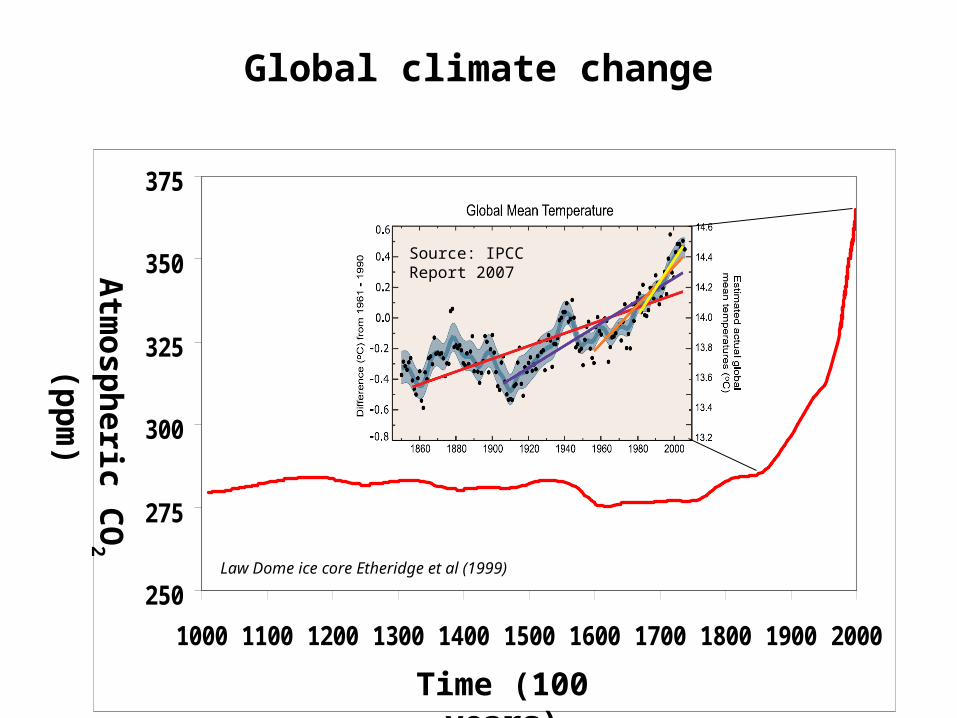
Changes in the precipitation pattern :IPCC Report (2007)
• Precipitation has significantly increased (+) in eastern North and South America, northern and central Asia and northern Europe
• There has been decline (-) in precipitation in the Mediterranean, some regions in southern Asia, southern Africa and Sahel
Source: http://www.unep.org.
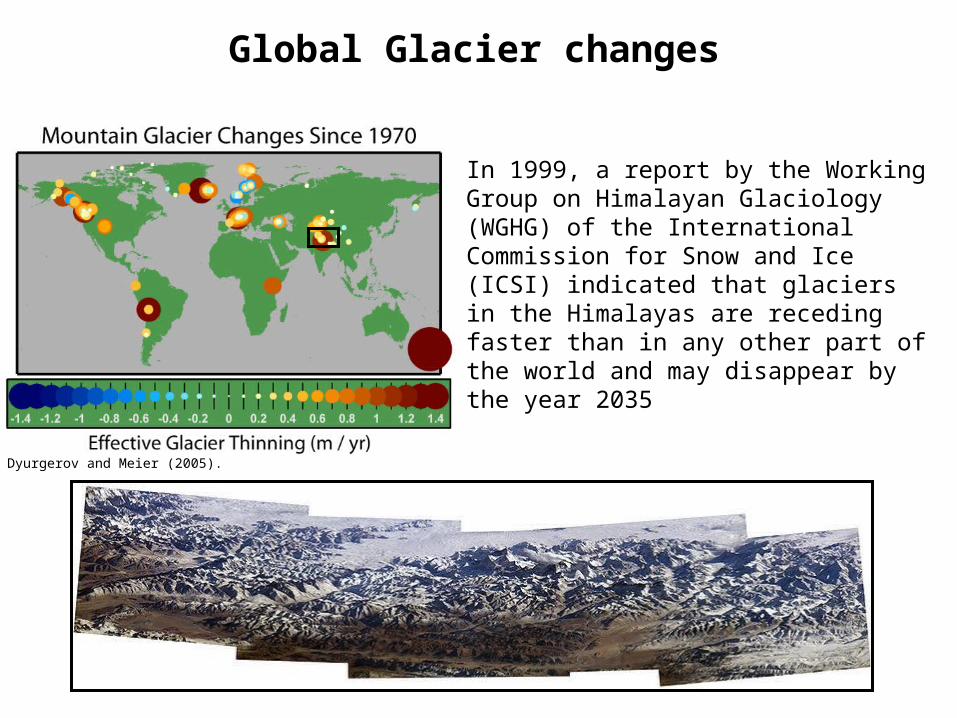
Global Glacier changes
In 1999, a report by the Working Group on Himalayan Glaciology (WGHG) of the International Commission for Snow and Ice (ICSI) indicated that glaciers in the Himalayas are receding faster than in any other part of the world and may disappear by the year 2035
Dyurgerov and Meier (2005).
http://www.atmos.washington.edu/2009Q1/111/ATMS111%20Presentations/Folder%203/HughesS_BedionesJ.pdf
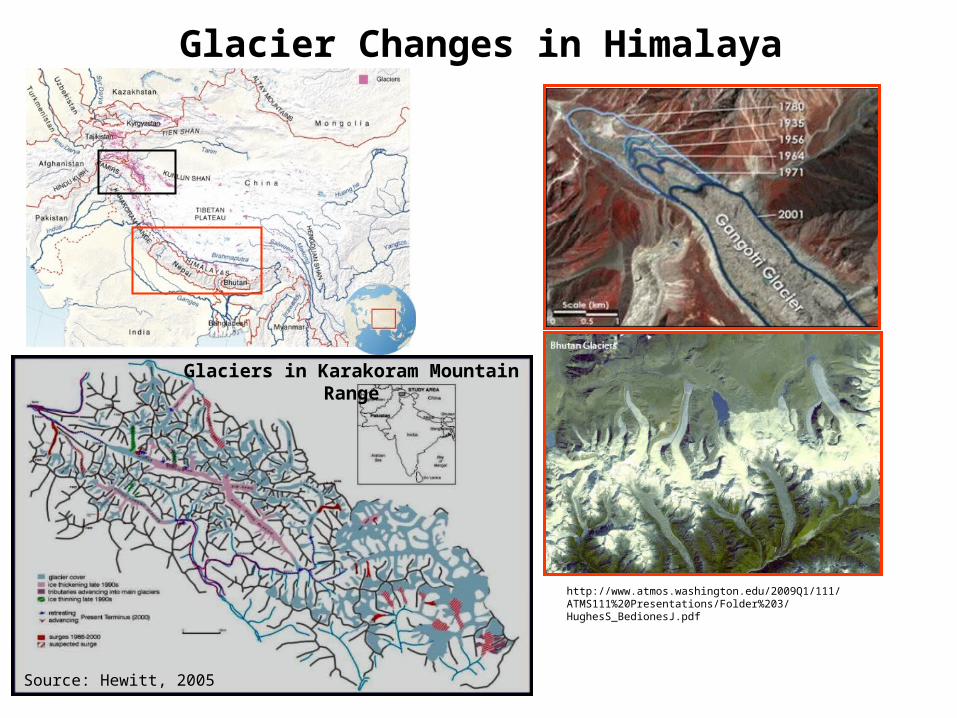
Source: Hewitt, 2005
Glacier Changes in Himalaya
Glaciers in Karakoram Mountain Range
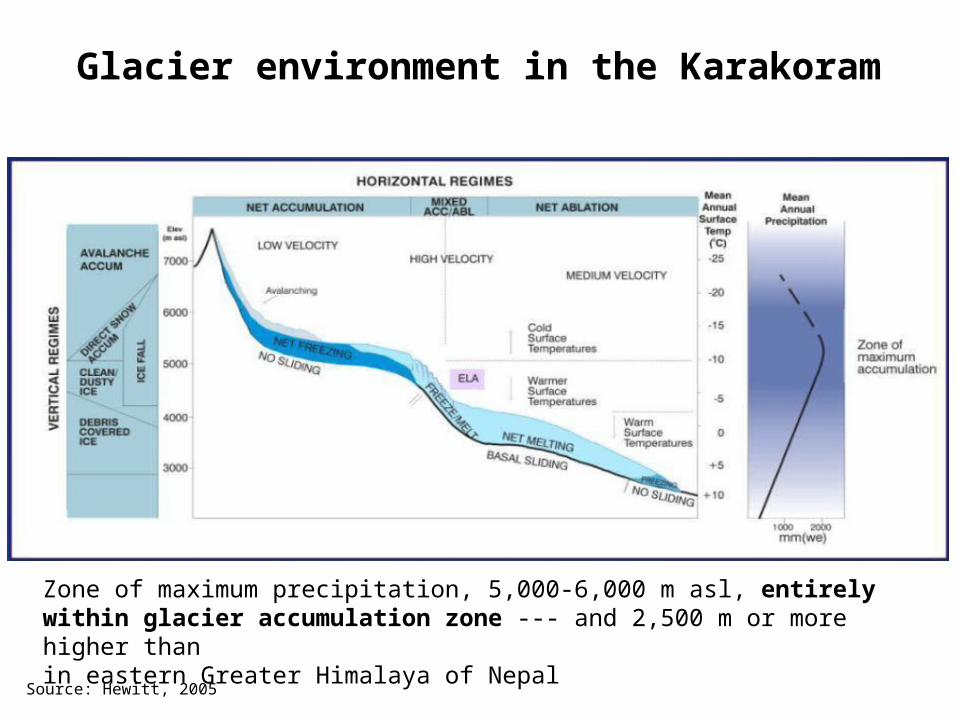
Glacier environment in the Karakoram
Source: Hewitt, 2005
Zone of maximum precipitation, 5,000-6,000 m asl, entirely within glacier accumulation zone --- and 2,500 m or more higher thanin eastern Greater Himalaya of Nepal
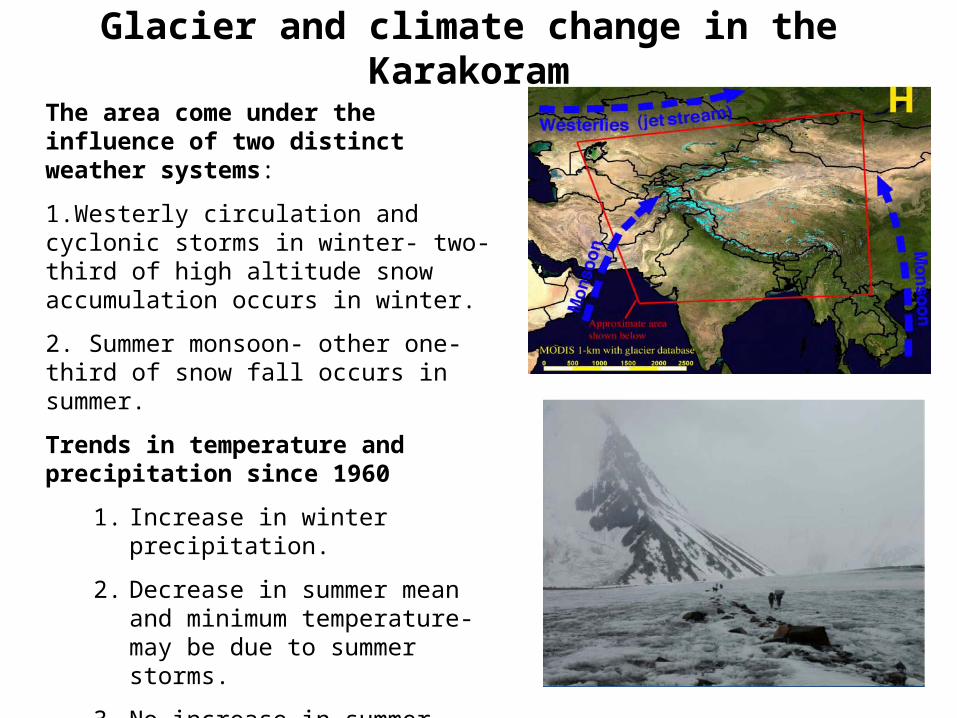
Glacier and climate change in the Karakoram
The area come under the influence of two distinct weather systems:
1.Westerly circulation and cyclonic storms in winter- two-third of high altitude snow accumulation occurs in winter.
2. Summer monsoon- other one-third of snow fall occurs in summer.
Trends in temperature and precipitation since 1960
1. Increase in winter precipitation.
2. Decrease in summer mean and minimum temperature- may be due to summer storms.
3. No increase in summer precipitation
4. Increase in winter temperature- less critical for high-altitude glaciers.
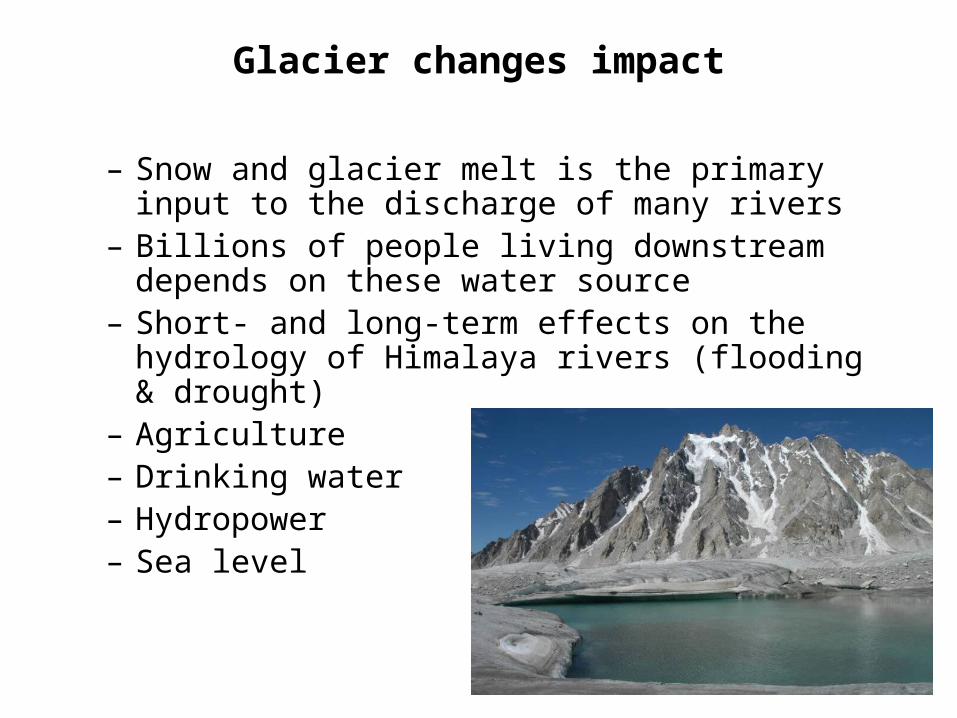
Glacier changes impact
– Snow and glacier melt is the primary input to the discharge of many rivers
– Billions of people living downstream depends on these water source
– Short- and long-term effects on the hydrology of Himalaya rivers (flooding & drought)
– Agriculture– Drinking water– Hydropower– Sea level
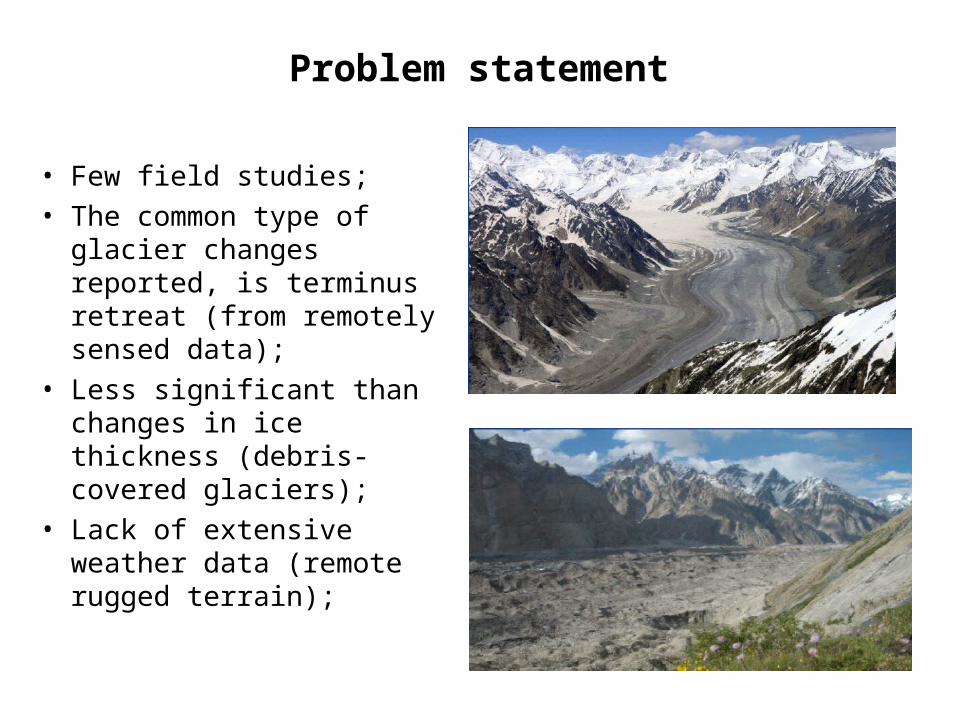
Problem statement
• Few field studies;• The common type of
glacier changes reported, is terminus retreat (from remotely sensed data);
• Less significant than changes in ice thickness (debris-covered glaciers);
• Lack of extensive weather data (remote rugged terrain);
Objectives
• Quantify glacier mass balance of major glaciers in the Karakorum Himalaya Region using measurements of ice mass changes and areal extent of glaciated area from remotely sensed data;
• Assess the effect of glacial fluctuations on annual discharge of major rivers;
• Predict the impacts of future climate change on contribution from snow and glacier melt runoff to the total discharge of the rivers.
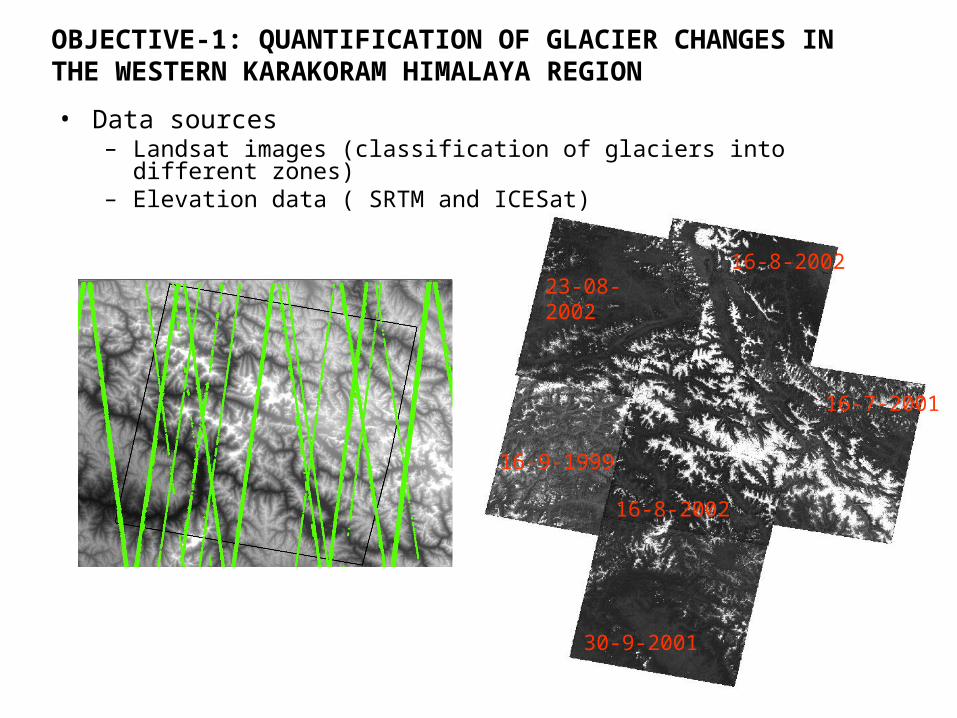
• Data sources– Landsat images (classification of glaciers into different zones)– Elevation data ( SRTM and ICESat)
16-8-2002
16-8-2002
30-9-2001
16-7-2001
16-9-1999
23-08-2002
OBJECTIVE-1: QUANTIFICATION OF GLACIER CHANGES IN THE WESTERN KARAKORAM HIMALAYA REGION
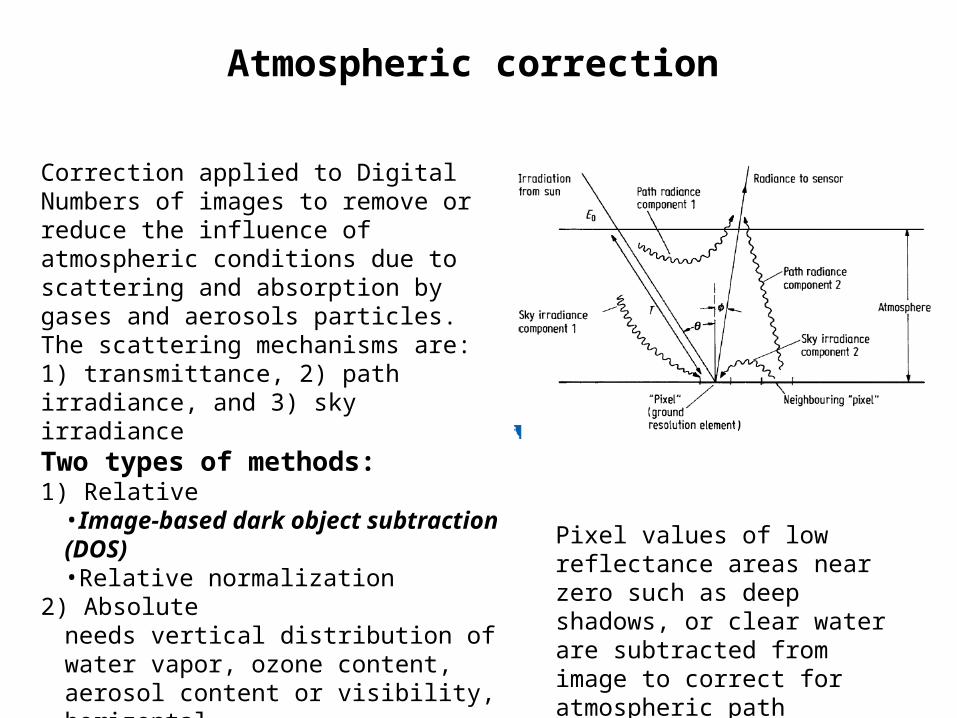
Correction applied to Digital Numbers of images to remove or reduce the influence of atmospheric conditions due to scattering and absorption by gases and aerosols particles.The scattering mechanisms are:1) transmittance, 2) path irradiance, and 3) sky irradianceTwo types of methods: 1) Relative
•Image-based dark object subtraction (DOS)•Relative normalization
2) Absoluteneeds vertical distribution of water vapor, ozone content, aerosol content or visibility, horizontal
Pixel values of low reflectance areas near zero such as deep shadows, or clear water are subtracted from image to correct for atmospheric path radiance.
Atmospheric correction
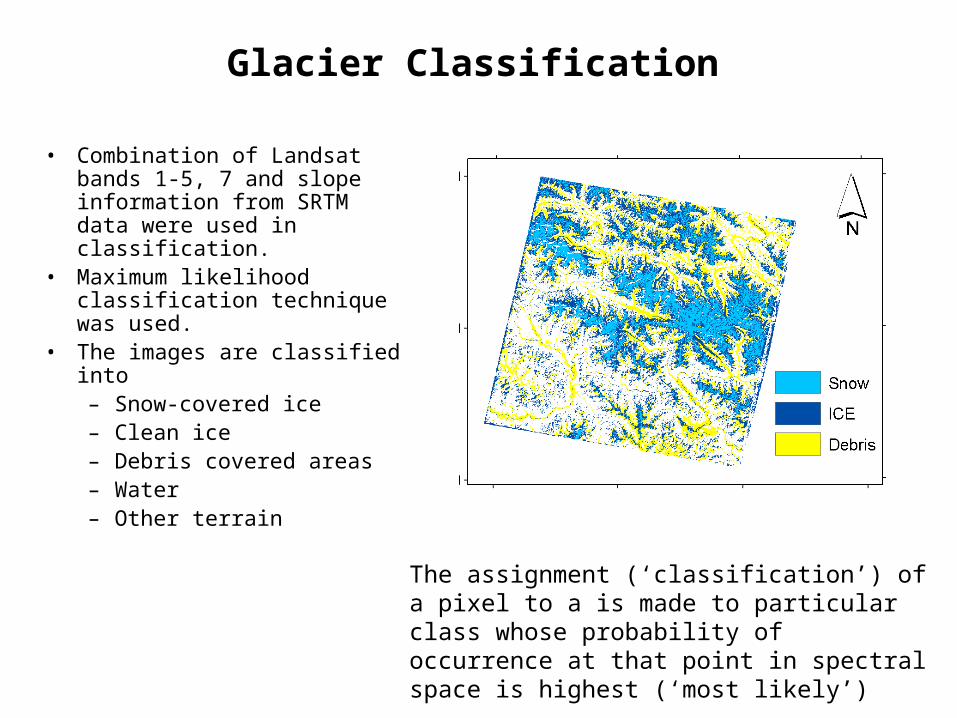
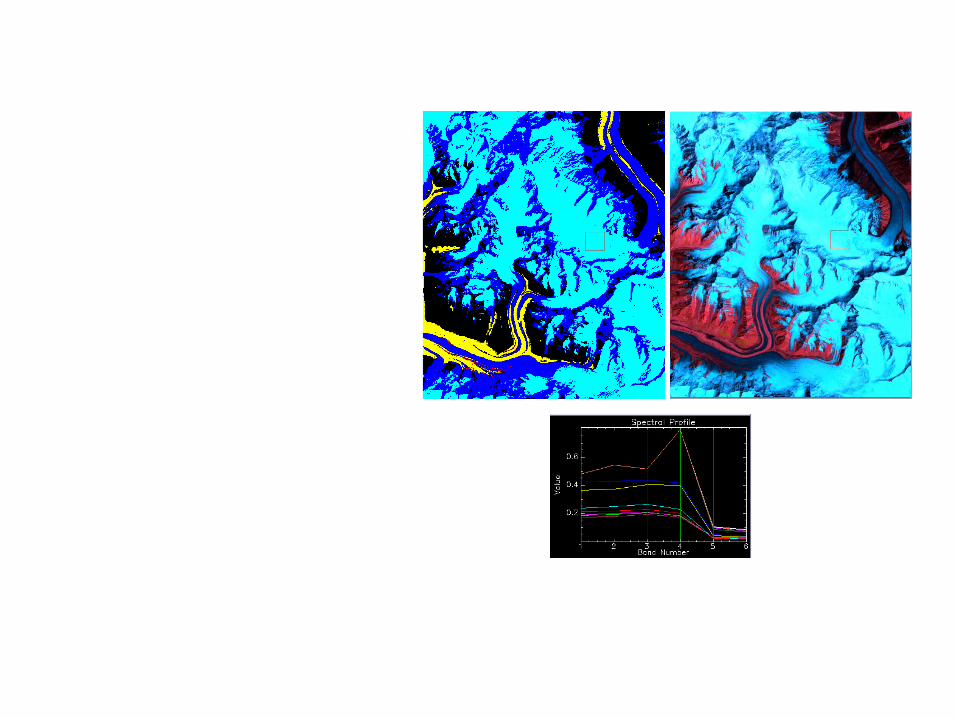
• Combination of Landsat bands 1-5, 7 and slope information from SRTM data were used in classification.
• Maximum likelihood classification technique was used.
• The images are classified into– Snow-covered ice– Clean ice– Debris covered areas– Water– Other terrain
Glacier Classification
The assignment (‘classification’) of a pixel to a is made to particular class whose probability of occurrence at that point in spectral space is highest (‘most likely’)
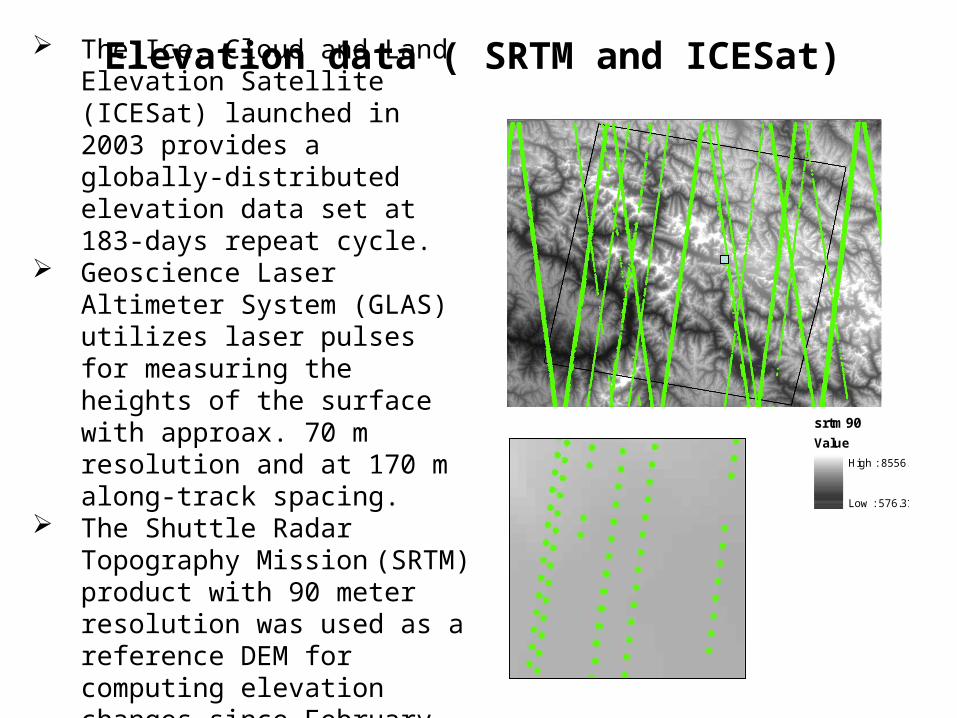
The Ice, Cloud and Land Elevation Satellite (ICESat) launched in 2003 provides a globally-distributed elevation data set at 183-days repeat cycle.
Geoscience Laser Altimeter System (GLAS) utilizes laser pulses for measuring the heights of the surface with approax. 70 m resolution and at 170 m along-track spacing.
The Shuttle Radar Topography Mission (SRTM) product with 90 meter resolution was used as a reference DEM for computing elevation changes since February, 2000.
srtm90
Value
High : 8556.99
Low : 576.312
Elevation data ( SRTM and ICESat)
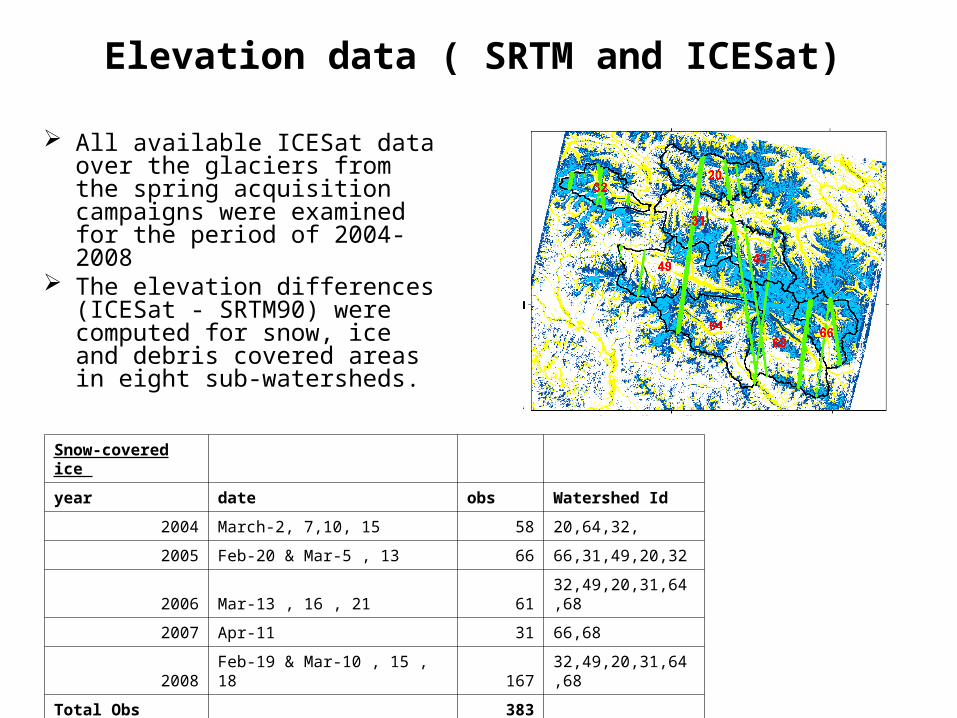
All available ICESat data over the glaciers from the spring acquisition campaigns were examined for the period of 2004-2008
The elevation differences (ICESat - SRTM90) were computed for snow, ice and debris covered areas in eight sub-watersheds.
Snow-covered ice
year date obs Watershed Id
2004 March-2, 7,10, 15 58 20,64,32,
2005 Feb-20 & Mar-5 , 13 66 66,31,49,20,32
2006 Mar-13 , 16 , 21 61 32,49,20,31,64,68
2007 Apr-11 31 66,68
2008 Feb-19 & Mar-10 , 15 , 18 167 32,49,20,31,64,68
Total Obs 383
Elevation data ( SRTM and ICESat)
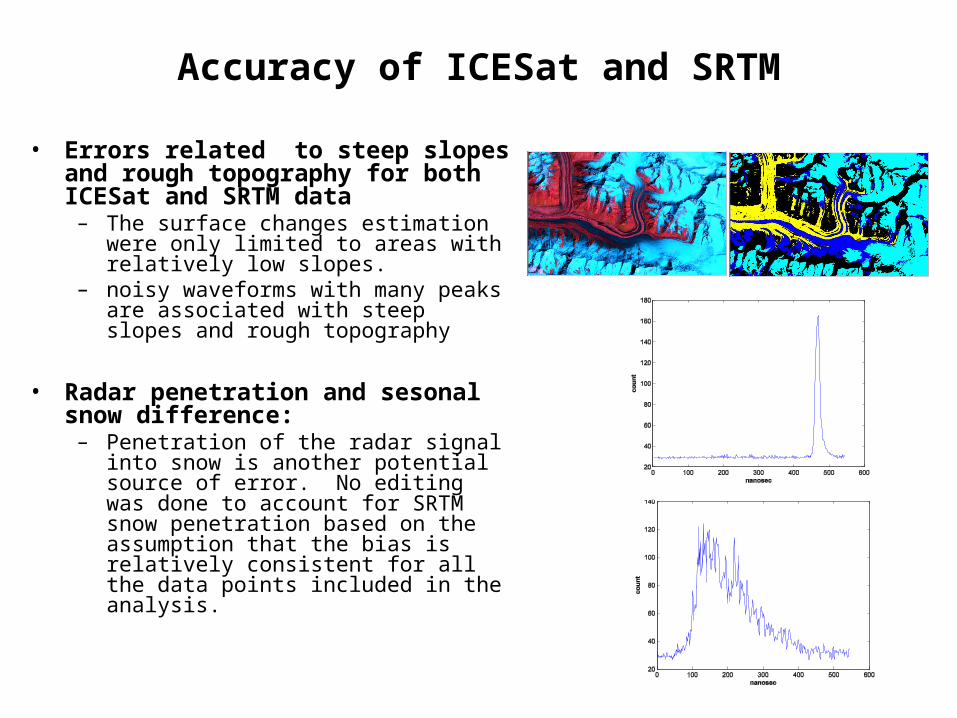
Accuracy of ICESat and SRTM
• Errors related to steep slopes and rough topography for both ICESat and SRTM data
– The surface changes estimation were only limited to areas with relatively low slopes.
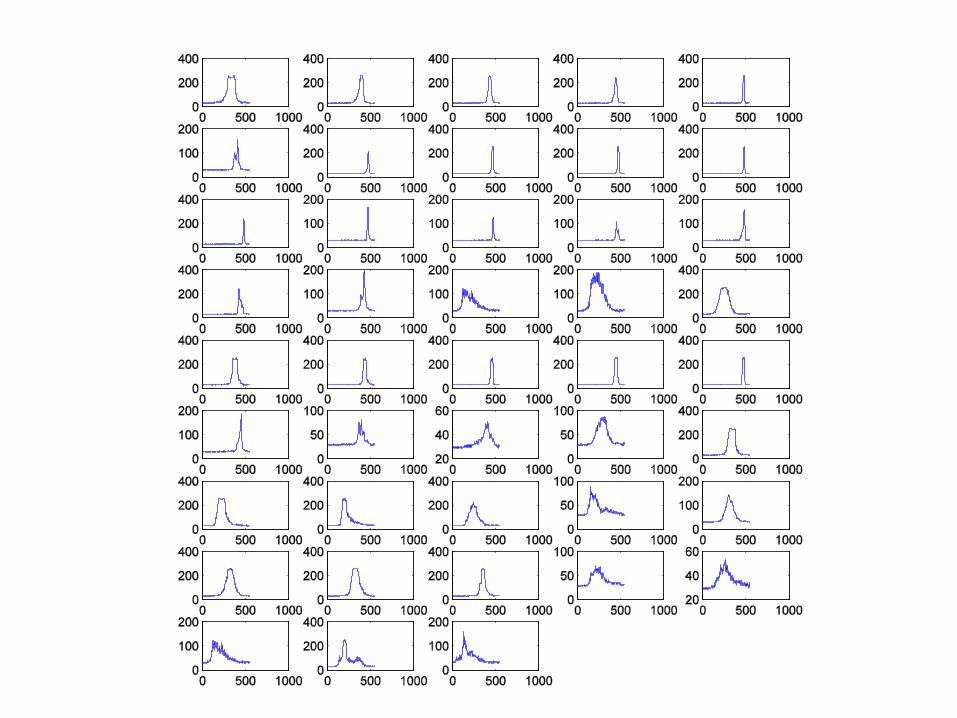
– noisy waveforms with many peaks are associated with steep slopes and rough topography
• Radar penetration and sesonal snow difference:
– Penetration of the radar signal into snow is another potential source of error. No editing was done to account for SRTM snow penetration based on the assumption that the bias is relatively consistent for all the data points included in the analysis.
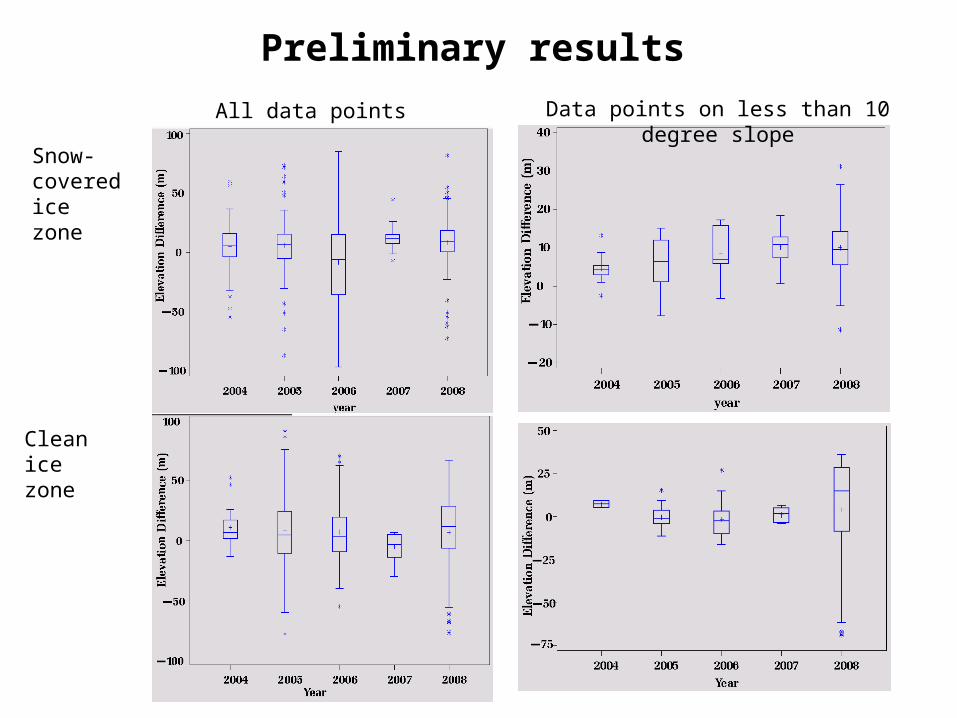
Snow- covered ice zone
Clean ice zone
All data points Data points on less than 10 degree slope
Preliminary results
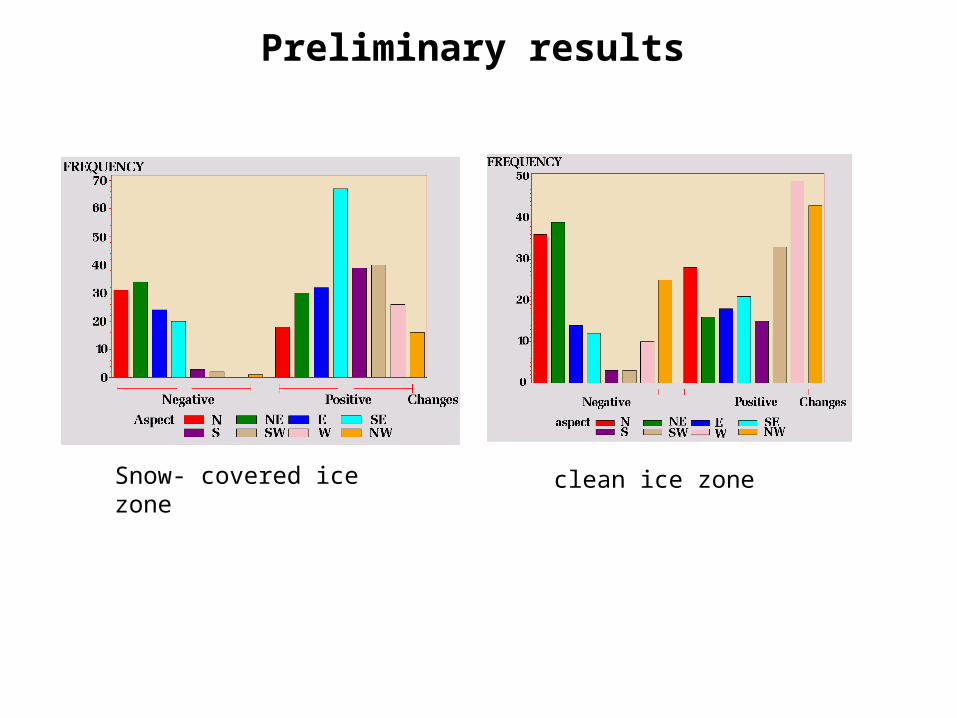
Snow- covered ice zone clean ice zone
Preliminary results
Summary
• Comparisons of elevation differences (ICESat - SRTM90) between years 2004-2008 shows an increase in elevation in the snow-covered ice zone (5000 - 6000m elevation).
• In clean ice areas, there is a slight decrease in elevation relative to SRTM between 2004 and 2007, while the debris covered areas show no changes between 2004 and 2007. The statistical significance of these changes has not been assessed.
• More positive elevation changes were seen on south east and south west facing slopes for snow covered areas than north facing slopes. A similar pattern is observed for ice covered areas where south and north western slopes show more positive changes.
• This might be associated with two strong regional trends of precipitation in the Karakoram Himalaya i.e. the south and east facing slopes receive heavy precipitation due to monsoonal influence, while westerly winds give more precipitation to west and north facing slopes ( Young and Hewitt, 1990).

Thank you
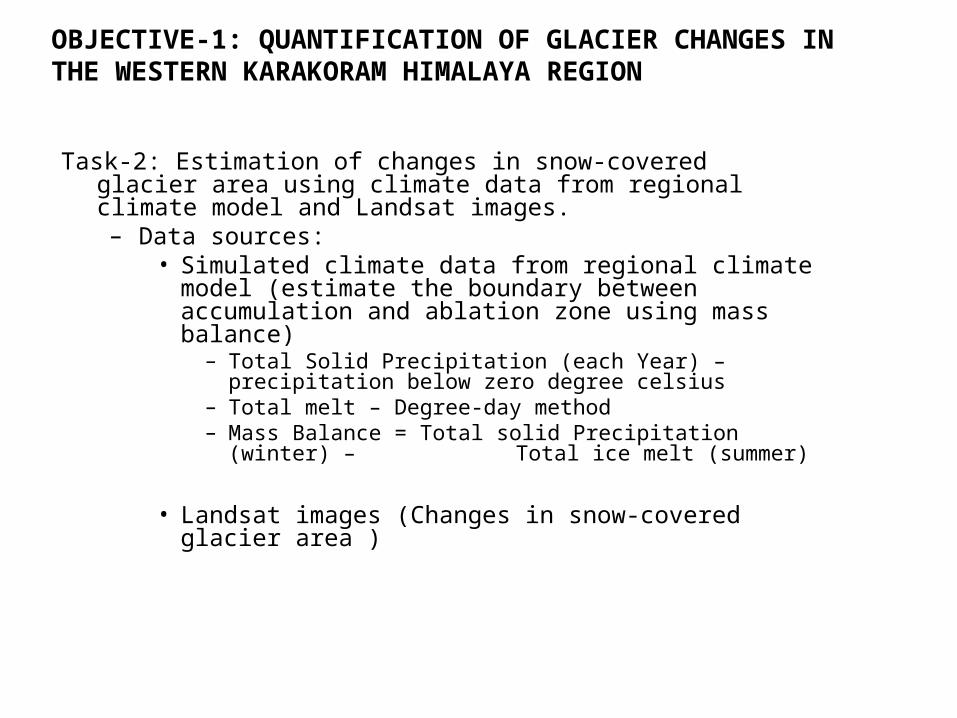
Task-2: Estimation of changes in snow-covered glacier area using climate data from regional climate model and Landsat images.– Data sources:
• Simulated climate data from regional climate model (estimate the boundary between accumulation and ablation zone using mass balance)
– Total Solid Precipitation (each Year) – precipitation below zero degree celsius
– Total melt – Degree-day method– Mass Balance = Total solid Precipitation (winter) –
Total ice melt (summer)
• Landsat images (Changes in snow-covered glacier area )
OBJECTIVE-1: QUANTIFICATION OF GLACIER CHANGES IN THE WESTERN KARAKORAM HIMALAYA REGION
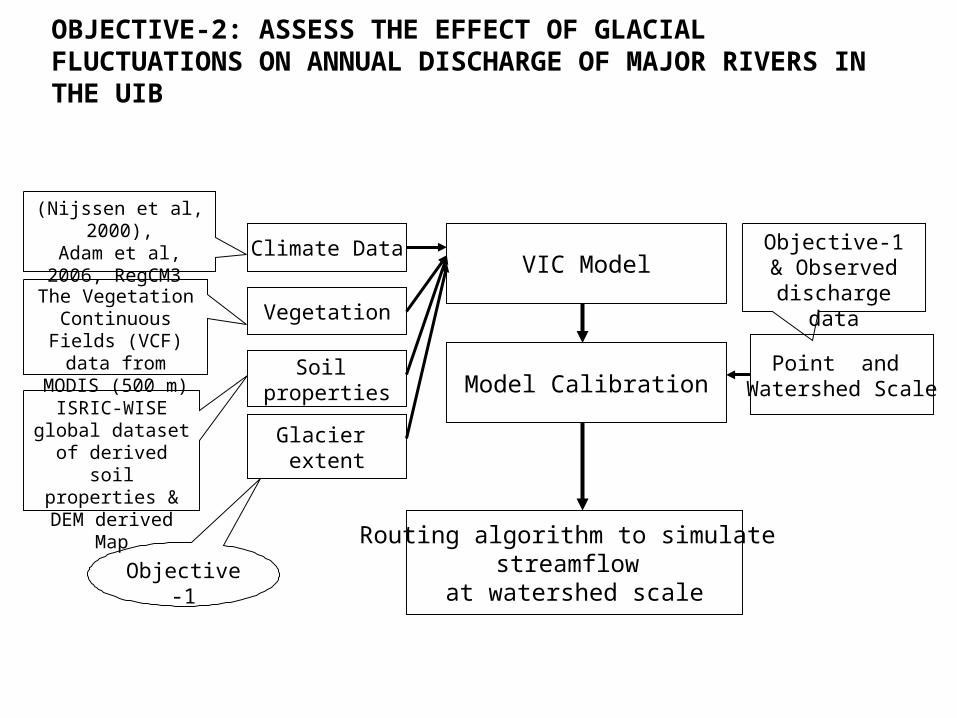
VIC Model
Model CalibrationPoint and
Watershed Scale
Routing algorithm to simulate streamflow
at watershed scale
Climate Data
Vegetation
Soil properties
(Nijssen et al, 2000),Adam et al, 2006,
RegCM3
The Vegetation Continuous Fields (VCF) data from MODIS (500 m)
ISRIC-WISE global dataset of
derived soil properties & DEM
derived Map
Glacier extent
Objective-1
Objective-1 & Observed
discharge data
OBJECTIVE-2: ASSESS THE EFFECT OF GLACIAL FLUCTUATIONS ON ANNUAL DISCHARGE OF MAJOR RIVERS IN THE UIB
– Prediction of long-term glaciers behaviour and their effects on streamflow variability by running the VIC model under future climate scenarios.
OBJECTIVE-3: IMPACT OF FUTURE CLIMATE CHANGE ON WATER RESOURCES WITHIN UIB.
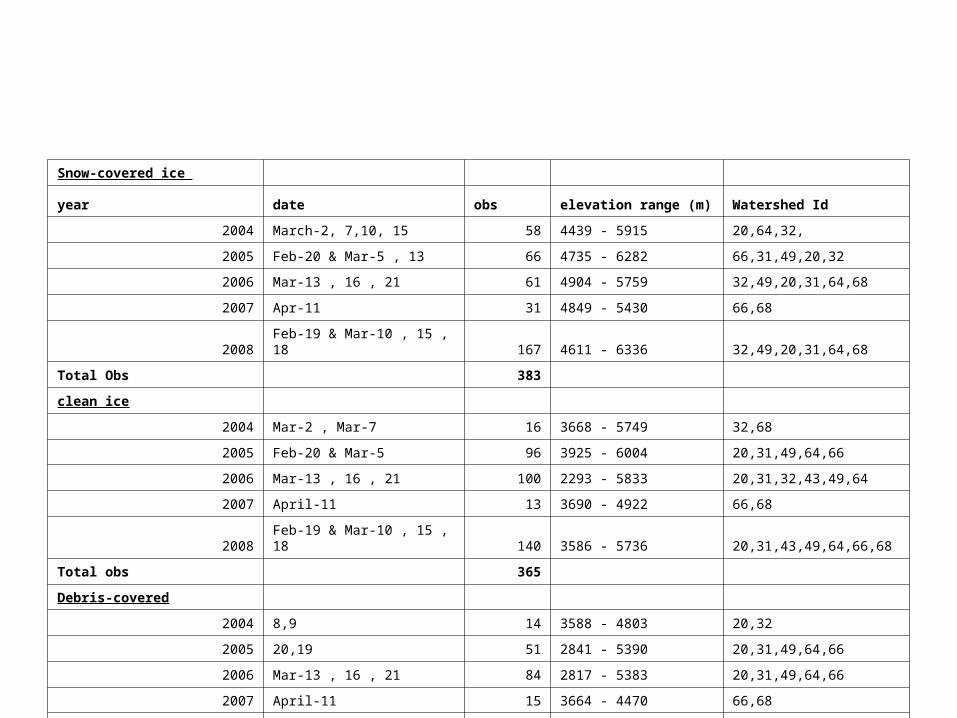
Snow-covered ice
year date obs elevation range (m) Watershed Id
2004 March-2, 7,10, 15 58 4439 - 5915 20,64,32,
2005 Feb-20 & Mar-5 , 13 66 4735 - 6282 66,31,49,20,32
2006 Mar-13 , 16 , 21 61 4904 - 5759 32,49,20,31,64,68
2007 Apr-11 31 4849 - 5430 66,68
2008 Feb-19 & Mar-10 , 15 , 18 167 4611 - 6336 32,49,20,31,64,68
Total Obs 383
clean ice
2004 Mar-2 , Mar-7 16 3668 - 5749 32,68
2005 Feb-20 & Mar-5 96 3925 - 6004 20,31,49,64,66
2006 Mar-13 , 16 , 21 100 2293 - 5833 20,31,32,43,49,64
2007 April-11 13 3690 - 4922 66,68
2008 Feb-19 & Mar-10 , 15 , 18 140 3586 - 5736 20,31,43,49,64,66,68
Total obs 365
Debris-covered
2004 8,9 14 3588 - 4803 20,32
2005 20,19 51 2841 - 5390 20,31,49,64,66
2006 Mar-13 , 16 , 21 84 2817 - 5383 20,31,49,64,66
2007 April-11 15 3664 - 4470 66,68
2008 Feb-19 & Mar-10 , 15 , 18 105 2824 - 4908 20,31,43,64,68
Total obs 269
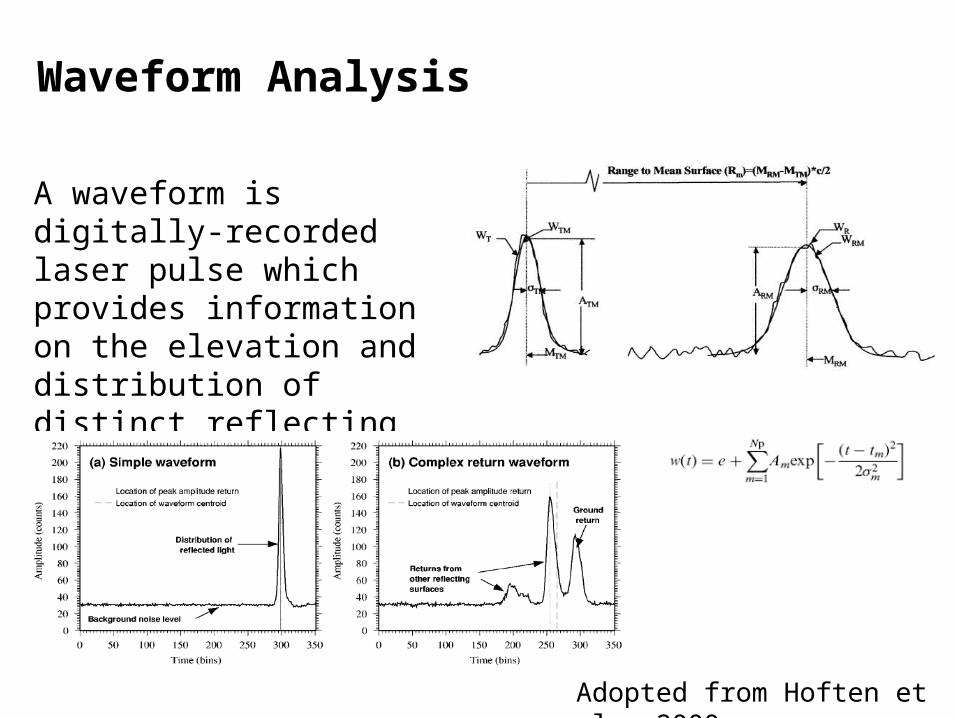
Waveform Analysis
A waveform is digitally-recorded laser pulse which provides information on the elevation and distribution of distinct reflecting surfaces within the footprint.
Adopted from Hoften et al., 2000