Embed Size (px)
Citation preview
Liu, Chen, and Sun
1
1
Bicycle Parking Demand Model for the Trips Combined of Urban Rail 2
Transit-Bicycle Chain 3
4
5
6
7
Shuai LIU, Master Student 8
School of Transportation Engineering, Tongji University 9
4800 Cao’an Road, Shanghai, 201804, P. R. of China 10
M-Tel) +86-13774240530 11
13
14
15
Xiaohong CHEN, Ph.D.* 16
Professor 17
School of Transportation Engineering, Tongji University 18
Key Laboratory of Road and Traffic Engineering of the Ministry of Education, Tongji University 19
4800 Cao’an Road, Shanghai, 201804, P. R. of China 20
Tel) +86-21-65989270 Fax) +86-21-65982897 21
23
24
25
Haihao SUN 26
Assistant Professor 27
School of Transportation Engineering, Tongji University 28
Key Laboratory of Road and Traffic Engineering of the Ministry of Education, Tongji University 29
4800 Cao’an Road, Shanghai, 201804, P. R. of China 30
M-Tel) +86-13818266327 31
33
34
35
Submitted: November 13, 2011 36
Word count: 4998 (Text) + 1,000 (4 Figures) + 1,250 (5 Tables) =7248 words 37
*Corresponding author 38
39
40
41
Paper Submitted to the 91st Annual Meeting of the Transportation Research Board, 42
Washington D.C. 43
44
TRB 2012 Annual Meeting Paper revised from original submittal.
Liu, Chen, and Sun
2
ABSTRACT 1
2
3
With China’s large-scale construction of urban rail transit, using bicycle to transfer to rail transit 4
has become a common and efficient travel pattern. It can not only make full use of bicycle’s 5
advantage in short-distance travel, but also make up for the shortcomings of rail transit. In 6
Shanghai, China, the rail-bicycle combined trips are increasing year by year. This will inevitably 7
make corresponding demands on the bicycle parking facilities planning and construction. 8
Therefore, a reasonable model to estimate the bicycle parking demand around the railway station 9
is necessary. In this paper, based on the bicycle parking on-site survey and questionnaire survey 10
around the rail transit stations, the researchers analyzed and summarized the transfer 11
characteristics of the metro-bicycle combined mode, and extracted the major influencing factors, 12
such as passengers entering the station in the morning rush hour, scale of residential area within 13
the bicycle attractive region, the number of bus routes in the visible range of the station. After 14
that, the researchers built the relationship between each factor and the amount of parking, and 15
developed a model by multiple regressions. In support of the trips characterized by 16
subway-bicycle chain, the model could be used to estimate the bicycle parking demand for the 17
urban transit system. 18
19
20
Keywords: Rail transit station, bicycle parking demand, influencing factor, multiple regressions 21
22
TRB 2012 Annual Meeting Paper revised from original submittal.
Liu, Chen, and Sun
3
1. INTRODUCTION 1
Urban rail transit system is the most important infrastructure in Chinese large cities, which has 2
provided some new trip chains and changed the structure of the travel modes. A large amount of 3
money has been invested on this system and the related service facilities. Beijing, Shanghai, 4
Guangzhou, Nanjing, Tianjin and other cities have already had a rail transit network in operation. 5
However, the network only covers main passenger corridors and has to depend on the feeding of 6
other transport systems. It’s important for the rail system service to find an efficient and 7
economic connection to integrate with it. The data from The Fourth Comprehensive Transport 8
Survey of Shanghai (2009) showed that more than 5% of the metro passengers arrived at the 9
stations by bicycles with an average riding distance of 2.4 kilometers, which was just the 10
reasonable travel distance for bicycle. As a feeding mode should be encouraged, a convenient 11
and adequate bicycle parking space is necessary for improving the accessibility of the 12
rail-bicycle trip mode. 13
Using bicycle to transfer to rail transit is a common, efficient and green travel pattern. With 14
the expansion of rail network, metro-bicycle combined trips are growing rapidly. In Shanghai, 15
for example, the trips in 2004 were 80 thousand passengers per day, which increased to 150 16
thousand passengers per day in 2009 (1). In Beijing, the passengers riding to or from the metro 17
stations are about 4 to 9% of the total volume (2). Compared with other countries such as Japan 18
(30%) and the Netherlands (35%) (3), there is still a large space for growth. It means that the 19
bicycle parking facilities are necessary around the railway station. How many parking spaces 20
should be reserved and how many parking lots should be built are important considerations when 21
the rail transit system is planned. 22
Most of the Chinese cities are lack of the data accumulation and facilities planning 23
experience on the metro-bicycle combined trip mode, although using bicycle as an independent 24
transport tool has had a long history in China. This situation contributes to the low efficiency in 25
the trips combined of urban rail-bicycle chain. For example, the average transfer rate in Shanghai 26
is only 5% (1). Bicycle parking demand around the station is influenced by many complex 27
factors. If some policies are made and the relevant measures are taken in the cities when the 28
influencing factors are well understood, it will be helpful to estimate the bicycle parking demand 29
and to improve parking facilities’ planning and construction. This will also be the core issue to 30
encourage and support the development of the bicycle-rail combined trip mode. 31
This paper takes Shanghai as a case, which chooses Shiguang Road Station, Yangsi Station, 32
Qu yang Road Station, Zhenping Road Station in the central urban area for the study of the 33
parking demand for the trips combined with metro and bicycle. Shanghai has the largest 34
operating rail transit network in China. There are 11 routes in total, with a length of 420km as of 35
2010 since the first urban subway operated in 1996. The bicycles still play an important role, 36
sharing 28.6% of trip mode. Based on the parked bicycles volume survey considering time 37
distribution, the riders questionnaire survey in the stations, the passengers volume data survey of 38
the rail system, the surrounding land use survey, and the bus network survey, the researchers use 39
statistical analysis and correlation analysis to find how these factors influence the bicycle 40
parking demand, and then build a bicycle parking demand model. The model could be applied to 41
TRB 2012 Annual Meeting Paper revised from original submittal.
Liu, Chen, and Sun
4
estimate the space demand of the bicycle parking and support the plan and design of metro 1
stations. 2
2. LITERATURE REVIEW 3
The rail transit-bicycle intermodal study is focused on the following two aspects: One introduced 4
the typical cases and successful experience in the world; the other mainly addressed the 5
metro-bicycle transfer demand analysis, and established the models for demand forecasting. 6
Successful experience is mainly found in the Netherlands, Japan and Denmark. Rietveld (3) 7
introduced the Dutch experience. It was noted that in the Netherlands bicycle as the access mode 8
played a significant role with a share of 35%, while at the activity end the share was only 10% 9
(1994). Meanwhile, in the access end, bicycle was the main mode within the range 1.2 ~ 3.7km 10
from the station and the range was much larger than the activity end. 11
Martens (4) discussed the use of bike and ride in three countries with widely different 12
bicycle cultures and infrastructures: the Netherlands, Germany and the UK. The share of the 13
bicycle in access trips had a comparable level in these three countries, but only for train services 14
and other fast public transport. In addition, it was found that the majority of bike-and-ride users’ 15
travel distance and the travel purpose were greatly similar. They often traveled between 2 and 5 16
km to a railway station. Working and education were the main purpose for trips. In2007, Martens 17
(5) further introduced the use of bicycles and the measures taken to encourage riding bicycles to 18
transfer train in the past decade in the Netherlands. It indicated that promoting the use of rental 19
bicycles not only led to a reduction in car use, but also growth in train trips and in bicycle use for 20
non-recurrent trips. 21
Peplogle (6) made investigations in the Netherlands, Denmark and United States. Based on 22
the observation result, the study discussed and compared the benefits and costs between P&R 23
and B&R. The results showed that regardless of cost, space, environmental protection and 24
passengers’ transfer will, bike and ride was more effective. The study also found that land use 25
and the distance from the city center would affect the amount of bicycle parking around the 26
station. In addition, the national bike and ride overview were described, and the reasons for 27
growth were also discussed at last. 28
In 2010, Pan (7) examined the challenges and opportunities for improving the bicycle-rail 29
connection, using Shanghai as a case study. Based on two questionnaire surveys of rail transit 30
riders, it was noted that bicycle had comparative advantage for a distance of 800-2500 meters. In 31
addition, people residing in areas not adjacent to bus stops preferred to use bicycle. And the 32
development of a bicycle rental system would likely be an effective way to increase bicycle use 33
among rail transit riders. 34
Some researchers are dedicated to bicycle demand forecasting. For example, Wardman, 35
Tight, and Page (8) identified factors influencing the cycling to work in UK. They developed a 36
mode choice model for the journey to work using both revealed preference data and stated 37
preference data obtained from travel surveys. They then used the model to forecast future trends 38
in urban commuting mode shares and to predict the impacts of different measures to encourage 39
cycling. Improving bicycle facilities and providing financial incentives to bicycle users were 40
among the policies analyzed. 41
TRB 2012 Annual Meeting Paper revised from original submittal.
Liu, Chen, and Sun
5
Christpher (9) reviewed past researches on bicycle travel demand forecasting methods. One 1
of the methods was to develop a regression model to estimate the proportion of bicycle users for 2
commuting. Demographics, facilities, and regional characteristics were considered. It was also 3
found that terrain and climate was one of the important factors which had a signification impact 4
on the bicycle travel. At last the researcher suggested that bicycle and pedestrian considerations 5
should be integrated into mainstream transportation models. 6
Taylor and Mahmassani (10) did some analysis of stated preferences for intermodal 7
bicycle-transit interfaces. A stated-preference survey was conducted using hypothetical scenarios. 8
The researchers then developed a nested logit choice model to find out travelers’ preference. 9
From this model, it was found that three potential factors might have great influence on this 10
choice, which were bicycle lockers, bike lanes and wide curb lanes, 1.6~2.4km bicycle access 11
distance to transit. This survey result could provide a reference for bicycle parking planning. 12
In China, most cities are lack of the practical experience on rail-bicycle combined trip mode. 13
The researchers devoted themselves to the bike and ride demand forecasting study. There are 14
mainly three methods: (a) Demand forecasting method based on bicycle parking features. Kuang 15
(11) divided bicycle parking lot into three types: only for the railway services, close to public 16
transport hubs, and next to large supermarkets. Through investigation, the researcher figured out 17
the bicycle parking hourly-variation characteristics, obtained some indicators such as transfer 18
rate, daily parking turnover rate, etc. In combination with passenger flow volume, the researcher 19
built bicycle parking demand model. (b) Discrete choice model. Mi (12) described the factors 20
influencing individuals’ choice of bicycle for rail station access and egress. In order to forecast 21
the parking demand, a suitable zone of the railway station was delineated firstly. Then, the 22
researcher chose discrete choice model to obtain the bicycle transfer selective probability, 23
multiplied by bicycle trips in the morning peak, thus the bicycle parking demand could be 24
predicted. (c) Parking demand forecasting model based on attraction. Chen (13) used gravity 25
model to forecast parking demand. He thought that the amount of bicycle parking within the 26
residential area was related with demographic characteristics, rail transit service and bike lane 27
connecting residential area and the railway station. 28
From the above literature review, it can be learned that great achievements have been made 29
on rail-bicycle intermodal transit in some European countries and in Japan. The policies and 30
measures of these countries are worthy to be learned to encourage the combination of urban 31
metro and bicycle. In China, using bicycle to transfer to rail transit is common and economic. 32
However, although there have already been some methods to estimate bicycle parking demand 33
around the station, the theory is still not mature yet. Further theoretical and empirical studies are 34
needed. 35
3. SURVEY METHODOLOGY AND DATA COLLETION 36
As of June 30, 2010, rail transit network in Shanghai included 11 routes, reached 420 kilometers, 37
plus a high-speed Maglev route serving the Pudong International Airport. The network structure 38
has been basically formed. In particular, the extension of Lines 1, 2, 3 and the completion of 39
Lines 5, 7, 8, 9, 11 make the metro stretch outside the city, and create a link between central city 40
and suburban areas. In this paper, the researchers select Line 4 and Line8 as the study object, 41
TRB 2012 Annual Meeting Paper revised from original submittal.
Liu, Chen, and Sun
6
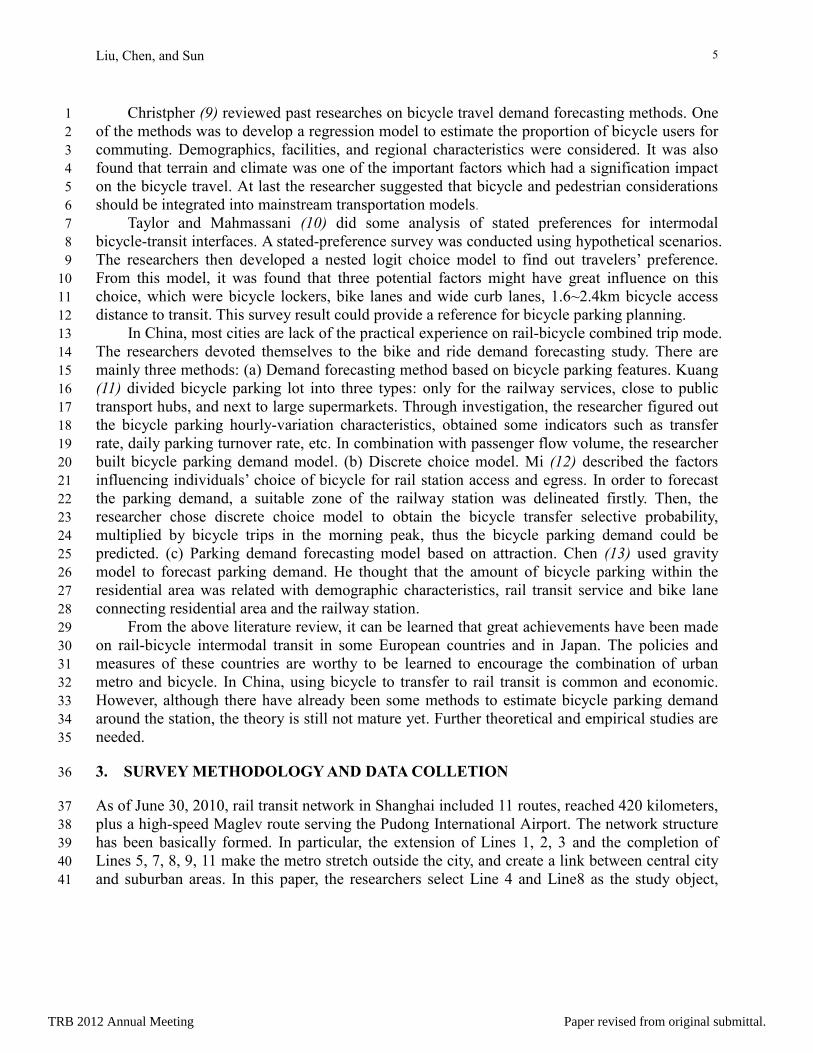
which are crossing a wide range of residential areas. Line 4 is a ring line, located within the inner 1
ring in Shanghai; Line 8 is overall in north-south direction. In the North it starts from Shiguang 2
Road Station, after crossing the city center, it extends to the Minhang Development Area in the 3
South. The stations selected from Line 4 and Line 8 and the land use along these two lines are 4
showed in Figure 1 5
6
FIGURE 1 Stations and land use along Line 4 and Line 8 in Shanghai 7
In this study, the researchers did some surveys as follows: the parked bicycles volume 8
survey considering time distribution, riders’ questionnaire survey in the stations, the passengers 9
volume data survey of the rail system, the land use survey around the station, and the bus 10
network survey. Through these surveys, the researchers extracted the main factors influencing 11
the amount of bicycle parking, and further described the quantitative relationship between these 12
factors and bicycle parking demand. 13
Bicycle parking status around the stations can be summarized as follows: (a) A serious 14
shortage of Bicycle parking space with parking racks in short supply. The total parking area of 15
Line 8 is approximately 7,500 m2, which meets only half of the Standards for Design of Traffic 16
and Setting Parking Lots (Garages) in Architectural Engineering in Shanghai. Parking supply and 17
demand ratio of Line 8 is 1:1.3. (b) Parking mismanagement. Parking area around the station is 18
more dispersed and difficult to manage; nearly 70% unattended parking area leads to security 19
risk (14). Bicycle parking volume, parking forms, parking charges of Line 8 are showed in Table 20
1. 21
TRB 2012 Annual Meeting Paper revised from original submittal.
Liu, Chen, and Sun
7
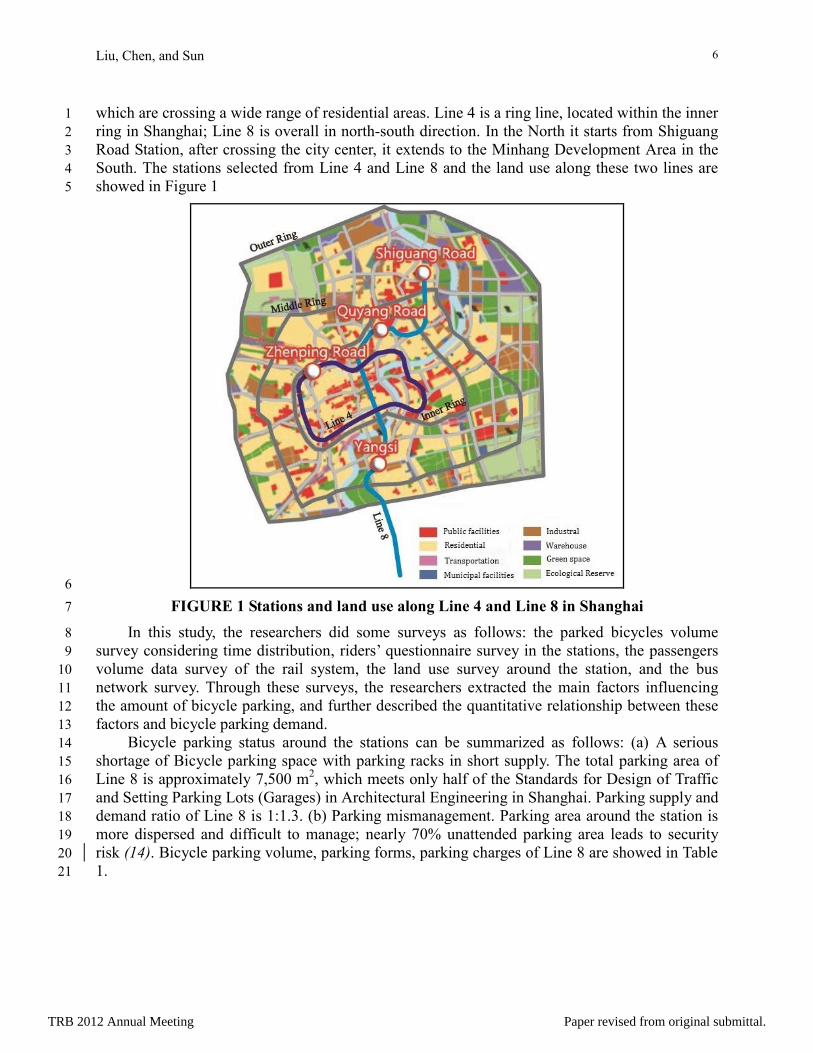
TABLE 1 Bicycle Parking Status around Line 8 Stations 1
Station
Maximum
parking
volume
Supply and
demand ratio
Parking forms Parking
charges Line mark Parking racks Open space
Aerospace Museum 487 1.3 √ √ √ free
Lianhang Road 198 1.5 √ √ free
Jiangyue Road 174 1.7 √ √ paid
Pujiang Town 185 1.4 √ √ free
Luheng Road 94 - √ √ free
Lingzhao Xincun 33 - √ √ free
Yangsi 297 1.5 √ paid
Chengshan Road 207 1.6 √ √ free
Yaohua Road 104 1.1 √ √ free
South Xizang Road 175 1.2 √ √ free
Lujiabang Road 107 0.9 √ free
Laoximen 160 1.2 √ √ free
Dashijie 27 1.4 √ √ free
People's Square 64 - √ √ free
Qufu Road 28 - √ free
Zhongxing Road 57 0.4 √ √ free
North Xizang Road 262 2.8 √ √ √ paid
Hongkou Football Stadium 137 2.0 √ √ paid
Quyang Road 199 1.7 √ √ √ paid
Siping Road 179 0.6 √ √ paid
Anshan Xincun 77 2.2 √ √ paid
Jiangpu Road 308 1.1 √ √ paid
Huangxing Road 351 1.1 √ √ free
Middle Yanji Road 226 1.7 √ free
Huangxing Park 147 0.6 √ √ free
Xiangyin Road 132 1.2 √ √ free
Nenjiang Road 236 1.0 √ √ free
Shiguang Road 639 1.5 √ free
Bicycle parking volume survey and hourly variation characteristics 2
In order to get the maximum parking volume at the railway station, the researchers selected 4 3
typical stations to take a continuous observation from7:00 a.m.to 7:00 p.m. They are Shiguang 4
Road Station, Quyang Road Station, Yangsi Station and Zhenping Road Station. There are large 5
residential communities near these stations. Quyang Road Station and Zhenping Road Station are 6
located within the inner ring. Shiguang Road Station and Yangsi Station are respectively the first 7
and the last stop. The researchers took 1 hour as the survey interval and continuously observed 8
bicycle arrival and departure within 50m from the entrance and exit around the stations, and 9
recorded the bicycle parking number each hour. The results are showed in Figure 2. 10
TRB 2012 Annual Meeting Paper revised from original submittal.
Liu, Chen, and Sun
8
1
2
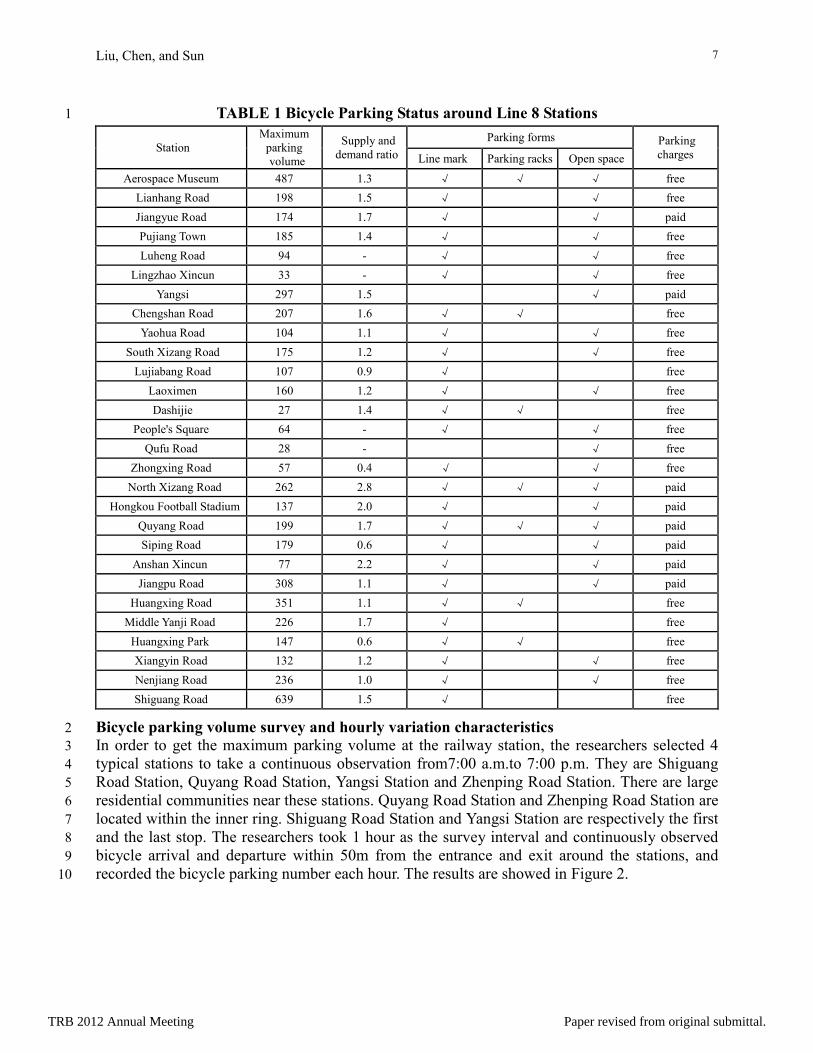
FIGURE 2 Bicycle parking volume curves at four different stations 3
From the bicycle parking observations, the researchers found that parked bicycles were 4
concentrated in the morning rush hour of 7:00 ~ 9:00, while the maximum parking volume 5
appeared in different periods, Shiguang Road Station and Quyang Road Station was in 9:00 ~ 6
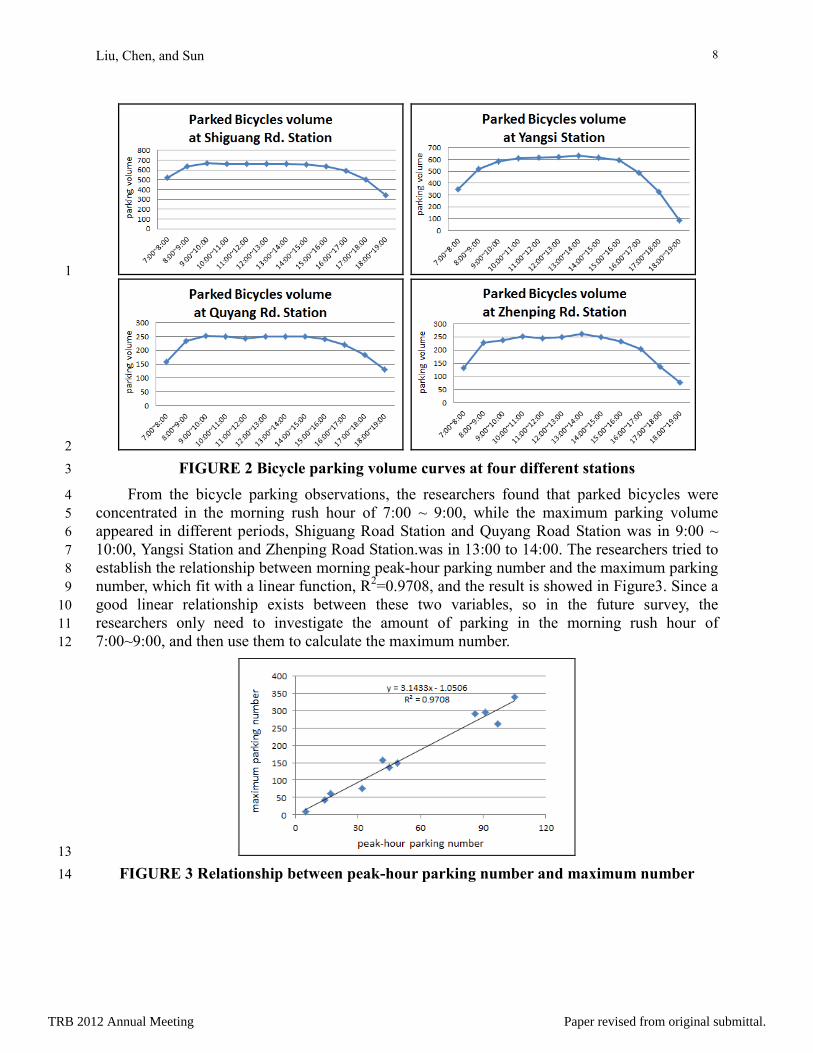
10:00, Yangsi Station and Zhenping Road Station.was in 13:00 to 14:00. The researchers tried to 7
establish the relationship between morning peak-hour parking number and the maximum parking 8
number, which fit with a linear function, R2=0.9708, and the result is showed in Figure3. Since a 9
good linear relationship exists between these two variables, so in the future survey, the 10
researchers only need to investigate the amount of parking in the morning rush hour of 11
7:00~9:00, and then use them to calculate the maximum number. 12
13
FIGURE 3 Relationship between peak-hour parking number and maximum number 14
TRB 2012 Annual Meeting Paper revised from original submittal.
Liu, Chen, and Sun
9
Riders’ questionnaire survey 1
Riders’ questionnaire survey was based on the parked bicycles volume survey. The researchers 2
chose the rail transit stations which have more rail-bicycle transfer amount, used the revealed 3
preference survey and the stated preference survey to obtain transfer travelers’ individual 4
characteristics, trip characteristics and transfer will. Questionnaire consisted of three parts: The 5
first part was individuals’ information, including gender, age, monthly incomes, etc., and these 6
questions were asked in order to figure out which kind of people use bicycle to transfer to rail 7
transit. In the second part, the researchers tried to obtain some trip characteristics such as 8
travelers’ trip purpose, riding time and parking duration. Transfer wills were asked in the third 9
part. Through inquiry, how riders’ features and convenience of service influence the parking 10
demand would be found out. 11
Surrounding land use survey and bus network survey. 12
The data from The Fourth Comprehensive Transport Survey of Shanghai (2009) showed that the 13
average riding distance at both ends of the station was 2.4 kilometers. Using the railway station 14
as the center and extending 2.4km along the road into the polygon, the space enclosed by such 15
boundary is called bicycle attractive region of the railway station. The researchers counted the 16
scale of different land areas within the attractive region and the number of bus routes in the 17
passengers’ visible range (50~80m). The passenger volume data were collected by Automatic 18
Fare Collection System at different stations and counted in hours. 19
4. PARKING DEMAND MODEL 20
4.1 Analysis of influencing factors 21
In order to build the bicycle parking demand model, the relationship between parking demand 22
and each influencing factor should be found out. These factor(s) which have a significant 23
influence on the model and can be quantified should be selected. In this study, the researchers 24
find that different factors have different influences on the parking demand, such as the volume of 25
passengers passing in and out, the nature of surrounding land, the number of bus routes, bicycle 26
parking facilities and services. Therefore, these factors need to be emphasized for a further 27
analysis, and the appropriate ones should be selected as model variables to the developed bicycle 28
parking demand model. 29
Passenger volume of rail transit station 30
Analysis of the passenger factor comes from two aspects: First is the transfer characteristic of the 31
travelers. The researchers used RP survey with a total of 400 questionnaires, and 351 copies were 32
collected as valid. In terms of individual characteristics, some results are drawn: the proportion 33
of men (64%) is higher than that of women (36%), the travelers aged from 18 to 40 years old are 34
the main transfer group accounting for 67.7%, whose monthly incomes concentrate in a range 35
from 3,000 to 5,000 Yuan. Transfer characteristics show that commuting is the main trip purpose 36
of the travelers who use bicycle to transfer to rail transit. The proportion of working and 37
education is 91.1%, and entertainment, visiting friends and business travel accounts for 2.1%, 38
TRB 2012 Annual Meeting Paper revised from original submittal.
Liu, Chen, and Sun
10
2.3% and 4.5% respectively. 1
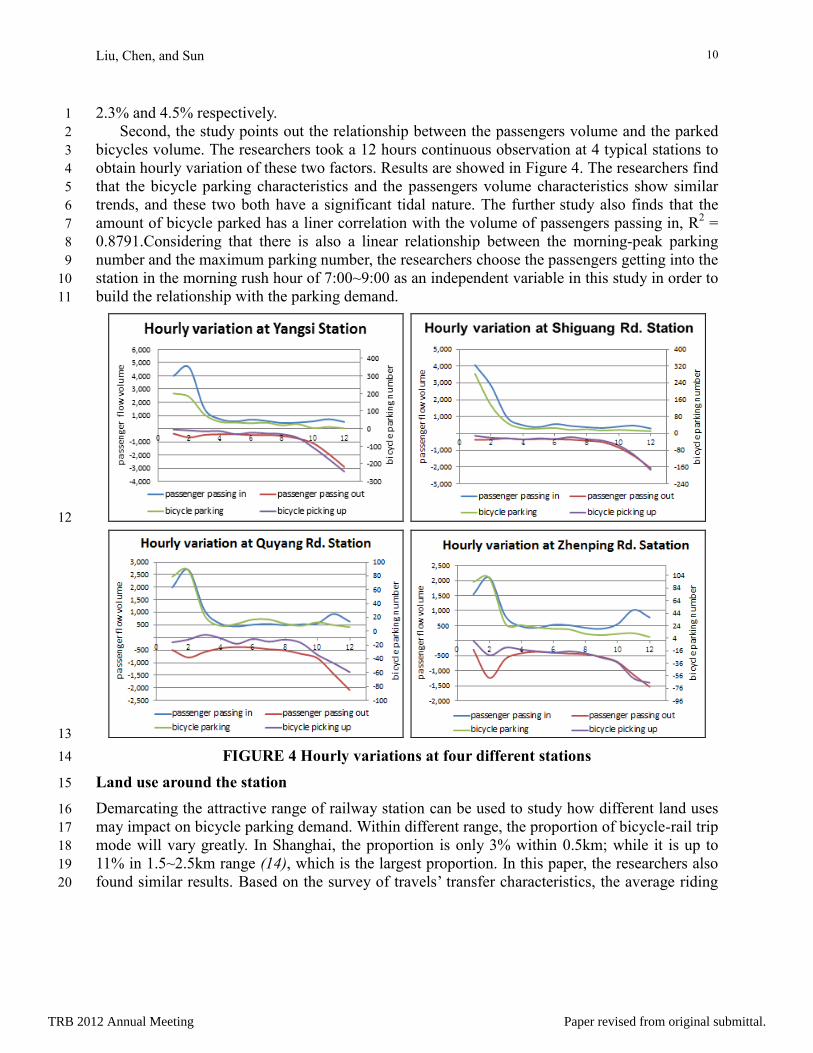
Second, the study points out the relationship between the passengers volume and the parked 2
bicycles volume. The researchers took a 12 hours continuous observation at 4 typical stations to 3
obtain hourly variation of these two factors. Results are showed in Figure 4. The researchers find 4
that the bicycle parking characteristics and the passengers volume characteristics show similar 5
trends, and these two both have a significant tidal nature. The further study also finds that the 6
amount of bicycle parked has a liner correlation with the volume of passengers passing in, R2 = 7
0.8791.Considering that there is also a linear relationship between the morning-peak parking 8
number and the maximum parking number, the researchers choose the passengers getting into the 9
station in the morning rush hour of 7:00~9:00 as an independent variable in this study in order to 10
build the relationship with the parking demand. 11
12
13
FIGURE 4 Hourly variations at four different stations 14
Land use around the station 15
Demarcating the attractive range of railway station can be used to study how different land uses 16
may impact on bicycle parking demand. Within different range, the proportion of bicycle-rail trip 17
mode will vary greatly. In Shanghai, the proportion is only 3% within 0.5km; while it is up to 18
11% in 1.5~2.5km range (14), which is the largest proportion. In this paper, the researchers also 19
found similar results. Based on the survey of travels’ transfer characteristics, the average riding 20
TRB 2012 Annual Meeting Paper revised from original submittal.
Liu, Chen, and Sun
11
time from home to railway station is 11 minutes, when the bicycle travel speed is 150m/min and 1
the distance is about 1600m. 85% of travelers’ riding time is 16 minutes, and the distance is up to 2
2400m. In this study, the researchers use 2400m as a feeder distance. 3
There are several different kinds of land within bicycle attractive region. The researchers 4
first divided the surrounding land into 7 categories: residential land, industrial land, commercial 5
land, farm land, institutional land, transportation land and green land, and then counted the area 6
of different land. After that, the researchers discussed the relationship between each kind of land 7
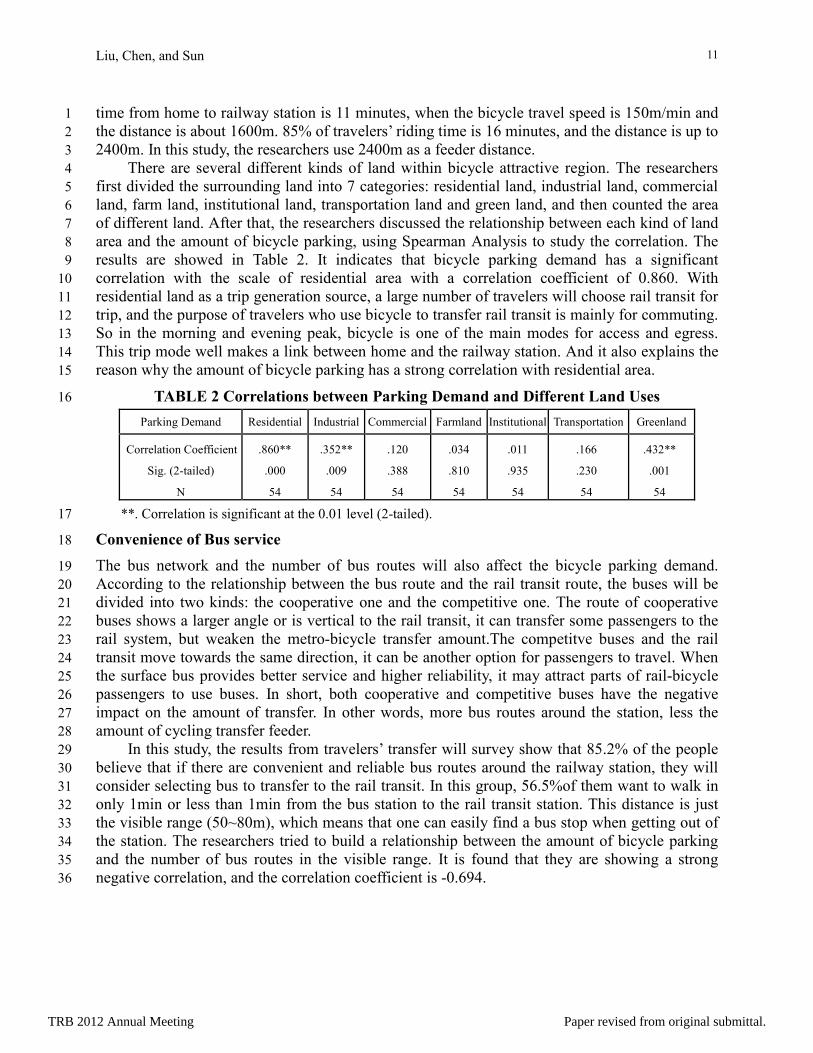
area and the amount of bicycle parking, using Spearman Analysis to study the correlation. The 8
results are showed in Table 2. It indicates that bicycle parking demand has a significant 9
correlation with the scale of residential area with a correlation coefficient of 0.860. With 10
residential land as a trip generation source, a large number of travelers will choose rail transit for 11
trip, and the purpose of travelers who use bicycle to transfer rail transit is mainly for commuting. 12
So in the morning and evening peak, bicycle is one of the main modes for access and egress. 13
This trip mode well makes a link between home and the railway station. And it also explains the 14
reason why the amount of bicycle parking has a strong correlation with residential area. 15
TABLE 2 Correlations between Parking Demand and Different Land Uses 16
Parking Demand Residential Industrial Commercial Farmland Institutional Transportation Greenland
Correlation Coefficient
Sig. (2-tailed)
N
.860**
.000
54
.352**
.009
54
.120
.388
54
.034
.810
54
.011
.935
54
.166
.230
54
.432**
.001
54
**. Correlation is significant at the 0.01 level (2-tailed). 17
Convenience of Bus service 18
The bus network and the number of bus routes will also affect the bicycle parking demand. 19
According to the relationship between the bus route and the rail transit route, the buses will be 20
divided into two kinds: the cooperative one and the competitive one. The route of cooperative 21
buses shows a larger angle or is vertical to the rail transit, it can transfer some passengers to the 22
rail system, but weaken the metro-bicycle transfer amount.The competitve buses and the rail 23
transit move towards the same direction, it can be another option for passengers to travel. When 24
the surface bus provides better service and higher reliability, it may attract parts of rail-bicycle 25
passengers to use buses. In short, both cooperative and competitive buses have the negative 26
impact on the amount of transfer. In other words, more bus routes around the station, less the 27
amount of cycling transfer feeder. 28
In this study, the results from travelers’ transfer will survey show that 85.2% of the people 29
believe that if there are convenient and reliable bus routes around the railway station, they will 30
consider selecting bus to transfer to the rail transit. In this group, 56.5%of them want to walk in 31
only 1min or less than 1min from the bus station to the rail transit station. This distance is just 32
the visible range (50~80m), which means that one can easily find a bus stop when getting out of 33
the station. The researchers tried to build a relationship between the amount of bicycle parking 34
and the number of bus routes in the visible range. It is found that they are showing a strong 35
negative correlation, and the correlation coefficient is -0.694. 36
TRB 2012 Annual Meeting Paper revised from original submittal.
Liu, Chen, and Sun
12
Bicycle parking facilities and services 1
Walking distance is an important indicator to measure parking services. However, as this 2
investigation is confined to a parking area within 50m of the station entrances and exits, walking 3
distance has little effect on the amount of bicycle parking. So this factor would not be considered 4
in this study. Different parking forms and parking charges may have different impacts on the 5
amount of bicycle parking. Based on the parking survey along the Line 4 and Line 8, there are 6
three kinds of parking forms: line mark, bicycle racks, and open space. The parking lot is divided 7
into the paid and free ones. The researchers took these two factors as control variables, and tried 8
to find out whether they have a significant impact on the amount of bicycle parking. Using 9
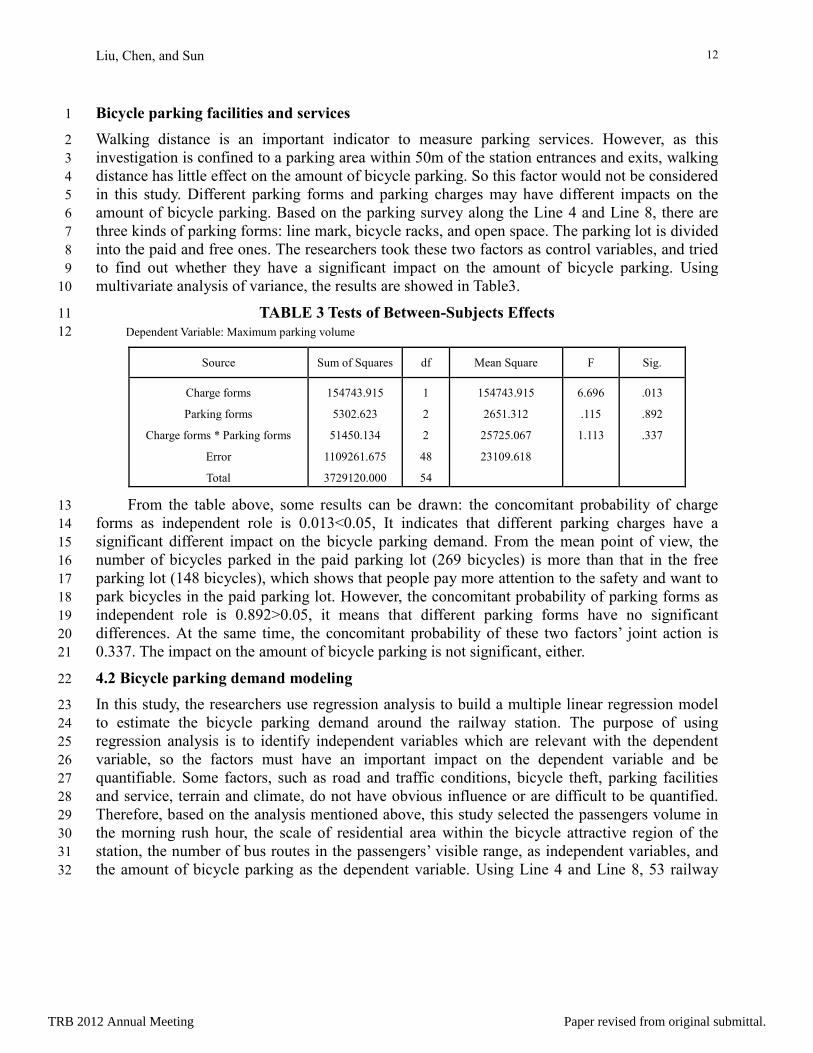
multivariate analysis of variance, the results are showed in Table3. 10
TABLE 3 Tests of Between-Subjects Effects 11
Dependent Variable: Maximum parking volume 12
Source Sum of Squares df Mean Square F Sig.
Charge forms
Parking forms
Charge forms * Parking forms
Error
Total
154743.915
5302.623
51450.134
1109261.675
3729120.000
1
2
2
48
54
154743.915
2651.312
25725.067
23109.618
6.696
.115
1.113
.013
.892
.337
From the table above, some results can be drawn: the concomitant probability of charge 13
forms as independent role is 0.013<0.05, It indicates that different parking charges have a 14
significant different impact on the bicycle parking demand. From the mean point of view, the 15
number of bicycles parked in the paid parking lot (269 bicycles) is more than that in the free 16
parking lot (148 bicycles), which shows that people pay more attention to the safety and want to 17
park bicycles in the paid parking lot. However, the concomitant probability of parking forms as 18
independent role is 0.892>0.05, it means that different parking forms have no significant 19
differences. At the same time, the concomitant probability of these two factors’ joint action is 20
0.337. The impact on the amount of bicycle parking is not significant, either. 21
4.2 Bicycle parking demand modeling 22
In this study, the researchers use regression analysis to build a multiple linear regression model 23
to estimate the bicycle parking demand around the railway station. The purpose of using 24
regression analysis is to identify independent variables which are relevant with the dependent 25
variable, so the factors must have an important impact on the dependent variable and be 26
quantifiable. Some factors, such as road and traffic conditions, bicycle theft, parking facilities 27
and service, terrain and climate, do not have obvious influence or are difficult to be quantified. 28
Therefore, based on the analysis mentioned above, this study selected the passengers volume in 29
the morning rush hour, the scale of residential area within the bicycle attractive region of the 30
station, the number of bus routes in the passengers’ visible range, as independent variables, and 31
the amount of bicycle parking as the dependent variable. Using Line 4 and Line 8, 53 railway 32
TRB 2012 Annual Meeting Paper revised from original submittal.
Liu, Chen, and Sun
13
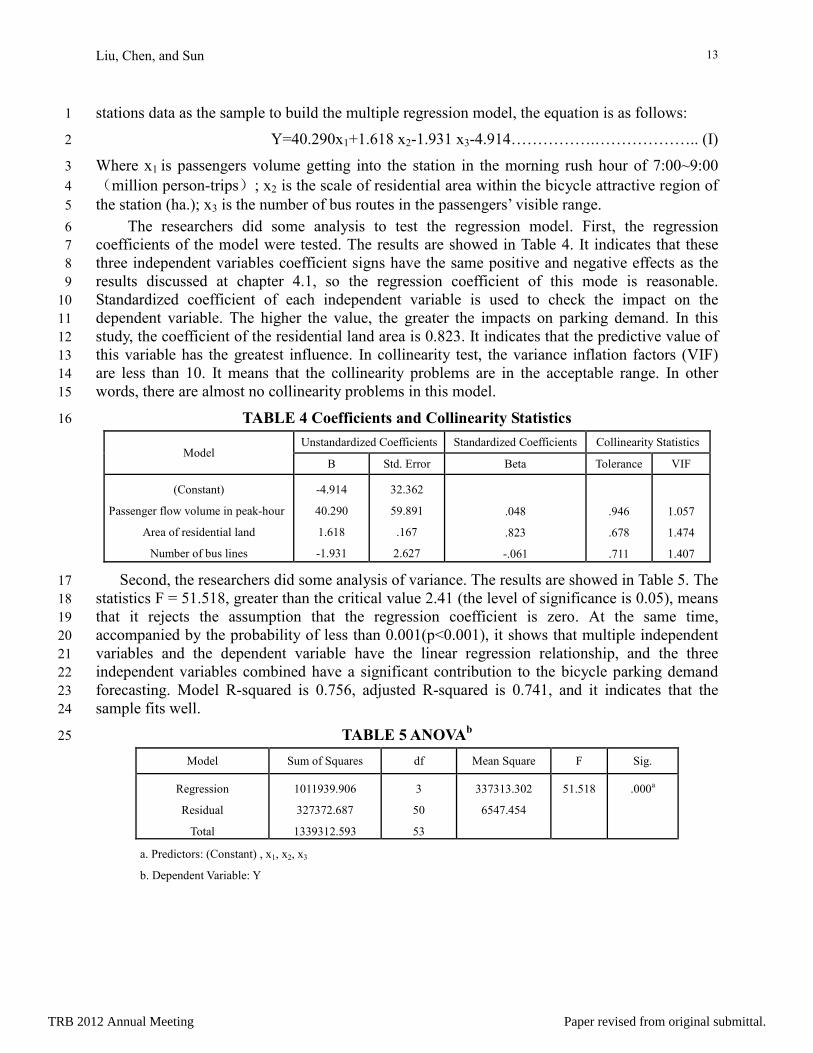
stations data as the sample to build the multiple regression model, the equation is as follows: 1
Y=40.290x1+1.618 x2-1.931 x3-4.914…………….……………….. (I) 2
Where x1 is passengers volume getting into the station in the morning rush hour of 7:00~9:003
(million person-trips); x2 is the scale of residential area within the bicycle attractive region of 4
the station (ha.); x3 is the number of bus routes in the passengers’ visible range. 5
The researchers did some analysis to test the regression model. First, the regression 6
coefficients of the model were tested. The results are showed in Table 4. It indicates that these 7
three independent variables coefficient signs have the same positive and negative effects as the 8
results discussed at chapter 4.1, so the regression coefficient of this mode is reasonable. 9
Standardized coefficient of each independent variable is used to check the impact on the 10
dependent variable. The higher the value, the greater the impacts on parking demand. In this 11
study, the coefficient of the residential land area is 0.823. It indicates that the predictive value of 12
this variable has the greatest influence. In collinearity test, the variance inflation factors (VIF) 13
are less than 10. It means that the collinearity problems are in the acceptable range. In other 14
words, there are almost no collinearity problems in this model. 15
TABLE 4 Coefficients and Collinearity Statistics 16
Model Unstandardized Coefficients Standardized Coefficients Collinearity Statistics
B Std. Error Beta Tolerance VIF
(Constant)
Passenger flow volume in peak-hour
Area of residential land
Number of bus lines
-4.914
40.290
1.618
-1.931
32.362
59.891
.167
2.627
.048
.823
-.061
.946
.678
.711
1.057
1.474
1.407
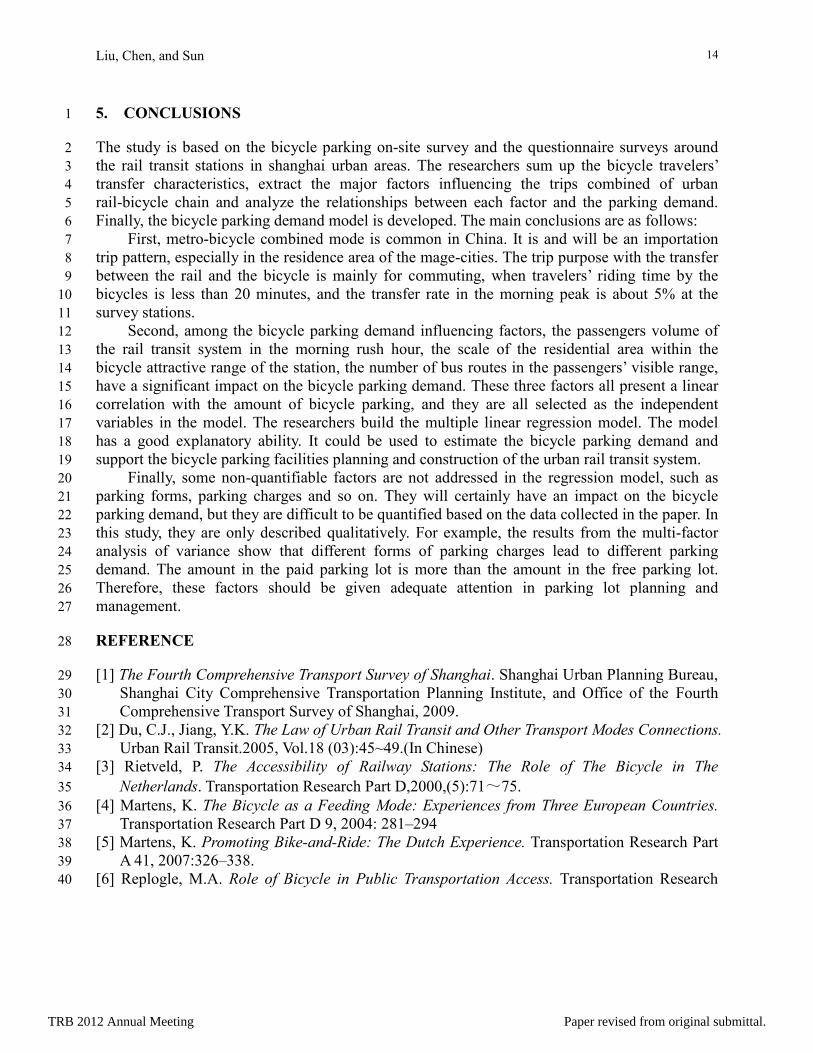
Second, the researchers did some analysis of variance. The results are showed in Table 5. The 17
statistics F = 51.518, greater than the critical value 2.41 (the level of significance is 0.05), means 18
that it rejects the assumption that the regression coefficient is zero. At the same time, 19
accompanied by the probability of less than 0.001(p<0.001), it shows that multiple independent 20
variables and the dependent variable have the linear regression relationship, and the three 21
independent variables combined have a significant contribution to the bicycle parking demand 22
forecasting. Model R-squared is 0.756, adjusted R-squared is 0.741, and it indicates that the 23
sample fits well. 24
TABLE 5 ANOVAb 25
Model Sum of Squares df Mean Square F Sig.
Regression
Residual
Total
1011939.906
327372.687
1339312.593
3
50
53
337313.302
6547.454
51.518
.000a
a. Predictors: (Constant) , x1, x2, x3
b. Dependent Variable: Y
TRB 2012 Annual Meeting Paper revised from original submittal.
Liu, Chen, and Sun
14
5. CONCLUSIONS 1
The study is based on the bicycle parking on-site survey and the questionnaire surveys around 2
the rail transit stations in shanghai urban areas. The researchers sum up the bicycle travelers’ 3
transfer characteristics, extract the major factors influencing the trips combined of urban 4
rail-bicycle chain and analyze the relationships between each factor and the parking demand. 5
Finally, the bicycle parking demand model is developed. The main conclusions are as follows: 6
First, metro-bicycle combined mode is common in China. It is and will be an importation 7
trip pattern, especially in the residence area of the mage-cities. The trip purpose with the transfer 8
between the rail and the bicycle is mainly for commuting, when travelers’ riding time by the 9
bicycles is less than 20 minutes, and the transfer rate in the morning peak is about 5% at the 10
survey stations. 11
Second, among the bicycle parking demand influencing factors, the passengers volume of 12
the rail transit system in the morning rush hour, the scale of the residential area within the 13
bicycle attractive range of the station, the number of bus routes in the passengers’ visible range, 14
have a significant impact on the bicycle parking demand. These three factors all present a linear 15
correlation with the amount of bicycle parking, and they are all selected as the independent 16
variables in the model. The researchers build the multiple linear regression model. The model 17
has a good explanatory ability. It could be used to estimate the bicycle parking demand and 18
support the bicycle parking facilities planning and construction of the urban rail transit system. 19
Finally, some non-quantifiable factors are not addressed in the regression model, such as 20
parking forms, parking charges and so on. They will certainly have an impact on the bicycle 21
parking demand, but they are difficult to be quantified based on the data collected in the paper. In 22
this study, they are only described qualitatively. For example, the results from the multi-factor 23
analysis of variance show that different forms of parking charges lead to different parking 24
demand. The amount in the paid parking lot is more than the amount in the free parking lot. 25
Therefore, these factors should be given adequate attention in parking lot planning and 26
management. 27
REFERENCE 28
[1] The Fourth Comprehensive Transport Survey of Shanghai. Shanghai Urban Planning Bureau, 29
Shanghai City Comprehensive Transportation Planning Institute, and Office of the Fourth 30
Comprehensive Transport Survey of Shanghai, 2009. 31
[2] Du, C.J., Jiang, Y.K. The Law of Urban Rail Transit and Other Transport Modes Connections. 32
Urban Rail Transit.2005, Vol.18 (03):45~49.(In Chinese) 33
[3] Rietveld, P. The Accessibility of Railway Stations: The Role of The Bicycle in The 34
Netherlands. Transportation Research Part D,2000,(5):71~75. 35
[4] Martens, K. The Bicycle as a Feeding Mode: Experiences from Three European Countries. 36
Transportation Research Part D 9, 2004: 281–294 37
[5] Martens, K. Promoting Bike-and-Ride: The Dutch Experience. Transportation Research Part 38
A 41, 2007:326–338. 39
[6] Replogle, M.A. Role of Bicycle in Public Transportation Access. Transportation Research 40
TRB 2012 Annual Meeting Paper revised from original submittal.
Liu, Chen, and Sun
15
Record 959, 55-61 1
[7] Pan, H.X. Intermodal Transfer between Bicycles and Rail Transit in Shanghai, China. In 2
TRB 2010 Annual Meeting CD-ROM, Washington D. C. 2010. 3
[8] Wardman, M., Tight, M., Page, M., Factors influencing the propensity to cycle to work. 4
Transportation Research Part A 41, 2007:339-350. 5
[9] Christpher et al., Forecasting Bicycle and Pedestrian Travel-State of the Practice and 6
Research Needs, Transportation Research Record 1674, 94-101. 7
[10] Taylor, D. and Mahmassani, H. Analysis of stated preferences for intermodal bicycle-transit 8
interfaces, Transportation Research Record 1556, 86-95 9
[11] Kuang, L.J. Study on the Combined Use of Bicycle and Urban Mass Transit. Masters’ Thesis. 10
Shanghai: Tongji University. 2010. (In Chinese) 11
[12] Mi, W.Y. Research on Bicycle-Rail Transfer Systems in Large Cities. Masters’ Thesis. 12
Chengdu: Southwest Jiaotong University, 2007 (In Chinese) 13
[13] Chen, J. Study on Urban Parking Facilities’ Parking Methods. Ph.D. dissertation. Nanjing: 14
Southeast University, 2000 (In Chinese) 15
[14] Pedestrian and Bicycle Development Strategy in Shanghai Central City. Shanghai City 16
Comprehensive Transportation Planning Institute, 2011(In Chinese) 17
TRB 2012 Annual Meeting Paper revised from original submittal.