Embed Size (px)
Citation preview
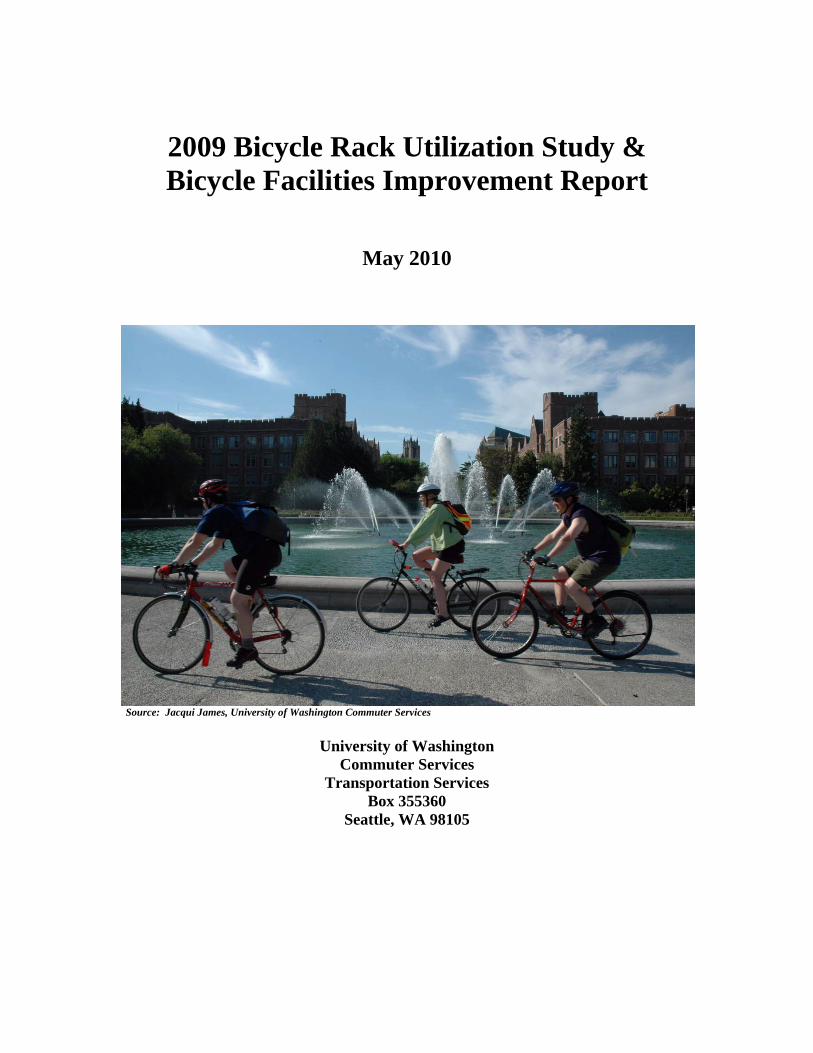
2009 Bicycle Rack Utilization Study & Bicycle Facilities Improvement Report
May 2010
Source: Jacqui James, University of Washington Commuter Services
University of Washington
Commuter Services Transportation Services
Box 355360 Seattle, WA 98105
SUMMARY
This report discusses the University of Washington’s (UW) 2009 Bicycle Rack Utilization
Survey and the bicycle facility improvements implemented in response to the survey’s findings.
On May 21, 2009, the total number of bicycles counted on the UW main campus was 2,398, a
9.9% decrease from the 2,660 bicycles counted in 2008. Approximately 2,889 bicycles were
estimated to be on campus on May 21st. This estimate includes bicycles parked in bicycle rooms,
lockers, offices, and at bicycle racks. Though the number of bicycles decreased from last year,
because the survey changed its assumption about the parking capacity of “ribbon” racks, the
actual bicycle rack utilization rate in 2009 nevertheless increased from 41% in 2008 to 42% in
2009.
Throughout 2009, UW Commuter Services repositioned bicycle racks into high-demand areas,
maintained equilibrium of supply and demand of bicycle racks across campus, and promoted
bicycle transportation through events such as Ride in the Rain and Bike to Work Month. The
relatively low cost of gasoline and decreased trip-making overall compared to summer 2008 are
just some of the factors that likely contributed to the decline in the number of bicycles counted in
the 2009 Utilization Survey.
In May 2009, 28 presumed-to-be abandoned bicycles and accessories were tagged for removal
(not including bicycle rooms in dorms), of which 12 were ultimately impounded. Additionally,
24 bicycles were impounded from dorms throughout campus.
2
TABLE OF CONTENTS SUMMARY ....................................................................................................................... 2 INTRODUCTION............................................................................................................. 4 SURVEY METHODOLOGY .......................................................................................... 4 FINDINGS ......................................................................................................................... 5 EVALUATING ADEQUACY OF BICYCLE RACKS................................................. 6 IMPROVEMENT AREAS ............................................................................................... 7 CAMPUS COVERAGE ................................................................................................. 10 BICYCLE LOCKERS .................................................................................................... 10 CONCLUSION ............................................................................................................... 10 APPENDIX A: University of Washington Main Campus Map Zones ..................... 11
3
INTRODUCTION This report documents the University of Washington (UW) 2009 Bicycle Rack Utilization Survey and the bicycle facility improvements implemented in response to the survey’s findings.
SURVEY METHODOLOGY The survey was completed by UW Commuter Services staff on Thursday, May 21, 2009, between the hours of 11:30 a.m. and 2:30 p.m. Historically, the survey has been conducted on a sunny Wednesday in May with temperatures in the 70’s. Although May 21st was not a Wednesday this year, it was sunny, breezy, and clear with temperatures in the 60’s. Surveyors used campus CAD maps showing known bicycle parking facilities to locate and count the number of bicycles parked at each location, including inside building bicycle rooms. Surveyors also marked locations on CAD maps where bicycles were illegally or inappropriately parked on rails, posts, trees, or other non-rack locations. The survey did not include bicycles parked in lockers, offices, and hallways. Utilization was calculated by dividing the number of bicycles parked at legal racks by the total number of available spaces. In 2009, a portion of campus was missed by the survey team which may have skewed the results slightly. The general areas not included in the Utilization Survey were locations immediately south and east of Drumheller Fountain. In order to provide the best indication of actual bicycle rack utilization on campus, the previous year’s counts for these missed locations were used as proxy numbers in this year’s survey. Staff will be given additional training prior to future surveying efforts to ensure that all campus areas are surveyed.
4
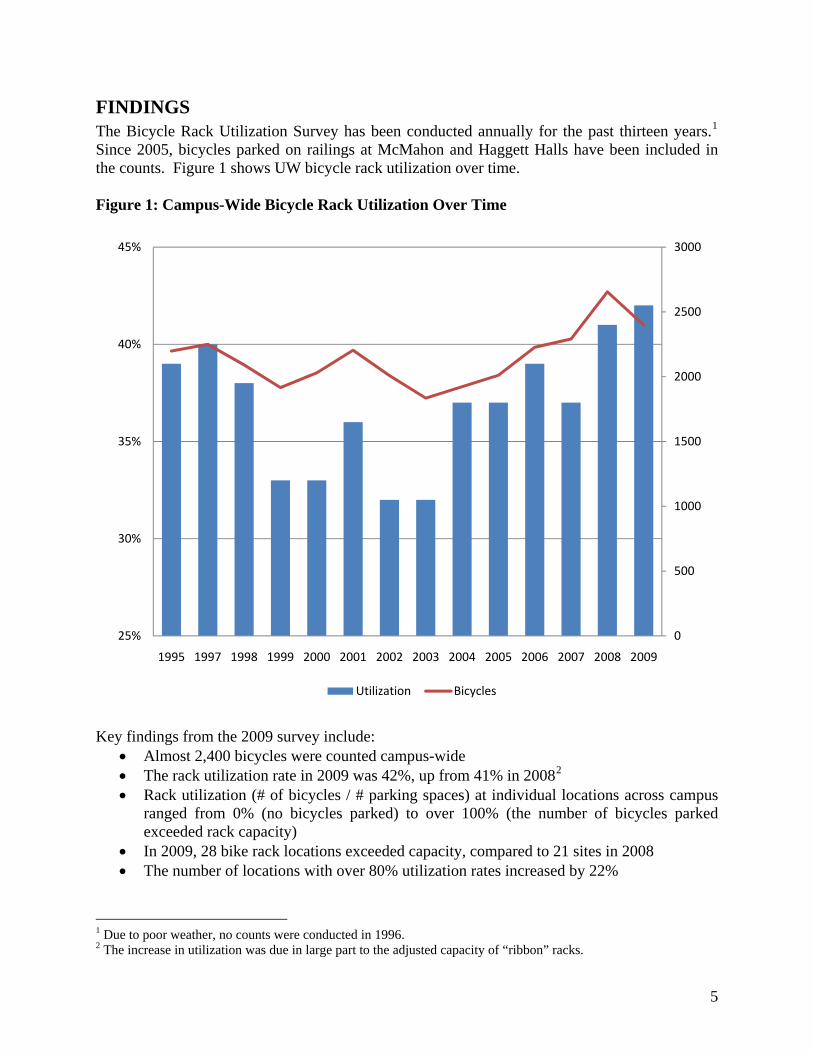
FINDINGS The Bicycle Rack Utilization Survey has been conducted annually for the past thirteen years.1 Since 2005, bicycles parked on railings at McMahon and Haggett Halls have been included in the counts. Figure 1 shows UW bicycle rack utilization over time. Figure 1: Campus-Wide Bicycle Rack Utilization Over Time
Key findings from the 2009 survey include:
0
500
1000
1500
2000
2500
3000
25%
30%
35%
40%
45%
1995 1997 1998 1999 2000 2001 2002 2003 2004 2005 2006 2007 2008 2009
Utilization Bicycles
• Almost 2,400 bicycles were counted campus-wide • The rack utilization rate in 2009 was 42%, up from 41% in 20082 • Rack utilization (# of bicycles / # parking spaces) at individual locations across campus
ranged from 0% (no bicycles parked) to over 100% (the number of bicycles parked exceeded rack capacity)
• In 2009, 28 bike rack locations exceeded capacity, compared to 21 sites in 2008 • The number of locations with over 80% utilization rates increased by 22%
1 Due to poor weather, no counts were conducted in 1996. 2 The increase in utilization was due in large part to the adjusted capacity of “ribbon” racks.
5
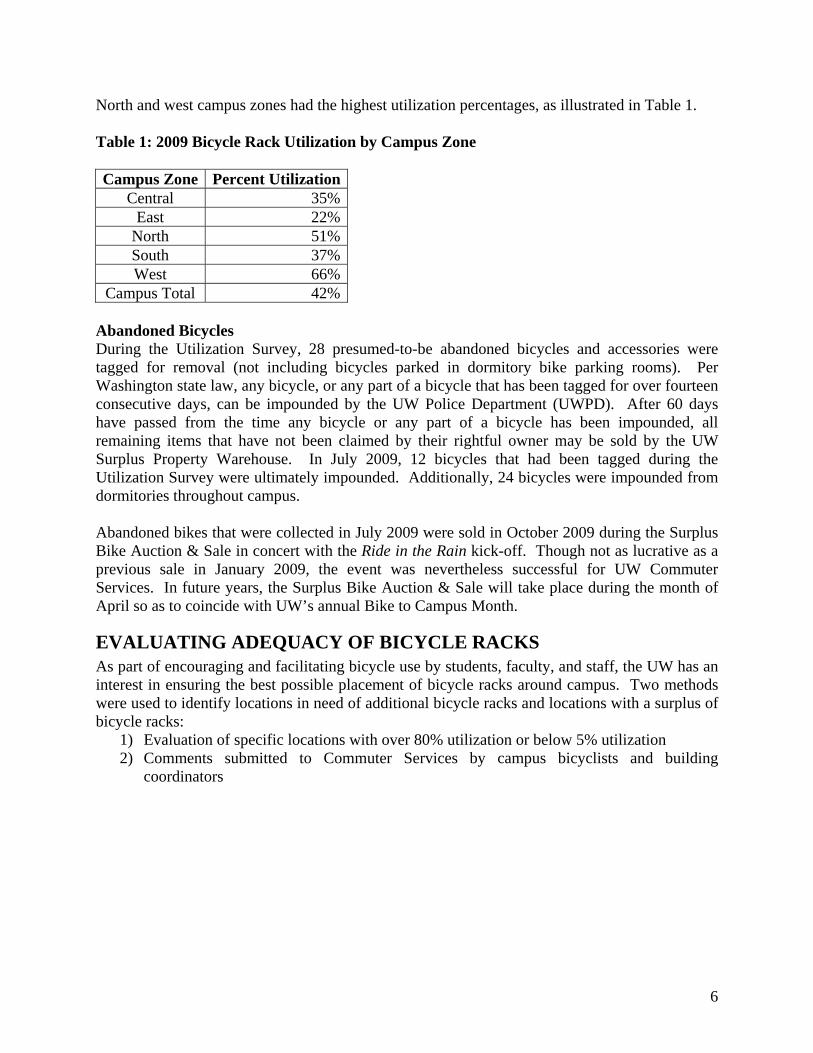
North and west campus zones had the highest utilization percentages, as illustrated in Table 1. Table 1: 2009 Bicycle Rack Utilization by Campus Zone Campus Zone Percent Utilization
Central 35%East 22%
North 51%South 37%West 66%
Campus Total 42% Abandoned Bicycles During the Utilization Survey, 28 presumed-to-be abandoned bicycles and accessories were tagged for removal (not including bicycles parked in dormitory bike parking rooms). Per Washington state law, any bicycle, or any part of a bicycle that has been tagged for over fourteen consecutive days, can be impounded by the UW Police Department (UWPD). After 60 days have passed from the time any bicycle or any part of a bicycle has been impounded, all remaining items that have not been claimed by their rightful owner may be sold by the UW Surplus Property Warehouse. In July 2009, 12 bicycles that had been tagged during the Utilization Survey were ultimately impounded. Additionally, 24 bicycles were impounded from dormitories throughout campus. Abandoned bikes that were collected in July 2009 were sold in October 2009 during the Surplus Bike Auction & Sale in concert with the Ride in the Rain kick-off. Though not as lucrative as a previous sale in January 2009, the event was nevertheless successful for UW Commuter Services. In future years, the Surplus Bike Auction & Sale will take place during the month of April so as to coincide with UW’s annual Bike to Campus Month.
EVALUATING ADEQUACY OF BICYCLE RACKS As part of encouraging and facilitating bicycle use by students, faculty, and staff, the UW has an interest in ensuring the best possible placement of bicycle racks around campus. Two methods were used to identify locations in need of additional bicycle racks and locations with a surplus of bicycle racks:
1) Evaluation of specific locations with over 80% utilization or below 5% utilization 2) Comments submitted to Commuter Services by campus bicyclists and building
coordinators
6
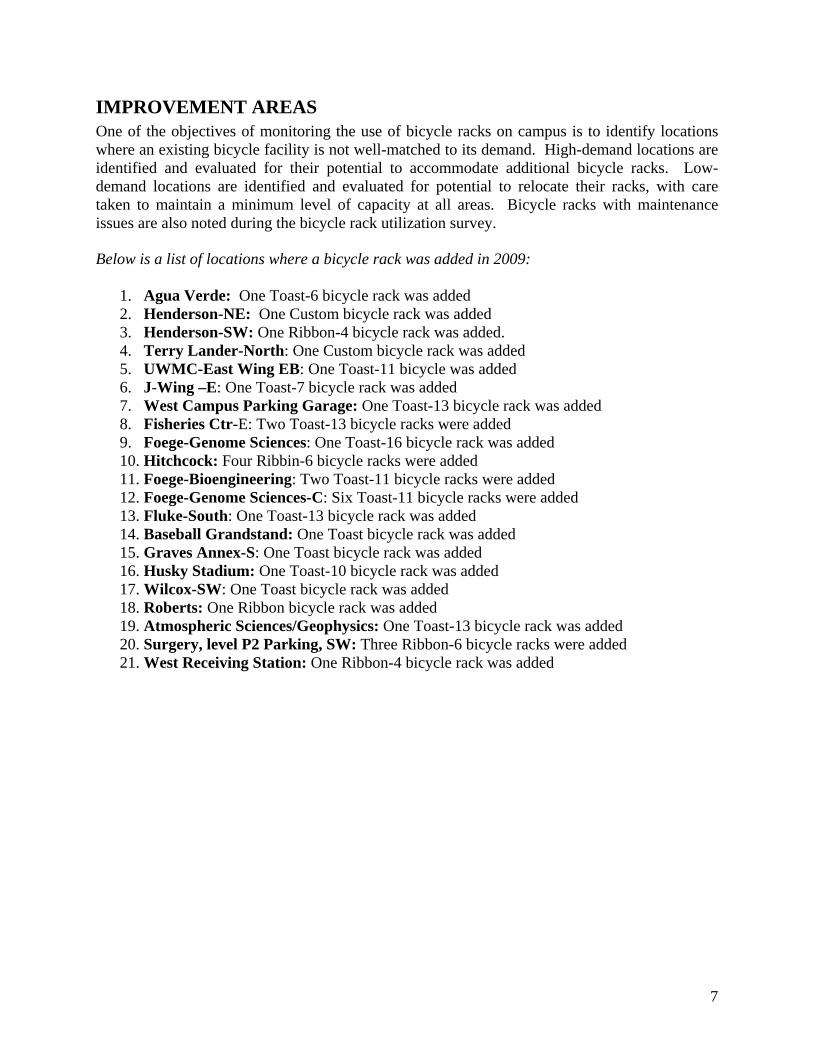
IMPROVEMENT AREAS One of the objectives of monitoring the use of bicycle racks on campus is to identify locations where an existing bicycle facility is not well-matched to its demand. High-demand locations are identified and evaluated for their potential to accommodate additional bicycle racks. Low-demand locations are identified and evaluated for potential to relocate their racks, with care taken to maintain a minimum level of capacity at all areas. Bicycle racks with maintenance issues are also noted during the bicycle rack utilization survey. Below is a list of locations where a bicycle rack was added in 2009:
1. Agua Verde: One Toast-6 bicycle rack was added 2. Henderson-NE: One Custom bicycle rack was added 3. Henderson-SW: One Ribbon-4 bicycle rack was added. 4. Terry Lander-North: One Custom bicycle rack was added 5. UWMC-East Wing EB: One Toast-11 bicycle was added 6. J-Wing –E: One Toast-7 bicycle rack was added 7. West Campus Parking Garage: One Toast-13 bicycle rack was added 8. Fisheries Ctr-E: Two Toast-13 bicycle racks were added 9. Foege-Genome Sciences: One Toast-16 bicycle rack was added 10. Hitchcock: Four Ribbin-6 bicycle racks were added 11. Foege-Bioengineering: Two Toast-11 bicycle racks were added 12. Foege-Genome Sciences-C: Six Toast-11 bicycle racks were added 13. Fluke-South: One Toast-13 bicycle rack was added 14. Baseball Grandstand: One Toast bicycle rack was added 15. Graves Annex-S: One Toast bicycle rack was added 16. Husky Stadium: One Toast-10 bicycle rack was added 17. Wilcox-SW: One Toast bicycle rack was added 18. Roberts: One Ribbon bicycle rack was added 19. Atmospheric Sciences/Geophysics: One Toast-13 bicycle rack was added 20. Surgery, level P2 Parking, SW: Three Ribbon-6 bicycle racks were added 21. West Receiving Station: One Ribbon-4 bicycle rack was added
7
8
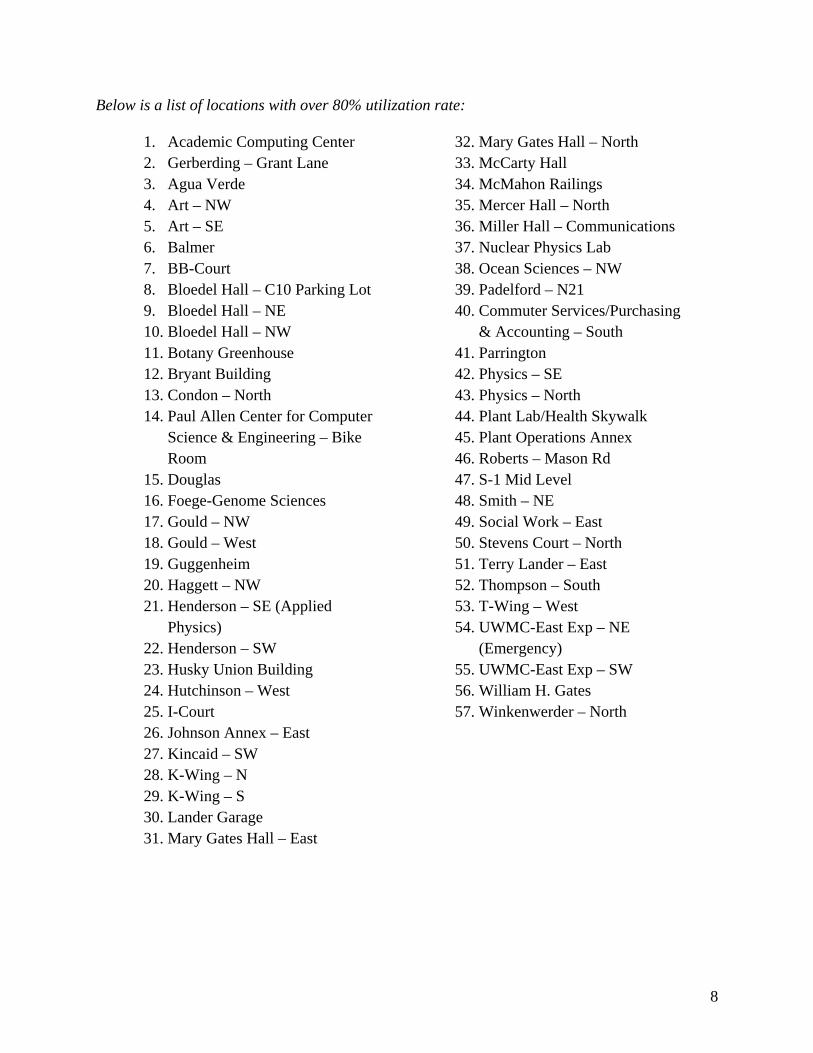
Below is a list of locations with over 80% utilization rate:
1. Academic Computing Center 2. Gerberding – Grant Lane 3. Agua Verde 4. Art – NW 5. Art – SE 6. Balmer 7. BB-Court 8. Bloedel Hall – C10 Parking Lot 9. Bloedel Hall – NE 10. Bloedel Hall – NW 11. Botany Greenhouse 12. Bryant Building 13. Condon – North 14. Paul Allen Center for Computer
Science & Engineering – Bike Room
15. Douglas 16. Foege-Genome Sciences 17. Gould – NW 18. Gould – West 19. Guggenheim 20. Haggett – NW 21. Henderson – SE (Applied
Physics) 22. Henderson – SW 23. Husky Union Building 24. Hutchinson – West 25. I-Court 26. Johnson Annex – East 27. Kincaid – SW 28. K-Wing – N 29. K-Wing – S 30. Lander Garage 31. Mary Gates Hall – East
32. Mary Gates Hall – North 33. McCarty Hall 34. McMahon Railings 35. Mercer Hall – North 36. Miller Hall – Communications 37. Nuclear Physics Lab 38. Ocean Sciences – NW 39. Padelford – N21 40. Commuter Services/Purchasing
& Accounting – South 41. Parrington 42. Physics – SE 43. Physics – North 44. Plant Lab/Health Skywalk 45. Plant Operations Annex 46. Roberts – Mason Rd 47. S-1 Mid Level 48. Smith – NE 49. Social Work – East 50. Stevens Court – North 51. Terry Lander – East 52. Thompson – South 53. T-Wing – West 54. UWMC-East Exp – NE
(Emergency) 55. UWMC-East Exp – SW 56. William H. Gates 57. Winkenwerder – North
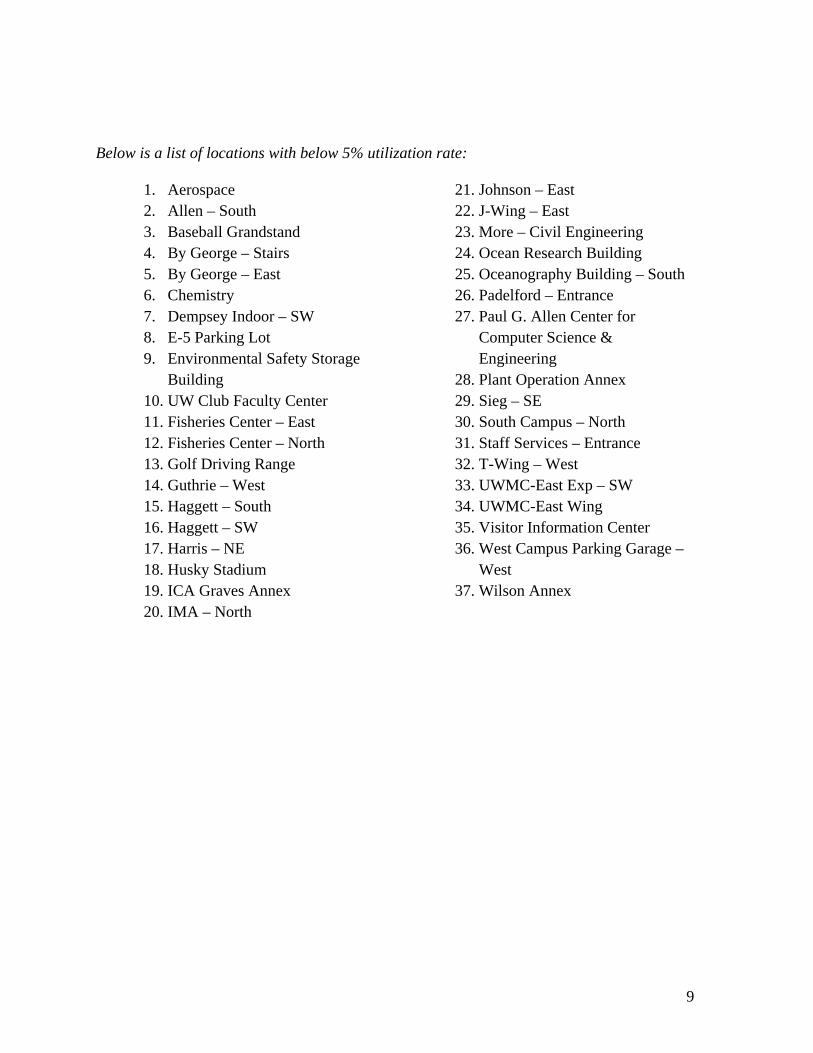
Below is a list of locations with below 5% utilization rate:
1. Aerospace 2. Allen – South 3. Baseball Grandstand 4. By George – Stairs 5. By George – East 6. Chemistry 7. Dempsey Indoor – SW 8. E-5 Parking Lot 9. Environmental Safety Storage
Building 10. UW Club Faculty Center 11. Fisheries Center – East 12. Fisheries Center – North 13. Golf Driving Range 14. Guthrie – West 15. Haggett – South 16. Haggett – SW 17. Harris – NE 18. Husky Stadium 19. ICA Graves Annex 20. IMA – North
21. Johnson – East 22. J-Wing – East 23. More – Civil Engineering 24. Ocean Research Building 25. Oceanography Building – South 26. Padelford – Entrance 27. Paul G. Allen Center for
Computer Science & Engineering
28. Plant Operation Annex 29. Sieg – SE 30. South Campus – North 31. Staff Services – Entrance 32. T-Wing – West 33. UWMC-East Exp – SW 34. UWMC-East Wing 35. Visitor Information Center 36. West Campus Parking Garage –
West 37. Wilson Annex
9
CAMPUS COVERAGE UW Commuter Services’ goal is to provide an adequate amount of bicycle parking across the campus to accommodate all bicycle commuters. The University of Washington’s Seattle campus has over 300 buildings, and each is served in close proximity by at least one bicycle rack. Bicycle racks, lockers, and secure bicycle enclosures are also located in areas such as parking garages, adjacent to the Burke-Gilman trail, and recreational areas.
BICYCLE LOCKERS There is a maximum capacity of 584 bicycle locker rental spaces on campus. When the Utilization Survey was administered it was estimated that 453 bicycle lockers were rented. Because a precise utilization could not be obtained this year due to changes in data administration, this estimate was obtained by subtracting new rentals since May 21st from the total number of rentals as of early June. Based on these numbers, 77.6% of bicycle lockers were leased in 2009. On May 19, 2008, UW Commuter Services sent a bicycle locker utilization e-survey to current bicycle locker tenants. An estimated bicycle locker utilization rate of approximately 71% was deduced based on responses to the question, “Last week, how many days did you ride your bicycle to campus and park in your bicycle locker?” Using the survey results from 2008 and multiplying this percentage by the total number of leased bicycle lockers yields approximately 322 occupied lockers each day.
CONCLUSION The University of Washington continues to promote bicycling to faculty, staff, and students by providing end-of-trip facilities including bicycle racks and lockers. The survey conducted suggests that bicycling continues to be a popular commute choice for members of the UW community; this is reflected in the continued trends of high ridership, rack utilization, and locker rental and occupancy. As a result, UW Commuter Services will continue to meet demand by providing additional bicycle racks, lockers, and other end-of-trip facilities.
10
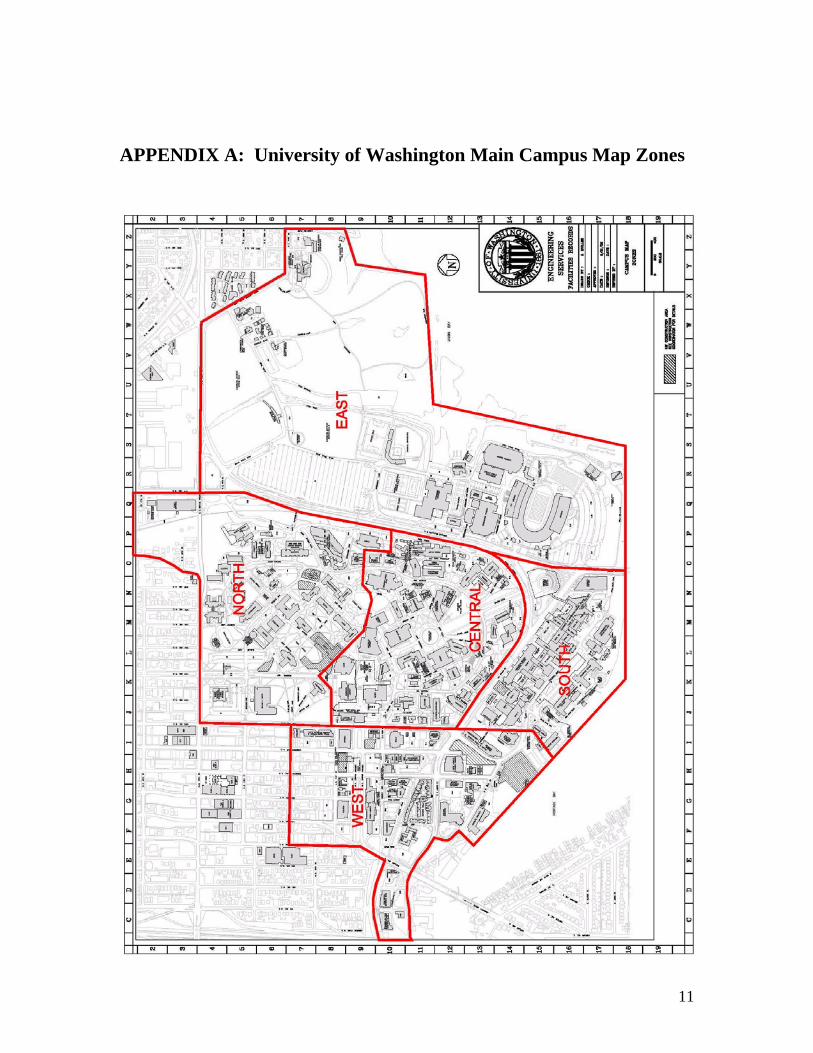
APPENDIX A: University of Washington Main Campus Map Zones
11


![pd-oth.s3.amazonaws.com · e short-term bicycle designaied rack ... landscape plan avenue 2"tree tree plan ... notes soul]" as franciscan 2' tall](https://img.pdfslide.net/doc/110x75/5b23fb497f8b9a5f458b4eb3/pd-oths3-e-short-term-bicycle-designaied-rack-landscape-plan-avenue-2tree.jpg)