Embed Size (px)
Citation preview
Big Data and Artificial Intelligence Analytics in Geosciences:Promises and Potential
Last Call for 2019 Annual Meeting Proposals
Big Data and Artificial Intelligence Analytics Intelligence Analytics in Geosciences:in Geosciences:Promises and Promises and Potential
Last Call for 2019 Annual Meeting Proposals
VOL. 29, NO. 1 | JANUARY 2019
ABSTRACTBig data and machine learning are IT
methodologies that are bringing substan-tial changes in the analysis and interpreta-tion of scientific data. By adding GPU processing resources to the typical equip-ment of a server host, it is possible to speed up queries performed on large data-bases and reduce training time for deep learning architectures.
A recent pairing of the big data technolo-gies, applied to old and new data, and arti-ficial intelligence techniques has enabled a team of scientists to create an interactive virtual globe that shows a color mosaic of the seabed geology. This interactive model allows us to obtain robust reconstructions and predictions of climate changes and their impacts on the ocean environment. We suggest a possible evolution of such a model by means of the expansion of functionalities and performance improve-ments. We refer respectively to the imple-mentation of isochronic layers of seabed lithologies and the addition of GPU resources to speed up the learning phase of the support vector machine (SVM) model. These additional features would allow us to establish broader correlations and extract additional information on large-scale geological phenomena.
INTRODUCTIONThe Earth system generates continuous
data, and our acquisition capacity has significantly increased over time. The growing availability of acquired geological data and the methods developed in the field of information technology make it possible to identify associations and understand patterns and trends within data (Big Data), solve difficult decision problems (artificial intelligence), and provide acceleration to data processing (GPU computing).
Big Data is a term that indicates very large databases (often by order of zettabytes, i.e., billions of terabytes) that
can contain huge amounts of hetero-geneous, structured and unstructured data (text, numerical values, images, e-mail, GPS data, and data acquired from social networks), which can be extrapolated, analyzed, and correlated with each other.
Artificial Intelligence (AI) is a branch of computer science that studies the way in which the combination of hardware and software systems can simulate typical behaviors of the human brain. One of the most important applications consists of a complex algorithm, called machine learning, which is able to learn and make decisions.
GPU Parallel Computing (GPGPU) involves the processing of data by the pro-cessors present in the graphics card (GPU) and has allowed the computation, in rela-tively short times, of huge amounts of data with an efficiency of at least two orders of magnitude greater compared to the past.
There are several cases in which these technologies have been applied both in the field of potential earthquakes (Rouet-Leduc et al., 2017), volcanic eruptions (Ham et al., 2012), and to solve the prob-lems of spatial modeling in the field of the assessment of landslide susceptibility (Korup and Stolle, 2014).
The following describes a mixed approach (AI and Big Data) in the field of geosciences—analyzing potentials and possible future developments.
CASE STUDY: BIG DATA AND AI MAP WORLD’S OCEAN FLOOR
An example of an application combining Big Data and machine learning technolo-gies was implemented by a team of Australian scientists who created the first digital map of seabed lithologies (Dutkiewicz et al., 2015) through the analy-sis and cataloging of ~15,000 samples of sediments found in marine basins. Before such a map, the most recent map of oceanic lithologies was hand drawn ~40 years ago,
at the beginning of ocean exploration. Since then, the map has undergone few changes, with at most six types of sediment dominant in the ocean basins.
The digital map was created using an AI method consisting of the support vector machine (SVM) model. Through a cross-validation approach, the classifier was trained by adding new data gradually so as to allow its learning. Learning the param-eter values, which optimize the classifier’s performance on withheld data, is an impor-tant step in the workflow. In this way, the vast set of point data has been transformed into a continuous digital map with very high accuracy (up to 80%).
The new lithological map of the seabed is very important for the interpretation of global phenomena related to the evolution of ocean basins. An example of this is dia-toms, siliceous phytoplankton that live in the oceans and that through chlorophyll photosynthesis produce about one-quarter of the oxygen present in the atmosphere, contributing to reduce global terrestrial warming. At their death, these organisms precipitate through the water column, accumulating on the underlying sea floor. Satellite surveys over the years have identi-fied places where diatomaceous activity is more productive; that is, the marine areas in which there are the maximum concentra-tions of chlorophyll, considering that they should also correspond to the areas of max-imum accumulation of these organisms in the sea floor. Surprisingly, the digital map of the seabed has revealed that there is a decoupling between the productivity of diatoms and the corresponding accumula-tion areas in the sea floor. The possibility of diatom ooze formation is however favored by the low surface temperature (0.9–5.7 °C), by salinity (33.8–34 PSS), and by the high concentration of nutrients, and therefore can represent an important indicator of the oceanographic variables of the surface of the sea (Cunningham and
Big Data and Artificial Intelligence Analytics in Geosciences: Promises and Potential
Roberto Spina, Geologist and DCompSci, CNG (National Council of Geologists), Rome, Italy, [email protected]
GSA Today, https://www.doi.org/10.1130/GSATG372GW.1. Copyright 2019, The Geological Society of America. CC-BY-NC.
Leventer, 1998). For this reason, the map will help scientists better understand how our oceans have responded and will respond to environmental changes.
POTENTIAL AND FUTURE PROSPECTS
Big Data and AI are having an impact on every commercial and scientific domain, and their application in the field of geosciences is making a great impact in the analysis and understanding of natural phenomena.
The intensive use of CPUs required by these two technologies has stimulated the search for alternative solutions to improve performance by using a mixed CPU-GPU approach. In this way it is possible to obtain rapid results from huge databases and the acceleration of the learning process for neural networks. These techniques are the basis of deep learning, an alternative model of machine learning, which achieves a very high degree of accuracy in recognizing objects and is able to learn features auto-matically from data without the need to extract them manually.
The joint application of Big Data–machine learning, described as a case study, allowed researchers to demonstrate the absence of correlation between diatom productivity and the corresponding diatom oozes: The accumulation of these organ-isms in the seabed seems rather to be linked to specific variations in sea-surface parameters. This is one of many cases where the integrated analysis of various parameters allows a different interpretation from what could be assumed by their disjoint analysis.
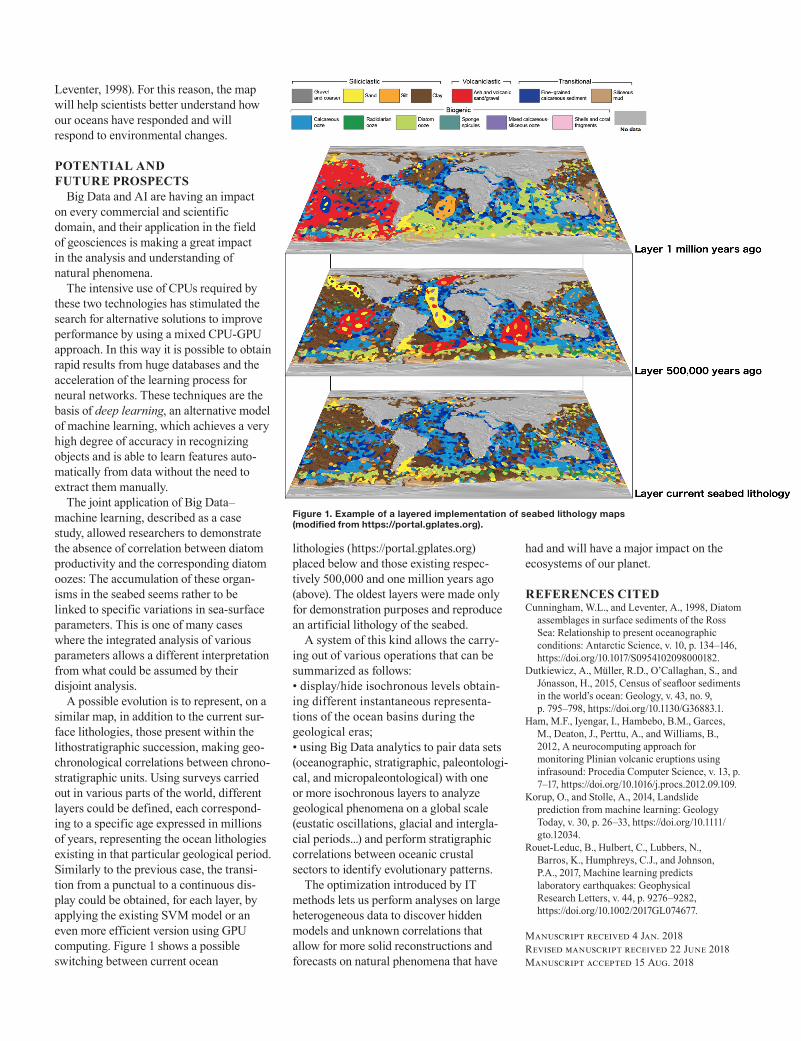
A possible evolution is to represent, on a similar map, in addition to the current sur-face lithologies, those present within the lithostratigraphic succession, making geo-chronological correlations between chrono-stratigraphic units. Using surveys carried out in various parts of the world, different layers could be defined, each correspond-ing to a specific age expressed in millions of years, representing the ocean lithologies existing in that particular geological period. Similarly to the previous case, the transi-tion from a punctual to a continuous dis-play could be obtained, for each layer, by applying the existing SVM model or an even more efficient version using GPU computing. Figure 1 shows a possible switching between current ocean
Figure 1. Example of a layered implementation of seabed lithology maps (modified from https://portal.gplates.org).
lithologies (https://portal.gplates.org) placed below and those existing respec-tively 500,000 and one million years ago (above). The oldest layers were made only for demonstration purposes and reproduce an artificial lithology of the seabed.
A system of this kind allows the carry-ing out of various operations that can be summarized as follows:• display/hide isochronous levels obtain-ing different instantaneous representa-tions of the ocean basins during the geological eras;• using Big Data analytics to pair data sets (oceanographic, stratigraphic, paleontologi-cal, and micropaleontological) with one or more isochronous layers to analyze geological phenomena on a global scale (eustatic oscillations, glacial and intergla-cial periods...) and perform stratigraphic correlations between oceanic crustal sectors to identify evolutionary patterns.
The optimization introduced by IT methods lets us perform analyses on large heterogeneous data to discover hidden models and unknown correlations that allow for more solid reconstructions and forecasts on natural phenomena that have
had and will have a major impact on the ecosystems of our planet.
REFERENCES CITEDCunningham, W.L., and Leventer, A., 1998, Diatom
assemblages in surface sediments of the Ross Sea: Relationship to present oceanographic conditions: Antarctic Science, v. 10, p. 134–146, https://doi.org/10.1017/S0954102098000182.
Dutkiewicz, A., Müller, R.D., O’Callaghan, S., and Jónasson, H., 2015, Census of seafloor sediments in the world’s ocean: Geology, v. 43, no. 9, p. 795–798, https://doi.org/10.1130/G36883.1.
Ham, M.F., Iyengar, I., Hambebo, B.M., Garces, M., Deaton, J., Perttu, A., and Williams, B., 2012, A neurocomputing approach for monitoring Plinian volcanic eruptions using infrasound: Procedia Computer Science, v. 13, p. 7–17, https://doi.org/10.1016/j.procs.2012.09.109.
Korup, O., and Stolle, A., 2014, Landslide prediction from machine learning: Geology Today, v. 30, p. 26–33, https://doi.org/10.1111/gto.12034.
Rouet-Leduc, B., Hulbert, C., Lubbers, N., Barros, K., Humphreys, C.J., and Johnson, P.A., 2017, Machine learning predicts laboratory earthquakes: Geophysical Research Letters, v. 44, p. 9276–9282, https://doi.org/10.1002/2017GL074677.
Manuscript received 4 Jan. 2018 Revised manuscript received 22 June 2018 Manuscript accepted 15 Aug. 2018