Embed Size (px)
DESCRIPTION
This article is a review of the current bilayer technologies.
Citation preview
International Journal of Pharmaceutics 477 (2014) 306–316
Theoretical investigations into the influence of the position of abreaking line on the tensile failure of flat, round, bevel-edged tabletsusing finite element methodology (FEM) and its practical relevance forindustrial tablet strength testing
Fridrun Podczeck *, J. Michael Newton, Paul FrommeUniversity College London, Department of Mechanical Engineering, Torrington Place, London WC1E 7JE, UK
A R T I C L E I N F O
Article history:Received 8 September 2014Accepted 13 October 2014Available online 22 October 2014
Keywords:Bevel-edgeBrazilian equationBreaking lineDiametral compression testFinite element method (FEM)Tablet tensile failure
A B S T R A C T
Flat, round tablets may have a breaking (“score”) line. Pharmacopoeial tablet breaking load tests arediametral in their design, and industrially used breaking load testers often have automatic tablet feedingsystems, which position the tablets between the loading platens of the machine with the breaking lines inrandom orientation to the applied load. The aim of this work was to ascertain the influence of the positionof the breaking line in a diametral compression test using finite element methodology (FEM) and tocompare the theoretical results with practical findings using commercially produced bevel-edged, scoredtablets. Breaking line test positions at an angle of 0�, 22.5�, 45�, 67.5� and 90� relative to the loading planewere studied. FEM results obtained for fully elastic and elasto-plastic tablets were fairly similar, but theyhighlighted large differences in stress distributions depending on the position of the breaking line. Thestress values at failure were predicted to be similar for tablets tested at an angle of 45� or above, whereasat lower test angles the predicted breaking loads were up to three times larger. The stress distributionssuggested that not all breaking line angles would result in clean tensile failure. Practical results, however,did not confirm the differences in the predicted breaking loads, but they confirmed differences in the waytablets broke. The results suggest that it is not advisable to convert breaking loads obtained on scoredtablets into tablet tensile strength values, and comparisons between different tablets or batches shouldcarefully consider the orientation of the breaking line with respect to the loading plane, as the failuremechanisms appear to vary.
ã 2014 Elsevier B.V. All rights reserved.
Contents lists available at ScienceDirect
International Journal of Pharmaceutics
journa l home page : www.e l sev ier .com/ loca te / i jpharm
1. Introduction
Flat, round tablets usually have bevel-edges to reduce chippingof the tablet edges during packaging, transport and handling, andvery often they carry a breaking (“score”) line. The provision of abreaking line is an attempt to reduce the number of tablet dosingstrengths required to cover a range of dosing options for a drug. Atthe same time, breaking lines might help patients who haveswallowing difficulties and provide some flexibility in the amountof drug taken in a single dose (Van Santen et al., 2002). However, asnoted in the USP monograph on testing tablet breaking forces(Method 1217, USP38/NF33, 2014) the presence of a breaking linemight influence the breaking forces recorded, and they hence
* Corresponding author. Tel.: +44 20 7679 7178; fax: +44 20 7388 0180.E-mail addresses: [email protected], [email protected]
(F. Podczeck).
http://dx.doi.org/10.1016/j.ijpharm.2014.10.0280378-5173/ã 2014 Elsevier B.V. All rights reserved.
advise that during the standard diametral compression test theorientation of the breaking line should be kept constant, eitherhorizontally or vertically. However, in line with fracture mechanicsknowledge Newton et al. (1977) recommended that the breakingline should be positioned perpendicular to the platen surfaces i.e.be parallel to the direction of loading to increase the chance oftensile failure to occur along the breaking line. As an alternative tothe diametral compression test, Sovány et al. (2010) used athree-point bending test, whereby the breaking line waspositioned below the upper, slightly blunted loading edge,presumably facing downward (this is not clearly specified in theirpaper). The advantage of a three-point bending test over thediametral compression test is that the bending moment increaseslinearly from zero at either support of the tablet to a maximumvalue at the mid-span location, and assuming linear elasticbehaviour, shear effects will not affect the maximum tensilestress developing at the lower tablet surface (Stanley, 2001). Mazelet al. (2014) also suggested that for pharmaceutical compacts the
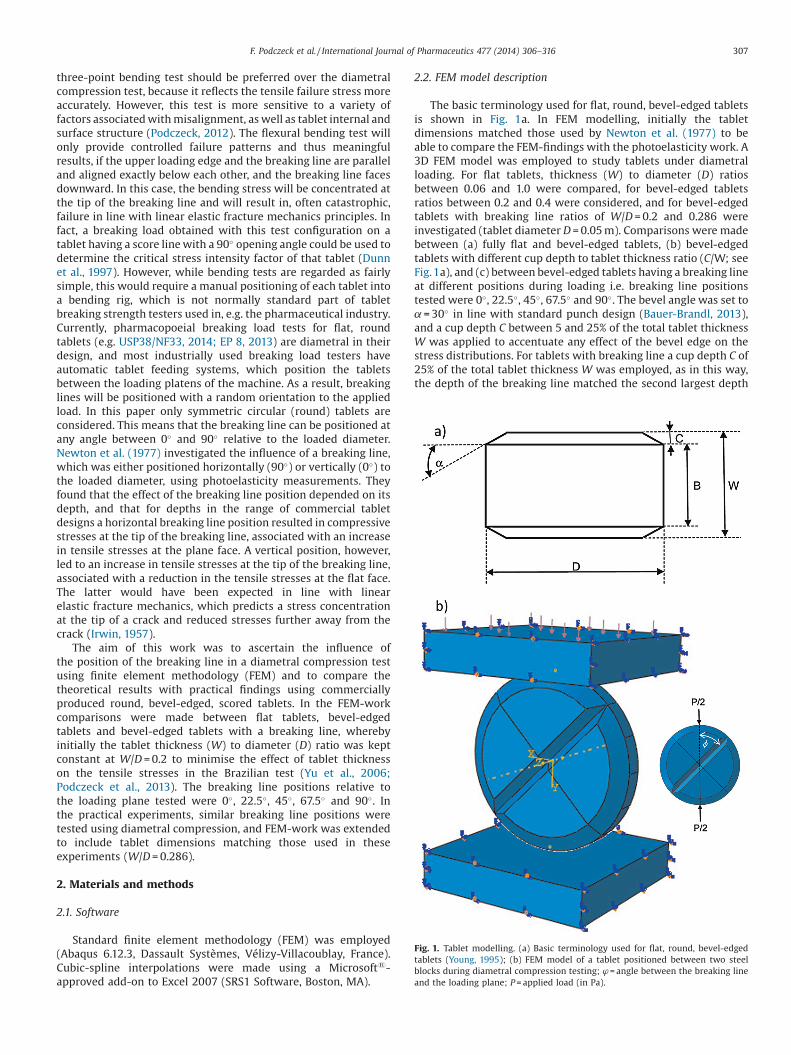
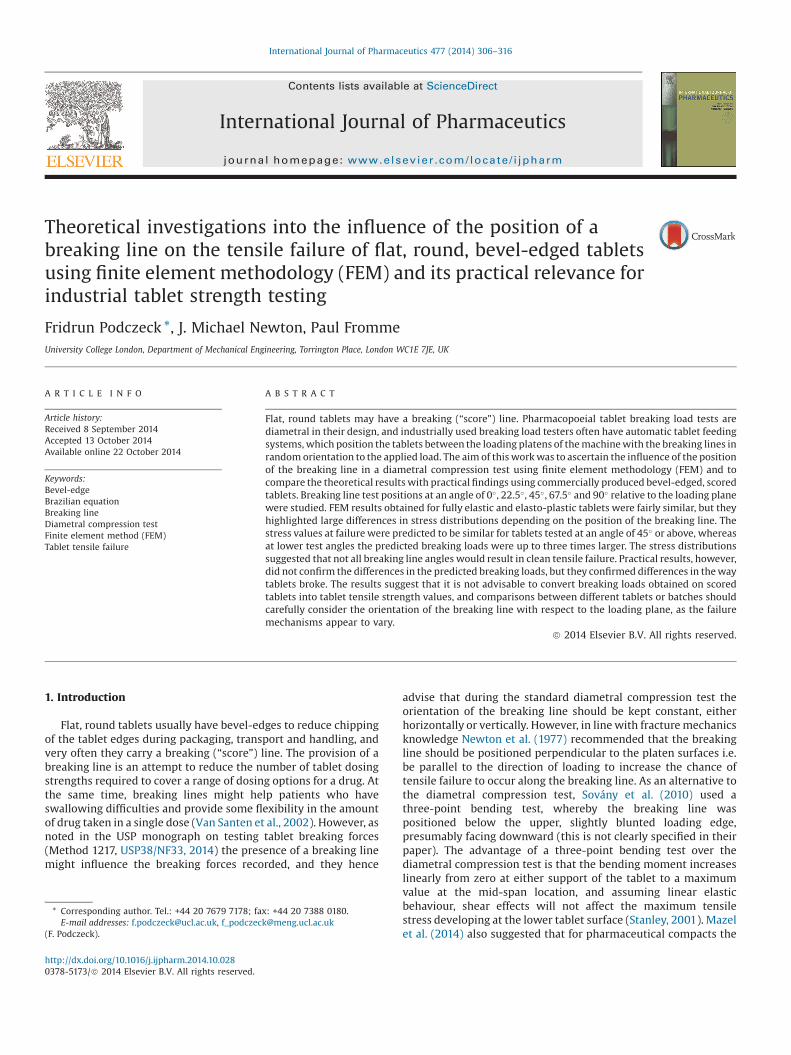
Fig. 1. Tablet modelling. (a) Basic terminology used for flat, round, bevel-edgedtablets (Young, 1995); (b) FEM model of a tablet positioned between two steelblocks during diametral compression testing; ’ = angle between the breaking lineand the loading plane; P = applied load (in Pa).
F. Podczeck et al. / International Journal of Pharmaceutics 477 (2014) 306–316 307
three-point bending test should be preferred over the diametralcompression test, because it reflects the tensile failure stress moreaccurately. However, this test is more sensitive to a variety offactors associated with misalignment, as well as tablet internal andsurface structure (Podczeck, 2012). The flexural bending test willonly provide controlled failure patterns and thus meaningfulresults, if the upper loading edge and the breaking line are paralleland aligned exactly below each other, and the breaking line facesdownward. In this case, the bending stress will be concentrated atthe tip of the breaking line and will result in, often catastrophic,failure in line with linear elastic fracture mechanics principles. Infact, a breaking load obtained with this test configuration on atablet having a score line with a 90� opening angle could be used todetermine the critical stress intensity factor of that tablet (Dunnet al., 1997). However, while bending tests are regarded as fairlysimple, this would require a manual positioning of each tablet intoa bending rig, which is not normally standard part of tabletbreaking strength testers used in, e.g. the pharmaceutical industry.Currently, pharmacopoeial breaking load tests for flat, roundtablets (e.g. USP38/NF33, 2014; EP 8, 2013) are diametral in theirdesign, and most industrially used breaking load testers haveautomatic tablet feeding systems, which position the tabletsbetween the loading platens of the machine. As a result, breakinglines will be positioned with a random orientation to the appliedload. In this paper only symmetric circular (round) tablets areconsidered. This means that the breaking line can be positioned atany angle between 0� and 90� relative to the loaded diameter.Newton et al. (1977) investigated the influence of a breaking line,which was either positioned horizontally (90�) or vertically (0�) tothe loaded diameter, using photoelasticity measurements. Theyfound that the effect of the breaking line position depended on itsdepth, and that for depths in the range of commercial tabletdesigns a horizontal breaking line position resulted in compressivestresses at the tip of the breaking line, associated with an increasein tensile stresses at the plane face. A vertical position, however,led to an increase in tensile stresses at the tip of the breaking line,associated with a reduction in the tensile stresses at the flat face.The latter would have been expected in line with linearelastic fracture mechanics, which predicts a stress concentrationat the tip of a crack and reduced stresses further away from thecrack (Irwin, 1957).
The aim of this work was to ascertain the influence ofthe position of the breaking line in a diametral compression testusing finite element methodology (FEM) and to compare thetheoretical results with practical findings using commerciallyproduced round, bevel-edged, scored tablets. In the FEM-workcomparisons were made between flat tablets, bevel-edgedtablets and bevel-edged tablets with a breaking line, wherebyinitially the tablet thickness (W) to diameter (D) ratio was keptconstant at W/D = 0.2 to minimise the effect of tablet thicknesson the tensile stresses in the Brazilian test (Yu et al., 2006;Podczeck et al., 2013). The breaking line positions relative tothe loading plane tested were 0�, 22.5�, 45�, 67.5� and 90�. Inthe practical experiments, similar breaking line positions weretested using diametral compression, and FEM-work was extendedto include tablet dimensions matching those used in theseexperiments (W/D = 0.286).
2. Materials and methods
2.1. Software
Standard finite element methodology (FEM) was employed(Abaqus 6.12.3, Dassault Systèmes, Vélizy-Villacoublay, France).Cubic-spline interpolations were made using a Microsoft1-approved add-on to Excel 2007 (SRS1 Software, Boston, MA).
2.2. FEM model description
The basic terminology used for flat, round, bevel-edged tabletsis shown in Fig. 1a. In FEM modelling, initially the tabletdimensions matched those used by Newton et al. (1977) to beable to compare the FEM-findings with the photoelasticity work. A3D FEM model was employed to study tablets under diametralloading. For flat tablets, thickness (W) to diameter (D) ratiosbetween 0.06 and 1.0 were compared, for bevel-edged tabletsratios between 0.2 and 0.4 were considered, and for bevel-edgedtablets with breaking line ratios of W/D = 0.2 and 0.286 wereinvestigated (tablet diameter D = 0.05 m). Comparisons were madebetween (a) fully flat and bevel-edged tablets, (b) bevel-edgedtablets with different cup depth to tablet thickness ratio (C/W; seeFig.1a), and (c) between bevel-edged tablets having a breaking lineat different positions during loading i.e. breaking line positionstested were 0�, 22.5�, 45�, 67.5� and 90�. The bevel angle was set toa = 30� in line with standard punch design (Bauer-Brandl, 2013),and a cup depth C between 5 and 25% of the total tablet thicknessW was applied to accentuate any effect of the bevel edge on thestress distributions. For tablets with breaking line a cup depth C of25% of the total tablet thickness W was employed, as in this way,the depth of the breaking line matched the second largest depth
308 F. Podczeck et al. / International Journal of Pharmaceutics 477 (2014) 306–316
tested in the photoelasticity models (Newton et al., 1977) andtherefore allowed direct comparison of the influence of thebreaking line on the stress distributions, although Newton et al.(1977) used plane-faced rather than bevel-edged tablets. Onlysingle breaking lines with an opening angle of 90� and a depthmatching the bevel were investigated.
Since the position of the breaking line results in unsymmetricaltest configurations, complete tablets were modelled, positionedbetween two stainless steel blocks (l = w = 0.05 m, h = 0.01 m),similar to standard tablet breaking load testers (Fig. 1b). Boundaryconditions were applied to the steel blocks to avoid tilting, slipping,sliding or twisting and only to permit movements parallel withthe loading plane. To hold the tablets in place and to avoid largelocalised penetrations of the tablets, a surface-to-surface discre-tization approach was used and a friction coefficient between steelblocks and tablet surface of m = 0.1 was assumed. Surfacesmoothing was applied to the circumferential tablet surface toavoid the need of matching nodes across the contact interface andan iterative solver algorithm was chosen. 3D-quadratic tetrahedralelements were used for the meshing. The mesh density to achieve astable and accurate solution was optimised using a convergencetest as described earlier (Podczeck et al., 2013). The mesh density ofthe blocks (s = 0.002) was kept slightly below that of the tablets(s = 0.0011) to ensure convergence.
The stainless steel blocks were modelled from engineering steelwith a Young’s modulus of 209 GPa and a Poisson’s ratio of 0.3. Theload P was transmitted through both blocks (i.e. P/2 per block) toprevent unsymmetrical loading and distortions. As in previouswork (Podczeck et al., 2013) and as used by others (Pitt et al., 1989)the load P was calculated as 100 N mm�1 of total tablet thickness tomaintain a standard load intensity. For the tablets only one linearelastic model with the properties of Araldite CT200, hardened with30% w/w Hardener 901, for which Young’s modulus of elasticity(2.58 GPa) and Poisson’s ratio (0.35) were taken from the literature(Burger, 1969), was studied. This model was chosen to enable adirect comparison with the photoelasticity results reported byNewton et al. (1977). The theory of elasticity (Timoshenko andGoodier, 1987) predicts that relative stress distributions are
Fig. 2. x-axial tensile stresses observed in
independent of Young’s modulus and Poisson’s ratio, and thatthis holds in FEM studies has previously been confirmed (Pitt andHeasley, 2013; Podczeck et al., 2013). There is therefore no need torepeat the analyses with other elasticity data. An elasto-plasticmodel with similar Young’s modulus and Poisson’s ratio as aboveplus a yield strength of 25.8 MPa at a plastic strain of 0.01 was alsotested to reflect maximum underestimation of the failure stress(Procopio et al., 2003). To ensure convergence, in the elasto-plasticmodels the initial step time and step increment size were slightlyreduced.
2.3. Practical work
Bevel-edged, scored tablets were purchased to be able to reflectthe larger variability of tablet breaking loads of commerciallyproduced compacts during testing: (1) Superdrug Diarrhoea ReliefTablets1 (SDRT), Surepharm Services Ltd., Burton-Upon-Trent, UK,batches 4A058 and 3J114; (2) Aspirin 300 mg Dispersible T mgdispersible tablets1 (ADT), Boots Company PLC, Nottingham, UK,batch 140032.
The main ingredients of the SDRT tablets are 400 mg lightkaolin and 75 mg calcium carbonate. The remaining excipients areicing sugar, maize starch, magnesium stearate, erythrosine,clove-, cinnamon- and nutmeg oil. The estimated powder particledensity of the mixture is 2150 kg m�3. The ADT tablets contain300 mg of acetylsalicylic acid, plus lactose, sodium saccharin, maizestarch, citric acid, sodium lauryl sulphate, talc and calcium carbonateasexcipients.Theestimatedpowderparticledensityof themixture is1400 kg m�3.
The breaking load of the tablets was determined using aCT6 tablet strength tester (Engineering Systems, Nottingham, UK),equipped with a 50 kg load cell, at a test speed of 1 mm min�1. Thebreaking load was recorded with an accuracy of �0.005 kg. Thetester was linked to a laptop (Dell Latitude D505, Dell UK,Bracknell, Berkshire) via a USB cable. Machine inherentplotter software (Graph Plotter1, V2.09; Engineering Systems,Nottingham, UK) was installed and used to control the testerremotely from the computer. Force versus displacement curves
flat elastic discs using FEM-modelling.
F. Podczeck et al. / International Journal of Pharmaceutics 477 (2014) 306–316 309
were recorded for each tablet using a recording frequency of1000 Hz. They were exported into Windows Excel 2007(Microsoft1) and further processed to obtain the slope of thelinear portion of the force–displacement curves.
Tablets were weighed to �0.001 g (Sartorius BP 121S, Göttingen,Germany) and their dimensions were measured to �0.001 mm(Moore and Wright MED961D Digital Micrometre, Neill Tools Ltd.,Sheffield, UK). A protractor was used to mark the exact test positionsfor the tablets to be placed between the loading platens of the CT6.
To determine the exact cup depth and width of the breakingline, photographs (Olympus SP-500UZ, Olympus Imaging Corp.,Hamburg, Germany) of the tablets were taken with a magnificationof 50� (diameter view) and 100� (thickness view) against agraticule (Graticule Ltd., Tonbridge, UK).
2.4. Statistical analysis
Analysis of variance (ANOVA) was performed using SPSS 20.0(SPSS-IBM, Woking, UK). The post-hoc Scheffé test (Scheffé, 1959;
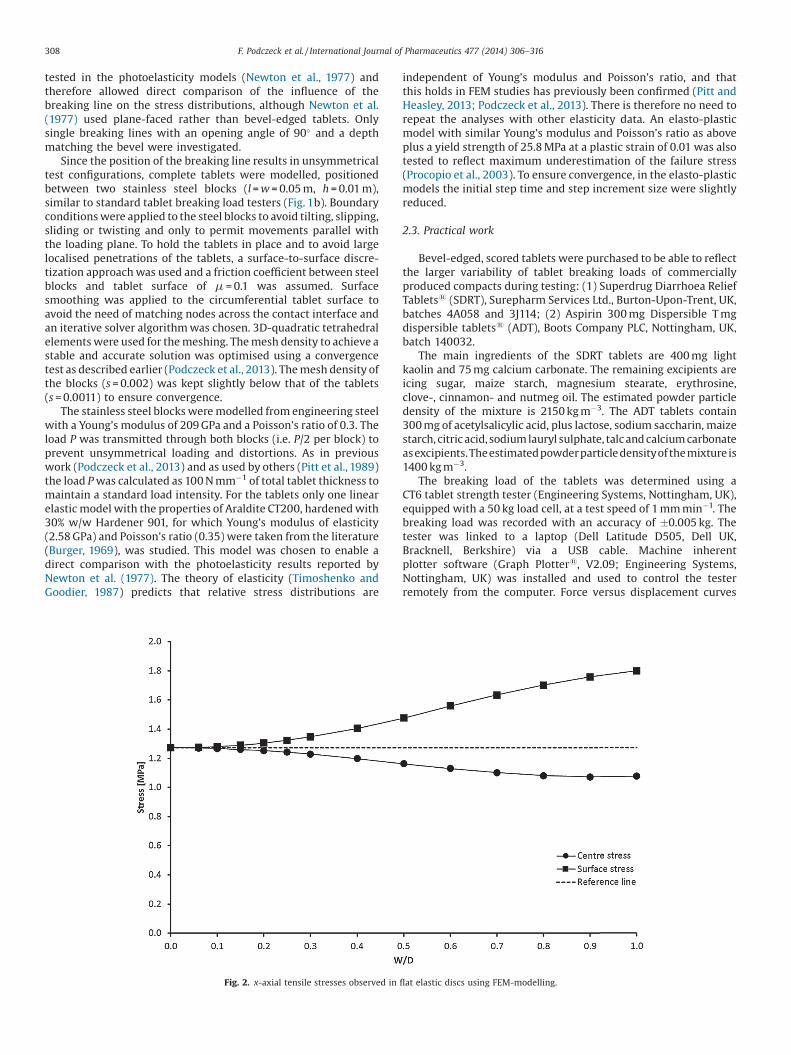
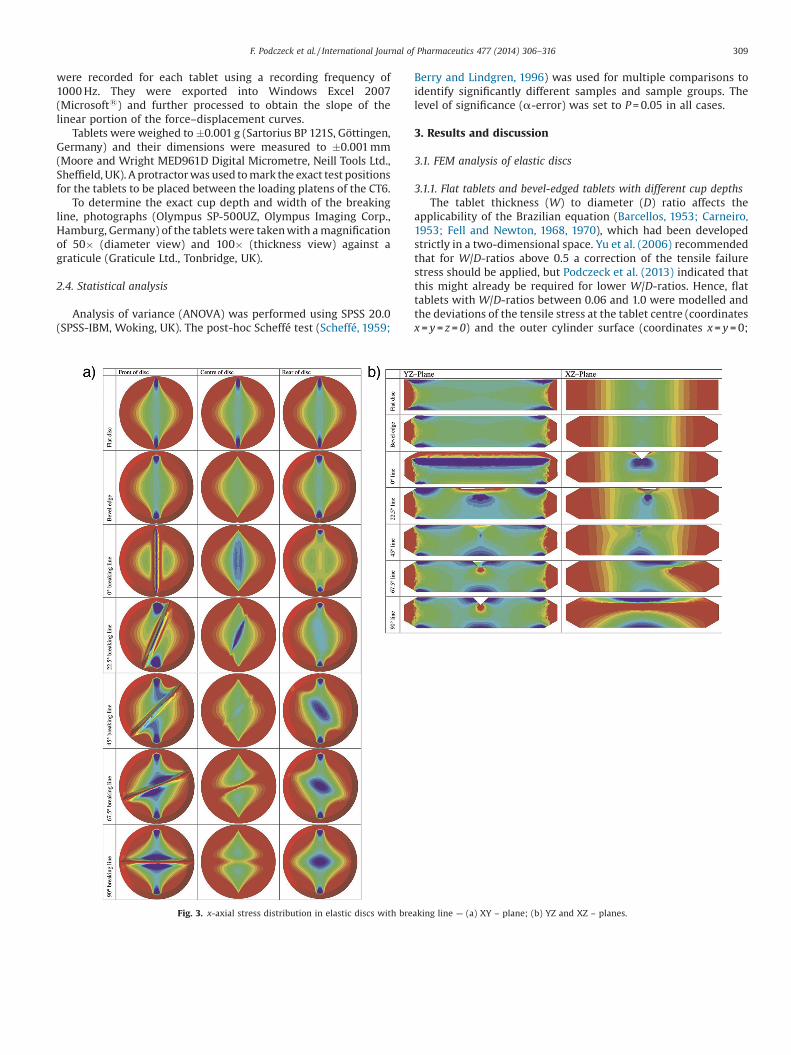
Fig. 3. x-axial stress distribution in elastic discs with bre
Berry and Lindgren, 1996) was used for multiple comparisons toidentify significantly different samples and sample groups. Thelevel of significance (a-error) was set to P = 0.05 in all cases.
3. Results and discussion
3.1. FEM analysis of elastic discs
3.1.1. Flat tablets and bevel-edged tablets with different cup depthsThe tablet thickness (W) to diameter (D) ratio affects the
applicability of the Brazilian equation (Barcellos, 1953; Carneiro,1953; Fell and Newton, 1968, 1970), which had been developedstrictly in a two-dimensional space. Yu et al. (2006) recommendedthat for W/D-ratios above 0.5 a correction of the tensile failurestress should be applied, but Podczeck et al. (2013) indicated thatthis might already be required for lower W/D-ratios. Hence, flattablets with W/D-ratios between 0.06 and 1.0 were modelled andthe deviations of the tensile stress at the tablet centre (coordinatesx = y = z = 0) and the outer cylinder surface (coordinates x = y = 0;
aking line — (a) XY – plane; (b) YZ and XZ – planes.
310 F. Podczeck et al. / International Journal of Pharmaceutics 477 (2014) 306–316
2 z/W = 1) from the 2D-solution are shown in Fig. 2. As can be seenfrom the figure, deviations from the theoretical tensile failurestress are already present at a W/D-ratio of 0.1.
Bevel edges with a cup depth of 5, 10, 15, 20 and 25% of the totalthickness of the flat discs were added for discs with a W/D-ratio of0.2, 0.3 and 0.4. These, however, did not significantly affect thestress distributions (see below) and reduced the tensile stresses inthe centre (coordinates x = y = z = 0) and at the surface of the discs(coordinates x = y = 0; 2 z/W = 1) by less than 1% in all cases. It washence decided to use a W/D-ratio of 0.2 for the work comparing theinfluence of the position of the breaking line, as here the deviationsfrom the Brazilian solution appeared still reasonably small (1.6% inthe centre and 2.5% at the surface of the disc; Fig. 2). A cup depth of25% of the total tablet thickness was used to accentuate anypotential contribution of the bevel edge on the stress distributions.
For post-processing of the results, the x-axial stressdistributions were first studied graphically using an inverserainbow colour scheme with 2 MPa and 0 MPa as maximum andminimum threshold levels. Hence, maximum tensile stresses arecoloured dark blue, whereas compressive stresses are red in allfigures. Various views and cuts were produced in all threedimensions of space to investigate the stress distribution changesthroughout the discs. Secondly, the numeric values along the z-axiswere collected and compared to get a better assessment of themagnitude of x-axial stresses inside the discs.
As stated above, in order to determine the influence of the beveledge on the stress distribution, a flat and a bevel-edged disc werecompared. From Fig. 3a it can be seen that the bevel edge onlyslightly affects the stress distributions at the front, centre or rear ofthe discs in the XY – plane. In the centre the tensile stresses at thesurface of the discs seem to be lower when a bevel edge is present,and at the outer surfaces the tensile stresses are slightly lesspointed and broader in this case. The average tensile stress acrossthe z-axis, however, is only reduced by 0.6% despite theaccentuated cup depth of 25% of the tablet thickness, comparedto the flat disc, and this reduction is consistent across the wholefailure plane. Nevertheless, when comparing the discs withbreaking lines (see following sections), the numerical x-axialstress values were normalised using the x-axial stress values
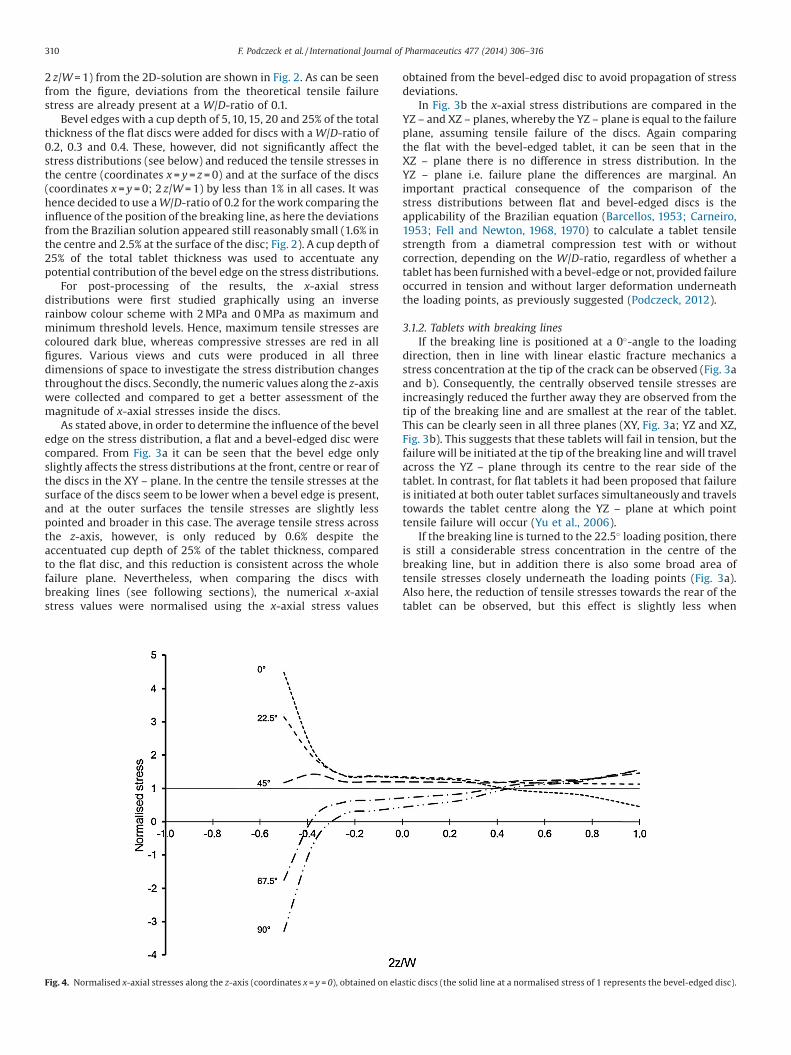
Fig. 4. Normalised x-axial stresses along the z-axis (coordinates x = y = 0), obtained on ela
obtained from the bevel-edged disc to avoid propagation of stressdeviations.
In Fig. 3b the x-axial stress distributions are compared in theYZ – and XZ – planes, whereby the YZ – plane is equal to the failureplane, assuming tensile failure of the discs. Again comparingthe flat with the bevel-edged tablet, it can be seen that in theXZ – plane there is no difference in stress distribution. In theYZ – plane i.e. failure plane the differences are marginal. Animportant practical consequence of the comparison of thestress distributions between flat and bevel-edged discs is theapplicability of the Brazilian equation (Barcellos, 1953; Carneiro,1953; Fell and Newton, 1968, 1970) to calculate a tablet tensilestrength from a diametral compression test with or withoutcorrection, depending on the W/D-ratio, regardless of whether atablet has been furnished with a bevel-edge or not, provided failureoccurred in tension and without larger deformation underneaththe loading points, as previously suggested (Podczeck, 2012).
3.1.2. Tablets with breaking linesIf the breaking line is positioned at a 0�-angle to the loading
direction, then in line with linear elastic fracture mechanics astress concentration at the tip of the crack can be observed (Fig. 3aand b). Consequently, the centrally observed tensile stresses areincreasingly reduced the further away they are observed from thetip of the breaking line and are smallest at the rear of the tablet.This can be clearly seen in all three planes (XY, Fig. 3a; YZ and XZ,Fig. 3b). This suggests that these tablets will fail in tension, but thefailure will be initiated at the tip of the breaking line and will travelacross the YZ – plane through its centre to the rear side of thetablet. In contrast, for flat tablets it had been proposed that failureis initiated at both outer tablet surfaces simultaneously and travelstowards the tablet centre along the YZ – plane at which pointtensile failure will occur (Yu et al., 2006).
If the breaking line is turned to the 22.5� loading position, thereis still a considerable stress concentration in the centre of thebreaking line, but in addition there is also some broad area oftensile stresses closely underneath the loading points (Fig. 3a).Also here, the reduction of tensile stresses towards the rear of thetablet can be observed, but this effect is slightly less when
stic discs (the solid line at a normalised stress of 1 represents the bevel-edged disc).
F. Podczeck et al. / International Journal of Pharmaceutics 477 (2014) 306–316 311
compared with the 0�-position (Fig 3b). A possible breakingpattern might hence be the start of crack propagation in the centreof the breaking line with failure moving towards the rear of thetablet, but at the same time breaking might be initiatedunderneath the loading platens potentially leading to somedeviation from a clean tensile failure across the YZ – plane.
At a 45� angle of the breaking line a very different pictureemerges. At the front of the disc (Fig. 3a) tensile stresses areconcentrated along the loading diameter with a slight disruption inthe centre of the disc inside the breaking line. In the centre of thetablet along the XY – plane tensile stresses are much lower, butfollow more or less the breaking line position, and this is even moreapparent at the rear of the disc, where the tensile stresses arehighest opposite the breaking line and underneath the loadingpoints. First of all this indicates a conversion to the stress patternobserved on the simple bevel-edged disc suggesting that failurewill be initiated from the periphery of the disc on either side andmight not be too dissimilar in the final failure load. On the otherhand, the stress distribution in the YZ – plane still shows a smallstress concentration at the tip of the crack (Fig. 3b) and someasymmetric stress distribution across the XZ – plane, theconsequences of which can only be identified using practicalexperiments (see Section 3.3).
When the disc is turned further to 67.5� and ultimately to90�, tensile stresses inside the breaking line are replaced bycompressive stresses (Fig. 3a), in particular for the 90� test position(Fig. 3b). If failure is initiated by the tensile stresses underneath theloading platens, these discs could still fail in tension, but especiallyin the 90� position the large compressive stresses seen in theXZ – plane (Fig. 3b) could also indicate a collapse or folding of thedisc along the breaking line during loading. Again, whichmechanism will apply cannot be derived from the FEM resultsand requires practical assessment (see Section 3.3).
In Fig. 4 the normalised x-axial stresses along the z-axis arecompared (a negative sign indicates compressive, while a positivesign indicates tensile stress). For the 0� and the 90� angle these arein very good agreement with the findings reported employingphotoelasticity work (Newton et al., 1977). As observed in thephotoelasticity work, the compressive stresses along the breaking
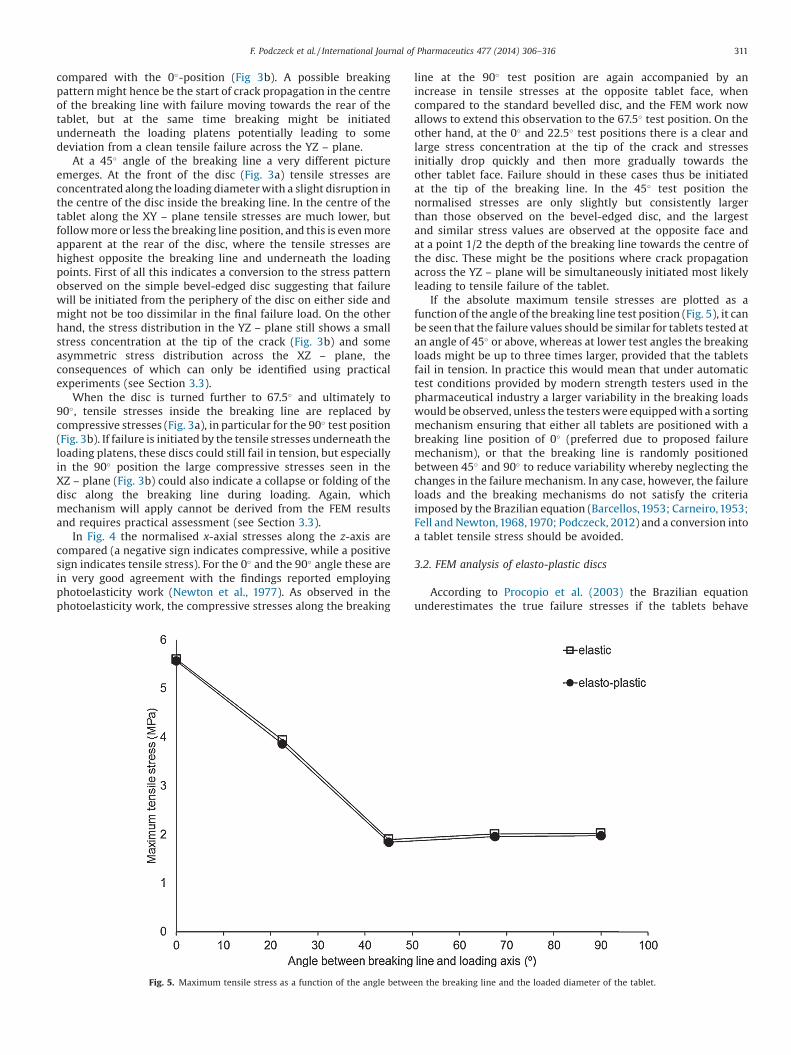
Fig. 5. Maximum tensile stress as a function of the angle betwe
line at the 90� test position are again accompanied by anincrease in tensile stresses at the opposite tablet face, whencompared to the standard bevelled disc, and the FEM work nowallows to extend this observation to the 67.5� test position. On theother hand, at the 0� and 22.5� test positions there is a clear andlarge stress concentration at the tip of the crack and stressesinitially drop quickly and then more gradually towards theother tablet face. Failure should in these cases thus be initiatedat the tip of the breaking line. In the 45� test position thenormalised stresses are only slightly but consistently largerthan those observed on the bevel-edged disc, and the largestand similar stress values are observed at the opposite face andat a point 1/2 the depth of the breaking line towards the centre ofthe disc. These might be the positions where crack propagationacross the YZ – plane will be simultaneously initiated most likelyleading to tensile failure of the tablet.
If the absolute maximum tensile stresses are plotted as afunction of the angle of the breaking line test position (Fig. 5), it canbe seen that the failure values should be similar for tablets tested atan angle of 45� or above, whereas at lower test angles the breakingloads might be up to three times larger, provided that the tabletsfail in tension. In practice this would mean that under automatictest conditions provided by modern strength testers used in thepharmaceutical industry a larger variability in the breaking loadswould be observed, unless the testers were equipped with a sortingmechanism ensuring that either all tablets are positioned with abreaking line position of 0� (preferred due to proposed failuremechanism), or that the breaking line is randomly positionedbetween 45� and 90� to reduce variability whereby neglecting thechanges in the failure mechanism. In any case, however, the failureloads and the breaking mechanisms do not satisfy the criteriaimposed by the Brazilian equation (Barcellos, 1953; Carneiro,1953;Fell and Newton, 1968,1970; Podczeck, 2012) and a conversion intoa tablet tensile stress should be avoided.
3.2. FEM analysis of elasto-plastic discs
According to Procopio et al. (2003) the Brazilian equationunderestimates the true failure stresses if the tablets behave
en the breaking line and the loaded diameter of the tablet.
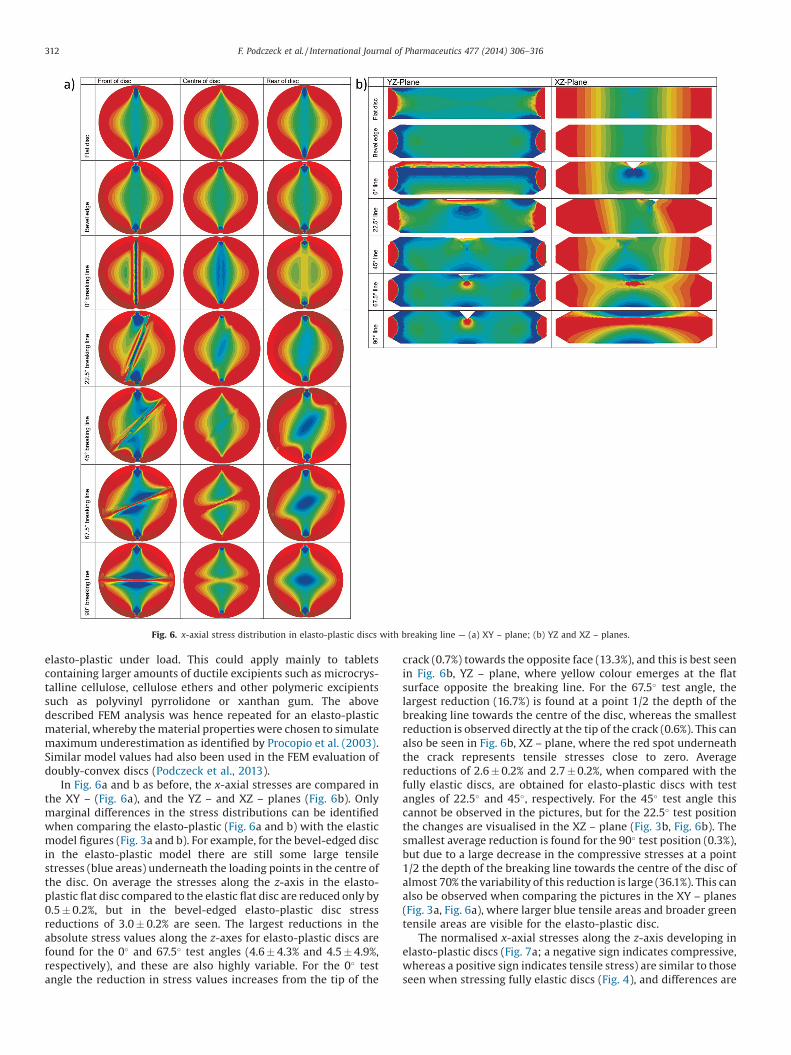
Fig. 6. x-axial stress distribution in elasto-plastic discs with breaking line — (a) XY – plane; (b) YZ and XZ – planes.
312 F. Podczeck et al. / International Journal of Pharmaceutics 477 (2014) 306–316
elasto-plastic under load. This could apply mainly to tabletscontaining larger amounts of ductile excipients such as microcrys-talline cellulose, cellulose ethers and other polymeric excipientssuch as polyvinyl pyrrolidone or xanthan gum. The abovedescribed FEM analysis was hence repeated for an elasto-plasticmaterial, whereby the material properties were chosen to simulatemaximum underestimation as identified by Procopio et al. (2003).Similar model values had also been used in the FEM evaluation ofdoubly-convex discs (Podczeck et al., 2013).
In Fig. 6a and b as before, the x-axial stresses are compared inthe XY – (Fig. 6a), and the YZ – and XZ – planes (Fig. 6b). Onlymarginal differences in the stress distributions can be identifiedwhen comparing the elasto-plastic (Fig. 6a and b) with the elasticmodel figures (Fig. 3a and b). For example, for the bevel-edged discin the elasto-plastic model there are still some large tensilestresses (blue areas) underneath the loading points in the centre ofthe disc. On average the stresses along the z-axis in the elasto-plastic flat disc compared to the elastic flat disc are reduced only by0.5 � 0.2%, but in the bevel-edged elasto-plastic disc stressreductions of 3.0 � 0.2% are seen. The largest reductions in theabsolute stress values along the z-axes for elasto-plastic discs arefound for the 0� and 67.5� test angles (4.6 � 4.3% and 4.5 � 4.9%,respectively), and these are also highly variable. For the 0� testangle the reduction in stress values increases from the tip of the
crack (0.7%) towards the opposite face (13.3%), and this is best seenin Fig. 6b, YZ – plane, where yellow colour emerges at the flatsurface opposite the breaking line. For the 67.5� test angle, thelargest reduction (16.7%) is found at a point 1/2 the depth of thebreaking line towards the centre of the disc, whereas the smallestreduction is observed directly at the tip of the crack (0.6%). This canalso be seen in Fig. 6b, XZ – plane, where the red spot underneaththe crack represents tensile stresses close to zero. Averagereductions of 2.6 � 0.2% and 2.7 � 0.2%, when compared with thefully elastic discs, are obtained for elasto-plastic discs with testangles of 22.5� and 45�, respectively. For the 45� test angle thiscannot be observed in the pictures, but for the 22.5� test positionthe changes are visualised in the XZ – plane (Fig. 3b, Fig. 6b). Thesmallest average reduction is found for the 90� test position (0.3%),but due to a large decrease in the compressive stresses at a point1/2 the depth of the breaking line towards the centre of the disc ofalmost 70% the variability of this reduction is large (36.1%). This canalso be observed when comparing the pictures in the XY – planes(Fig. 3a, Fig. 6a), where larger blue tensile areas and broader greentensile areas are visible for the elasto-plastic disc.
The normalised x-axial stresses along the z-axis developing inelasto-plastic discs (Fig. 7a; a negative sign indicates compressive,whereas a positive sign indicates tensile stress) are similar to thoseseen when stressing fully elastic discs (Fig. 4), and differences are
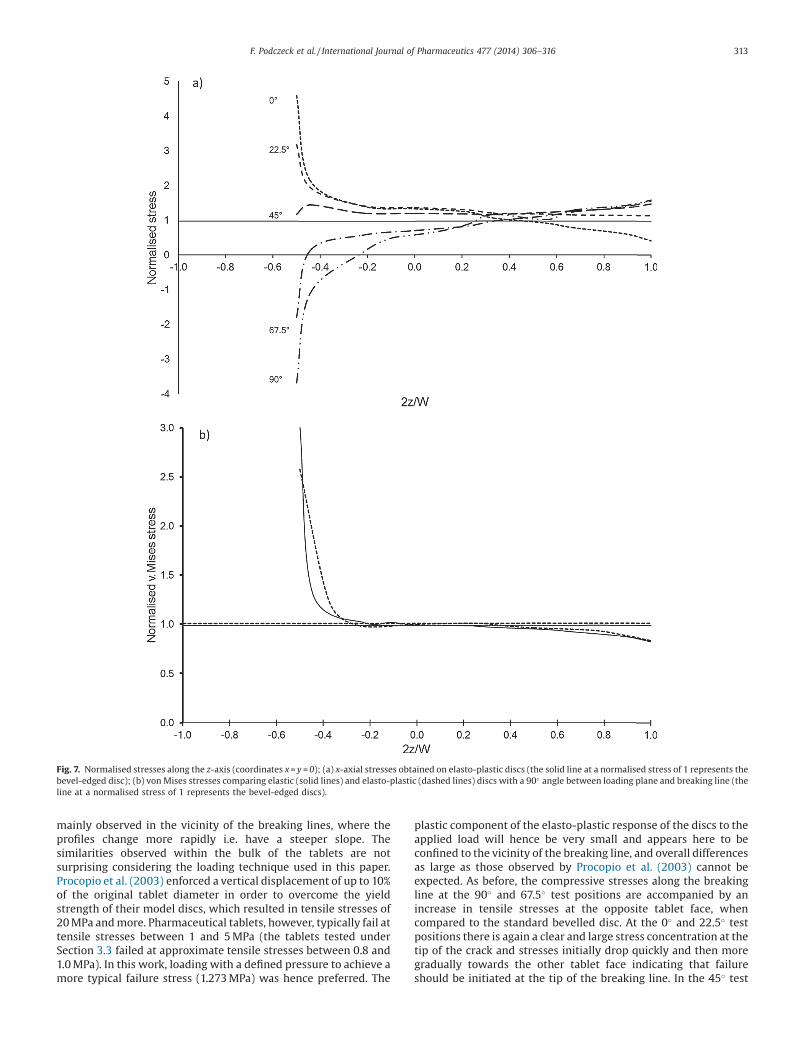
Fig. 7. Normalised stresses along the z-axis (coordinates x = y = 0); (a) x-axial stresses obtained on elasto-plastic discs (the solid line at a normalised stress of 1 represents thebevel-edged disc); (b) von Mises stresses comparing elastic (solid lines) and elasto-plastic (dashed lines) discs with a 90� angle between loading plane and breaking line (theline at a normalised stress of 1 represents the bevel-edged discs).
F. Podczeck et al. / International Journal of Pharmaceutics 477 (2014) 306–316 313
mainly observed in the vicinity of the breaking lines, where theprofiles change more rapidly i.e. have a steeper slope. Thesimilarities observed within the bulk of the tablets are notsurprising considering the loading technique used in this paper.Procopio et al. (2003) enforced a vertical displacement of up to 10%of the original tablet diameter in order to overcome the yieldstrength of their model discs, which resulted in tensile stresses of20 MPa and more. Pharmaceutical tablets, however, typically fail attensile stresses between 1 and 5 MPa (the tablets tested underSection 3.3 failed at approximate tensile stresses between 0.8 and1.0 MPa). In this work, loading with a defined pressure to achieve amore typical failure stress (1.273 MPa) was hence preferred. The
plastic component of the elasto-plastic response of the discs to theapplied load will hence be very small and appears here to beconfined to the vicinity of the breaking line, and overall differencesas large as those observed by Procopio et al. (2003) cannot beexpected. As before, the compressive stresses along the breakingline at the 90� and 67.5� test positions are accompanied by anincrease in tensile stresses at the opposite tablet face, whencompared to the standard bevelled disc. At the 0� and 22.5� testpositions there is again a clear and large stress concentration at thetip of the crack and stresses initially drop quickly and then moregradually towards the other tablet face indicating that failureshould be initiated at the tip of the breaking line. In the 45� test
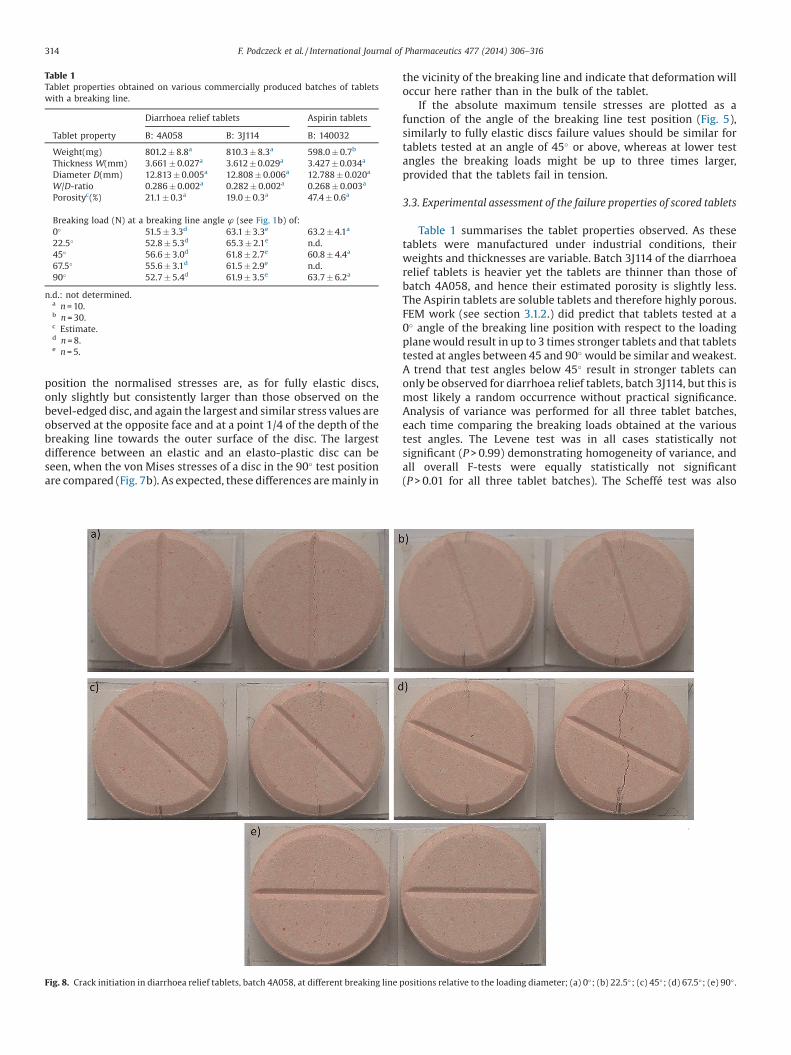
Table 1Tablet properties obtained on various commercially produced batches of tabletswith a breaking line.
Diarrhoea relief tablets Aspirin tablets
Tablet property B: 4A058 B: 3J114 B: 140032
Weight(mg) 801.2 � 8.8a 810.3 � 8.3a 598.0 � 0.7b
Thickness W(mm) 3.661 � 0.027a 3.612 � 0.029a 3.427 � 0.034a
Diameter D(mm) 12.813 � 0.005a 12.808 � 0.006a 12.788 � 0.020a
W/D-ratio 0.286 � 0.002a 0.282 � 0.002a 0.268 � 0.003a
Porosityc(%) 21.1 � 0.3a 19.0 � 0.3a 47.4 � 0.6a
Breaking load (N) at a breaking line angle ’ (see Fig. 1b) of:0� 51.5 � 3.3d 63.1 � 3.3e 63.2 � 4.1a
22.5� 52.8 � 5.3d 65.3 � 2.1e n.d.45� 56.6 � 3.0d 61.8 � 2.7e 60.8 � 4.4a
67.5� 55.6 � 3.1d 61.5 � 2.9e n.d.90� 52.7 � 5.4d 61.9 � 3.5e 63.7 � 6.2a
n.d.: not determined.a n = 10.b n = 30.c Estimate.d n = 8.e n = 5.
314 F. Podczeck et al. / International Journal of Pharmaceutics 477 (2014) 306–316
position the normalised stresses are, as for fully elastic discs,only slightly but consistently larger than those observed on thebevel-edged disc, and again the largest and similar stress values areobserved at the opposite face and at a point 1/4 of the depth of thebreaking line towards the outer surface of the disc. The largestdifference between an elastic and an elasto-plastic disc can beseen, when the von Mises stresses of a disc in the 90� test positionare compared (Fig. 7b). As expected, these differences are mainly in
Fig. 8. Crack initiation in diarrhoea relief tablets, batch 4A058, at different breaking line
the vicinity of the breaking line and indicate that deformation willoccur here rather than in the bulk of the tablet.
If the absolute maximum tensile stresses are plotted as afunction of the angle of the breaking line test position (Fig. 5),similarly to fully elastic discs failure values should be similar fortablets tested at an angle of 45� or above, whereas at lower testangles the breaking loads might be up to three times larger,provided that the tablets fail in tension.
3.3. Experimental assessment of the failure properties of scored tablets
Table 1 summarises the tablet properties observed. As thesetablets were manufactured under industrial conditions, theirweights and thicknesses are variable. Batch 3J114 of the diarrhoearelief tablets is heavier yet the tablets are thinner than those ofbatch 4A058, and hence their estimated porosity is slightly less.The Aspirin tablets are soluble tablets and therefore highly porous.FEM work (see section 3.1.2.) did predict that tablets tested at a0� angle of the breaking line position with respect to the loadingplane would result in up to 3 times stronger tablets and that tabletstested at angles between 45 and 90� would be similar and weakest.A trend that test angles below 45� result in stronger tablets canonly be observed for diarrhoea relief tablets, batch 3J114, but this ismost likely a random occurrence without practical significance.Analysis of variance was performed for all three tablet batches,each time comparing the breaking loads obtained at the varioustest angles. The Levene test was in all cases statistically notsignificant (P > 0.99) demonstrating homogeneity of variance, andall overall F-tests were equally statistically not significant(P > 0.01 for all three tablet batches). The Scheffé test was also
positions relative to the loading diameter; (a) 0�; (b) 22.5�; (c) 45�; (d) 67.5�; (e) 90� .
F. Podczeck et al. / International Journal of Pharmaceutics 477 (2014) 306–316 315
unable to separate different batches. The large differencespredicted by FEM analysis hence appear of no relevance inpractice, if only breaking loads are considered. However, it isimportant to remember that even breaking loads should only becompared between tablet batches, if the failure mechanisms arethe same (Fell and Newton,1970). To assess the failure mechanismsfor different loading angles, initially force–displacement curveswere recorded during tablet testing. These were all linear overmore than 90% of their total length, and hence the slopes werecalculated for all tablets. For diarrhoea relief tablet batch 4A058 theslopes ranged from 22.1 � 2.3 N mm�1 (90�) to 22.9 � 1.0 N mm�1
(67.5�); for batch 3J114 they ranged from 24.6 � 0.8 N mm�1 (67.5�)to 27.0 � 1.3 N mm�1 (22.5�); and for Aspirin tablets they rangedfrom 23.3 � 1.0 N mm�1 (45�) to 23.8 � 1.7 N mm�1 (0�). The slopesseem only to be related to the overall breaking load and the type oftablet, but they are not related to the angle of the breaking lineduring the test. The only physical property of the tablets that can beinferred from the linearity of the slopes is that all tablets failed byunstable crack propagation indicating that sufficient energy haddeveloped to propagate the most suitably orientated flaw insidethe tablets suddenly and completely across the failure plane. This istypical of elastic behaviour of brittle specimen (Adams, 1985).
Despite the generally similar fracture mechanism identifiedfrom the force–displacement curves, there are subtle differences inthe crack initiation. Fig. 8 shows this for all five test angles asobserved for diarrhoea relief tablets batch 4A058. If the breakingline is positioned at 0� to the loading plane, then the crack appearsto initiate at the centre of the tablet and follows the breaking line(Fig. 8a), which is in line with the FEM observations. If the breakingline is positioned 22.5� to the loading plane, then crackpropagation potentially starts at the centre and inside the breakingline (Fig. 8b, left), but the majority of tablets showed patternswhere crack propagation started simultaneously in the centrealong the breaking line and underneath the loading points (Fig. 8b,right). Again this is in agreement with the FEM predictionsdiscussed above. At an angle of 45� again in some cases fractureappears to initiate at the centre of the tablets inside the breakingline (Fig. 8c, left), but on the whole tablets seem to break into twohalves, although the failure line is not ideally straight and smooth,and there is a shift of the breaking line in the centre of the tablets(Fig. 8c, right). This again matches FEM observations. A similarobservation is made for a test angle of 67.5� (Fig. 8d), but here in thecentre of the tablet the fracture line follows the breaking line more
Table 2Comparison of maximum tensile stress values and centre tensile stress values ofbevel-edged tablets with a breaking line, positioned at different angles to theloading plane, using different FEM-models. The “Factor” is the ratio between theconsidered angle ’ (see Fig. 1b) and the 90� value.
FEM-model Angle Stress(max)[MPa]
Factor Centre stress [MPa] Factor
Elastic 0� 5.605 2.8 1.638 3.022.5� 3.942 2.0 1.679 3.145� 1.896 0.9 1.480 2.767.5� 2.009 1.0 0.880 1.690� 2.021 (1.0) 0.540 (1.0)
Elasto-plastic
0� 5.568 2.8 1.603 2.322.5� 3.868 2.0 1.641 2.445� 1.844 0.9 1.442 2.167.5� 1.955 1.0 0.845 1.290� 1.978 (1.0) 0.692 (1.0)
Diarrhoea 0� 4.287 2.8 1.324 1.3Relief 22.5� 3.644 2.4 1.323 1.3Tablet 45� 1.882 1.2 1.286 1.2
67.5� 1.508 1.0 1.122 1.190� 1.519 (1.0) 1.034 (1.0)
closely (Fig. 8d, right). Finally, when the breaking line is positioned90� towards the loading direction, the tablets appear to fail intension (Fig. 8e). Hence the compressive forces seen in the FEManalysis do not lead to folding and tablet collapse during testing.
As the predicted differences in the breaking load of the tabletsas a function of the angle between breaking line and loading planecould not be found in the practical experiments, elastic discs withrelative dimensions similar to the diarrhoea relief tablets, namelyW/D = 0.286 and cup depth of 14.4% of the total tablet thickness,were reproduced for further FEM-testing. Table 2 compares thestress values and the resulting factors for the stress values at thecentre of the discs (coordinates x = y = z = 0) and the maximumtensile stress values, comparing all three FEM-models used (viz.elastic, elasto-plastic, elastic with relative tablet dimensionsmatching those of the diarrhoea relief tablets). As can be seen, ifthe maximum tensile stress in the failure plane were responsiblefor the breaking load that would be measured (Pitt et al., 1989)then the ratio between the failure loads of a tablet with thebreaking line positioned at an angle of 0� to the loading plane andthat of a 90� position would be 2.8 regardless of the model used andthe relative dimensions of the bevel-edge and the breaking line. Iftablet failure was initiated at the centre of the tablets, whichaccording to Peltier (1954) is an essential prerequisite for validtensile failure, then the factor i.e. the ratio between the failureloads of a tablet with the breaking line positioned at an angle of 0�
to the loading plane and that of a 90� position would be 1.3 for atablet of the dimensions of the diarrhoea relief tablets. This wouldstill mean that there should be a difference of 15 N in the breakingload of the experimentally tested tablets, which is not the case (seeTable 1). Large discrepancies between FEM-predictions andexperimental data have previously been noted for simple flat-faced tablets (Ehrnford, 1980, 1981), and Darvell (1990) concludedthat “finite element analysis can only be as good as the theory usedto make the calculations, and the theory is at present insufficientlyworked out”. While the theory behind FEM calculations hasadvanced considerably since Darvell’s statement, for bevel-edgedtablets with a breaking line there is no analytical solution available,making it difficult to identify the reasons for the discrepanciesobserved. For example, the porosity of the tablets will be lowestunderneath the breaking line due to the highest compressionstress and maximum compaction (Bauer-Brandl, 2013), resultingin nonhomogeneous and potentially non-isotropic specimen,yet all FEM-models used in this work assumed homogeneityand fully isotropic behaviour of the discs. The breaking line will berounded at the bottom; sharp tooling would be subject to breakageduring compaction. The tablet porosity, which ranged from 19 and21% for diarrhoea relief tablets to 47% for the Aspirin tablets, as wellas pore size and pore shape distributions will also influence thestresses developing inside the tablets (Rice, 1984, 1993, 1996).FEM-models can be produced for porous specimens, and porositydistributions can be modelled, for example, to acknowledge theincreased density beneath the breaking line, but such simulationsare beyond the scope of this work.
4. Conclusions
FEM results obtained for fully elastic and elasto-plastic tabletsare fairly similar in terms of the stress distributions within thetablets. However, there are large differences in stress distributionsdepending on the position of the breaking line. FEM predicts thestress values at failure to be similar for tablets tested at an angle of45� or above, whereas at lower test angles the predicted breakingloads are up to three times larger. The stress distributions suggestthat not all breaking line angles would result in clean tensilefailure. In practice, however, these differences in breaking load arenot found, but differences in the way tablets break can be observed.
316 F. Podczeck et al. / International Journal of Pharmaceutics 477 (2014) 306–316
The results suggest that it is not advisable to convert breaking loadsobtained on scored tablets into tablet tensile strength values, andcomparisons between different tablets or batches should carefullyconsider the orientation of the breaking line with respect to theloading plane, as the failure mechanisms appear to vary.
Acknowledgements
The authors are grateful to Denis Cooper and Simon Carter(Engineering Systems, Nottingham, UK) for the loan of the CT6tablet strength tester. Daniel Ashworth’s help to overcome aremote access problem to the Linux server was invaluable, as wasthe server and software maintenance performed by David Bevanand Mark Iline (all from UCL Mechanical Engineering, UK).
References
Adams, M.J., 1985. The strength of particulate solids. J. Powder Bulk Solids Technol.9, 15–20.
Barcellos, A., 1953. Tensile strength of concrete—correlation between tensile andcompressive concrete strength. RILEM Bull. 15, 109–113.
Bauer-Brandl, A., 2013. Tooling for tableting, Encyclopedia of PharmaceuticalScience and Technology. 4th ed. Taylor and Francis, New York, pp. 3628–3644.
Berry, D.A., Lindgren, B.W., 1996. Statistics, Theory and Methods. 2nd ed. DuxburyPress, Belmont, pp. 577–578.
Burger, C.P., 1969. A generalized method for photoelastic studies of transientthermal stresses. Exp. Mech. 9, 529–537.
Carneiro, F.L.L., 1953. Tensile strength of concrete—a new method for determiningthe tensile strength of concretes. RILEM Bull. 13, 103–107.
Darvell, B.W., 1990. Uniaxial compression tests and the validity of indirect tensilestrength. J. Mater. Sci. 25, 757–780.
Dunn, M.L., Suwito, W., Cunningham, S., 1997. Fracture initiation at sharp notches:correlation using critical stress intensities. Int. J. Solid Struct. 34, 3873–3883.
Ehrnford, L.,1980. The connection between load distribution and fracture load in thediametral compression test—an experimental study. Swed. Dent. J. 4, 201–212.
Ehrnford, L., 1981. Stress–distribution in diametral compression tests. ActaOdontol. Scand. 39, 55–60.
EP 8 (European Pharmacopoeia, 8th edn.). Resistance to Crushing Force (Method2.9.8). European Directorate for the Quality of Medicines and Health CareStrasbourg. 2013.
Fell, J.T., Newton, J.M., 1968. The tensile strength of lactose tablets. J. Pharm.Pharmacol. 20, 657–658.
Fell, J.T., Newton, J.M., 1970. Determination of tablet strength by the diametralcompression test. J. Pharm. Sci. 59, 688–691.
Irwin, G.R., 1957. Analysis of stresses and strains near the end of a crack traversing aplate. J. Appl. Mech. 24, 361–364.
Mazel, V., Diarra, H., Busignies, V., Tchoreloff, P., 2014. Comparison of differentfailure tests for pharmaceutical tablets: applicability of the Drucker–Pragerfailure criterion. Int. J. Pharm. 470, 63–69.
Newton, J.M., Stanley, P., Tan, C.S., 1977. Model study of stresses in grooved tabletsunder diametral compression. J. Pharm. Pharmacol. 29, 40P.
Peltier, R.,1954. Theoretical investigation of the Brazilian test. RILEM Bull. 19, 29–69.Pitt, K.G., Newton, J.M., Stanley, P., 1989. Stress distributions in doubly convex
cylindrical discs under diametral loading. J. Phys. D Appl. Phys. 22, 1114–1127.Pitt, K.G., Heasley, M.G., 2013. Determination of the tensile strength of elongated
tablets. Powder Technol. 238, 169–175.Podczeck, F., 2012. Methods for the practical determination of the mechanical
strength of tablets—from empiricism to science. Int. J. Pharm. 436, 214–232.Podczeck, F., Drake, K.R., Newton, J.M., 2013. Investigations into the tensile failure of
doubly-convex cylindrical tablets under diametral loading using finite elementmethodology. Int. J. Pharm. 454, 412–424.
Procopio, A.T., Zavaliangos, A., Cunningham, J.C., 2003. Analysis of the diametralcompression test and the applicability to plastically deforming materials.J. Mater. Sci. 38, 3629–3639.
Rice, R.W., 1984. Pores as fracture origins in ceramics. J. Mater. Sci. 19, 895–914.Rice, R.W., 1993. Comparison of stress concentration versus minimum solid area
based mechanical property—porosity relations. J. Mater. Sci. 28, 2187–2190.Rice, R.W., 1996. Grain size and porosity dependence of ceramic fracture energy and
toughness at 22 �C. J. Mater. Sci. 31, 1969–1983.Scheffé, H., 1959. The Analysis of Variance. Wiley, New York (reprinted 1999. ISBN
0-471-34505-9).Sovány, T., Kása, P., Pintye-Hódi, K., 2010. Modeling of subdivision of scored tablets
with the application of artificial neural networks. J. Pharm. Sci. 99, 905–915.Stanley, P., 2001. Mechanical strength testing of compacted powders. Int. J. Pharm.
227, 27–38.Timoshenko, S.P., Goodier, J.N., 1987. Theory of Elasticity, 3rd ed. McGraw-Hill,
New York.USP38/NF33, 2014. Tablet Breaking Force (Method 1217). The United States
Pharmacopoeial Convention, Rockville, MD.Van Santen, E., Barends, D.M., Frijlink, H.W., 2002. Breaking of scored tablets: a
review. Eur. J. Pharm. Biopharm. 53, 139–145.Young, L.L., 1995. Tableting Specification Manual. American Pharmaceutical
Association, Washington, DC, pp. 46.Yu, Y., Yin, J., Zhong, Z., 2006. Shape effects in the Brazilian tensile strength test and a
3D FEM correction. Int. J. Rock Mech. Min. Sci. 43, 623–627.