Embed Size (px)
Citation preview
Bill.com Reports Third Quarter Fiscal 2020 Financial Results
● Total Quarterly Revenue Growth of 46% Year-over-Year ● Subscription and Transaction Revenue Increases 63% Year-over-Year
PALO ALTO, CALIF. – May 7, 2020 – Bill.com (NYSE: BILL), a leading provider of cloud-based software that simplifies, digitizes, and automates complex back-office financial operations for small and midsize businesses, today announced financial results for the third fiscal quarter ended March 31, 2020.
“Bill.com reported solid quarterly results highlighted by strong revenue growth and a healthy pace of new customer acquisition,” commented Bill.com CEO René Lacerte. “Our platform is mission-critical to SMBs and we have found this to be especially true in the current work-from-home environment. We are optimistic that our purpose-built platform will resonate even more with SMBs who are now coping with the reality that the old way of managing their back-office financial operations doesn’t work anymore.”
Financial Highlights for the Third Quarter of Fiscal 2020
● Total revenue for the quarter was $41.2 million, an increase of 46% from the third quarter of fiscal 2019. Subscription and transaction revenue was $36.1 million, an increase of 63% from the third quarter of fiscal 2019. Interest on funds held for customers, which we refer to as float revenue, was $5.1 million, a decrease of 16% from the third quarter of fiscal 2019.
● GAAP gross profit was $31.1 million, representing a 75.5% gross margin, compared to $20.3 million, or a 72.0% gross margin, in the third quarter of fiscal 2019. Non-GAAP gross profit was $32.5 million, representing a 78.8% non-GAAP gross margin, compared to $21.5 million, or a 76.0% non-GAAP gross margin in the third quarter of fiscal 2019.
● Loss from operations was $9.7 million, compared to loss from operations of $2.8 million in the third quarter of fiscal 2019. Non-GAAP loss from operations for the third quarter was $4.3 million, compared to a non-GAAP loss from operations of $1.1 million in the third quarter of fiscal 2019.
● Net loss was $8.3 million, or ($0.11) per share, basic and diluted, compared to net loss of $2.0 million, or ($0.26) per share, basic and diluted, in the third quarter of fiscal 2019. Non-GAAP net loss was $2.9 million, or ($0.04) per share, basic and diluted, compared to non-GAAP net loss of $138,000, or breakeven on a per share basis, basic and diluted, in the same period last year.
● Cash, cash equivalents and short-term investments were $382.4 million at March 31, 2020.
Business Highlights
● Served over 91,000 customers, representing year-over-year customer growth of 28%.
● Processed $24.2 billion in total payment volume on our platform, an increase of 35% year-over-year.
● Processed over 6 million transactions, representing an increase of 23% year-over-year.
● Named a leader in G2’s 2020 Accounts Payable Automation Software category for the small and medium business community.
● Signed an agreement with Wells Fargo Bank, N.A. to integrate Bill.com into its Commercial Electronic Office® (CEO®) online electronic banking portal.
Conference Call
In conjunction with this announcement Bill.com will host a conference call at 1:30 p.m. PT (4:30 p.m. ET) today to discuss the third quarter of fiscal 2020 results and our outlook for the fourth quarter of fiscal 2020. The conference call will be available via live webcast and replay at the Investor Relations section of Bill.com’s website: https://investor.bill.com/events-and-presentations/default.aspx .
About Bill.com
Bill.com is a leading provider of cloud-based software that simplifies, digitizes, and automates complex, back-office financial operations for small and midsize businesses. Customers use the Bill.com platform to manage end-to-end financial workflows and to process payments. The Bill.com financial software platform creates connections between businesses and their suppliers and clients. It helps manage cash inflows and outflows. The company partners with several of the largest U.S. financial institutions, the majority of the top 100 U.S. accounting firms, and popular accounting software providers. Bill.com has offices in Palo Alto, California and Houston, Texas. For more information visit www.bill.com.
Note on Forward-Looking Statements
This press release and the accompanying conference call include forward-looking statements, which are statements other than statements of historical facts, and statements in the future tense. Forward-looking statements are based on our expectations as of the date of this press release and are subject to a number of risks, uncertainties and assumptions, many of which involve factors or circumstances that are beyond our control. These statements include, but are not limited to, statements regarding our expectations for future performance and results in the third quarter of fiscal 2020, the growth of demand on our platform and the expansion of our customers’ utilization of our services. These risks and
uncertainties include, but are not limited to, the novel coronavirus outbreak (COVID-19) and its impact to our employees, customers, strategic partners, vendors, our results of operations, liquidity and financial condition, our history of operating losses, our recent rapid growth, the large sums of customer funds that we transfer daily, the risk of loss, errors and fraudulent activity, the market, interest rate, foreign exchange and other conditions that the customer funds we hold in trust are subject to, our ability to attract new customers and convert trial customers into paying customers, our ability to develop new products and services, increased competition or new entrants in the marketplace, potential impact of acquisitions and investments, changes in staffing levels, and other risks detailed in registration statements and periodic reports we file with the SEC, including our quarterly report on Form 10-Q filed with the SEC on February 11, 2020, which may be obtained on the Investor Relations section of Bill.com’s website (https://investor.bill.com/financials/sec-filings/default.aspx) and on the SEC website at www.sec.gov. Actual results may differ materially from those presently reported. All forward-looking statements in this press release are based on information available to us as of the date hereof. We assume no obligation to update the information contained in this press release or the accompanying conference call.
Non-GAAP Financial Measures
In addition to financial measures prepared in accordance with U.S. generally accepted accounting principles (“GAAP”), this press release and the accompanying tables contain, and the conference call will contain, non-GAAP financial measures, including non-GAAP loss from operations, non-GAAP net loss and non-GAAP net loss per share, basic and diluted. The non-GAAP financial information is presented for supplemental informational purposes only and is not intended to be considered in isolation or as a substitute for, or superior to, financial information prepared and presented in accordance with GAAP.
We believe that these non-GAAP financial measures provide useful information about our financial performance, enhance the overall understanding of our past performance and future prospects and allow for greater transparency with respect to important metrics used by our management for financial and operational decision-making. We believe that these measures provide an additional tool for investors to use in comparing our core financial performance over multiple periods with other companies in our industry. However, it is important to note that the particular items we exclude from, or include in, our non-GAAP financial measures may differ from the items excluded from, or included in, similar non-GAAP financial measures used by other companies in the same industry.
We adjust the following items from one or more of our non-GAAP financial measures:
Stock-based compensation expense. We exclude stock-based compensation expense, which is a non-cash expense, from certain of our non-GAAP financial measures because we believe that excluding this item provides meaningful supplemental information regarding operational performance. In particular, companies calculate stock- based compensation expense using a variety of valuation methodologies and subjective assumptions.
Depreciation and amortization expense. We exclude depreciation and amortization expense from certain of our non-GAAP financial measures because we believe that excluding this item provides meaningful supplemental information regarding operational performance.
Capitalized internal-use software and amortization. We include capitalization and exclude the subsequent amortization of internal-use software costs in certain of our non-GAAP financial measures. We capitalize direct costs incurred related to obtaining or developing internal-use software during the application development stage and we amortize those costs over the estimated useful lives of the software. The capitalization and subsequent amortization of those costs can vary every period depending on our business needs and the timing on the software’s availability for its intended use. We believe that including or excluding the effect of the capitalized internal-use software in certain of our non-GAAP financial measure provides us useful information in evaluating and comparing the consistency of our operating performance on a period-to-period basis.
Capitalized sales commissions and amortization. We include capitalization and exclude the subsequent amortization of sales commissions in certain of our non-GAAP financial measures. We capitalize sales commissions that are incremental costs in obtaining new customer contracts and we amortize such costs over the benefit period of our relationship with the acquired customers. We believe that including or excluding the effect of the capitalization of sales commissions in certain of our non-GAAP financial measures in a given period provides us useful information in evaluating and comparing the consistency of our performance in acquiring new customer contracts on a period-to-period basis.
Capitalized service costs and amortization. We include capitalization and exclude the subsequent amortization of service costs in certain of our non-GAAP financial measures. These service costs, which primarily consist of direct payroll costs, pertain to the implementation services that we provide to our financial institution customers and certain SMB customers prior to the launching of our product for general use. We capitalize such service costs and amortize them over the estimated benefit period. Our implementation service is generally a non-recurring type of service that we perform for our new customers. We believe that including or excluding the
effect of the capitalization of service costs in certain of our non-GAAP financial measures provides us useful information in evaluating and comparing the consistency of our operating performance on a period-to-period basis.
Gain or loss on revaluation of warrant liabilities and gain on forfeiture of warrants. We exclude gain or loss on revaluation of warrant liabilities and gain on forfeiture of warrants, which is a non-cash income or expense, from certain of our non-GAAP financial measures because we believe that excluding this item provides meaningful supplemental information regarding operational performance.
Stock warrants expense. We exclude stock warrants expense, which is a non-cash expense, from certain of our non-GAAP financial measures because we believe that excluding this item provides meaningful supplemental information regarding operational performance.
There are material limitations associated with the use of non-GAAP financial measures since they exclude significant expenses and income that are required by GAAP to be recorded in our financial statements. Please see the reconciliation tables at the end of this release for the reconciliation of GAAP and non-GAAP results.
IR Contact: Carolyn Bass [email protected] Press Contact: [email protected]
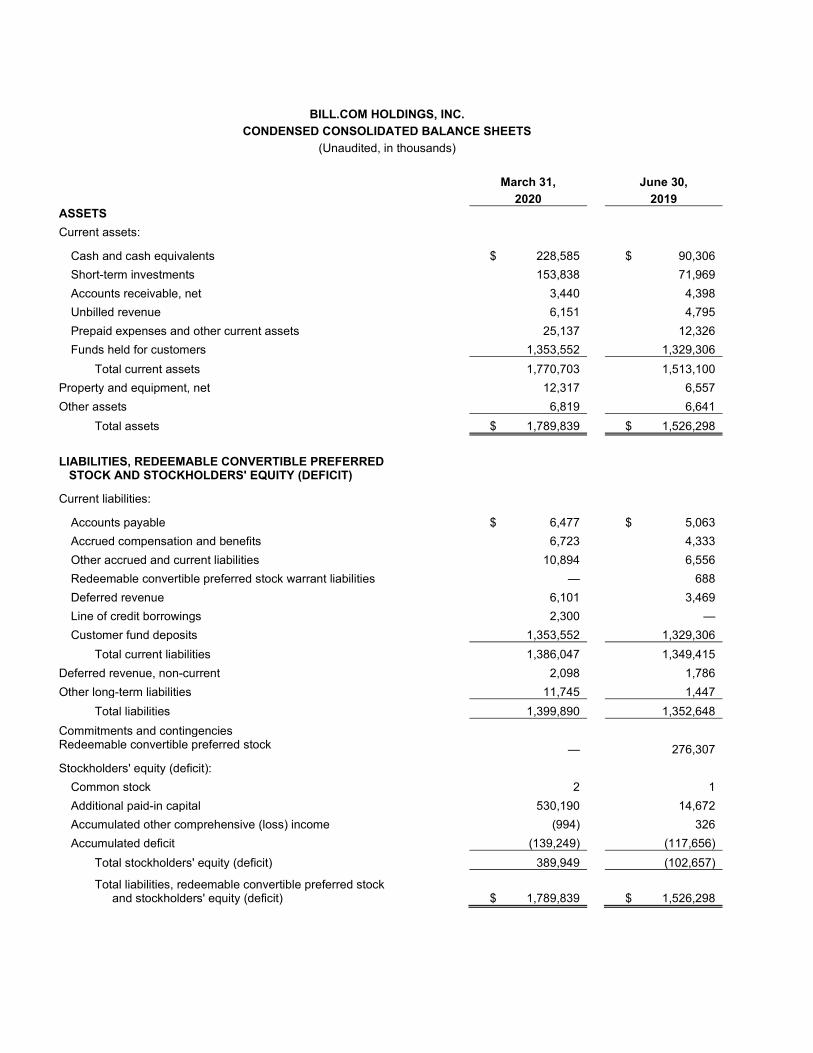
BILL.COM HOLDINGS, INC. CONDENSED CONSOLIDATED BALANCE SHEETS
(Unaudited, in thousands) March 31, June 30, 2020 2019 ASSETS Current assets:
Cash and cash equivalents $ 228,585 $ 90,306 Short-term investments 153,838 71,969 Accounts receivable, net 3,440 4,398 Unbilled revenue 6,151 4,795 Prepaid expenses and other current assets 25,137 12,326 Funds held for customers 1,353,552 1,329,306
Total current assets 1,770,703 1,513,100 Property and equipment, net 12,317 6,557 Other assets 6,819 6,641
Total assets $ 1,789,839 $ 1,526,298
LIABILITIES, REDEEMABLE CONVERTIBLE PREFERRED STOCK AND STOCKHOLDERS' EQUITY (DEFICIT)
Current liabilities:
Accounts payable $ 6,477 $ 5,063 Accrued compensation and benefits 6,723 4,333 Other accrued and current liabilities 10,894 6,556 Redeemable convertible preferred stock warrant liabilities — 688 Deferred revenue 6,101 3,469 Line of credit borrowings 2,300 — Customer fund deposits 1,353,552 1,329,306
Total current liabilities 1,386,047 1,349,415 Deferred revenue, non-current 2,098 1,786 Other long-term liabilities 11,745 1,447
Total liabilities 1,399,890 1,352,648 Commitments and contingencies Redeemable convertible preferred stock — 276,307 Stockholders' equity (deficit):
Common stock 2 1 Additional paid-in capital 530,190 14,672 Accumulated other comprehensive (loss) income (994) 326 Accumulated deficit (139,249) (117,656)
Total stockholders' equity (deficit) 389,949 (102,657)
Total liabilities, redeemable convertible preferred stock and stockholders' equity (deficit) $ 1,789,839 $ 1,526,298
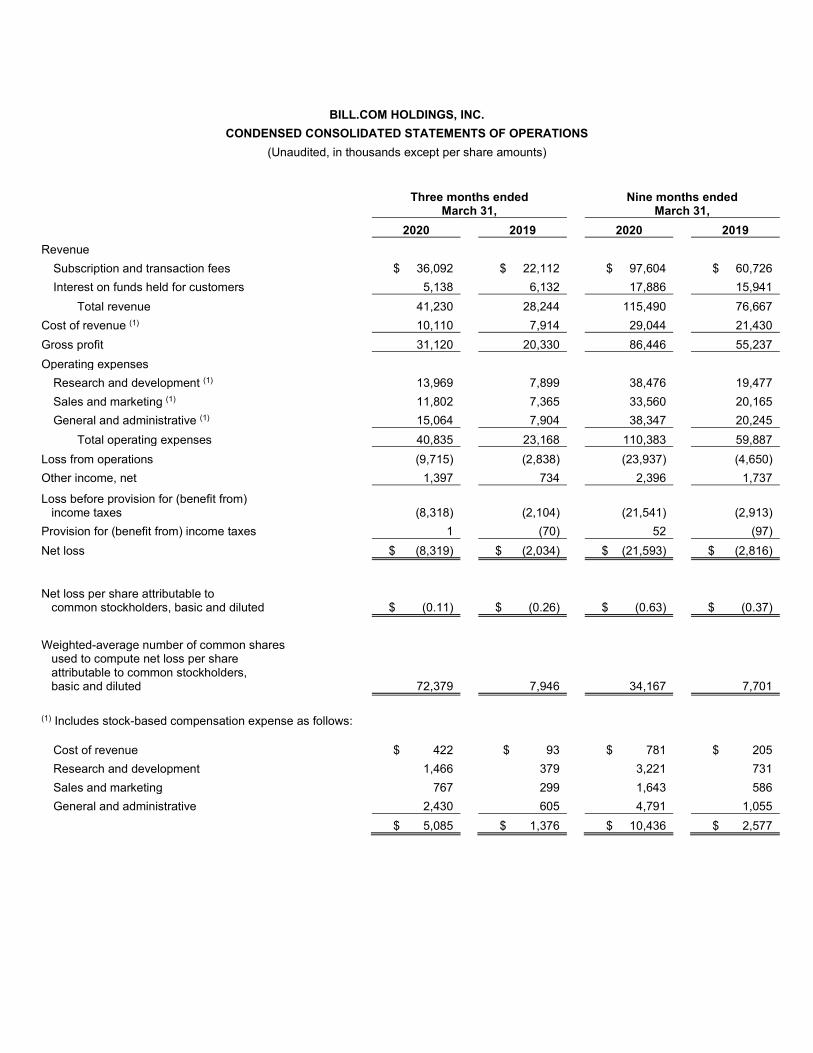
BILL.COM HOLDINGS, INC. CONDENSED CONSOLIDATED STATEMENTS OF OPERATIONS
(Unaudited, in thousands except per share amounts)
Three months ended
March 31, Nine months ended
March 31, 2020 2019 2020 2019 Revenue
Subscription and transaction fees $ 36,092 $ 22,112 $ 97,604 $ 60,726 Interest on funds held for customers 5,138 6,132 17,886 15,941
Total revenue 41,230 28,244 115,490 76,667 Cost of revenue (1) 10,110 7,914 29,044 21,430 Gross profit 31,120 20,330 86,446 55,237 Operating expenses
Research and development (1) 13,969 7,899 38,476 19,477 Sales and marketing (1) 11,802 7,365 33,560 20,165 General and administrative (1) 15,064 7,904 38,347 20,245
Total operating expenses 40,835 23,168 110,383 59,887 Loss from operations (9,715) (2,838) (23,937) (4,650) Other income, net 1,397 734 2,396 1,737
Loss before provision for (benefit from) income taxes (8,318) (2,104) (21,541) (2,913) Provision for (benefit from) income taxes 1 (70) 52 (97) Net loss $ (8,319) $ (2,034) $ (21,593) $ (2,816)
Net loss per share attributable to common stockholders, basic and diluted $ (0.11) $ (0.26) $ (0.63) $ (0.37)
Weighted-average number of common shares used to compute net loss per share attributable to common stockholders, basic and diluted 72,379 7,946 34,167 7,701
(1) Includes stock-based compensation expense as follows:
Cost of revenue $ 422 $ 93 $ 781 $ 205 Research and development 1,466 379 3,221 731 Sales and marketing 767 299 1,643 586 General and administrative 2,430 605 4,791 1,055
$ 5,085 $ 1,376 $ 10,436 $ 2,577
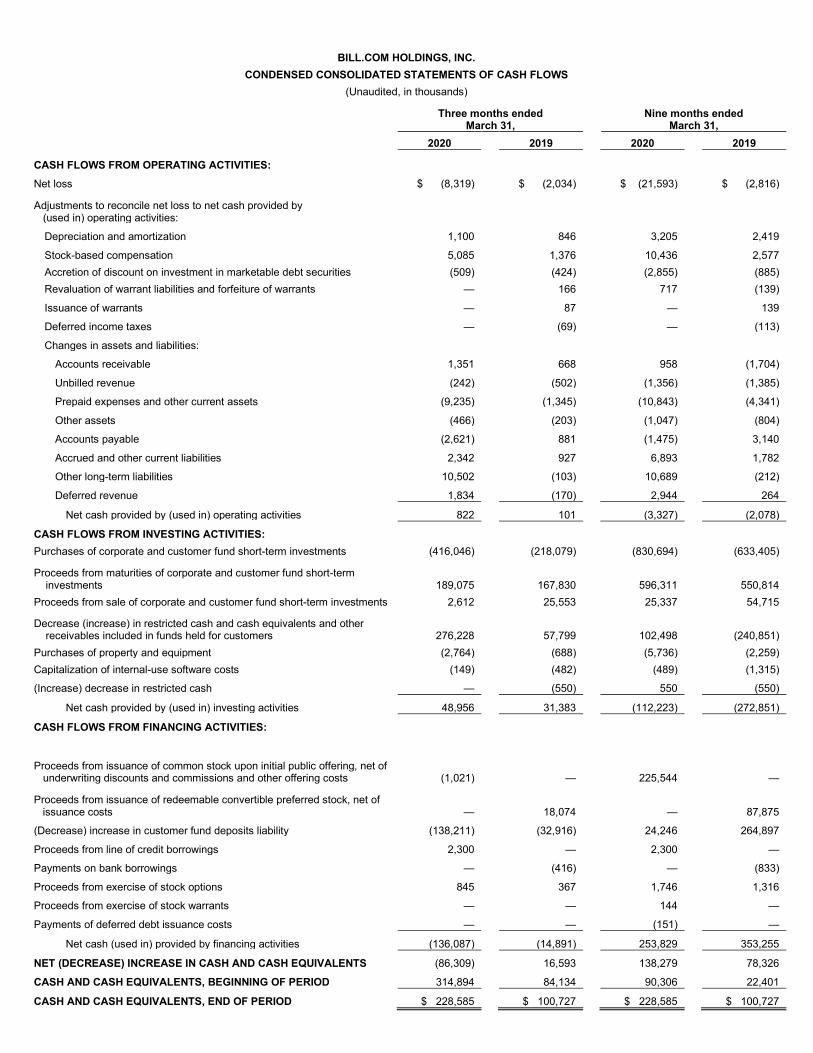
BILL.COM HOLDINGS, INC. CONDENSED CONSOLIDATED STATEMENTS OF CASH FLOWS
(Unaudited, in thousands)
Three months ended
March 31, Nine months ended
March 31, 2020 2019 2020 2019
CASH FLOWS FROM OPERATING ACTIVITIES:
Net loss $ (8,319) $ (2,034) $ (21,593) $ (2,816)
Adjustments to reconcile net loss to net cash provided by (used in) operating activities:
Depreciation and amortization 1,100 846 3,205 2,419
Stock-based compensation 5,085 1,376 10,436 2,577 Accretion of discount on investment in marketable debt securities (509) (424) (2,855) (885) Revaluation of warrant liabilities and forfeiture of warrants — 166 717 (139)
Issuance of warrants — 87 — 139
Deferred income taxes — (69) — (113)
Changes in assets and liabilities:
Accounts receivable 1,351 668 958 (1,704)
Unbilled revenue (242) (502) (1,356) (1,385)
Prepaid expenses and other current assets (9,235) (1,345) (10,843) (4,341)
Other assets (466) (203) (1,047) (804)
Accounts payable (2,621) 881 (1,475) 3,140
Accrued and other current liabilities 2,342 927 6,893 1,782
Other long-term liabilities 10,502 (103) 10,689 (212)
Deferred revenue 1,834 (170) 2,944 264
Net cash provided by (used in) operating activities 822 101 (3,327) (2,078)
CASH FLOWS FROM INVESTING ACTIVITIES: Purchases of corporate and customer fund short-term investments (416,046) (218,079) (830,694) (633,405)
Proceeds from maturities of corporate and customer fund short-term __investments 189,075 167,830 596,311 550,814 Proceeds from sale of corporate and customer fund short-term investments 2,612 25,553 25,337 54,715
Decrease (increase) in restricted cash and cash equivalents and other _ __receivables included in funds held for customers 276,228 57,799 102,498 (240,851) Purchases of property and equipment (2,764) (688) (5,736) (2,259) Capitalization of internal-use software costs (149) (482) (489) (1,315)
(Increase) decrease in restricted cash — (550) 550 (550)
Net cash provided by (used in) investing activities 48,956 31,383 (112,223) (272,851)
CASH FLOWS FROM FINANCING ACTIVITIES:
Proceeds from issuance of common stock upon initial public offering, net of underwriting discounts and commissions and other offering costs (1,021) — 225,544 —
Proceeds from issuance of redeemable convertible preferred stock, net of issuance costs — 18,074 — 87,875
(Decrease) increase in customer fund deposits liability (138,211) (32,916) 24,246 264,897
Proceeds from line of credit borrowings 2,300 — 2,300 —
Payments on bank borrowings — (416) — (833)
Proceeds from exercise of stock options 845 367 1,746 1,316
Proceeds from exercise of stock warrants — — 144 —
Payments of deferred debt issuance costs — — (151) —
Net cash (used in) provided by financing activities (136,087) (14,891) 253,829 353,255
NET (DECREASE) INCREASE IN CASH AND CASH EQUIVALENTS (86,309) 16,593 138,279 78,326
CASH AND CASH EQUIVALENTS, BEGINNING OF PERIOD 314,894 84,134 90,306 22,401
CASH AND CASH EQUIVALENTS, END OF PERIOD $ 228,585 $ 100,727 $ 228,585 $ 100,727
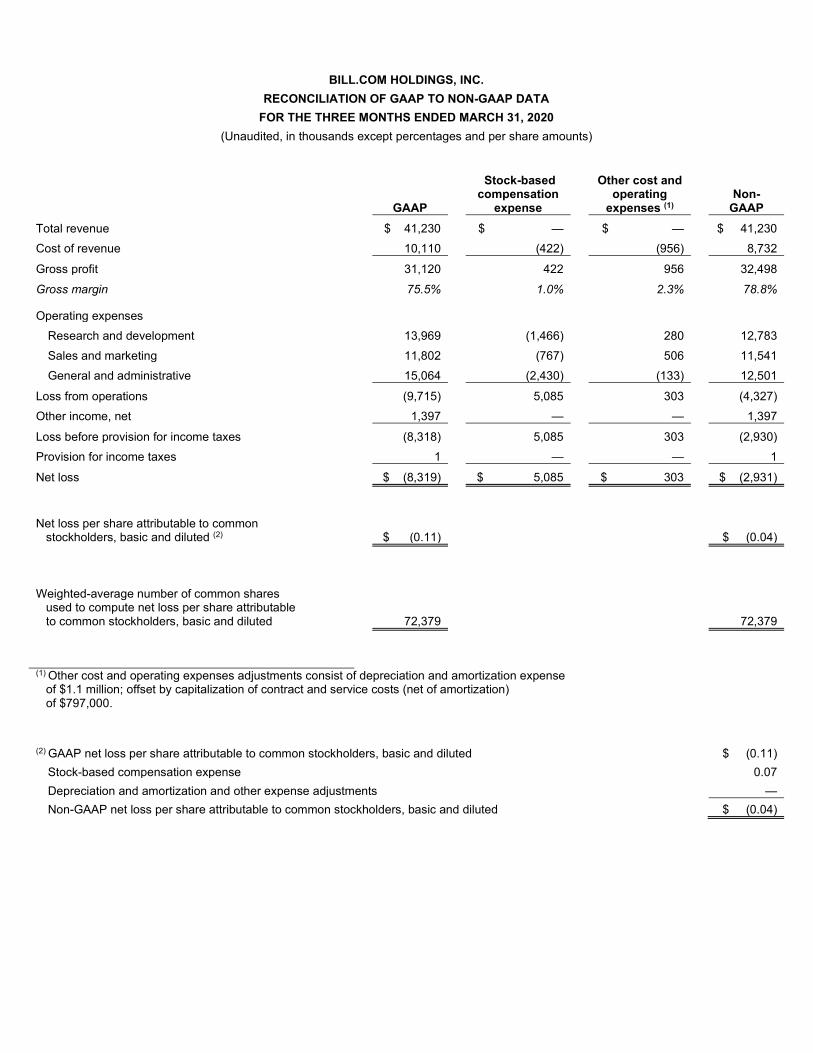
BILL.COM HOLDINGS, INC. RECONCILIATION OF GAAP TO NON-GAAP DATA
FOR THE THREE MONTHS ENDED MARCH 31, 2020 (Unaudited, in thousands except percentages and per share amounts)
GAAP
Stock-based compensation
expense
Other cost and operating
expenses (1) Non-
GAAP Total revenue $ 41,230 $ — $ — $ 41,230 Cost of revenue 10,110 (422) (956) 8,732
Gross profit 31,120 422 956 32,498 Gross margin 75.5% 1.0% 2.3% 78.8%
Operating expenses Research and development 13,969 (1,466) 280 12,783 Sales and marketing 11,802 (767) 506 11,541 General and administrative 15,064 (2,430) (133) 12,501
Loss from operations (9,715) 5,085 303 (4,327) Other income, net 1,397 — — 1,397
Loss before provision for income taxes (8,318) 5,085 303 (2,930) Provision for income taxes 1 — — 1
Net loss $ (8,319) $ 5,085 $ 303 $ (2,931)
Net loss per share attributable to common stockholders, basic and diluted (2) $ (0.11) $ (0.04)
Weighted-average number of common shares used to compute net loss per share attributable to common stockholders, basic and diluted 72,379 72,379
(1) Other cost and operating expenses adjustments consist of depreciation and amortization expense of $1.1 million; offset by capitalization of contract and service costs (net of amortization) of $797,000.
(2) GAAP net loss per share attributable to common stockholders, basic and diluted $ (0.11)
Stock-based compensation expense 0.07 Depreciation and amortization and other expense adjustments — Non-GAAP net loss per share attributable to common stockholders, basic and diluted $ (0.04)
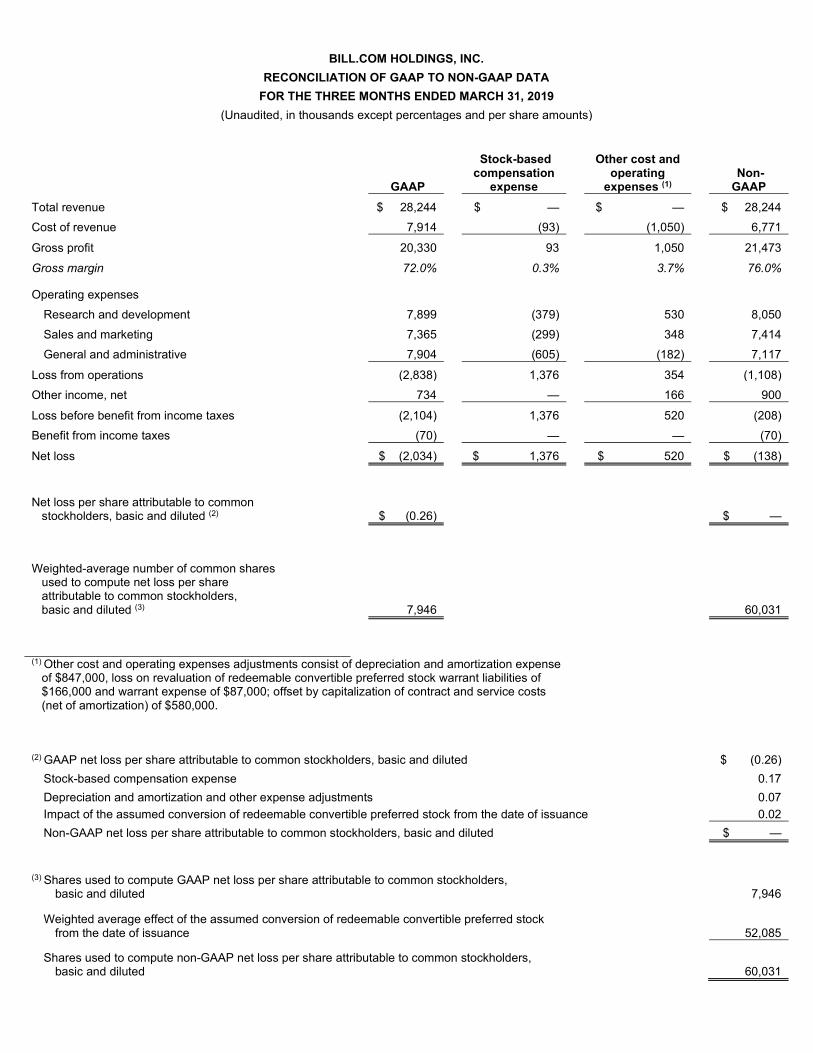
BILL.COM HOLDINGS, INC. RECONCILIATION OF GAAP TO NON-GAAP DATA
FOR THE THREE MONTHS ENDED MARCH 31, 2019 (Unaudited, in thousands except percentages and per share amounts)
GAAP
Stock-based compensation
expense
Other cost and operating
expenses (1) Non-GAAP
Total revenue $ 28,244 $ — $ — $ 28,244 Cost of revenue 7,914 (93) (1,050) 6,771
Gross profit 20,330 93 1,050 21,473 Gross margin 72.0% 0.3% 3.7% 76.0%
Operating expenses Research and development 7,899 (379) 530 8,050 Sales and marketing 7,365 (299) 348 7,414 General and administrative 7,904 (605) (182) 7,117
Loss from operations (2,838) 1,376 354 (1,108) Other income, net 734 — 166 900
Loss before benefit from income taxes (2,104) 1,376 520 (208) Benefit from income taxes (70) — — (70)
Net loss $ (2,034) $ 1,376 $ 520 $ (138)
Net loss per share attributable to common stockholders, basic and diluted (2) $ (0.26) $ —
Weighted-average number of common shares used to compute net loss per share attributable to common stockholders, basic and diluted (3) 7,946 60,031
(1) Other cost and operating expenses adjustments consist of depreciation and amortization expense of $847,000, loss on revaluation of redeemable convertible preferred stock warrant liabilities of $166,000 and warrant expense of $87,000; offset by capitalization of contract and service costs (net of amortization) of $580,000.
(2) GAAP net loss per share attributable to common stockholders, basic and diluted $ (0.26)
Stock-based compensation expense 0.17 Depreciation and amortization and other expense adjustments 0.07 Impact of the assumed conversion of redeemable convertible preferred stock from the date of issuance 0.02 Non-GAAP net loss per share attributable to common stockholders, basic and diluted $ —
(3) Shares used to compute GAAP net loss per share attributable to common stockholders, basic and diluted 7,946
Weighted average effect of the assumed conversion of redeemable convertible preferred stock from the date of issuance 52,085
Shares used to compute non-GAAP net loss per share attributable to common stockholders, basic and diluted 60,031
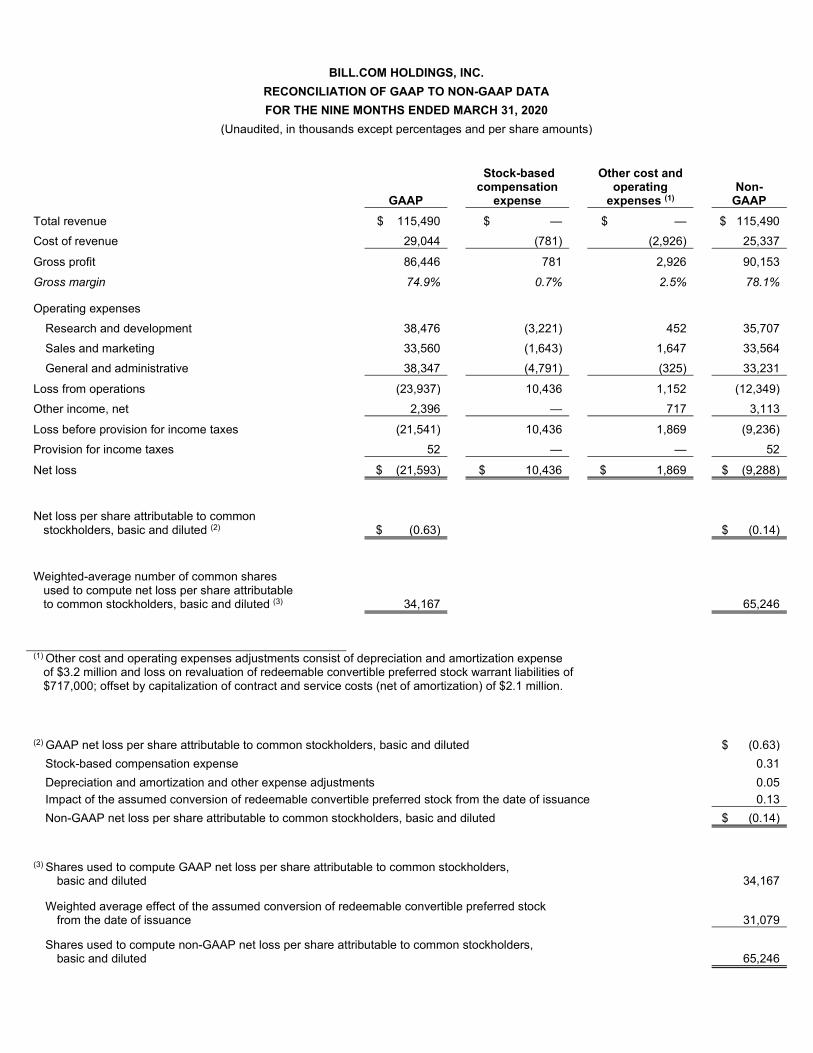
BILL.COM HOLDINGS, INC. RECONCILIATION OF GAAP TO NON-GAAP DATA FOR THE NINE MONTHS ENDED MARCH 31, 2020
(Unaudited, in thousands except percentages and per share amounts)
GAAP
Stock-based compensation
expense
Other cost and operating
expenses (1) Non-
GAAP Total revenue $ 115,490 $ — $ — $ 115,490 Cost of revenue 29,044 (781) (2,926) 25,337
Gross profit 86,446 781 2,926 90,153 Gross margin 74.9% 0.7% 2.5% 78.1%
Operating expenses Research and development 38,476 (3,221) 452 35,707 Sales and marketing 33,560 (1,643) 1,647 33,564 General and administrative 38,347 (4,791) (325) 33,231
Loss from operations (23,937) 10,436 1,152 (12,349) Other income, net 2,396 — 717 3,113
Loss before provision for income taxes (21,541) 10,436 1,869 (9,236) Provision for income taxes 52 — — 52
Net loss $ (21,593) $ 10,436 $ 1,869 $ (9,288)
Net loss per share attributable to common stockholders, basic and diluted (2) $ (0.63) $ (0.14)
Weighted-average number of common shares used to compute net loss per share attributable to common stockholders, basic and diluted (3) 34,167 65,246
(1) Other cost and operating expenses adjustments consist of depreciation and amortization expense of $3.2 million and loss on revaluation of redeemable convertible preferred stock warrant liabilities of $717,000; offset by capitalization of contract and service costs (net of amortization) of $2.1 million.
(2) GAAP net loss per share attributable to common stockholders, basic and diluted $ (0.63)
Stock-based compensation expense 0.31 Depreciation and amortization and other expense adjustments 0.05 Impact of the assumed conversion of redeemable convertible preferred stock from the date of issuance 0.13 Non-GAAP net loss per share attributable to common stockholders, basic and diluted $ (0.14)
(3) Shares used to compute GAAP net loss per share attributable to common stockholders, basic and diluted 34,167
Weighted average effect of the assumed conversion of redeemable convertible preferred stock from the date of issuance 31,079
Shares used to compute non-GAAP net loss per share attributable to common stockholders, basic and diluted 65,246
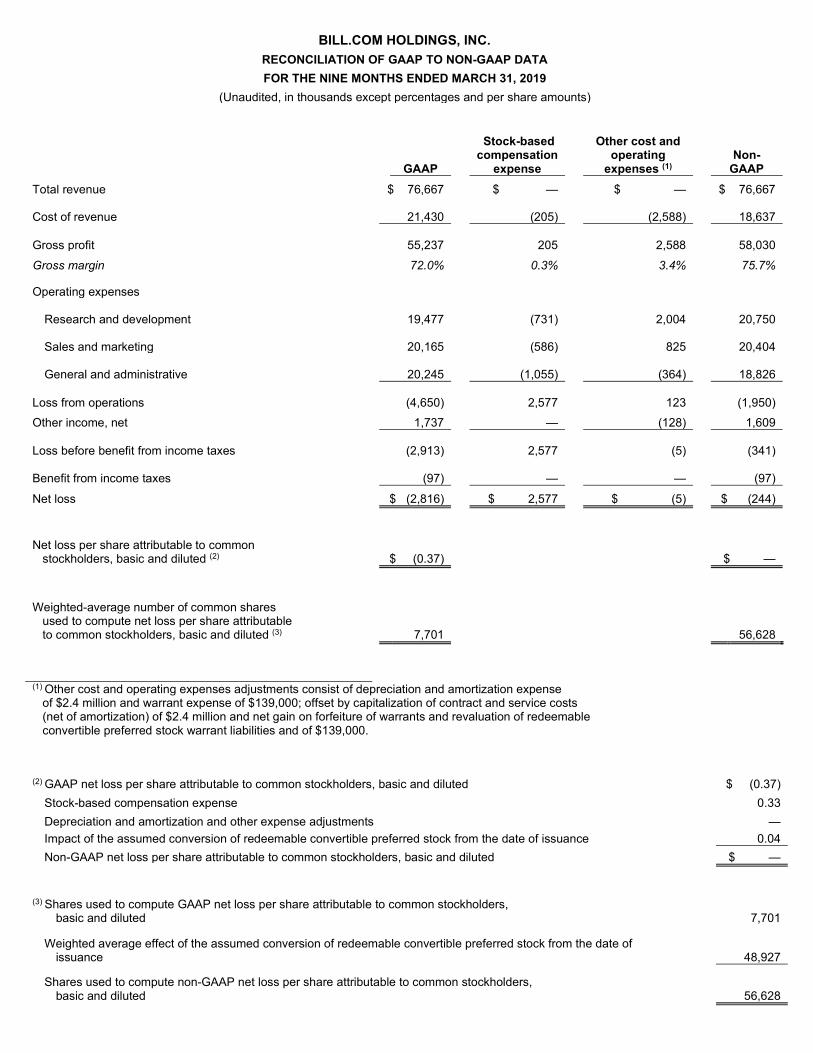
BILL.COM HOLDINGS, INC.
RECONCILIATION OF GAAP TO NON-GAAP DATA FOR THE NINE MONTHS ENDED MARCH 31, 2019
(Unaudited, in thousands except percentages and per share amounts)
GAAP
Stock-based compensation
expense
Other cost and operating
expenses (1) Non-
GAAP Total revenue $ 76,667 $ — $ — $ 76,667
Cost of revenue
21,430 (205) (2,588) 18,637
Gross profit
55,237 205 2,588 58,030 Gross margin 72.0% 0.3% 3.4% 75.7%
Operating expenses
Research and development
19,477 (731) 2,004 20,750
Sales and marketing
20,165 (586) 825 20,404
General and administrative
20,245 (1,055) (364) 18,826
Loss from operations
(4,650) 2,577 123
(1,950) Other income, net 1,737 — (128) 1,609
Loss before benefit from income taxes
(2,913) 2,577 (5)
(341)
Benefit from income taxes
(97) — —
(97)
Net loss $ (2,816) $ 2,577 $ (5) $ (244)
Net loss per share attributable to common stockholders, basic and diluted (2) $ (0.37) $ —
Weighted-average number of common shares used to compute net loss per share attributable to common stockholders, basic and diluted (3) 7,701 56,628
(1) Other cost and operating expenses adjustments consist of depreciation and amortization expense of $2.4 million and warrant expense of $139,000; offset by capitalization of contract and service costs (net of amortization) of $2.4 million and net gain on forfeiture of warrants and revaluation of redeemable convertible preferred stock warrant liabilities and of $139,000.
(2) GAAP net loss per share attributable to common stockholders, basic and diluted $ (0.37)
Stock-based compensation expense 0.33 Depreciation and amortization and other expense adjustments — Impact of the assumed conversion of redeemable convertible preferred stock from the date of issuance 0.04 Non-GAAP net loss per share attributable to common stockholders, basic and diluted $ —
(3) Shares used to compute GAAP net loss per share attributable to common stockholders, basic and diluted 7,701
Weighted average effect of the assumed conversion of redeemable convertible preferred stock from the date of ___ issuance 48,927
Shares used to compute non-GAAP net loss per share attributable to common stockholders, ___ basic and diluted 56,628
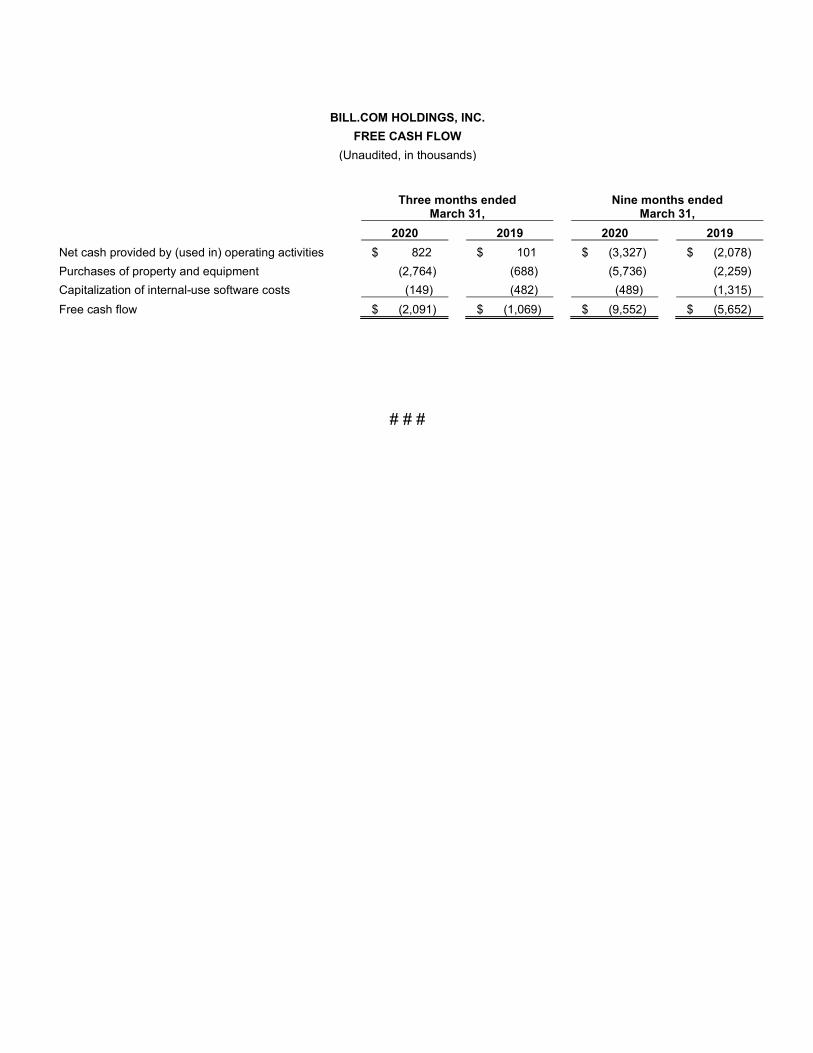
BILL.COM HOLDINGS, INC. FREE CASH FLOW
(Unaudited, in thousands)
Three months ended
March 31, Nine months ended
March 31, 2020 2019 2020 2019 Net cash provided by (used in) operating activities $ 822 $ 101 $ (3,327) $ (2,078) Purchases of property and equipment (2,764) (688) (5,736) (2,259) Capitalization of internal-use software costs (149) (482) (489) (1,315) Free cash flow $ (2,091) $ (1,069) $ (9,552) $ (5,652)
# # #