Embed Size (px)
Citation preview

Binary Decision DiagramsStatic Timing Analysis
ECE 5775 (Fall’17)High-Level Digital Design Automation
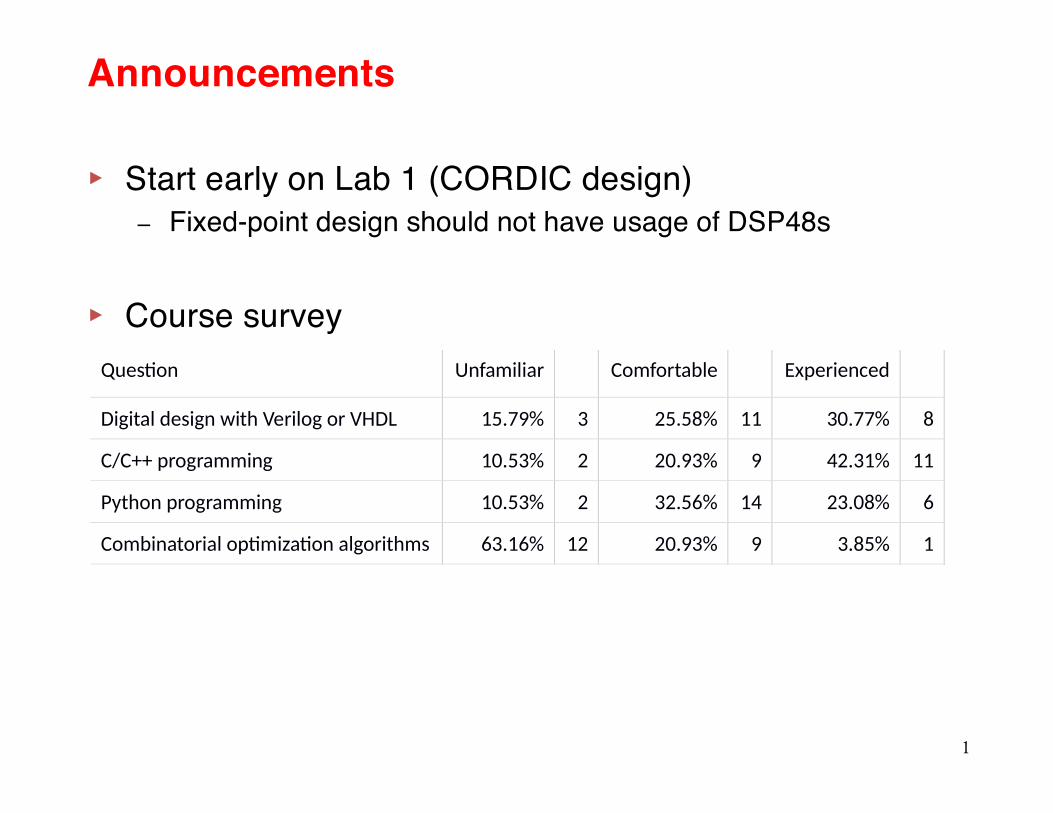
▸ Start early on Lab 1 (CORDIC design)– Fixed-point design should not have usage of DSP48s
▸ Course survey
1
Announcements
Q5 - Background knowledge
Ques�on Unfamiliar Comfortable Experienced
Digital design with Verilog or VHDL 15.79% 3 25.58% 11 30.77% 8
C/C++ programming 10.53% 2 20.93% 9 42.31% 11
Python programming 10.53% 2 32.56% 14 23.08% 6
Combinatorial op�miza�on algorithms 63.16% 12 20.93% 9 3.85% 1
Total Total 19 Total 43 Total 26
# Field Minimum Maximum Mean Std Devia�on Variance Count
1 Digital design with Verilog or VHDL 1.00 3.00 2.23 0.67 0.45 22
2 C/C++ programming 1.00 3.00 2.41 0.65 0.42 22
3 Python programming 1.00 3.00 2.18 0.57 0.33 22
4 Combinatorial op�miza�on algorithms 1.00 3.00 1.50 0.58 0.34 22
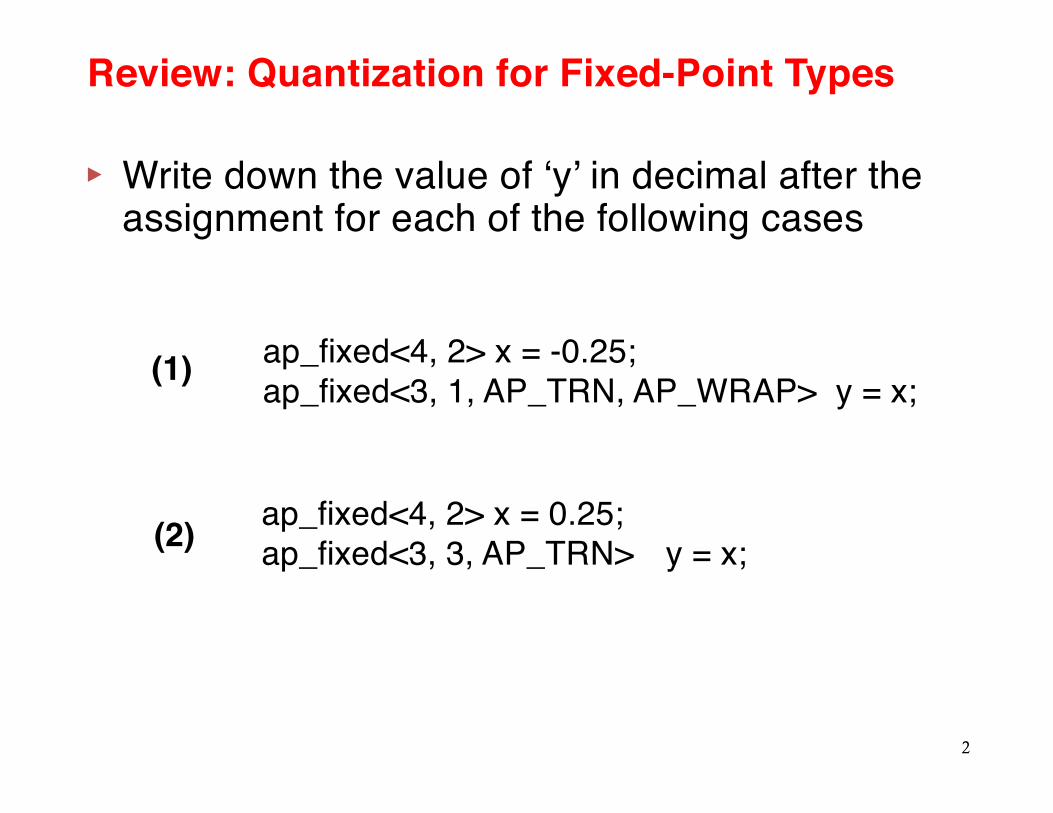
▸ Write down the value of ‘y’ in decimal after the assignment for each of the following cases
2
Review: Quantization for Fixed-Point Types
ap_fixed<4, 2> x = -0.25;ap_fixed<3, 1, AP_TRN, AP_WRAP> y = x;
ap_fixed<4, 2> x = 0.25;ap_fixed<3, 3, AP_TRN> y = x;
(1)
(2)
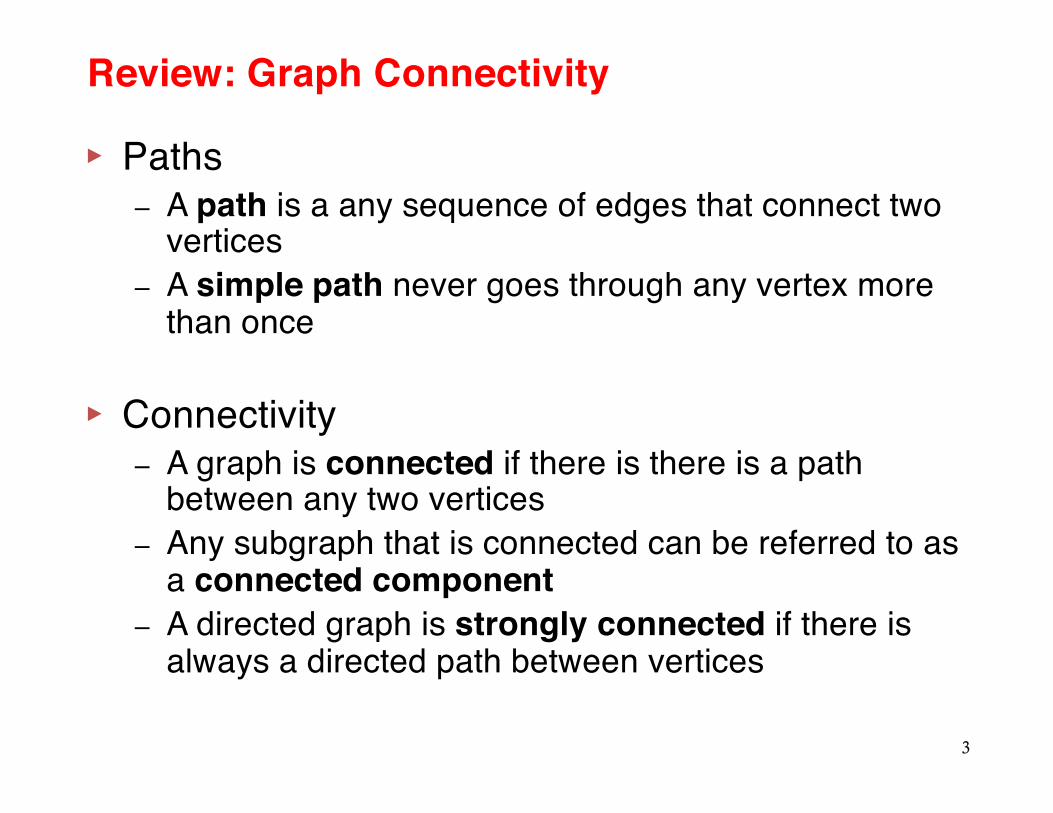
Review: Graph Connectivity
▸ Paths– A path is a any sequence of edges that connect two
vertices– A simple path never goes through any vertex more
than once
▸ Connectivity – A graph is connected if there is there is a path
between any two vertices– Any subgraph that is connected can be referred to as
a connected component– A directed graph is strongly connected if there is
always a directed path between vertices
3
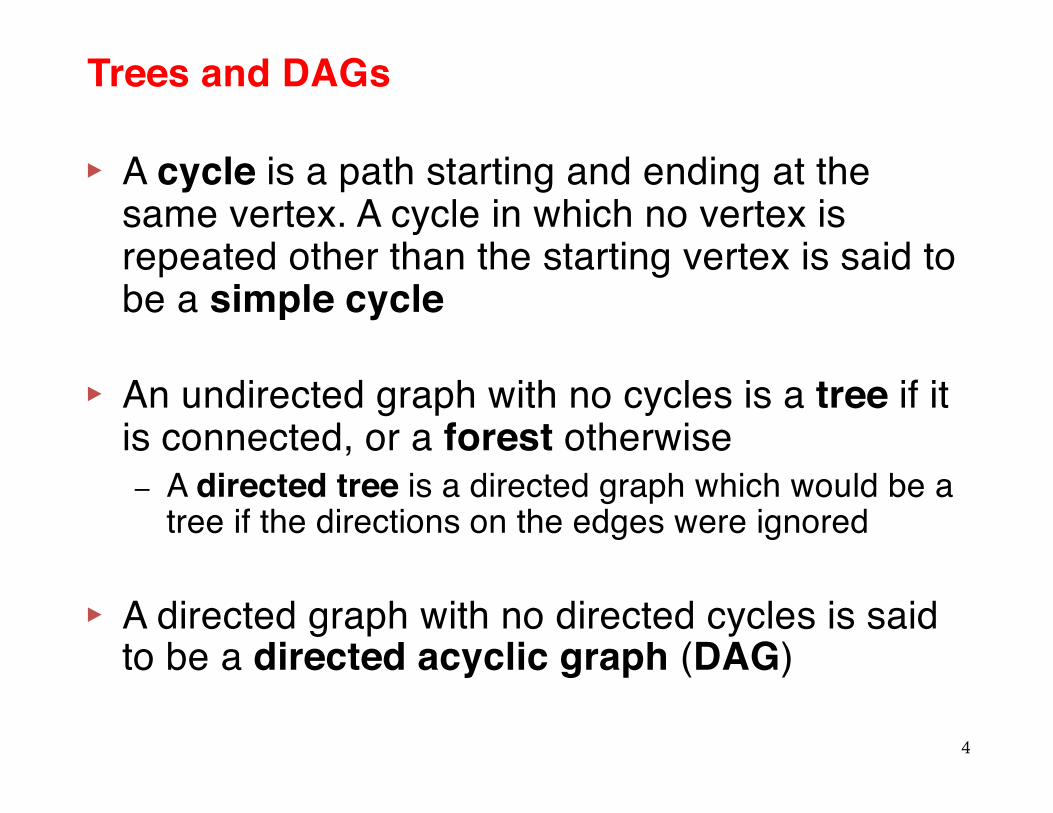
Trees and DAGs
▸ A cycle is a path starting and ending at the same vertex. A cycle in which no vertex is repeated other than the starting vertex is said to be a simple cycle
▸ An undirected graph with no cycles is a tree if it is connected, or a forest otherwise– A directed tree is a directed graph which would be a
tree if the directions on the edges were ignored
▸ A directed graph with no directed cycles is said to be a directed acyclic graph (DAG)
4
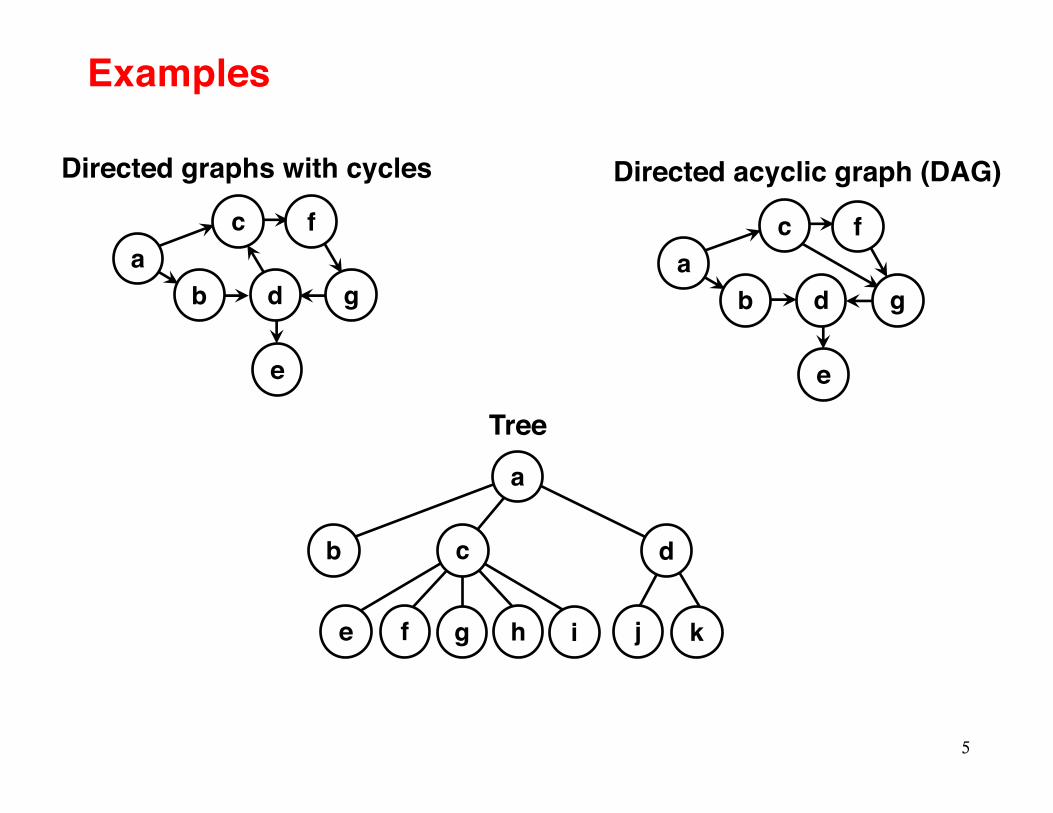
Examples
5
ca
b d
e
f
g
ca
b d
e
f
g
Directed graphs with cycles Directed acyclic graph (DAG)
a
b c d
e f g h i j k
Tree
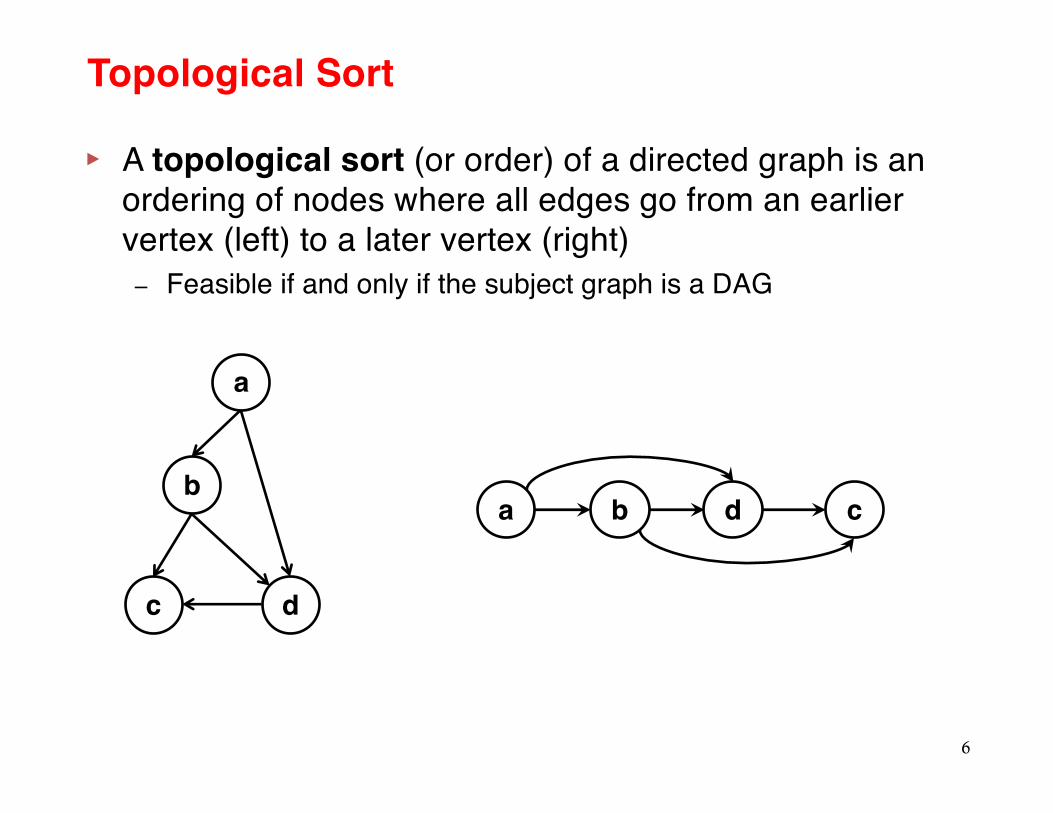
▸ A topological sort (or order) of a directed graph is an ordering of nodes where all edges go from an earlier vertex (left) to a later vertex (right) – Feasible if and only if the subject graph is a DAG
6
Topological Sort
a
c d
ba cdb
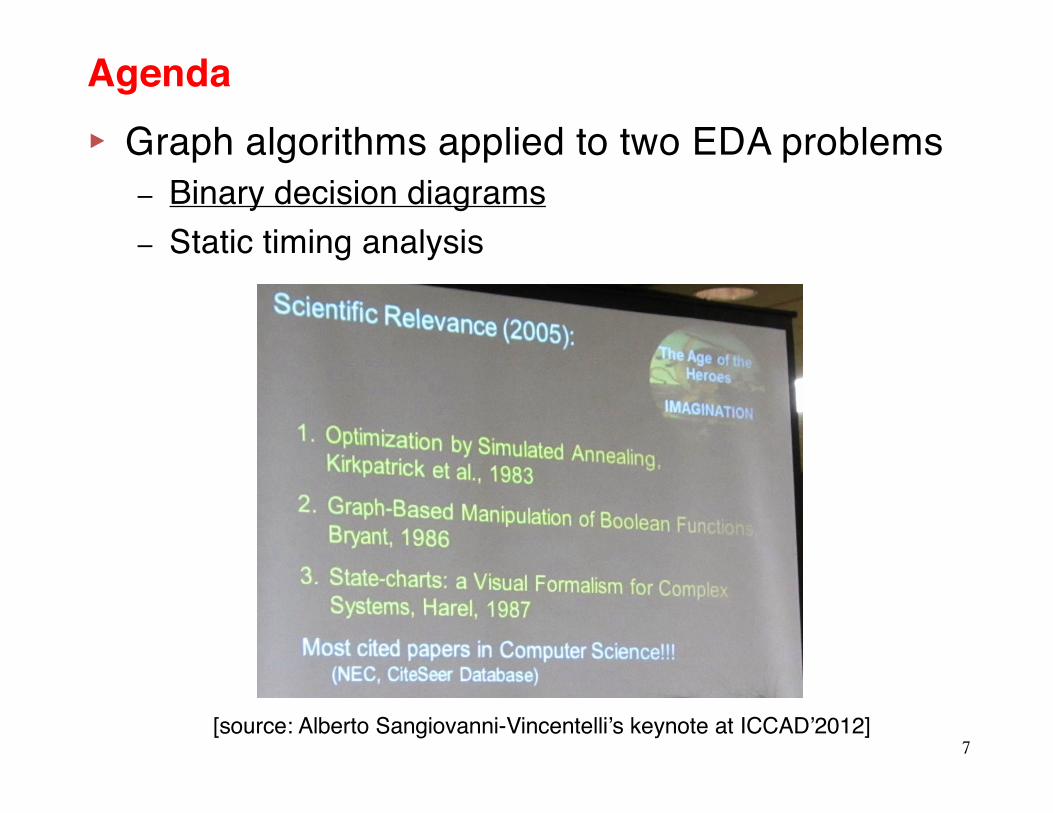
▸ Graph algorithms applied to two EDA problems– Binary decision diagrams– Static timing analysis
7
Agenda
[source: Alberto Sangiovanni-Vincentelli’s keynote at ICCAD’2012]
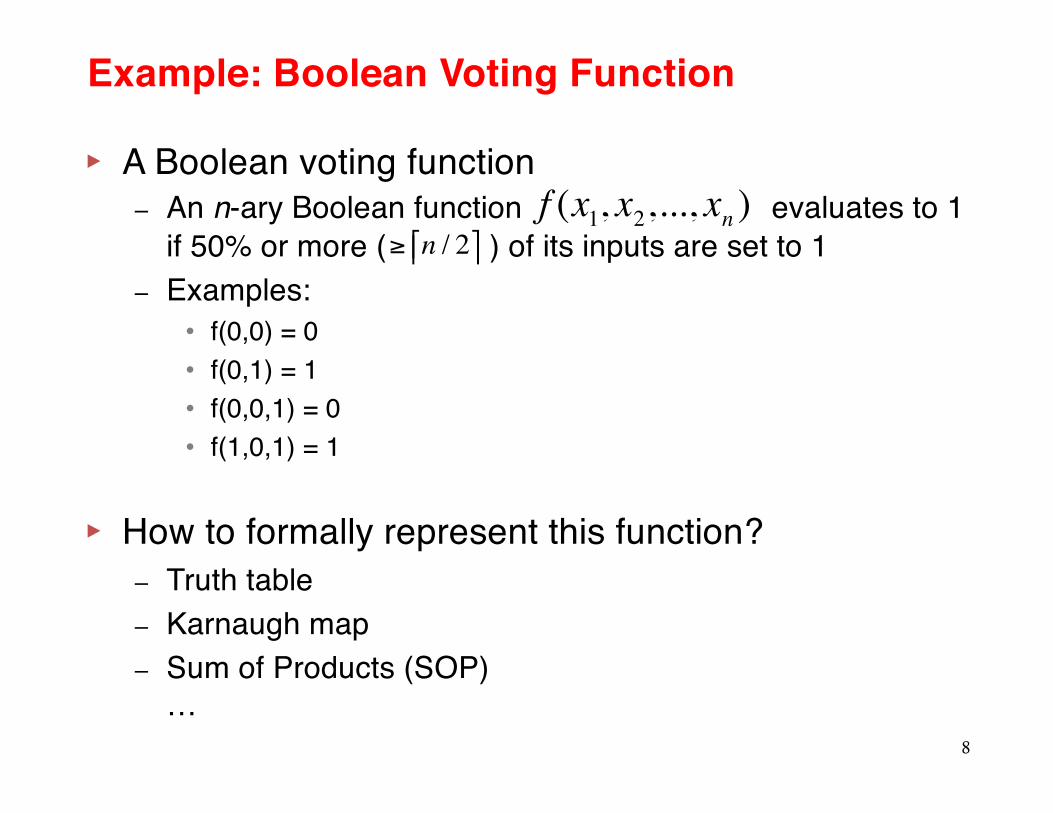
Example: Boolean Voting Function
▸ A Boolean voting function– An n-ary Boolean function evaluates to 1
if 50% or more ( ) of its inputs are set to 1– Examples:
• f(0,0) = 0• f(0,1) = 1• f(0,0,1) = 0• f(1,0,1) = 1
▸ How to formally represent this function? – Truth table– Karnaugh map– Sum of Products (SOP)
… 8
f (x1, x2,..., xn )≥ n / 2"# $%
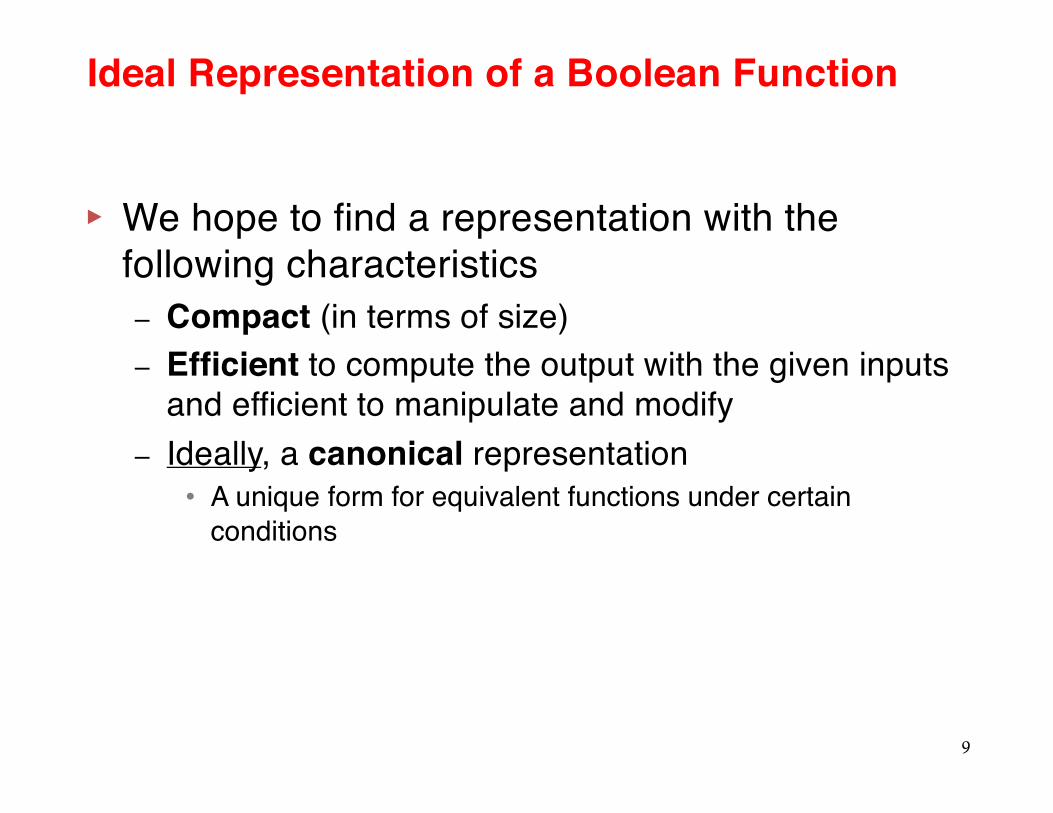
Ideal Representation of a Boolean Function
▸ We hope to find a representation with the following characteristics– Compact (in terms of size)– Efficient to compute the output with the given inputs
and efficient to manipulate and modify– Ideally, a canonical representation
• A unique form for equivalent functions under certain conditions
9
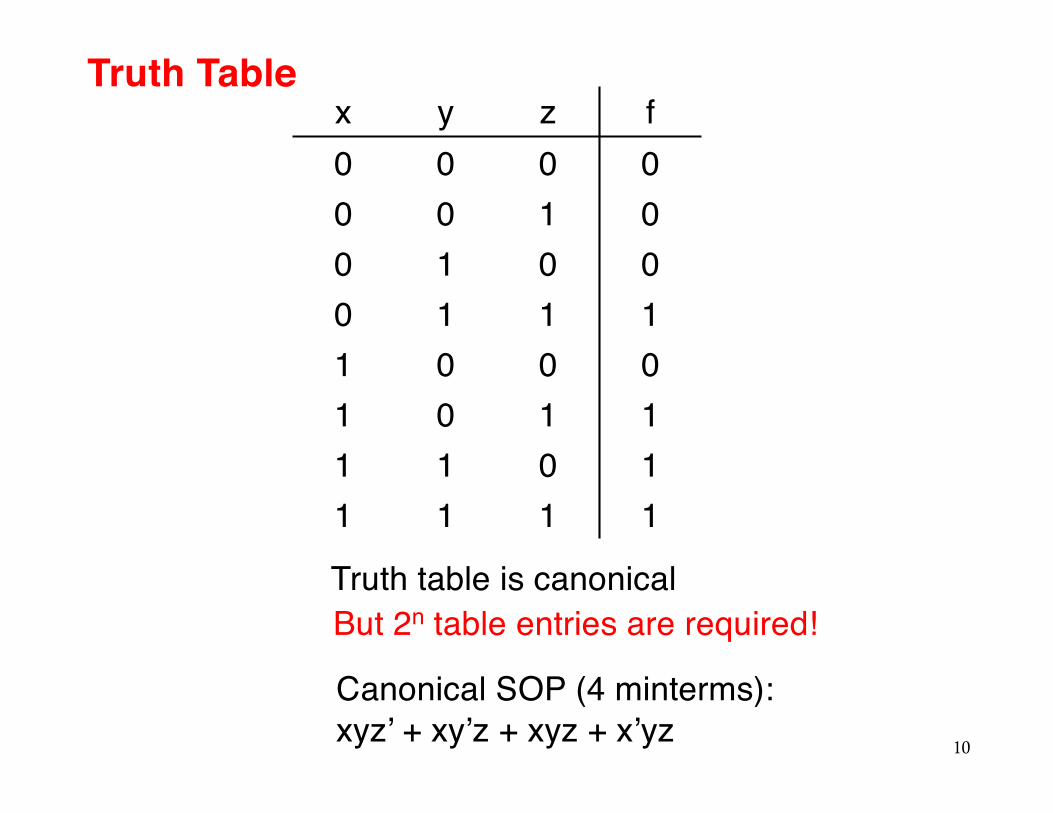
Truth Table
10
x y z f0 0 0 00 0 1 00 1 0 00 1 1 11 0 0 01 0 1 11 1 0 11 1 1 1
But 2n table entries are required!Truth table is canonical
Canonical SOP (4 minterms): xyz’ + xy’z + xyz + x’yz
11
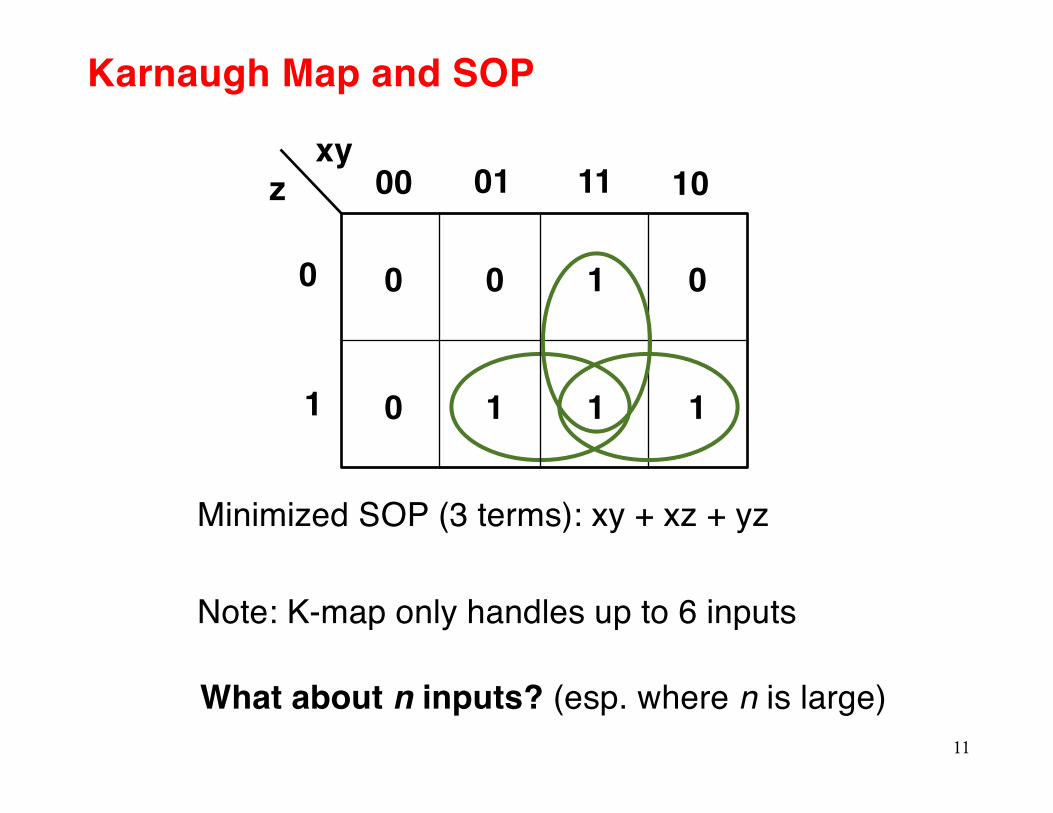
Karnaugh Map and SOP
0 0 1 0
0 1 1 1
00 01 11 10
0
1
xyz
What about n inputs? (esp. where n is large)
Minimized SOP (3 terms): xy + xz + yz
Note: K-map only handles up to 6 inputs
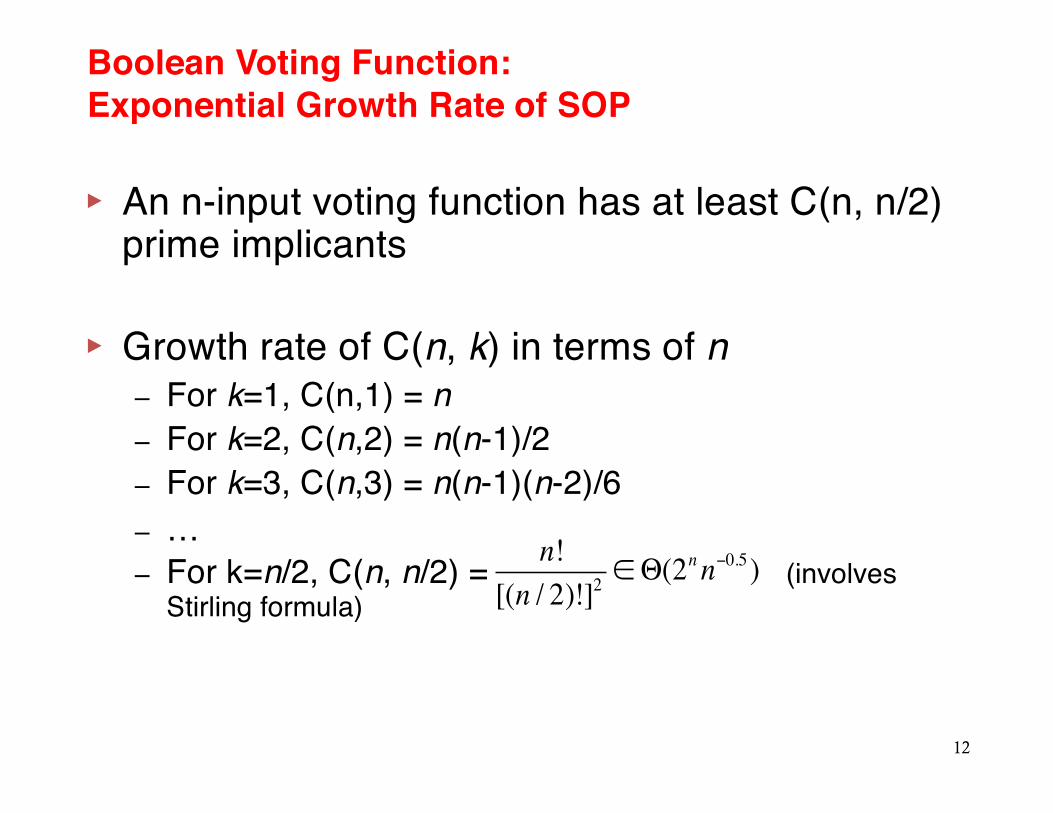
Boolean Voting Function:Exponential Growth Rate of SOP
▸ An n-input voting function has at least C(n, n/2) prime implicants
▸ Growth rate of C(n, k) in terms of n– For k=1, C(n,1) = n– For k=2, C(n,2) = n(n-1)/2– For k=3, C(n,3) = n(n-1)(n-2)/6– …– For k=n/2, C(n, n/2) = (involves
Stirling formula)
12
n![(n / 2)!]2
∈Θ(2n n−0.5 )
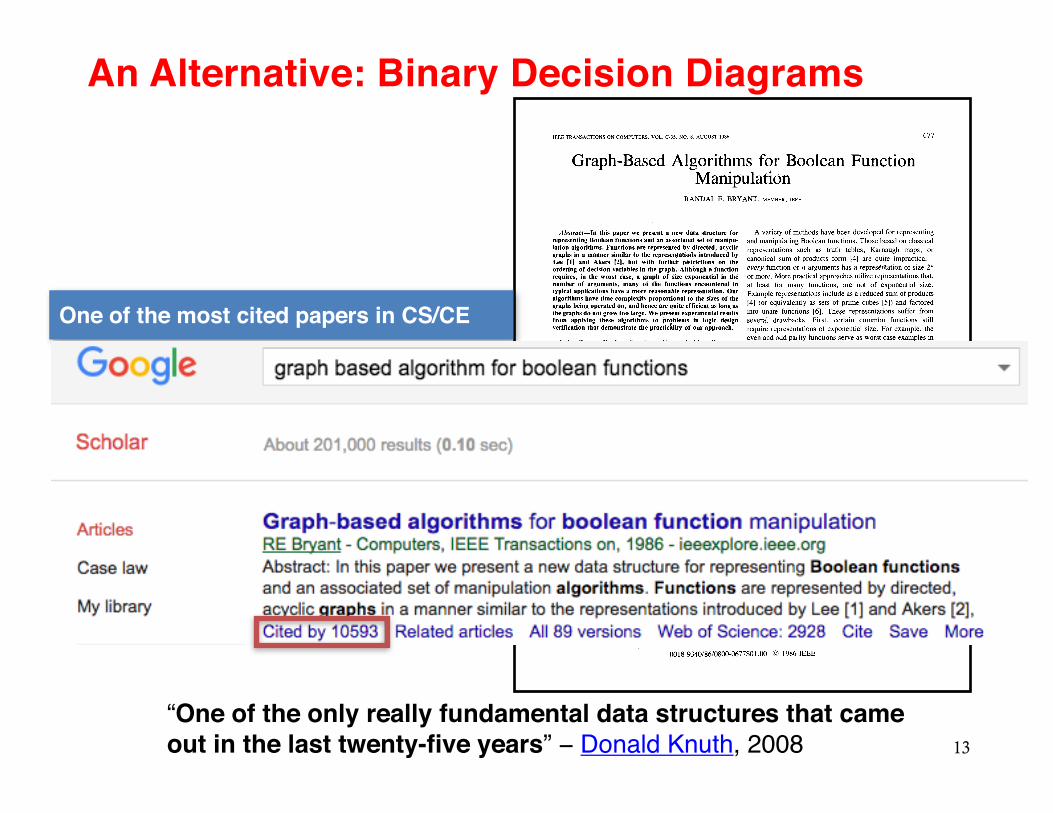
“One of the only really fundamental data structures that came out in the last twenty-five years” − Donald Knuth, 2008 13
An Alternative: Binary Decision Diagrams
One of the most cited papers in CS/CE
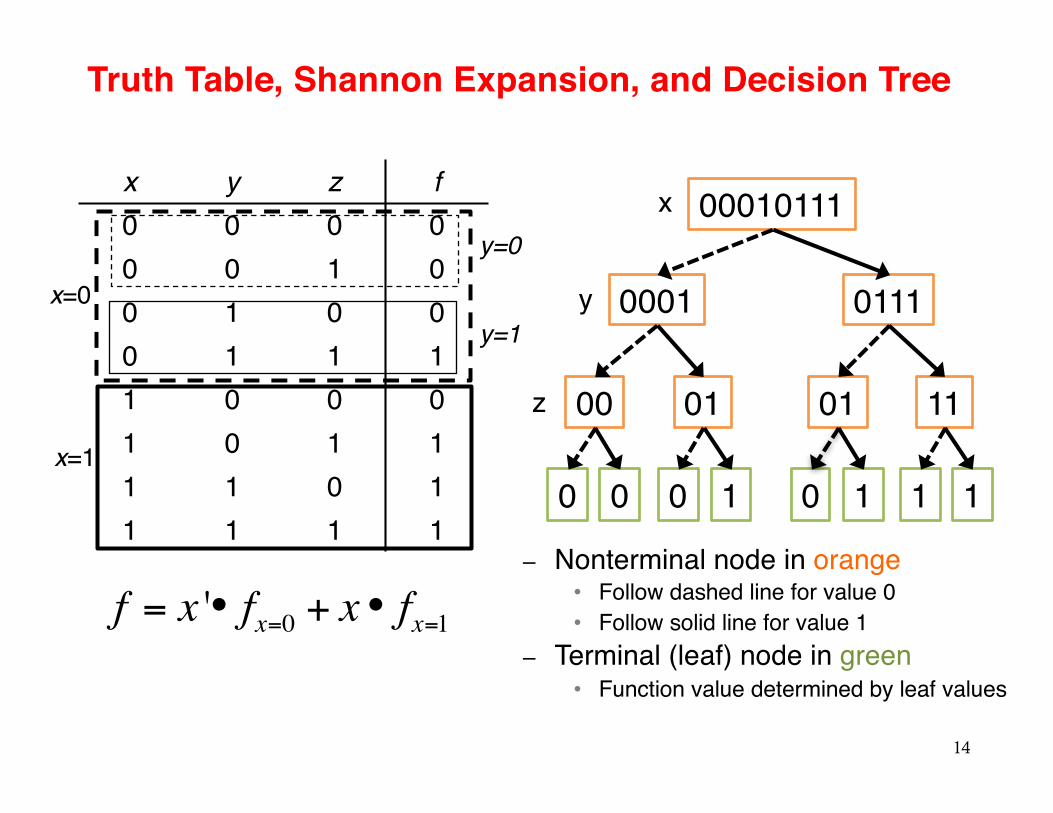
Truth Table, Shannon Expansion, and Decision Tree
14
x y z f0 0 0 00 0 1 00 1 0 00 1 1 11 0 0 01 0 1 11 1 0 11 1 1 1
00010111
0001 0111
00 01 01 11
0 0 0 1 0 1 1 1
x
y
z
– Nonterminal node in orange• Follow dashed line for value 0• Follow solid line for value 1
– Terminal (leaf) node in green • Function value determined by leaf values
f = x '• fx=0 + x• fx=1
x=0
x=1
y=0
y=1
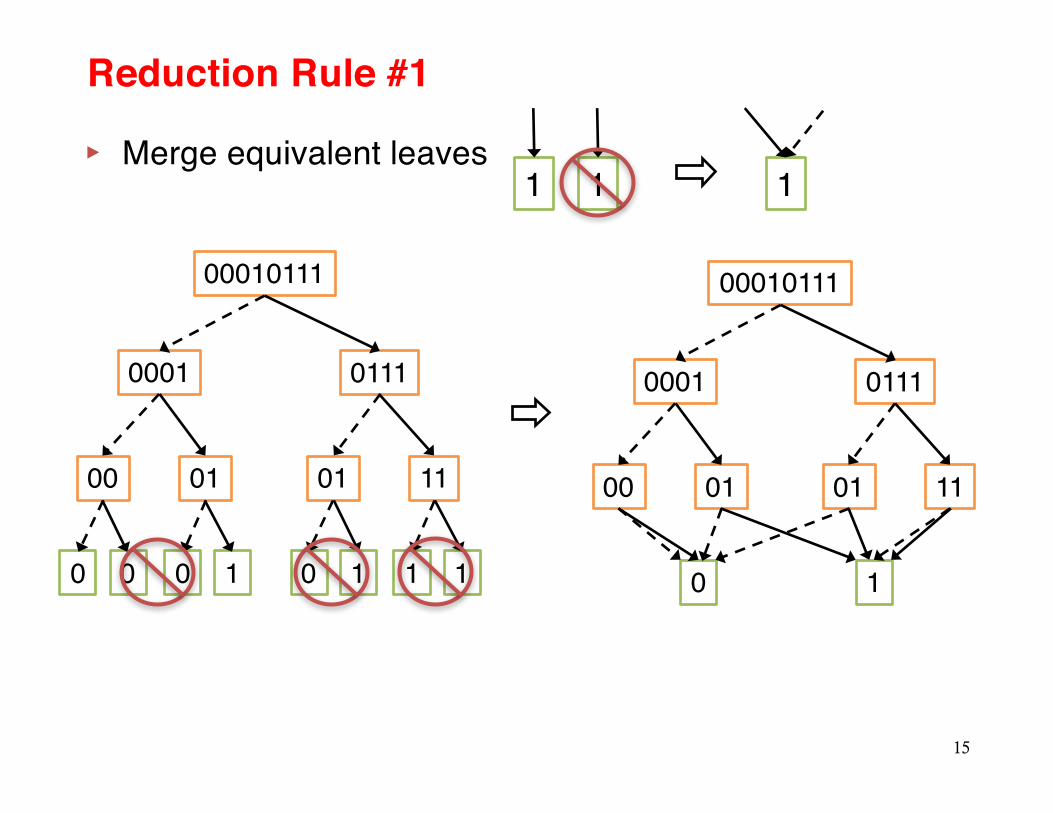
Reduction Rule #1
▸ Merge equivalent leaves
15
00010111
0001 0111
00 01 01 11
0 0 0 1 0 1 1 1
1 1 1
00010111
0001 0111
00 01 01 11
0 1
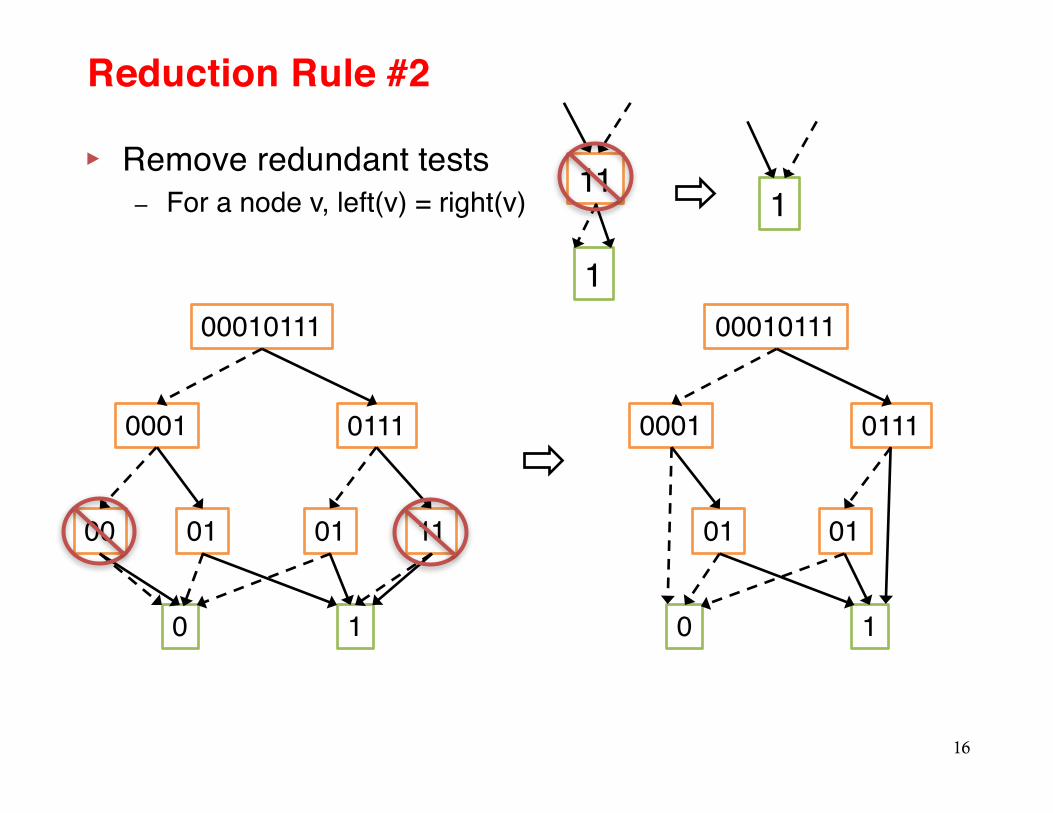
▸ Remove redundant tests– For a node v, left(v) = right(v)
Reduction Rule #2
16
00010111
0001 0111
00 01 01 11
0 1
00010111
0001 0111
01 01
0 1
11
1
1
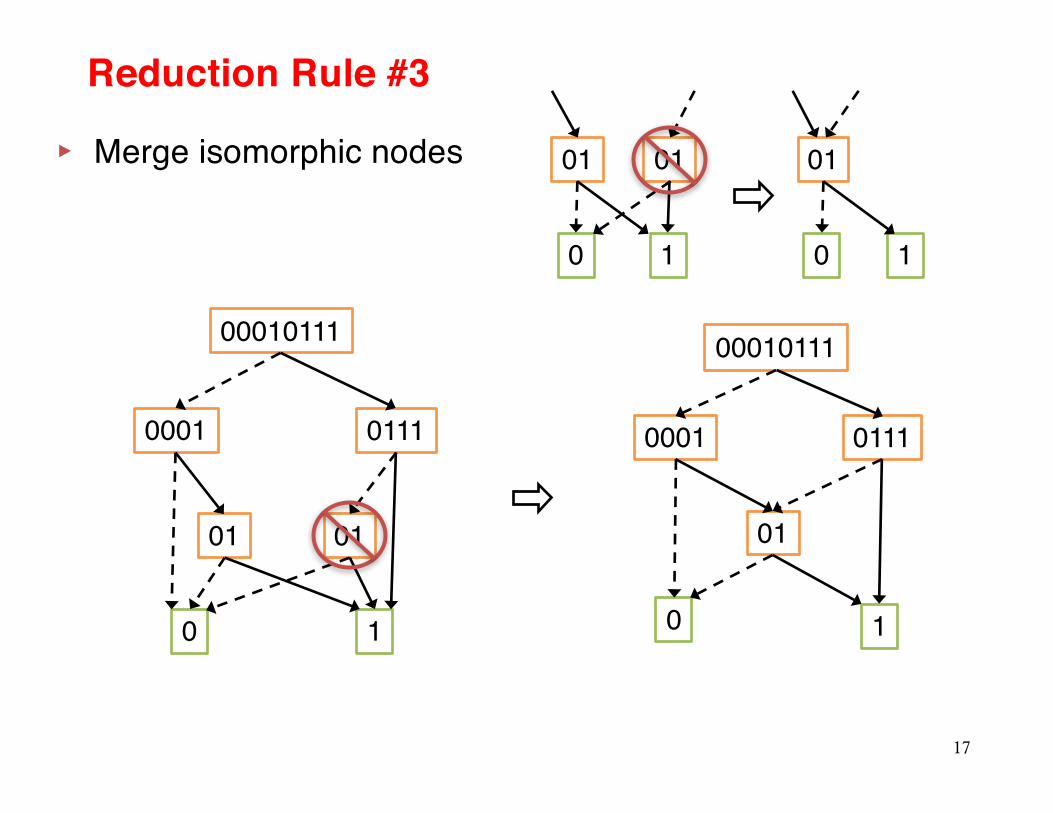
17
00010111
0001 0111
01
0 1
▸ Merge isomorphic nodes
Reduction Rule #3
01
0 1
01 01
0 1
01
00010111
0001 0111
01
0 1
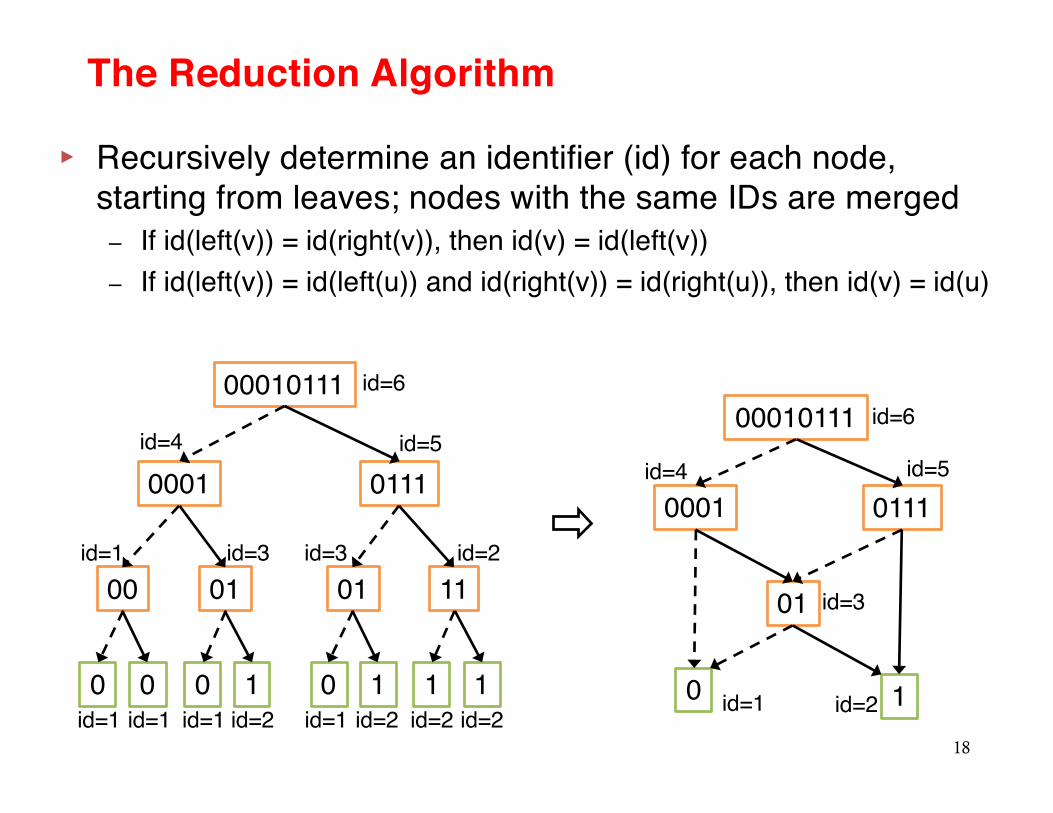
The Reduction Algorithm
18
00010111
0001 0111
00 01 01 11
0 0 0 1 0 1 1 1
▸ Recursively determine an identifier (id) for each node, starting from leaves; nodes with the same IDs are merged– If id(left(v)) = id(right(v)), then id(v) = id(left(v))– If id(left(v)) = id(left(u)) and id(right(v)) = id(right(u)), then id(v) = id(u)
id=1 id=1
id=1 id=3 id=3 id=2
id=1 id=2 id=1 id=2id=2 id=2
id=4 id=5
id=600010111
0001 0111
01
0 1
id=3
id=5id=4
id=6
id=2id=1
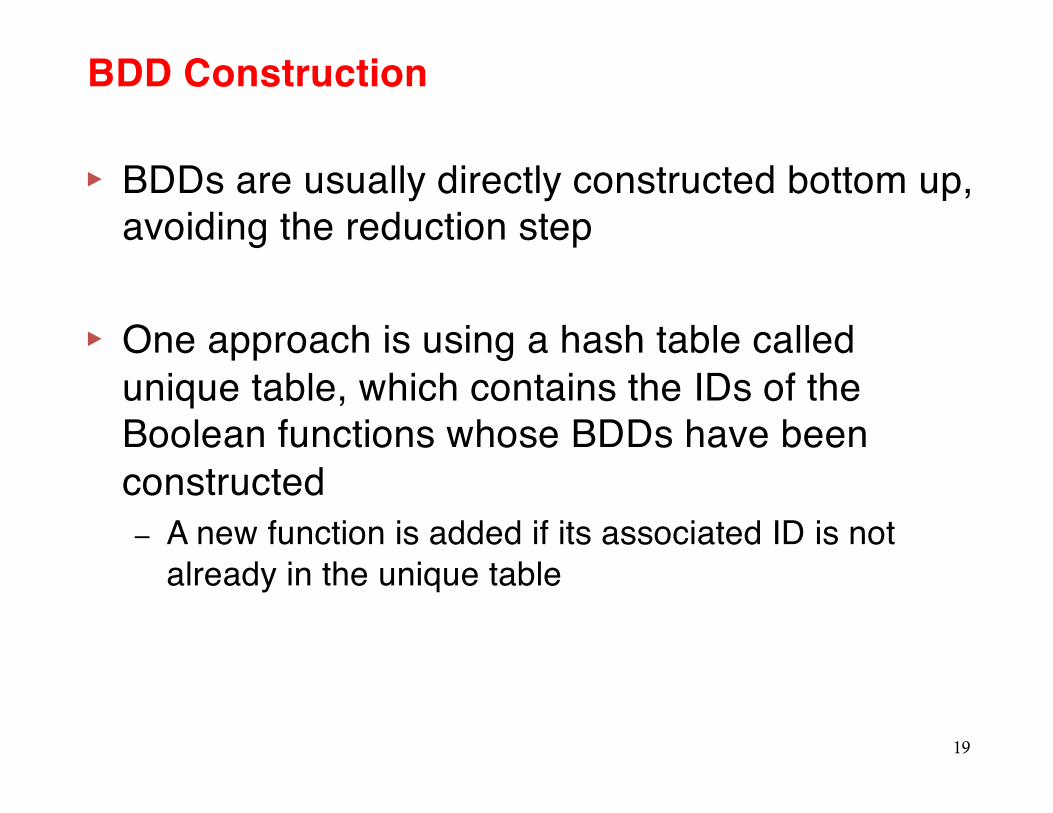
▸ BDDs are usually directly constructed bottom up, avoiding the reduction step
▸ One approach is using a hash table called unique table, which contains the IDs of the Boolean functions whose BDDs have been constructed– A new function is added if its associated ID is not
already in the unique table
19
BDD Construction
BDDs History
▸ Proposed by Lee 1959, Akers 1976– Idea of representing Boolean function as a rooted
DAG with a decision at each vertex
▸ Popularized by Bryant 1986– Further restrictions + efficient algorithms to make a
useful data structure (ROBDD)– BDD = ROBDD since then
20
ROBDDs
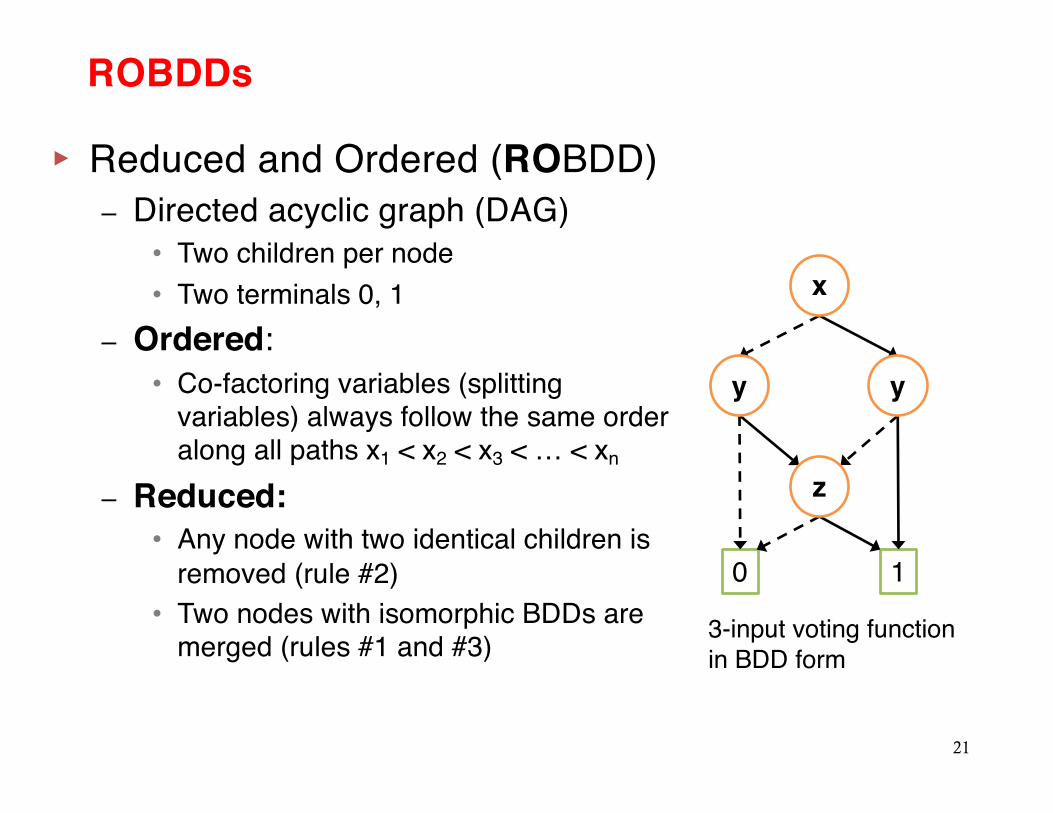
▸ Reduced and Ordered (ROBDD) – Directed acyclic graph (DAG)
• Two children per node• Two terminals 0, 1
– Ordered: • Co-factoring variables (splitting
variables) always follow the same order along all paths x1 < x2 < x3 < … < xn
– Reduced: • Any node with two identical children is
removed (rule #2)• Two nodes with isomorphic BDDs are
merged (rules #1 and #3)
21
3-input voting function in BDD form
0 1
y y
x
z
More on Variable Ordering
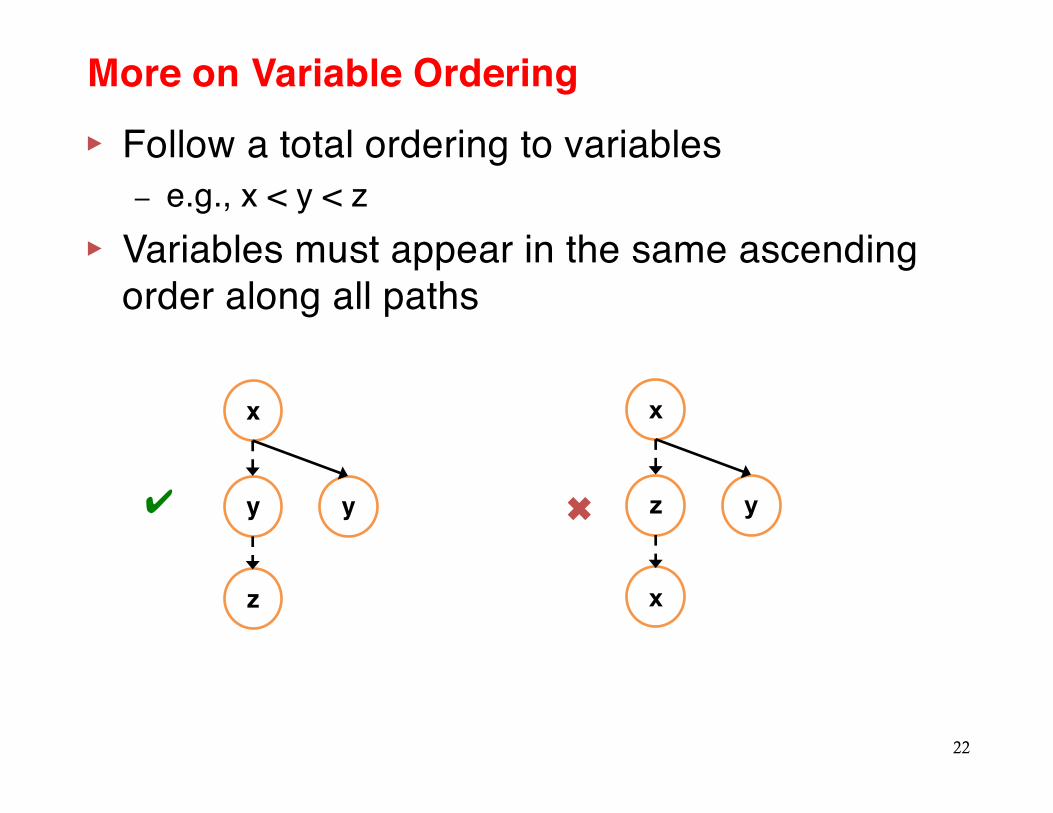
▸ Follow a total ordering to variables– e.g., x < y < z
▸ Variables must appear in the same ascending order along all paths
22
x
y
z
y
x
z
x
y✔ ✖
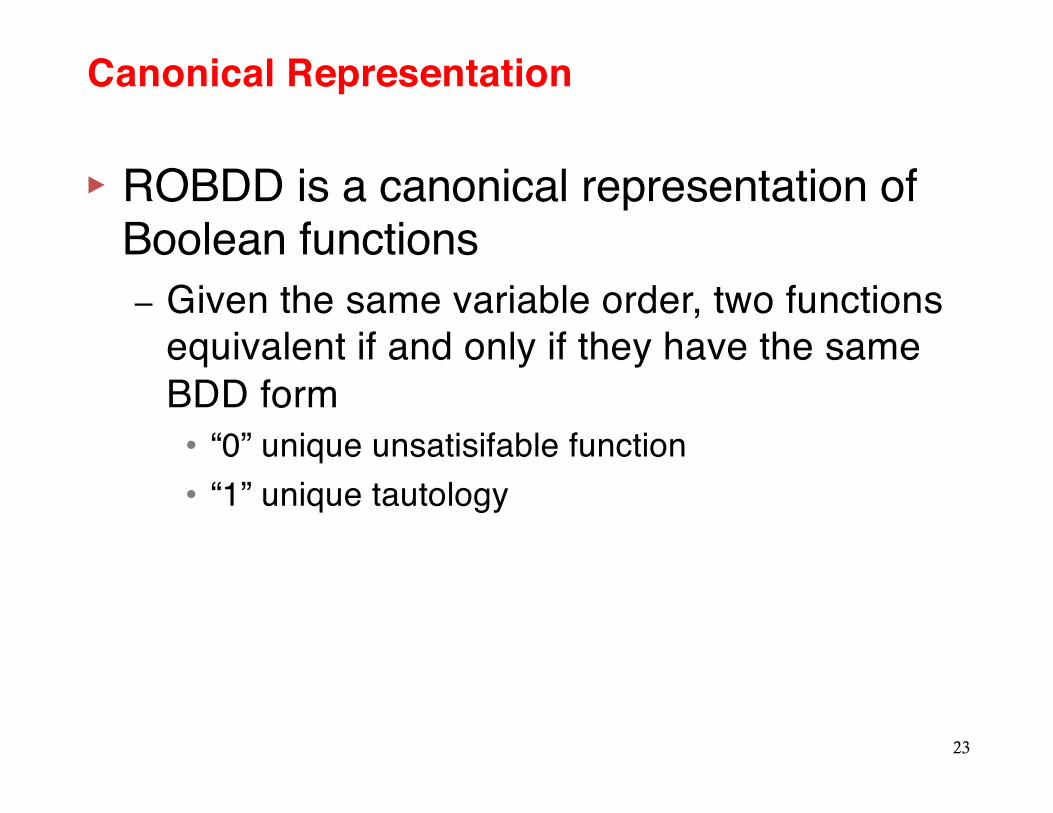
Canonical Representation
▸ ROBDD is a canonical representation of Boolean functions – Given the same variable order, two functions
equivalent if and only if they have the same BDD form• “0” unique unsatisifable function• “1” unique tautology
23
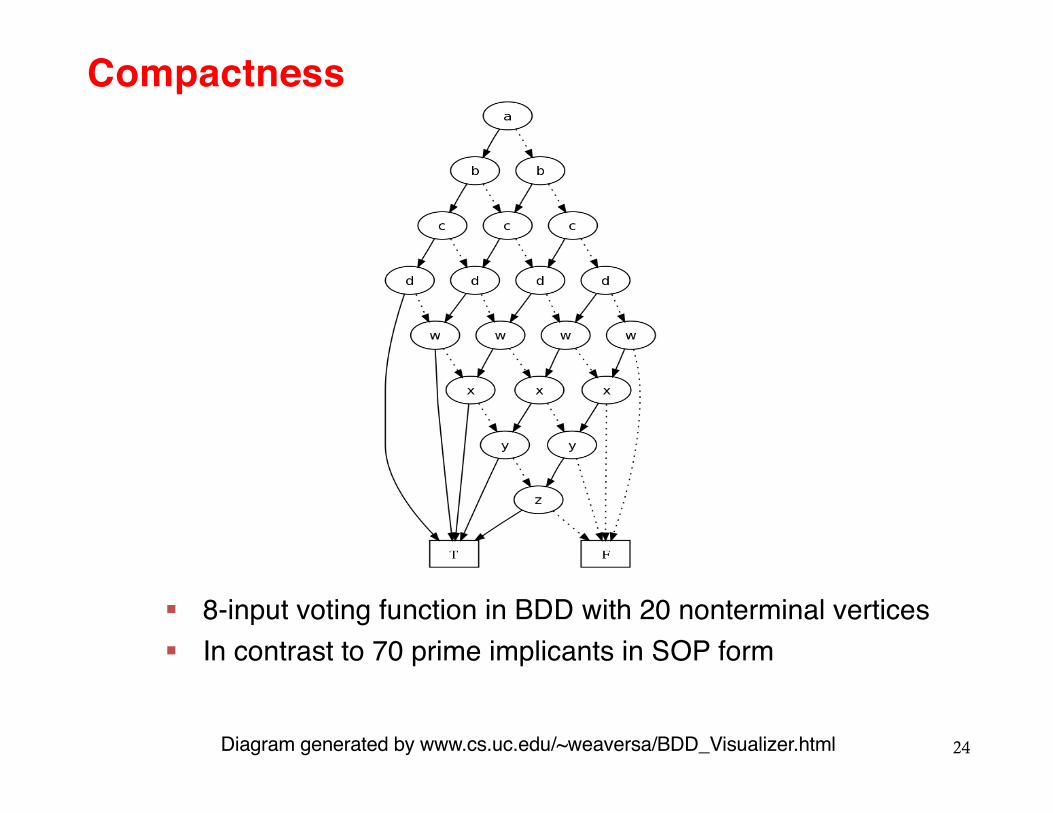
Compactness
24Diagram generated by www.cs.uc.edu/~weaversa/BDD_Visualizer.html
§ 8-input voting function in BDD with 20 nonterminal vertices § In contrast to 70 prime implicants in SOP form
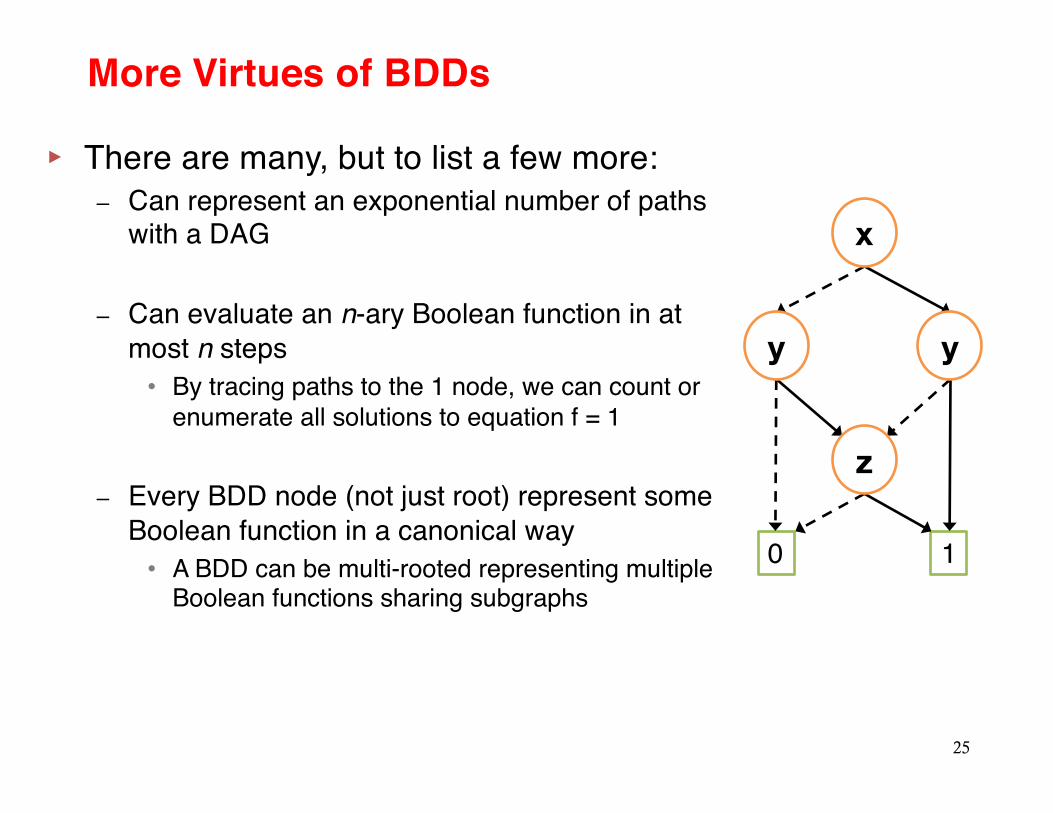
More Virtues of BDDs
▸ There are many, but to list a few more:– Can represent an exponential number of paths
with a DAG
– Can evaluate an n-ary Boolean function in at most n steps• By tracing paths to the 1 node, we can count or
enumerate all solutions to equation f = 1
– Every BDD node (not just root) represent some Boolean function in a canonical way• A BDD can be multi-rooted representing multiple
Boolean functions sharing subgraphs
25
0 1
y y
x
z
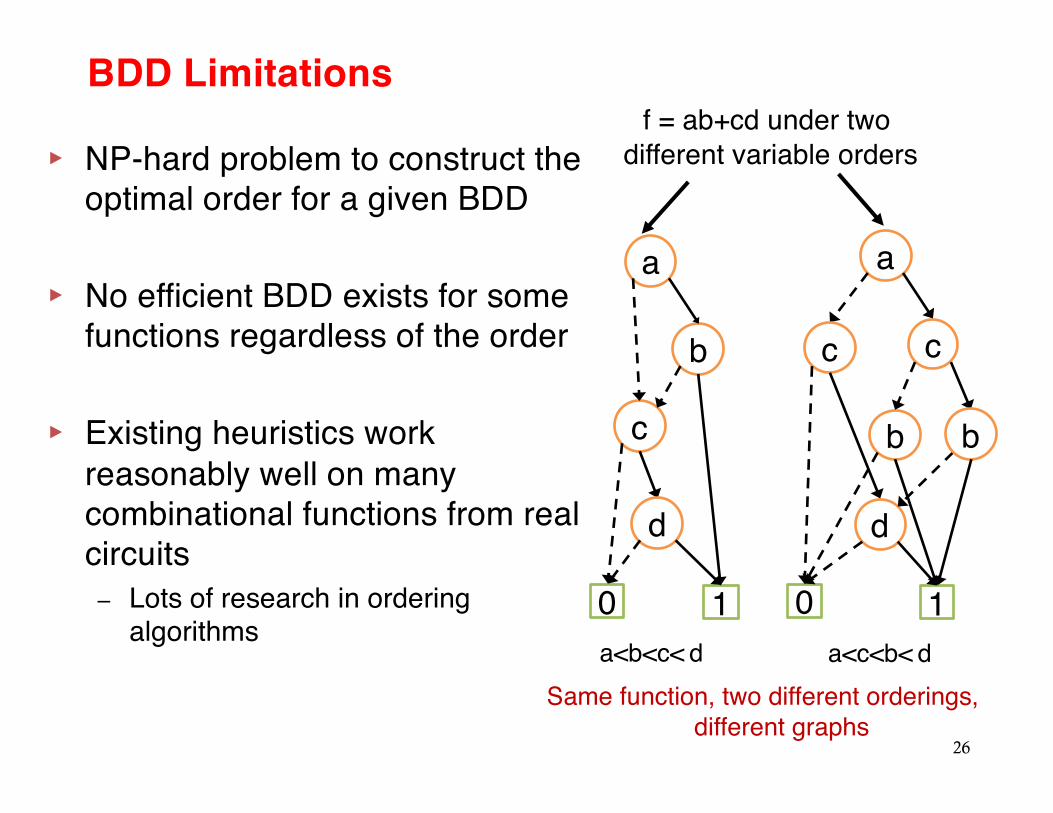
Same function, two different orderings, different graphs
f = ab+cd under two different variable orders
26
a
b
c
10
d
c
b
a<c<b< d
a
c
b
10
d
a<b<c< d
BDD Limitations
▸ NP-hard problem to construct the optimal order for a given BDD
▸ No efficient BDD exists for some functions regardless of the order
▸ Existing heuristics work reasonably well on many combinational functions from real circuits– Lots of research in ordering
algorithms
Static Timing Analysis
▸ In circuit graphs, static timing analysis (STA) refers to the problem of finding the delays from the input pins of the circuit (esp. nodes) to each gate– In sequential circuits, flip-flop (FF) input acts as output pin, FF
output acts as input pin– Max delay of the output pins determines clock period– Critical path is a path with max delay among all paths
▸ Two important terms– Required time: The time that the data signal needs to arrive at
certain endpoint on a path to ensure the timing is met– Arrival time: The time that the data signal actually arrives at certain
endpoint on a path
27
28
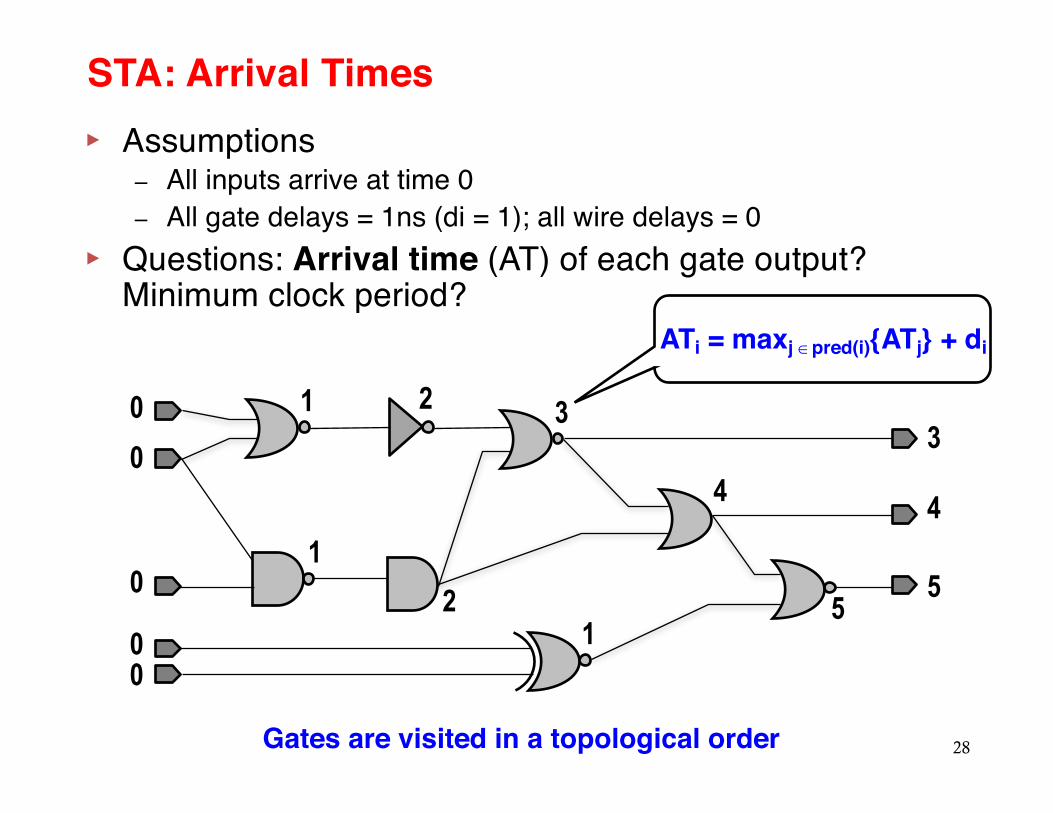
STA: Arrival Times
0
0
0
00
1
1
1
2
2
33
4 4
55
ATi = maxj Îpred(i){ATj} + di
▸ Assumptions – All inputs arrive at time 0 – All gate delays = 1ns (di = 1); all wire delays = 0
▸ Questions: Arrival time (AT) of each gate output? Minimum clock period?
Gates are visited in a topological order
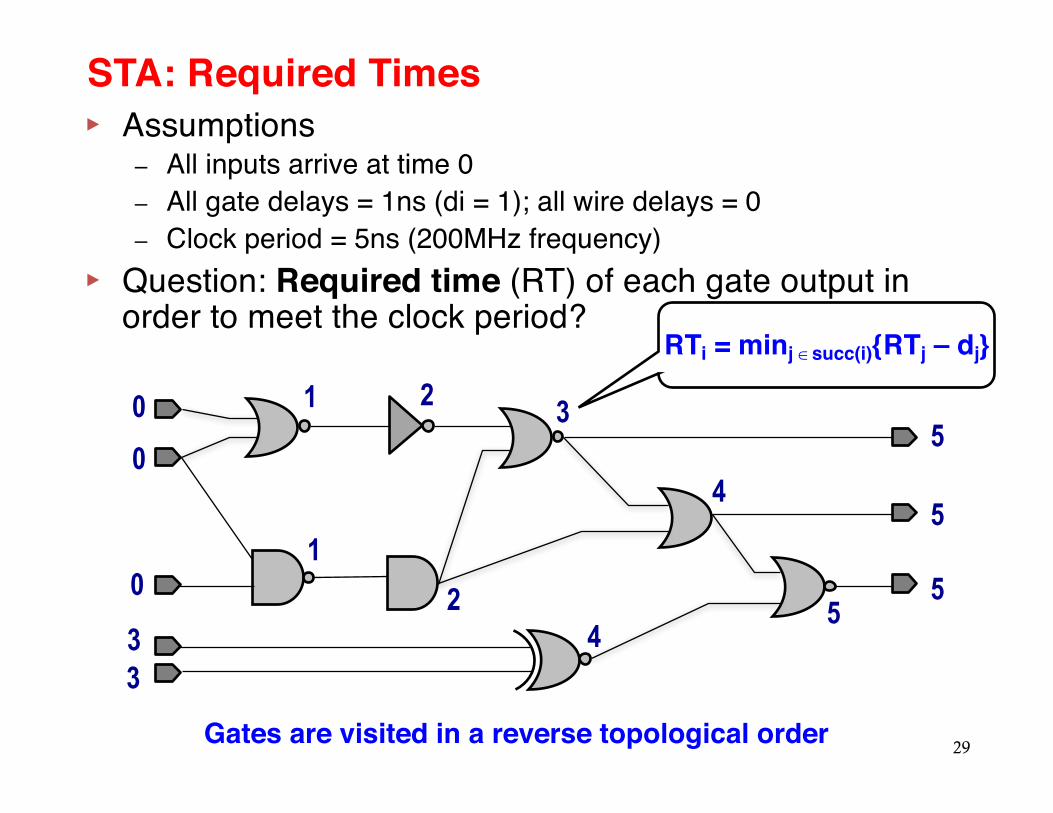
STA: Required Times
29
4
4
5
5
55
00
01
1RTi = minj Îsucc(i){RTj – dj}
2
2
3
33
▸ Assumptions – All inputs arrive at time 0 – All gate delays = 1ns (di = 1); all wire delays = 0 – Clock period = 5ns (200MHz frequency)
▸ Question: Required time (RT) of each gate output in order to meet the clock period?
Gates are visited in a reverse topological order
More on Static Timing Analysis
▸ In addition to the arrival time and required time of each node, we are interested in knowing the slack (= RT - AT) of each node / edge– Negative slacks indicate unsatisfied timing constraints– Positive slacks often present opportunities for additional
(area/power) optimization – Node on the critical path have zero slacks
30
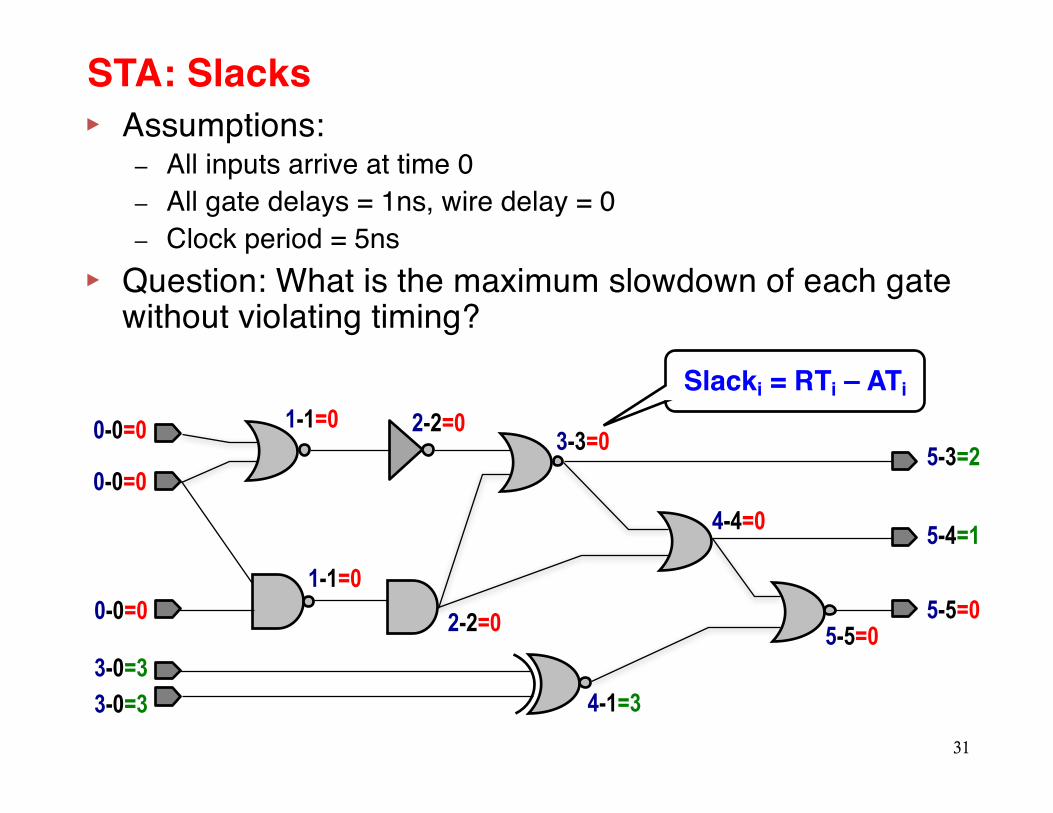
▸ Assumptions:– All inputs arrive at time 0– All gate delays = 1ns, wire delay = 0– Clock period = 5ns
▸ Question: What is the maximum slowdown of each gate without violating timing?
31
STA: Slacks
5-3=2
5-4=1
5-5=0
Slacki = RTi – ATi
5-5=0
4-4=0
3-3=02-2=01-1=00-0=0
0-0=0
2-2=0
4-1=3
1-1=00-0=0
3-0=33-0=3
Summary
▸ Graph algorithms are applicable to a wide range of EDA problems– Neatly capture the circuit topology– DAG is an important class of directed graph and will
be used frequently in this class
32

▸ Start early on CORDIC design!
▸ Next lecture: Front-end compilation and CDFG
33
Before Next Class
▸ These slides contain/adapt materials from / developed by– Prof. Randal Bryant (CMU)
34
Acknowledgements