Embed Size (px)
Citation preview
The low-frequency vocalizations of finand blue whales are the most powerfuland ubiquitous biological sounds in
the ocean1,2. Here we combine acousticlocalization and molecular techniques toshow that, in fin whales, only males produce these vocalizations. This findingindicates that they may function as malebreeding displays, and will help to focusconcern on the impact of human-generatedlow-frequency sounds on recovering whalepopulations.
The long, patterned 15–30-Hz (‘20-Hz’)vocal sequences of fin whales (Balaenopteraphysalus) can reach intensities of 184–186decibels (dB) relative to 1 mPa of soundpressure, and can be detected throughoutthe world’s oceans3,4. However, the sourceof these vocalizations was hard to identify5
because of the inherent difficulty of study-ing wide-ranging pelagic species and inlocating low-frequency sound sources inthe ocean. Until now, their function wastherefore unknown6, making it difficult toassess the effects of increasing levels ofhuman-produced sounds on these whales7.
We investigated whether these vocaliza-tions could be breeding displays8 by deter-mining the sex of vocalizing fin whales (Fig.1) and comparing the results to the overallsex ratio in Loreto Bay, Gulf of California,Mexico. We identified and tracked vocalizingfin whales by using a 120-metre-long towedarray of hydrophones and beam-formingsoftware to compute a series of cross-bearings to a vocalizing individual. Requiredconfirmation criteria included the absence ofother whales that could potentially matchthe acoustic cross-bearings, and asynchro-nization of vocalizations with respiration.
Once the vocalizing animal was unam-biguously identified, a skiff was deployedto obtain a biopsy sample in order toascertain its sex9. To estimate the overallsex ratio in the study area, we took biopsysamples from all fin whales encounteredduring systematic weekly surveys.
Vocalizations were produced only bymale fin whales, despite a 1:1 overall sexratio in the area (vocalizing: males, 9;females, 0; binomial test, P*0.001; popu-lation: males, 21; females, 22; binomial testwith normal approximation, Z0.05,240.153,P40.879). This sexual dichotomy in vocalbehaviour supports the idea that the patterned sounds of fin whales are malebreeding displays.
We propose that these displays serve toattract females from great distances toaggregations of patchily distributed prey.This is supported by several observations.
First, fin and blue whales (Balaenopteramusculus) do not aggregate in specific areas for breeding, a behavioural trait thatdistinguishes them from the closely relatedhumpback whale (Megaptera novaeangliae)10.Second, we previously found that fin whales use the Loreto study area to forageon dense aggregations of krill11. Third, thelow-frequency vocalizations of Balaenopteraspp. are optimal for long-distance commu-nication in deep water12.
Our results help to focus growing con-cern over the effects of human-producedsound on Balaenoptera spp.13. Sound levelsfrom commercial ships, military sonar, seismic surveys and ocean acoustic researchare extremely high (190–250 dB relative to 1 mPa at 1 m; ref. 4) and, at least since theearly 1960s, the amount of human-produced sound in the frequency range usedby large whales has increased7. A sound isdetectable if its received level exceeds that ofbackground noise by enough to be detectedby the animal. An increase in ambient noisecould thus reduce the distance over whichreceptive females might hear the vocaliza-tions of males. To the extent that growth of Balaenoptera populations is limited by
the encounter rate of receptive females withsinging males, the recovery of fin- and blue-whale populations from past exploitationcould be impeded by low-frequency soundsgenerated by human activity.Donald A. Croll*, Christopher W. Clark†,Alejandro Acevedo‡, Bernie Tershy*, SergioFlores§, Jason Gedamke*, Jorge Urban§*Department of Ecology and Evolutionary Biology,Center for Ocean Health, University of California,Santa Cruz, California 95060, USAe-mail: [email protected]†Cornell Laboratory of Ornithology, BioacousticsResearch Program, 159 Sapsucker Woods Road,Ithaca, New York 14850, USA‡California Academy of Sciences, 55 Concourse Drive, Golden Gate Park, San Francisco, California 94118, USA§Universidad Autónoma de Baja California Sur, AP 19-B, La Paz, BCS 23080, Mexico
1. Aroyan, J. L. et al. in Hearing by Whales and Dolphins
(eds Au, W. W. L., Popper, A. N. & Fay, R. N.) 409–469
(Springer, New York, 2000).
2. Thode, A. M., D’Spain, G. L. & Kuperman, W. A.
J. Acoust. Soc. Am. 107, 1286–1300 (2000).
3. Charif, R. A., Mellinger, D. K., Dunsmore, K. J., Fristrup, K. M.
& Clark, C. W. Mar. Mammal Sci. 18, 81–98 (2002).
4. Richardson, W. J., Greene, C. R., Malme, C. I. & Thomson, D. H.
Marine Mammals and Noise (Academic, New York, 1995).
5. Schevill, W. E., Watkins, W. A. & Backus, R. H. in Marine
Bio-Acoustics (ed. Tavolga, W. N.) 147–152 (Pergamon,
New York, 1964).
6. Popper, A. N., Hawkins, H. L. & Gisiner, R. C. Bioacoustics 8,
163–182 (1997).
7. Andrew, R. K., Howe, B. M. & Mercer, J. A. Acoust. Res. Lett.
Online 3, 65–70 (2002).
8. Watkins, W. A., Tyack, P., Moore, K. E. & Bird, J. E.
J. Acoust. Soc. Am. 82, 1901–1912 (1987).
9. Berube, M. & Palsboll, P. Mol. Ecol. 5, 283–287 (1996).
10.Clapham, P. J. Mammal Rev. 26, 27–49 (1996).
11.Croll, D. A., Acevedo-Gutierrez, A., Tershy, B. R. & Urban-
Ramirez, J. Comp. Biochem. Physiol. A 129, 797–809 (2001).
12.Clark, C. W. & Ellison, W. T. in Echolocation in Bats and
Dolphins (eds Thomas, J., Moss, C. & Vater, M.)
(Univ. Chicago Press, in the press).
13. Payne, R. S. & Webb, D. Ann. NY Acad. Sci. 188, 110–141 (1971).
Competing financial interests: declared none.
brief communications
NATURE | VOL 417 | 20 JUNE 2002 | www.nature.com/nature 809
Only male fin whales sing loud songsThese mammals need to call long-distance when it comes to attracting females.
Physiology
Dynamic instabilities in the inflating lung
In lung diseases such as asthma1, expira-tory flow becomes limited2, airways cancollapse3 and the vital exchange of gases is
compromised. Here we model the inflationof collapsed regions of the lung duringinspiration in terms of avalanches propa-gating through a bifurcating network of airways, and find that the accompanyingcascade of dynamic pressure instabilities —avalanche ‘shocks’ — manifests as negativeelastic resistance of the lung. Our analysis
of this apparent thermodynamic paradox provides a better understanding of aerationin the deep regions of the lung, which mayfind application in medical conditions inwhich gas exchange is impaired.
Most thermodynamic systems respondto an applied load by developing a restoringforce — for example, when air is pumpedinto a rigid chamber, the pressure inside thechamber increases monotonically. However,during inflation of the mammalian lungfrom the collapsed state, the lung does notalways develop an increasing restoringforce; instead, the pressure inside the lungdecreases intermittently. We explain thisapparently paradoxical behaviour in terms
Figure 1 Only boys make noise: the wide dispersal of populations
of the fin whale, seen here surfacing off the Mexican coast,
means that males have to sing extra loudly to woo females.
B. R
. TE
RSH
Y
© 2002 Nature Publishing Group
chamber containing 12 ml of air at atmos-pheric pressure, corresponding to theexperimental conditions. Inflation is simu-lated by increasing V at a constant rate.
At the start of the inflation, all airwaysare closed and no alveoli are connected tothe root, so a small increase in V increasesP. A closed airway opens when P exceedsthe airway’s opening threshold pressure5, Pth,which we assume to be a random variableuniformly distributed between 0 and 4 kilo-pascals (the pressure at total lung capacity).When a segment opens, the pressure propa-gates deeper into the airway tree. If the Pth
of either daughter airway is also smallerthan P, then this daughter opens togetherwith its parent.
This process leads to an avalanche ofopenings involving a large number of airways and alveoli6. The newly opened airways and alveoli increase the volume ofthe lung, and P decreases according toBoyle’s law. However, the reduction in P canterminate the propagation of the avalancheand P increases again owing to the steadyinflux of air — we term this phenomenonan avalanche shock (Fig. 1c, inset), which isnot a conventional propagating shock wave.
The time course of an avalanche shock issmoothed by relaxation processes due toflow resistance in the airways7 and the viscoelasticity of the alveolar walls8. Thedecreasing component of an avalancheshock corresponds to instabilities that arecharacterized by negative elastance. The
continuous increase in P is intermittentlyinterrupted by avalanche shocks of differ-ent magnitudes until all of the air in thechamber is injected into the lung.
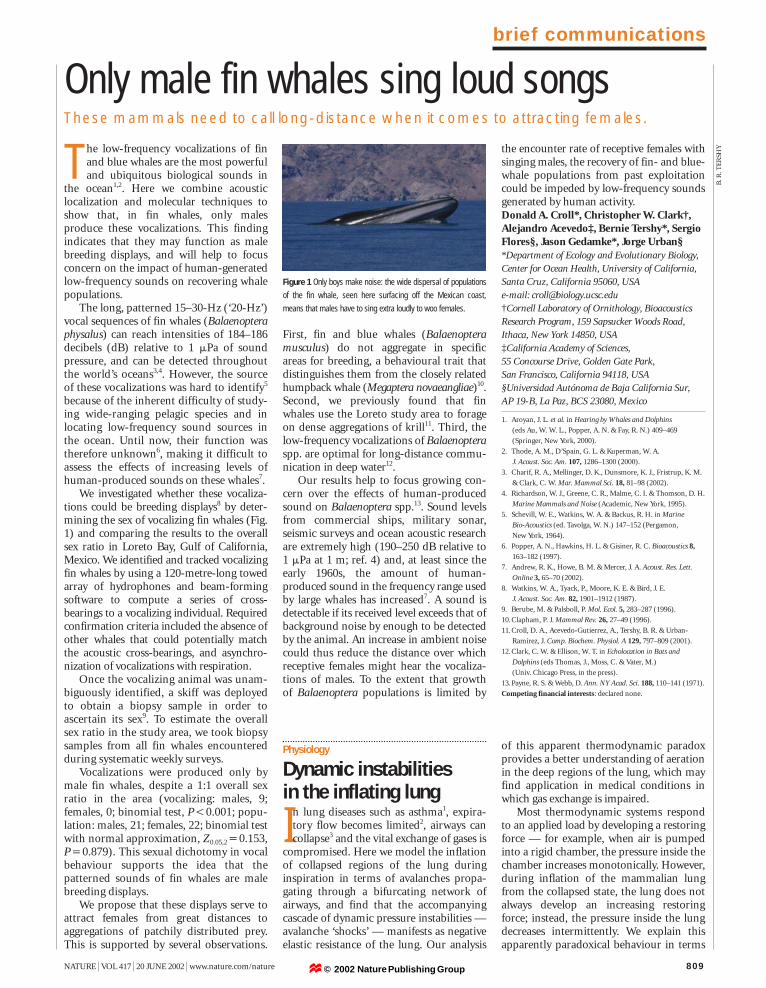
The model produces P–V curves (Fig.1c) that are similar to those observedexperimentally (Fig. 1a). The local Eneg isdetermined in the same way as for themeasured data. The distributions P(Eneg)from the simulations fit the experimen-tally obtained distributions for both slowand fast inflation rates (Fig. 1b). Theseresults indicate that inflating the lungfrom a state in which a considerable partof the gas-exchange region is collapsed is a non-equilibrium dynamical processcharacterized by a sequence of instabilitieswith negative elastance.
For slow inflation, the system hasenough time after each avalanche to reachequilibrium, so the individual avalancheshocks are distinct and non-overlapping.With increasing inflation rate, however,avalanche shocks due to separate avalan-ches increasingly overlap, resulting insmoother P–V curves with fewer regions ofnegative elastance. We conclude that theparadoxical negative elastance and its distribution arise from avalanche shocksinvolving the sudden recruitment and subsequent relaxation of a large number of airways and alveoli.
Instabilities related to airway and alveo-lar collapse and recruitment have a keyfunction in impaired gas exchange in premature infants9, in sufferers of severeasthma3 or after acute lung injury10. Theseinstabilities have previously been attrib-uted to a combination of the static properties of the alveolar liquid lining11
and the non-uniform deformation of lungtissue12. Our results and quantitative modelling provide a new interpretation of these instabilities.Adriano M. Alencar*†, Stephen P. Arold*,Sergey V. Buldyrev†, Arnab Majumdar†,Dimitrije Stamenovic*, H. Eugene Stanley†,Béla Suki**Department of Biomedical Engineering, and†Center for Polymer Studies and Department ofPhysics, Boston University, Boston,Massachusetts 02215, USAe-mail: [email protected]
1. Tobin, M. J. Am. J. Crit. Care Med. 165, 598–618 (2002).
2. Mead, J., Turner, J. M., Macklem, P. T. & Little, J. B.
J. Appl. Physiol. 22, 95–108 (1967).
3. Lutchen, K. R., Kaczka, D. W., Israel, E., Suki, B. &
Ingenito, E. P. Am. J. Crit. Care Med. 164, 207–215 (2001).
4. Shlesinger, M. F. & West, B. J. Phys. Rev. Lett. 67,
2106–2108 (1991).
5. Gaver, D. P., Samsel, R. W. & Solway, J. J. Appl. Physiol. 69,
74–85 (1990).
6. Suki, B. et al. Nature 368, 615–618 (1994).
7. Pedley, T. J., Schroter, R. C. & Sudlow, M. F. Respir. Physiol. 9,
387–405 (1970).
8. Fukaya, H., Martin, C. J., Young, A. C. & Katsura, S.
J. Appl. Physiol. 25, 689–695 (1968).
9. Pattle, R. E., Claireaux, A. E., Davis, P. A. & Cameron, A. H.
Lancet 2, 469–473 (1962).
10.Muscedere, J. G., Mullen, J. B., Gan, K. & Slutsky, A. S.
810 NATURE | VOL 417 | 20 JUNE 2002 | www.nature.com/nature
of a non-equilibrium avalanche model.We inflated isolated, degassed rat lungs
to total lung capacity at two different butconstant rates by pumping in 12 ml of airwith a computer-controlled piston. Thelung recoil pressure, P, was then measuredwith respect to atmosphere as a function ofthe volume displacement, V, of the piston.With increasing V, P also increases, but thisincrease is not monotonic and P inter-mittently decreases (Fig. 1a), causing theelastance, E (defined as E = dP/dV ), to takenegative and positive values intermittently.
We estimate E as the local slope of astraight-line fit within a moving windowalong the P–V curve. The magnitude, Eneg,of elastances with negative values fluctuates.We find that the distribution P(Eneg) isexponential,
P(Eneg)]e1(Eneg/E0) (1)
where E0, the characteristic value of Eneg,increases with inflation rate (Fig. 1b). Thepattern of Eneg varies from inflation to infla-tion, but the distribution in equation (1) isreproducible. (This excludes the possibilitythat Eneg arises from tissue rupture.)
To understand the existence and fluctua-tions of the negative elastance, we devel-oped a dynamical model of a systemconsisting of a piston chamber and a lung.We modelled the lung as a binary tree terminating in elastic alveoli4. The root ofthe tree, the trachea, is connected to the
brief communications
Figure 1 Pressure–volume
curves and distributions of
negative elastance. a, Example
of the P–V curve (see text) dur-
ing the inflation of a degassed
rat lung. Inset, magnification of
a region with many local nega-
tive-elastance patterns. b, Dis-
tributions of negative elastance
from 10 independent inflations
at rates of 2.0 ml s11 (tri-
angles) and 0.5 ml s11 (circles).
The values of E0 obtained
from the straight-line fits to
the measured distributions
are 0.28 kPa ml11 and
0.1 kPa ml11 for the slow and
fast inflations, respectively
(dashed lines). Solid lines cor-
respond to the distributions of
negative elastance from 1,000
simulated inflations of an
18-generation symmetric binary
tree. c, Example of the P–V
curve from inflation of the
model. Inset, magnification of
a region with many local
negative-elastance patterns
similar to those in a; red line,
trace of an avalanche shock.
3.22.82.43.4
3.5
4
3
2
1
02 4 6 8 10 12
Slow
Fast
Volume (ml)
Volume (ml)
105
104
103
102
101
100
0.0 0.5 1.0 1.5 2.0Eneg (kPa ml–1)
3.4
3.22.5 3
12108642
2
3
4
00
1Pre
ssur
e (k
Pa)
Pre
ssur
e (k
Pa)
Dis
trib
utio
n
(Ene
g)a
b
c
Π
© 2002 Nature Publishing Group
Am. J. Crit. Care Med. 149, 1327–1334 (1994).
11.Clements, J. A., Hustead, R. F., Johnson, R. T. & Gribetz, I.
J. Appl. Physiol. 16, 444–450 (1961).
12.Stamenovic, D. & Wilson, T. A. J. Appl. Physiol. 73,
596–602 (1992).
Competing financial interests: declared none.
Surface phenomena
Contact time of abouncing drop
When a liquid drop lands on a solidsurface without wetting it, itbounces with remarkable elasticity1–3.
Here we measure how long the dropremains in contact with the solid during the shock, a problem that was consid-ered by Hertz4 for a bouncing ball. Our findings could help to quantify the efficiency of water-repellent surfaces(super-hydrophobic solids5) and to improvewater-cooling of hot solids, which is limitedby the rebounding of drops6 as well as bytemperature effects.
The way in which a water drop of radiusR deforms during its impact with a highlyhydrophobic solid depends mainly on itsimpinging velocity, V. The Weber number,W4rV 2R/g, compares the kinetic and surface energies of the drop, where r and gare the liquid density and surface tension,respectively. The greater the value of W, the larger are the deformations that occurduring the impact (Fig. 1).
High-speed photography (Fig. 1) enabledus to measure the drop’s contact time, t.The frame rate could be greater than 104 Hz,
allowing precise measurements of t, whichwe found to be in the range 1–10 ms. As theimpact is mainly inertial (with a restitutioncoefficient2 as great as 0.91), t is expected tobe a function of only R, V, r and g, and thusto vary as R/V.f(W ). For a Hertz shock, forexample, the maximum vertical deforma-tion, d, scales as R(r2V 4/E 2)1/5, where E isthe Young’s modulus of the ball7. Taking adrop’s Laplace pressure, E<g/R, as anequivalent modulus and noting thatt<d/V, we find for a Hertz drop thatf(W)~W 2/5 and that the contact time variesas V 11/5 and R7/5.
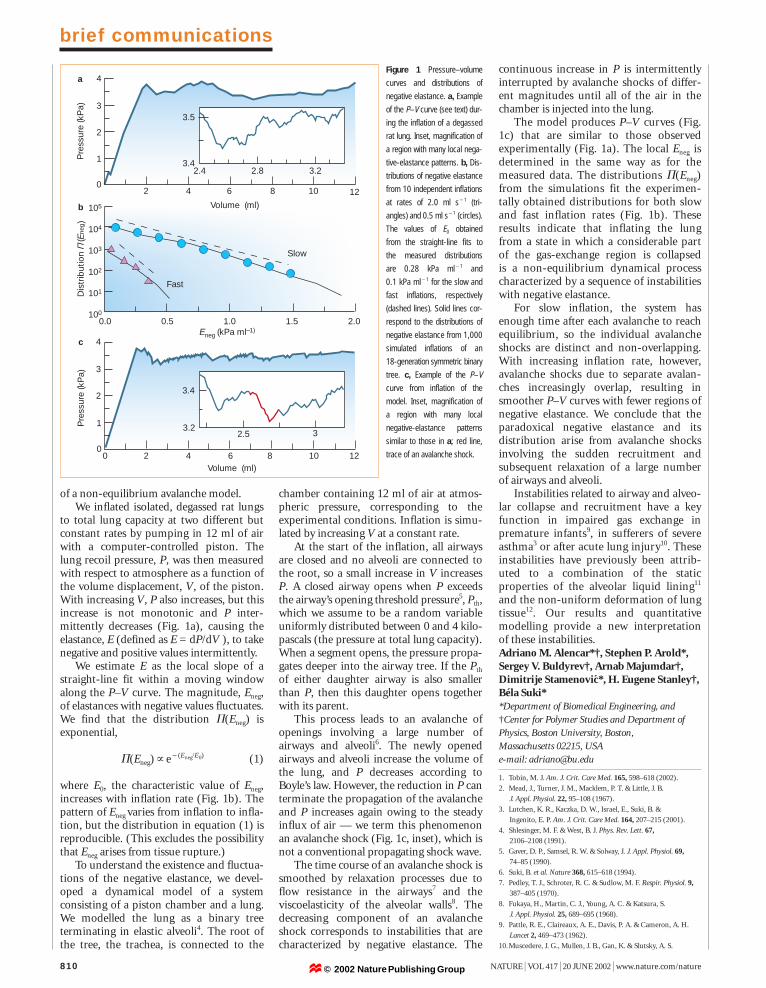
Figure 2a shows that the contact timedoes not depend on the impact velocity over a wide range of velocities (20–230 cm s11), although both the deformationamplitude and the details of the intermediatestages largely depend on it. This is similar to the case of a harmonic spring, althoughoscillations in the drop are far from beinglinear. Moreover, this finding confirms thatviscosity is not important here.
Figure 2b shows that t is mainly fixedby the drop radius, because it is well fittedby R3/2 over a wide range of radii (0.1–4.0mm). Both this result and the findingshown in Fig. 2a can be understood simply by balancing inertia (of the orderrR/t 2) with capillarity (g/R2), which yieldst<(rR3/g)1/2, of the form already statedwith f(W)~W 1/2. This time is slightly different from the Hertz time because thekinetic energy for a solid is stored duringthe impact in a localized region, whereas in our case it forces an overall deformationof the drop (Fig. 1).
The scaling for t is the same as for theperiod of vibration of a drop derived byRayleigh8, and is consistent with a previouspostulation9, although the motion here isasymmetric in time, forced against a solid,and of very large amplitude. Absolute
brief communications
NATURE | VOL 417 | 20 JUNE 2002 | www.nature.com/nature 811
values are indeed found to be different: theprefactor deduced from Fig. 2b is 2.650.1,which is significantly greater thanp/£2<2.2 for an oscillating drop8. Another difference between the two systemsis the behaviour in the linear regime(W**1): for speeds less than those shownin Fig. 2, we found that t depends on V, and typically doubles when V is reducedfrom 20 to 5 cm s11, which could be due tothe drop’s weight10.
The brevity of the contact means that adrop that contains surfactants, which willspread when gently deposited onto thesolid, can bounce when thrown onto it; thisis because the contact time is too short toallow the adsorption of the surfactants ontothe fresh interface generated by the shock.Conversely, the contact time should providea measurement of the dynamic surface tension of the drop.Denis Richard*, Christophe Clanet†, David Quéré**Laboratoire de Physique de la Matière Condensée,URA 792 du CNRS, Collège de France, 75231 ParisCedex 05, Francee-mail: [email protected]†Institut de Recherche sur les Phénomènes HorsÉquilibre, UMR 6594 du CNRS, BP 146, 13384 Marseille Cedex, France
1. Hartley, G. S. & Brunskill, R. T. in Surface Phenomena in
Chemistry and Biology (ed. Danielli, J. F.) 214 (Pergamon,
Oxford, 1958).
2. Richard, D. & Quéré, D. Europhys. Lett. 50, 769–775 (2000).
3. Aussillous, P. & Quéré, D. Nature 411, 924–927 (2001).
4. Hertz, H. J. Reine Angew. Math. 92, 156–171 (1881).
5. Nakajima, A., Hashimoto, K. & Watanabe, T. Monatshefte Chim.
132, 31–41 (2001).
6. Frohn, A. & Roth, R. Dynamics of Droplets (Springer,
Berlin, 2000).
7. Landau, L. D. & Lifschitz, E. M. Theory of Elasticity 3rd edn
(Pergamon, Oxford, 1986).
8. Rayleigh, Lord Proc. R. Soc. Lond. A 29, 71–97 (1879).
9. Wachters, L. H. J. & Westerling, N. A. J. Chem. Eng. Sci. 21,
1047–1056 (1966).
10.Perez, M. et al. Europhys Lett. 47, 189–195 (1999).
Competing financial interests: declared none.
Evolutionary biology
Hedgehog crosses thesnail’s midline
A ccording to the dorsoventral axis-inversion theory1, protostomes (suchas insects, snails and worms) are
organized upside-down by comparison withdeuterostomes (vertebrates)2–5, in whichcase their respective ventrally (belly-side)and dorsally (back-side) located nervoussystems, as well as their midline regions,should all be derived from a commonancestor5. Here we provide experimentalevidence for such homology by showingthat an orthologue of hedgehog, an impor-tant gene in midline patterning in verte-brates, is expressed along the belly of thelarva of the limpet Patella vulgata. This
Figure 2 Contact time of a bouncing drop as a function of impact
velocity and drop radius. a, b, In the explored interval (Weber
number, W, between 0.3 and 37), the contact time is a, indepen-
dent of the impact velocity, V, but b, depends on the drop radius,
R. Dotted lines indicate slopes of 0 (a) and 3/2 (b).
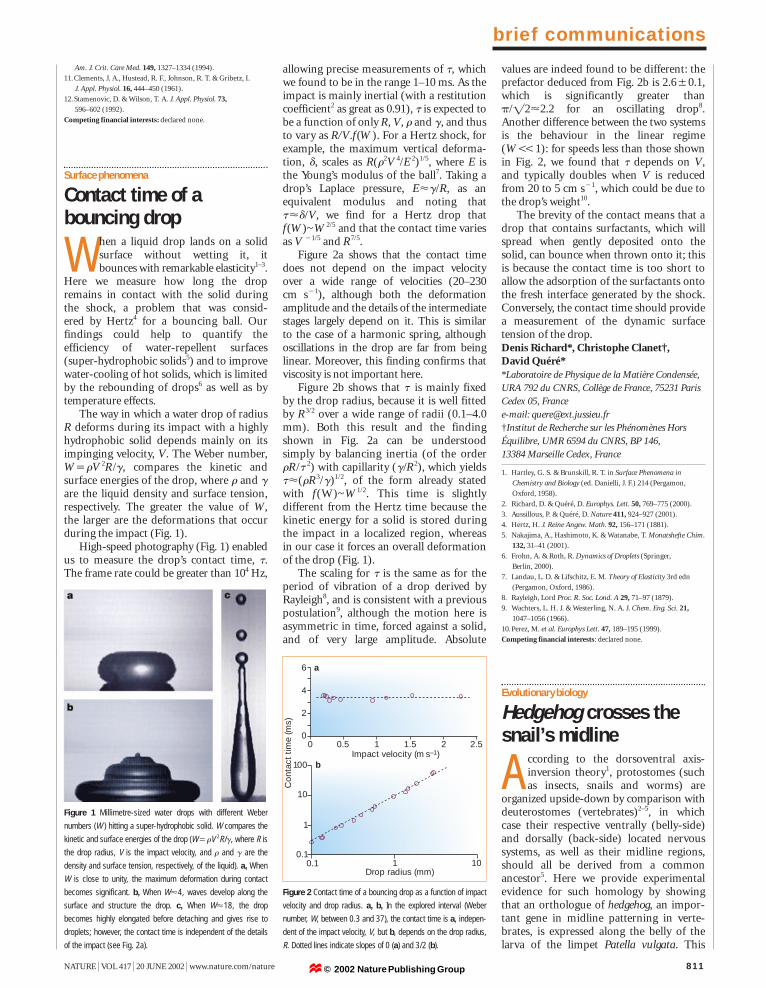
Figure 1 Millimetre-sized water drops with different Weber
numbers (W ) hitting a super-hydrophobic solid. W compares the
kinetic and surface energies of the drop (W4rV 2R/g, where R is
the drop radius, V is the impact velocity, and r and g are the
density and surface tension, respectively, of the liquid). a, When
W is close to unity, the maximum deformation during contact
becomes significant. b, When W<4, waves develop along the
surface and structure the drop. c, When W<18, the drop
becomes highly elongated before detaching and gives rise to
droplets; however, the contact time is independent of the details
of the impact (see Fig. 2a).
2.51.50.5 1Impact velocity (m s–1)
200
2
4
6
Con
tact
tim
e (m
s)
10 0
10
1
1 100.1
0.1Drop radius (mm)
a
b
© 2002 Nature Publishing Group