Embed Size (px)
Citation preview
Graintek – 2012
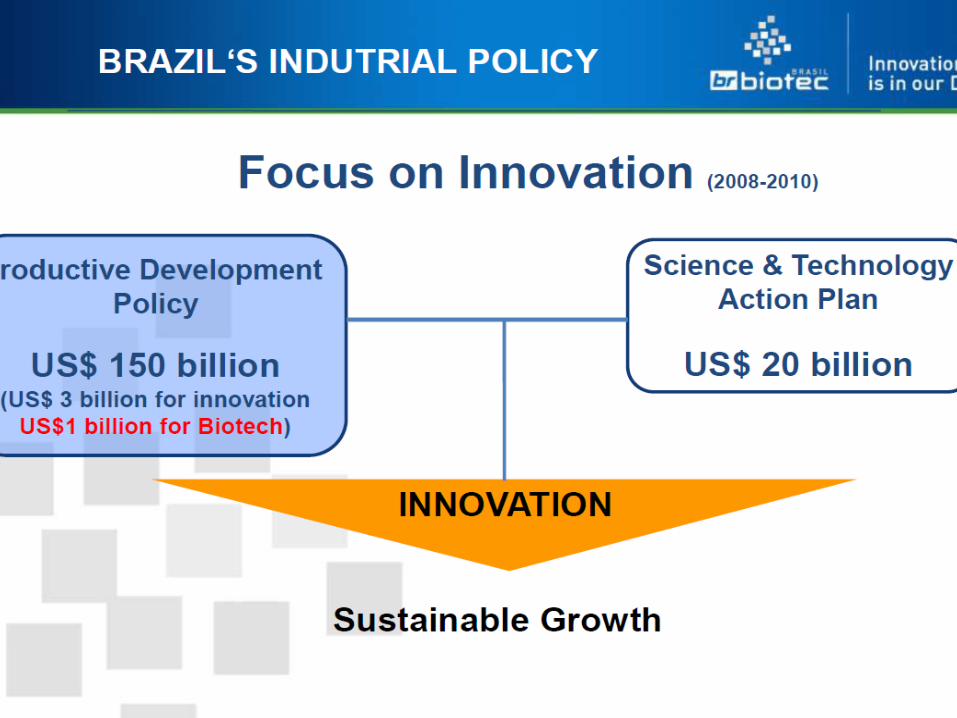
Bioeconomy in Brazil: State of the art and
perspectives
Jose Geraldo Eugenio de Franca
UNL – Fulbright Association
Visiting Professor on Bioenergy and Biofuels
The Technology Institute of Pernambuco – Brazil
Moscow – Russia – Nov 2012
Summary
. Science and Technology in Brazil
. Human resources and training
. Agriculture
. Bioenergy
. Biotechnology and bioeconomy
. The cooperation between Brazil and Russia on Bioeconomy and energy issues
. Conclusions
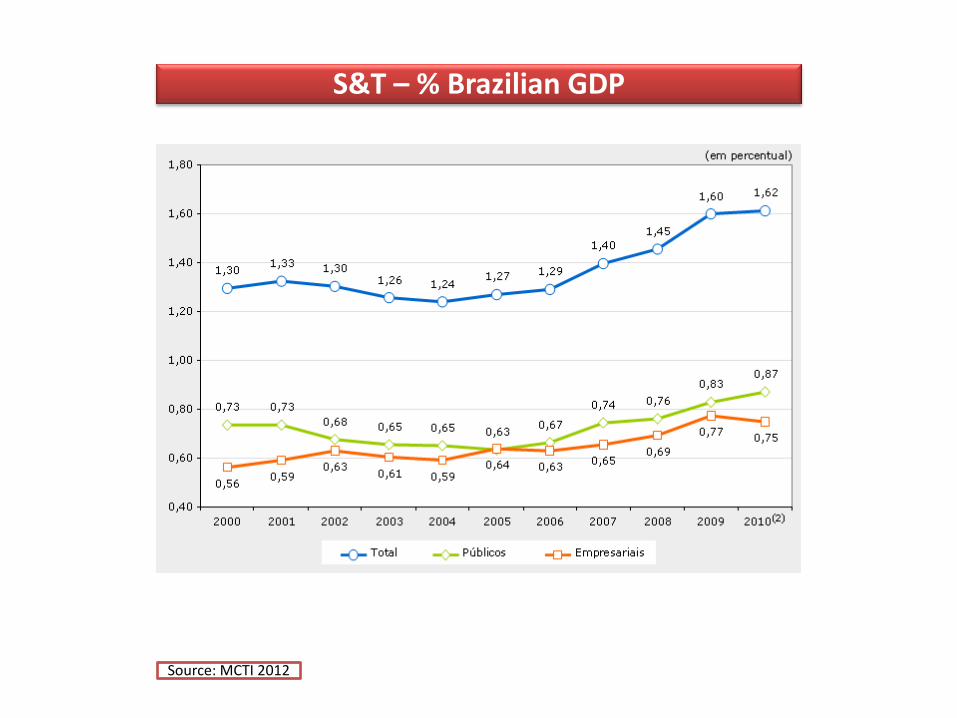
S&T – % Brazilian GDP
Source: MCTI 2012
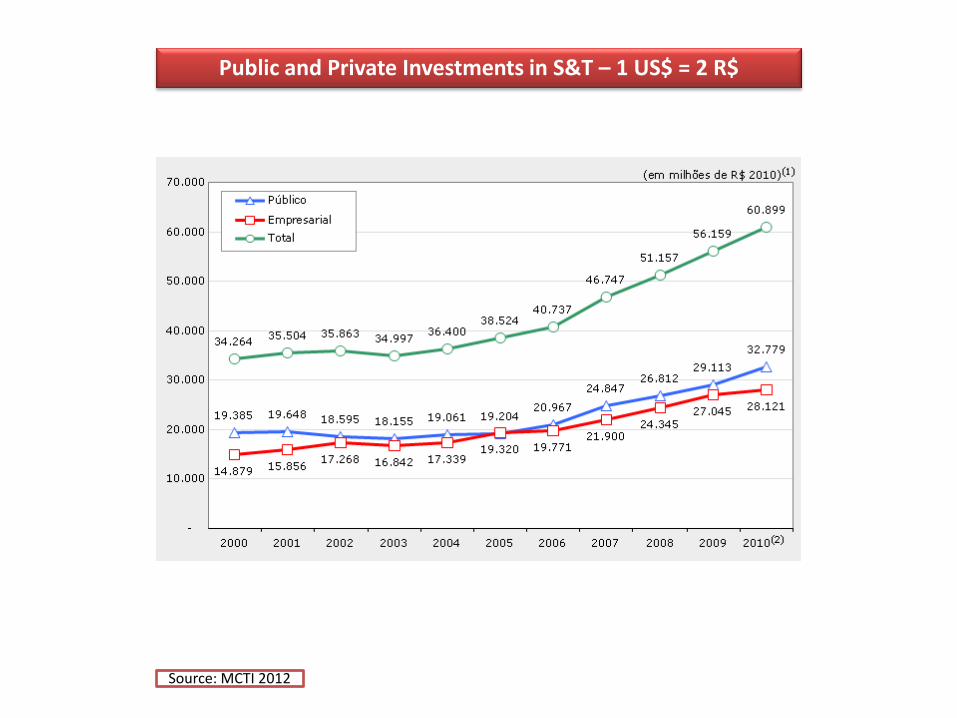
Public and Private Investments in S&T – 1 US$ = 2 R$
Source: MCTI 2012
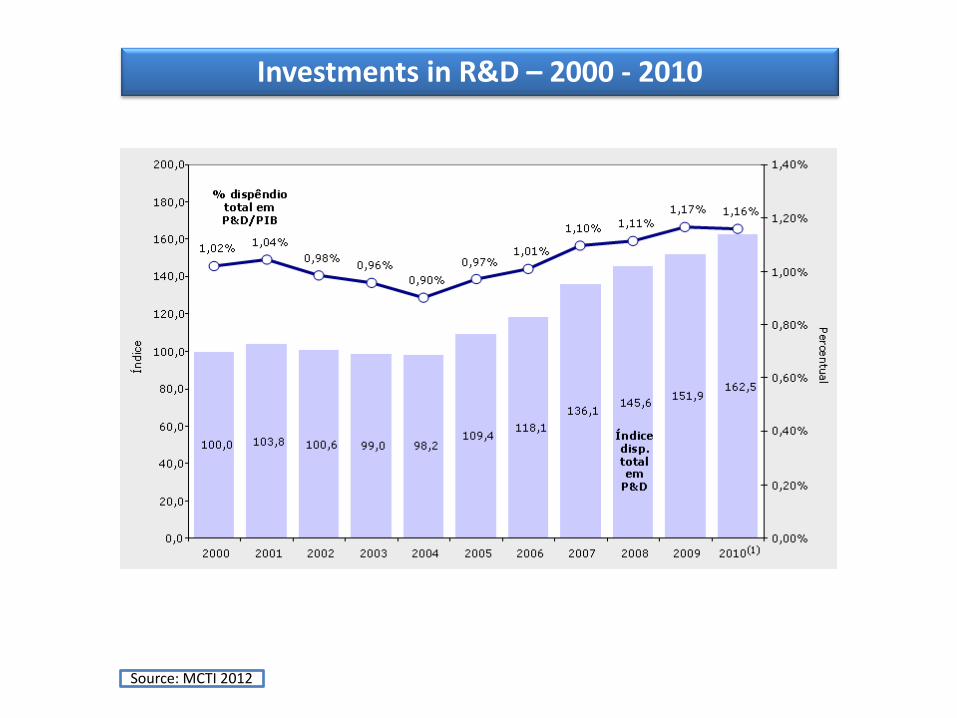
Investments in R&D – 2000 - 2010
Source: MCTI 2012
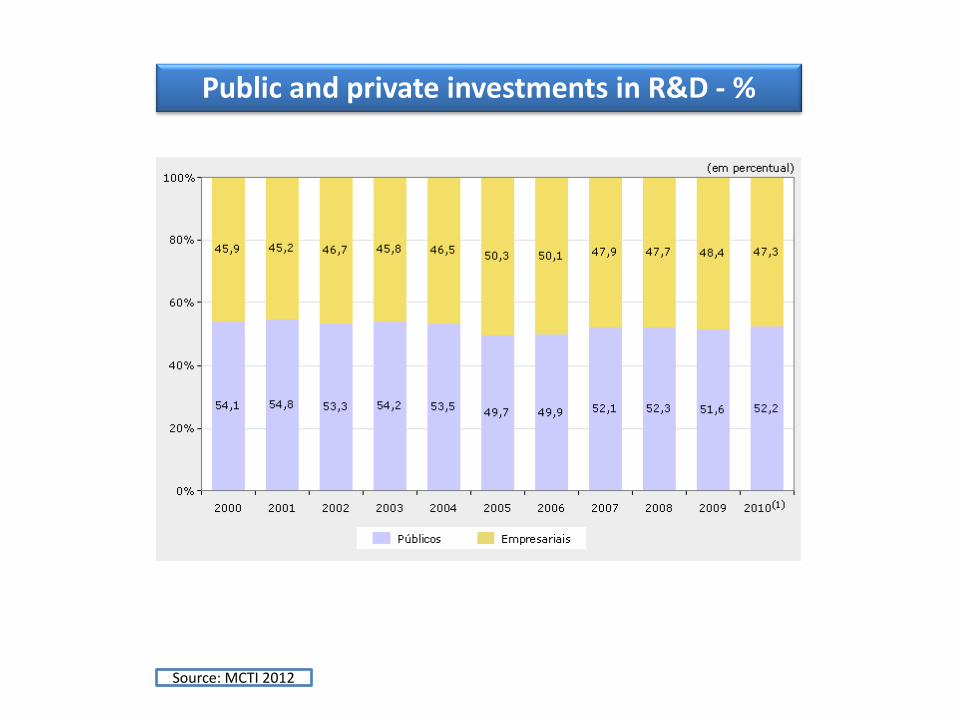
Public and private investments in R&D - %
Source: MCTI 2012
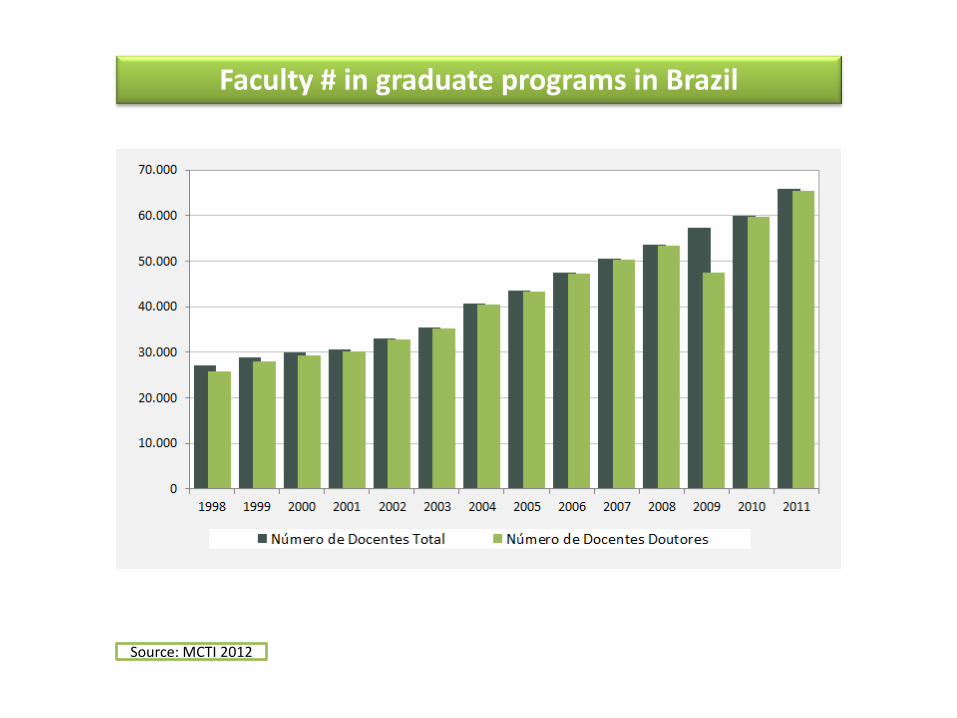
Faculty # in graduate programs in Brazil
Source: MCTI 2012
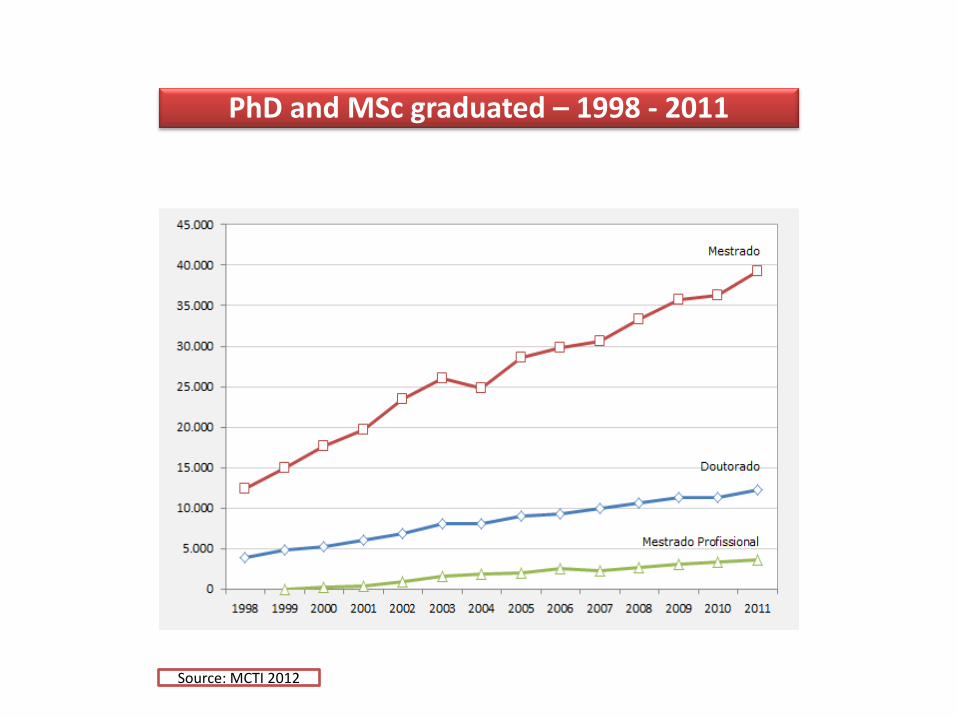
PhD and MSc graduated – 1998 - 2011
Source: MCTI 2012
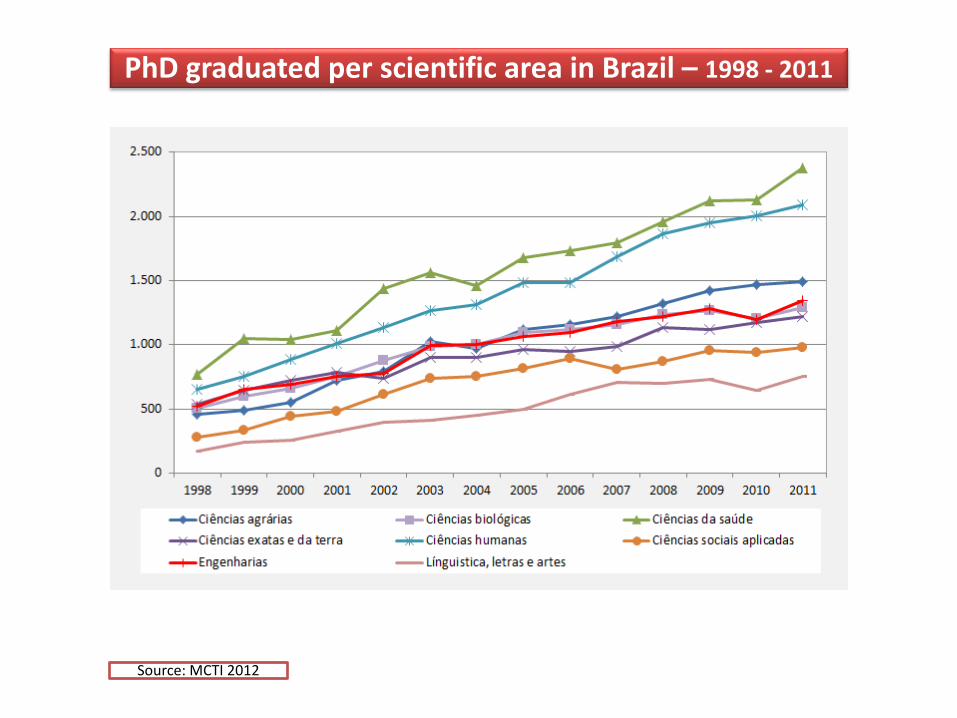
PhD graduated per scientific area in Brazil – 1998 - 2011
Source: MCTI 2012
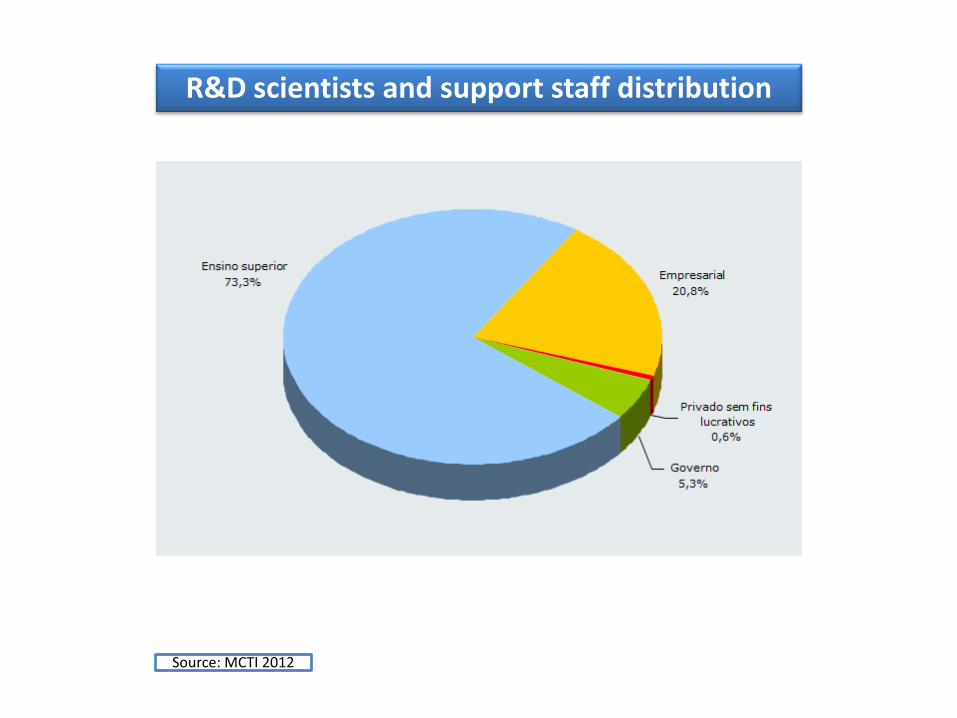
R&D scientists and support staff distribution
Source: MCTI 2012
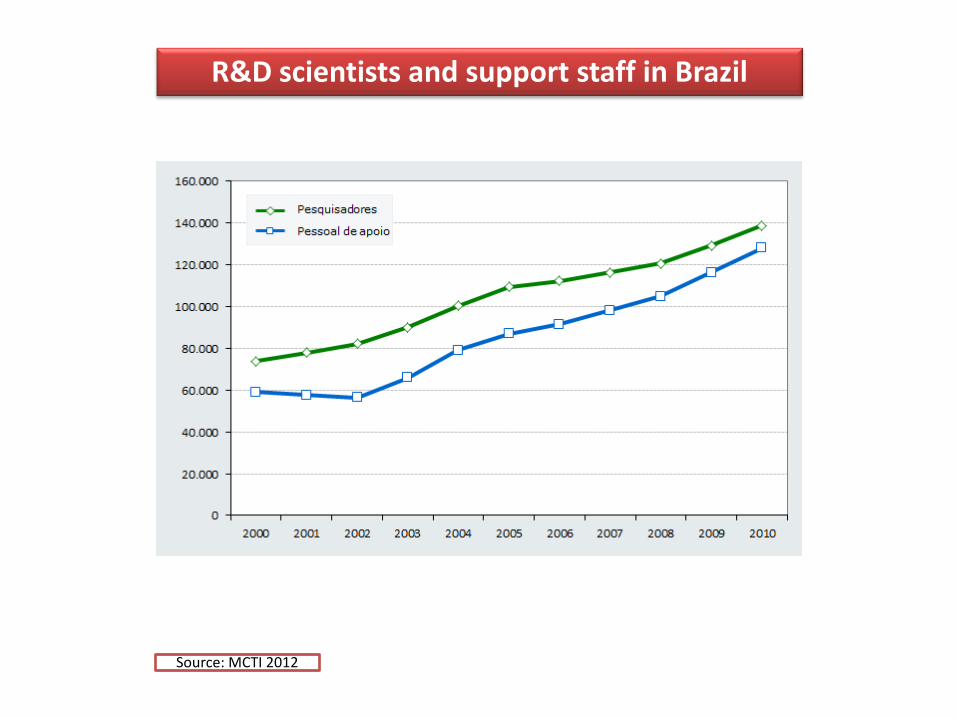
R&D scientists and support staff in Brazil
Source: MCTI 2012
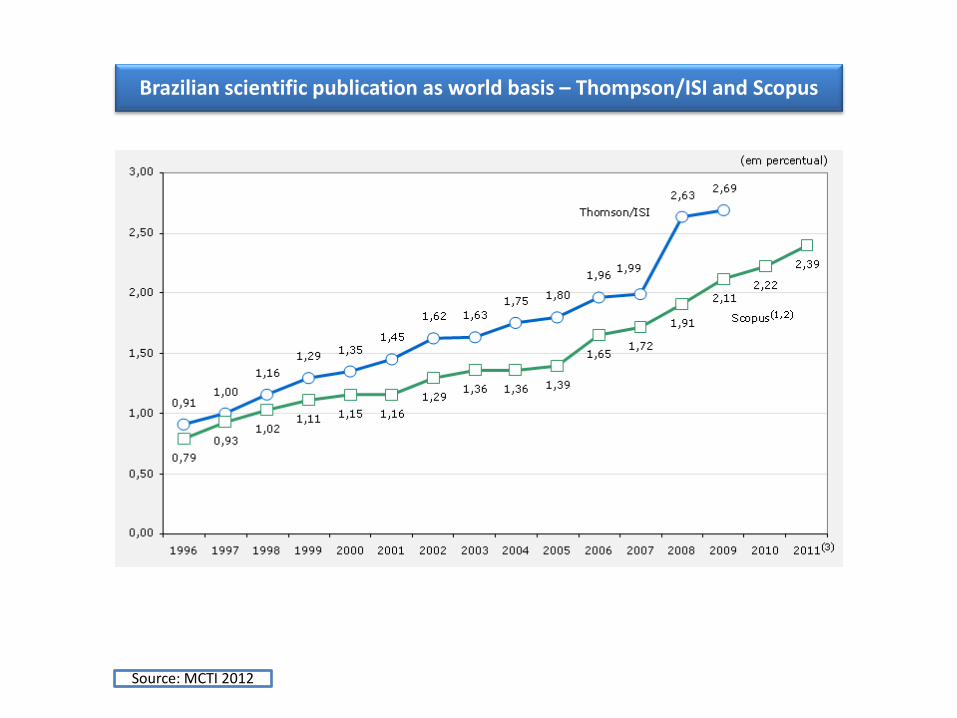
Brazilian scientific publication as world basis – Thompson/ISI and Scopus
Source: MCTI 2012
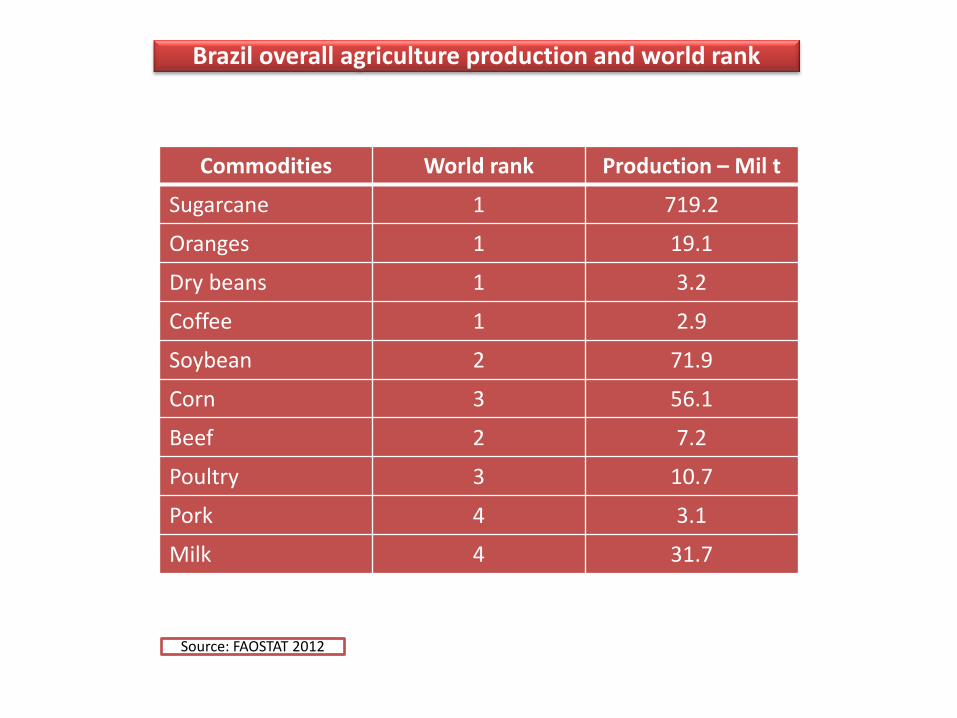
Commodities World rank Production – Mil t
Sugarcane 1 719.2
Oranges 1 19.1
Dry beans 1 3.2
Coffee 1 2.9
Soybean 2 71.9
Corn 3 56.1
Beef 2 7.2
Poultry 3 10.7
Pork 4 3.1
Milk 4 31.7
Brazil overall agriculture production and world rank
Source: FAOSTAT 2012
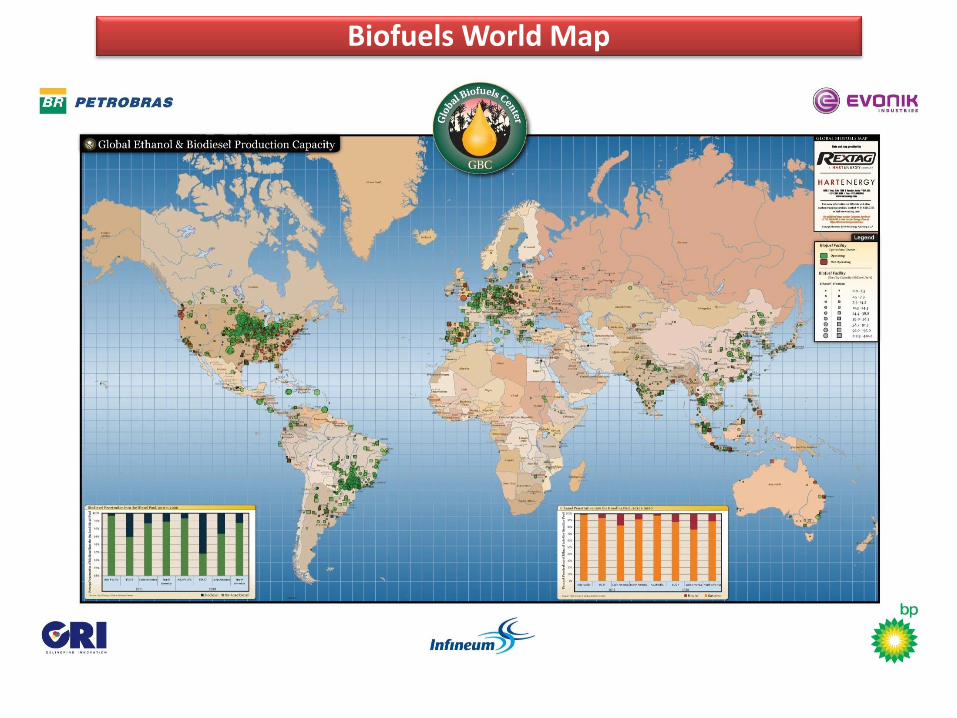
Biofuels World Map
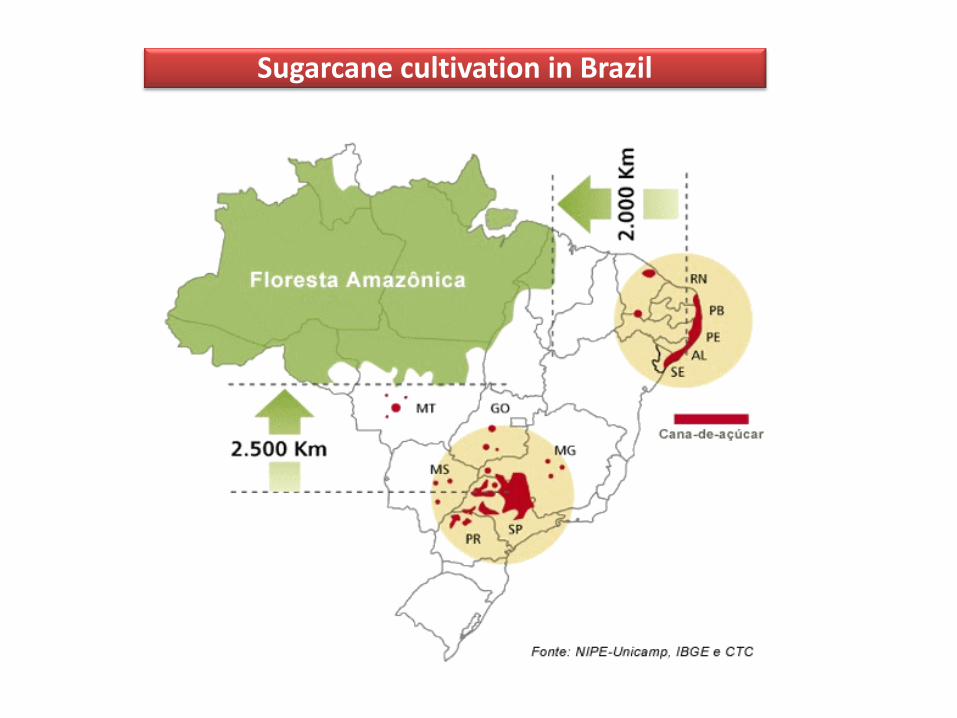
Sugarcane cultivation in Brazil
Milh
õe
s d
e H
ect
are
s
8,0
7,0
6,0
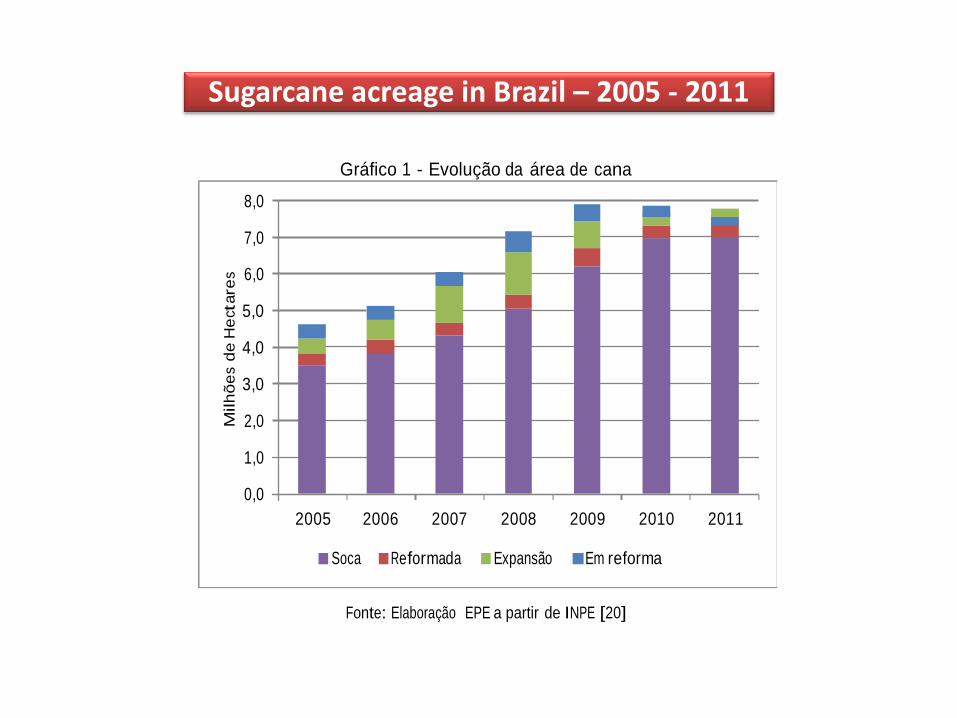
Gráfico 1 - Evolução da área de cana
5,0
4,0
3,0
2,0
1,0
0,0
2005 2006 2007 2008 2009 2010 2011
Soca Reformada Expansão Em reforma
Fonte: Elaboração EPE a partir de INPE [20]
Sugarcane acreage in Brazil – 2005 - 2011
Milh
õe
s d
e t
on
ela
das
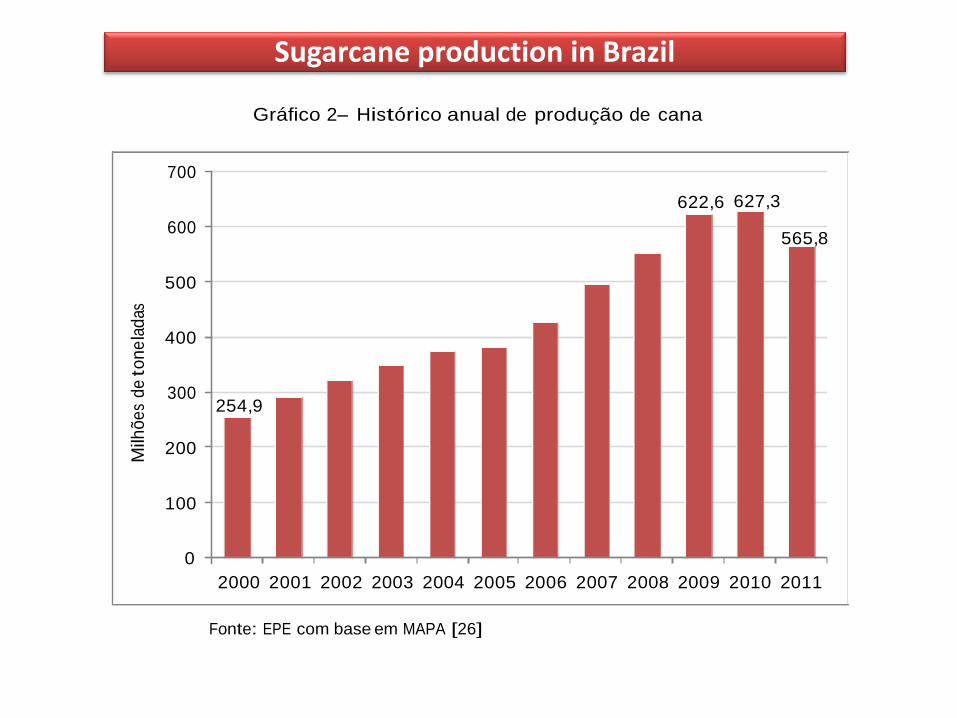
Gráfico 2– Histórico anual de produção de cana
700
600
622,6 627,3
565,8
500
400
300
254,9
200
100
0
2000 2001 2002 2003 2004 2005 2006 2007 2008 2009 2010 2011
Fonte: EPE com base em MAPA [26]
Sugarcane production in Brazil
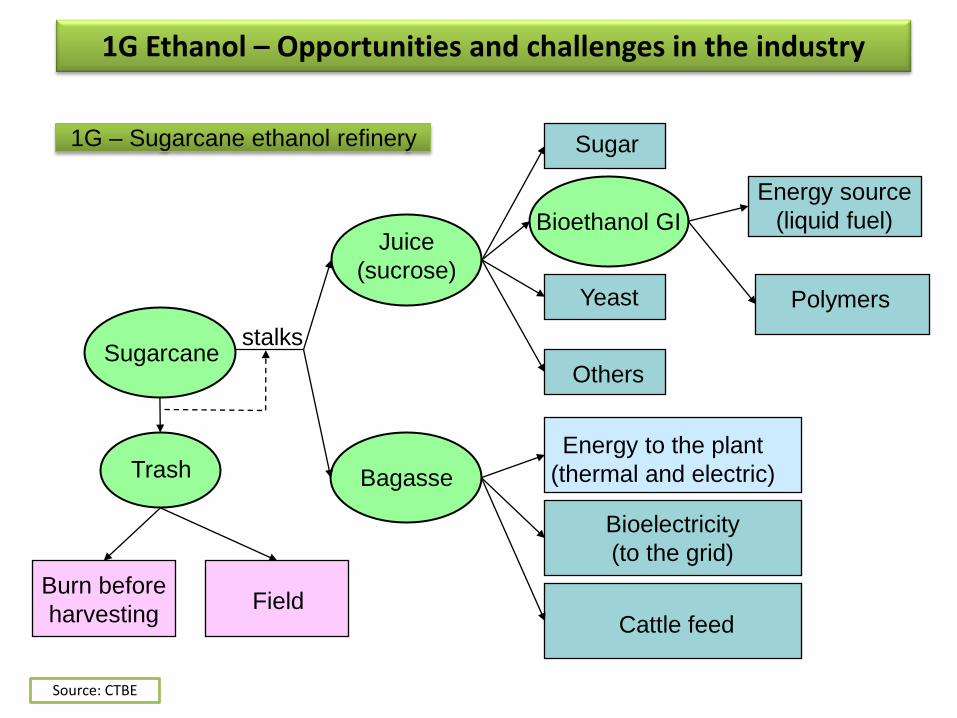
Burn before
harvesting
Juice
(sucrose)
Bagasse
Field
Trash Energy to the plant
(thermal and electric)
Sugarcane Others
Yeast
Bioethanol GI
Sugar
Polymers
Energy source
(liquid fuel)
Bioelectricity
(to the grid)
Cattle feed
stalks
1G Ethanol – Opportunities and challenges in the industry
Source: CTBE
1G – Sugarcane ethanol refinery
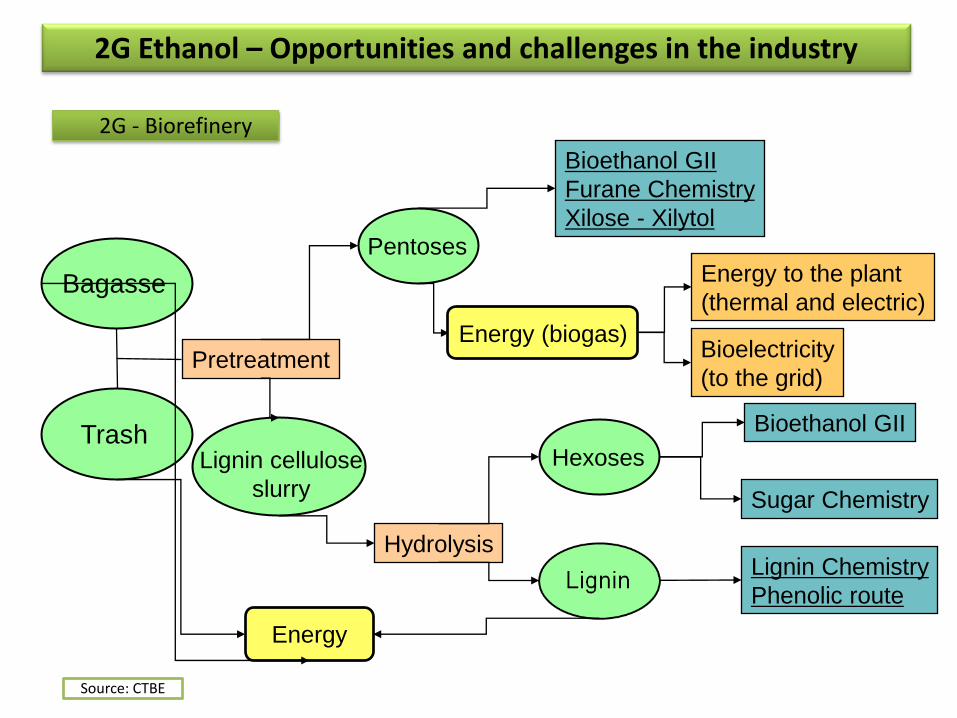
Trash
Bagasse
Pretreatment
Hydrolysis
Hexoses
Bioethanol GII
Sugar Chemistry
Lignin Chemistry
Phenolic route
Energy
Pentoses
Energy (biogas)
Bioethanol GII
Furane Chemistry
Xilose - Xilytol
Energy to the plant
(thermal and electric)
Bioelectricity
(to the grid)
Lignin cellulose
slurry
2G - Biorefinery
2G Ethanol – Opportunities and challenges in the industry
Source: CTBE
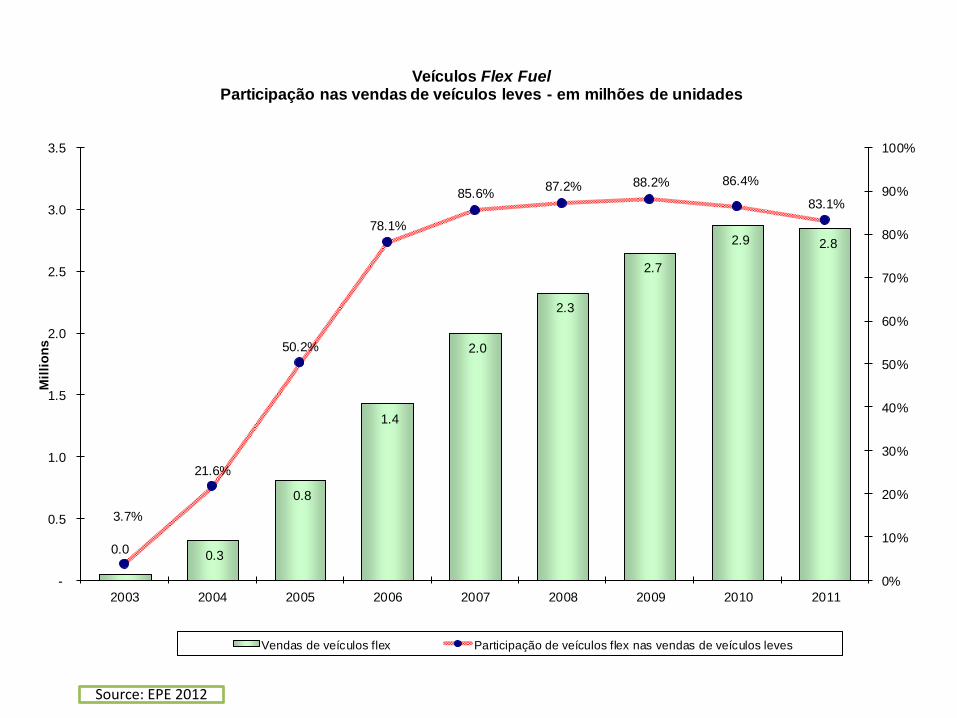
0.0 0.3
0.8
1.4
2.0
2.3
2.7
2.9 2.8
3.7%
21.6%
50.2%
78.1%
85.6%87.2% 88.2% 86.4%
83.1%
0%
10%
20%
30%
40%
50%
60%
70%
80%
90%
100%
-
0.5
1.0
1.5
2.0
2.5
3.0
3.5
2003 2004 2005 2006 2007 2008 2009 2010 2011
Mil
lio
ns
Veículos Flex FuelParticipação nas vendas de veículos leves - em milhões de unidades
Vendas de veículos flex Participação de veículos flex nas vendas de veículos leves
Source: EPE 2012
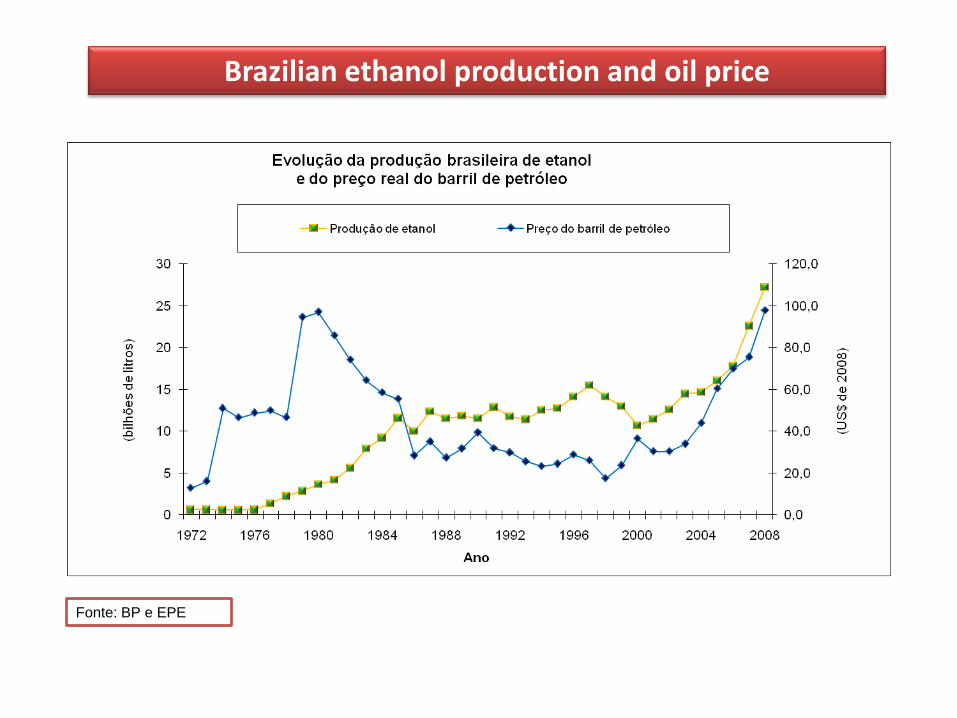
Brazilian ethanol production and oil price
Fonte: BP e EPE
Milh
õe
s d
e m
³
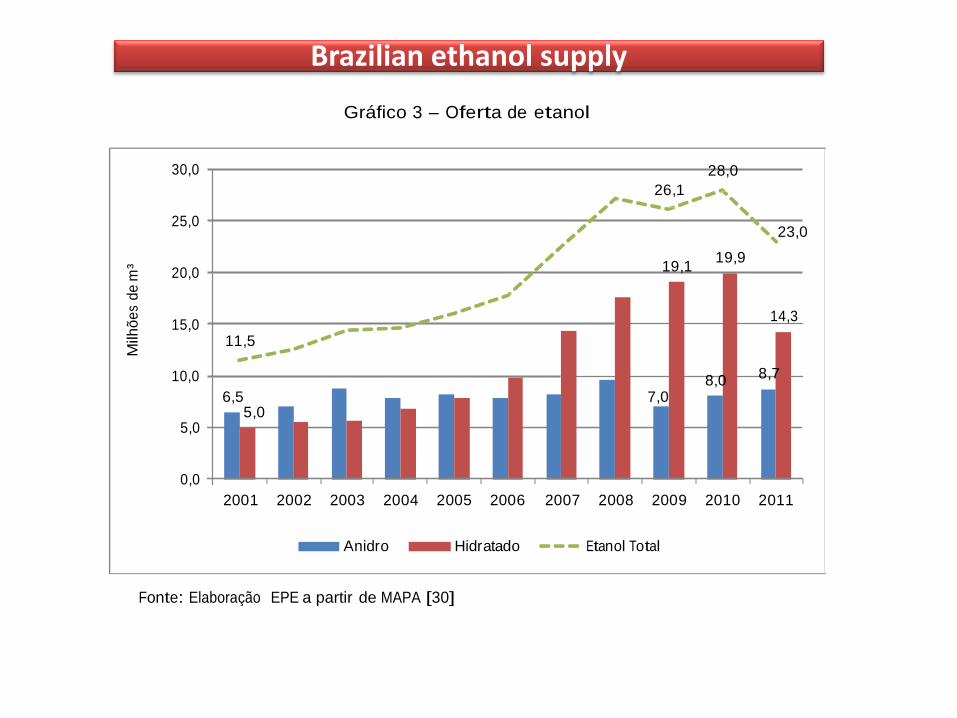
Gráfico 3 – Oferta de etanol
30,0 26,1
28,0
25,0
20,0
19,1 19,9
23,0
15,0
10,0
5,0
11,5
6,5 7,0
5,0
14,3
8,0 8,7
0,0
2001 2002 2003 2004 2005 2006 2007 2008 2009 2010 2011
Anidro Hidratado Etanol Total
Fonte: Elaboração EPE a partir de MAPA [30]
Brazilian ethanol supply
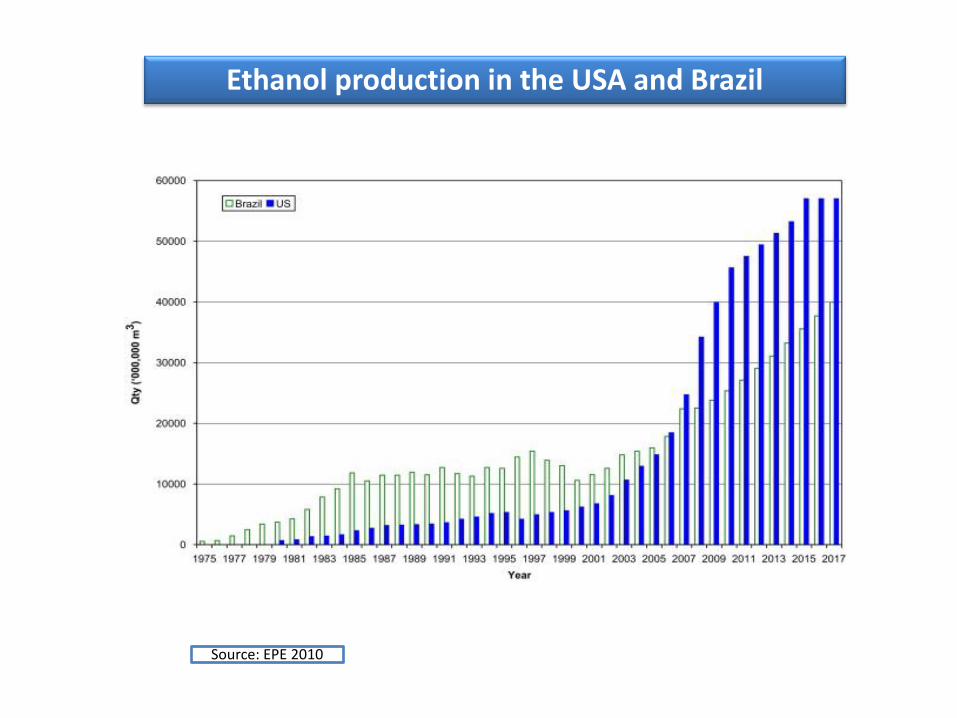
Ethanol production in the USA and Brazil
Source: EPE 2010
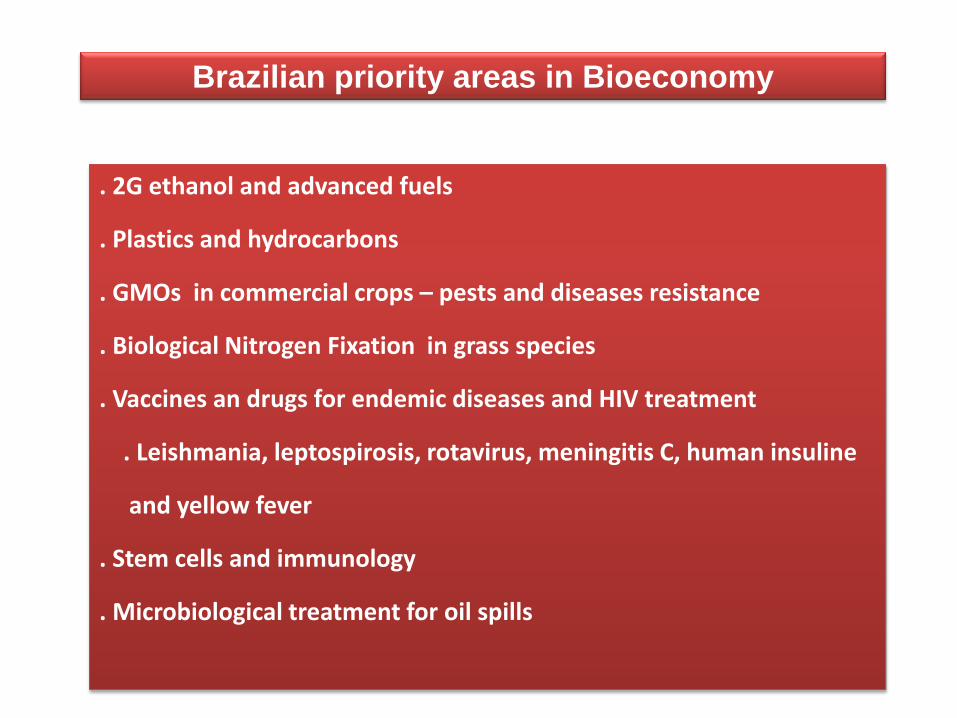
Brazilian priority areas in Bioeconomy
. 2G ethanol and advanced fuels
. Plastics and hydrocarbons
. GMOs in commercial crops – pests and diseases resistance
. Biological Nitrogen Fixation in grass species
. Vaccines an drugs for endemic diseases and HIV treatment
. Leishmania, leptospirosis, rotavirus, meningitis C, human insuline
and yellow fever
. Stem cells and immunology
. Microbiological treatment for oil spills
Conclusions
. The bioeconomy development for countries like Russia and Brazil has to be linked with investments in Science and Technology
. Human resources and training are indispensable tools for the bioeconomy to flourish
. The agriculture and the bioenergy sectors would be eligible as priorities in Russia as well as in Brazil
Conclusions
. The bioeconomy industry may have in the agriculture its launch pad
. The bioeconomy technology and market cooperation between Russia and Brazil may be part of their strategic agenda
. The relationship with the private sector in areas such as bioeconomy and energy has to be a cornstone in the foreign agenda of Russia and Brazil.
Thanking you!
ITEP – The Technological Institute of the State
of Pernambuco – Brazil
Fulbright Association – UNL & USDA-ARS
Geraldo Eugenio – [email protected]


![arXiv:1909.02799v1 [eess.IV] 6 Sep 20194 Moscow Gamma-Knife Center, Moscow, Russia 5 Burdenko Neurosurgery Institute, Moscow, Russia m.belyaev@skoltech.ru Abstract. Stereotactic radiosurgery](https://img.pdfslide.net/doc/110x75/5f97243497bac815b47f8d13/arxiv190902799v1-eessiv-6-sep-2019-4-moscow-gamma-knife-center-moscow-russia.jpg)