Embed Size (px)
Citation preview
Marine Pollution Bulletin 61 (2010) 205–210
Contents lists available at ScienceDirect
Marine Pollution Bulletin
journal homepage: www.elsevier .com/locate /marpolbul
Biological production and eutrophication of Baltic Sea estuarine ecosystems:The Curonian and Vistula Lagoons
S.V. AleksandrovAtlantic Research Institute of Marine Fisheries and Oceanography (AtlantNIRO), 5, Dm. Donskoy Str., Kaliningrad 236000, Russia
a r t i c l e i n f o a b s t r a c t
Keywords:EutrophicationClimate changeHyperbloom of CyanobacteriaCuronian and Vistula Lagoons
0025-326X/$ - see front matter � 2010 Published bydoi:10.1016/j.marpolbul.2010.02.015
E-mail address: [email protected]
The long-term data on the temporal and spatial changes of chlorophyll and nutrients concentrations,phytoplankton biomass, primary production and mineralization of organic matter in the Curonian andVistula Lagoons were analyzed using seasonal data to 1994 and monthly data to 2007 at 9–12 stations.A comparison with hydrological (water temperature, salinity, water exchange) and chemical parametersindicate the main abiotic factors which influence the level of biological production and the trophic stateof lagoons. Most of the Curonian Lagoon showed the strong summer warming-up of water (higher 20 �C)combined with freshwater conditions, slow-flow velocity and high concentrations of phosphorus whichcreates conditions for hyperblooms of Cyanobacteria. The biological production of the Vistula Lagoon isbelow the potentially possible level as the hydrodynamic activity (high-flow velocity) and brackish waterprevent the intensive development of Cyanobacteria. The Curonian Lagoon may be considered as hyper-trophic water body whereas the Vistula Lagoon is a eutrophic water body.
� 2010 Published by Elsevier Ltd.
1. Introduction
The problems of contamination of coastal and offshore environ-ments and, consequently, of aquatic organisms by pathogenic bac-teria and in uncontrolled run-off from urban and agricultural areas,are manifest in the Baltic Sea region (HELCOM, 2002). Eutrophica-tion from the same sources encourages harmful algal blooms thatmay contaminate fish and shellfish.
Coastal lagoons are most vulnerable to direct impacts of naturalenvironmental and anthropogenic factors. Due to this sensitivity,the analysis of long-term changes of chemical and biologicalparameters in lagoons could demonstrate the actual relationshipbetween global and local changes, including the discrimination ofwhat is ‘‘natural” from what is due to the human action.
The Curonian and Vistula Lagoon are the largest coastal lagoonsof the Baltic Sea separated from the sea by narrow sand spits. TheseLagoons are similar in ground types, mean depths, wind and tem-perature regimes, however quite different in continental runoffand water salinity. The main morphometric and hydrological char-acteristics are presented in Table 1. The Curonian and Vistula La-goons play an important part in many fields of the economies ofRussia (Kaliningrad region), Lithuania and Poland. During recentdecades, significant anthropogenic changes have occurred in theLagoons and their watersheds. Ongoing eutrophication is one ofthe most important problems. Until the late 1980s nutrients load-ing exceeded by many times the permissible nutrients loading
Elsevier Ltd.
leading to eutrophication of water body with such mean depths.Multiple reductions of nutrient loading from the watershed areain 1990s owing to the economic crisis in industry and agriculturedid not produce a considerable improvement of the ecological sit-uation. As compared to 1989–1990, the concentration of totalnitrogen and phosphorus in the water of the Curonian Lagoon insummer even increased, causing eutrophication. Eutrophicationof the Curonian Lagoon affects all trophic levels especially theintensity of phytoplankton development. The research of phyto-plankton in the 1980s–2000s showed that the biomass of Cyano-bacteria in summer was always at the level of intensive bloom(above 10 g/m3) and during 10 seasons it reached the hyperbloomstate (above 100 g/m3) (Aleksandrov and Dmitrieva, 2006; Olenina,1998; Olenina and Olenin, 2002).
This article aims to analyze temporal and spatial changes of bio-mass and production of phytoplankton, chlorophyll and nutrientsconcentrations in the water and to evaluate the impact of abioticfactors on biological productivity and ecological conditions of theLagoons.
2. Material and methods
The research was carried out seasonally (from 1993 to 1994) andmonthly (from 1995 to 2007) from March to November at 12 stan-dard stations in the Curonian Lagoon and at 9 stations in the VistulaLagoon (Fig. 1). The hydrological and hydrochemical parameters(water temperature, transparency and salinity, concentration ofnutrients, including phosphate, nitrate, ammonia nitrogen, total
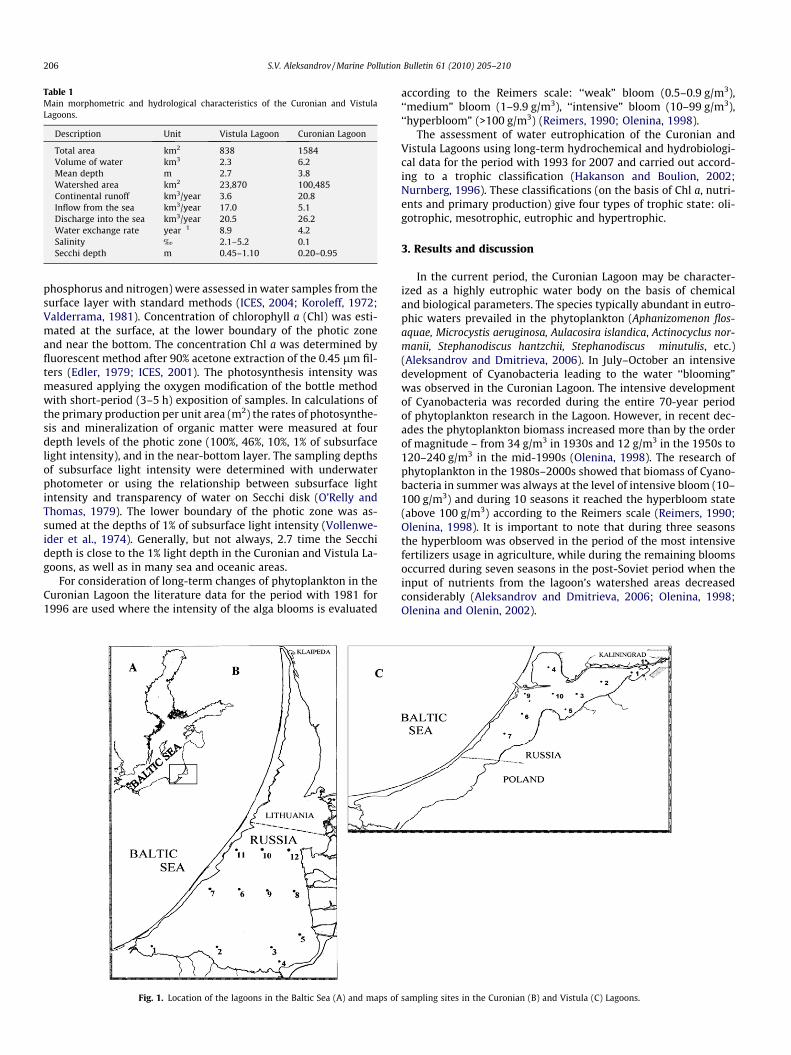
Table 1Main morphometric and hydrological characteristics of the Curonian and VistulaLagoons.
Description Unit Vistula Lagoon Curonian Lagoon
Total area km2 838 1584Volume of water km3 2.3 6.2Mean depth m 2.7 3.8Watershed area km2 23,870 100,485Continental runoff km3/year 3.6 20.8Inflow from the sea km3/year 17.0 5.1Discharge into the sea km3/year 20.5 26.2Water exchange rate year�1 8.9 4.2Salinity ‰ 2.1–5.2 0.1Secchi depth m 0.45–1.10 0.20–0.95
206 S.V. Aleksandrov / Marine Pollution Bulletin 61 (2010) 205–210
phosphorus and nitrogen) were assessed in water samples from thesurface layer with standard methods (ICES, 2004; Koroleff, 1972;Valderrama, 1981). Concentration of chlorophyll a (Chl) was esti-mated at the surface, at the lower boundary of the photic zoneand near the bottom. The concentration Chl a was determined byfluorescent method after 90% acetone extraction of the 0.45 lm fil-ters (Edler, 1979; ICES, 2001). The photosynthesis intensity wasmeasured applying the oxygen modification of the bottle methodwith short-period (3–5 h) exposition of samples. In calculations ofthe primary production per unit area (m2) the rates of photosynthe-sis and mineralization of organic matter were measured at fourdepth levels of the photic zone (100%, 46%, 10%, 1% of subsurfacelight intensity), and in the near-bottom layer. The sampling depthsof subsurface light intensity were determined with underwaterphotometer or using the relationship between subsurface lightintensity and transparency of water on Secchi disk (O’Relly andThomas, 1979). The lower boundary of the photic zone was as-sumed at the depths of 1% of subsurface light intensity (Vollenwe-ider et al., 1974). Generally, but not always, 2.7 time the Secchidepth is close to the 1% light depth in the Curonian and Vistula La-goons, as well as in many sea and oceanic areas.
For consideration of long-term changes of phytoplankton in theCuronian Lagoon the literature data for the period with 1981 for1996 are used where the intensity of the alga blooms is evaluated
Fig. 1. Location of the lagoons in the Baltic Sea (A) and maps of
according to the Reimers scale: ‘‘weak” bloom (0.5–0.9 g/m3),‘‘medium” bloom (1–9.9 g/m3), ‘‘intensive” bloom (10–99 g/m3),‘‘hyperbloom” (>100 g/m3) (Reimers, 1990; Olenina, 1998).
The assessment of water eutrophication of the Curonian andVistula Lagoons using long-term hydrochemical and hydrobiologi-cal data for the period with 1993 for 2007 and carried out accord-ing to a trophic classification (Hakanson and Boulion, 2002;Nurnberg, 1996). These classifications (on the basis of Chl a, nutri-ents and primary production) give four types of trophic state: oli-gotrophic, mesotrophic, eutrophic and hypertrophic.
3. Results and discussion
In the current period, the Curonian Lagoon may be character-ized as a highly eutrophic water body on the basis of chemicaland biological parameters. The species typically abundant in eutro-phic waters prevailed in the phytoplankton (Aphanizomenon flos-aquae, Microcystis aeruginosa, Aulacosira islandica, Actinocyclus nor-manii, Stephanodiscus hantzchii, Stephanodiscus minutulis, etc.)(Aleksandrov and Dmitrieva, 2006). In July–October an intensivedevelopment of Cyanobacteria leading to the water ‘‘blooming”was observed in the Curonian Lagoon. The intensive developmentof Cyanobacteria was recorded during the entire 70-year periodof phytoplankton research in the Lagoon. However, in recent dec-ades the phytoplankton biomass increased more than by the orderof magnitude – from 34 g/m3 in 1930s and 12 g/m3 in the 1950s to120–240 g/m3 in the mid-1990s (Olenina, 1998). The research ofphytoplankton in the 1980s–2000s showed that biomass of Cyano-bacteria in summer was always at the level of intensive bloom (10–100 g/m3) and during 10 seasons it reached the hyperbloom state(above 100 g/m3) according to the Reimers scale (Reimers, 1990;Olenina, 1998). It is important to note that during three seasonsthe hyperbloom was observed in the period of the most intensivefertilizers usage in agriculture, while during the remaining bloomsoccurred during seven seasons in the post-Soviet period when theinput of nutrients from the lagoon’s watershed areas decreasedconsiderably (Aleksandrov and Dmitrieva, 2006; Olenina, 1998;Olenina and Olenin, 2002).
sampling sites in the Curonian (B) and Vistula (C) Lagoons.
S.V. Aleksandrov / Marine Pollution Bulletin 61 (2010) 205–210 207
The occurrence of Cyanobacterial blooms resulted from inten-sive nutrients loading of the Lagoon which occurred up to 1991.During 1989–1990, in the period of maximum fertilizers usage inagriculture and industrial development, the annual input of phos-phorus were 3.7–8.5 g/m2 and that of nitrogen – 60.8–109.6 g/m2.The reduction of industrial production and fertilizer usage in the1990s resulted in a decrease of the external nutrients loading by3–4 times to 0.75–2.3 g/m2 of phosphorus and to 20.8–40.4 g/m2
of nitrogen per year (Cetkauskaite et al., 2000). As a result it wasexpected that we would observe a reduction in nutrients concen-tration in the water and decrease of phytoplankton biomass sincethe 1990s. However, the research showed that neither a decreaseof the trophic status nor an improvement of the ecological situa-tion occurred in the Curonian Lagoon. As compared to the period1989–1990s, the same high concentration of the total phosphorusand nitrogen are observed, which exceeded the level causingeutrophication of water bodies with such mean depths as thosehere.
The eutrophication processes and water ‘‘blooming” were mostpronounced in the southern and central parts (the Russian zone) ofthe Curonian Lagoon (75% of the area), where the environmentalconditions (high concentrations of nutrients in the bed silt, contin-uously resuspension into the water column due to shallow depthsof the Lagoon, absence of the sea water intrusion, slow water ex-
Table 2Pearson correlation coefficients between average for the growing season (April–October) values water temperature and parameters determining trophic status ofwater bodies for the period 1993–2007.
Index Curonian Lagoon Vistula Lagoon
Chlorophyll a 0.67 �0.09Total phosphorus 0.72 �0.29Total nitrogen 0.70 0.02
BA
0
100
200
300
400
500
600
700
IV V VI VII VIII IX X XIMonth
0246810121416182022Chl (µg L
-1) t (°C)
1 2 3 4
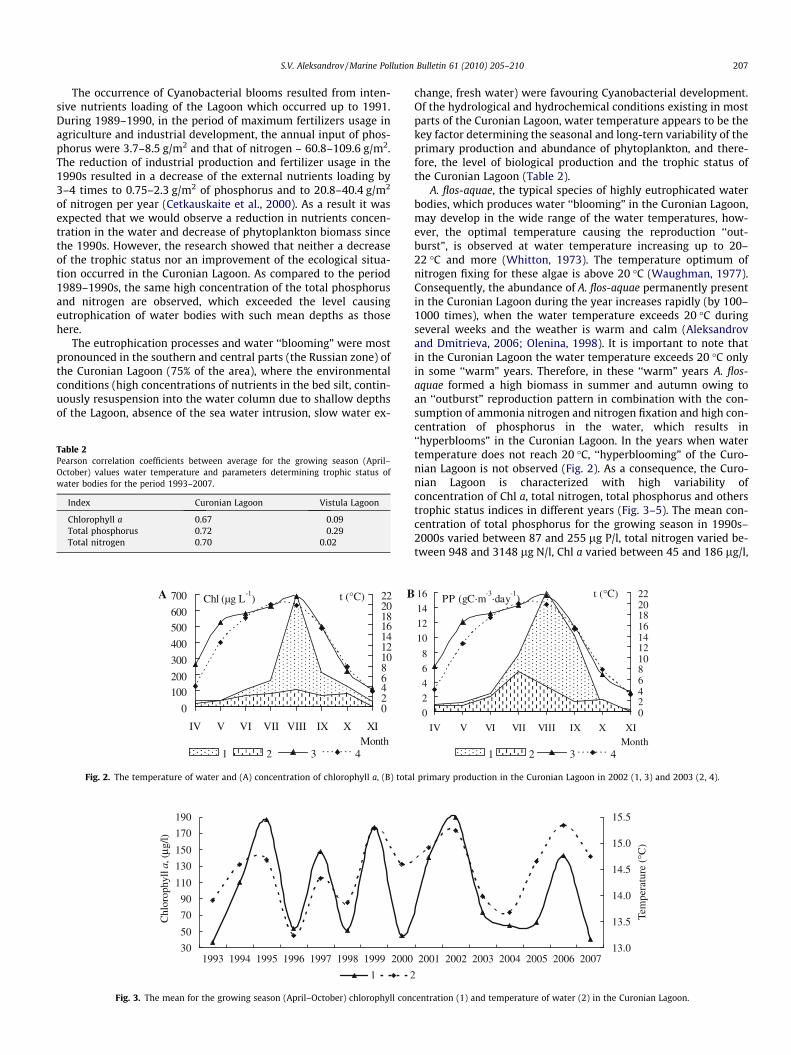
Fig. 2. The temperature of water and (A) concentration of chlorophyll a, (B) tota
30
50
70
90
110
130
150
170
190
1993 1994 1995 1996 1997 1998 1999 2000
Chl
orop
hyll
, (µg
/l)
1 2
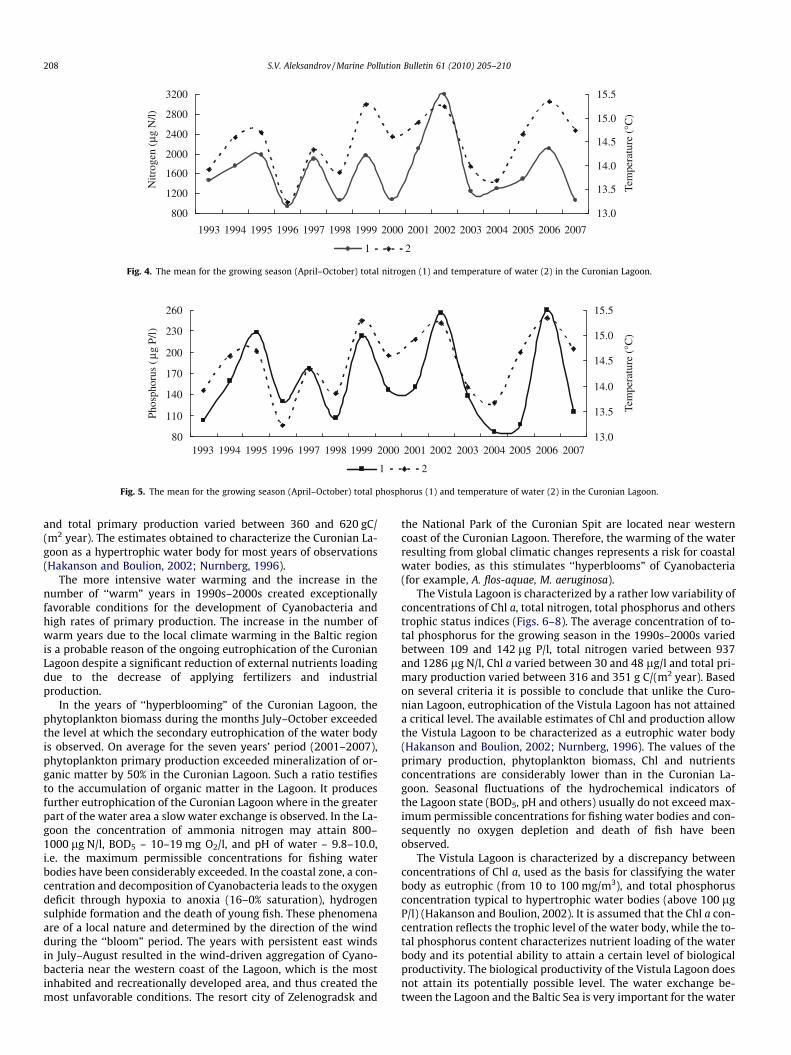
Fig. 3. The mean for the growing season (April–October) chlorophyll con
change, fresh water) were favouring Cyanobacterial development.Of the hydrological and hydrochemical conditions existing in mostparts of the Curonian Lagoon, water temperature appears to be thekey factor determining the seasonal and long-tern variability of theprimary production and abundance of phytoplankton, and there-fore, the level of biological production and the trophic status ofthe Curonian Lagoon (Table 2).
A. flos-aquae, the typical species of highly eutrophicated waterbodies, which produces water ‘‘blooming” in the Curonian Lagoon,may develop in the wide range of the water temperatures, how-ever, the optimal temperature causing the reproduction ‘‘out-burst”, is observed at water temperature increasing up to 20–22 �C and more (Whitton, 1973). The temperature optimum ofnitrogen fixing for these algae is above 20 �C (Waughman, 1977).Consequently, the abundance of A. flos-aquae permanently presentin the Curonian Lagoon during the year increases rapidly (by 100–1000 times), when the water temperature exceeds 20 �C duringseveral weeks and the weather is warm and calm (Aleksandrovand Dmitrieva, 2006; Olenina, 1998). It is important to note thatin the Curonian Lagoon the water temperature exceeds 20 �C onlyin some ‘‘warm” years. Therefore, in these ‘‘warm” years A. flos-aquae formed a high biomass in summer and autumn owing toan ‘‘outburst” reproduction pattern in combination with the con-sumption of ammonia nitrogen and nitrogen fixation and high con-centration of phosphorus in the water, which results in‘‘hyperblooms” in the Curonian Lagoon. In the years when watertemperature does not reach 20 �C, ‘‘hyperblooming” of the Curo-nian Lagoon is not observed (Fig. 2). As a consequence, the Curo-nian Lagoon is characterized with high variability ofconcentration of Chl a, total nitrogen, total phosphorus and otherstrophic status indices in different years (Fig. 3–5). The mean con-centration of total phosphorus for the growing season in 1990s–2000s varied between 87 and 255 lg P/l, total nitrogen varied be-tween 948 and 3148 lg N/l, Chl a varied between 45 and 186 lg/l,
PP (gC·m-3
·day-1
)
0
2
4
6
8
10
12
14
16
IV V VI VII VIII IX X XIMonth
0246810121416182022t (°C)
1 2 3 4
l primary production in the Curonian Lagoon in 2002 (1, 3) and 2003 (2, 4).
2001 2002 2003 2004 2005 2006 200713.0
13.5
14.0
14.5
15.0
15.5
Tem
pera
ture
(°C
)
centration (1) and temperature of water (2) in the Curonian Lagoon.
800
1200
1600
2000
2400
2800
3200
1993 1994 1995 1996 1997 1998 1999 2000 2001 2002 2003 2004 2005 2006 2007
Nitr
ogen
(µg
N/l)
13.0
13.5
14.0
14.5
15.0
15.5
Tem
pera
ture
(°C
)
1 2
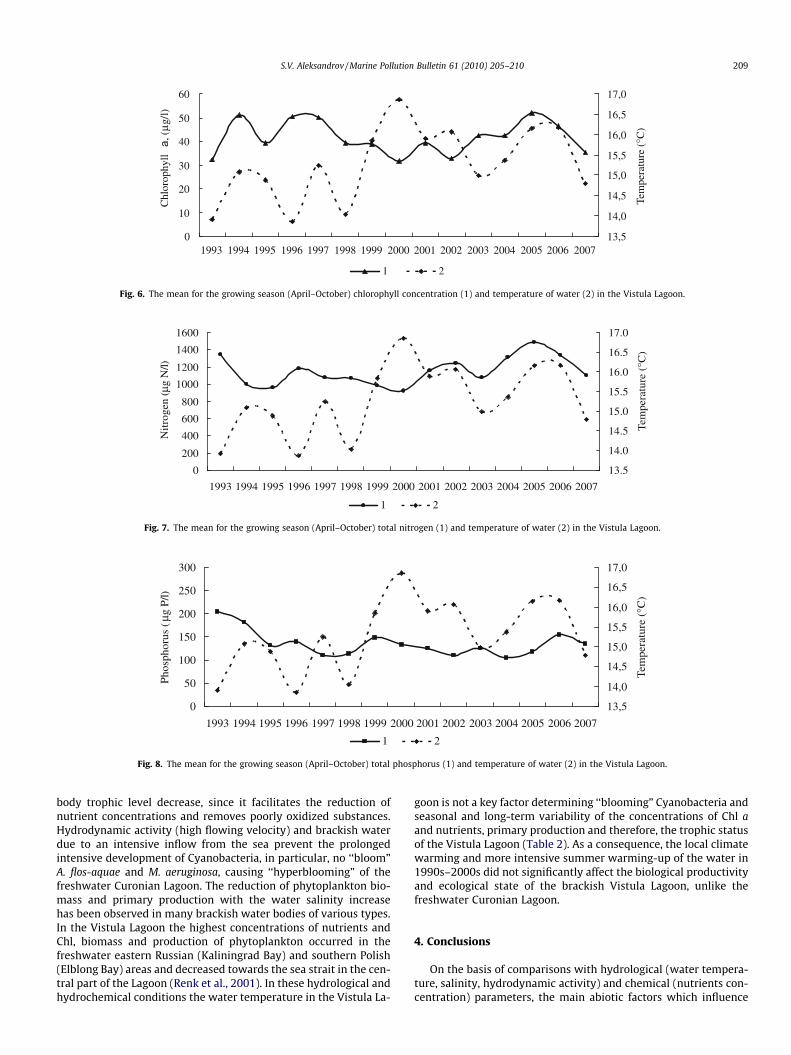
Fig. 4. The mean for the growing season (April–October) total nitrogen (1) and temperature of water (2) in the Curonian Lagoon.
80
110
140
170
200
230
260
1993 1994 1995 1996 1997 1998 1999 2000 2001 2002 2003 2004 2005 2006 2007
Phos
phor
us (
µg P
/l)
13.0
13.5
14.0
14.5
15.0
15.5
Tem
pera
ture
(°C
)
1 2
Fig. 5. The mean for the growing season (April–October) total phosphorus (1) and temperature of water (2) in the Curonian Lagoon.
208 S.V. Aleksandrov / Marine Pollution Bulletin 61 (2010) 205–210
and total primary production varied between 360 and 620 gC/(m2�year). The estimates obtained to characterize the Curonian La-goon as a hypertrophic water body for most years of observations(Hakanson and Boulion, 2002; Nurnberg, 1996).
The more intensive water warming and the increase in thenumber of ‘‘warm” years in 1990s–2000s created exceptionallyfavorable conditions for the development of Cyanobacteria andhigh rates of primary production. The increase in the number ofwarm years due to the local climate warming in the Baltic regionis a probable reason of the ongoing eutrophication of the CuronianLagoon despite a significant reduction of external nutrients loadingdue to the decrease of applying fertilizers and industrialproduction.
In the years of ‘‘hyperblooming” of the Curonian Lagoon, thephytoplankton biomass during the months July–October exceededthe level at which the secondary eutrophication of the water bodyis observed. On average for the seven years’ period (2001–2007),phytoplankton primary production exceeded mineralization of or-ganic matter by 50% in the Curonian Lagoon. Such a ratio testifiesto the accumulation of organic matter in the Lagoon. It producesfurther eutrophication of the Curonian Lagoon where in the greaterpart of the water area a slow water exchange is observed. In the La-goon the concentration of ammonia nitrogen may attain 800–1000 lg N/l, BOD5 – 10–19 mg O2/l, and pH of water – 9.8–10.0,i.e. the maximum permissible concentrations for fishing waterbodies have been considerably exceeded. In the coastal zone, a con-centration and decomposition of Cyanobacteria leads to the oxygendeficit through hypoxia to anoxia (16–0% saturation), hydrogensulphide formation and the death of young fish. These phenomenaare of a local nature and determined by the direction of the windduring the ‘‘bloom” period. The years with persistent east windsin July–August resulted in the wind-driven aggregation of Cyano-bacteria near the western coast of the Lagoon, which is the mostinhabited and recreationally developed area, and thus created themost unfavorable conditions. The resort city of Zelenogradsk and
the National Park of the Curonian Spit are located near westerncoast of the Curonian Lagoon. Therefore, the warming of the waterresulting from global climatic changes represents a risk for coastalwater bodies, as this stimulates ‘‘hyperblooms” of Cyanobacteria(for example, A. flos-aquae, M. aeruginosa).
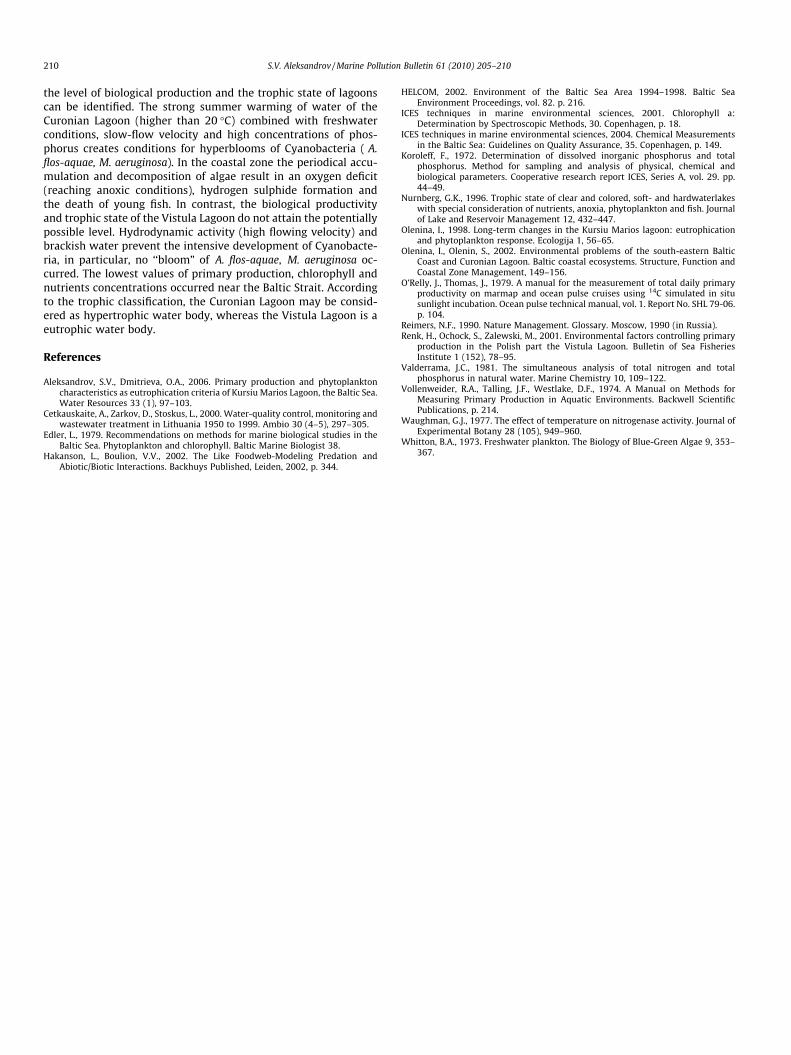
The Vistula Lagoon is characterized by a rather low variability ofconcentrations of Chl a, total nitrogen, total phosphorus and otherstrophic status indices (Figs. 6–8). The average concentration of to-tal phosphorus for the growing season in the 1990s–2000s variedbetween 109 and 142 lg P/l, total nitrogen varied between 937and 1286 lg N/l, Chl a varied between 30 and 48 lg/l and total pri-mary production varied between 316 and 351 g C/(m2 year). Basedon several criteria it is possible to conclude that unlike the Curo-nian Lagoon, eutrophication of the Vistula Lagoon has not attaineda critical level. The available estimates of Chl and production allowthe Vistula Lagoon to be characterized as a eutrophic water body(Hakanson and Boulion, 2002; Nurnberg, 1996). The values of theprimary production, phytoplankton biomass, Chl and nutrientsconcentrations are considerably lower than in the Curonian La-goon. Seasonal fluctuations of the hydrochemical indicators ofthe Lagoon state (BOD5, pH and others) usually do not exceed max-imum permissible concentrations for fishing water bodies and con-sequently no oxygen depletion and death of fish have beenobserved.
The Vistula Lagoon is characterized by a discrepancy betweenconcentrations of Chl a, used as the basis for classifying the waterbody as eutrophic (from 10 to 100 mg/m3), and total phosphorusconcentration typical to hypertrophic water bodies (above 100 lgP/l) (Hakanson and Boulion, 2002). It is assumed that the Chl a con-centration reflects the trophic level of the water body, while the to-tal phosphorus content characterizes nutrient loading of the waterbody and its potential ability to attain a certain level of biologicalproductivity. The biological productivity of the Vistula Lagoon doesnot attain its potentially possible level. The water exchange be-tween the Lagoon and the Baltic Sea is very important for the water
0
10
20
30
40
50
60
1993 1994 1995 1996 1997 1998 1999 2000 2001 2002 2003 2004 2005 2006 2007
Chl
orop
hyll
а, (
µg/l
)
13,5
14,0
14,5
15,0
15,5
16,0
16,5
17,0
Tem
pera
ture
(°C
)
1 2
Fig. 6. The mean for the growing season (April–October) chlorophyll concentration (1) and temperature of water (2) in the Vistula Lagoon.
0
200
400
600
800
1000
1200
1400
1600
1993 1994 1995 1996 1997 1998 1999 2000 2001 2002 2003 2004 2005 2006 2007
Nit
roge
n (µ
g N
/l)
13.5
14.0
14.5
15.0
15.5
16.0
16.5
17.0
Tem
pera
ture
(°C
)
1 2
Fig. 7. The mean for the growing season (April–October) total nitrogen (1) and temperature of water (2) in the Vistula Lagoon.
0
50
100
150
200
250
300
1993 1994 1995 1996 1997 1998 1999 2000 2001 2002 2003 2004 2005 2006 2007
Pho
spho
rus
(µg
P/l)
13,5
14,0
14,5
15,0
15,5
16,0
16,5
17,0
Tem
pera
ture
(°C
)
1 2
Fig. 8. The mean for the growing season (April–October) total phosphorus (1) and temperature of water (2) in the Vistula Lagoon.
S.V. Aleksandrov / Marine Pollution Bulletin 61 (2010) 205–210 209
body trophic level decrease, since it facilitates the reduction ofnutrient concentrations and removes poorly oxidized substances.Hydrodynamic activity (high flowing velocity) and brackish waterdue to an intensive inflow from the sea prevent the prolongedintensive development of Cyanobacteria, in particular, no ‘‘bloom”A. flos-aquae and M. aeruginosa, causing ‘‘hyperblooming” of thefreshwater Curonian Lagoon. The reduction of phytoplankton bio-mass and primary production with the water salinity increasehas been observed in many brackish water bodies of various types.In the Vistula Lagoon the highest concentrations of nutrients andChl, biomass and production of phytoplankton occurred in thefreshwater eastern Russian (Kaliningrad Bay) and southern Polish(Elblong Bay) areas and decreased towards the sea strait in the cen-tral part of the Lagoon (Renk et al., 2001). In these hydrological andhydrochemical conditions the water temperature in the Vistula La-
goon is not a key factor determining ‘‘blooming” Cyanobacteria andseasonal and long-term variability of the concentrations of Chl aand nutrients, primary production and therefore, the trophic statusof the Vistula Lagoon (Table 2). As a consequence, the local climatewarming and more intensive summer warming-up of the water in1990s–2000s did not significantly affect the biological productivityand ecological state of the brackish Vistula Lagoon, unlike thefreshwater Curonian Lagoon.
4. Conclusions
On the basis of comparisons with hydrological (water tempera-ture, salinity, hydrodynamic activity) and chemical (nutrients con-centration) parameters, the main abiotic factors which influence
210 S.V. Aleksandrov / Marine Pollution Bulletin 61 (2010) 205–210
the level of biological production and the trophic state of lagoonscan be identified. The strong summer warming of water of theCuronian Lagoon (higher than 20 �C) combined with freshwaterconditions, slow-flow velocity and high concentrations of phos-phorus creates conditions for hyperblooms of Cyanobacteria ( A.flos-aquae, M. aeruginosa). In the coastal zone the periodical accu-mulation and decomposition of algae result in an oxygen deficit(reaching anoxic conditions), hydrogen sulphide formation andthe death of young fish. In contrast, the biological productivityand trophic state of the Vistula Lagoon do not attain the potentiallypossible level. Hydrodynamic activity (high flowing velocity) andbrackish water prevent the intensive development of Cyanobacte-ria, in particular, no ‘‘bloom” of A. flos-aquae, M. aeruginosa oc-curred. The lowest values of primary production, chlorophyll andnutrients concentrations occurred near the Baltic Strait. Accordingto the trophic classification, the Curonian Lagoon may be consid-ered as hypertrophic water body, whereas the Vistula Lagoon is aeutrophic water body.
References
Aleksandrov, S.V., Dmitrieva, O.A., 2006. Primary production and phytoplanktoncharacteristics as eutrophication criteria of Kursiu Marios Lagoon, the Baltic Sea.Water Resources 33 (1), 97–103.
Cetkauskaite, A., Zarkov, D., Stoskus, L., 2000. Water-quality control, monitoring andwastewater treatment in Lithuania 1950 to 1999. Ambio 30 (4–5), 297–305.
Edler, L., 1979. Recommendations on methods for marine biological studies in theBaltic Sea. Phytoplankton and chlorophyll. Baltic Marine Biologist 38.
Hakanson, L., Boulion, V.V., 2002. The Like Foodweb-Modeling Predation andAbiotic/Biotic Interactions. Backhuys Published, Leiden, 2002, p. 344.
HELCOM, 2002. Environment of the Baltic Sea Area 1994–1998. Baltic SeaEnvironment Proceedings, vol. 82. p. 216.
ICES techniques in marine environmental sciences, 2001. Chlorophyll a:Determination by Spectroscopic Methods, 30. Copenhagen, p. 18.
ICES techniques in marine environmental sciences, 2004. Chemical Measurementsin the Baltic Sea: Guidelines on Quality Assurance, 35. Copenhagen, p. 149.
Koroleff, F., 1972. Determination of dissolved inorganic phosphorus and totalphosphorus. Method for sampling and analysis of physical, chemical andbiological parameters. Cooperative research report ICES, Series A, vol. 29. pp.44–49.
Nurnberg, G.K., 1996. Trophic state of clear and colored, soft- and hardwaterlakeswith special consideration of nutrients, anoxia, phytoplankton and fish. Journalof Lake and Reservoir Management 12, 432–447.
Olenina, I., 1998. Long-term changes in the Kursiu Marios lagoon: eutrophicationand phytoplankton response. Ecologija 1, 56–65.
Olenina, I., Olenin, S., 2002. Environmental problems of the south-eastern BalticCoast and Curonian Lagoon. Baltic coastal ecosystems. Structure, Function andCoastal Zone Management, 149–156.
O’Relly, J., Thomas, J., 1979. A manual for the measurement of total daily primaryproductivity on marmap and ocean pulse cruises using 14C simulated in situsunlight incubation. Ocean pulse technical manual, vol. 1. Report No. SHL 79-06.p. 104.
Reimers, N.F., 1990. Nature Management. Glossary. Moscow, 1990 (in Russia).Renk, H., Ochock, S., Zalewski, M., 2001. Environmental factors controlling primary
production in the Polish part the Vistula Lagoon. Bulletin of Sea FisheriesInstitute 1 (152), 78–95.
Valderrama, J.C., 1981. The simultaneous analysis of total nitrogen and totalphosphorus in natural water. Marine Chemistry 10, 109–122.
Vollenweider, R.A., Talling, J.F., Westlake, D.F., 1974. A Manual on Methods forMeasuring Primary Production in Aquatic Environments. Backwell ScientificPublications, p. 214.
Waughman, G.J., 1977. The effect of temperature on nitrogenase activity. Journal ofExperimental Botany 28 (105), 949–960.
Whitton, B.A., 1973. Freshwater plankton. The Biology of Blue-Green Algae 9, 353–367.