Embed Size (px)
Citation preview
65
Exploring in vivo models to characterize peripheral microcirculation – a pilot study
Explorando modelos in vivo para caracterizar a microcirculação periférica - um estudo piloto
1,2 3 1 4 1,2 Henrique Silva *, Hugo Ferreira , Liliana Tavares , Julia Bujan & L Monteiro Rodrigues1CBIOS – Universidade Lusófona's Research Center for Health Science and Technologies (UDE), Campo
Grande 376, 1749-024, Lisboa, Portugal2Pharmacol. Sc Depart – Universidade de Lisboa, Faculty of Pharmacy, Lisboa, Portugal
3 IBEB, Universidade de Lisboa, Faculty of Sciences de Ciências, Lisboa, Portugal4 Universidad de Alcalá, Faculty of Medicine, Alcalá de Henares, Madrid, Spain
Email: [email protected]
*This project is supported by the grant PADDIC 2012-2013, from ALIES-COFAC and part of the PhD Program in Heath Sciences from U Alcalá and U Lusófona.
Este projecto é apoiado pela concessão PADDIC 2012-2013, a partir de ALIES-COFAC e faz parte do Programa de Doutoramento em Ciências da Saúde pela U. Alcalá e U Lusófona.
__________________________________________________________________________________AbstractIn recent years cutaneous circulation has emerged as an interesting window through which to study microcirculatory function and dysfunction mechanisms. Non-invasive technologies, including Laser Doppler Flowmetry (LDF), transcutaneous gasimetry and Transepidermal Water Loss (TEWL), helped to consider cutaneous circulation as a useful translational model in vascular disease. In this study we attempted to evaluate the response profile from a group of healthy young individuals (n=8), of both genders (24,5 ± 0,8 years old) to three perfusion-conditioning maneuvers in the lower limb - A: leg elevation while seated; B: leg elevation during dorsal decubitus; C: supra-systolic occlusion with a tourniquet-cuff. Measurement techniques included LDF, transcutaneous (tc) pO2 and pCO2 partial pressures, by gasimetry and TEWL by evaporimetry. Descriptive and nonparametric statistics were applied and a 95% confidence level adopted. tcpO2 and tcpCO2 changed significantly during the maneuvers. A reciprocal evolution profile was registered in LDF and TEWL in A and C which might suggest that under the present experimental conditions local perfusion might influence the epidermal “barrier” function. The proposed models seem to be appropriate to characterize the peripheral microcirculation in vivo, justifying further development studies. Keywords: Microcirculatory model; postural reflex; LDF; transcutaneous gases; TEWL
___________________________________________________________________________________________________ResumoNos últimos anos, a circulação cutânea surgiu como uma janela interessante para analisar a função microcirculatória e os mecanismos de disfunção. Tecnologias não-invasivas, incluindo a Fluxometria por Laser Doppler (FLD), gasimetria transcutânea e a Perda Transepidérmica de Água (PTEA), ajudaram a considerar a circulação cutânea como um modelo de translação útil na doença vascular. Neste estudo procurou-se avaliar o perfil de resposta de um grupo de indivíduos jovens saudáveis (n = 8), de ambos os sexos (24,5 ± 0,8 anos de idade) a três manobras de condicionamento da perfusão no membro inferior - A: elevação da perna enquanto sentado, B: elevação da perna enquanto em decúbito dorsal; C: oclusão supra-sistólica com um torniquete. As técnicas de medição incluiram FLD, pressões parciais transcutâneas (tc) pO2 e pCO2 por gasimetria e PTEA por evaporimetria. Foram aplicados testes de estatística descritiva e não paramétrica, sendo adotado um nível de confiança de 95%. As tcpO2 e tcpCO2 alteraram-se significativamente durante as manobras. Foi registado um perfil de evolução recíproca para FLD e PTEA em A e C, o que pode sugerir que, sob as condições experimentais as condições de perfusão local podem influenciar a função epidérmica "barreira". Os modelos propostos parecem ser adequados para caracterizar a microcirculação periférica in vivo, o que justifica estudos de desenvolvimento posteriores.
Palavras-chave: Modelo microcirculatório; reflexo postural; FLD; gases transcutâneos; PTEA________________________________________________________________________________________________
Received / Recebido : 26/04/2013Accepted / Aceite: 12/06/2013
Electronic Edition: http://www.biomedicalandbiopharmaceuticalresearch.com
Biomedical Sciences | Ciências Biomédicas
Biomedical andBiopharmaceuticalResearchJornal de InvestigaçãoBiomédica e Biofarmacêutica
Biomed Biopharm Res. , 2013; (10) 1: 65-72
Introduction
The term “microcirculation” is largely used to designate blood vessels with a diameter of less than 150 μm including arterioles, capillaries and venules. However, a more recent definition was proposed, according to which all vessels responding to an increase of the internal pressure by a myogenic reduction of its diameter, are considered part of the
[1]microcirculation . The cutaneous microcirculation consists of two horizontal plexuses that are located at different depths – a superficial and a deep plexus. The superficial plexus consists of nutritional vessels and is situated 1-1.5 mm below the skin surface, while the deep plexus is situated at the dermal-subcutaneous
[2,3]junction and consists of thermoregulatory vessels . A special feature of the cutaneous microvasculature is the presence of numerous arteriovenous (AV) anastomoses which are vessels connecting skin arterioles and venules in the extremities, mainly present in the hands, feet, ears and nail beds. These AV anastomoses allow the blood to flow directly from the arterioles to the venules of the skin deep vascular plexus, bypassing the high-resistance arterioles and capillaries of the more superficial vascular plexus. Apart from tissue nutrition and heat exchange for thermoregulation, the skin microcirculation may also significantly redistribute
[3]blood flow during stress . In recent years the cutaneous circulation has emerged as an accessible and potentially representative vascular network to observe the microcirculatory function and dysfunction
[4-6]mechanisms . Vascular dysfunction including impaired endothelium-dependent vasodilation, is
[7-10]apparent in the cutaneous circulation and may mirror generalized systemic vascular dysfunction in
[4-6]magnitude and underlying mechanisms . Non-invasive technologies, such as local blood flow by Laser Doppler Flowmetry (LDF), transcutaneous O 2
and CO partial pressures (tcpO and tcpCO ) and 2 2 2
Transepidermal Water Loss (TEWL) help us to look at cutaneous circulation as a useful translational model to investigate mechanisms of vascular disease and to
[11-15]evaluate the in vivo microcirculatory status . The present study explores several dynamical maneuvers developed to assess the in vivo circulation physiology described by these methods.
Materials and Methods
A group of eight young volunteers (24,5 ± 0,8 years old) was selected after informed written consent. Volunteers were healthy, non-smokers, who were not
Introdução
O termo "microcirculação" é largamente utilizado para designar os vasos sanguíneos com um diâmetro menor do que 150 μm, incluindo as arteríolas, capilares e vénulas. No entanto, foi proposta uma definição mais recente, de acordo com o qual todos os vasos que respondem a um aumento da pressão interna por uma redução miogénica do seu diâmetro são considerados
[1]parte da microcirculação . A microcirculação cutânea consiste em dois plexos horizontais que se organizam em diferentes profundidades – um plexo superficial e um plexo profundo. O plexo superficial consiste em vasos nutricionais e está situado 1-1,5 mm abaixo da superfície da pele, enquanto que o plexo profundo está situado na junção dermo-subcutânea e consiste em
[2,3]vasos termorregulatórios . Uma característica especial da microcirculação cutânea é a presença de numerosas anastomoses arteriovenosas (AV), vasos que ligam as arteríolas e vénulas da pele nas extremidades, presentes principalmente nas mãos, pés, orelhas e pregas ungueais. Estes anastomoses AV permitem que o sangue flua directamente das arteríolas para as vénulas da pele plexo vascular profundo, ignorando as arteríolas de alta resistência e os capilares do plexo vascular mais superficial. Além da nutrição tecidual e de troca de calor para a termorregulação da pele microcirculação pode também significativamente
[3]o fluxo sanguíneo redistribuir durante o stress . Nos últimos anos, a circulação cutânea tem emergido como uma rede vascular acessível e potencialmente representativa para examinar os mecanismos de função
[4-6]e disfunção da microcirculação . A disfunção vascular, incluindo a diminuição da vasodilatação dependente do endotélio, é aparente na circulação
[7-10]cutânea e pode espelhar a disfunção vascular sistémica generalizada em termos de magnitude e de
[4-6]mecanismos subjacentes . Tecnologias não invasivas, tais como o fluxo sanguíneo local por Fluxometria por Laser Doppler (FLD), pressões parciais transcutâneas de O e CO (tcpO e tcpCO ) e 2 2 2 2
perda transepidérmica de água (PTEA) ajudam a olhar para a circulação cutânea como um modelo de translação útil para investigar os mecanismos de doença vascular e para avaliar o estado da
[11-15]microcirculação in vivo . O presente estudo explora várias manobras dinâmicas desenvolvidas para avaliar a fisiologia da circulação in vivo descrita por esses métodos.
Materiais e Métodos
Um grupo de oito voluntários jovens (24,5 ± 0,8 anos de idade) foi selecionado após consentimento informado por escrito. Os voluntários eram saudáveis,
Henrique Silva et al.
66
taking any kind of medication. Restrictions included physical exercise and caffeine and alcohol consumption 24 hours before procedures. To exclude peripheral arterial disease, the Ankle Brachial Index (ABI) was calculated by measuring the ankle and the forearm blood pressures (Tensoval Comfort Hartmann). All procedures complied with the ethical standards for human research outlined in the Declaration of Helsinki and subsequent amendments. Studied variables, obtained in distal locations of the lower limb, involved microcirculatory blood flow in the inferior side of the second toe, expressed in arbitrary units (AU) by LDF (PeriFlux PF5000, PF5010 System, Perimed, Sweden); tcpO /tcpCO on 2 2
the root of the second toe, by transcutaneous gasimetry (Periflux PF5000, PF5040 tcpO /tcpCO System, 2 2
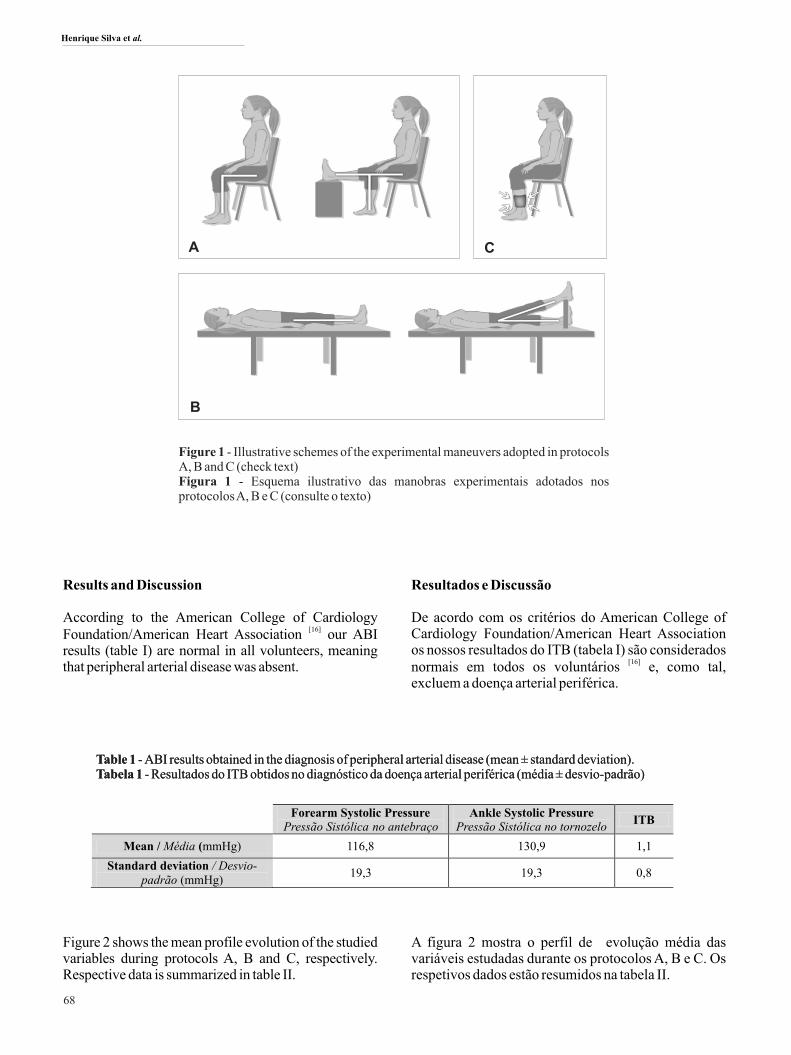
Perimed, Sweden); and TEWL on the inner side of the foot, on the projection of the first metatarsophalangeal joint, by evaporimetry (Tewameter TM300, CK electronics, Germany). After acclimatization volunteers performed three designed protocols (Figure 1) - two involving postural change maneuvers (protocols A and B) and one protocol involving the application of a supra-systolic tourniquet-cuff maneuver (protocol C). Each protocol consisted of three phases – resting (phase I), provocation (phase II) and post-provocation (phase III) as follows:
Protocol A (Figure 1): The volunteer remains seated for 10 minutes with the knee positioned at 90º. The leg is positioned in a 180º resting position for another 10 minutes. After this period, the initial position is resumed for a further 10 minutes.Protocol B (Figure 1): The volunteer remains in a dorsal decubitus position for 10 minutes with the leg positioned at a 180º angle in relation to the body axis. The leg is positioned at a 30º angle for another 10 minutes. After this period, the initial position is resumed for a further 10 minutes.Protocol C (Figure 1): The volunteer remains seated for 10 minutes with the knee positioned at 90º. Then, a t o u r n i q u e t - c u f f ( P r o f e s s i o n a l A n e r o i d Sphygmomanometer MDF® 808B) is placed around the ankle and inflated above systolic pressure (200 mmHg) for 3 minutes reducing flow to a minimal. Then the cuff is removed allowing recovery for another 10 minutes.The statistical analysis was performed with the Wilcoxon matched-pairs signed-rank test (IBM SPSS Statistics for Windows, Version 20.0. Armonk, NY: IBM Corp), and a 95% confidence interval adopted. .
não-fumadores, e não tomavam qualquer tipo de medicação. Restrições incluíram o exercício físico e o consumo de cafeína e álcool 24 horas antes dos procedimentos. Para excluir a doença arterial periférica foi calculado o Índice Tornozelo-Braquial (ITB) medindo as pressões arteriais no tornozelo e no antebraço (Tensoval Confort Hartmann). Todos os procedimentos cumpriram com as normas éticas para a investigação em seres humanos previstas pela Declaração de Helsínquia e emendas subsequentes. As variáveis estudadas, obtidas em zonas distais do membro inferior, incluíram o fluxo sanguíneo microcirculatório na inferior do segundo dedo do pé, expressa em unidades arbitrárias (UA) por FLD (PeriFlux PF5000, Sistema PF5010, Perimed, Suécia), tcpO /tcpCO na raíz do segundo dedo do pé por 2 2
gasimetria transcutânea (Periflux PF5000, Sistema PF5040 tcpO /tcpCO , Perimed, Suécia) e PTEA no 2 2
lado interno do pé, na projeção da primeira articulação metatarsofalângica por evaporimetria (Tewameter TM300, CK Electronics, Alemanha). Após aclimatação os voluntários realizaram três protocolos personalizados (Figura 1) – dois deles envolvendo manobras de alteração postural (protocolos A e B) e um protocolo que envolveu a aplicação de um torniquete a pressão supra-sistólica (protocolo C). Cada protocolo consistiu em três fases - repouso (fase I), provocação (fase II) e pós-provocação (fase III) como se segue:
Protocolo A (Figura 1): O voluntário permanece por 10 minutos sentado com o seu joelho fletido a 90º. De seguida eleva a perna durante 10 minutos de modo a que o membro inferior faça um ângulo de 180º. Finalmente, retorna à posição inicial por mais 10 minutos.Protocolo B (Figura 1): O voluntário permanece em decúbito dorsal por 10 minutos com a perna posicionada a um ângulo de 180º em relação ao eixo do corpo. De seguida eleva a perna a um ângulo de 30º por 10 minutos. Depois deste período, retorna à posição inicial por mais 10 minutos.Protocolo C (Figura 1): O voluntário permanece por 10 minutos sentado com o seu joelho fletido a 90º. Enquanto mantém esta postura, é aplicado um torniquete (Professional Aneroid Sphygmomanometer MDF® 808B) acima da pressão sistólica (200 mmHg) durante 3 minutos, reduzindo o fluxo sanguíneo a um mínimo. Finalmente, o torniquete é removido e o voluntário permanece sentado por mais 10 minutos.A análise estatística foi realizada através do teste de Wilcoxon para amostras emparelhadas com a adoção de um intervalo de confiança de 95% (IBM SPSS Statistics for Windows, Versão 20.0. Armonk, NY: IBM Corp).
Exploring in vivo microcirculation models Explorando modelos in vivo para caractrrizar a microcirculação
67
Results and Discussion
According to the American College of Cardiology [16]
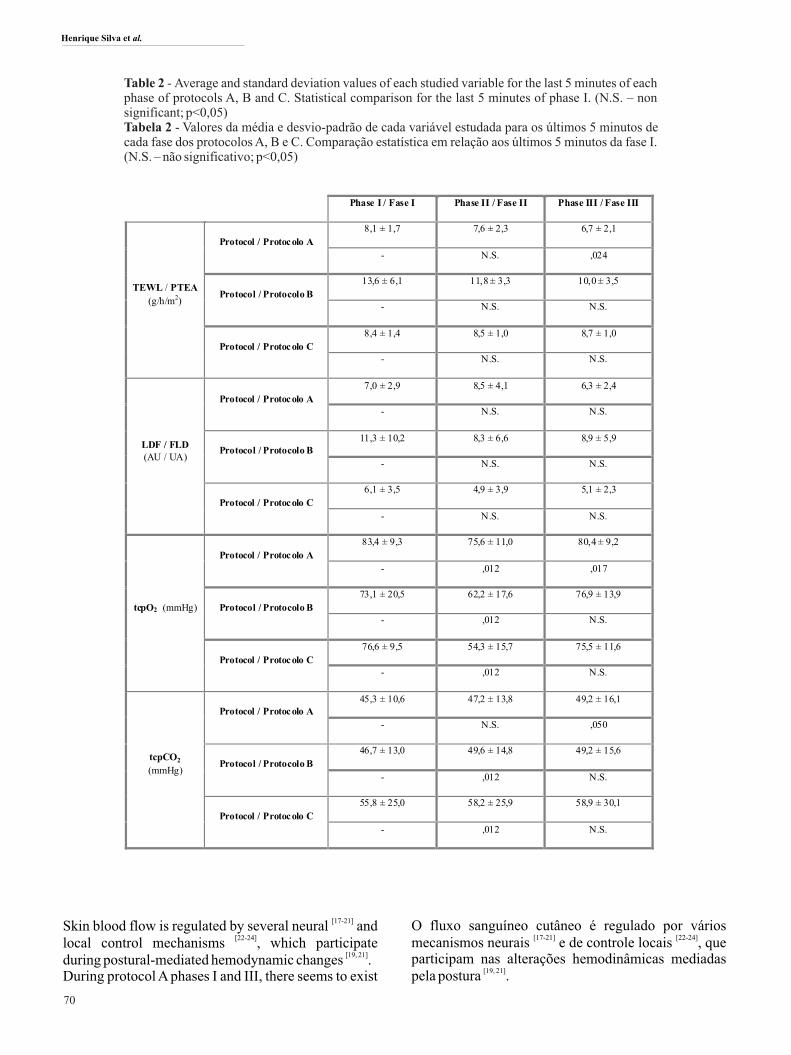
Foundation/American Heart Association our ABI results (table I) are normal in all volunteers, meaning that peripheral arterial disease was absent.
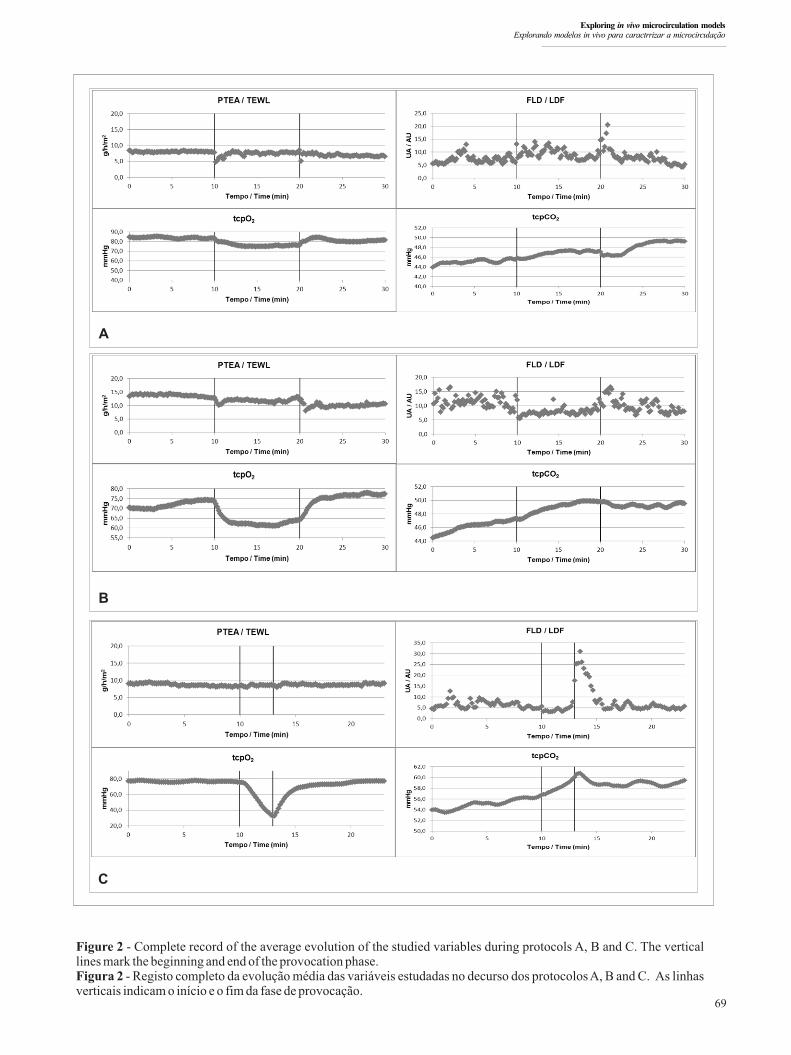
Figure 2 shows the mean profile evolution of the studied variables during protocols A, B and C, respectively. Respective data is summarized in table II.
Resultados e Discussão
De acordo com os critérios do American College of Cardiology Foundation/American Heart Association os nossos resultados do ITB (tabela I) são considerados
[16]normais em todos os voluntários e, como tal, excluem a doença arterial periférica.
A figura 2 mostra o perfil de evolução média das variáveis estudadas durante os protocolos A, B e C. Os respetivos dados estão resumidos na tabela II.
68
Figure 1 - Illustrative schemes of the experimental maneuvers adopted in protocols A, B and C (check text)Figura 1 - Esquema ilustrativo das manobras experimentais adotados nos protocolos A, B e C (consulte o texto)
A C
B
Forearm Systolic Pressure
Pressão Sistólica no antebraço Ankle Systolic Pressure
Pressão Sistólica no tornozelo ITB
Mean / Média (mmHg) 116,8 130,9 1,1
Standard deviation / Desvio-padrão (mmHg)
19,3 19,3 0,8
Table 1 - ABI results obtained in the diagnosis of peripheral arterial disease (mean ± standard deviation).Tabela 1 - Resultados do ITB obtidos no diagnóstico da doença arterial periférica (média ± desvio-padrão)Table 1 - ABI results obtained in the diagnosis of peripheral arterial disease (mean ± standard deviation).Tabela 1 - Resultados do ITB obtidos no diagnóstico da doença arterial periférica (média ± desvio-padrão)
Henrique Silva et al.
69
C
A
B
Figure 2 - Complete record of the average evolution of the studied variables during protocols A, B and C. The vertical lines mark the beginning and end of the provocation phase.Figura 2 - Registo completo da evolução média das variáveis estudadas no decurso dos protocolos A, B and C. As linhas verticais indicam o início e o fim da fase de provocação.
Exploring in vivo microcirculation models Explorando modelos in vivo para caractrrizar a microcirculação
[17-21]Skin blood flow is regulated by several neural and [22-24]local control mechanisms , which participate
[19, 21]during postural-mediated hemodynamic changes .During protocol A phases I and III, there seems to exist
O fluxo sanguíneo cutâneo é regulado por vários [17-21] [22-24]
mecanismos neurais e de controle locais , que participam nas alterações hemodinâmicas mediadas
[19, 21]pela postura .
70
Phase I / Fase I Phase II / Fase II Phase III / Fase III
TEWL / PTEA
(g/h/m2)
Protocol / Protocolo A
8,1 ± 1,7 7,6 ± 2,3 6,7 ± 2,1
- N.S. ,024
Protocol / Protocolo B
13,6 ± 6,1 11,8 ± 3,3 10,0 ± 3,5
- N.S. N.S.
Protocol / Protocolo C
8,4 ± 1,4 8,5 ± 1,0 8,7 ± 1,0
- N.S. N.S.
LDF / FLD (AU / UA)
Protocol / Protocolo A
7,0 ± 2,9 8,5 ± 4,1 6,3 ± 2,4
- N.S. N.S.
Protocol / Protocolo B 11,3 ± 10,2 8,3 ± 6,6 8,9 ± 5,9
- N.S. N.S.
Protocol / Protocolo C
6,1 ± 3,5 4,9 ± 3,9 5,1 ± 2,3
- N.S. N.S.
tcpO2 (mmHg)
Protocol / Protocolo A
83,4 ± 9,3 75,6 ± 11,0 80,4 ± 9,2
- ,012 ,017
Protocol / Protocolo B
73,1 ± 20,5 62,2 ± 17,6 76,9 ± 13,9
- ,012 N.S.
Protocol / Protocolo C
76,6 ± 9,5 54,3 ± 15,7 75,5 ± 11,6
- ,012 N.S.
tcpCO2
(mmHg)
Protocol / Protocolo A 45,3 ± 10,6 47,2 ± 13,8 49,2 ± 16,1
- N.S. ,050
Protocol / Protocolo B
46,7 ± 13,0 49,6 ± 14,8 49,2 ± 15,6
- ,012 N.S.
Protocol / Protocolo C
55,8 ± 25,0 58,2 ± 25,9 58,9 ± 30,1
- ,012 N.S.
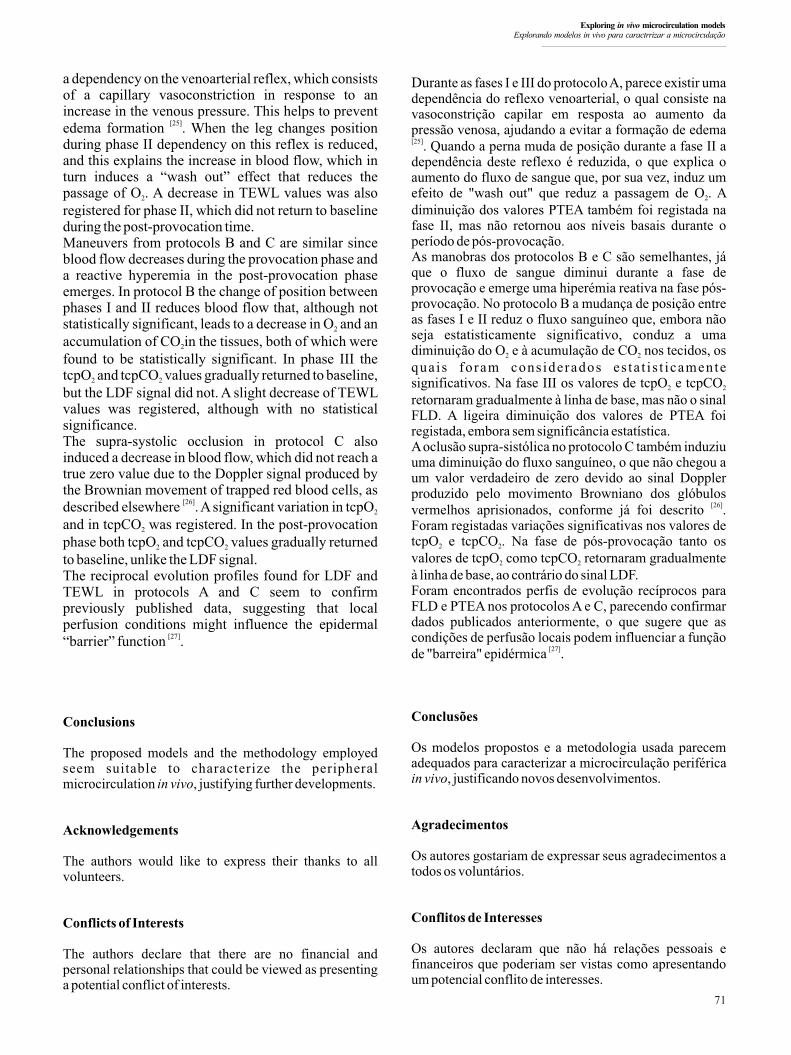
Table 2 - Average and standard deviation values of each studied variable for the last 5 minutes of each phase of protocols A, B and C. Statistical comparison for the last 5 minutes of phase I. (N.S. – non significant; p<0,05)Tabela 2 - Valores da média e desvio-padrão de cada variável estudada para os últimos 5 minutos de cada fase dos protocolos A, B e C. Comparação estatística em relação aos últimos 5 minutos da fase I. (N.S. – não significativo; p<0,05)
Henrique Silva et al.
a dependency on the venoarterial reflex, which consists of a capillary vasoconstriction in response to an increase in the venous pressure. This helps to prevent
[25]edema formation . When the leg changes position during phase II dependency on this reflex is reduced, and this explains the increase in blood flow, which in turn induces a “wash out” effect that reduces the passage of O . A decrease in TEWL values was also 2
registered for phase II, which did not return to baseline during the post-provocation time.Maneuvers from protocols B and C are similar since blood flow decreases during the provocation phase and a reactive hyperemia in the post-provocation phase emerges. In protocol B the change of position between phases I and II reduces blood flow that, although not statistically significant, leads to a decrease in O and an 2
accumulation of CO in the tissues, both of which were 2
found to be statistically significant. In phase III the tcpO and tcpCO values gradually returned to baseline, 2 2
but the LDF signal did not. A slight decrease of TEWL values was registered, although with no statistical significance.The supra-systolic occlusion in protocol C also induced a decrease in blood flow, which did not reach a true zero value due to the Doppler signal produced by the Brownian movement of trapped red blood cells, as
[26]described elsewhere . A significant variation in tcpO 2
and in tcpCO was registered. In the post-provocation 2
phase both tcpO and tcpCO values gradually returned 2 2
to baseline, unlike the LDF signal.The reciprocal evolution profiles found for LDF and TEWL in protocols A and C seem to confirm previously published data, suggesting that local perfusion conditions might influence the epidermal
[27]“barrier” function .
Conclusions
The proposed models and the methodology employed seem suitable to characterize the peripheral microcirculation in vivo, justifying further developments.
Acknowledgements
The authors would like to express their thanks to all volunteers.
Conflicts of Interests
The authors declare that there are no financial and personal relationships that could be viewed as presenting a potential conflict of interests.
Durante as fases I e III do protocolo A, parece existir uma dependência do reflexo venoarterial, o qual consiste na vasoconstrição capilar em resposta ao aumento da pressão venosa, ajudando a evitar a formação de edema [25]. Quando a perna muda de posição durante a fase II a dependência deste reflexo é reduzida, o que explica o aumento do fluxo de sangue que, por sua vez, induz um efeito de "wash out" que reduz a passagem de O . A 2
diminuição dos valores PTEA também foi registada na fase II, mas não retornou aos níveis basais durante o período de pós-provocação.As manobras dos protocolos B e C são semelhantes, já que o fluxo de sangue diminui durante a fase de provocação e emerge uma hiperémia reativa na fase pós-provocação. No protocolo B a mudança de posição entre as fases I e II reduz o fluxo sanguíneo que, embora não seja estatisticamente significativo, conduz a uma diminuição do O e à acumulação de CO nos tecidos, os 2 2
quais foram cons iderados es ta t i s t icamente significativos. Na fase III os valores de tcpO e tcpCO 2 2
retornaram gradualmente à linha de base, mas não o sinal FLD. A ligeira diminuição dos valores de PTEA foi registada, embora sem significância estatística.A oclusão supra-sistólica no protocolo C também induziu uma diminuição do fluxo sanguíneo, o que não chegou a um valor verdadeiro de zero devido ao sinal Doppler produzido pelo movimento Browniano dos glóbulos
[26]vermelhos aprisionados, conforme já foi descrito . Foram registadas variações significativas nos valores de tcpO e tcpCO . Na fase de pós-provocação tanto os 2 2
valores de tcpO como tcpCO retornaram gradualmente 2 2
à linha de base, ao contrário do sinal LDF. Foram encontrados perfis de evolução recíprocos para FLD e PTEA nos protocolos A e C, parecendo confirmar dados publicados anteriormente, o que sugere que as condições de perfusão locais podem influenciar a função
[27]de "barreira" epidérmica .
Conclusões
Os modelos propostos e a metodologia usada parecem adequados para caracterizar a microcirculação periférica in vivo, justificando novos desenvolvimentos.
Agradecimentos
Os autores gostariam de expressar seus agradecimentos a todos os voluntários.
Conflitos de Interesses
Os autores declaram que não há relações pessoais e financeiros que poderiam ser vistas como apresentando um potencial conflito de interesses.
71
Exploring in vivo microcirculation models Explorando modelos in vivo para caractrrizar a microcirculação
[1]. Jonk AM, Houben AJ, de Jongh RT, Serné EH, Schaper NC, Stehouwer CD. Microvascular Dysfunction in Obesity: A Potential Mechanism in the Pathogenesis of Obesity-Associated Insulin Resistance and Hypertension. Physiology 2007; 22: 252–260[2].Braverman IM. The cutaneous microcirculation. J Investig Dermatol Symp Proc 2000; 5(1): 3-9[3].Roddie I. Circulation to skin and adipose tissue. Geiger S editor, The Cardiovascular System. American Physiological Society, Bethesda, MD; 1983. p. 285–317[4]. Abularrage CJ, Sidawy AN, Aidinian G, Singh N, Weiswasser JM, Arora S. Evaluation of the microcirculation in vascular disease. J Vasc Surg 2005; 42: 574–581[5].Izjerman RG, de Jongh RT, Beijk MA, van Weissenbruch MM, Delemarre-van de Waal HA, Serne EH, Stehouwer CD. Individuals at increased coronary heart disease risk are characterized by an impaired microvascular function in skin. Eur J Clin Invest 2003; 33: 536–542[6]. Stewart J, Kohen A, Brouder D, Rahim F, Adler S, Garrick R, Goligorsky MS. Noninvasive interrogation of microvasculature for signs of endothelial dysfunction in patients with chronic renal failure. Am J Physiol Heart Circ Physiol 2004; 287: H2687–E2696[7]. Lindstedt IH, Edvinsson ML, Edvinsson L. R e d u c e d r e s p o n s i v e n e s s o f c u t a n e o u s microcirculation in essential hypertension—a pilot study. Blood Pressure 2006; 15: 275–280[8]. Holowatz LA, Kenney WL. Local ascorbate administration augments NO- and non-NO-dependent reflex cutaneous vasodilation in hypertensive humans. Am J Physiol Heart Circ Physiol 293: H1090–H1096.
[9].Holowatz LA, Kenney WL. Up-regulation of arginase activity contributes to attenuated reflex cutaneous vasodilatation in hypertensive humans. J Physiol 2007; 581: 863–872[10].Carberry PA, Shepherd AM, Johnson JM. Resting and maximal forearm skin blood flows are reduced in hypertension. Hypertension 1992; 20: 349–355[11].Takiwaki H: Measurement of transcutaneous oxygen tension, in "Hand Book of Non-Invasive Methods and the Skin" Ed. J. Serup & G.B.E Jemec, CRC Press, Boca Raton, 1995; 185-195[12].Nickelsen CN: Measurement of Transcutaneous pCO2, in "Handbook of non-invasive Methods and the Skin", Eds. J. Serup & G. Gemec, CRC Press, Boca Raton, 1995; 197-200[13].Rodrigues L, Ferro IZ, Galego N, Pinto P, Silva N, Rey-Salgueiros Y: Study on the application of transcutaneous pO2 and pCO2 monitoring to the in vivo functional characterisation of the normal human skin, Piel span 1998; 13: 380-388[14].Berardesca E, Leveque JL, Masson Ph, the EEMCO Group, EEMCO guidance for the measurement of skin microcirculation: Skin Pharmacol AppI Skin Physiol 2001[15].Hauser CJ, Klein SR, Mehringer CM, Apple P, Shoemaker WC. Superiority of transcutaneous oximetry in noninvasive vascular diagnosis in patients with diabetes Arch Surg 1984; 119: 690-694[16].Anderson JL, Halperin JL, Albert N, Bozkurt B, Brindis RG, Curtis LH et al. Management of Patients With Peripheral Artery Disease (Compilation of 2005 and 2011 ACCF/AHA Guideline Recommendations): A Report of the American College of Cardiology Foundation/American Heart Association Task Force on Practice Guidelines. J Am Coll Cardiol 2013; 61(14):1555-1570
[17].Hassan, A, Tooke, JE. Mechanism of the postural vasoconstrictor response in the human foot. Clin Sci 1988; 75: 379–387[18].Henriksen O. Sympathetic reflex control of blood flow in human peripheral tissues. Acta Physiol Scand 1991; 143: 33–39[19].Rayman G, Hassan A, Tooke JE. Blood flow in the skin of the foot related to posture in diabetes mellitus. Br Med J 1986; 292: 87–90[20].Hamdy O, Abou-Elenin K, LoGerfo FW, Horton ES, Veves A. Contribution of nerve-axon reflex-related vasodilation to the total skin vasodilation in diabetic patients with and without neuropathy. Diabetes Care 2001; 24: 344–349[21].Rodrigues LM, Pinto PC, Leal A. Transcutaneous flow related variables measured in vivo: the effects of gender. BMC Dermatol 2001; 1:4[22].Vane JR, Anggård EE, Botting RM. Regulatory functions of the vascular endothelium. N Engl JMed 1990; 323: 27–36[23].Kellogg DL Jr. In vivo mechanisms of cutaneous vasodilation and vasoconstriction in humans during thermoregulatory challenges. J Appl Physiol 2006; 100: 1709-1718[24].Hassan, A, Tooke, JE. Mechanism of the postural vasoconstrictor response in the human foot. Clin Sci 1988; 75: 379-387 [25].Johnson JM, Kellogg DL Jr. (2010). Thermoregulatory and thermal control in the human cutaneous circulation. Front Biosci, S2: 825-53[26].Rajan V, Varghese B, van Leeuwen TG, Steenbergen W. Review of methodological developments in laser Doppler flowmetry. Lasers Med Sci 2009; 24(2): 269-83[27].Rodrigues LM, Pinto PC, Magro JM, Fernandes M, Alves J. Exploring the Influence of skin perfusion on transepidermal water loss. Skin Res Technol 2004, 10 (4): 257-62
References / Referências
72
Henrique Silva et al.