Embed Size (px)
Citation preview
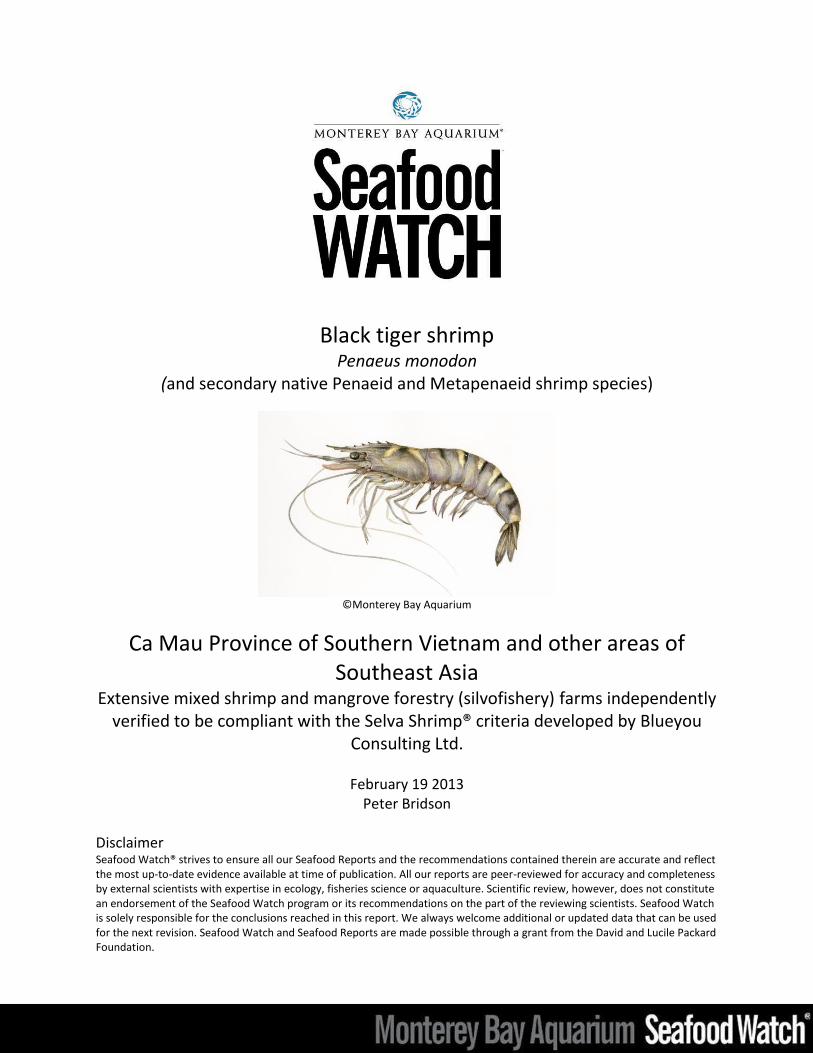
Black tiger shrimp Penaeus monodon
(and secondary native Penaeid and Metapenaeid shrimp species)
©Monterey Bay Aquarium
Ca Mau Province of Southern Vietnam and other areas of Southeast Asia
Extensive mixed shrimp and mangrove forestry (silvofishery) farms independently verified to be compliant with the Selva Shrimp® criteria developed by Blueyou
Consulting Ltd.
February 19 2013 Peter Bridson
Disclaimer Seafood Watch® strives to ensure all our Seafood Reports and the recommendations contained therein are accurate and reflect the most up-to-date evidence available at time of publication. All our reports are peer-reviewed for accuracy and completeness by external scientists with expertise in ecology, fisheries science or aquaculture. Scientific review, however, does not constitute an endorsement of the Seafood Watch program or its recommendations on the part of the reviewing scientists. Seafood Watch is solely responsible for the conclusions reached in this report. We always welcome additional or updated data that can be used for the next revision. Seafood Watch and Seafood Reports are made possible through a grant from the David and Lucile Packard Foundation.
2
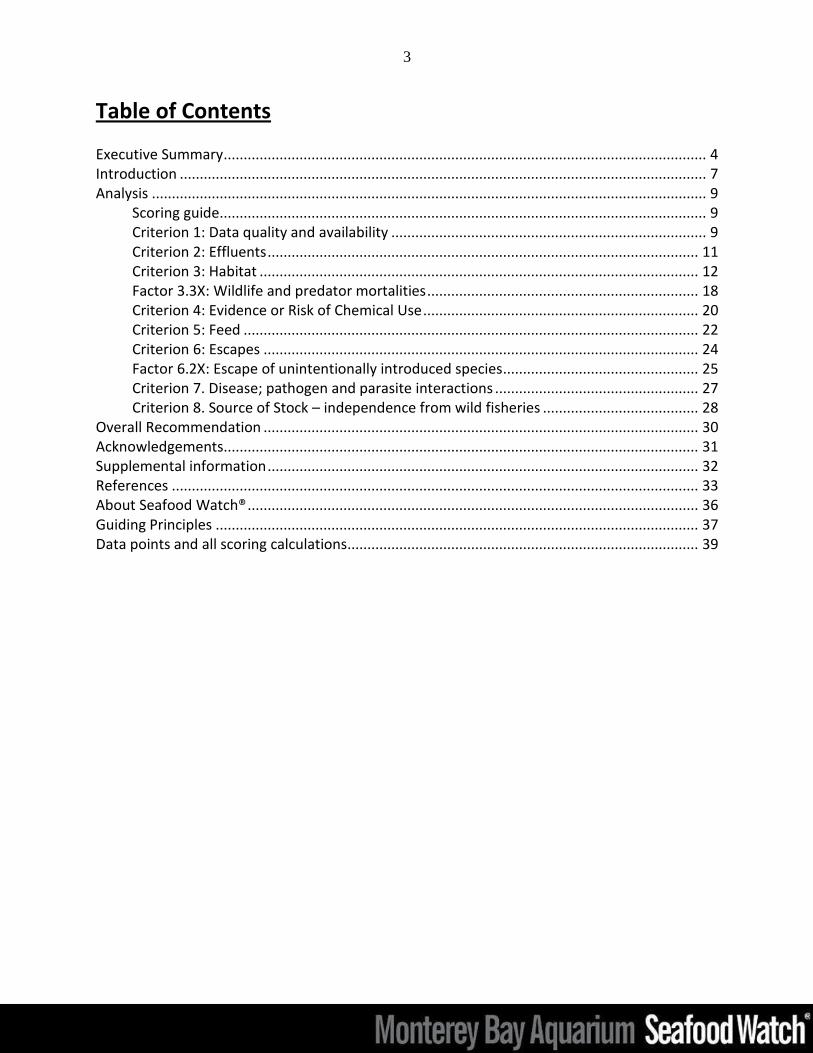
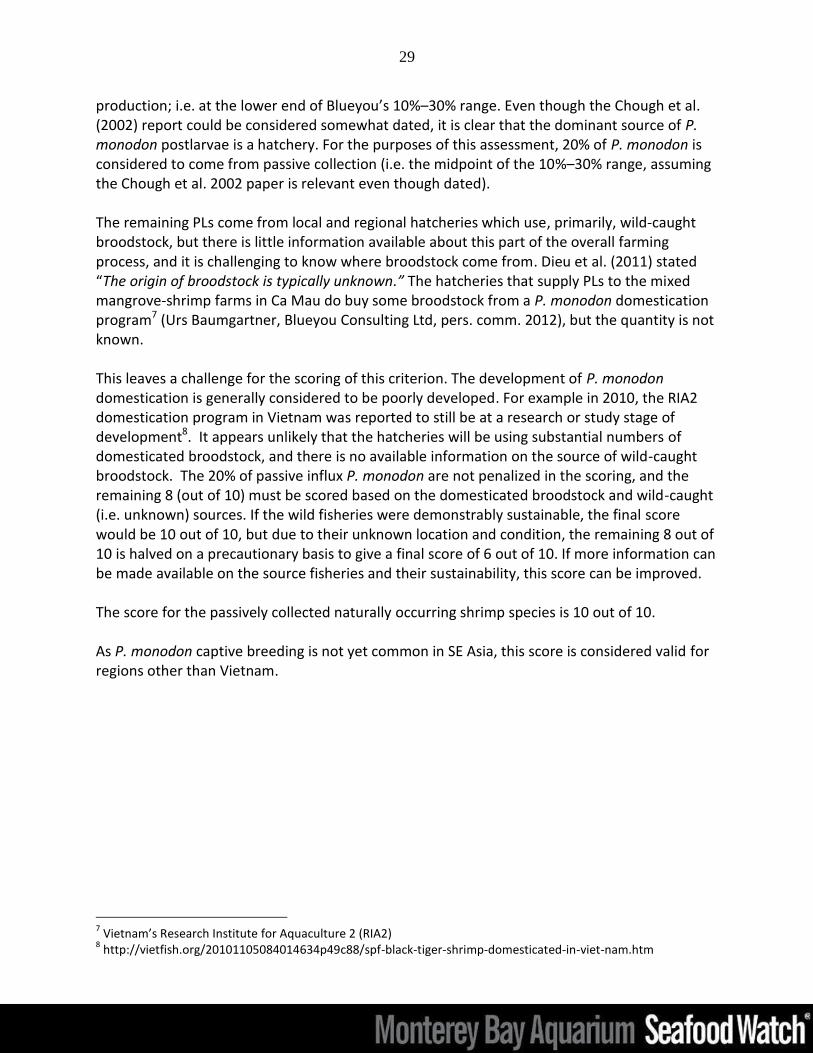
Final Seafood Recommendation
The silvofishery production system scores well for many criteria. With a final numerical score of 7.12 out of 10 and no red criteria, the final recommendation for P. monodon and other
passively collected wild shrimp species that enter the ponds is a green “Best Choice.”
Black tiger shrimp (Penaeus monodon); Banana prawn (Penaeus merguiensis); Greasyback shrimp (Metapenaeus ensis); Bird shrimp (Metapenaeus lysianassa); Indian white shrimp (Penaeus indicus) Region: Ca Mau Province of Southern Vietnam and other areas of Southeast Asia Method: Extensive mixed shrimp and mangrove forestry (silvofishery) farms independently verified to be compliant with the Selva Shrimp® criteria developed by Blueyou Consulting Ltd. For other shrimp species Penaeus merguiensis, Metapenaeus ensis, M. lysianassa, P. indicus (or other passively collected native species) the C6 and C8 criteria are scored 10, and the final score is 7.87 with no “Red” criteria. The final rank for these species from this production system is green.
Criterion Score (0-10) Rank Critical?
C1 Data 6.07 YELLOW
C2 Effluent 10.00 GREEN NO
C3 Habitat 3.87 YELLOW NO
C4 Chemicals 7.00 GREEN NO
C5 Feed 10.00 GREEN NO
C6 Escapes 8.00 GREEN NO
C7 Disease 8.00 GREEN NO
C8 Source 6.00 YELLOW
3.3X Wildlife mortalities -2.00 GREEN NO
6.2X Introduced species escape 0.00 GREEN
Total 56.94
Final score 7.12
OVERALL RANKING
Final Score 56.94
Initial rank GREEN
Red criteria 0
Interim rank GREEN
Critical Criteria? NO
Final Rank BEST CHOICE
Scoring note–scores range from zero to ten where zero indicates very poor performance and ten indicates the aquaculture operations have no significant impact.
3
Table of Contents Executive Summary ......................................................................................................................... 4
Introduction .................................................................................................................................... 7
Analysis ........................................................................................................................................... 9
Scoring guide .......................................................................................................................... 9
Criterion 1: Data quality and availability ............................................................................... 9
Criterion 2: Effluents ............................................................................................................ 11
Criterion 3: Habitat .............................................................................................................. 12
Factor 3.3X: Wildlife and predator mortalities .................................................................... 18
Criterion 4: Evidence or Risk of Chemical Use ..................................................................... 20
Criterion 5: Feed .................................................................................................................. 22
Criterion 6: Escapes ............................................................................................................. 24
Factor 6.2X: Escape of unintentionally introduced species................................................. 25
Criterion 7. Disease; pathogen and parasite interactions ................................................... 27
Criterion 8. Source of Stock – independence from wild fisheries ....................................... 28
Overall Recommendation ............................................................................................................. 30
Acknowledgements ....................................................................................................................... 31
Supplemental information ............................................................................................................ 32
References .................................................................................................................................... 33
About Seafood Watch® ................................................................................................................. 36
Guiding Principles ......................................................................................................................... 37
Data points and all scoring calculations........................................................................................ 39
4
Executive Summary The mixed shrimp-mangrove (or silvofishery) system is a form of land and water use that integrates low input brackish water aquaculture with mangrove forestry. It is practiced across Southeast Asia and mangrove trees are either grown within or outside the pond system at varying pond:forest ratios. Usually small and family owned, the farms are by definition low input systems typically not using supplemental feed or fertilization, and supplementing passively collected, wild shrimp juveniles with low densities of hatchery-produced black tiger shrimp (Penaeus monodon) postlarvae. Shrimp yields are typically low, with modest secondary harvests of crabs and fish, but the harvest of mature mangrove trees is a central component of the system. While individual farms are small, large areas of low lying coastal regions are dominated by these farming systems. The Selva Shrimp® Criteria have been developed by Blueyou Consulting Ltd, and are applied by independent verification at the site level. As such, they ensure that the typical characteristics of the silvofishery system are in place and that other minimum requirements are met. This assessment focuses on the Ca Mau region of Southern Vietnam, but the resulting recommendation is applicable to other regions of SE Asia where the Selva Shrimp® Criteria are applied, and ensure the same basic requirements of the silvofishery production system are met. Data availability from the small family-run farms and from the regional government and forest management bureaus is limited outside Vietnam, but the site-level application and independent verification of the Selva Shrimp® Criteria means that a much higher level of information will be available. The silvofishery production system, along with other types of shrimp farming, is the subject of significant academic study; overall, the Data Criterion score is 6 out of 10. With no feed or fertilizer inputs, the Effluent Criterion score is automatically 10 out of 10 in the Seafood Watch criteria. The ponds exchange water with the network of channels beyond the farm, but without significant inputs to the farm there is not considered to be a significant risk of effluent impacts. The habitat criterion is perhaps the most interesting aspect of this assessment. It is well established that mangrove forests provide important ecosystem services, which may be lost when the forests are removed or significantly altered. It is acknowledged that silvofisheries maintain a higher overall level of mangrove cover than alternative (more intensive) shrimp farming systems in these habitats; the area continues to provide some secondary food harvests (e.g. crabs and fish), and by their presence, the silvofishery farms prevent the further loss of mangrove from conversion to more intensive shrimp production. However, the remaining mangroves are heavily managed, particularly from a hydrodynamic perspective (i.e. the presence of dykes, bunds and sluices greatly alters the water flow/exchange characteristics) and are harvested (i.e. cut down) every 10 to 20 years. On balance, this assessment considers the mangroves forests to have lost functionality. The regulation and management of cumulative impacts from multiple farms is based primarily on maintaining a minimum percentage of

5
mangrove cover on farms of differing sizes, aiming at a regional average of 50%. In Ca Mau, approximately 80% of farms achieve a minimum of 50% cover, and the application of the Selva Shrimp® Criteria is considered to ensure that this baseline occurs in this region and in other areas where they are applied. Due to the heavily managed nature of the mangroves, the final Habitat Criterion score is 3.9 out of 10. The ponds are considered likely to attract or be associated with a variety of predators. There is already an active harvest of fish and crabs from ponds and surrounding waterways, and although considered somewhat challenging to verify, the Selva Shrimp® Criteria prohibit lethal predator control particularly of protected or endangered species. In practice, the control of predators is likely to be limited to the removal of predatory fish in ponds. A minor precautionary penalty of -2 out of -10 is applied. The academic literature indicates that chemical and feed inputs to the silvofishery system can be considered to be minimal or non-existent. The Selva Shrimp® Criteria also prohibit the addition of chemicals or external feed. This assessment considers it likely that there is some use of the natural piscicide “teaseed cake” to control fish in the ponds and in this respect the Chemical Use Criterion is scored a precautionary 7 out of 10, although the risk is considered low. The Feed Criterion score is 10 out of 10 as no external feed is used. It is likely that shrimp will escape from the ponds during water exchanges, at harvest, or during floods; but as the number of shrimp involved is very low and they shrimp are all native species, the risk is considered low. The escape of the passively collected local juveniles is clearly not a concern, and as the hatchery-sourced P. monodon are from wild-caught broodstock there is low risk of any genetic interactions from this hatchery-selected population to the local wild populations. The Escape Criterion score is 8 out of 10. Shrimp stocking density is very low in the silvofishery systems and similar to natural densities (1 to 1.5 shrimp per square meter in silvofisheries compared to 1 to 7 in “improved-extensive” systems, or 15 to 45 in intensive monoculture systems). The lower virulence of pathogens in the silvofisheries is one of the reasons they remain attractive to farmers. Virus populations have been shown to be more stable in silvofishery ponds and less prone to the increasing selection for virulence associated with more intensive systems. The Disease Criterion score is 8 out of 10. While some of the P. monodon produced will originate from passive collection of wild juveniles, it is not possible to demonstrate that this accounts for more than 20% of the total. The remainder comes from hatcheries whose source of broodstock is dominated by wild shrimp fisheries. It is considered that some broodstock supplying the silvofisheries will come from the nascent P. monodon domestication programs in Vietnam or other areas of SE Asia, but it has not been possible to establish a percentage of production. The source, and therefore the status, of wild broodstock fisheries is not known. The precautionary score is 6 out of 10 which can improve with better information (and is 10 out of 10 for the passively collected shrimp species).
6
Overall, the final score for black tiger shrimp (P. monodon) is 7.12 out of 10, and 7.87 for the other passively collected species. With no red criteria, the final recommendation is a green “Best Choice.” While this assessment focuses on the example of the Ca Mau region of Southern Vietnam, the application and independent verification of the requirements of the Selva Shrimp® Criteria is considered to ensure this recommendation would be valid if the silvofishery system were in a different region of Southeast Asia and using native shrimp species.
7
Introduction
Scope of the analysis and ensuing recommendation Species Black tiger shrimp Penaeus monodon. Also secondary harvested native species: Penaeus merguiensis, Metapenaeus ensis, Metapenaeus lysianassa, Penaeus indicus. Note – the recommendation of this report is only valid when native species are grown. It is not applicable to the farming of non-native shrimp species. Geographic coverage This assessment is based on the Ca Mau Province of South Vietnam, but is applicable to other areas of Southeast Asia based on the mixed shrimp-mangrove production system and the Selva Shrimp® Criteria (see native species note above). Production Methods Extensive ponds—mixed shrimp-mangrove production. Also known as silvofisheries. Selva Shrimp® Criteria These criteria have been developed by Blueyou Consulting Ltd, an international consultancy group, to independently verify fundamental characteristics and minimum standards of performance for the silvofishery production system. Compliance with the criteria is independently verified at the farm level by a third-party audit. The full criteria are in Appendix 1 – Supplemental information.
Species Overview Basic biology (based on Penaeus monodon - from FAO Fisheries and Aquaculture species information program1) Penaeus monodon or the giant tiger prawn inhabits the coasts of Australia, South East Asia, South Asia and East Africa. They mature and breed only in tropical marine habitats and spend their larval, juvenile, adolescent and sub-adult stages in coastal estuaries, lagoons or mangrove areas. P. monodon is more of a predator than other penaeid shrimp, which are typically omnivorous scavengers and detritus feeders. Adults are often found over muddy sand or sandy bottoms at 20-50 m depth in offshore waters. The larvae are free swimming and remain planktonic for some time, and are carried towards the shore by tidal currents before metamorphosing into postlarvae (PLs) with similar characteristics to adult shrimp. The PL subsequently change their habit to feed on benthic
1 http://www.fao.org/fishery/culturedspecies/Penaeus_monodon/en
8
detritus, polychaete worms and small crustaceans. Juvenile and adolescent stages can tolerate
salinity conditions as low as 1‰–2‰. Production statistics (from Ha et al. 2012). The Ca Mau region is the leading producer of shrimp in Vietnam with 265,153 hectares of ponds producing 99,600 tons or 25% of the country’s total production in 2009. Only 15% of the pond area in Ca Mau is in the mixed shrimp-mangrove system (64.5% is the improved-extensive monoculture system, 20% mixed shrimp-rice and only 0.5% in intensive shrimp monoculture). According to Ha et al., the typical yield per hectare is 250kg, but Johnston et al. (2000) reported highly variable yields up to approximately 400kg per hectare. This yield is considered to be similar for this production system in other regions or countries. Production system The mixed shrimp-mangrove (or silvofishery) system is a form of land use that integrates low input brackish water aquaculture with mangrove tree culture. It is practiced across Southeast Asia, with mangroves either within or outside the pond system at specific pond-mangrove area ratios (Bush et al. 2010). These ‘ecologically integrated’ mangrove friendly aquaculture technologies are amenable to small-scale, family-based operations, and can be adopted in mangrove conservation (Primavera 2006). According to Tho et al. (2011), these systems rely on (passively collected) natural seedstocks, and use supplementary stocking at a low density of 1–1.5 shrimp postlarvae per square meter (compared to 1–7 pl m-2 in “improved-extensive” systems, or 15–45 pl m-2 in intensive monoculture systems). The forestry is managed by regional forestry management enterprises and companies. Within this combined shrimp-forestry system, the mangrove trees are harvested at intervals, typically in the order of ten to twenty years, and then replanted for a subsequent timber harvest. Import and export sources and statistics. Specific production and export volumes from the mixed shrimp-mangrove farms are not known, but data from VASEP2 in Vietnam shows that for shrimp in general, the U.S. is the second largest export market (behind Japan), receiving approximately 20% of Vietnam’s shrimp exports between January and September 2012. Common and market names Tiger prawn, tiger shrimp, black tiger shrimp/prawn, giant tiger prawn. Product forms. Tiger shrimp are typically sold whole at a large size, but may be available in all common shrimp product forms.
2 Vietnam Association of Seafood Exporters and Producers. http://www.eng.vasep.com.vn/
9
Analysis
Scoring guide Excluding the exceptional factors (3.3x and 6.2X), all scores result in a zero to ten final score
for the criterion and the overall final rank. A zero score indicates poor performance, while a score of ten indicates high performance. In contrast, the two exceptional factors result in negative scores from zero to minus ten, and in these cases zero indicates no negative impact.
The full Seafood Watch Aquaculture Criteria that the following scores relate to are available on the Seafood Watch website.3
The full data values and scoring calculations are available in Annex 1.
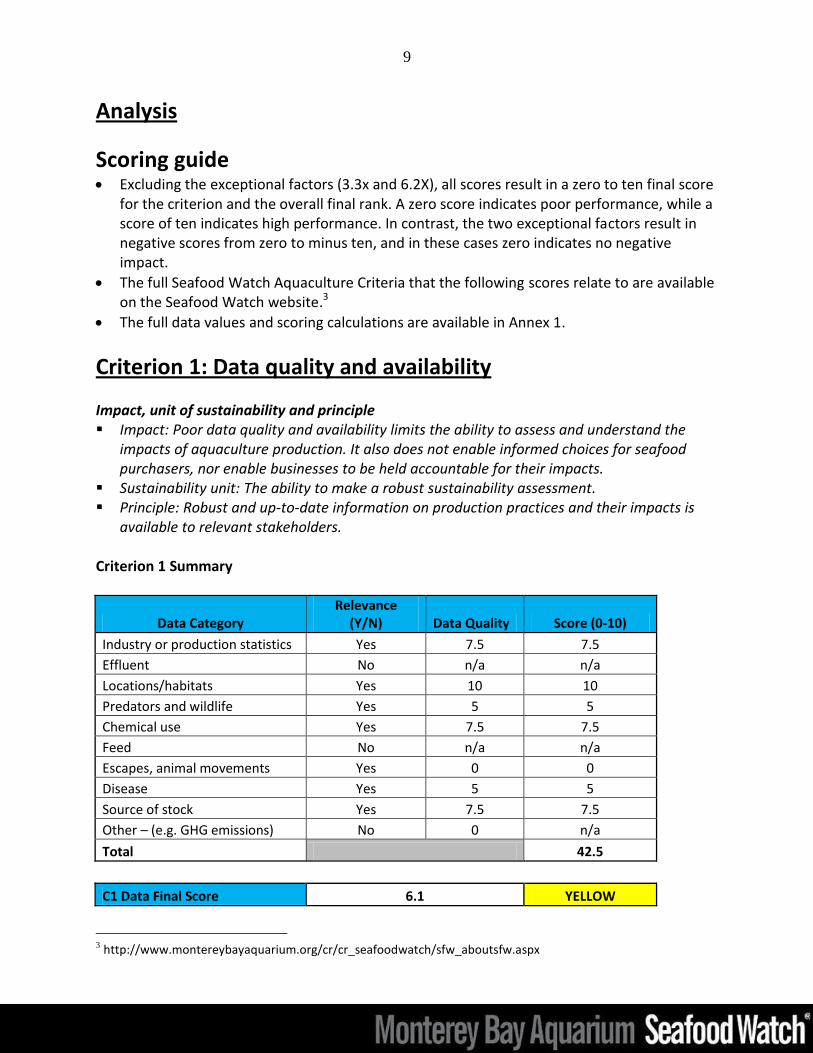
Criterion 1: Data quality and availability Impact, unit of sustainability and principle Impact: Poor data quality and availability limits the ability to assess and understand the
impacts of aquaculture production. It also does not enable informed choices for seafood purchasers, nor enable businesses to be held accountable for their impacts.
Sustainability unit: The ability to make a robust sustainability assessment. Principle: Robust and up-to-date information on production practices and their impacts is
available to relevant stakeholders. Criterion 1 Summary
Data Category Relevance
(Y/N) Data Quality Score (0-10)
Industry or production statistics Yes 7.5 7.5
Effluent No n/a n/a
Locations/habitats Yes 10 10
Predators and wildlife Yes 5 5
Chemical use Yes 7.5 7.5
Feed No n/a n/a
Escapes, animal movements Yes 0 0
Disease Yes 5 5
Source of stock Yes 7.5 7.5
Other – (e.g. GHG emissions) No 0 n/a
Total 42.5
C1 Data Final Score 6.1 YELLOW
3 http://www.montereybayaquarium.org/cr/cr_seafoodwatch/sfw_aboutsfw.aspx
10
Justification of Ranking In general, the data collection at the farm level in Ca Mau is considered to be somewhat minimal with respect to shrimp production and understanding the inputs or outputs of extensive farms. Production statistics are available at a very general level in terms of typical pond yields, estimates of total pond areas, and regional and national production statistics. However, the application and independent verification of the Selva Shrimp® Criteria mean that much more information is available. For example, the nature of this production system is typically that of thousands of small family-run farms, and although locational information at the individual farm level is not easily available outside Vietnam, the application and independent verification of the Selva Shrimp® Criteria will involve detailed GPS-accurate location and site mappings. Referring to the improved and extensive shrimp producers, Tho et al. (2011) reported that farmers do not keep records of pond inputs or other production aspects such as potential escape events. Previous site visits indicated that data collection and record keeping at the farms are minimal to non-existent, but a minimum is necessary for the mangrove coverage and harvesting records which have external oversight. This lack of publically available data may be due to the simplicity of the production system and the lack of things to record. But the broad (global) interest in shrimp farming, in particular the mangrove system and environmental impacts, has led to significant academic study of the Ca Mau region of Southern Vietnam where a variety of shrimp farming practices take place. Recent interest in the management of the region’s shrimp farming and, in particular, interest in organic certification of the mixed shrimp-mangrove silvofishery system means there are some recently focused academic studies available (for example Ha et al. (2012a,b), Tho et al. (2011), Tho et al. (2012), Ha and Bush (2010)). In addition to the typical production practices identified in the scientific literature, the Selva Shrimp® Criteria have been used to define specific aspects or limits where relevant. At the time of writing there are no audit reports available so this aspect has not specifically affected this Data Criterion but could improve it at a later date if the audit information is made available. Overall, the poor farm-level general data availability when combined with the academic study and the Selva Shrimp® Criteria verification gives a moderate final data score of 6.1 out of 10. In terms of applicability to regions other than Vietnam, the independent verification of the Selva Shrimp® Criteria, along with other necessary site visits, provide a similar baseline level of farm level information, and this data score is therefore considered to be applicable to other regions.
11
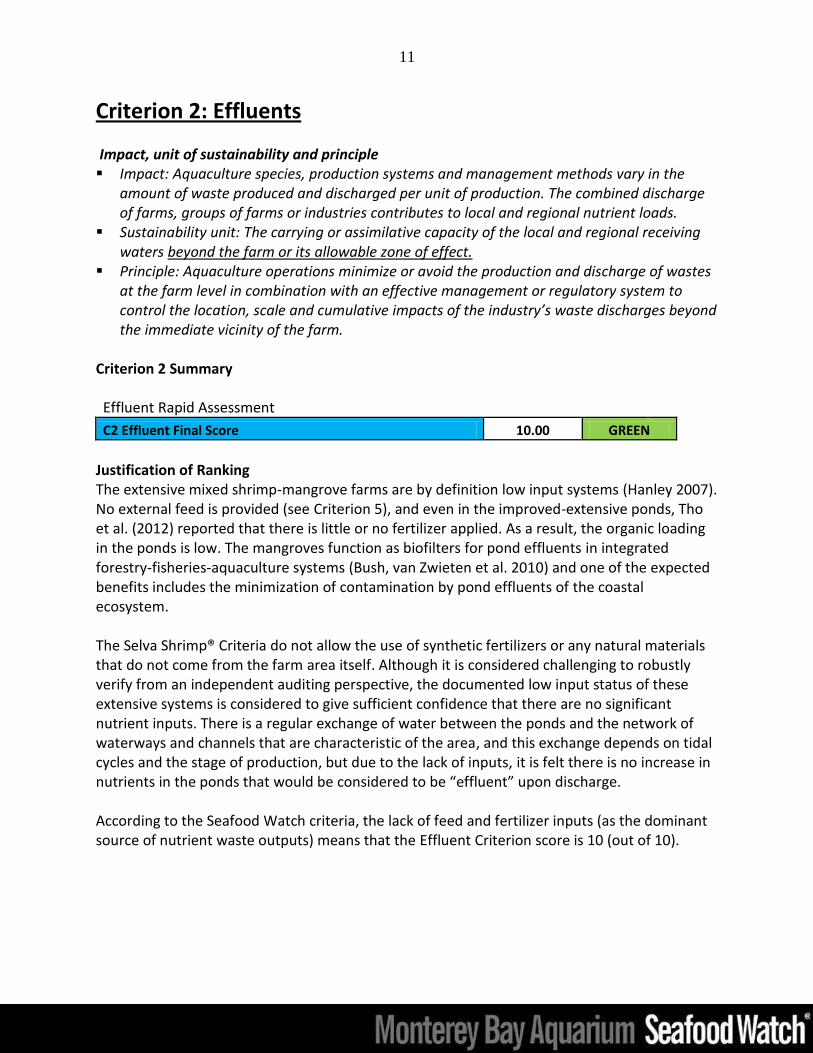
Criterion 2: Effluents Impact, unit of sustainability and principle Impact: Aquaculture species, production systems and management methods vary in the
amount of waste produced and discharged per unit of production. The combined discharge of farms, groups of farms or industries contributes to local and regional nutrient loads.
Sustainability unit: The carrying or assimilative capacity of the local and regional receiving waters beyond the farm or its allowable zone of effect.
Principle: Aquaculture operations minimize or avoid the production and discharge of wastes at the farm level in combination with an effective management or regulatory system to control the location, scale and cumulative impacts of the industry’s waste discharges beyond the immediate vicinity of the farm.
Criterion 2 Summary
Effluent Rapid Assessment
C2 Effluent Final Score 10.00 GREEN
Justification of Ranking The extensive mixed shrimp-mangrove farms are by definition low input systems (Hanley 2007). No external feed is provided (see Criterion 5), and even in the improved-extensive ponds, Tho et al. (2012) reported that there is little or no fertilizer applied. As a result, the organic loading in the ponds is low. The mangroves function as biofilters for pond effluents in integrated forestry-fisheries-aquaculture systems (Bush, van Zwieten et al. 2010) and one of the expected benefits includes the minimization of contamination by pond effluents of the coastal ecosystem. The Selva Shrimp® Criteria do not allow the use of synthetic fertilizers or any natural materials that do not come from the farm area itself. Although it is considered challenging to robustly verify from an independent auditing perspective, the documented low input status of these extensive systems is considered to give sufficient confidence that there are no significant nutrient inputs. There is a regular exchange of water between the ponds and the network of waterways and channels that are characteristic of the area, and this exchange depends on tidal cycles and the stage of production, but due to the lack of inputs, it is felt there is no increase in nutrients in the ponds that would be considered to be “effluent” upon discharge. According to the Seafood Watch criteria, the lack of feed and fertilizer inputs (as the dominant source of nutrient waste outputs) means that the Effluent Criterion score is 10 (out of 10).
12
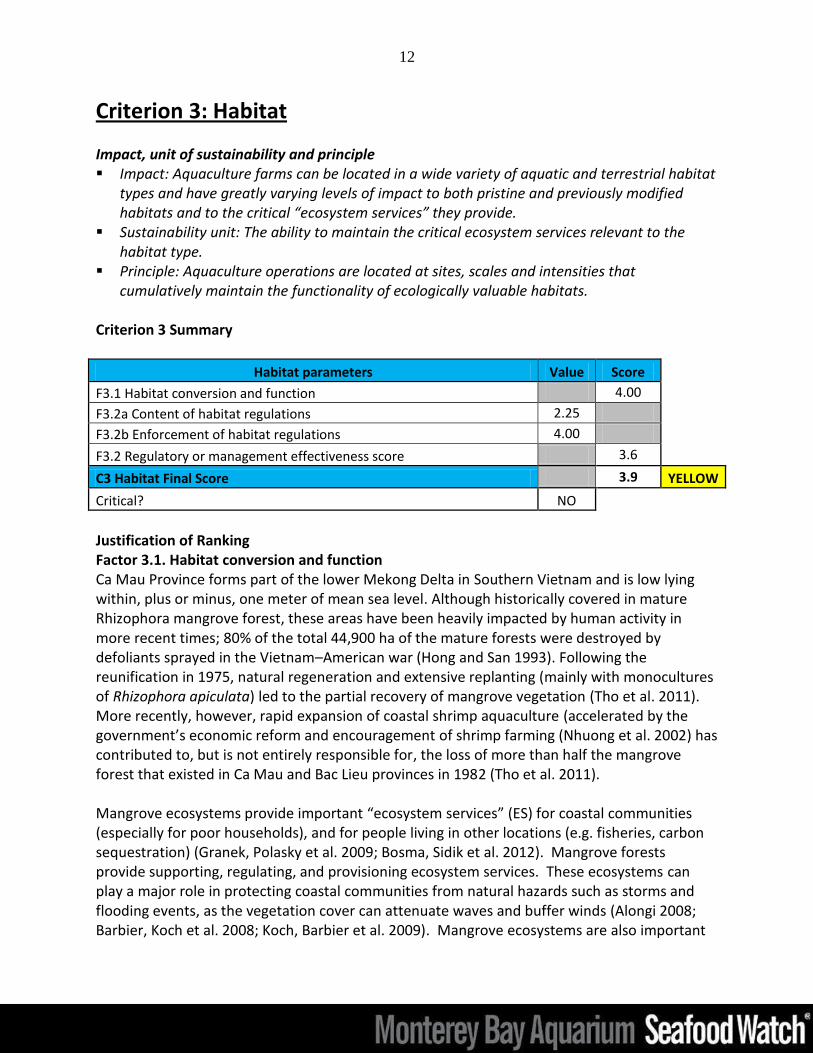
Criterion 3: Habitat Impact, unit of sustainability and principle Impact: Aquaculture farms can be located in a wide variety of aquatic and terrestrial habitat
types and have greatly varying levels of impact to both pristine and previously modified habitats and to the critical “ecosystem services” they provide.
Sustainability unit: The ability to maintain the critical ecosystem services relevant to the habitat type.
Principle: Aquaculture operations are located at sites, scales and intensities that cumulatively maintain the functionality of ecologically valuable habitats.
Criterion 3 Summary
Habitat parameters Value Score
F3.1 Habitat conversion and function 4.00
F3.2a Content of habitat regulations 2.25
F3.2b Enforcement of habitat regulations 4.00
F3.2 Regulatory or management effectiveness score 3.6
C3 Habitat Final Score 3.9 YELLOW
Critical? NO
Justification of Ranking Factor 3.1. Habitat conversion and function Ca Mau Province forms part of the lower Mekong Delta in Southern Vietnam and is low lying within, plus or minus, one meter of mean sea level. Although historically covered in mature Rhizophora mangrove forest, these areas have been heavily impacted by human activity in more recent times; 80% of the total 44,900 ha of the mature forests were destroyed by defoliants sprayed in the Vietnam–American war (Hong and San 1993). Following the reunification in 1975, natural regeneration and extensive replanting (mainly with monocultures of Rhizophora apiculata) led to the partial recovery of mangrove vegetation (Tho et al. 2011). More recently, however, rapid expansion of coastal shrimp aquaculture (accelerated by the government’s economic reform and encouragement of shrimp farming (Nhuong et al. 2002) has contributed to, but is not entirely responsible for, the loss of more than half the mangrove forest that existed in Ca Mau and Bac Lieu provinces in 1982 (Tho et al. 2011). Mangrove ecosystems provide important “ecosystem services” (ES) for coastal communities (especially for poor households), and for people living in other locations (e.g. fisheries, carbon sequestration) (Granek, Polasky et al. 2009; Bosma, Sidik et al. 2012). Mangrove forests provide supporting, regulating, and provisioning ecosystem services. These ecosystems can play a major role in protecting coastal communities from natural hazards such as storms and flooding events, as the vegetation cover can attenuate waves and buffer winds (Alongi 2008; Barbier, Koch et al. 2008; Koch, Barbier et al. 2009). Mangrove ecosystems are also important

13
for climate regulation through their high potential of carbon sequestration and storage, and their capacity of modifying local temperature and evapotranspiration. The high productivity of coastal ecosystems results in the sequestration of millions of tons of C annually from the atmosphere and the C dissolved in seawater. Sequestered C is accumulated in below-ground structures (i.e. roots and rhizomes) of mangrove trees and seagrasses, and the anoxic conditions in soils reduce respiration, slowing C release (Lovelock et al. 2011). Provisioning services in mangrove ecosystems are directly used by coastal communities; these ES include water (for multiple purposes, ranging from drinking to transportation), food (e.g. fish, crabs, honey), timber products (e.g. timber, fuel wood, poles, fiber), and other non-timber forest products (e.g. wax, tannins) (Walters et al. 2008; Hussain and Badola 2010). Most of the links between ecosystem structure and function, and the provision of ecosystem services, remain unknown (Barbier 2012). However, research during the last decade has shown that some of these services, such as wave attenuation and support for marine fisheries, decrease non-linearly, being maximum in the seaward boundary (Barbier, Koch et al. 2008). Therefore, mangroves should be conserved up to a distance from the coast, where the marginal ecosystem benefits at that distance just equals the marginal returns of converting the coastal landscape (Barbier 2012). Ca Mau is home to half of the remaining mangrove forest in the Mekong Delta and a third of what is left in Vietnam (MARD 2008), and according to Ha et al. (2012) the government is therefore under pressure to balance wider aspirations of an export-led economy [i.e. shrimp] with the conservation of the remaining mangrove forests. Against these competing agendas, in 1999, a new law to create rules for land use of mangrove forest had been enacted (Christensen et al. 2008), enabling the emergence of integrated shrimp-mangrove systems as an opportunity to maintain production while ensuring a minimum area of forest cover (Ha et al. 2012). The Ca Mau Province has 12 mangrove forest enterprises and, depending on their location, they are divided into two main land use zones: (1) a conservation zone on which all land must be forested and conserved with no human settlement allowed except for fishing communities at river mouths, and (2) a buffer zone with minimum ratios of forest to non-forest area, i.e. agriculture or aquaculture (Gebhardt et al. 2012). According to the provincial regulations, farmers must meet the following ratios of mangrove to shrimp pond area based on the total farm area Ha et al. (2012):
More than 5 hectares— 60% mangroves, 40% aquaculture
3 to 5 hectares—50% mangroves, 50% aquaculture
Less than 3 hectares—40% mangroves, 60% aquaculture According to official statistics from the GSO (General Statistics Office of Vietnam), the development and expansion of integrated shrimp-mangrove systems in Ca Mau Province has resulted in the increase of shrimp production and a reduction in the deforestation rate. These statistics show a peak of deforestation destruction and conversion into fish farms from 1995 to 1998, and a reduction in the rate of forest since 1999. For instance, this rate was 70 thousand hectares in 2002 and 7 thousand hectares in 2008. At the same time, shrimp production in Ca
14
Mau has almost doubled from 2001 to 2009 (Gebhardt et al. 2012). However, statistics regarding mangrove cover in Vietnam are hard to verify as the methodologies used for data collection, measuring and validation are not always available (Gebhardt et al. 2012). While statistics from the Forest Inventory Planning and Investigation Institute (FIPI) report an almost constant mangrove cover during the period 2002-2009, maps calculated from remote sensing data indicate a strong decrease in the mangrove are in Ca Mau Province. Nevertheless, with respect to this assessment, it appears that the improved, extensive shrimp farms (i.e. not the mixed shrimp/mangrove extensive systems being assessed in this report) were largely responsible and these farms occupied more than 70% of Ca Mau’s total land area in 2008 (Tho et al. 2012).
In practice, shrimp ponds in silvofisheries are either incorporated into the mangroves (typically as long thin channels within the mangroves themselves, sometimes separated by vegetated levees), or the two (mangroves and shrimp ponds) are separated with ponds located near waterways at the front of the farm, while mangroves are usually grown on a separate area at the back of the farm (Tho et al. 2011). Site visits in 2011 demonstrated that not all farms in the area have reached their minimum mangrove coverage, but according to Ha et al. (2012 mangrove conservation) the government is aiming for 50% coverage in total. Ha et al. (2012) visited 32 farms and reported 82% of farms had 50% or more mangrove coverage. Eighteen percent of farms had less than 50% but it is not clear what total area these farms covered. Similarly, the Selva Shrimp® Criteria and verification means that 50% mangrove coverage will be independently verified (except for the smaller farms (<3ha), which will be allowed to operate at the regulatory minimum of 40%). Despite this level of mangrove cover, an important aspect to consider of the combined shrimp aquaculture and forestry system is the allowance to harvest the mangroves at specified intervals. Under the current forest management policy, planted mangroves can be thinned by 20%–30% at 5, 10 and 15 years of age, and the final harvest at 20 years (Chough et al. 2002). Mangroves must be replanted within 12 months, and therefore there may be periods of a number of years where areas of mangroves are either absent or dominated by small immature trees. In the case of young forest stands, it has been proven that they have the ability to contribute to fisheries production by exporting organic matter. Young forests are a highly productive ecosystem, and they are able to take up more N and P than mature forests. Therefore, they produce large quantities of high quality litter that may enhance food availability in the aquatic ecosystem (Nga, Tinh et al. 2005). The government’s prescribed forest cover of 50% is an indicator for the quantity of forest but it is not necessarily the best indicator for the quality of forest, such as the density of trees (Ha, Bush et al. 2012). Farmers and provincial government officials alike blame the continued decline of mangrove quality in the province on the mechanism of benefit sharing between farmers and forest companies and management boards. The low return farmers receive at the end of a production cycle is a key reason for many farmers to cut mangroves continuously, and
15
this reduces the capacity of forest to maintain ecological functions. Although the regulations of the state on the forest-to-pond ratio are followed by the farmers, they do not pay attention to the quality of mangroves due to their low share in the benefits after harvesting. According to Bush et al. (2010) and references therein, the expected benefits of landscape integrated systems (i.e. mixed shrimp-mangrove aquaculture) include maintenance of coastal fisheries and their nursery areas. However, the nature of the water exchange based on spring high tide filling and low tide draining, means that the hydrographic characteristics are considerably modified compared to undisturbed mangroves. According to Chough et al. (2002) “aquaculture development in Ca Mau Province has had a significant impact on the hydrology of mangrove areas. Many of the remaining mangroves are surrounded by levee banks, or situated in areas where tidal access is hindered. In mixed farms, where mangroves are enclosed within a levee surrounding the farm, normal tidal flooding and flushing is prevented by the more or less constant water level in the pond. Flooding and flushing of mangroves in these farms is further hindered by the usual practice of placing soil excavated during pond construction, along the edge of the adjacent mangrove areas. Reliable estimates of the frequency and duration of flooding for mangrove areas [in the areas studied] are not available. However, based on general field observations it is probable that mangrove areas within the ponds of mixed farms are rarely flooded. The situation for mangrove areas located outside the pond on farms using the separate farming system is less clear, but field observations again suggest that many areas are flooded for not more than about 2-3 days per month.” Flooding duration and frequency are critical factors in the survival of mangrove trees, and they also determine functional attributes like habitat provision and C sequestration (Bosire et al. 2008). For instance, anaerobic conditions in waterlogged mangrove soils slow down the decomposition of organic matter and accelerate carbon accumulation. Chough et al (2002) conclude: “It is clear from the foregoing that extensive mixed farming systems in Ngoc Hien District present a number of environmental and production problems, and that they require management compromises to be made that are not optimal for either shrimp culture or mangroves.” In terms of ecosystem services and functionality assessed in the Seafood Watch criteria, it is widely accepted that mangroves represent a high value habitat. Mangroves have been shown to play an important role in coastline protection, mitigation of wave and storm impacts, local climate stabilization and as a source for wood, fuel, and feeding and nursing areas for many aquatic species ((Primavera and Esteban 2008) and in Ha et al. (2012)). Measuring or valuing these services is complex and may not even follow a linear relationship with the area (Barbier, Koch et al. 2008). Nevertheless the percentage of mangrove coverage continues to be the measure used by the forestry enterprises and regulations, and the Selva Shrimp® Criteria require a minimum 50% mangrove coverage. The Seafood Watch guidelines dictate that 50%–70% of remaining mangrove cover is considered as “moderate impacts” (and an initial score of 7 out of 10); however, as Bush et al. (2010) and Chough et al. (2002) point out, the remaining mangrove areas in these mixed shrimp/mangrove systems are considerably hydrographically modified compared to undisturbed mangrove, and are also of lower “quality” (Ha et al. 2012).
16
Nevertheless, Ha et al. (2012) show that households in the integrated systems have extra income from fish and crab (nearly 28% of total income) compared to 9% additional income in improved, extensive production, and zero in intensive shrimp production, indicating some provision of the natural food productivity ecosystem services in the integrated silvofisheries. It is important to note that the silvofishery production system is a key aspect in maintaining the remaining forest cover in this region of Vietnam. Despite this, (and also considering the cyclical harvesting and replanting of the trees and the reduced mangrove quality), it is likely that, due to the heavily modified hydrodynamics, the ecosystem services of the farm areas have, to some extent, been lost. Therefore, for the purposes of this assessment, the heavily managed habitat is considered to have lost functionality. It could be argued that the repetitive harvesting of the mangroves has created ongoing habitat damage, but for the purposes of this assessment it is considered that the primary loss of ecosystem services happened when the ponds were constructed more than 10 years ago. This production method is, to some extent, protecting the existing mangrove from further conversion to more intensive shrimp production. The initial habitat function score is therefore 4 out of 10. Factor 3.2. Habitat and farm siting management effectiveness (appropriate to the scale of the industry) The Vietnamese government has recognized the valuable environmental services provided by mangroves, and their importance in the fluvial environment of the Mekong Delta and the Ca Mau peninsula (Viet Nam Environment Protection Agency 2005), but is also under pressure to balance wider aspirations of an export-led economy with the conservation of the remaining mangrove forests Ha et al. (2012). Against these competing agendas, integrated shrimp-mangrove systems have emerged as an opportunity to maintain production while ensuring a minimum area of forest cover (Ha et al. 2012). Forest allocation and management—known as the devolution of forest management—in Ca Mau is complex, with areas allocated to forest management boards, to forest companies and also to individual households; all based on a framework of policies established to devolve rights over forests and forestland to farmers process (Ha et al. 2012). According to Ha et al. (2012), a large part of forestland remains under the control of state organizations, but demand for forestland and forest products from the rural households is increasing. This led to a situation where forestry companies and management boards were under pressure to curb illegal cutting by local people. The conflict between state forest management board and/or forestry companies and farmers therefore emerged as one of the main problems in forest management in the province. This led to the establishment4 of the specific ratios of mangrove to shrimp areas specified in the previous section.
4 Ca Mau Provincial People’s Committee Decision 24/2002/QD-UB.
17
The regulations clearly do not require farmers to avoid high value habitats (i.e. mangrove forests), but the intent of the minimum mangrove coverage percentages is to maintain the mangrove ecosystem in the region based on its cumulative impacts. While the concerns expressed in Factor 3.1 above indicate that this is only partly successful, according to Chough et al (2002) the problems would be more serious if the farmers shift from this extensive culture to improved-extensive, semi-intensive, or intensive shrimp culture. Despite the concerns regarding the impacts on ecosystem services primarily through modified hydrodynamics and mangrove harvesting, the focus of the management is on mangrove cover (including cutting and replanting) and there do not appear to be any requirements to restore these aquatic functions. It could be argued that the regulations are not actually intended to restore ecosystem services and that they are successful in achieving their intent; however, the definition of ecosystem services means that we would be better off overall if they were restored, regardless of the impact on the present shrimp farming system. Overall, the regulations have good intentions towards maintaining ecosystem functioning at the farm level and at the cumulative level of the industry, but they do not address the concerns for the substantially modified hydrodynamics of individual farms and their cumulative impacts, and they allow (if not require) the harvest of mangrove areas every 10-20 years. The content of the regulations, therefore, earns a score of 2.25 out of 5. The forestry management agencies are responsible for enforcement of habitat regulations. Each farm has a “blue book” which articulates the status of the mangroves on the farm and is used to plan and record the harvesting of the mangroves. While Chough et al. (2002) indicated that the financial returns to farmers from aquaculture are much higher than those from mangrove forestry and hence most farmers are keen to expand their ponds into areas presently set aside for forestry, the forestry agencies receive some profit from the mangrove harvests and, therefore, enforce the required mangrove coverage according to the farm total area. As the agencies operate and maintain mangrove coverage on a regional basis and all the farms have the same mangrove area minimum requirements, they primarily account for multiple farms and cumulative impacts; although it is clear that ecosystem services are a lower priority. The enforcement process is not considered to be very transparent and without site visits it will be challenging to obtain information, but the presence of the Selva Shrimp® verification for mangrove coverage improves this aspect. The government hopes to maintain 50% of the area covered with mangrove in coastal areas through the household or plot-level regulation of a specified percentage cover of mangroves, (Ha, van Dijk e et al. 2012) which shows that enforcement is reasonably successful with 82% of farms that have more than 50% cover. Overall, although there are some weaknesses in the enforcement by forest management boards and companies, the independent verification of the Selva Shrimp® Criteria effectively adds another layer of rigor, specifically with respect to the percentage of mangrove cover. This improves the habitat regulatory enforcement score to 4 out of 5.
18
As there are some weaknesses in both the content of the regulations and their enforcement, the final management effectiveness score for Factor 3.2 (which combines the regulatory content and enforcement scores) is 3.6 out of 10. This is relatively low because, although the Selva Shrimp® Criteria require similar mangrove coverage, as the regulations and the verification improves the enforcement score, neither the regulations or the Selva Shrimp® Criteria address the loss of ecosystem services due to the modified hydrodynamics of the area. Final Habitat Criterion Score The final score combines the habitat impact score with the effectiveness of the regulations and enforcement, and is 3.9 out of 10, which is at the lower end of the moderate range, and reflects the fact that although the region maintains higher mangrove coverage than other farming systems, the mangroves themselves are heavily managed and modified, particularly in an aquatic or hydrodynamic context. Extending this Vietnam-focused example to other regions of SE Asia is challenging due to differences in regulations and mangrove forest management between countries. However, the defining characteristics of the Ca Mau example—in terms of ecosystem services and habitat functionality of the silvofishery production system—are considered to be consistent across different regions (i.e. the modified hydrodynamics of the silvofishery system that lead to a “loss of functionality” score would be considered to be similar if the silvofishery were in a different country). The defining measurement in Vietnam, and therefore for applicability to other regions, is the percentage of mangrove cover. The presence of the independently verified Selva Shrimp® Criteria that ensure an effective minimum mangrove cover in any country or region is, therefore, considered to justify the applicability of this habitat criterion score to other production regions.
Factor 3.3X: Wildlife and predator mortalities A measure of the effects of deliberate or accidental mortality on the populations of affected species of predators or other wildlife. This is an “exceptional” factor that may not apply in many circumstances. It generates a
negative score that is deducted from the overall final score. A score of zero means there is no
impact.
Factor 3.3X Summary
Wildlife and predator mortality parameters Score
F3.3X Wildlife and predator mortality Final Score -2.00 GREEN
Critical? NO
19
Justification of Ranking F3.3X Wildlife and predator score Due to the mangrove forest cover, it seems likely that the biodiversity of the area is likely to be significant and to include potential shrimp predators. While aquatic predators such as fish can largely be excluded by nets and screens from incoming water, they also appear to be controlled occasionally with piscicides such as teaseed cake (saponin – see Criterion 4). However as Ha et al. (2012) point out, farmers in the mixed shrimp-mangrove system obtain a significant amount of income from fish and crabs, and the area has active fisheries in addition to any fish controlled in ponds. No information about the control of other predators (such as birds) was available in the literature, but although considered to be somewhat challenging to audit, the Selva Shrimp® Criteria prohibit active predator control. The criteria also require the protection of endangered species (IUCN red list endangered or critically endangered or listed in the Vietnamese red data books). Despite the requirements of the Selva Shrimp® Criteria to prohibit active predator control, this is considered challenging to audit and rather than the zero penalty score, which this would define, a precautionary penalty score of -2 is allocated based on the Seafood Watch criteria: aquaculture operations may attract predators or interact with predators or other wildlife, but effective management and prevention measures limit mortalities to exceptional cases.
20
Criterion 4: Evidence or Risk of Chemical Use Impact, unit of sustainability and principle Impact: Improper use of chemical treatments impacts non-target organisms and leads to
production losses and human health concerns due to the development of chemical-resistant organisms.
Sustainability unit: Non-target organisms in the local or regional environment, presence of pathogens or parasites resistant to important treatments.
Principle: Aquaculture operations by design, management or regulation avoid the discharge of chemicals toxic to aquatic life, and/or effectively control the frequency, risk of environmental impact and risk to human health of their use.
Criterion 4 Summary
Chemical Use parameters Score
C4 Chemical Use Score 7.00
C4 Chemical Use Final Score 7.00 GREEN
Critical? NO
Justification of Ranking Consistent with the low input farming system, the use of chemicals in mixed mangrove-shrimp farming is considered to be low or non-existent. , Thi (2007) states that farmers do not use chemicals or other admixtures. In addition, the Selva Shrimp® Criteria do not allow the use of “chemicals” (although this is considered challenging to audit). Despite this, it is considered likely that the piscicide (fish killing) “teaseed cake” (active ingredient saponin) is occasionally used to control fish in the ponds prior to stocking with shrimp (Urs Baumgartner, Blueyou Consulting Ltd, pers. comm. 2012). In describing typical use of saponin, Boyd and Massaut (1999) state “while the entire pond volume is sometimes treated, usually treatment is limited to puddles of water that remain in the bottom of ponds after harvest. The compounds are degraded by natural processes before the fish and shrimp are stocked for the next crop.” Boyd and Massaut describe teaseed cake as a low environmental safety risk. Overall, despite the prohibition of chemicals in the Selva Shrimp® Criteria and the low input system, the potential use of teaseed cake as a piscicide and the lack of information on its correct application and frequency of use must be taken into account in the scoring. According to the Seafood Watch criteria, a score of 6 is applied when “Specific data may be limited, but the species or production systems have a demonstrably low need for chemical use.” But considering the probable low use of teaseed cake and the low environmental risk, the score is improved to 7 (out of 10).

21
In terms of applicability to regions other than Vietnam, the situation described above is considered to be typical for this production system regardless of location. This score is therefore considered to be applicable to other regions.
22
Criterion 5: Feed Impact, unit of sustainability and principle Impact: Feed consumption, feed type, ingredients used and the net nutritional gains or
losses vary dramatically between farmed species and production systems. Producing feeds and their ingredients has complex global ecological impacts, and their efficiency of conversion can result in net food gains, or dramatic net losses of nutrients. Feed use is considered to be one of the defining factors of aquaculture sustainability.
Sustainability unit: The amount and sustainability of wild fish caught for feeding to farmed fish, the global impacts of harvesting or cultivating feed ingredients, and the net nutritional gains or losses from the farming operation.
Principle: Aquaculture operations source only sustainable feed ingredients, convert them efficiently and responsibly, and minimize and utilize the non-edible portion of farmed fish.
Criterion 5 Summary
Feed parameters Value Score
F5.1a Fish In: Fish Out ratio (FIFO) 0.0 10.0
F5.1b Source Fishery Sustainability Score n/a
F5.1: Wild Fish Use 0.0
F5.2a Protein IN 0.0
F5.2b Protein OUT 18.5
F5.2: Net Protein Gain or Loss (%) > 0 10
F5.3: Feed Footprint (hectares) 0.0 10
C5 Feed Final Score 10 GREEN
Critical? No
Justification of Ranking The Selva Shrimp® Criteria do not allow the use of external feed, and although it is considered challenging to verify this from an independent auditing perspective, sufficient confidence can be gained from the scientific literature, which says that this is the normal situation for these farming systems in this region. For example:
According to Ha et al. 2012, these extensive systems are characterized by “the absence of artificial feeding during the entire grow-out period.”
Hanley (2007) states that there is no use of feed in this model (referring to the organic farms which are identical in this respect) and shrimp feed on the mangrove floristic composition, algae and planktons, etc.
23
According to Chough et al. (2002), shrimp culture in Ca Mau has been extensive (which is considered to include the improved-extensive systems) with little or no supplementary feeding.
According to Hanley (2007), the overall productivity of the pond is low because of limited, or no additions of feed or fertilizers.
Further confidence can also be gained from the lack of feeding in the improved-extensive farms in the same region. For example:
Tho et al. (2011) state “No feeding of the shrimps is applied.”
Dieu et al. (2011) state “No additional feed is required in this system as shrimp use natural feed in pond.”
Additional indirect evidence also supports this conclusion. For example:
According to Bush et al. (2010), mangroves inside these ponds provide shading and food for shrimps (referencing Primavera and Esteban 2008).
Tho et al. (2012) describe the pond’s zoobenthos as one of the major food sources for cultured shrimp in this system.
Therefore, the feed criterion score is 10 as no external feed is provided. This is considered to be characteristic of the production system and, in addition to the independently verified requirements of the Selva Shrimp® Criteria, this score is therefore considered applicable to this production system in regions other than Vietnam.
24
Criterion 6: Escapes Impact, unit of sustainability and principle Impact: Competition, genetic loss, predation, habitat damage , spawning disruption, and
other impacts on wild fish and ecosystems resulting from the escape of native, non-native and/or genetically distinct fish or other unintended species from aquaculture operations.
Sustainability unit: Affected ecosystems and/or associated wild populations. Principle: Aquaculture operations pose no substantial risk of deleterious effects to wild
populations associated with the escape of farmed fish or other unintentionally introduced species.
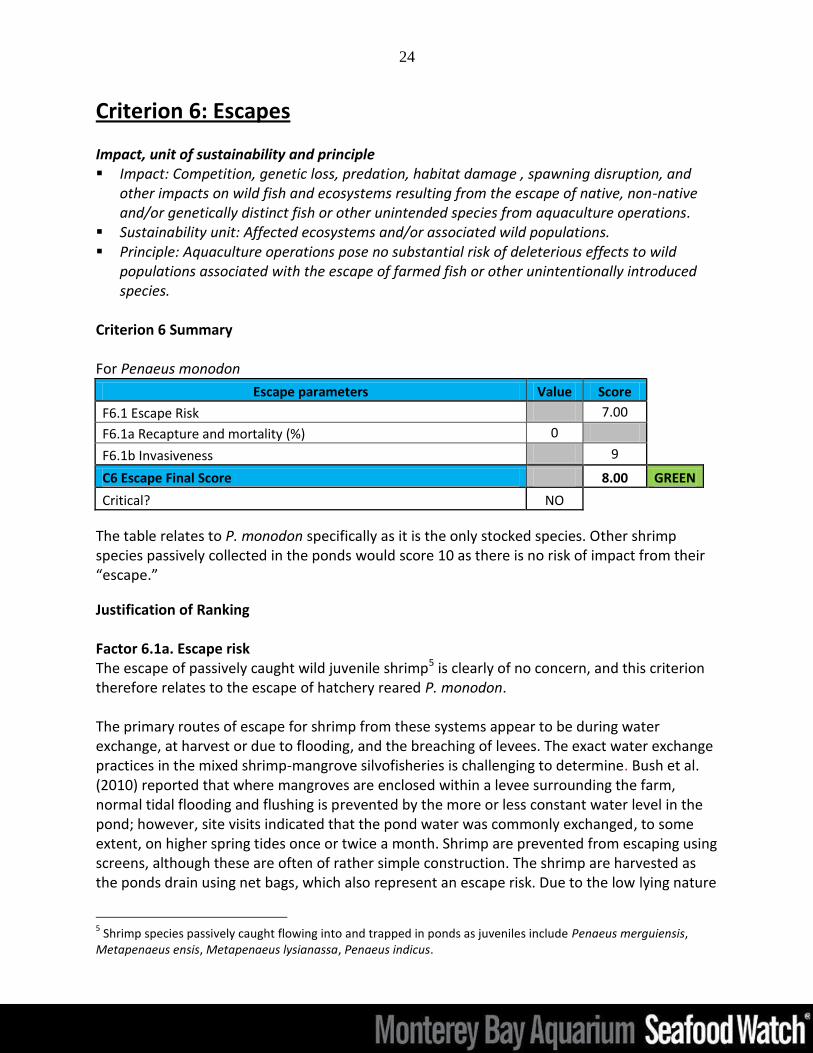
Criterion 6 Summary For Penaeus monodon
Escape parameters Value Score
F6.1 Escape Risk 7.00
F6.1a Recapture and mortality (%) 0
F6.1b Invasiveness 9
C6 Escape Final Score 8.00 GREEN
Critical? NO
The table relates to P. monodon specifically as it is the only stocked species. Other shrimp species passively collected in the ponds would score 10 as there is no risk of impact from their “escape.”
Justification of Ranking Factor 6.1a. Escape risk The escape of passively caught wild juvenile shrimp5 is clearly of no concern, and this criterion therefore relates to the escape of hatchery reared P. monodon. The primary routes of escape for shrimp from these systems appear to be during water exchange, at harvest or due to flooding, and the breaching of levees. The exact water exchange practices in the mixed shrimp-mangrove silvofisheries is challenging to determine. Bush et al. (2010) reported that where mangroves are enclosed within a levee surrounding the farm, normal tidal flooding and flushing is prevented by the more or less constant water level in the pond; however, site visits indicated that the pond water was commonly exchanged, to some extent, on higher spring tides once or twice a month. Shrimp are prevented from escaping using screens, although these are often of rather simple construction. The shrimp are harvested as the ponds drain using net bags, which also represent an escape risk. Due to the low lying nature
5 Shrimp species passively caught flowing into and trapped in ponds as juveniles include Penaeus merguiensis,
Metapenaeus ensis, Metapenaeus lysianassa, Penaeus indicus.
25
of the area, it is considered to be vulnerable to flooding at a level that would breach pond levees. According to Tho et al. (2012), the area is affected by a complex tidal regime and is characterized by a wet season between May and October with more than 2100mm of rainfall, making up 90% of the total annual rainfall. Therefore, although the system has substantially altered hydrodynamic characteristics sufficient to affect the Habitat Criterion score, the system is still sufficiently open to have a significant risk of escapes. In the Seafood Watch criteria, these characteristics would indicate an escape risk score of 4 out of 10. However the extreme low stocking density must be taken into account compared to more typical aquaculture systems. According to Tho et al. (2011), these systems rely mostly on natural seedstocks and sometimes use supplementary stocking at a low density of 1–1.5 shrimp postlarvae per square meter. This is low compared to 1–7 pl m-2 in “improved-extensive”
systems, and very low compared to the 15–45 pl m-2 in intensive monoculture systems. Therefore an “escape event” in this system is likely to involve very low numbers of shrimp, and thus, the score is improved to 7 out of 10 (because the risk is still considered to be higher than “closed” pond systems, which do not exchange water over multiple production cycles and which would score 8). There is not considered to be any significant direct recapture of any escaping shrimp. Factor 6.1b. Invasiveness Penaeus monodon is a native species in Vietnam. The use of wild-caught broodstock means that the native species score (Factor 6,1b Part A) is 4 out of 56. Any escaping monodon are not considered to have any significant impact in the receiving waters as the stocking densities in the ponds are intended to be similar to that in the wild, and therefore would not create an unnatural situation. The score for Part C of this factor is therefore 5 out of 5. The overall invasiveness score is therefore 9 out of 10. Due to the low risk of significant escape numbers and the low potential impact of escapes, the final escape score is 8 out of 10.
Factor 6.2X: Escape of unintentionally introduced species A measure of the escape risk (introduction to the wild) of alien species other than the principle farmed species unintentionally transported during live animal shipments. This is an “exceptional” criterion that may not apply in many circumstances. It generates a negative score that is deducted from the overall final score.
6 It is interesting to note that the increasing use of domesticated broodstocks could eventually worsen this score
due to the higher risk of genetic impacts resulting from genetically distinct domesticated monodon escapes breeding with wild genetic stocks.
26
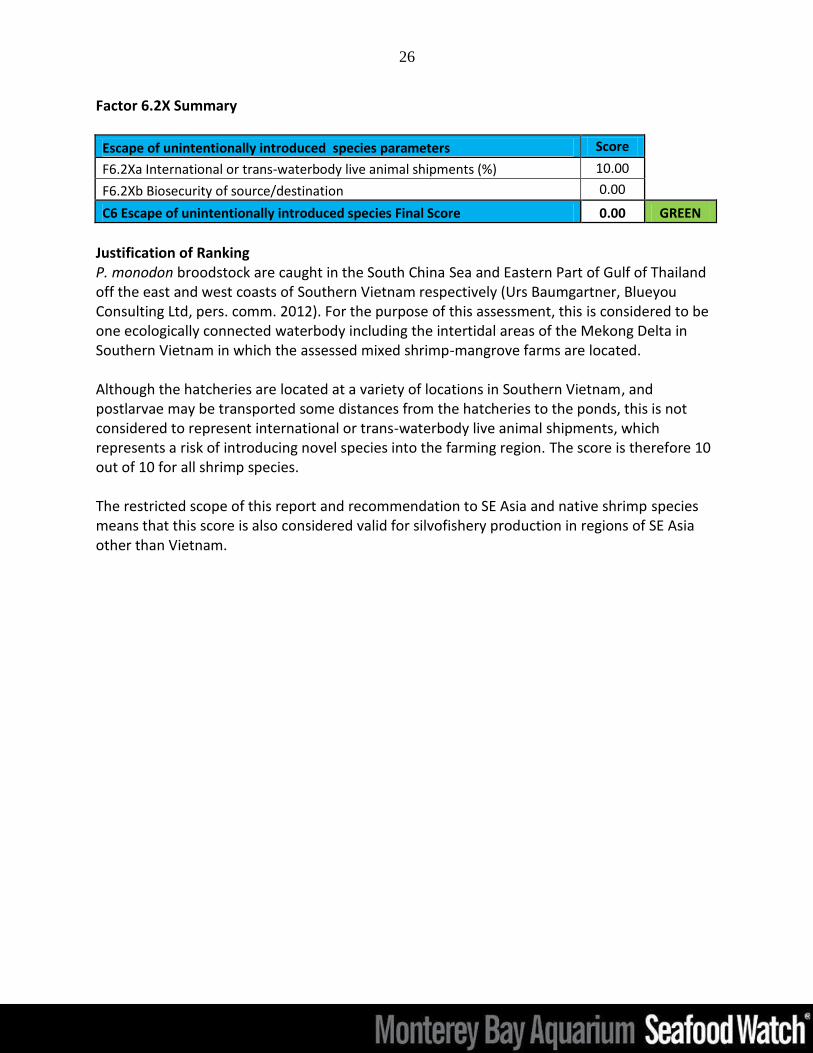
Factor 6.2X Summary
Escape of unintentionally introduced species parameters Score
F6.2Xa International or trans-waterbody live animal shipments (%) 10.00
F6.2Xb Biosecurity of source/destination 0.00
C6 Escape of unintentionally introduced species Final Score 0.00 GREEN
Justification of Ranking P. monodon broodstock are caught in the South China Sea and Eastern Part of Gulf of Thailand off the east and west coasts of Southern Vietnam respectively (Urs Baumgartner, Blueyou Consulting Ltd, pers. comm. 2012). For the purpose of this assessment, this is considered to be one ecologically connected waterbody including the intertidal areas of the Mekong Delta in Southern Vietnam in which the assessed mixed shrimp-mangrove farms are located. Although the hatcheries are located at a variety of locations in Southern Vietnam, and postlarvae may be transported some distances from the hatcheries to the ponds, this is not considered to represent international or trans-waterbody live animal shipments, which represents a risk of introducing novel species into the farming region. The score is therefore 10 out of 10 for all shrimp species. The restricted scope of this report and recommendation to SE Asia and native shrimp species means that this score is also considered valid for silvofishery production in regions of SE Asia other than Vietnam.
27
Criterion 7. Disease; pathogen and parasite interactions Impact, unit of sustainability and principle Impact: Amplification of local pathogens and parasites on fish farms and their
retransmission to local wild species that share the same water body. Sustainability unit: Wild populations susceptible to elevated levels of pathogens and
parasites. Principle: Aquaculture operations pose no substantial risk of deleterious effects to wild
populations through the amplification and retransmission of pathogens or parasites. Criterion 7 Summary
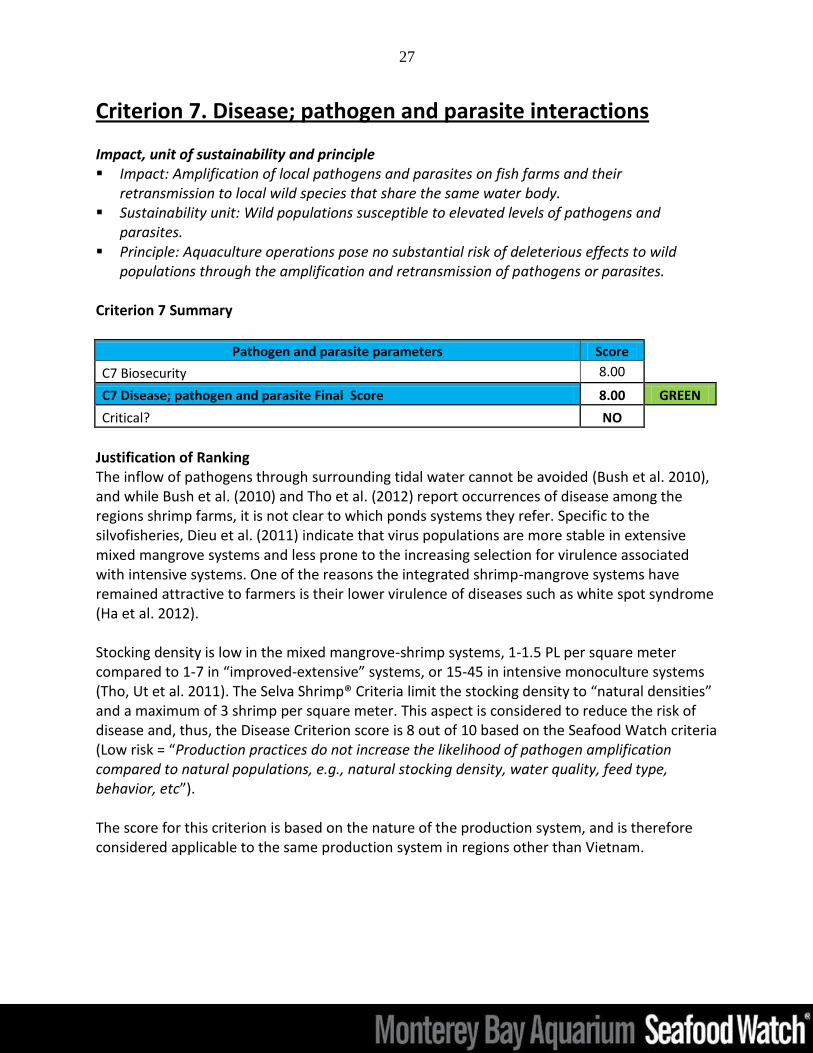
Pathogen and parasite parameters Score
C7 Biosecurity 8.00
C7 Disease; pathogen and parasite Final Score 8.00 GREEN
Critical? NO
Justification of Ranking The inflow of pathogens through surrounding tidal water cannot be avoided (Bush et al. 2010), and while Bush et al. (2010) and Tho et al. (2012) report occurrences of disease among the regions shrimp farms, it is not clear to which ponds systems they refer. Specific to the silvofisheries, Dieu et al. (2011) indicate that virus populations are more stable in extensive mixed mangrove systems and less prone to the increasing selection for virulence associated with intensive systems. One of the reasons the integrated shrimp-mangrove systems have remained attractive to farmers is their lower virulence of diseases such as white spot syndrome (Ha et al. 2012). Stocking density is low in the mixed mangrove-shrimp systems, 1-1.5 PL per square meter compared to 1-7 in “improved-extensive” systems, or 15-45 in intensive monoculture systems (Tho, Ut et al. 2011). The Selva Shrimp® Criteria limit the stocking density to “natural densities” and a maximum of 3 shrimp per square meter. This aspect is considered to reduce the risk of disease and, thus, the Disease Criterion score is 8 out of 10 based on the Seafood Watch criteria (Low risk = “Production practices do not increase the likelihood of pathogen amplification compared to natural populations, e.g., natural stocking density, water quality, feed type, behavior, etc”). The score for this criterion is based on the nature of the production system, and is therefore considered applicable to the same production system in regions other than Vietnam.

28
Criterion 8. Source of Stock – independence from wild fisheries Impact, unit of sustainability and principle Impact: The removal of fish from wild populations for on-growing to harvest size in farms. Sustainability unit: Wild fish populations. Principle: Aquaculture operations use eggs, larvae, or juvenile fish produced from farm-
raised broodstocks, use minimal numbers, or source them from demonstrably sustainable fisheries.
Criterion 8 Summary For P. monodon
Source of stock parameters Score C8 % of production from hatchery-raised broodstock, natural (passive) settlement, or sourced from sustainable fisheries
60
C8 Source of stock Final Score 6 YELLOW
For P. merguiensis, Metapenaeus ensis, M. lysianassa, P. indicus (or other passively collected native species).
Source of stock parameters Score C8 % of production from hatchery-raised broodstock or natural (passive) settlement
100
C8 Source of stock Final Score 10.00 GREEN
Justification of Ranking According to Chough et al. (2002), extensive shrimp culture was traditionally based on tidal recruitment of penaied and metapenaied shrimp—naturally occurring in the local waterways. The paper by Chough et al. (2002) also mentioned that some farmers stock part of their pond with hatchery reared postlarvae of P. monodon. Ten years later, Ha et al. (2012) stated that this farming system is now characterized by artificially stocked black tiger shrimp (P. monodon). Bush et al. (2010) also state that hatchery reared seed is often supplemented with low input farming techniques such as allowing natural recruitment of wild juveniles through tidal flushing, and according to Tho et al. (2011) the situation is the same for the improved-extensive systems in the same region. According to Urs Baumgartner (pers. comm., Blueyou Consulting Ltd 2012), 10%–30% of the P. monodon shrimp harvested originates from passive influx and the farmers supplement this with hatchery-raised P. monodon PLs every two to three months when they can afford it. Chough et al. (2002) reported that the dominant species produced purely by passive influx were Metapenaeus ensis and M. lysianassa (>80% harvest) with Penaeus indicus the next most important species (7%–10%). If the remainder were P. monodon, this would be 10%–13% of
29
production; i.e. at the lower end of Blueyou’s 10%–30% range. Even though the Chough et al. (2002) report could be considered somewhat dated, it is clear that the dominant source of P. monodon postlarvae is a hatchery. For the purposes of this assessment, 20% of P. monodon is considered to come from passive collection (i.e. the midpoint of the 10%–30% range, assuming the Chough et al. 2002 paper is relevant even though dated). The remaining PLs come from local and regional hatcheries which use, primarily, wild-caught broodstock, but there is little information available about this part of the overall farming process, and it is challenging to know where broodstock come from. Dieu et al. (2011) stated “The origin of broodstock is typically unknown.” The hatcheries that supply PLs to the mixed mangrove-shrimp farms in Ca Mau do buy some broodstock from a P. monodon domestication program7 (Urs Baumgartner, Blueyou Consulting Ltd, pers. comm. 2012), but the quantity is not known. This leaves a challenge for the scoring of this criterion. The development of P. monodon domestication is generally considered to be poorly developed. For example in 2010, the RIA2 domestication program in Vietnam was reported to still be at a research or study stage of development8. It appears unlikely that the hatcheries will be using substantial numbers of domesticated broodstock, and there is no available information on the source of wild-caught broodstock. The 20% of passive influx P. monodon are not penalized in the scoring, and the remaining 8 (out of 10) must be scored based on the domesticated broodstock and wild-caught (i.e. unknown) sources. If the wild fisheries were demonstrably sustainable, the final score would be 10 out of 10, but due to their unknown location and condition, the remaining 8 out of 10 is halved on a precautionary basis to give a final score of 6 out of 10. If more information can be made available on the source fisheries and their sustainability, this score can be improved. The score for the passively collected naturally occurring shrimp species is 10 out of 10. As P. monodon captive breeding is not yet common in SE Asia, this score is considered valid for regions other than Vietnam.
7 Vietnam’s Research Institute for Aquaculture 2 (RIA2)
8 http://vietfish.org/20101105084014634p49c88/spf-black-tiger-shrimp-domesticated-in-viet-nam.htm
30
Overall Recommendation The overall final score is the average of the individual criterion scores (after the two exceptional scores have been deducted from the total). The overall ranking is decided according to the final score, the number of red criteria, and the number of critical scores as follows: – Best Choice = Final score ≥6.6 AND no individual criteria are Red (i.e. <3.3). – Good Alternative = Final score ≥3.3 AND <6.6, OR Final score ≥ 6.6 and there is one
individual “Red” criterion. – Red = Final score <3.3, OR there is more than one individual Red criterion, OR there is one
or more Critical score.
Criterion Score (0-10) Rank Critical?
C1 Data 6.07 YELLOW
C2 Effluent 10.00 GREEN NO
C3 Habitat 3.87 YELLOW NO
C4 Chemicals 7.00 GREEN NO
C5 Feed 10.00 GREEN NO
C6 Escapes 8.00 GREEN NO
C7 Disease 8.00 GREEN NO
C8 Source 6.00 YELLOW
3.3X Wildlife mortalities -2.00 GREEN NO
6.2X Introduced species escape 0.00 GREEN
Total 56.94
Final score 7.12
OVERALL RANKING
Final Score 56.94
Initial rank GREEN
Red criteria 0
Interim rank GREEN
Critical Criteria? NO
Final Rank BEST CHOICE
For other shrimp species Penaeus merguiensis, Metapenaeus ensis, M. lysianassa, P. indicus (or other passively collected native species) For these species, the C6 and C8 criteria are scored 10, and the final score is 7.87 with no “Red” criteria. The final rank for these species from this production system is green.
31
Acknowledgements Scientific review does not constitute an endorsement of the Seafood Watch® program, or its seafood recommendations, on the part of the reviewing scientists. Seafood Watch® is solely responsible for the conclusions reached in this report. Seafood Watch® would like to thank Simon Bush and Ha Tran Thi Thu for graciously reviewing this report for scientific accuracy.
32
Supplemental information
33
References Alongi, D. M. (2008). "Mangrove forests: Resilience, protection from tsunamis, and responses to global climate change." Estuarine, Coastal and Shelf Science 76(1): 1-13. Barbier, E. B. (2012). "A spatial model of coastal ecosystem services." Ecological Economics. Barbier, E. B., E. W. Koch, et al. (2008). "Coastal Ecosystem-Based Management with Nonlinear Ecological Functions and Values." Science 319(5861): 321-323. Bosire, J., F. Dahdouh-Guebas, et al. (2008). "Functionality of restored mangroves: A review." Aquatic Botany 89(2): 251-259. Bosma, R., A. Sidik, et al. (2012). "Challenges of a transition to a sustainably managed shrimp culture agro-ecosystem in the Mahakam delta, East Kalimantan, Indonesia." Wetlands Ecology and Management 20(2): 89-99. Bush, S., P. van Zwieten, et al. (2010). "Scenarios for Resilient Shrimp Aquaculture in Tropical Coastal Areas." Ecology and Society 15(2): 15. Christensen, S. M., P. Tarp, et al. (2008). "Mangrove forest management planning in coastal buffer and conservation zones, Vietnam: A multimethodological approach incorporating multiple stakeholders." Ocean & Coastal Management 51(10): 712-726. Dieu, B., J. Vlak, et al. (2011). Effects of extensive and intensive shrimp farming on the genetic composition of white spot syndrome virus populations. Diseases in Asian Aquaculture VII. Fish Health Section. M. Bondstad, Asian Fisheries Society: 145-156. Gebhardt, S., L. D. Nguyen, et al. (2012). Mangrove Ecosystems in the Mekong Delta – Overcoming Uncertainties in Inventory Mapping Using Satellite Remote Sensing Data. The Mekong Delta System. F. G. Renaud and C. Kuenzer, Springer Netherlands: 315-330. Granek, E. F., S. Polasky, et al. (2009). "Ecosystem Services as a Common Language for Coastal Ecosystem‐Based Management." Conservation Biology 24(1): 207-216. Ha, T. T. T., S. R. Bush, et al. (2012). "Organic coasts? Regulatory challenges of certifying integrated shrimp–mangrove production systems in Vietnam." Journal of Rural Studies(0). Ha, T. T. T., H. van Dijk, et al. (2012). "Mangrove conservation or shrimp farmer's livelihood? The devolution of forest management and benefit sharing in the Mekong Delta, Vietnam." Ocean & Coastal Management 69(0): 185-193.

34
Hanley, R. (2007). Hanley, J. Russell. "Integrated land management to improve long-term benefits in coastal areas of Asian tsunami-affected countries." Proceedings of the Workshop on Coastal Area Planning and Management in Asian Tsunami Affected Countries. 2007. Proceedings of the Workshop on Coastal Area Planning and Management in Asian Tsunami Affected Countries. 2007. Hussain, S. A. and R. Badola (2010). "Valuing mangrove benefits: contribution of mangrove forests to local livelihoods in Bhitarkanika Conservation Area, east coast of India." Wetlands Ecology and Management 18(3): 321-331. Johnston, D., N. V. Trong, et al. (2000). "Shrimp yields and harvest characteristics of mixed shrimp-mangrove forestry farms in southern Vietnam: factors affecting production." Aquaculture 188(3-4): 263-284. Koch, E. W., E. B. Barbier, et al. (2009). "Non-linearity in ecosystem services: temporal and spatial variability in coastal protection." Frontiers in Ecology and the Environment 7(1): 29-37. Lovelock, C. E., R. W. Ruess, et al. (2011). "CO2 Efflux from Cleared Mangrove Peat." PLoS ONE 6(6): e21279. MARD, 2008. Proposal on Restoring and Development Coastal Mangroves for the Period 2008 -2015. Hanoi. Nga, B. T., H. Q. Tinh, et al. (2005). "Young Mangrove Stands Produce a Large and High Quality Litter Input to Aquatic Systems." Wetlands Ecology and Management 13(5): 569-576. Primavera, J. (2006). Overcoming the impacts of aquaculture on the coastal zone. Ocean and Coastal Management, 49, 531-545. Primavera, J. and J. Esteban (2008). "A review of mangrove rehabilitation in the Philippines: successes, failures and future prospects." Wetlands Ecology and Management 16(5): 345-358. Thi, N. (2007). Shrimp farming in Vietnam: Current situation, environmental-economic-social impacts and the need for sustainable shrimp aquaculture. 7th Asia Pacific Roundtable for sustainable consumption and production. Hanoi, Vietnam Tho, N., R. Merckx, et al. (2012). "Biological characteristics of the improved extensive shrimp system in the Mekong delta of Vietnam." Aquaculture Research 43(4): 526-537. Tho, N., V. N. Ut, et al. (2011). "Physico-chemical characteristics of the improved extensive shrimp farming system in the Mekong Delta of Vietnam." Aquaculture Research 42(11): 1600-1614.
35
Walters, B. B., P. Rönnbäck, et al. (2008). "Ethnobiology, socio-economics and management of mangrove forests: A review." Aquatic Botany 89(2): 220-236.
36
About Seafood Watch® Monterey Bay Aquarium’s Seafood Watch® program evaluates the ecological sustainability of wild-caught and farmed seafood commonly found in the United States marketplace. Seafood Watch® defines sustainable seafood as originating from sources, whether wild-caught or farmed, which can maintain or increase production in the long-term without jeopardizing the structure or function of affected ecosystems. Seafood Watch® makes its science-based recommendations available to the public in the form of regional pocket guides that can be downloaded from www.seafoodwatch.org. The program’s goals are to raise awareness of important ocean conservation issues and empower seafood consumers and businesses to make choices for healthy oceans. Each sustainability recommendation on the regional pocket guides is supported by a Seafood Report. Each report synthesizes and analyzes the most current ecological, fisheries and ecosystem science on a species, then evaluates this information against the program’s conservation ethic to arrive at a recommendation of “Best Choices,” “Good Alternatives” or “Avoid.” The detailed evaluation methodology is available upon request. In producing the Seafood Reports, Seafood Watch® seeks out research published in academic, peer-reviewed journals whenever possible. Other sources of information include government technical publications, fishery management plans and supporting documents, and other scientific reviews of ecological sustainability. Seafood Watch® Research Analysts also communicate regularly with ecologists, fisheries and aquaculture scientists, and members of industry and conservation organizations when evaluating fisheries and aquaculture practices. Capture fisheries and aquaculture practices are highly dynamic; as the scientific information on each species changes, Seafood Watch®’s sustainability recommendations and the underlying Seafood Reports will be updated to reflect these changes. Parties interested in capture fisheries, aquaculture practices and the sustainability of ocean ecosystems are welcome to use Seafood Reports in any way they find useful. For more information about Seafood Watch® and Seafood Reports, please contact the Seafood Watch® program at Monterey Bay Aquarium by calling 1-877-229-9990. Disclaimer Seafood Watch® strives to have all Seafood Reports reviewed for accuracy and completeness by external scientists with expertise in ecology, fisheries science and aquaculture. Scientific review, however, does not constitute an endorsement of the Seafood Watch® program or its recommendations on the part of the reviewing scientists. Seafood Watch® is solely responsible for the conclusions reached in this report. Seafood Watch® and Seafood Reports are made possible through a grant from the David and Lucile Packard Foundation.
37
Guiding Principles
Seafood Watch defines sustainable seafood as originating from sources, whether fished9 or farmed, that can maintain or increase production in the long-term without jeopardizing the structure or function of affected ecosystems. The following guiding principles illustrate the qualities that aquaculture must possess to be considered sustainable by the Seafood Watch program: Seafood Watch will:
Support data transparency and therefore aquaculture producers or industries that make
information and data on production practices and their impacts available to relevant
stakeholders.
Promote aquaculture production that minimizes or avoids the discharge of wastes at the
farm level in combination with an effective management or regulatory system to control
the location, scale and cumulative impacts of the industry’s waste discharges beyond the
immediate vicinity of the farm.
Promote aquaculture production at locations, scales and intensities that cumulatively
maintain the functionality of ecologically valuable habitats without unreasonably penalizing
historic habitat damage.
Promote aquaculture production that by design, management or regulation avoids the use
and discharge of chemicals toxic to aquatic life, and/or effectively controls the frequency,
risk of environmental impact and risk to human health of their use.
Within the typically limited data availability, use understandable quantitative and relative
indicators to recognize the global impacts of feed production and the efficiency of
conversion of feed ingredients to farmed seafood.
Promote aquaculture operations that pose no substantial risk of deleterious effects to wild
fish or shellfish populations through competition, habitat damage, genetic introgression,
hybridization, spawning disruption, changes in trophic structure or other impacts associated
with the escape of farmed fish or other unintentionally introduced species.
Promote aquaculture operations that pose no substantial risk of deleterious effects to wild
populations through the amplification and retransmission of pathogens or parasites.
Promote the use of eggs, larvae, or juvenile fish produced in hatcheries using domesticated
broodstocks thereby avoiding the need for wild capture.
Recognize that energy use varies greatly among different production systems and can be a
major impact category for some aquaculture operations, and also recognize that improving
9 “Fish” is used throughout this document to refer to finfish, shellfish and other invertebrates.
38
practices for some criteria may lead to more energy intensive production systems (e.g.
promoting more energy-intensive closed recirculation systems).
Once a score and rank has been assigned to each criterion, an overall seafood recommendation is developed on additional evaluation guidelines. Criteria ranks and the overall recommendation are color-coded to correspond to the categories on the Seafood Watch pocket guide: Best Choices/Green: Are well managed and caught or farmed in environmentally friendly ways. Good Alternatives/Yellow: Buy, but be aware there are concerns with how they’re caught or farmed. Avoid/Red: Take a pass on these. These items are overfished or caught or farmed in ways that harm other marine life or the environment.
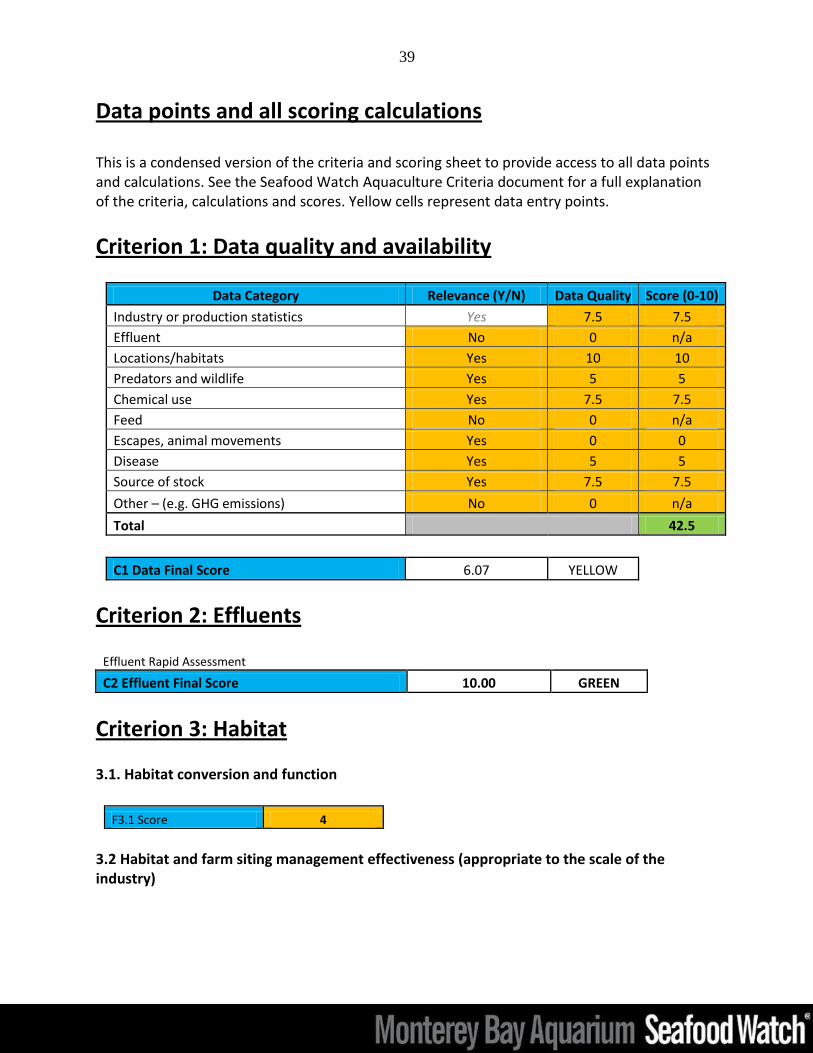
39
Data points and all scoring calculations This is a condensed version of the criteria and scoring sheet to provide access to all data points and calculations. See the Seafood Watch Aquaculture Criteria document for a full explanation of the criteria, calculations and scores. Yellow cells represent data entry points.
Criterion 1: Data quality and availability
Data Category Relevance (Y/N) Data Quality Score (0-10)
Industry or production statistics Yes 7.5 7.5
Effluent No 0 n/a
Locations/habitats Yes 10 10
Predators and wildlife Yes 5 5
Chemical use Yes 7.5 7.5
Feed No 0 n/a
Escapes, animal movements Yes 0 0
Disease Yes 5 5
Source of stock Yes 7.5 7.5
Other – (e.g. GHG emissions) No 0 n/a
Total 42.5
C1 Data Final Score 6.07 YELLOW
Criterion 2: Effluents
Effluent Rapid Assessment
C2 Effluent Final Score 10.00 GREEN
Criterion 3: Habitat
3.1. Habitat conversion and function
F3.1 Score 4
3.2 Habitat and farm siting management effectiveness (appropriate to the scale of the industry)
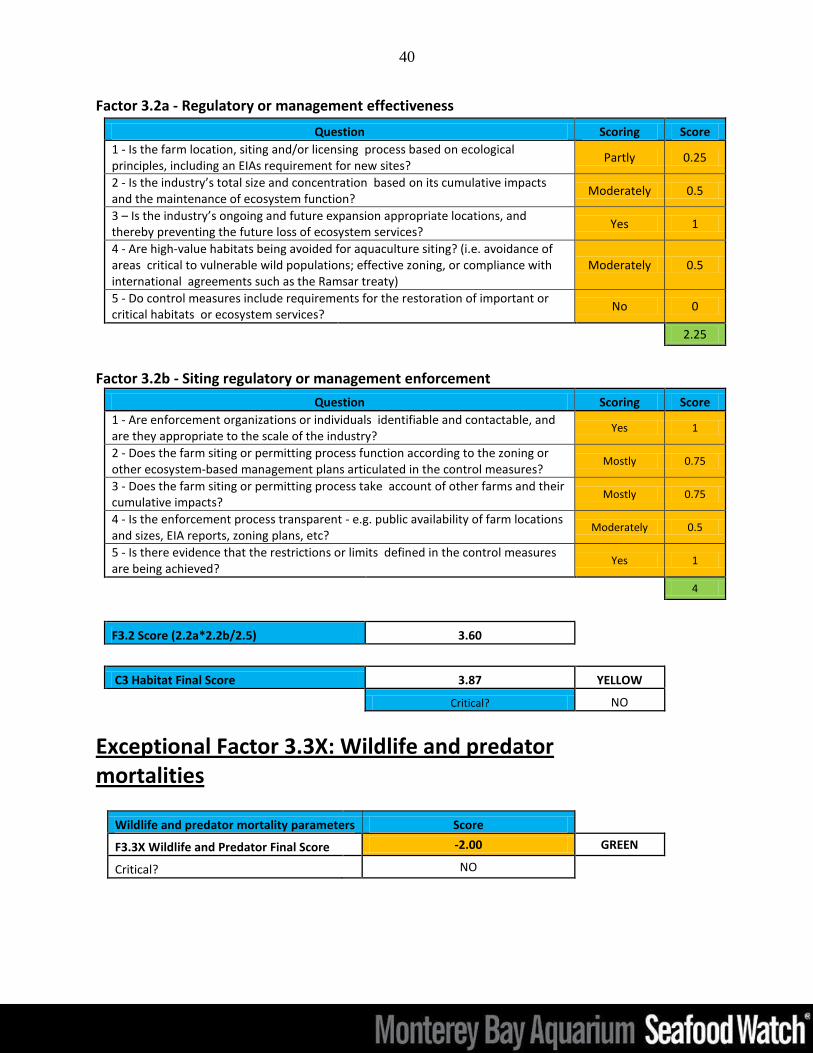
40
Factor 3.2a - Regulatory or management effectiveness
Question Scoring Score
1 - Is the farm location, siting and/or licensing process based on ecological principles, including an EIAs requirement for new sites?
Partly 0.25
2 - Is the industry’s total size and concentration based on its cumulative impacts and the maintenance of ecosystem function?
Moderately 0.5
3 – Is the industry’s ongoing and future expansion appropriate locations, and thereby preventing the future loss of ecosystem services?
Yes 1
4 - Are high-value habitats being avoided for aquaculture siting? (i.e. avoidance of areas critical to vulnerable wild populations; effective zoning, or compliance with international agreements such as the Ramsar treaty)
Moderately 0.5
5 - Do control measures include requirements for the restoration of important or critical habitats or ecosystem services?
No 0
2.25
Factor 3.2b - Siting regulatory or management enforcement
Question Scoring Score
1 - Are enforcement organizations or individuals identifiable and contactable, and are they appropriate to the scale of the industry?
Yes 1
2 - Does the farm siting or permitting process function according to the zoning or other ecosystem-based management plans articulated in the control measures?
Mostly 0.75
3 - Does the farm siting or permitting process take account of other farms and their cumulative impacts?
Mostly 0.75
4 - Is the enforcement process transparent - e.g. public availability of farm locations and sizes, EIA reports, zoning plans, etc?
Moderately 0.5
5 - Is there evidence that the restrictions or limits defined in the control measures are being achieved?
Yes 1
4
F3.2 Score (2.2a*2.2b/2.5) 3.60
C3 Habitat Final Score 3.87 YELLOW
Critical? NO
Exceptional Factor 3.3X: Wildlife and predator mortalities
Wildlife and predator mortality parameters Score
F3.3X Wildlife and Predator Final Score -2.00 GREEN
Critical? NO

41
Criterion 4: Evidence or Risk of Chemical Use
Chemical Use parameters Score
C4 Chemical Use Score 7.00
C4 Chemical Use Final Score 7.00 GREEN
Critical? NO
Criterion 5: Feed No Feed provided. Score = 10
Criterion 6: Escapes 6.1a. Escape Risk
Escape Risk 7
Recapture & Mortality Score (RMS)
Estimated % recapture rate or direct mortality at the 0
escape site
Recapture & Mortality Score 0
Factor 6.1a Escape Risk Score 7
Exceptional Factor 6.2X: Escape of unintentionally introduced species
Escape of unintentionally introduced species parameters Score
F6.2Xa International or trans-waterbody live animal shipments (%) 10.00
F6.2Xb Biosecurity of source/destination 0.00
F6.2X Escape of unintentionally introduced species Final Score 0.00 GREEN
Criterion 7: Diseases
Pathogen and parasite parameters Score
C7 Biosecurity 8.00
C7 Disease; pathogen and parasite Final Score 8.00 GREEN
Critical? NO
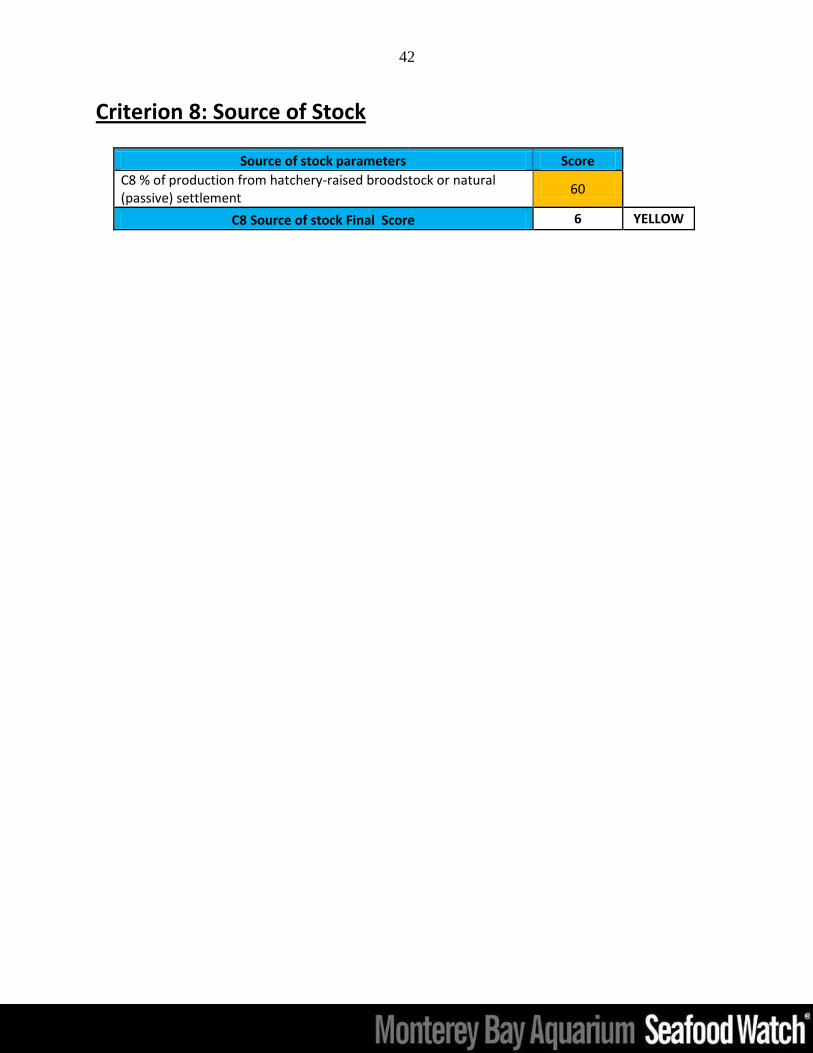
42
Criterion 8: Source of Stock
Source of stock parameters Score
C8 % of production from hatchery-raised broodstock or natural (passive) settlement
60
C8 Source of stock Final Score 6 YELLOW

![Polyplan Shrimp Basic Concept Alpha-Maris 2016 · 2017. 5. 31. · [] page 3 of 11 Criteria for an indoor shrimp farm White Tiger Shrimp (25-30 g/pcs), Litopenaeus vannamei, prepared](https://img.pdfslide.net/doc/110x75/6000feec0a6f01625220c85d/polyplan-shrimp-basic-concept-alpha-maris-2016-2017-5-31-page-3-of-11-criteria.jpg)