Embed Size (px)
Citation preview
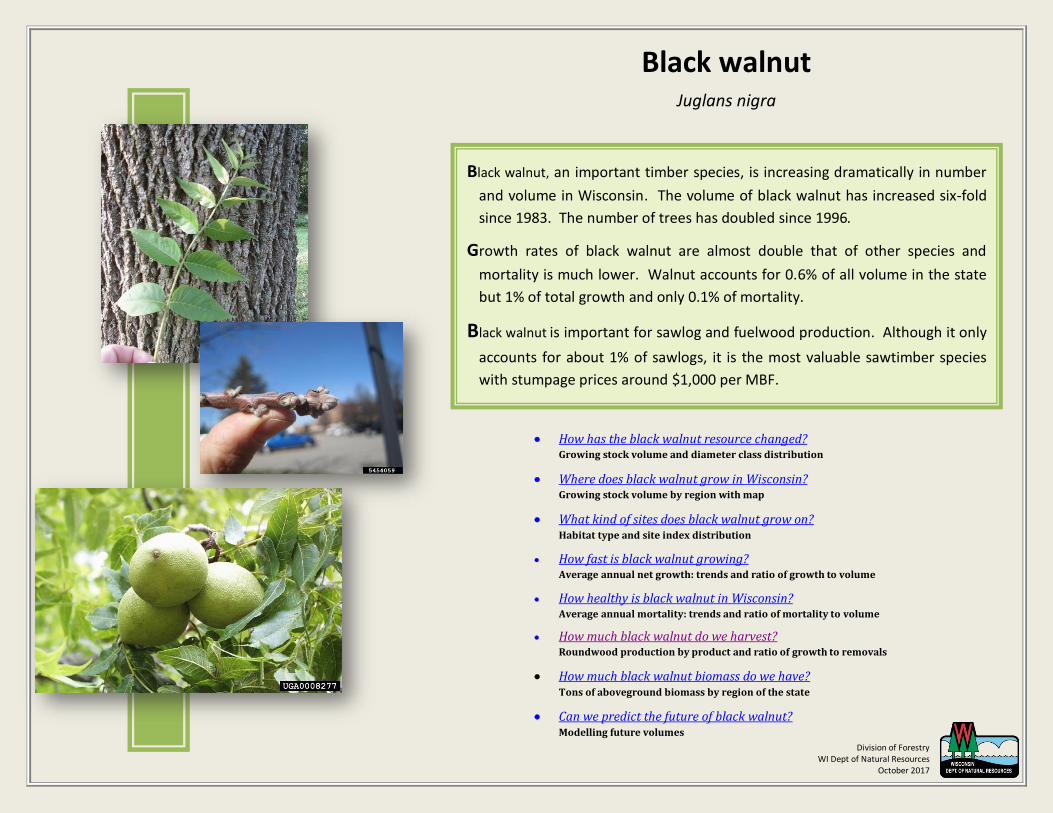
Black walnut Juglans nigra
• How has the black walnut resource changed? Growing stock volume and diameter class distribution
• Where does black walnut grow in Wisconsin? Growing stock volume by region with map
• What kind of sites does black walnut grow on? Habitat type and site index distribution
• How fast is black walnut growing?
Average annual net growth: trends and ratio of growth to volume
• How healthy is black walnut in Wisconsin?
Average annual mortality: trends and ratio of mortality to volume
• How much black walnut do we harvest?
Roundwood production by product and ratio of growth to removals
• How much black walnut biomass do we have? Tons of aboveground biomass by region of the state
• Can we predict the future of black walnut? Modelling future volumes
Black walnut, an important timber species, is increasing dramatically in number
and volume in Wisconsin. The volume of black walnut has increased six-fold
since 1983. The number of trees has doubled since 1996.
Growth rates of black walnut are almost double that of other species and
mortality is much lower. Walnut accounts for 0.6% of all volume in the state
but 1% of total growth and only 0.1% of mortality.
Black walnut is important for sawlog and fuelwood production. Although it only
accounts for about 1% of sawlogs, it is the most valuable sawtimber species
with stumpage prices around $1,000 per MBF.
Division of Forestry WI Dept of Natural Resources
October 2017
0
50
100
150
200
250
0-19 20-39 40-59 60-79 80-99 100-119
Change in acreage of red pine forest type
1983
1996
2005
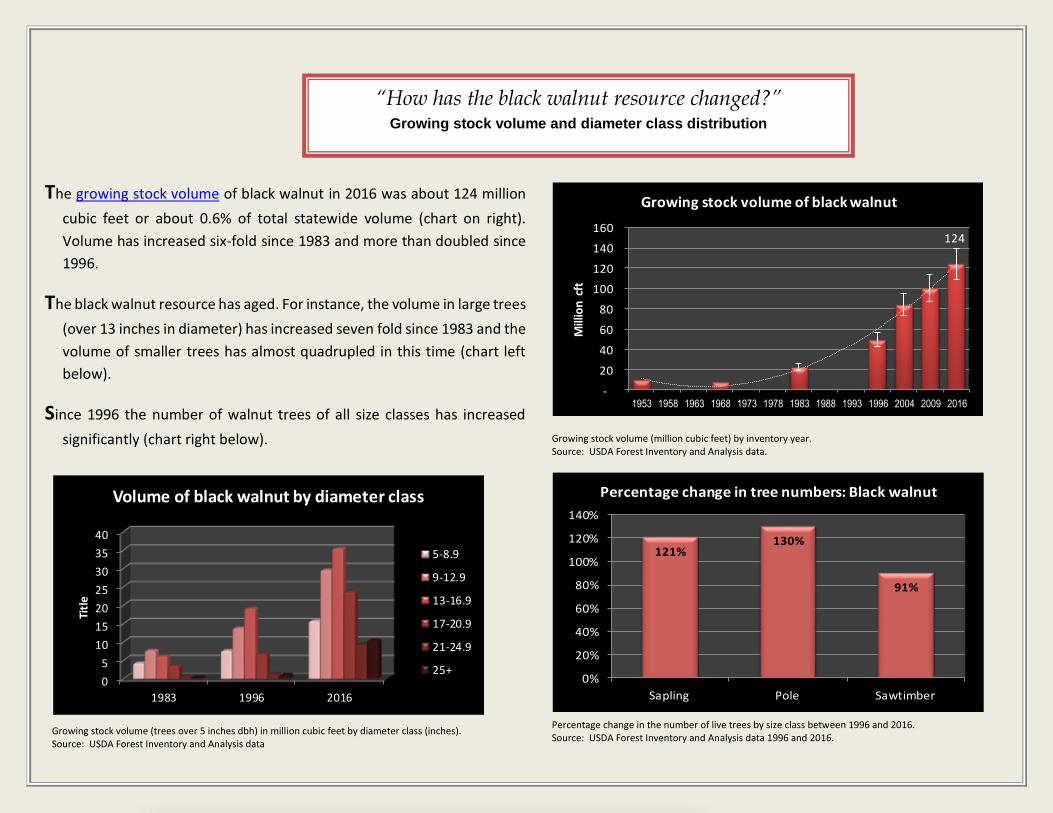
“How has the black walnut resource changed?” Growing stock volume and diameter class distribution
The growing stock volume of black walnut in 2016 was about 124 million
cubic feet or about 0.6% of total statewide volume (chart on right).
Volume has increased six-fold since 1983 and more than doubled since
1996.
The black walnut resource has aged. For instance, the volume in large trees
(over 13 inches in diameter) has increased seven fold since 1983 and the
volume of smaller trees has almost quadrupled in this time (chart left
below).
Since 1996 the number of walnut trees of all size classes has increased
significantly (chart right below).
Percentage change in the number of live trees by size class between 1996 and 2016. Source: USDA Forest Inventory and Analysis data 1996 and 2016.
Growing stock volume (trees over 5 inches dbh) in million cubic feet by diameter class (inches). Source: USDA Forest Inventory and Analysis data
Growing stock volume (million cubic feet) by inventory year. Source: USDA Forest Inventory and Analysis data.
124
-
20
40
60
80
100
120
140
160
1953 1958 1963 1968 1973 1978 1983 1988 1993 1996 2004 2009 2016
Mill
ion
cft
Growing stock volume of black walnut
0
5
10
15
20
25
30
35
40
1983 1996 2016
Titl
e
Volume of black walnut by diameter class
5-8.9
9-12.9
13-16.9
17-20.9
21-24.9
25+
121%130%
91%
0%
20%
40%
60%
80%
100%
120%
140%
Sapling Pole Sawtimber
Percentage change in tree numbers: Black walnut
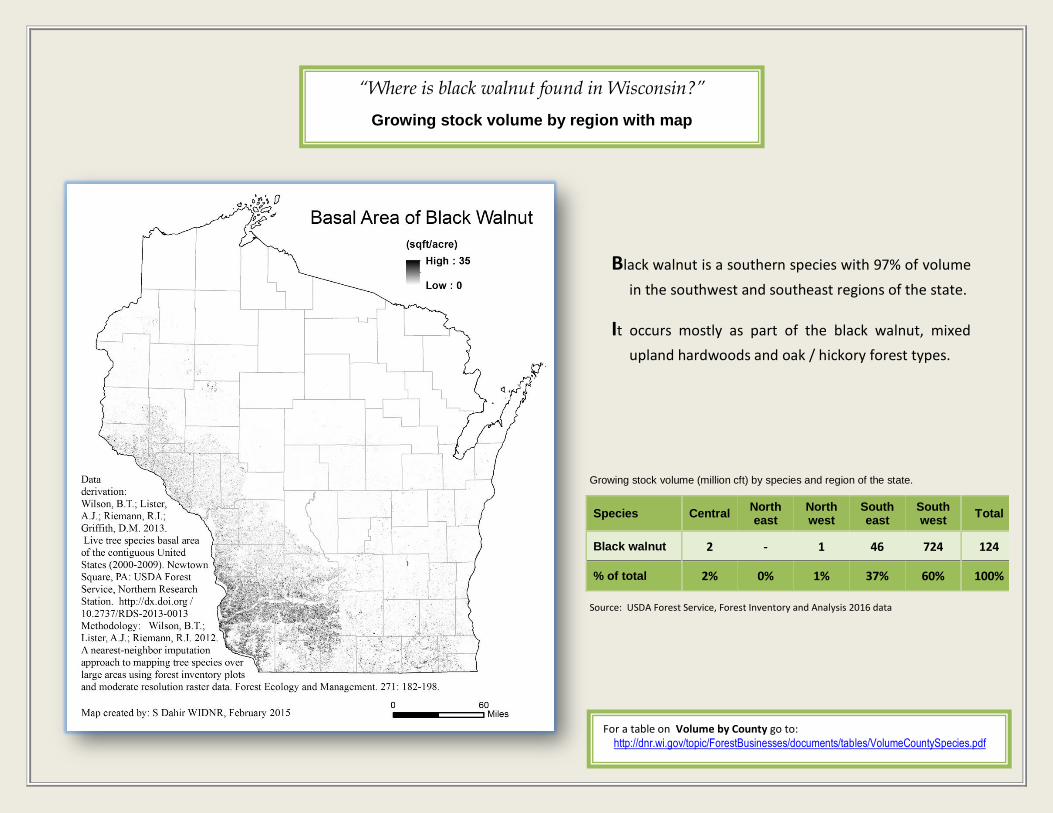
“Where is black walnut found in Wisconsin?”
Growing stock volume by region with map
Black walnut is a southern species with 97% of volume
in the southwest and southeast regions of the state.
It occurs mostly as part of the black walnut, mixed
upland hardwoods and oak / hickory forest types.
For a table on Volume by County go to: http://dnr.wi.gov/topic/ForestBusinesses/documents/tables/VolumeCountySpecies.pdf
Growing stock volume (million cft) by species and region of the state.
Species Central North east
North west
South east
South west
Total
Black walnut 2 - 1 46 724 124
% of total 2% 0% 1% 37% 60% 100%
Source: USDA Forest Service, Forest Inventory and Analysis 2016 data
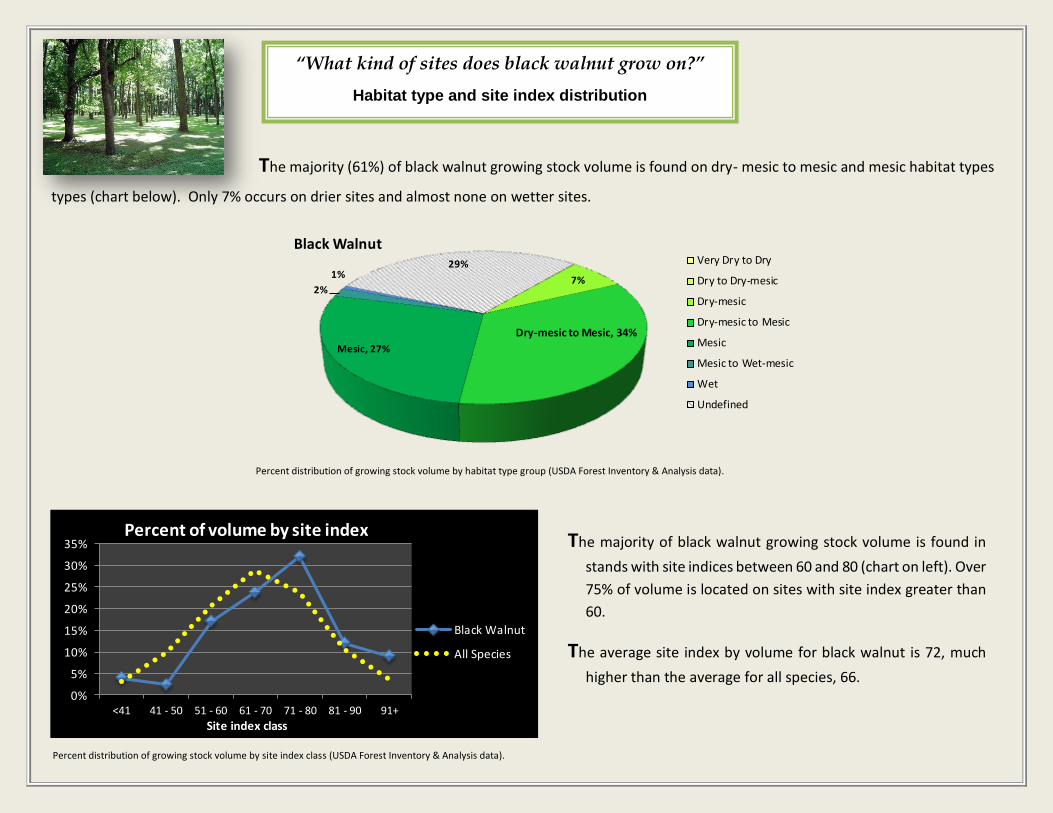
“What kind of sites does black walnut grow on?”
Habitat type and site index distribution
The majority (61%) of black walnut growing stock volume is found on dry- mesic to mesic and mesic habitat types
The majority of black walnut growing stock volume is found in
stands with site indices between 60 and 80 (chart on left). Over
75% of volume is located on sites with site index greater than
60.
The average site index by volume for black walnut is 72, much
higher than the average for all species, 66.
types (chart below). Only 7% occurs on drier sites and almost none on wetter sites.
Percent distribution of growing stock volume by habitat type group (USDA Forest Inventory & Analysis data).
7%
Dry-mesic to Mesic, 34%
Mesic, 27%
2%
1%29%
Black WalnutVery Dry to Dry
Dry to Dry-mesic
Dry-mesic
Dry-mesic to Mesic
Mesic
Mesic to Wet-mesic
Wet
Undefined
0%
5%
10%
15%
20%
25%
30%
35%
<41 41 - 50 51 - 60 61 - 70 71 - 80 81 - 90 91+
Site index class
Percent of volume by site index
Black Walnut
All Species
Percent distribution of growing stock volume by site index class (USDA Forest Inventory & Analysis data).
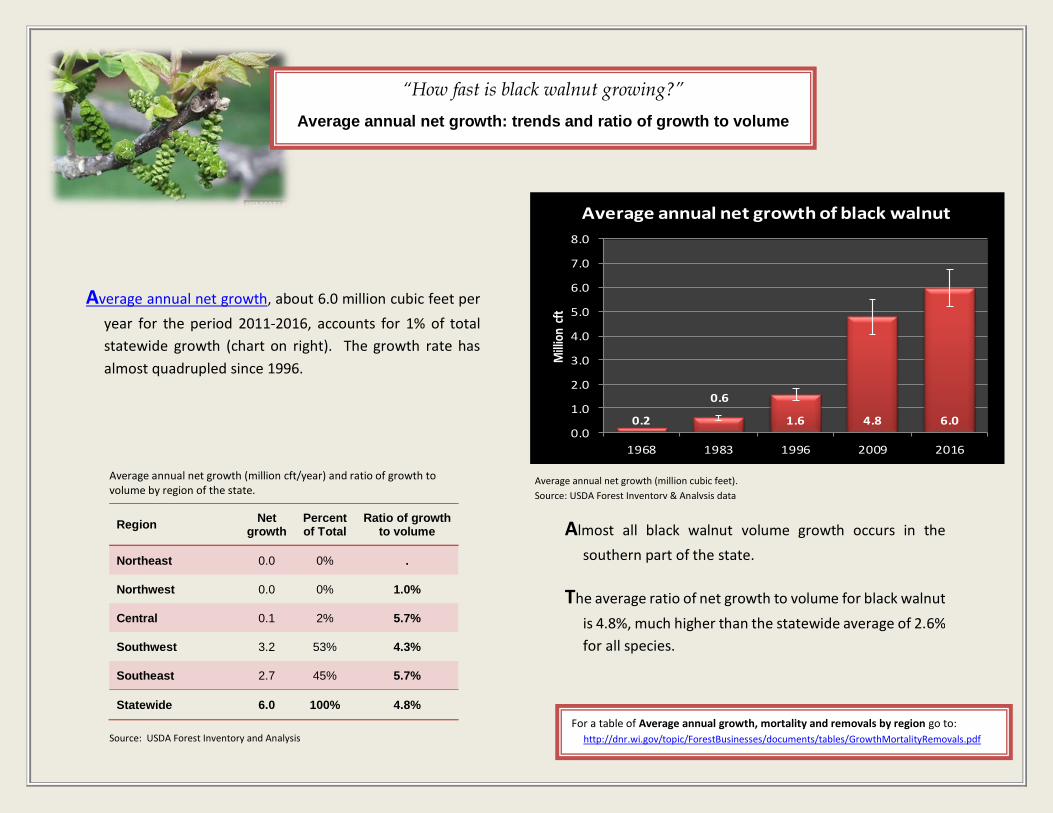
Average annual net growth (million cubic feet).
Source: USDA Forest Inventory & Analysis data
Average annual net growth, about 6.0 million cubic feet per
year for the period 2011-2016, accounts for 1% of total
statewide growth (chart on right). The growth rate has
almost quadrupled since 1996.
“How fast is black walnut growing?”
Average annual net growth: trends and ratio of growth to volume
Almost all black walnut volume growth occurs in the
southern part of the state.
The average ratio of net growth to volume for black walnut
is 4.8%, much higher than the statewide average of 2.6%
for all species.
Region Net
growth Percent of Total
Ratio of growth to volume
Northeast 0.0 0% .
Northwest 0.0 0% 1.0%
Central 0.1 2% 5.7%
Southwest 3.2 53% 4.3%
Southeast 2.7 45% 5.7%
Statewide 6.0 100% 4.8%
Source: USDA Forest Inventory and Analysis
Average annual net growth (million cft/year) and ratio of growth to volume by region of the state.
For a table of Average annual growth, mortality and removals by region go to:
http://dnr.wi.gov/topic/ForestBusinesses/documents/tables/GrowthMortalityRemovals.pdf
0.2
0.6
1.6 4.8 6.00.0
1.0
2.0
3.0
4.0
5.0
6.0
7.0
8.0
1968 1983 1996 2009 2016
Mill
ion
cft
Average annual net growth of black walnut
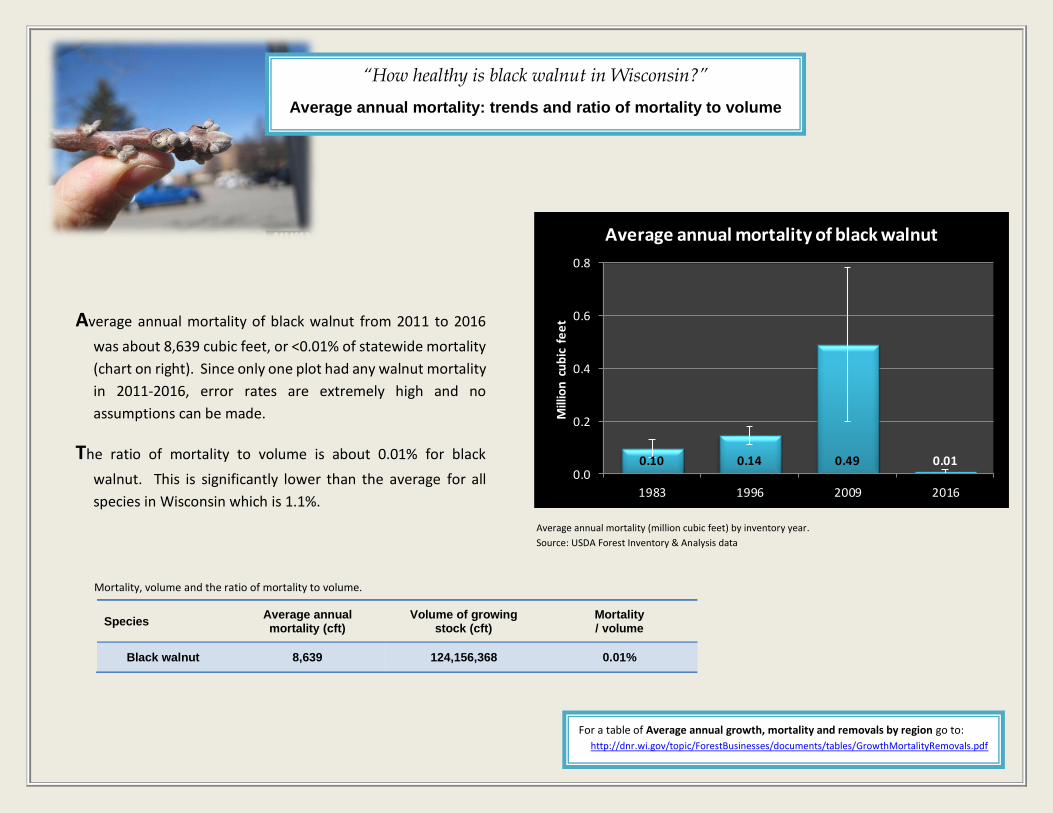
“How healthy is black walnut in Wisconsin?”
Average annual mortality: trends and ratio of mortality to volume
Average annual mortality of black walnut from 2011 to 2016
was about 8,639 cubic feet, or <0.01% of statewide mortality
(chart on right). Since only one plot had any walnut mortality
in 2011-2016, error rates are extremely high and no
assumptions can be made.
The ratio of mortality to volume is about 0.01% for black
walnut. This is significantly lower than the average for all
species in Wisconsin which is 1.1%.
Species Average annual mortality (cft)
Volume of growing stock (cft)
Mortality / volume
Black walnut 8,639 124,156,368 0.01%
Mortality, volume and the ratio of mortality to volume.
Average annual mortality (million cubic feet) by inventory year.
Source: USDA Forest Inventory & Analysis data
For a table of Average annual growth, mortality and removals by region go to:
http://dnr.wi.gov/topic/ForestBusinesses/documents/tables/GrowthMortalityRemovals.pdf
0.10 0.14 0.49 0.010.0
0.2
0.4
0.6
0.8
1983 1996 2009 2016
Mill
ion
cu
bic
fe
et
Average annual mortality of black walnut
“How much black walnut do we harvest?”
Roundwood production by product and year
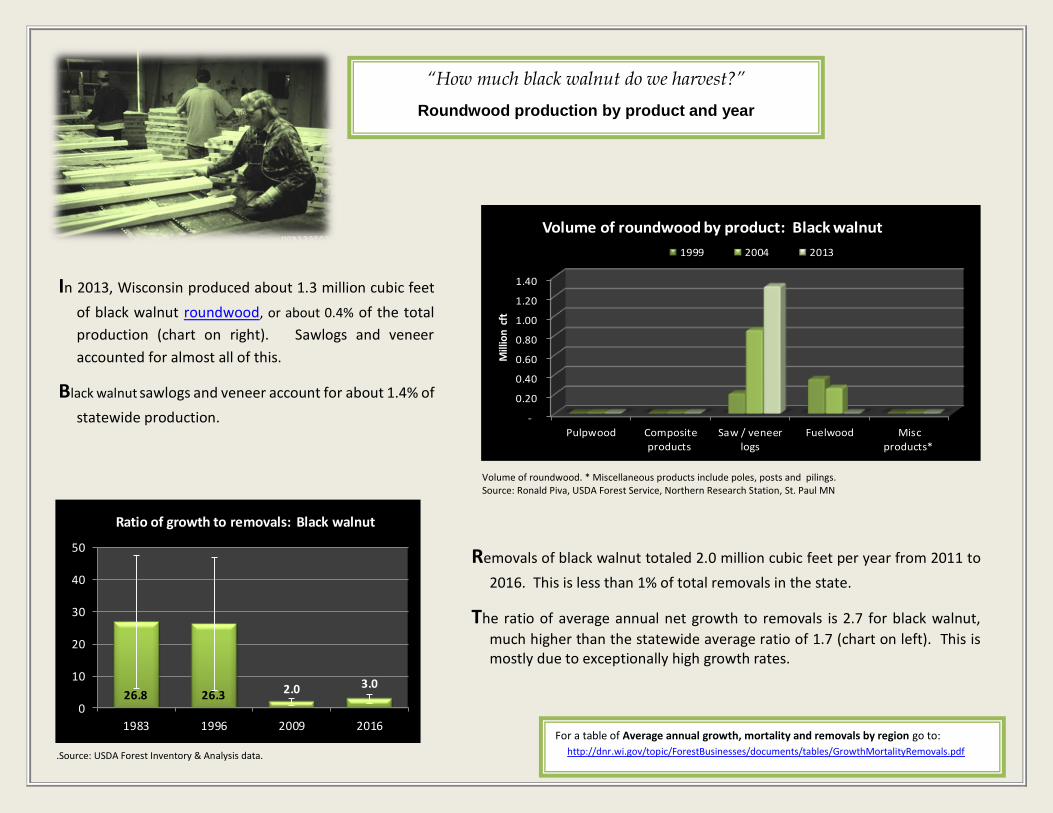
In 2013, Wisconsin produced about 1.3 million cubic feet
of black walnut roundwood, or about 0.4% of the total
production (chart on right). Sawlogs and veneer
accounted for almost all of this.
Black walnut sawlogs and veneer account for about 1.4% of
statewide production.
Removals of black walnut totaled 2.0 million cubic feet per year from 2011 to
2016. This is less than 1% of total removals in the state.
The ratio of average annual net growth to removals is 2.7 for black walnut,
much higher than the statewide average ratio of 1.7 (chart on left). This is mostly due to exceptionally high growth rates.
.Source: USDA Forest Inventory & Analysis data.
For a table of Average annual growth, mortality and removals by region go to:
http://dnr.wi.gov/topic/ForestBusinesses/documents/tables/GrowthMortalityRemovals.pdf
-
0.20
0.40
0.60
0.80
1.00
1.20
1.40
Pulpwood Composite
products
Saw / veneer
logs
Fuelwood Misc
products*
Mill
ion
cft
Volume of roundwood by product: Black walnut
1999 2004 2013
26.8 26.3 2.0 3.0
0
10
20
30
40
50
1983 1996 2009 2016
Ratio of growth to removals: Black walnut
Volume of roundwood. * Miscellaneous products include poles, posts and pilings. Source: Ronald Piva, USDA Forest Service, Northern Research Station, St. Paul MN
“How much black walnut biomass do we have?”
Tons of aboveground biomass by region of the state
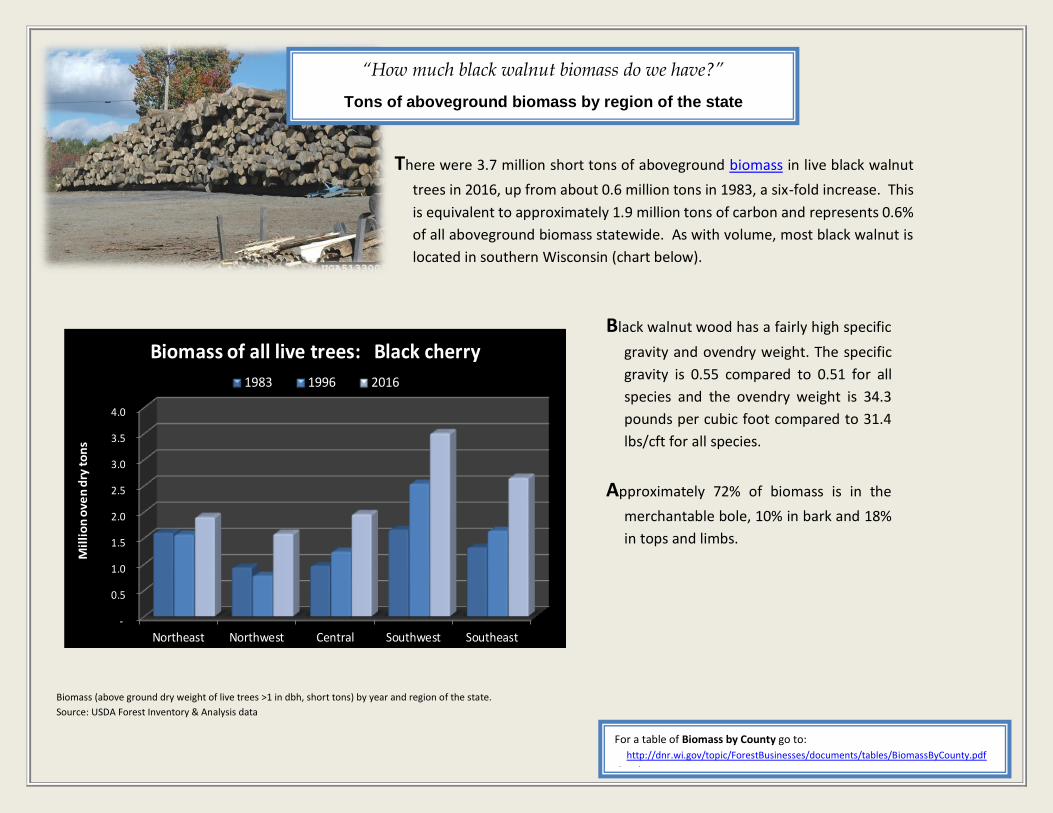
There were 3.7 million short tons of aboveground biomass in live black walnut
trees in 2016, up from about 0.6 million tons in 1983, a six-fold increase. This
is equivalent to approximately 1.9 million tons of carbon and represents 0.6%
of all aboveground biomass statewide. As with volume, most black walnut is
located in southern Wisconsin (chart below).
Black walnut wood has a fairly high specific
gravity and ovendry weight. The specific
gravity is 0.55 compared to 0.51 for all
species and the ovendry weight is 34.3
pounds per cubic foot compared to 31.4
lbs/cft for all species.
Approximately 72% of biomass is in the
merchantable bole, 10% in bark and 18%
in tops and limbs.
Biomass (above ground dry weight of live trees >1 in dbh, short tons) by year and region of the state.
Source: USDA Forest Inventory & Analysis data
-
0.5
1.0
1.5
2.0
2.5
3.0
3.5
4.0
Northeast Northwest Central Southwest Southeast
Mil
lio
n o
ven
dry
to
ns
Biomass of all live trees: Black cherry
1983 1996 2016
For a table of Biomass by County go to:
http://dnr.wi.gov/topic/ForestBusinesses/documents/tables/BiomassByCounty.pdf
.html
“Can we predict the future of black walnut?”
Predicted volumes based on current rates of mortality and harvest
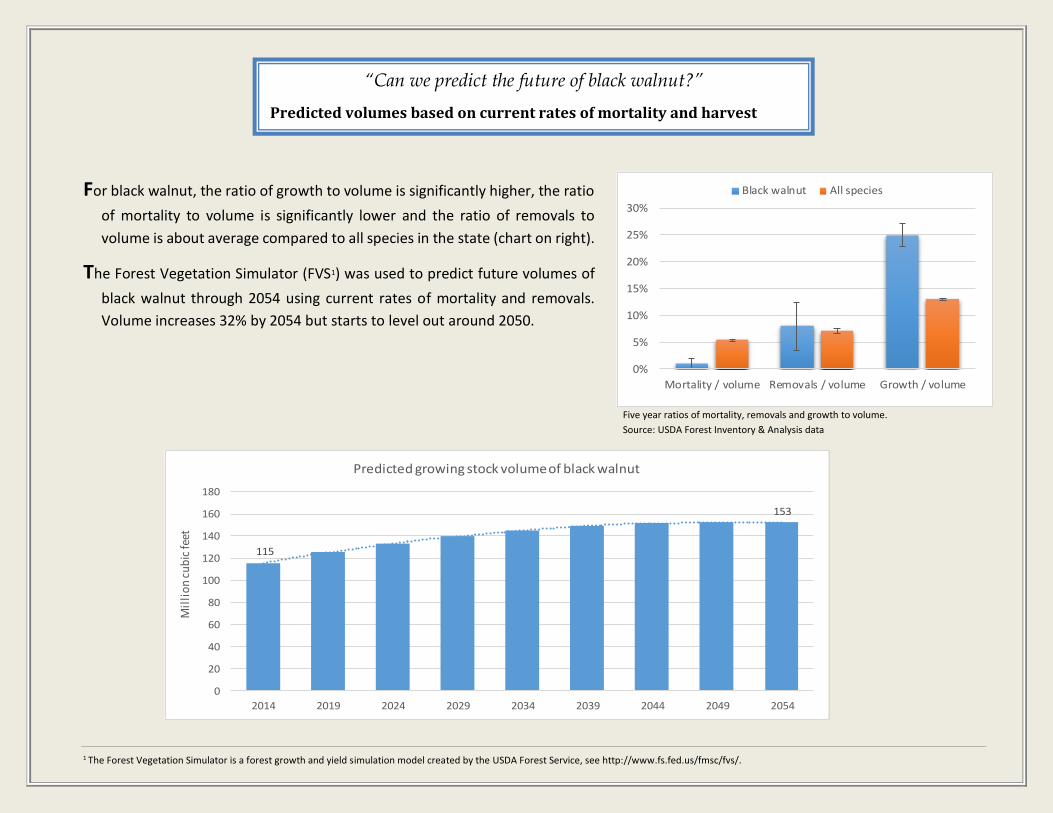
For black walnut, the ratio of growth to volume is significantly higher, the ratio
of mortality to volume is significantly lower and the ratio of removals to
volume is about average compared to all species in the state (chart on right).
The Forest Vegetation Simulator (FVS1) was used to predict future volumes of
black walnut through 2054 using current rates of mortality and removals.
Volume increases 32% by 2054 but starts to level out around 2050.
0%
5%
10%
15%
20%
25%
30%
Mortality / volume Removals / volume Growth / volume
Black walnut All species
115
153
0
20
40
60
80
100
120
140
160
180
2014 2019 2024 2029 2034 2039 2044 2049 2054
Mil
lio
n c
ub
ic fe
et
Predicted growing stock volume of black walnut
Five year ratios of mortality, removals and growth to volume.
Source: USDA Forest Inventory & Analysis data
1 The Forest Vegetation Simulator is a forest growth and yield simulation model created by the USDA Forest Service, see http://www.fs.fed.us/fmsc/fvs/.