Embed Size (px)
Citation preview
Noname manuscript No.(will be inserted by the editor)
Blind weave detection for woven fabrics
Received: date / Accepted: date
Abstract For the purpose of textile quality assurance,
an algorithmic framework for fully automatic detection
of weave patterns in woven fabrics is presented. The
proposed method is able to handle fabrics of any rota-
tion, material, and binding. Periodicity features within
highly resolved fabric images are found and structured
in a compact yarn matrix representation which allows
to estimate the trajectories of single yarns. Fourier anal-
ysis, template matching and fuzzy clustering are some
of the key methods employed during the process. From
the yarn matrix, the fabric’s weave and density can
directly be derived. Since a multitude of factors may
falsify the output, a feedback loop is integrated to it-
eratively find an optimal result. The framework works
completely blind, i.e. without any a priori knowledge of
the fabric. The evaluation has been conducted on an ex-tensive image database of 140 real-world fabric images
including cotton, polyester, viscose, and carbon mate-
rials of either plain, twill or satin weave. The system
proved to be robust and versatile as a 97% detection
accuracy could be achieved. Source codes and image
databases are provided.
woven fabric analysis, weave pattern, binding, yarn
density measurement, fabric database
1 Introduction
Weaving is the oldest method for the production of tex-
tile fabric. Within this process, two distinct and orthog-
onal yarn sets are interlaced according to a predefined
pattern to form a cloth. Woven fabrics are of fundamen-
tal significance not only to apparel and wear applica-
tions (jeans, shirt, and suit materials), but also to high
technology products in the automotive, aerospace, and
military industry. Examples are glass or carbon fabrics
used in fiber-reinforced composites and aramid fabrics
used in ballistic rated body armor, ballistic composites,
canvas, and tyre cord. The overall turnover in the year
2012 for fabric products is estimated to be 19 billion
Euro only in Germany [1].
The four main characteristics of woven fabric are
determined by 1) its yarn material and composition, 2)
the grammage (weight of the material per unit area),
3) the pickage (yarn density), and 4) the braiding pat-
tern which is called weave. The weave defines how wefts
(horizontally passing yarns) and warps (vertically pass-
ing yarns) are interlaced among each other to form
the cloth. An intersection point between yarns is called
float-point. We talk about weft-floats when a weft is re-
siding on top of a warp and of warp-floats if it is the
other way around. The weave is a fundamental prop-
erty of the fabric and codetermines the look and feel
as well as physical properties of the material. Several
weave pattern classes exist, the most common ones be-
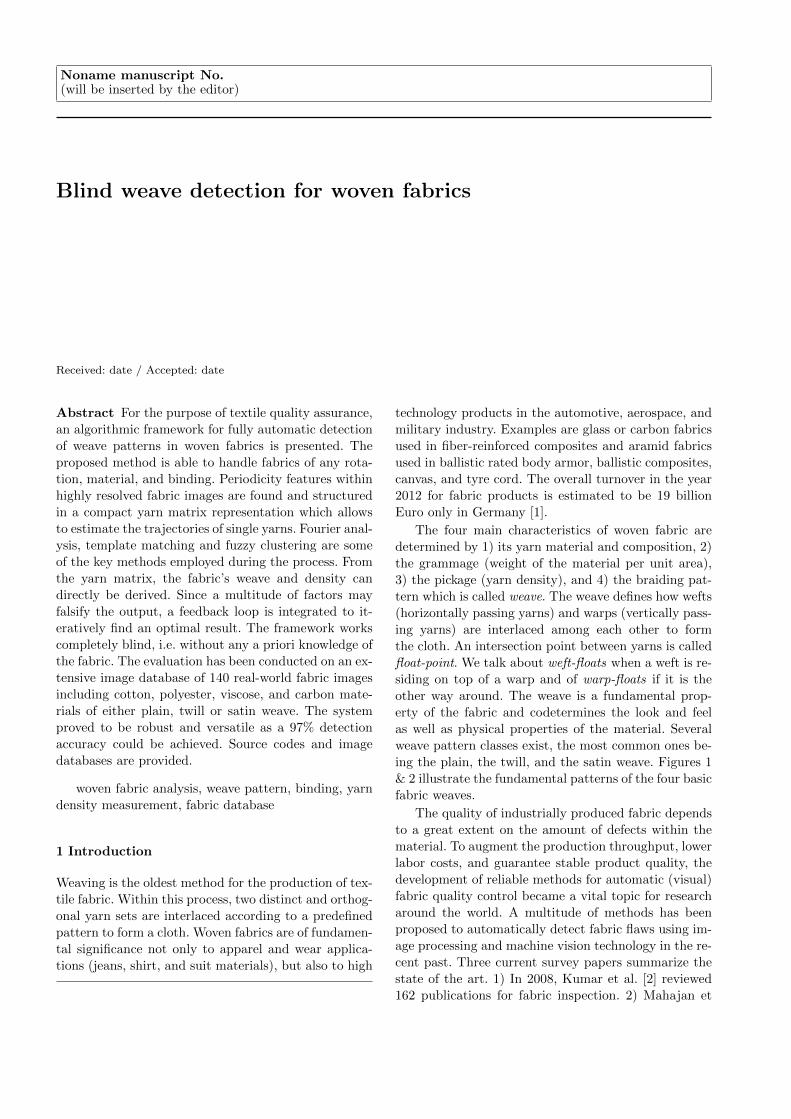
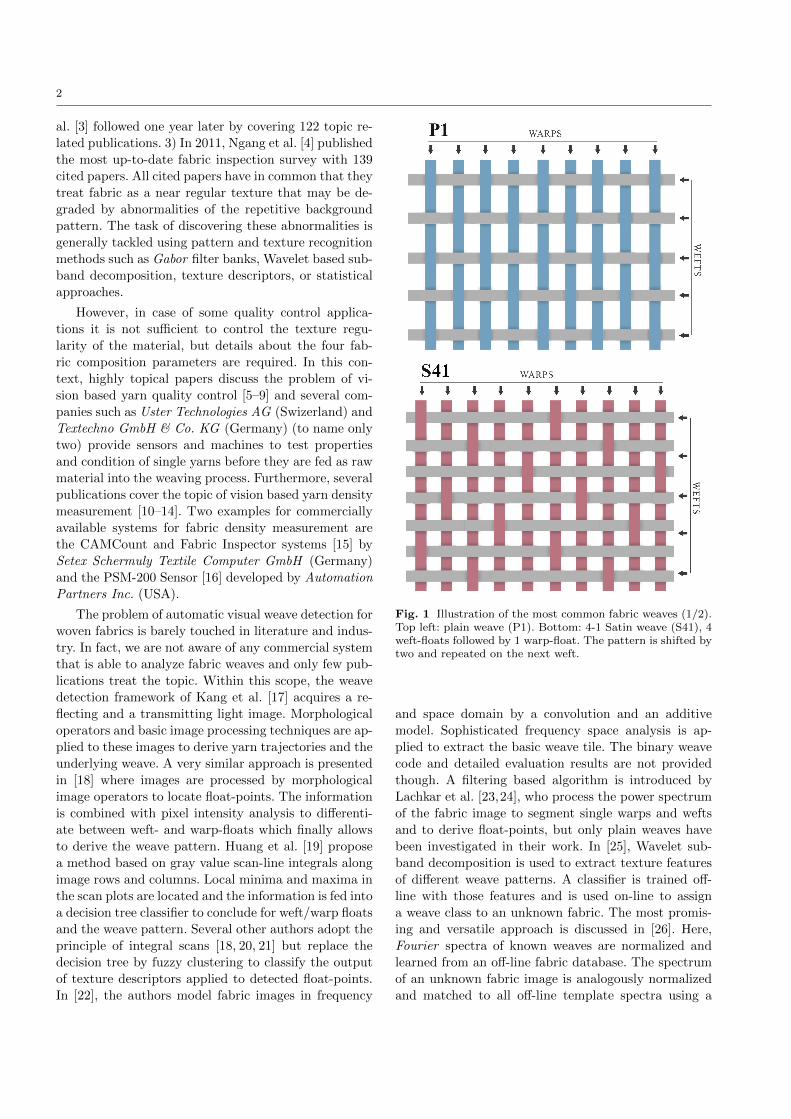
ing the plain, the twill, and the satin weave. Figures 1
& 2 illustrate the fundamental patterns of the four basic
fabric weaves.
The quality of industrially produced fabric depends
to a great extent on the amount of defects within the
material. To augment the production throughput, lower
labor costs, and guarantee stable product quality, the
development of reliable methods for automatic (visual)
fabric quality control became a vital topic for research
around the world. A multitude of methods has been
proposed to automatically detect fabric flaws using im-
age processing and machine vision technology in the re-
cent past. Three current survey papers summarize the
state of the art. 1) In 2008, Kumar et al. [2] reviewed
162 publications for fabric inspection. 2) Mahajan et
2
al. [3] followed one year later by covering 122 topic re-
lated publications. 3) In 2011, Ngang et al. [4] published
the most up-to-date fabric inspection survey with 139
cited papers. All cited papers have in common that they
treat fabric as a near regular texture that may be de-
graded by abnormalities of the repetitive background
pattern. The task of discovering these abnormalities is
generally tackled using pattern and texture recognition
methods such as Gabor filter banks, Wavelet based sub-
band decomposition, texture descriptors, or statistical
approaches.
However, in case of some quality control applica-
tions it is not sufficient to control the texture regu-
larity of the material, but details about the four fab-
ric composition parameters are required. In this con-
text, highly topical papers discuss the problem of vi-
sion based yarn quality control [5–9] and several com-
panies such as Uster Technologies AG (Swizerland) and
Textechno GmbH & Co. KG (Germany) (to name only
two) provide sensors and machines to test properties
and condition of single yarns before they are fed as raw
material into the weaving process. Furthermore, several
publications cover the topic of vision based yarn density
measurement [10–14]. Two examples for commercially
available systems for fabric density measurement are
the CAMCount and Fabric Inspector systems [15] by
Setex Schermuly Textile Computer GmbH (Germany)
and the PSM-200 Sensor [16] developed by Automation
Partners Inc. (USA).
The problem of automatic visual weave detection for
woven fabrics is barely touched in literature and indus-
try. In fact, we are not aware of any commercial system
that is able to analyze fabric weaves and only few pub-
lications treat the topic. Within this scope, the weave
detection framework of Kang et al. [17] acquires a re-
flecting and a transmitting light image. Morphological
operators and basic image processing techniques are ap-
plied to these images to derive yarn trajectories and the
underlying weave. A very similar approach is presented
in [18] where images are processed by morphological
image operators to locate float-points. The information
is combined with pixel intensity analysis to differenti-
ate between weft- and warp-floats which finally allows
to derive the weave pattern. Huang et al. [19] propose
a method based on gray value scan-line integrals along
image rows and columns. Local minima and maxima in
the scan plots are located and the information is fed into
a decision tree classifier to conclude for weft/warp floats
and the weave pattern. Several other authors adopt the
principle of integral scans [18, 20, 21] but replace the
decision tree by fuzzy clustering to classify the output
of texture descriptors applied to detected float-points.
In [22], the authors model fabric images in frequency
Fig. 1 Illustration of the most common fabric weaves (1/2).Top left: plain weave (P1). Bottom: 4-1 Satin weave (S41), 4weft-floats followed by 1 warp-float. The pattern is shifted bytwo and repeated on the next weft.
and space domain by a convolution and an additive
model. Sophisticated frequency space analysis is ap-
plied to extract the basic weave tile. The binary weave
code and detailed evaluation results are not provided
though. A filtering based algorithm is introduced by
Lachkar et al. [23,24], who process the power spectrum
of the fabric image to segment single warps and wefts
and to derive float-points, but only plain weaves have
been investigated in their work. In [25], Wavelet sub-
band decomposition is used to extract texture features
of different weave patterns. A classifier is trained off-
line with those features and is used on-line to assign
a weave class to an unknown fabric. The most promis-
ing and versatile approach is discussed in [26]. Here,
Fourier spectra of known weaves are normalized and
learned from an off-line fabric database. The spectrum
of an unknown fabric image is analogously normalized
and matched to all off-line template spectra using a
Blind weave detection for woven fabrics 3
Fig. 2 Illustration of the most common fabric weaves (2/2).Top: 3-1 twill weave (T31), i.e. three weft-floats are followedby one warp-float. The pattern is shifted to the right by 1 andrepeated for the next weft. Bottom: 2-1 twill weave (T21), i.e.two weft-floats are followed by one warp-float. The pattern isshifted to the right by 1 and repeated for the next weft.
distance metric. The reference fabric with the most re-
sembling spectrum determines the unknown weave.
Our own implementations of the proposed methods
showed that the discussed approaches suffer from either
tight weft/warp alignment restrictions or are vulnerable
to natural yarn irregularities. Other algorithms are not
afflicted by these limitations but require considerable a
priori knowledge of potential fabric weaves in order to
perform well. Those are not blind (fully automatic) and
require an off-line learning phase.
To overcome the above mentioned shortcomings, this
paper presents a robust algorithmic framework for blind,
i.e. fully automatic weave detection in woven fabrics.
For this purpose, the novel concept of a grid map is in-
troduced. Within the map, specific fabric interest points
are structured according to a proximity relationship
scheme. The grid map is transformed into a yarn map,
which assigns interest points to single yarns within the
image. The fabric weave can be directly extracted from
the final yarn map. In order for the grid map to be
build and transformed, proximity vectors are found au-
tomatically and the distance between adjacent wefts
and warps within the unknown fabric image is calcu-
lated using Fourier analysis. Since the frequency anal-
ysis might return ambiguous results (especially for twill
and satin weaves), a feedback loop is introduced to it-
eratively find optimal frequency values. The framework
has built-in features for automatic and robust fabric ro-
tation and density measurement. We provide all source
codes and image data on the project website.
The paper is structured as follows. Section 2 out-
lines the framework and gives an overview of the process
chain. Section 3 guides the reader through algorithmic
details, beginning with the processing of the spectrum
and ending with the extraction of the final fabric weave
pattern. Section 4 introduces the evaluation dataset and
presents the detection results for weave recognition and
fabric density measurements. Before the work is con-
cluded in Section 6, we discuss the framework with re-
gards to strengths and weaknesses in Section 5.
2 Process chain overview
The following section is intended to give the reader
an overview of the proposed algorithmic framework for
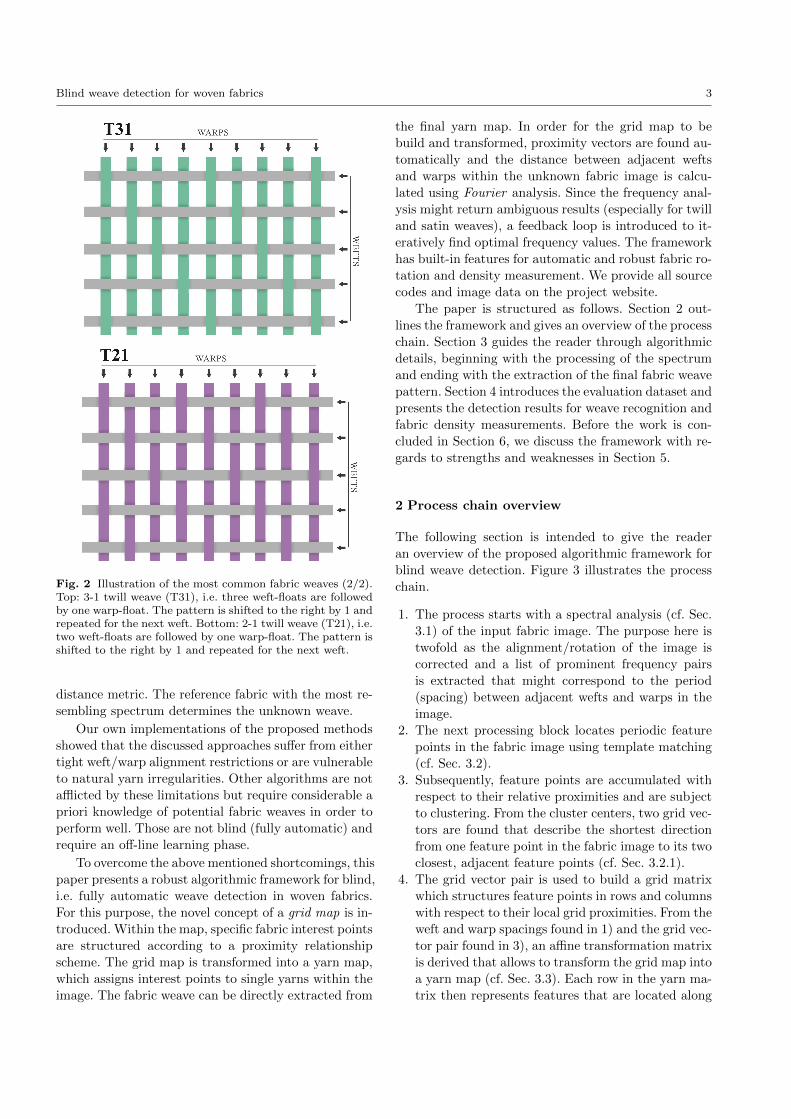
blind weave detection. Figure 3 illustrates the process
chain.
1. The process starts with a spectral analysis (cf. Sec.
3.1) of the input fabric image. The purpose here is
twofold as the alignment/rotation of the image is
corrected and a list of prominent frequency pairs
is extracted that might correspond to the period
(spacing) between adjacent wefts and warps in the
image.
2. The next processing block locates periodic feature
points in the fabric image using template matching
(cf. Sec. 3.2).
3. Subsequently, feature points are accumulated with
respect to their relative proximities and are subject
to clustering. From the cluster centers, two grid vec-
tors are found that describe the shortest direction
from one feature point in the fabric image to its two
closest, adjacent feature points (cf. Sec. 3.2.1).
4. The grid vector pair is used to build a grid matrix
which structures feature points in rows and columns
with respect to their local grid proximities. From the
weft and warp spacings found in 1) and the grid vec-
tor pair found in 3), an affine transformation matrix
is derived that allows to transform the grid map into
a yarn map (cf. Sec. 3.3). Each row in the yarn ma-
trix then represents features that are located along
4
Fig. 3 Block diagram of the proposed framework for blindweave detection in woven fabrics. Numbers on the processblocks refer to enumerations in Sec. 2.
a specific weft. Analogously, each column represents
features that are located along a specific warp.
5. The trajectories of single wefts and warps are sub-
sequently approximated by polynomials, allowing to
calculate the angles between wefts and warps in a
straight-forward way. If the results do not meet a
weft/warp orthogonality criterion, the current weft/warp
spacing pair as well as the corresponding yarn map
are considered as incorrect and become subject to
rejection. A new iteration with a different weft/warp
spacing pair is initiated and restarts at 2), cf. Sec. 3.4.
6. When all weft/warp spacing pairs have been an-
alyzed, the best result is selected and the weave
pattern is extracted from the winning yarn map.
Knowing the spatial resolution of the image acqui-
sition system, weft and warp densities can directly
be derived from the final weft/warp spacings (cf.
Sec. 3.4.1).
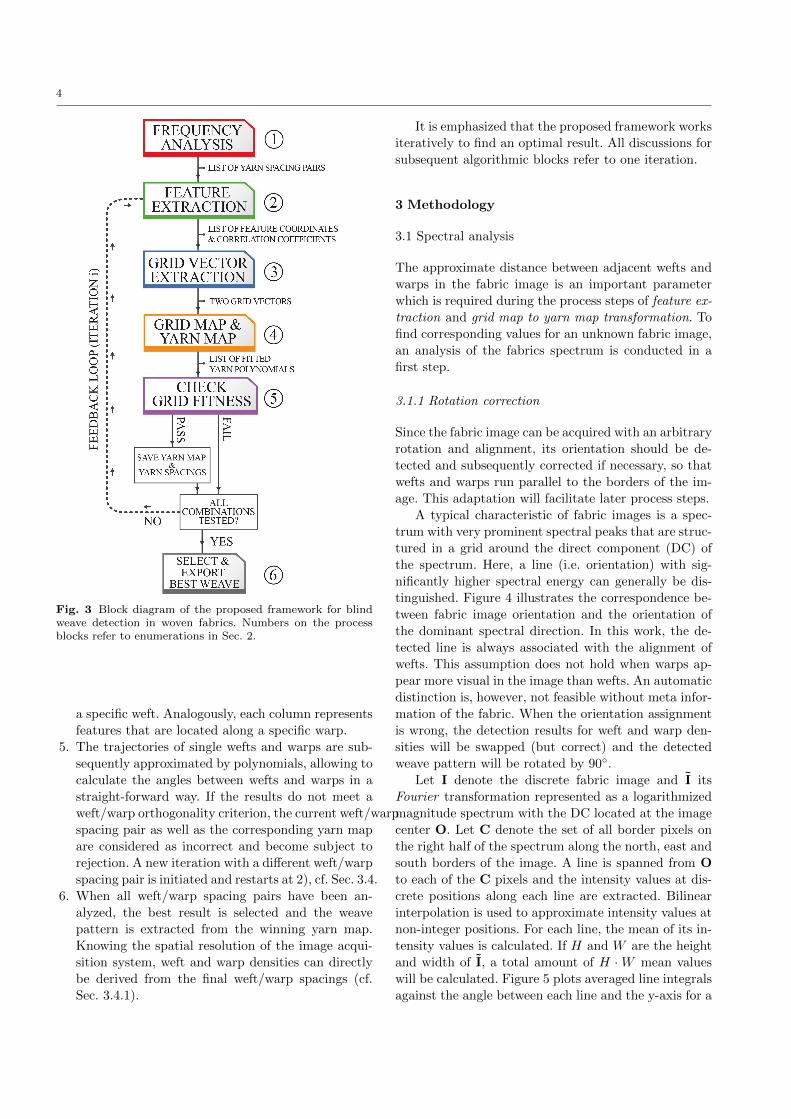
It is emphasized that the proposed framework works
iteratively to find an optimal result. All discussions for
subsequent algorithmic blocks refer to one iteration.
3 Methodology
3.1 Spectral analysis
The approximate distance between adjacent wefts and
warps in the fabric image is an important parameter
which is required during the process steps of feature ex-
traction and grid map to yarn map transformation. To
find corresponding values for an unknown fabric image,
an analysis of the fabrics spectrum is conducted in a
first step.
3.1.1 Rotation correction
Since the fabric image can be acquired with an arbitrary
rotation and alignment, its orientation should be de-
tected and subsequently corrected if necessary, so that
wefts and warps run parallel to the borders of the im-
age. This adaptation will facilitate later process steps.
A typical characteristic of fabric images is a spec-
trum with very prominent spectral peaks that are struc-
tured in a grid around the direct component (DC) of
the spectrum. Here, a line (i.e. orientation) with sig-
nificantly higher spectral energy can generally be dis-
tinguished. Figure 4 illustrates the correspondence be-
tween fabric image orientation and the orientation of
the dominant spectral direction. In this work, the de-
tected line is always associated with the alignment of
wefts. This assumption does not hold when warps ap-
pear more visual in the image than wefts. An automatic
distinction is, however, not feasible without meta infor-
mation of the fabric. When the orientation assignment
is wrong, the detection results for weft and warp den-
sities will be swapped (but correct) and the detected
weave pattern will be rotated by 90.
Let I denote the discrete fabric image and I its
Fourier transformation represented as a logarithmized
magnitude spectrum with the DC located at the image
center O. Let C denote the set of all border pixels on
the right half of the spectrum along the north, east and
south borders of the image. A line is spanned from O
to each of the C pixels and the intensity values at dis-
crete positions along each line are extracted. Bilinear
interpolation is used to approximate intensity values at
non-integer positions. For each line, the mean of its in-
tensity values is calculated. If H and W are the height
and width of I, a total amount of H ·W mean values
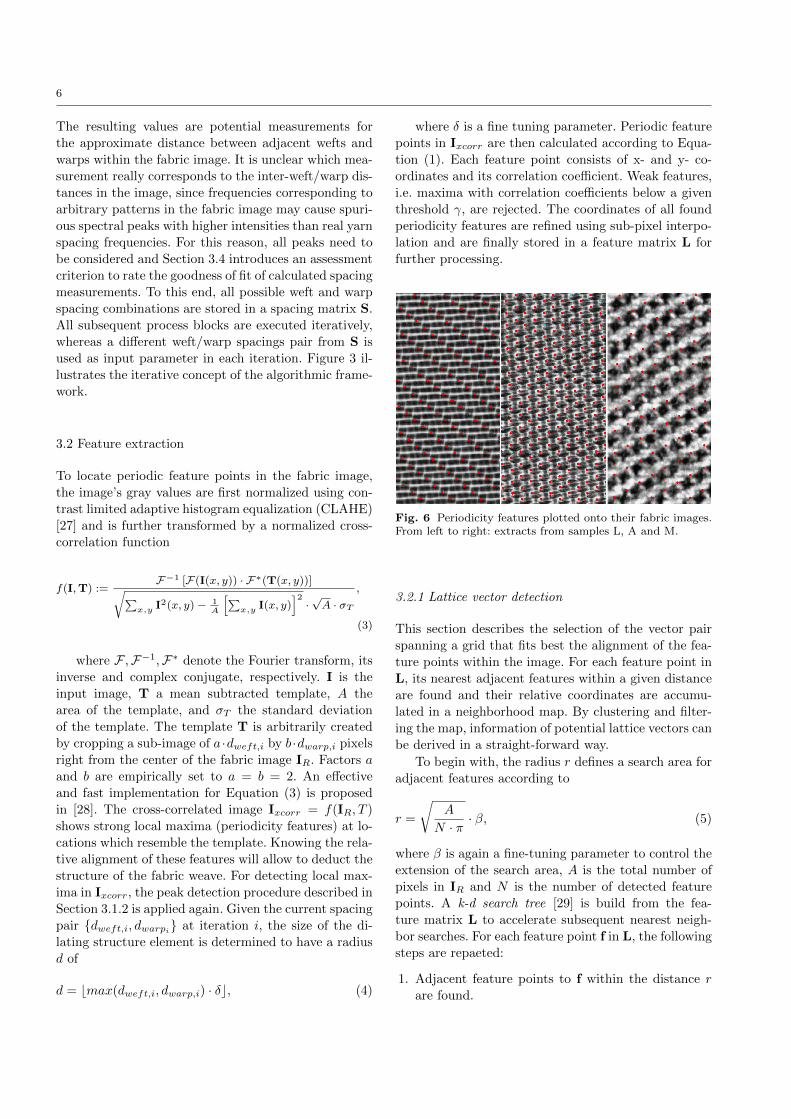
will be calculated. Figure 5 plots averaged line integrals
against the angle between each line and the y-axis for a
Blind weave detection for woven fabrics 5
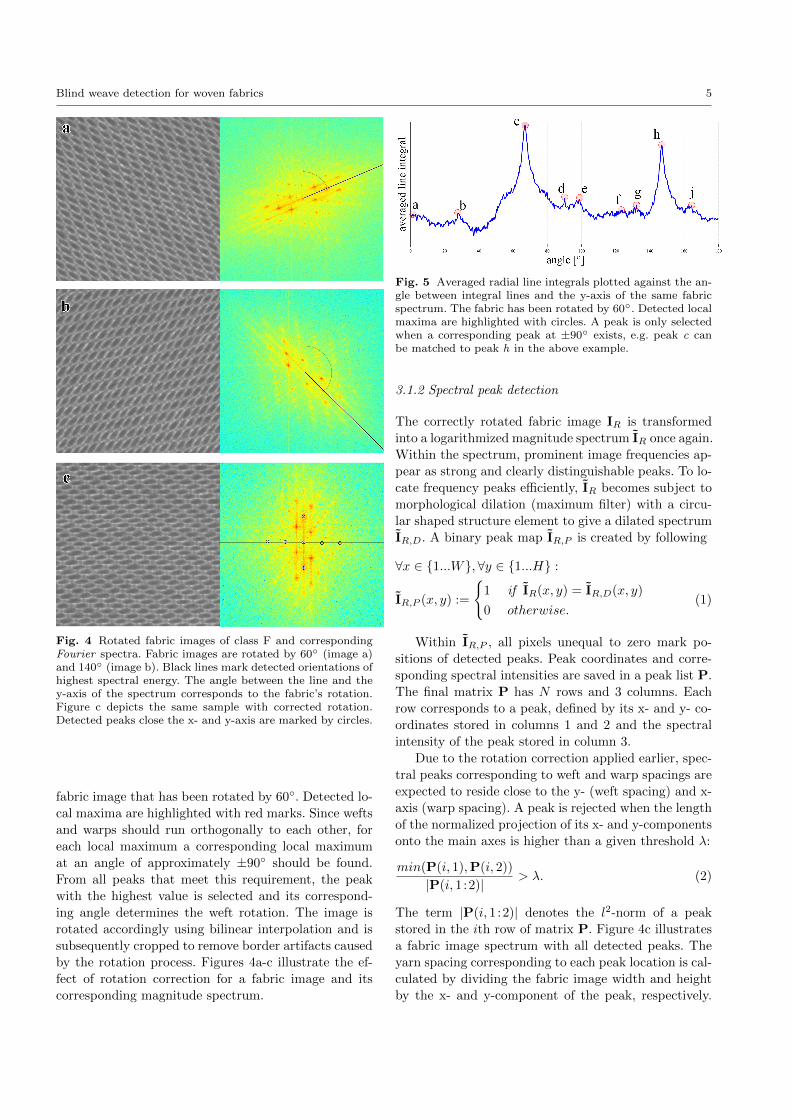
Fig. 4 Rotated fabric images of class F and correspondingFourier spectra. Fabric images are rotated by 60 (image a)and 140 (image b). Black lines mark detected orientations ofhighest spectral energy. The angle between the line and they-axis of the spectrum corresponds to the fabric’s rotation.Figure c depicts the same sample with corrected rotation.Detected peaks close the x- and y-axis are marked by circles.
fabric image that has been rotated by 60. Detected lo-
cal maxima are highlighted with red marks. Since wefts
and warps should run orthogonally to each other, for
each local maximum a corresponding local maximum
at an angle of approximately ±90 should be found.
From all peaks that meet this requirement, the peak
with the highest value is selected and its correspond-
ing angle determines the weft rotation. The image is
rotated accordingly using bilinear interpolation and is
subsequently cropped to remove border artifacts caused
by the rotation process. Figures 4a-c illustrate the ef-
fect of rotation correction for a fabric image and its
corresponding magnitude spectrum.
Fig. 5 Averaged radial line integrals plotted against the an-gle between integral lines and the y-axis of the same fabricspectrum. The fabric has been rotated by 60. Detected localmaxima are highlighted with circles. A peak is only selectedwhen a corresponding peak at ±90 exists, e.g. peak c canbe matched to peak h in the above example.
3.1.2 Spectral peak detection
The correctly rotated fabric image IR is transformed
into a logarithmized magnitude spectrum IR once again.
Within the spectrum, prominent image frequencies ap-
pear as strong and clearly distinguishable peaks. To lo-
cate frequency peaks efficiently, IR becomes subject to
morphological dilation (maximum filter) with a circu-
lar shaped structure element to give a dilated spectrum
IR,D. A binary peak map IR,P is created by following
∀x ∈ 1...W,∀y ∈ 1...H :
IR,P (x, y) :=
1 if IR(x, y) = IR,D(x, y)
0 otherwise.(1)
Within IR,P , all pixels unequal to zero mark po-
sitions of detected peaks. Peak coordinates and corre-
sponding spectral intensities are saved in a peak list P.
The final matrix P has N rows and 3 columns. Each
row corresponds to a peak, defined by its x- and y- co-
ordinates stored in columns 1 and 2 and the spectral
intensity of the peak stored in column 3.
Due to the rotation correction applied earlier, spec-
tral peaks corresponding to weft and warp spacings are
expected to reside close to the y- (weft spacing) and x-
axis (warp spacing). A peak is rejected when the length
of the normalized projection of its x- and y-components
onto the main axes is higher than a given threshold λ:
min(P(i, 1),P(i, 2))
|P(i, 1:2)|> λ. (2)
The term |P(i, 1:2)| denotes the l2-norm of a peak
stored in the ith row of matrix P. Figure 4c illustrates
a fabric image spectrum with all detected peaks. The
yarn spacing corresponding to each peak location is cal-
culated by dividing the fabric image width and height
by the x- and y-component of the peak, respectively.
6
The resulting values are potential measurements for
the approximate distance between adjacent wefts and
warps within the fabric image. It is unclear which mea-
surement really corresponds to the inter-weft/warp dis-
tances in the image, since frequencies corresponding to
arbitrary patterns in the fabric image may cause spuri-
ous spectral peaks with higher intensities than real yarn
spacing frequencies. For this reason, all peaks need to
be considered and Section 3.4 introduces an assessment
criterion to rate the goodness of fit of calculated spacing
measurements. To this end, all possible weft and warp
spacing combinations are stored in a spacing matrix S.
All subsequent process blocks are executed iteratively,
whereas a different weft/warp spacings pair from S is
used as input parameter in each iteration. Figure 3 il-
lustrates the iterative concept of the algorithmic frame-
work.
3.2 Feature extraction
To locate periodic feature points in the fabric image,
the image’s gray values are first normalized using con-
trast limited adaptive histogram equalization (CLAHE)
[27] and is further transformed by a normalized cross-
correlation function
f(I,T) :=F−1 [F(I(x, y)) · F∗(T(x, y))]√∑
x,y I2(x, y)− 1
A
[∑x,y I(x, y)
]2·√A · σT
,
(3)
where F ,F−1,F∗ denote the Fourier transform, its
inverse and complex conjugate, respectively. I is the
input image, T a mean subtracted template, A the
area of the template, and σT the standard deviation
of the template. The template T is arbitrarily created
by cropping a sub-image of a ·dweft,i by b ·dwarp,i pixels
right from the center of the fabric image IR. Factors a
and b are empirically set to a = b = 2. An effective
and fast implementation for Equation (3) is proposed
in [28]. The cross-correlated image Ixcorr = f(IR, T )
shows strong local maxima (periodicity features) at lo-
cations which resemble the template. Knowing the rela-
tive alignment of these features will allow to deduct the
structure of the fabric weave. For detecting local max-
ima in Ixcorr, the peak detection procedure described in
Section 3.1.2 is applied again. Given the current spacing
pair dweft,i, dwarpi at iteration i, the size of the di-
lating structure element is determined to have a radius
d of
d = bmax(dweft,i, dwarp,i) · δc, (4)
where δ is a fine tuning parameter. Periodic feature
points in Ixcorr are then calculated according to Equa-
tion (1). Each feature point consists of x- and y- co-
ordinates and its correlation coefficient. Weak features,
i.e. maxima with correlation coefficients below a given
threshold γ, are rejected. The coordinates of all found
periodicity features are refined using sub-pixel interpo-
lation and are finally stored in a feature matrix L for
further processing.
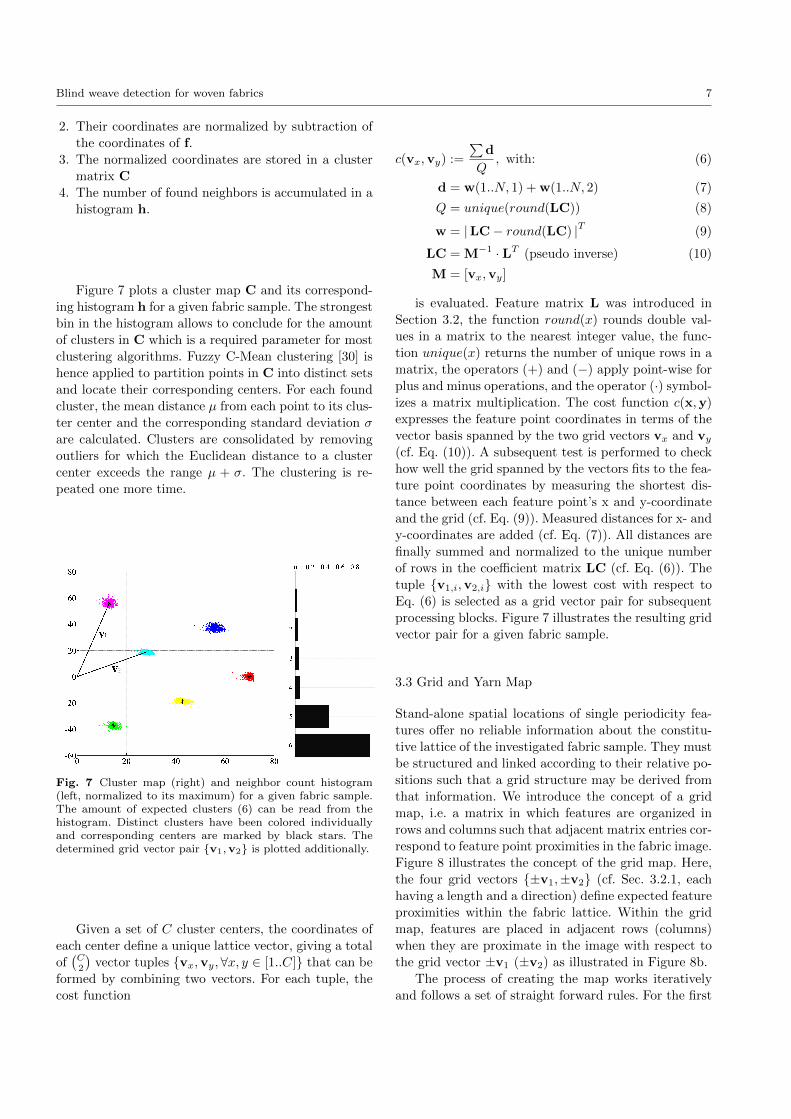
Fig. 6 Periodicity features plotted onto their fabric images.From left to right: extracts from samples L, A and M.
3.2.1 Lattice vector detection
This section describes the selection of the vector pair
spanning a grid that fits best the alignment of the fea-
ture points within the image. For each feature point in
L, its nearest adjacent features within a given distance
are found and their relative coordinates are accumu-
lated in a neighborhood map. By clustering and filter-
ing the map, information of potential lattice vectors can
be derived in a straight-forward way.
To begin with, the radius r defines a search area for
adjacent features according to
r =
√A
N · π· β, (5)
where β is again a fine-tuning parameter to control the
extension of the search area, A is the total number of
pixels in IR and N is the number of detected feature
points. A k-d search tree [29] is build from the fea-
ture matrix L to accelerate subsequent nearest neigh-
bor searches. For each feature point f in L, the following
steps are repaeted:
1. Adjacent feature points to f within the distance r
are found.
Blind weave detection for woven fabrics 7
2. Their coordinates are normalized by subtraction of
the coordinates of f.
3. The normalized coordinates are stored in a cluster
matrix C
4. The number of found neighbors is accumulated in a
histogram h.
Figure 7 plots a cluster map C and its correspond-
ing histogram h for a given fabric sample. The strongest
bin in the histogram allows to conclude for the amount
of clusters in C which is a required parameter for most
clustering algorithms. Fuzzy C-Mean clustering [30] is
hence applied to partition points in C into distinct sets
and locate their corresponding centers. For each found
cluster, the mean distance µ from each point to its clus-
ter center and the corresponding standard deviation σ
are calculated. Clusters are consolidated by removing
outliers for which the Euclidean distance to a cluster
center exceeds the range µ + σ. The clustering is re-
peated one more time.
Fig. 7 Cluster map (right) and neighbor count histogram(left, normalized to its maximum) for a given fabric sample.The amount of expected clusters (6) can be read from thehistogram. Distinct clusters have been colored individuallyand corresponding centers are marked by black stars. Thedetermined grid vector pair v1,v2 is plotted additionally.
Given a set of C cluster centers, the coordinates of
each center define a unique lattice vector, giving a total
of(C2
)vector tuples vx,vy,∀x, y ∈ [1..C] that can be
formed by combining two vectors. For each tuple, the
cost function
c(vx,vy) :=
∑d
Q, with: (6)
d = w(1..N, 1) + w(1..N, 2) (7)
Q = unique(round(LC)) (8)
w = |LC− round(LC) |T (9)
LC = M−1 · LT (pseudo inverse) (10)
M = [vx,vy]
is evaluated. Feature matrix L was introduced in
Section 3.2, the function round(x) rounds double val-
ues in a matrix to the nearest integer value, the func-
tion unique(x) returns the number of unique rows in a
matrix, the operators (+) and (−) apply point-wise for
plus and minus operations, and the operator (·) symbol-
izes a matrix multiplication. The cost function c(x,y)
expresses the feature point coordinates in terms of the
vector basis spanned by the two grid vectors vx and vy
(cf. Eq. (10)). A subsequent test is performed to check
how well the grid spanned by the vectors fits to the fea-
ture point coordinates by measuring the shortest dis-
tance between each feature point’s x and y-coordinate
and the grid (cf. Eq. (9)). Measured distances for x- and
y-coordinates are added (cf. Eq. (7)). All distances are
finally summed and normalized to the unique number
of rows in the coefficient matrix LC (cf. Eq. (6)). The
tuple v1,i,v2,i with the lowest cost with respect to
Eq. (6) is selected as a grid vector pair for subsequent
processing blocks. Figure 7 illustrates the resulting grid
vector pair for a given fabric sample.
3.3 Grid and Yarn Map
Stand-alone spatial locations of single periodicity fea-
tures offer no reliable information about the constitu-
tive lattice of the investigated fabric sample. They must
be structured and linked according to their relative po-
sitions such that a grid structure may be derived from
that information. We introduce the concept of a grid
map, i.e. a matrix in which features are organized in
rows and columns such that adjacent matrix entries cor-
respond to feature point proximities in the fabric image.
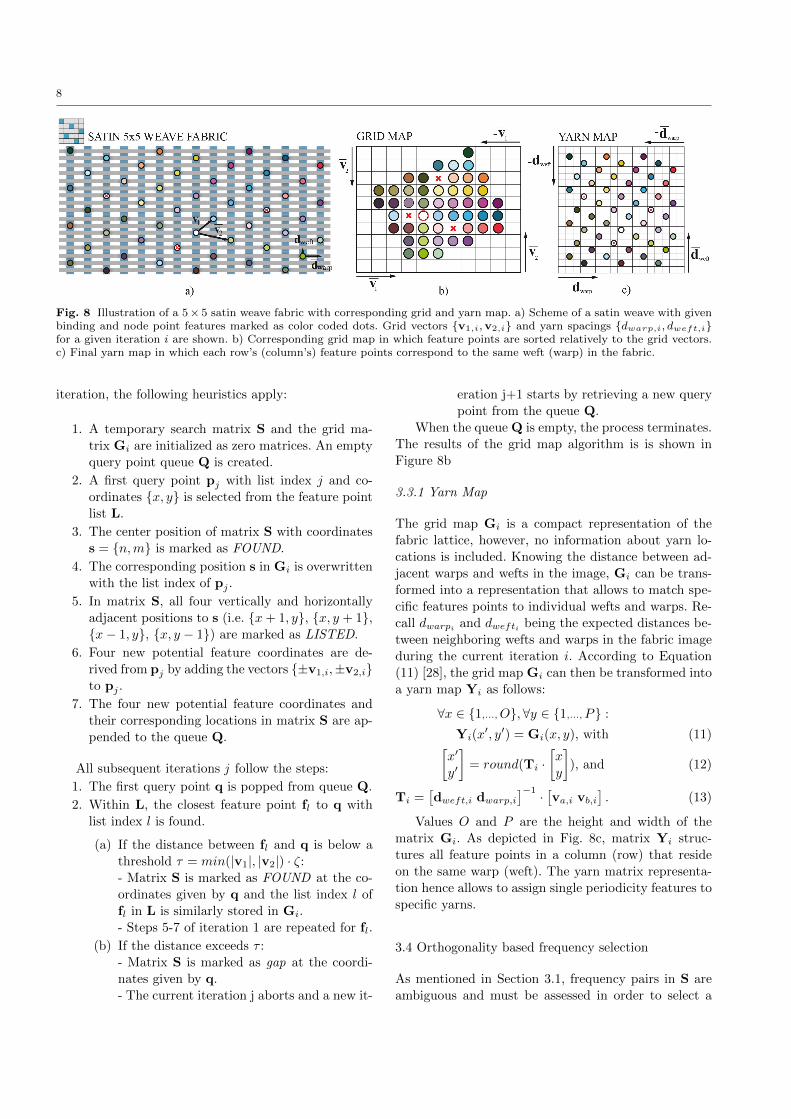
Figure 8 illustrates the concept of the grid map. Here,
the four grid vectors ±v1,±v2 (cf. Sec. 3.2.1, each
having a length and a direction) define expected feature
proximities within the fabric lattice. Within the grid
map, features are placed in adjacent rows (columns)
when they are proximate in the image with respect to
the grid vector ±v1 (±v2) as illustrated in Figure 8b.
The process of creating the map works iteratively
and follows a set of straight forward rules. For the first
8
Fig. 8 Illustration of a 5× 5 satin weave fabric with corresponding grid and yarn map. a) Scheme of a satin weave with givenbinding and node point features marked as color coded dots. Grid vectors v1,i,v2,i and yarn spacings dwarp,i, dweft,ifor a given iteration i are shown. b) Corresponding grid map in which feature points are sorted relatively to the grid vectors.c) Final yarn map in which each row’s (column’s) feature points correspond to the same weft (warp) in the fabric.
iteration, the following heuristics apply:
1. A temporary search matrix S and the grid ma-
trix Gi are initialized as zero matrices. An empty
query point queue Q is created.
2. A first query point pj with list index j and co-
ordinates x, y is selected from the feature point
list L.
3. The center position of matrix S with coordinates
s = n,m is marked as FOUND.
4. The corresponding position s in Gi is overwritten
with the list index of pj .
5. In matrix S, all four vertically and horizontally
adjacent positions to s (i.e. x+ 1, y, x, y + 1,x− 1, y, x, y − 1) are marked as LISTED.
6. Four new potential feature coordinates are de-
rived from pj by adding the vectors ±v1,i,±v2,ito pj .
7. The four new potential feature coordinates and
their corresponding locations in matrix S are ap-
pended to the queue Q.
All subsequent iterations j follow the steps:
1. The first query point q is popped from queue Q.
2. Within L, the closest feature point fl to q with
list index l is found.
(a) If the distance between fl and q is below a
threshold τ = min(|v1|, |v2|) · ζ:
- Matrix S is marked as FOUND at the co-
ordinates given by q and the list index l of
fl in L is similarly stored in Gi.
- Steps 5-7 of iteration 1 are repeated for fl.
(b) If the distance exceeds τ :
- Matrix S is marked as gap at the coordi-
nates given by q.
- The current iteration j aborts and a new it-
eration j+1 starts by retrieving a new query
point from the queue Q.
When the queue Q is empty, the process terminates.
The results of the grid map algorithm is is shown in
Figure 8b
3.3.1 Yarn Map
The grid map Gi is a compact representation of the
fabric lattice, however, no information about yarn lo-
cations is included. Knowing the distance between ad-
jacent warps and wefts in the image, Gi can be trans-
formed into a representation that allows to match spe-
cific features points to individual wefts and warps. Re-
call dwarpi and dwefti being the expected distances be-
tween neighboring wefts and warps in the fabric image
during the current iteration i. According to Equation
(11) [28], the grid map Gi can then be transformed into
a yarn map Yi as follows:
∀x ∈ 1,...,O,∀y ∈ 1,...,P :
Yi(x′, y′) = Gi(x, y), with (11)[
x′
y′
]= round(Ti ·
[x
y
]), and (12)
Ti =[dweft,i dwarp,i
]−1 · [va,i vb,i
]. (13)
Values O and P are the height and width of the
matrix Gi. As depicted in Fig. 8c, matrix Yi struc-
tures all feature points in a column (row) that reside
on the same warp (weft). The yarn matrix representa-
tion hence allows to assign single periodicity features to
specific yarns.
3.4 Orthogonality based frequency selection
As mentioned in Section 3.1, frequency pairs in S are
ambiguous and must be assessed in order to select a
Blind weave detection for woven fabrics 9
warp/weft spacing pair that suits the density of the fab-
ric image. This section uses the measurement of orthog-
onality between wefts and warps as exclusion criterion
for non-valid frequency combinations. Valid frequency
combinations are subsequently ranked according to an
assessment criterion and the best pair is chosen accord-
ingly. It is finally shown that the yarn map correspond-
ing to the determined frequency pair provides direct
information about the weave pattern of the fabric im-
age.
Wefts and warps within fabric images should run
orthogonal to each other. When the trajectories of wefts
and warps contained in the yarn matrix do not meet
this orthogonality criterion, the frequency pair that has
been used to construct the transformation matrix Ti,
cf. Eq. (11), can not correspond to a valid weft/warp
spacings combination.
To measure the orthogonality of wefts and warps,
the unique structure of the yarn map is analyzed. For
the current iteration i, single yarns of the fabric are
represented by periodicity features structured in rows
and columns in the yarn map Yi. A first order polyno-
mial is fitted to the feature xy-coordinates of each row
and column in Yi in order to model the trajectory of
single wefts/warps. Figure 9 plots fitted yarn polyno-
mials onto corresponding input images. Given N fitted
weft polynomials pn(x) and M fitted warp polynomi-
als pm(x), an orthogonality assessment criterion Ωi is
calculated according to
pm(x) = αmx+ c1, pn(x) = βnx+ c2,
Ωi =1
NM
N∑n=1
M∑m=1
π
2− arctan
(∣∣∣∣ αm − βn1 + αmβn
∣∣∣∣) . (14)
Equation 14 basically calculates the average angle
between approximated weft and warp trajectories in
the image. If the value Ωi exceeds a given threshold
κ, the current yarn spacing pair dweft,i, dwarp,i and
its corresponding yarn map Yi are considered as non-
fitting and are discarded. From all pairs that pass the
orthogonality test, the best pair is selected by evaluat-
ing
argmaxig(dweft,i) · g(dwarp,i), (15)
where the function g(x) returns the Fourier coefficients
of the spectral peak corresponding to the frequency x.
Therefore, the final yarn spacing pair is selected accord-
ing to the maximum product of spectral intensities.
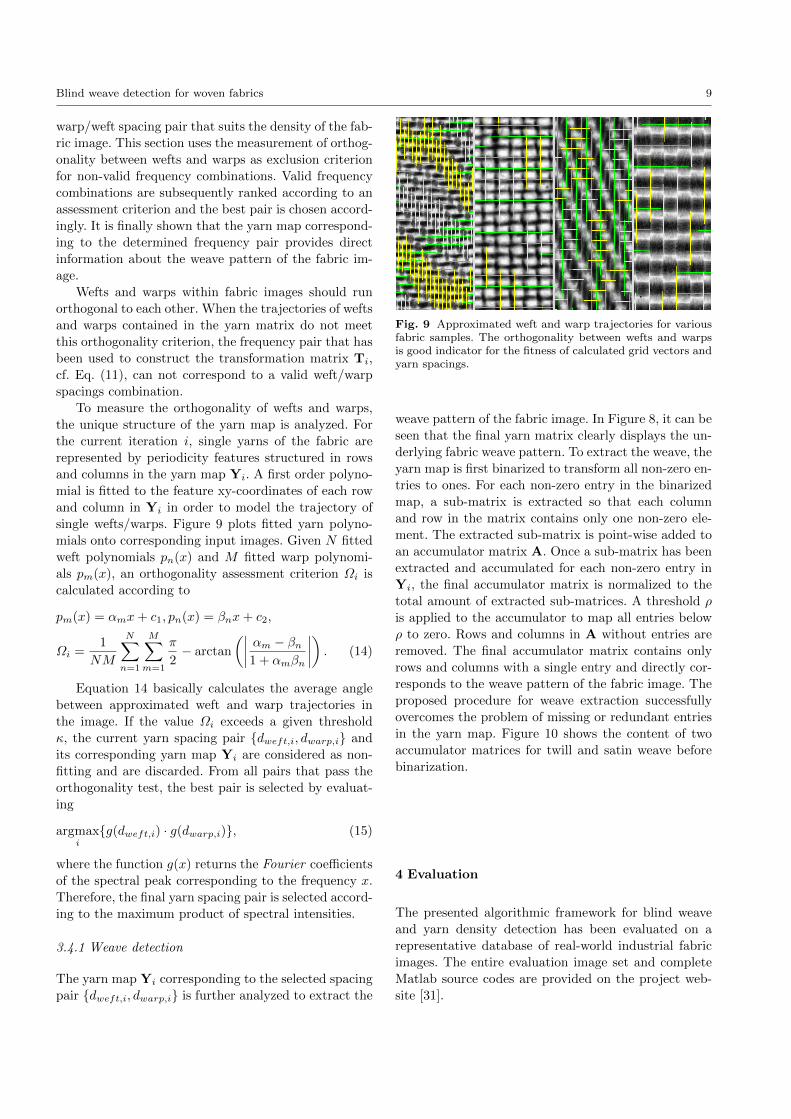
3.4.1 Weave detection
The yarn map Yi corresponding to the selected spacing
pair dweft,i, dwarp,i is further analyzed to extract the
Fig. 9 Approximated weft and warp trajectories for variousfabric samples. The orthogonality between wefts and warpsis good indicator for the fitness of calculated grid vectors andyarn spacings.
weave pattern of the fabric image. In Figure 8, it can be
seen that the final yarn matrix clearly displays the un-
derlying fabric weave pattern. To extract the weave, the
yarn map is first binarized to transform all non-zero en-
tries to ones. For each non-zero entry in the binarized
map, a sub-matrix is extracted so that each column
and row in the matrix contains only one non-zero ele-
ment. The extracted sub-matrix is point-wise added to
an accumulator matrix A. Once a sub-matrix has been
extracted and accumulated for each non-zero entry in
Yi, the final accumulator matrix is normalized to the
total amount of extracted sub-matrices. A threshold ρ
is applied to the accumulator to map all entries below
ρ to zero. Rows and columns in A without entries are
removed. The final accumulator matrix contains only
rows and columns with a single entry and directly cor-
responds to the weave pattern of the fabric image. The
proposed procedure for weave extraction successfully
overcomes the problem of missing or redundant entries
in the yarn map. Figure 10 shows the content of two
accumulator matrices for twill and satin weave before
binarization.
4 Evaluation
The presented algorithmic framework for blind weave
and yarn density detection has been evaluated on a
representative database of real-world industrial fabric
images. The entire evaluation image set and complete
Matlab source codes are provided on the project web-
site [31].
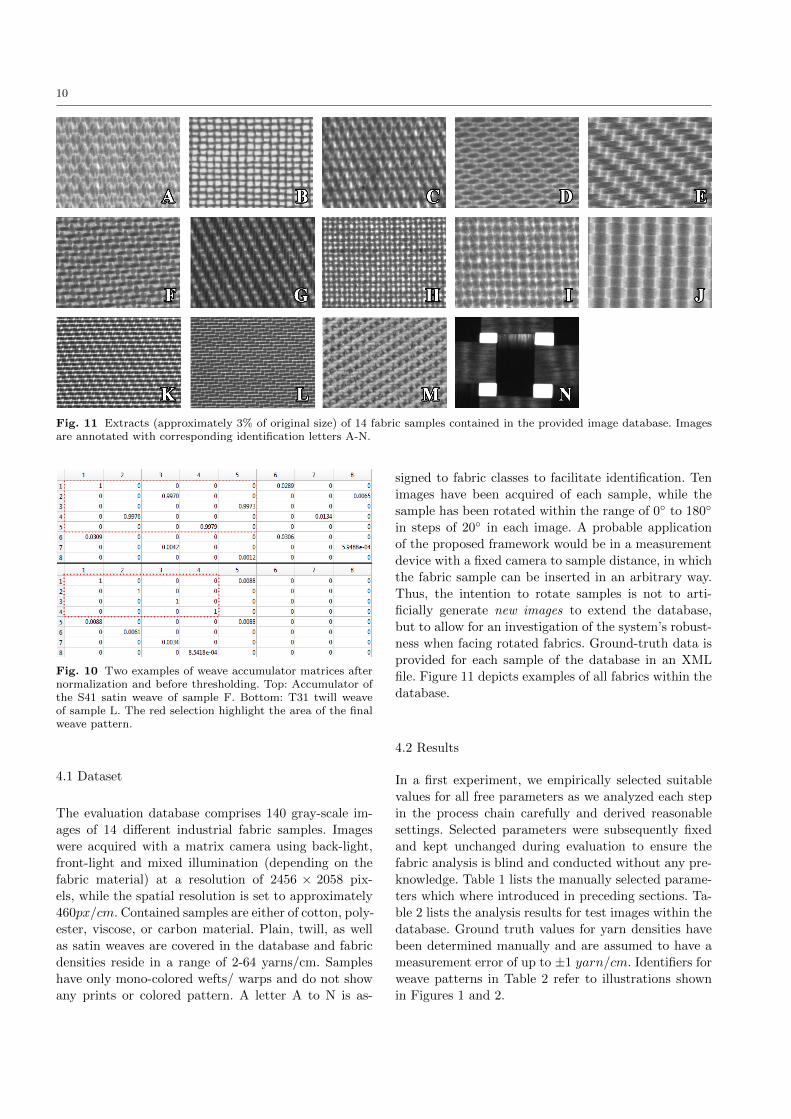
10
Fig. 11 Extracts (approximately 3% of original size) of 14 fabric samples contained in the provided image database. Imagesare annotated with corresponding identification letters A-N.
Fig. 10 Two examples of weave accumulator matrices afternormalization and before thresholding. Top: Accumulator ofthe S41 satin weave of sample F. Bottom: T31 twill weaveof sample L. The red selection highlight the area of the finalweave pattern.
4.1 Dataset
The evaluation database comprises 140 gray-scale im-
ages of 14 different industrial fabric samples. Images
were acquired with a matrix camera using back-light,
front-light and mixed illumination (depending on the
fabric material) at a resolution of 2456 × 2058 pix-
els, while the spatial resolution is set to approximately
460px/cm. Contained samples are either of cotton, poly-
ester, viscose, or carbon material. Plain, twill, as well
as satin weaves are covered in the database and fabric
densities reside in a range of 2-64 yarns/cm. Samples
have only mono-colored wefts/ warps and do not show
any prints or colored pattern. A letter A to N is as-
signed to fabric classes to facilitate identification. Ten
images have been acquired of each sample, while the
sample has been rotated within the range of 0 to 180
in steps of 20 in each image. A probable application
of the proposed framework would be in a measurement
device with a fixed camera to sample distance, in which
the fabric sample can be inserted in an arbitrary way.
Thus, the intention to rotate samples is not to arti-
ficially generate new images to extend the database,
but to allow for an investigation of the system’s robust-
ness when facing rotated fabrics. Ground-truth data is
provided for each sample of the database in an XML
file. Figure 11 depicts examples of all fabrics within the
database.
4.2 Results
In a first experiment, we empirically selected suitable
values for all free parameters as we analyzed each step
in the process chain carefully and derived reasonable
settings. Selected parameters were subsequently fixed
and kept unchanged during evaluation to ensure the
fabric analysis is blind and conducted without any pre-
knowledge. Table 1 lists the manually selected parame-
ters which where introduced in preceding sections. Ta-
ble 2 lists the analysis results for test images within the
database. Ground truth values for yarn densities have
been determined manually and are assumed to have a
measurement error of up to ±1 yarn/cm. Identifiers for
weave patterns in Table 2 refer to illustrations shown
in Figures 1 and 2.
Blind weave detection for woven fabrics 11
With reference to the evaluation results presented
in Table 2, the averaged absolute measurement errors
for weft and warp densities differ by a minimum of
0.11 yarns/cm and a maximum of 0.82 yarns/cm from
the ground truth data. All values are below the assumed
ground truth measurement error of ±1 yarn/cm. A lim-
itation of the proposed approach can be seen in the
experiments conducted on images of sample K, where
the averaged ground truth deviation for wefts raises to
28.6 yarns/cm. This inaccurate result is caused by the
high weft density of 64 yarns/cm for images of sample
K. Single wefts in class K are resolved by only 7 pix-
els per yarn which causes the measurement system to
struggle. A higher spatial resolution (by shortening the
distance between camera lens and fabric sample for ex-
ample) of the image acquisition system will overcome
this problem. The overall accuracy for weave detection
in this experiment is 97%, i.e. 136 of 140 fabric images
in the dataset have been correctly classified, 3 of the
misclassified images belong to sample K.
Parameter Discussed in Type Valueλ Sec. 3.1.2 threshold 0.13γ Sec. 3.2 threshold 0.50δ Sec. 3.2 tuner 0.80β Sec. 3.2.1 tuner 2.80ζ Sec. 3.3 tuner 0.40κ Sec. 3.4 threshold 0.13ρ Sec. 3.4.1 threshold 0.90
Table 1 Fixed settings for all crucial parameters used duringevaluation of the proposed algorithmic framework for blindweave detection.
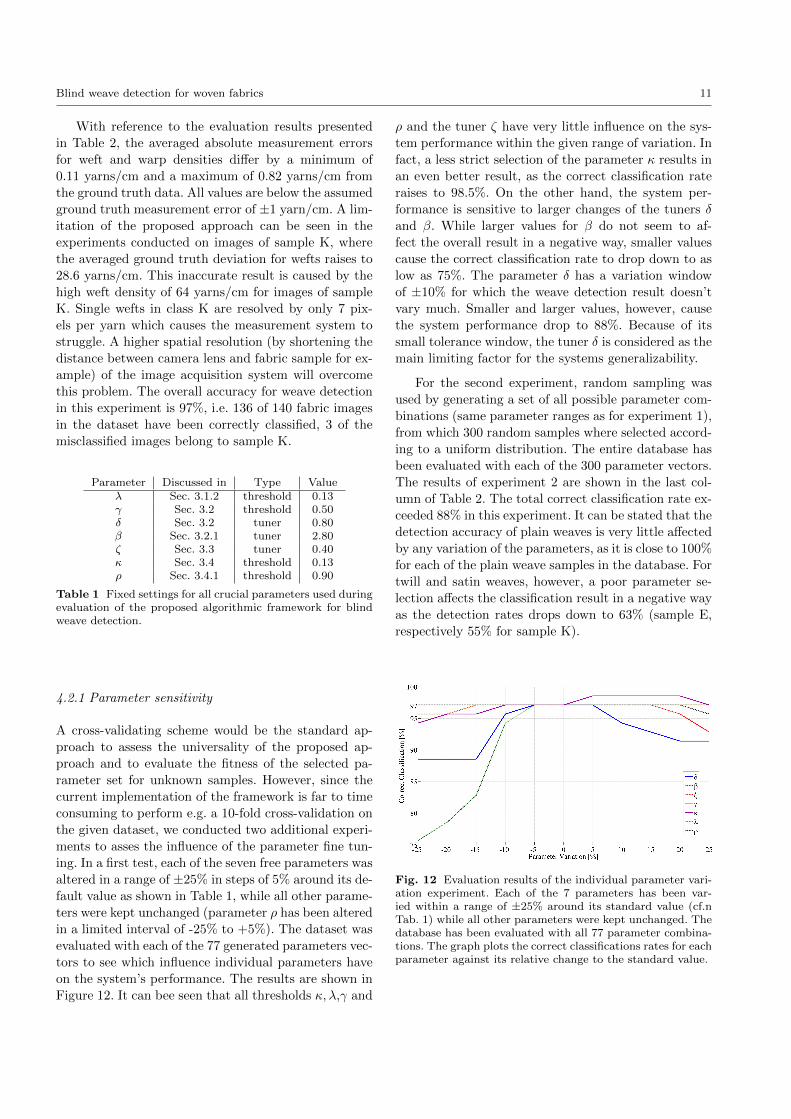
4.2.1 Parameter sensitivity
A cross-validating scheme would be the standard ap-
proach to assess the universality of the proposed ap-
proach and to evaluate the fitness of the selected pa-
rameter set for unknown samples. However, since the
current implementation of the framework is far to time
consuming to perform e.g. a 10-fold cross-validation on
the given dataset, we conducted two additional experi-
ments to asses the influence of the parameter fine tun-
ing. In a first test, each of the seven free parameters was
altered in a range of ±25% in steps of 5% around its de-
fault value as shown in Table 1, while all other parame-
ters were kept unchanged (parameter ρ has been altered
in a limited interval of -25% to +5%). The dataset was
evaluated with each of the 77 generated parameters vec-
tors to see which influence individual parameters have
on the system’s performance. The results are shown in
Figure 12. It can bee seen that all thresholds κ, λ,γ and
ρ and the tuner ζ have very little influence on the sys-
tem performance within the given range of variation. In
fact, a less strict selection of the parameter κ results in
an even better result, as the correct classification rate
raises to 98.5%. On the other hand, the system per-
formance is sensitive to larger changes of the tuners δ
and β. While larger values for β do not seem to af-
fect the overall result in a negative way, smaller values
cause the correct classification rate to drop down to as
low as 75%. The parameter δ has a variation window
of ±10% for which the weave detection result doesn’t
vary much. Smaller and larger values, however, cause
the system performance drop to 88%. Because of its
small tolerance window, the tuner δ is considered as the
main limiting factor for the systems generalizability.
For the second experiment, random sampling was
used by generating a set of all possible parameter com-
binations (same parameter ranges as for experiment 1),
from which 300 random samples where selected accord-
ing to a uniform distribution. The entire database has
been evaluated with each of the 300 parameter vectors.
The results of experiment 2 are shown in the last col-
umn of Table 2. The total correct classification rate ex-
ceeded 88% in this experiment. It can be stated that the
detection accuracy of plain weaves is very little affected
by any variation of the parameters, as it is close to 100%
for each of the plain weave samples in the database. For
twill and satin weaves, however, a poor parameter se-
lection affects the classification result in a negative way
as the detection rates drops down to 63% (sample E,
respectively 55% for sample K).
Fig. 12 Evaluation results of the individual parameter vari-ation experiment. Each of the 7 parameters has been var-ied within a range of ±25% around its standard value (cf.nTab. 1) while all other parameters were kept unchanged. Thedatabase has been evaluated with all 77 parameter combina-tions. The graph plots the correct classifications rates for eachparameter against its relative change to the standard value.
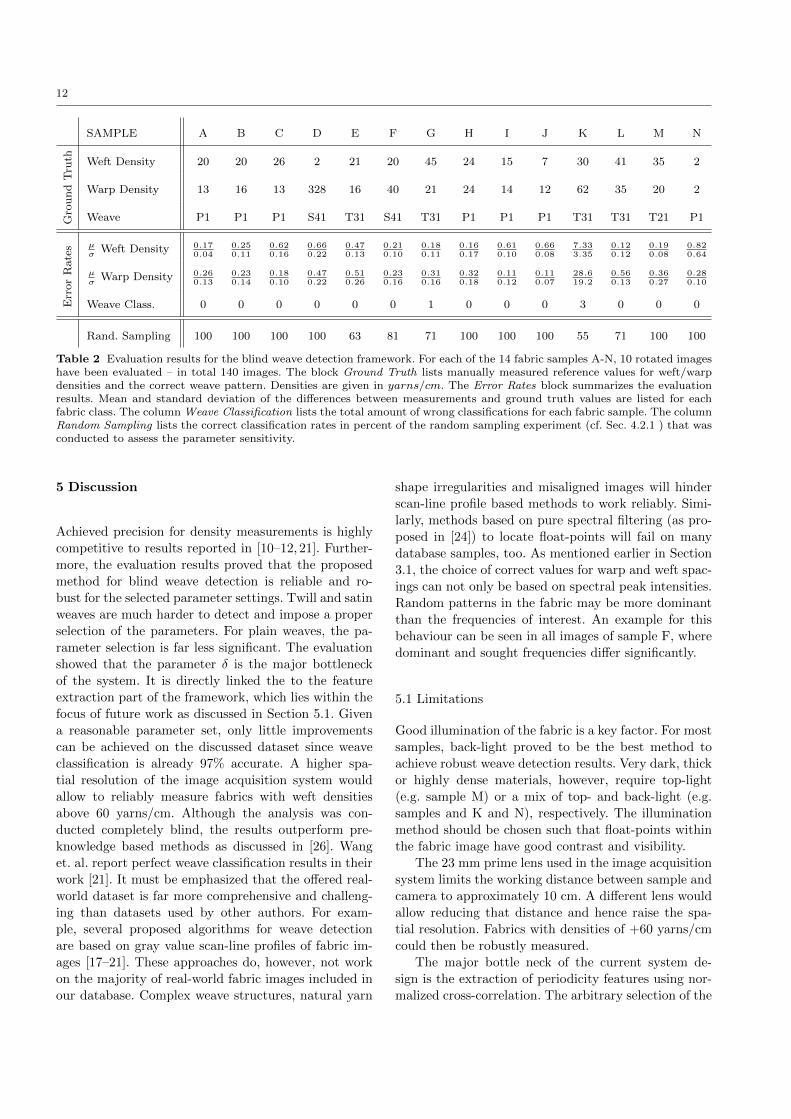
12
SAMPLE A B C D E F G H I J K L M N
Gro
un
dT
ruth Weft Density 20 20 26 2 21 20 45 24 15 7 30 41 35 2
Warp Density 13 16 13 328 16 40 21 24 14 12 62 35 20 2
Weave P1 P1 P1 S41 T31 S41 T31 P1 P1 P1 T31 T31 T21 P1
Err
or
Rate
s µσ
Weft Density 0.170.04
0.250.11
0.620.16
0.660.22
0.470.13
0.210.10
0.180.11
0.160.17
0.610.10
0.660.08
7.333.35
0.120.12
0.190.08
0.820.64
µσ
Warp Density 0.260.13
0.230.14
0.180.10
0.470.22
0.510.26
0.230.16
0.310.16
0.320.18
0.110.12
0.110.07
28.619.2
0.560.13
0.360.27
0.280.10
Weave Class. 0 0 0 0 0 0 1 0 0 0 3 0 0 0
Rand. Sampling 100 100 100 100 63 81 71 100 100 100 55 71 100 100
Table 2 Evaluation results for the blind weave detection framework. For each of the 14 fabric samples A-N, 10 rotated imageshave been evaluated – in total 140 images. The block Ground Truth lists manually measured reference values for weft/warpdensities and the correct weave pattern. Densities are given in yarns/cm. The Error Rates block summarizes the evaluationresults. Mean and standard deviation of the differences between measurements and ground truth values are listed for eachfabric class. The column Weave Classification lists the total amount of wrong classifications for each fabric sample. The columnRandom Sampling lists the correct classification rates in percent of the random sampling experiment (cf. Sec. 4.2.1 ) that wasconducted to assess the parameter sensitivity.
5 Discussion
Achieved precision for density measurements is highly
competitive to results reported in [10–12, 21]. Further-
more, the evaluation results proved that the proposed
method for blind weave detection is reliable and ro-
bust for the selected parameter settings. Twill and satin
weaves are much harder to detect and impose a proper
selection of the parameters. For plain weaves, the pa-
rameter selection is far less significant. The evaluation
showed that the parameter δ is the major bottleneck
of the system. It is directly linked the to the feature
extraction part of the framework, which lies within the
focus of future work as discussed in Section 5.1. Given
a reasonable parameter set, only little improvements
can be achieved on the discussed dataset since weave
classification is already 97% accurate. A higher spa-
tial resolution of the image acquisition system would
allow to reliably measure fabrics with weft densities
above 60 yarns/cm. Although the analysis was con-
ducted completely blind, the results outperform pre-
knowledge based methods as discussed in [26]. Wang
et. al. report perfect weave classification results in their
work [21]. It must be emphasized that the offered real-
world dataset is far more comprehensive and challeng-
ing than datasets used by other authors. For exam-
ple, several proposed algorithms for weave detection
are based on gray value scan-line profiles of fabric im-
ages [17–21]. These approaches do, however, not work
on the majority of real-world fabric images included in
our database. Complex weave structures, natural yarn
shape irregularities and misaligned images will hinder
scan-line profile based methods to work reliably. Simi-
larly, methods based on pure spectral filtering (as pro-
posed in [24]) to locate float-points will fail on many
database samples, too. As mentioned earlier in Section
3.1, the choice of correct values for warp and weft spac-
ings can not only be based on spectral peak intensities.
Random patterns in the fabric may be more dominant
than the frequencies of interest. An example for this
behaviour can be seen in all images of sample F, where
dominant and sought frequencies differ significantly.
5.1 Limitations
Good illumination of the fabric is a key factor. For most
samples, back-light proved to be the best method to
achieve robust weave detection results. Very dark, thick
or highly dense materials, however, require top-light
(e.g. sample M) or a mix of top- and back-light (e.g.
samples and K and N), respectively. The illumination
method should be chosen such that float-points within
the fabric image have good contrast and visibility.
The 23 mm prime lens used in the image acquisition
system limits the working distance between sample and
camera to approximately 10 cm. A different lens would
allow reducing that distance and hence raise the spa-
tial resolution. Fabrics with densities of +60 yarns/cm
could then be robustly measured.
The major bottle neck of the current system de-
sign is the extraction of periodicity features using nor-
malized cross-correlation. The arbitrary selection of the
Blind weave detection for woven fabrics 13
template may cause the detection of misleading feature
points for some uncommon fabric patterns. Even more
important, the template matching limits the framework
to non-patterned materials. Wefts and warps must be
of uniform color each, otherwise the correlation will
fail to robustly detect the correct location of repeti-
tive features. Yu et. al. [26] propose to overcome this
problem by considering edges only when analyzing pat-
terned fabrics. Our experiments, however, edge filtered
images derived from our database have edges that are
far too noisy and inadequate for robust pattern analy-
sis. It is likely that the best way to handle the problem
of patterned fabric analysis is by altering the imaging
method. Color might have no visible effect in fabric
images acquired with near infra-red, infra-red or ultra-
violet light. The confirmation of this hypothesis is sub-
ject to future work. Another strategy to handle pat-
terned fabrics would be based on models of weft/warp
floats in terms of probability density functions of gray
value intensities. More advanced techniques would model
distributions based on the output of texture descriptors
or combinations of different descriptors. Several authors
proposed similar strategies [17,19,21] which have been
tested successfully. However, further research and con-
siderable modifications are required to guarantee stable
and robust float-point detection results when applying
these techniques to real-world fabric images.
6 Conclusion
This work presents an algorithmic framework to au-
tomatically analyze weave patterns in woven fabrics.
The proposed methodology can handle arbitrary im-
age rotations, materials, densities, and weaves without
the requirement of previous knowledge of the fabric.
The system uses information derived from the fabric’s
Fourier spectrum and combines it with local period-
icity features to build a yarn map. By means of the
yarn map, the trajectory of singles yarns within the
fabric can be approximated which allows to assess the
accuracy of the weave analysis. An integrated feedback
loop iteratively finds the optimal result. The framework
has been evaluated on a comprehensive dataset of 140
fabric images of 14 different materials and proved to
be robust and versatile. The weave detection results
were 97% accurate. It is likely that the detection rate
can be further augmented when increasing the spatial
resolution of currently 460px/cm. The proposed frame-
work is limited to non patterned, mono-colored materi-
als which will be addressed in future work. Source codes
and databases are publicly available [31].
References
1. G. T. . Mode, Konjunkturbersicht 2005-2012, Tech. rep.,Gesamtverband Textil + Mode (2013).
2. A. Kumar, Computer-vision-based fabric defect detec-tion: A survey, Industrial Electronics, IEEE Transactionson 55 (1) (2008) 348–363. doi:10.1109/TIE.1930.896476.
3. P. Mahajan, Kolhe, A review of automatic fabric defectdetection techniques, Advances in Computational Re-search 1 (2) (2009) 18–29.
4. H. Y. Ngan, G. K. Pang, N. H. Yung, Automated fabricdefect detection–a review, Image and Vision Computing29 (7) (2011) 442–458.
5. D. Yuvaraj, R. C. Nayar, A simple yarn hairiness mea-surement setup using image processing techniques, IndianJournal of Fibre & Textile Research 37 (2012) 331–336.
6. A. Fabijaska, L. Jackowska-Strumio, Image processingand analysis algorithms for yarn hairiness determination,Machine Vision and Applications 23 (3) (2012) 527–540.doi:10.1007/s00138-012-0411-y.
7. A. Guha, C. Amarnath, S. Pateria, R. Mittal, Measure-ment of yarn hairiness by digital image processing, Jour-nal of the Textile Institute 101 (3) (2010) 214–222.
8. X.-H. Wang, J.-Y. Wang, J.-L. Zhang, H.-W. Liang, P.-M. Kou, Study on the detection of yarn hairiness mor-phology based on image processing technique, in: Ma-chine Learning and Cybernetics (ICMLC), 2010 Interna-tional Conference on, Vol. 5, 2010, pp. 2332–2336.
9. V. Carvalho, F. Soares, R. Vasconcelos, M. Belsley,N. Goncalves, Yarn hairiness determination using imageprocessing techniques, in: Emerging Technologies Fac-tory Automation (ETFA), 2011 IEEE 16th Conferenceon, 2011, pp. 1–4.
10. J.-J. Lin, Applying a co-occurrence matrix to automaticinspection of weaving density for woven fabrics, TextileResearch Journal 72 (6) (2002) 486–490.
11. Y. J. Jeong, J. Jang, Applying image analysis to au-tomatic inspection of fabric density for woven fab-rics, Fibers and Polymers 6 (2) (2005) 156–161.doi:10.1007/BF02875608.
12. R. Pan, F. Gao, J. Liu, H. Wang, Automatic inspection ofwoven fabric density of solid colour fabric density by thehough transform, Fibres & Textiles in Eastern Europe18 (4 (81)) (2010) 46–51.
13. S. H. Ravandi, Fourier transform analysis of plain weavefabric appearance, Textile Research Journal 65 (11)(1995) 676–683.
14. H. Sari-Sarraf, J. S. Goddard, Jr., Online optical mea-surement and monitoring of yarn density in woven fab-rics, in: SPIE Automated Optical Inspection for Industry,1996, pp. 444–452. doi:10.1117/12.252995.
15. Setex, Data sheet camcount, english, Tech. rep., SetexSchermuly textile computer GmbH (2008).
16. A. P. Inc., Apinc optical sensor brochure, Tech. rep., Au-tomation Partners Inc. (2008).
17. T. J. Kang, C. H. Kim, K. W. Oh, Automatic recognitionof fabric weave patterns by digital image analysis, TextileResearch Journal 69 (2) (1999) 77–83.
18. Kuo, C.-Y. Shih, J.-Y. Lee, Automatic recognition of fab-ric weave patterns by a fuzzy c-means clustering method,Textile Research Journal 74 (2) (2004) 107–111.
19. C.-C. Huang, S.-C. Liu, W.-H. Yu, Woven fabric anal-ysis by image processing: Part i: Identification of weavepatterns, Textile Research Journal 70 (6) (2000) 481–485.
20. C.-F. J. Kuo, C.-Y. Shih, C.-E. Ho, K.-C. Peng, Appli-cation of computer vision in the automatic identificationand classification of woven fabric weave patterns, TextileResearch Journal 80 (20) (2010) 2144–2157.
14
21. X. Wang, N. D. Georganas, E. Petriu, Automatic wovenfabric structure identification by using principal compo-nent analysis and fuzzy clustering, in: Instrumentationand Measurement Technology Conference (I2MTC), 2010IEEE, 2010, pp. 590–595.
22. M. Rallo, J. Escofet, M. S. Millan, Weave-repeat identifi-cation by structural analysis of fabric images, Appl. Opt.42 (17) (2003) 3361–3372.
23. A. Lachkar, T. Gadi, R. Benslimane, L. D’Orazio,E. Martuscelli, Textile woven-fabric recognition by usingfourier image-analysis techniques: Part i: A fully auto-matic approach for crossed-points detection, Journal ofthe Textile Institute 94 (3-4) (2003) 194–201.
24. A. Lachkar, R. Benslimane, L. D’Orazio, E. Martuscelli,Textile woven fabric recognition using fourier image anal-ysis techniques: Part ii texture analysis for crossed-statesdetection, Journal of the Textile Institute 96 (3) (2005)179–183.
25. J. Shen, X. Zou, F. Xu, Z. Xian, Intelligent recognition offabric weave patterns using texture orientation features,in: R. Zhu, Y. Zhang, B. Liu, C. Liu (Eds.), Informa-tion Computing and Applications, Vol. 106 of Communi-cations in Computer and Information Science, SpringerBerlin Heidelberg, 2010, pp. 8–15.
26. X. Yu, Micro structure information analysis of woven fab-rics, PhD Thesis, Hong Kong Polytechnic University de-partment of computing, 2007.
27. P. Heckbert (Ed.), Graphic Gems IV, San Diego: Aca-demic Press Professional, 1994.
28. D. Schneider, T. van Ekeris, J. zur Jacobsmuehlen,S. Groß, On benchmarking non-blind deconvolution algo-rithms: A sample driven comparison of image de-blurringmethods for automated visual inspection systems, in: In-strumentation and Measurement Technology Conference(I2MTC), 2013 IEEE International, 2013, pp. 1646–1651.doi:10.1109/I2MTC.2013.6555693.
29. M. Muja, D. G. Lowe, Fast approximate nearest neigh-bors with automatic algorithm configuration, in: Interna-tional Conference on Computer Vision Theory and Appli-cation VISSAPP’09, INSTICC Press, 2009, pp. 331–340.
30. J. C. Bezdek, Pattern Recognition with Fuzzy ObjectiveFunction Algorithms, Advanced Applications in PatternRecognition, Springer US, 1981.
31. Project website, On-loom imaging project webpage,http://onloom.lfb.rwth-aachen.de (July 2014).