Embed Size (px)
Citation preview
1
Blueprint for Academic Excellence in the University of South Carolina
School of Medicine (SOM)
2013-2014
25 February 2013
2
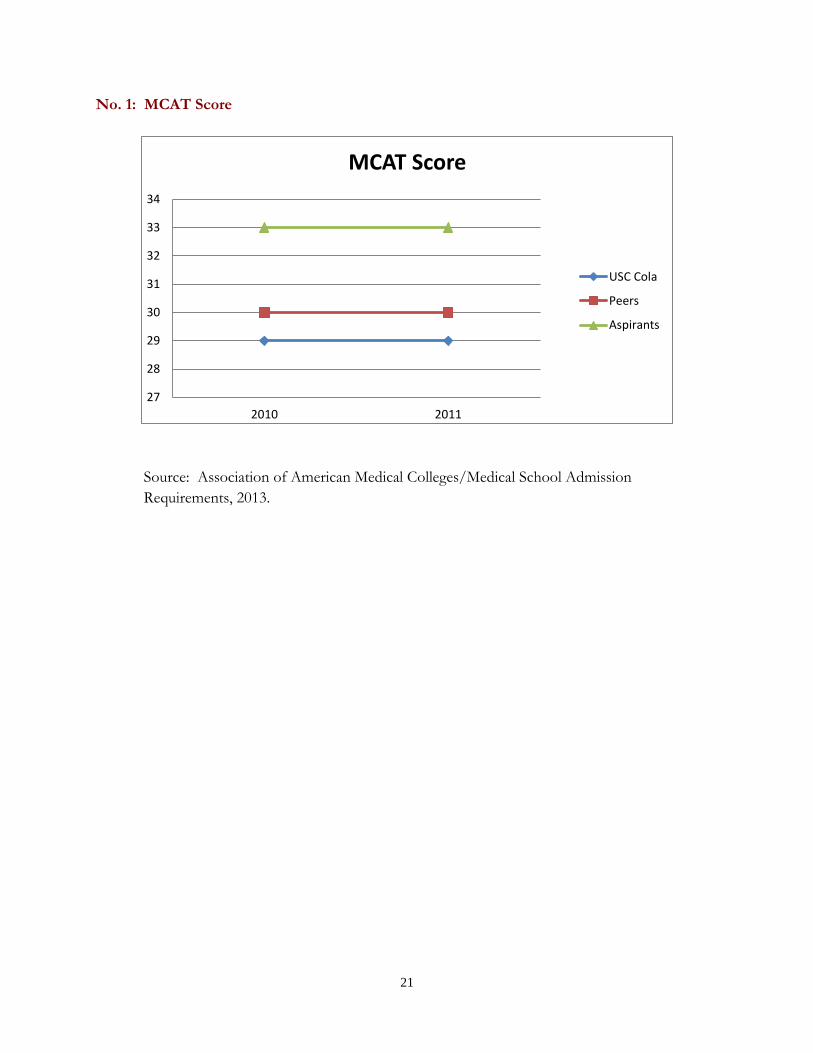
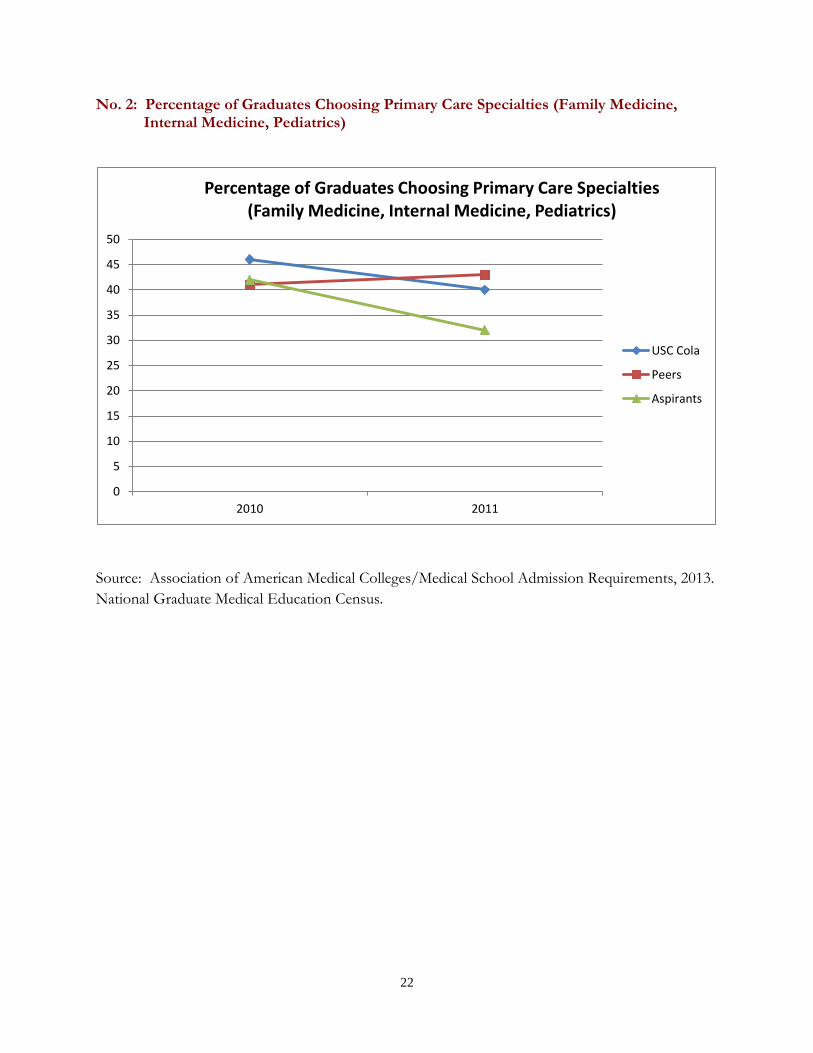
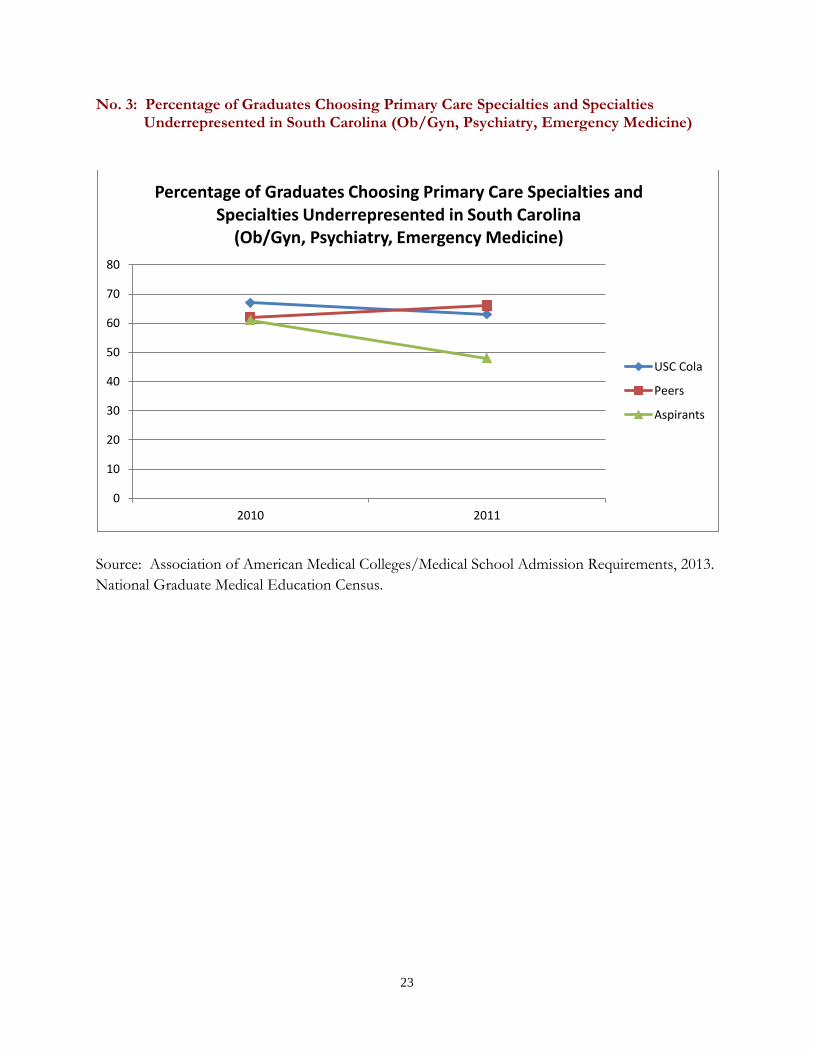
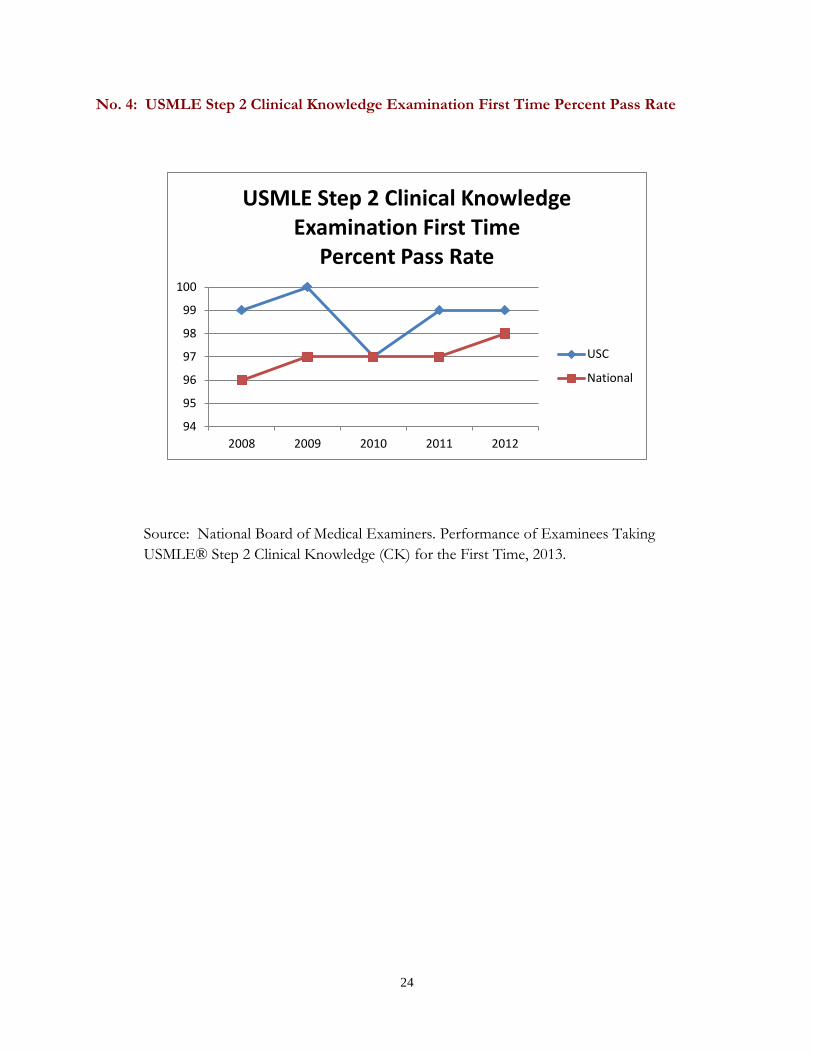
Section I. Executive Summary School of Medicine Contributions to Meeting the Academic Dashboard Targets Since it only enrolls post-baccalaureate students, many of the University Academic Dashboard targets are inapplicable to the School of Medicine. The School of Medicine proposes to use the following items for its Dashboard (Appendix G). 1. MCAT score – The School of Medicine median MCAT score for accepted applicants held steady at 29 compared to its peers (30) and its aspirants (33). 2. Percentage of Graduates Choosing Primary Care Specialties (Family Medicine, Internal Medicine, Pediatrics) – While the percentage of School of Medicine graduates choosing primary care specialties (40%) is very close to its peers (43%), this percentage is higher than its aspirants (32%). 3. Percentage of Graduates Choosing Primary Care Specialties and Specialties Underrepresented in South Carolina (OB/GYN, Psychiatry, Emergency Medicine) – The percentage of School of Medicine graduates choosing primary care specialties and specialties underrepresented in South Carolina (63%) is very close to its peers (66%) but is significantly higher than its aspirants (48%). 4. United States Medical Licensing Examination (USMLE) Step 2 First Time Percent Pass Rate - School of Medicine graduates continue to exceed the national average on first time percent pass rate.
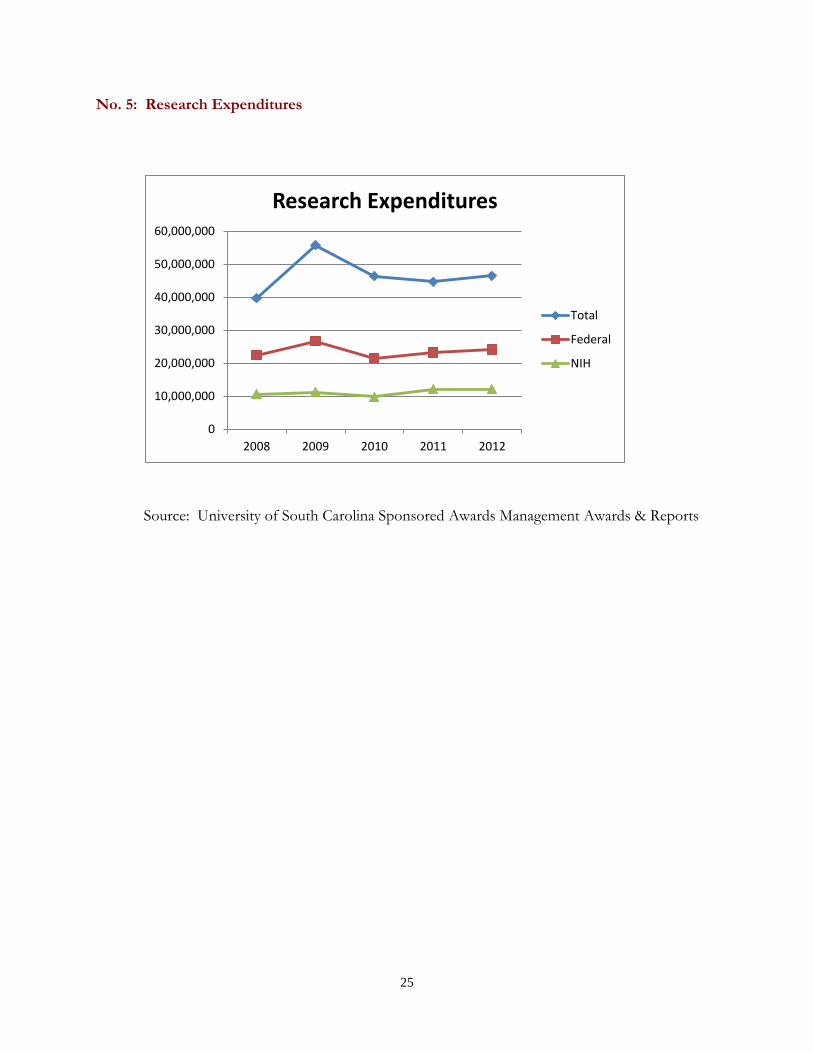
5. Research Expenditures – School of Medicine extramural funding continued to increase to $46.5 million with federal research funding (NIH, NSF, HHS) increasing to over $24 million with half coming from NIH awards. School of Medicine Contributions to Key Performance Parameters Teaching Excellence – The School of Medicine has collaborated with other health sciences schools to expand inter-professional education, has continued to maintain a global presence as a leader in ultrasound education, and increased support for minority scholarships. Research/scholarship reputation and productivity - The School of Medicine has fostered research and promoted collaborations and interdisciplinary research which resulted in extramural funding increasing to $46.5 million. Service to state, community, profession and university- The School of Medicine established a stronger financial base and infrastructure through its implementation of its electronic health record and promotion of fiscally sound practices and departmental accountability. Sustainability – The School of Medicine expects patient revenues to be consistent with revenues of the prior year, has achieved Stage I Meaningful Use for Internal Medicine, and expects to have resolution of clinical integration with Palmetto Health by summer of 2013.
3
Section II. Meeting the University’s Academic Dashboard Targets School of Medicine Contributions to Meeting the Academic Dashboard Targets Since it only enrolls post-baccalaureate students, many of the University Academic Dashboard targets are inapplicable to the School of Medicine. The School of Medicine proposes to use the following items for its Dashboard (Appendix G). Since this dashboard is in the early stages of development, the School of Medicine has not yet identified targets for the measures. Refinement of dashboard measures and identification of targets and strategies will be a focus in 2013-14. 1. MCAT score – The School of Medicine median MCAT score for accepted applicants held steady at 29 compared to its peers (30) and its aspirants (33). 2013-14 Strategy – Optimize student recruitment strategies. Increase SOM endowment to provide full tuition scholarships for academically gifted students. 2. Percentage of Graduates Choosing Primary Care Specialties (Family Medicine, Internal Medicine, Pediatrics) – While the percentage of School of Medicine graduates choosing primary care specialties (40%) is very close to its peers (43%), this percentage is higher than its aspirants (32%). 2013-14 Strategy – Maintain commitment to rural primary care training sites which provide students with first-hand experience in rural practice. Continue inclusion of Primary Care Week in curriculum. Encourage faculty participation in the Institute for Primary Care Education and Practice, an initiative from the South Carolina Area Health Education Consortium. 3. Percentage of Graduates Choosing Primary Care Specialties and Specialties Underrepresented in South Carolina (OB/GYN, Psychiatry, Emergency Medicine) – The percentage of School of Medicine graduates choosing primary care specialties and specialties underrepresented in South Carolina (63%) is very close to its peers (66%) but is significantly higher than its aspirants (48%).
2013-14 Strategy – Maintain commitment to rural primary care training sites which provide students with first-hand experience in rural practice. Continue inclusion of Primary Care Week in curriculum. Encourage faculty participation in the Institute for Primary Care Education and Practice, an initiative from the South Carolina Area Health Education Consortium. Investigate feasibility of expanding clinical education programs to Florence.
4
4. United States Medical Licensing Examination (USMLE) Step 2 First Time Percent Pass Rate and Mean Score – School of Medicine graduates continue to exceed the national average on first time percent pass rate.
2013-14 Strategy – Will continue to provide multiple opportunities for formative evaluation of clinical knowledge through the use of internal and end of clerkship subject exams plus the provision of a low teaching faculty-student ratio. 5. Research Expenditures – School of Medicine extramural funding continued to increase to $46.5 million with federal research funding (NIH, NSF, HHS) increasing to over $24 million with half coming from NIH awards. 2013-14 Strategy – Hire a new Associate Dean for Research and Graduate Education to promote translational research efforts at SOM. Renovate Building One research space. Promote research collaborations and enable additional VA eligibility for SOM faculty. Develop personal medicine research and education components.
5
Section III. School of Medicine Goals and their Contribution to the University’s Key
Performance Parameters
2013-2014 Academic Year Goals
Goal 1. Establish a stronger financial base and infrastructure in the SOM. Key Performance Parameters: Service to State, Community, Profession, and
University; Sustainability Progress: Moving forward with PH in clinical integration; addressing meaningful use
in newly implemented electronic health record.
Plans for Upcoming Year: We continue to have discussions and meetings with various University and PH persons on clinical integration. Joint board meetings started February 8, 2013 and are expected to continue over the Spring, as well as, USCSOM Departmental meetings on the matter. We expect to have some resolution of this matter by the Summer of 2013.
All clinical operational departments within the USC School of Medicine Trust and Practice Plan have fully implemented the Cerner EMR/EHR/PM, excludes Ophthalmology and Neurosurgery. Stage I Meaningful Use has been achieved for Internal Medicine, and we expect most of the Other Departments to qualify that have adequate Medicare and or Medicaid populations. Federal funding for Stage I to be received in Calendar 2013. Although productivity and collections are impacted by implementation of new patient and electronic medical systems, we expect our total patient revenues to be consistent or near overall patient driven revenues of the prior year; this is significant as most hospitals and providers have 30-40% drops in revenues for one to two years during implementation of significant electronic patient systems. Stage II planning and work is underway for 2013-2014.
Goal 2. Continue to collaborate with other health science schools to expand inter-
professional education. Key Performance Parameters: Teaching Excellence Progress: Inter-professional seminar was established between medical students and
college of pharmacy students. Plans for Upcoming Year: Expand existing inter-professional seminar to include
nursing students. Goal 3. Continue to maintain a global presence in medical education as a leader in ultrasound
medical education. Key Performance Parameters: Teaching Excellence; Services to State, Community,
Profession, and University

6
Progress: Provided leadership, infrastructure, and web-based learning modules for
Society of Ultrasound in Medical Education. Grant submitted to Fullerton Foundation for video production studio and Letter of Intent to AMA Accelerating Change in Medical Education. Five ultrasound-related patents in process.
Plans for Upcoming Year: Host Second World Congress on Ultrasound in Medical
Education. Partner with American Institute of Ultrasound in Medicine on 2013: Year of Ultrasound campaign. Participate in AAMC’s Global Health Learning Opportunities (GHLO) pilot program with focus on global ultrasound education. Establish memorandum of understanding with University of Santo Tomas in Philippines and the University of Sharjah in the United Arab Emirates.
Goal 4. Foster research and promote collaborations and interdisciplinary research.
Key Performance Indicators: Research/Scholarship Reputation and Productivity Progress: SOM funded five innovative and exploratory grant applications or bridge
funds totaling $90,000. This included one proposal to support the USC COBRE Center for Colon Cancer Research. Last year’s Research Development Fund funding of 5 investigators yielded five NIH grant applications.
Additional SOM faculty became VA-eligible and multiple VA Merit Award applications were submitted resulting in two funded VA Merit Awards. A joint VA Shared Equipment Evaluation Program (ShEEP) award requested large equipment to be housed in the IRF through joint efforts and underutilized VA laboratory space is becoming available to SOM faculty.
Plans for Upcoming Year: Hire a new Associate Dean for Research and Graduate
Education to promote translational research efforts at SOM. Renovate Building One research space. Promote research collaborations and enable additional VA eligibility for SOM faculty. Develop personal medicine research and education components.
Goal 5. Increase the SOM endowment to provide full tuition scholarships for
underrepresented minority and academically gifted students. Key Performance Parameters: Service to state, community, profession and
university; Sustainability Plans for Upcoming Year: Work with Development Office to investigate funding
streams and devise a fundraiser. Engage alumni and minority physicians, business and political leaders in strategy development.
Five-Year Goals
Goal 1. Pursue new clinical opportunities that align service, education, and research.
7
Key Performance Parameters: Service to State, Community, Profession, and University; Sustainability Form an integrated clinical practice with Palmetto Health. Actively pursue new practice opportunities centered on healthcare technology, telehealth, the Medical Home/Medical Neighborhood Concept, multidisciplinary teaching/learning experiences, and outcomes research.
Goal 2. Establish a Master’s in Physician Assistant Program
Key Performance Parameters: Teaching Excellence; Service to State, Community, Profession, and University; Sustainability Plan to establish a Master’s in Physician Assistant program with a target date of summer 2017 for the first entering class.
Goal 3. Develop a progressive interdisciplinary research agenda as part of SOM Strategic
Plan. Key Performance Parameters: Research/Scholarship Reputation and Productivity;
Service to State, Community, Profession, and University SOM faculty will collaborate with researchers across the university, the state, the
nation, and globally in targeted areas of strength, need, and funding promise such as inflammation, stroke, heart disease, regenerative medicine, neuropsychiatric diseases, technology in medicine, and health care delivery. Faculty will actively pursue funding opportunities such as COBRE and USAID.
Goal 4. Explore options for potential clinical campus in Florence. Key Performance Parameters: Teaching Excellence; Service to State, Community, Profession, and University The SOM will investigate the feasibility of expanding its clinical education programs to Florence. Goal 5. Strengthen infrastructure for educational programs.
Key Performance Parameters: Teaching Excellence; Services to State, Community, Profession, and University; Sustainability Initiate planning and fund raising for renovation of space for Objective Structured Clinical Examinations (OSCE), media production studio in Building 3 and technology-enabled smart classroom on second floor of Library.

8
Section IV. Appendices
9
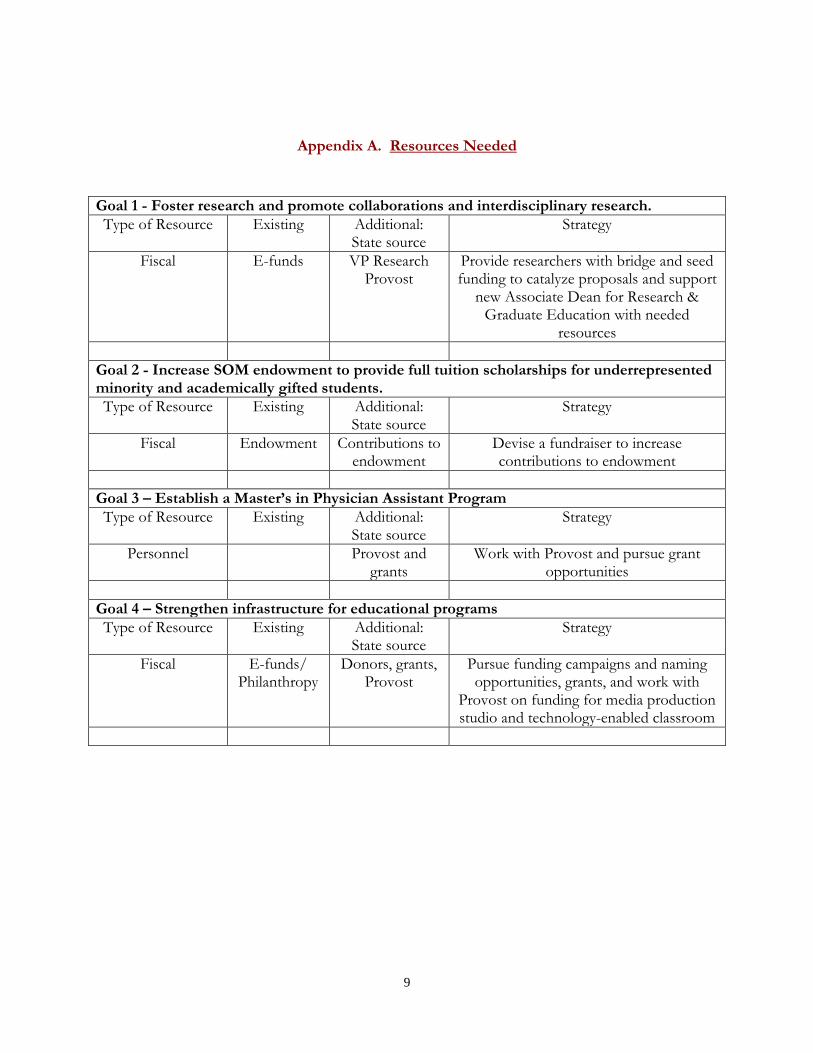
Appendix A. Resources Needed
Goal 1 - Foster research and promote collaborations and interdisciplinary research.
Type of Resource Existing Additional: State source
Strategy
Fiscal E-funds VP Research Provost
Provide researchers with bridge and seed funding to catalyze proposals and support
new Associate Dean for Research & Graduate Education with needed
resources
Goal 2 - Increase SOM endowment to provide full tuition scholarships for underrepresented minority and academically gifted students.
Type of Resource Existing Additional: State source
Strategy
Fiscal Endowment Contributions to endowment
Devise a fundraiser to increase contributions to endowment
Goal 3 – Establish a Master’s in Physician Assistant Program
Type of Resource Existing Additional: State source
Strategy
Personnel Provost and grants
Work with Provost and pursue grant opportunities
Goal 4 – Strengthen infrastructure for educational programs
Type of Resource Existing Additional: State source
Strategy
Fiscal E-funds/ Philanthropy
Donors, grants, Provost
Pursue funding campaigns and naming opportunities, grants, and work with
Provost on funding for media production studio and technology-enabled classroom
10
Appendix B. Benchmarking Information
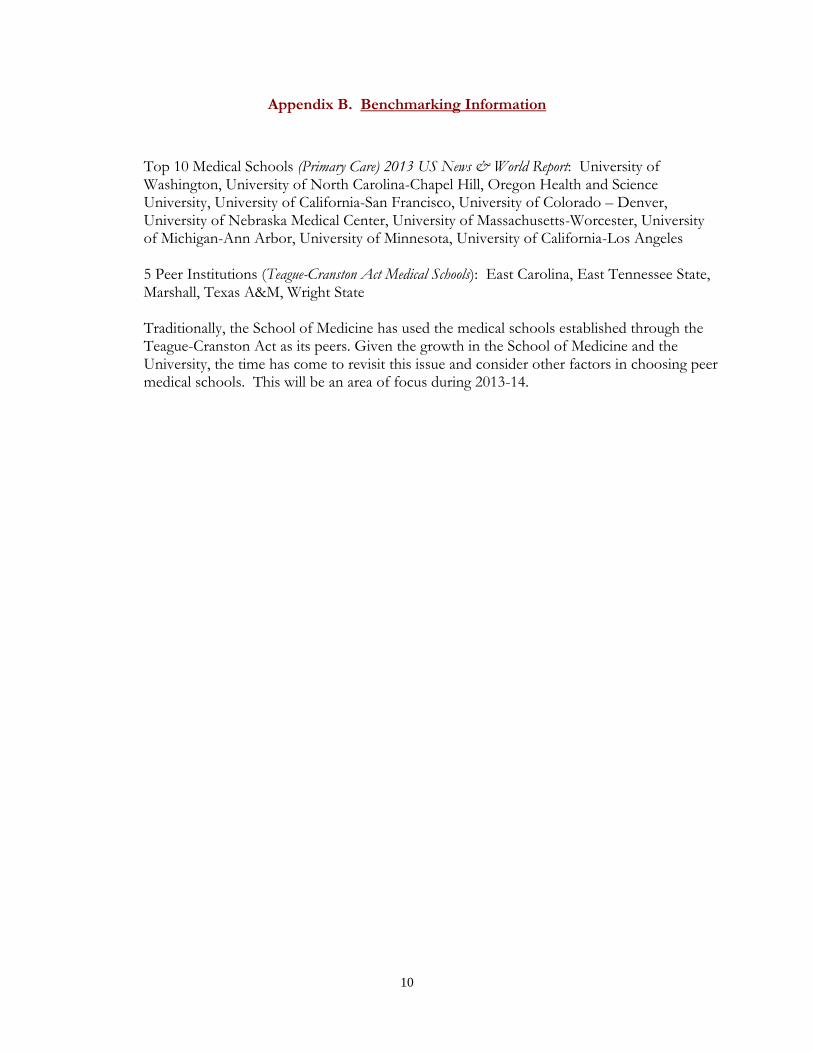
Top 10 Medical Schools (Primary Care) 2013 US News & World Report: University of Washington, University of North Carolina-Chapel Hill, Oregon Health and Science University, University of California-San Francisco, University of Colorado – Denver, University of Nebraska Medical Center, University of Massachusetts-Worcester, University of Michigan-Ann Arbor, University of Minnesota, University of California-Los Angeles
5 Peer Institutions (Teague-Cranston Act Medical Schools): East Carolina, East Tennessee State, Marshall, Texas A&M, Wright State Traditionally, the School of Medicine has used the medical schools established through the Teague-Cranston Act as its peers. Given the growth in the School of Medicine and the University, the time has come to revisit this issue and consider other factors in choosing peer medical schools. This will be an area of focus during 2013-14.
11
Appendix C. School of Medicine’s Top Strengths and Important Accomplishments
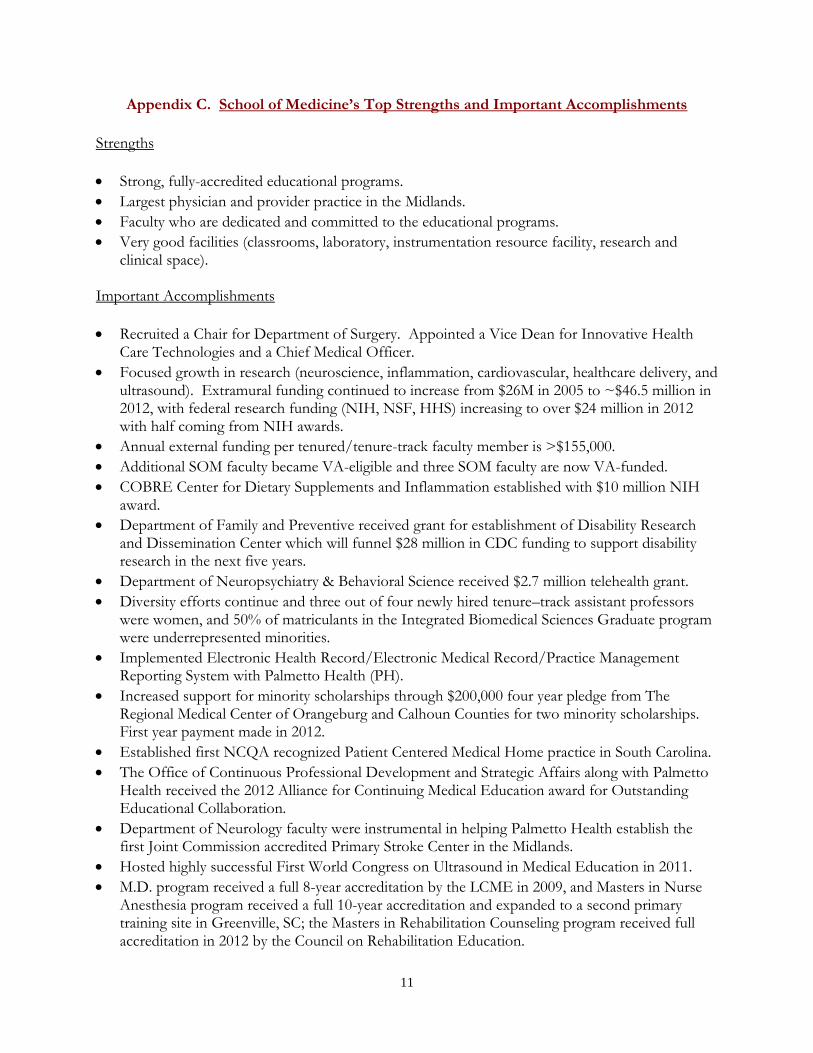
Strengths
Strong, fully-accredited educational programs.
Largest physician and provider practice in the Midlands.
Faculty who are dedicated and committed to the educational programs.
Very good facilities (classrooms, laboratory, instrumentation resource facility, research and clinical space).
Important Accomplishments
Recruited a Chair for Department of Surgery. Appointed a Vice Dean for Innovative Health Care Technologies and a Chief Medical Officer.
Focused growth in research (neuroscience, inflammation, cardiovascular, healthcare delivery, and ultrasound). Extramural funding continued to increase from $26M in 2005 to ~$46.5 million in 2012, with federal research funding (NIH, NSF, HHS) increasing to over $24 million in 2012 with half coming from NIH awards.
Annual external funding per tenured/tenure-track faculty member is >$155,000.
Additional SOM faculty became VA-eligible and three SOM faculty are now VA-funded.
COBRE Center for Dietary Supplements and Inflammation established with $10 million NIH award.
Department of Family and Preventive received grant for establishment of Disability Research and Dissemination Center which will funnel $28 million in CDC funding to support disability research in the next five years.
Department of Neuropsychiatry & Behavioral Science received $2.7 million telehealth grant.
Diversity efforts continue and three out of four newly hired tenure–track assistant professors were women, and 50% of matriculants in the Integrated Biomedical Sciences Graduate program were underrepresented minorities.
Implemented Electronic Health Record/Electronic Medical Record/Practice Management Reporting System with Palmetto Health (PH).
Increased support for minority scholarships through $200,000 four year pledge from The Regional Medical Center of Orangeburg and Calhoun Counties for two minority scholarships. First year payment made in 2012.
Established first NCQA recognized Patient Centered Medical Home practice in South Carolina.
The Office of Continuous Professional Development and Strategic Affairs along with Palmetto Health received the 2012 Alliance for Continuing Medical Education award for Outstanding Educational Collaboration.
Department of Neurology faculty were instrumental in helping Palmetto Health establish the first Joint Commission accredited Primary Stroke Center in the Midlands.
Hosted highly successful First World Congress on Ultrasound in Medical Education in 2011.
M.D. program received a full 8-year accreditation by the LCME in 2009, and Masters in Nurse Anesthesia program received a full 10-year accreditation and expanded to a second primary training site in Greenville, SC; the Masters in Rehabilitation Counseling program received full accreditation in 2012 by the Council on Rehabilitation Education.
12
Appendix D. School of Medicine’s Weaknesses and How They are Being Addressed
Weaknesses
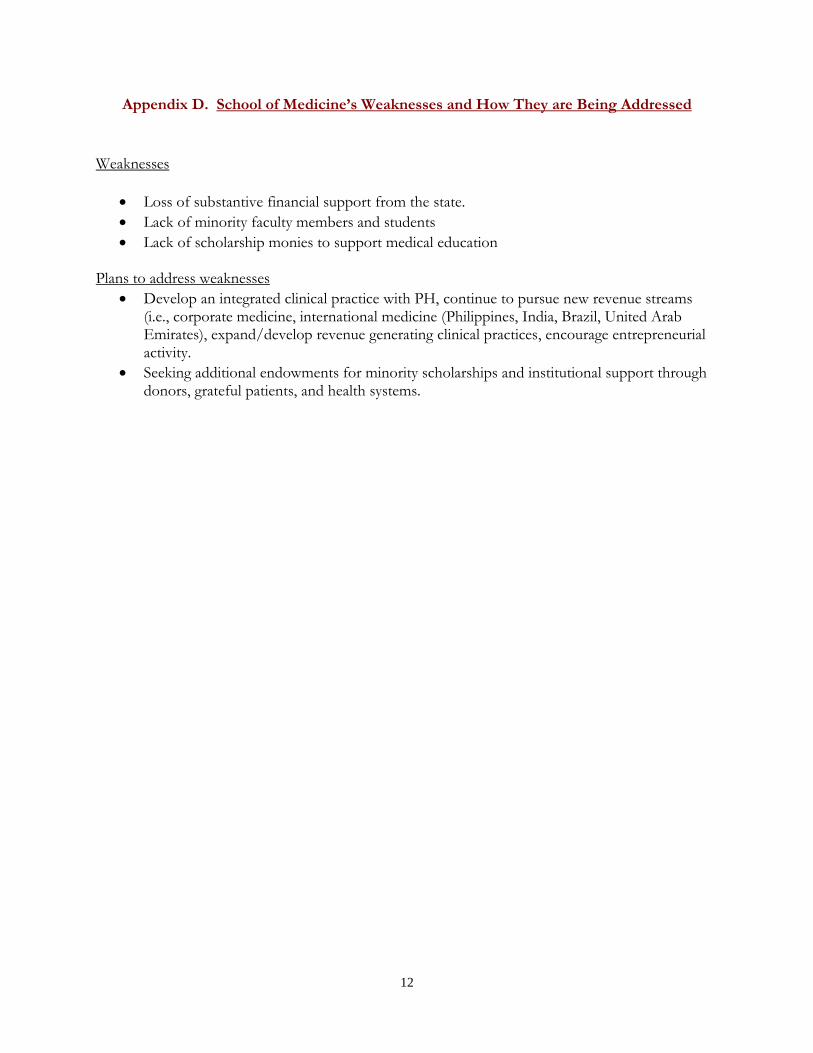
Loss of substantive financial support from the state.
Lack of minority faculty members and students
Lack of scholarship monies to support medical education
Plans to address weaknesses
Develop an integrated clinical practice with PH, continue to pursue new revenue streams (i.e., corporate medicine, international medicine (Philippines, India, Brazil, United Arab Emirates), expand/develop revenue generating clinical practices, encourage entrepreneurial activity.
Seeking additional endowments for minority scholarships and institutional support through donors, grateful patients, and health systems.
13
Appendix E. Statistical Data for School of Medicine
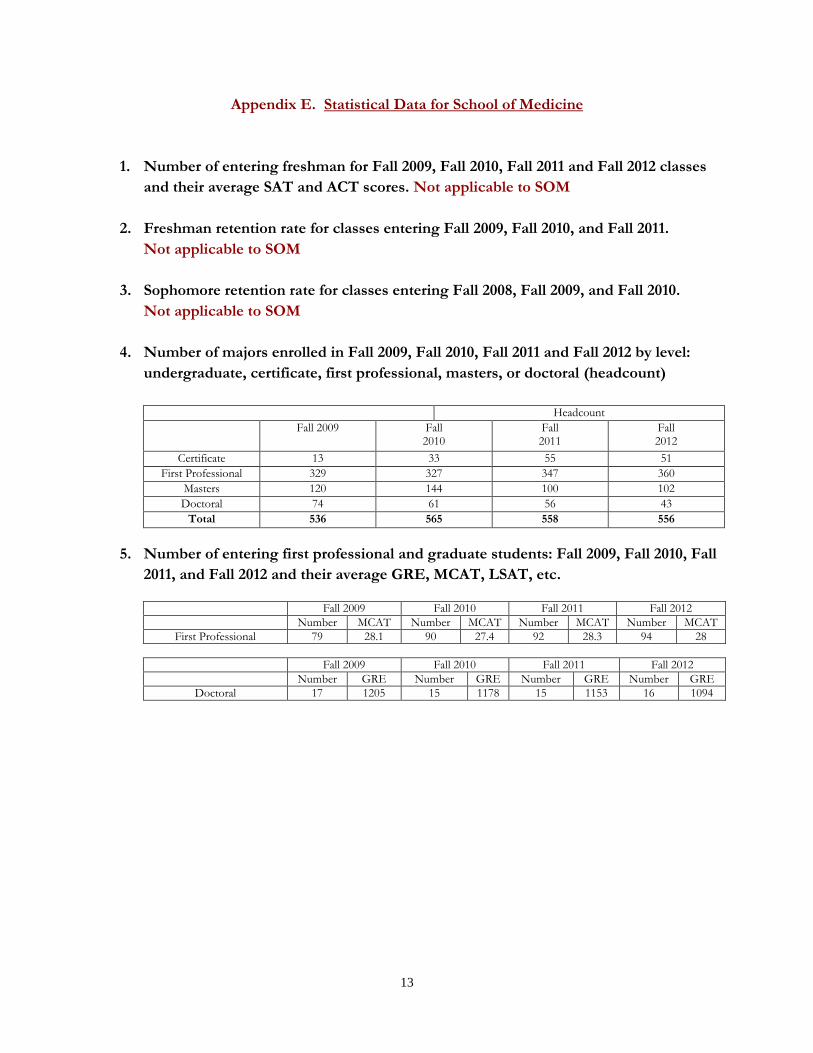
1. Number of entering freshman for Fall 2009, Fall 2010, Fall 2011 and Fall 2012 classes
and their average SAT and ACT scores. Not applicable to SOM
2. Freshman retention rate for classes entering Fall 2009, Fall 2010, and Fall 2011.
Not applicable to SOM
3. Sophomore retention rate for classes entering Fall 2008, Fall 2009, and Fall 2010.
Not applicable to SOM
4. Number of majors enrolled in Fall 2009, Fall 2010, Fall 2011 and Fall 2012 by level:
undergraduate, certificate, first professional, masters, or doctoral (headcount)
Headcount
Fall 2009 Fall 2010
Fall 2011
Fall 2012
Certificate 13 33 55 51
First Professional 329 327 347 360
Masters 120 144 100 102
Doctoral 74 61 56 43
Total 536 565 558 556
5. Number of entering first professional and graduate students: Fall 2009, Fall 2010, Fall
2011, and Fall 2012 and their average GRE, MCAT, LSAT, etc.
Fall 2009 Fall 2010 Fall 2011 Fall 2012
Number MCAT Number MCAT Number MCAT Number MCAT
First Professional 79 28.1 90 27.4 92 28.3 94 28
Fall 2009 Fall 2010 Fall 2011 Fall 2012
Number GRE Number GRE Number GRE Number GRE
Doctoral 17 1205 15 1178 15 1153 16 1094
14
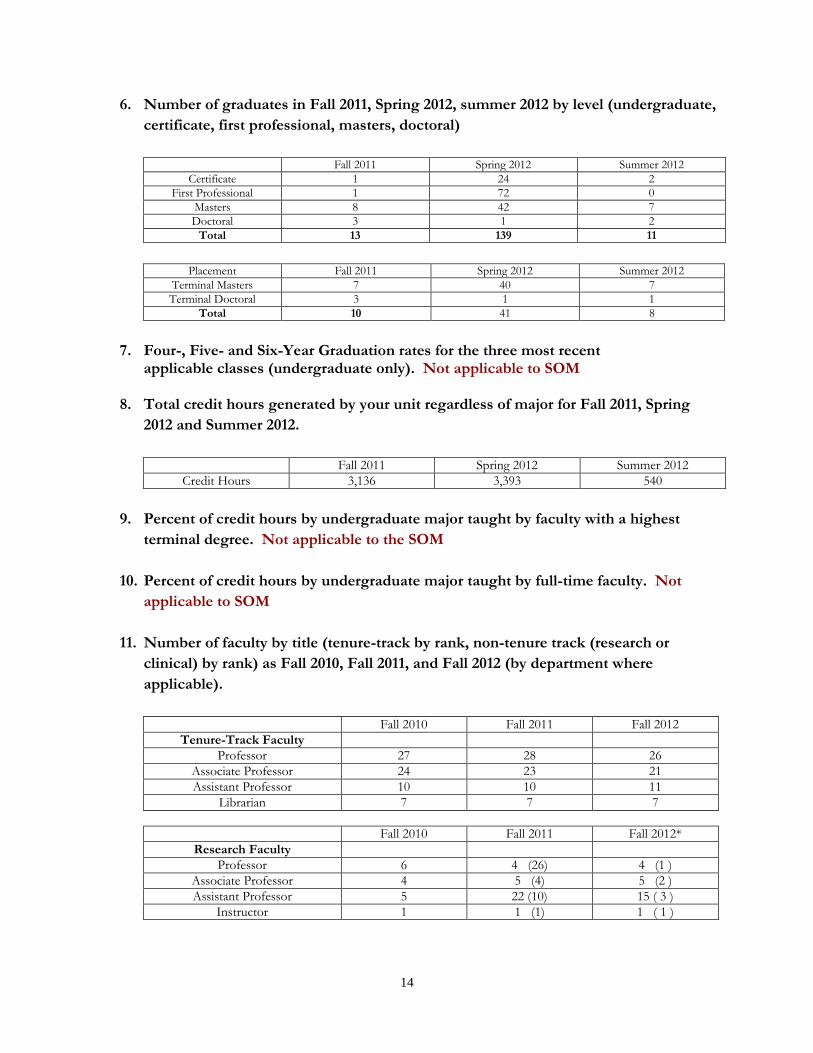
6. Number of graduates in Fall 2011, Spring 2012, summer 2012 by level (undergraduate,
certificate, first professional, masters, doctoral)
Fall 2011 Spring 2012 Summer 2012
Certificate 1 24 2
First Professional 1 72 0
Masters 8 42 7
Doctoral 3 1 2
Total 13 139 11
Placement Fall 2011 Spring 2012 Summer 2012
Terminal Masters 7 40 7
Terminal Doctoral 3 1 1
Total 10 41 8
7. Four-, Five- and Six-Year Graduation rates for the three most recent applicable classes (undergraduate only). Not applicable to SOM
8. Total credit hours generated by your unit regardless of major for Fall 2011, Spring
2012 and Summer 2012.
Fall 2011 Spring 2012 Summer 2012
Credit Hours 3,136 3,393 540
9. Percent of credit hours by undergraduate major taught by faculty with a highest
terminal degree. Not applicable to the SOM
10. Percent of credit hours by undergraduate major taught by full-time faculty. Not
applicable to SOM
11. Number of faculty by title (tenure-track by rank, non-tenure track (research or
clinical) by rank) as Fall 2010, Fall 2011, and Fall 2012 (by department where
applicable).
Fall 2010 Fall 2011 Fall 2012
Tenure-Track Faculty
Professor 27 28 26
Associate Professor 24 23 21
Assistant Professor 10 10 11
Librarian 7 7 7
Fall 2010 Fall 2011 Fall 2012*
Research Faculty
Professor 6 4 (26) 4 (1 )
Associate Professor 4 5 (4) 5 (2 )
Assistant Professor 5 22 (10) 15 ( 3 )
Instructor 1 1 (1) 1 ( 1 )
15
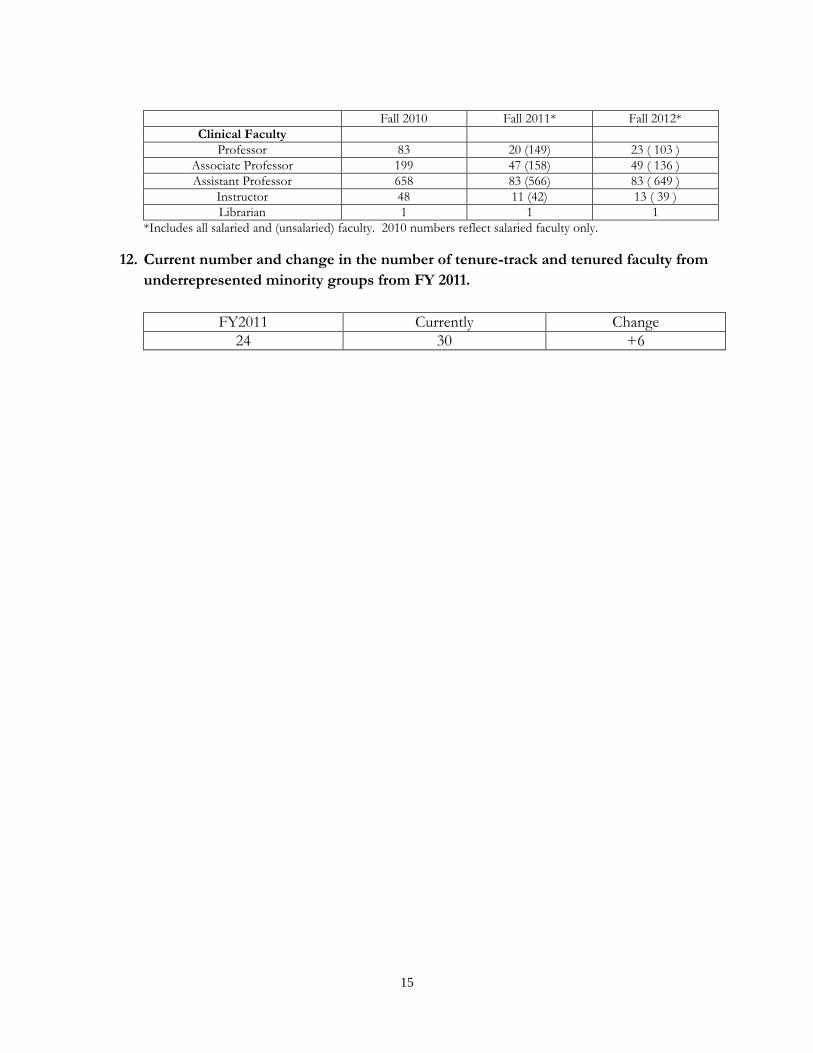
Fall 2010 Fall 2011* Fall 2012*
Clinical Faculty
Professor 83 20 (149) 23 ( 103 )
Associate Professor 199 47 (158) 49 ( 136 )
Assistant Professor 658 83 (566) 83 ( 649 )
Instructor 48 11 (42) 13 ( 39 )
Librarian 1 1 1
*Includes all salaried and (unsalaried) faculty. 2010 numbers reflect salaried faculty only.
12. Current number and change in the number of tenure-track and tenured faculty from
underrepresented minority groups from FY 2011.
FY2011 Currently Change
24 30 +6
16
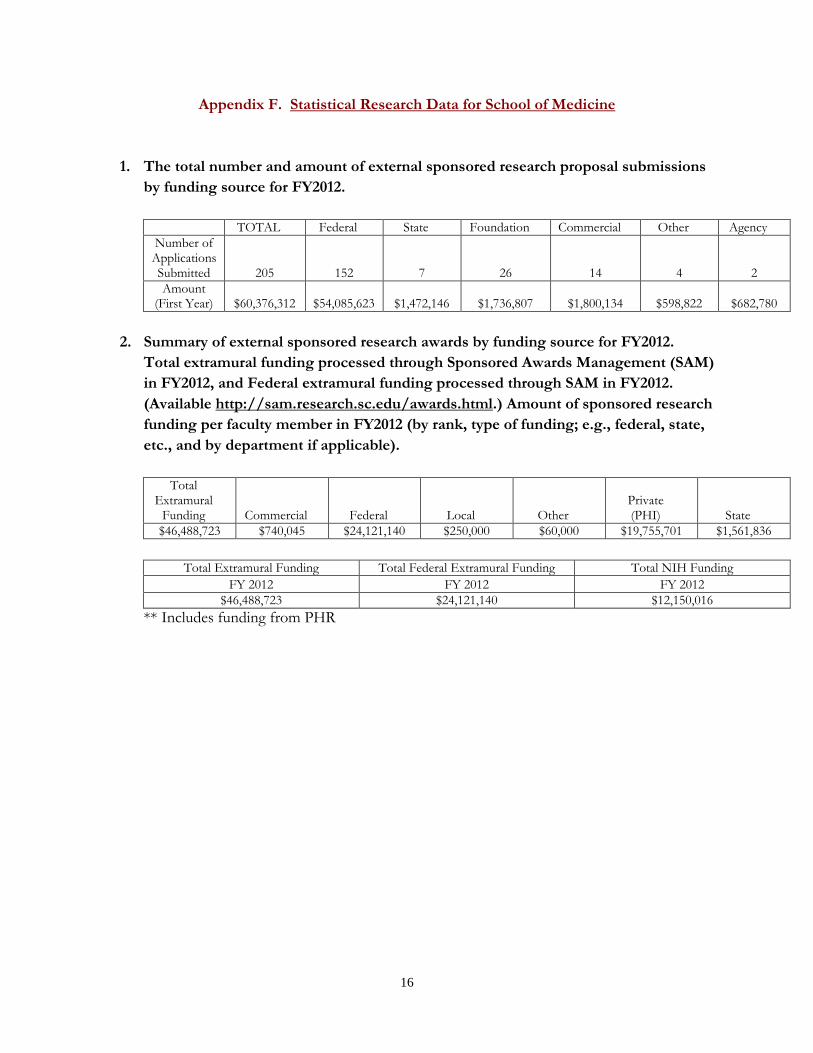
Appendix F. Statistical Research Data for School of Medicine
1. The total number and amount of external sponsored research proposal submissions
by funding source for FY2012.
TOTAL Federal State Foundation Commercial Other Agency
Number of Applications Submitted 205 152 7 26 14 4 2
Amount (First Year) $60,376,312 $54,085,623 $1,472,146 $1,736,807 $1,800,134 $598,822 $682,780
2. Summary of external sponsored research awards by funding source for FY2012.
Total extramural funding processed through Sponsored Awards Management (SAM)
in FY2012, and Federal extramural funding processed through SAM in FY2012.
(Available http://sam.research.sc.edu/awards.html.) Amount of sponsored research
funding per faculty member in FY2012 (by rank, type of funding; e.g., federal, state,
etc., and by department if applicable).
Total Extramural
Funding Commercial Federal Local Other Private (PHI) State
$46,488,723 $740,045 $24,121,140 $250,000 $60,000 $19,755,701 $1,561,836
Total Extramural Funding Total Federal Extramural Funding Total NIH Funding
FY 2012 FY 2012 FY 2012
$46,488,723 $24,121,140 $12,150,016
** Includes funding from PHR
17
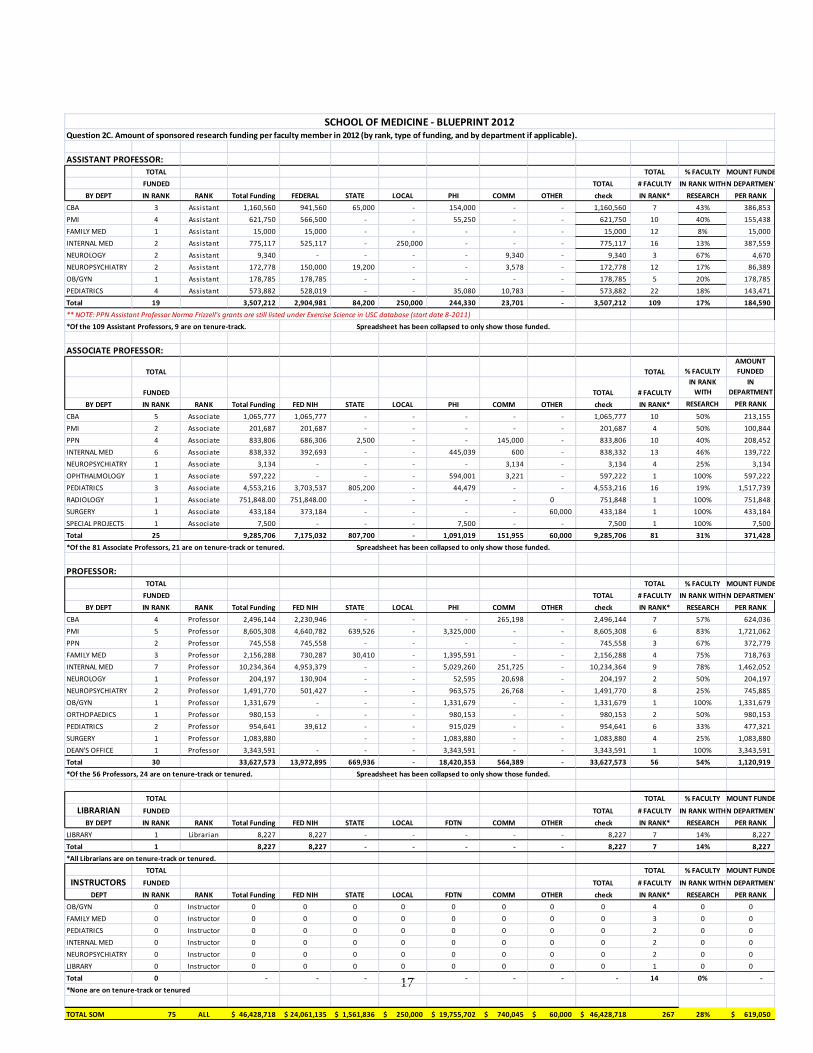
ASSISTANT PROFESSOR:TOTAL TOTAL % FACULTY AMOUNT FUNDED
FUNDED TOTAL # FACULTY IN RANK WITHIN DEPARTMENT
BY DEPT IN RANK RANK Total Funding FEDERAL STATE LOCAL PHI COMM OTHER check IN RANK* RESEARCH PER RANK
CBA 3 Assistant 1,160,560 941,560 65,000 - 154,000 - - 1,160,560 7 43% 386,853
PMI 4 Assistant 621,750 566,500 - - 55,250 - - 621,750 10 40% 155,438
FAMILY MED 1 Assistant 15,000 15,000 - - - - - 15,000 12 8% 15,000
INTERNAL MED 2 Assistant 775,117 525,117 - 250,000 - - - 775,117 16 13% 387,559
NEUROLOGY 2 Assistant 9,340 - - - - 9,340 - 9,340 3 67% 4,670
NEUROPSYCHIATRY 2 Assistant 172,778 150,000 19,200 - - 3,578 - 172,778 12 17% 86,389
OB/GYN 1 Assistant 178,785 178,785 - - - - - 178,785 5 20% 178,785
PEDIATRICS 4 Assistant 573,882 528,019 - - 35,080 10,783 - 573,882 22 18% 143,471
Total 19 3,507,212 2,904,981 84,200 250,000 244,330 23,701 - 3,507,212 109 17% 184,590
** NOTE: PPN Assistant Professor Norma Frizzell's grants are still listed under Exercise Science in USC database (start date 8-2011)
*Of the 109 Assistant Professors, 9 are on tenure-track. Spreadsheet has been collapsed to only show those funded.
ASSOCIATE PROFESSOR:
TOTAL TOTAL % FACULTY
AMOUNT
FUNDED
FUNDED TOTAL # FACULTY
IN RANK
WITH
IN
DEPARTMENT
BY DEPT IN RANK RANK Total Funding FED NIH STATE LOCAL PHI COMM OTHER check IN RANK* RESEARCH PER RANK
CBA 5 Associate 1,065,777 1,065,777 - - - - - 1,065,777 10 50% 213,155
PMI 2 Associate 201,687 201,687 - - - - - 201,687 4 50% 100,844
PPN 4 Associate 833,806 686,306 2,500 - - 145,000 - 833,806 10 40% 208,452
INTERNAL MED 6 Associate 838,332 392,693 - - 445,039 600 - 838,332 13 46% 139,722
NEUROPSYCHIATRY 1 Associate 3,134 - - - - 3,134 - 3,134 4 25% 3,134
OPHTHALMOLOGY 1 Associate 597,222 - - - 594,001 3,221 - 597,222 1 100% 597,222
PEDIATRICS 3 Associate 4,553,216 3,703,537 805,200 - 44,479 - - 4,553,216 16 19% 1,517,739
RADIOLOGY 1 Associate 751,848.00 751,848.00 - - - - 0 751,848 1 100% 751,848
SURGERY 1 Associate 433,184 373,184 - - - - 60,000 433,184 1 100% 433,184
SPECIAL PROJECTS 1 Associate 7,500 - - - 7,500 - - 7,500 1 100% 7,500
Total 25 9,285,706 7,175,032 807,700 - 1,091,019 151,955 60,000 9,285,706 81 31% 371,428
*Of the 81 Associate Professors, 21 are on tenure-track or tenured. Spreadsheet has been collapsed to only show those funded.
PROFESSOR:
TOTAL TOTAL % FACULTY AMOUNT FUNDED
FUNDED TOTAL # FACULTY IN RANK WITHIN DEPARTMENT
BY DEPT IN RANK RANK Total Funding FED NIH STATE LOCAL PHI COMM OTHER check IN RANK* RESEARCH PER RANK
CBA 4 Professor 2,496,144 2,230,946 - - - 265,198 - 2,496,144 7 57% 624,036
PMI 5 Professor 8,605,308 4,640,782 639,526 - 3,325,000 - - 8,605,308 6 83% 1,721,062
PPN 2 Professor 745,558 745,558 - - - - - 745,558 3 67% 372,779
FAMILY MED 3 Professor 2,156,288 730,287 30,410 - 1,395,591 - - 2,156,288 4 75% 718,763
INTERNAL MED 7 Professor 10,234,364 4,953,379 - - 5,029,260 251,725 - 10,234,364 9 78% 1,462,052
NEUROLOGY 1 Professor 204,197 130,904 - - 52,595 20,698 - 204,197 2 50% 204,197
NEUROPSYCHIATRY 2 Professor 1,491,770 501,427 - - 963,575 26,768 - 1,491,770 8 25% 745,885
OB/GYN 1 Professor 1,331,679 - - - 1,331,679 - - 1,331,679 1 100% 1,331,679
ORTHOPAEDICS 1 Professor 980,153 - - - 980,153 - - 980,153 2 50% 980,153
PEDIATRICS 2 Professor 954,641 39,612 - - 915,029 - - 954,641 6 33% 477,321
SURGERY 1 Professor 1,083,880 - - 1,083,880 - - 1,083,880 4 25% 1,083,880
DEAN'S OFFICE 1 Professor 3,343,591 - - - 3,343,591 - - 3,343,591 1 100% 3,343,591
Total 30 33,627,573 13,972,895 669,936 - 18,420,353 564,389 - 33,627,573 56 54% 1,120,919
*Of the 56 Professors, 24 are on tenure-track or tenured. Spreadsheet has been collapsed to only show those funded.
TOTAL TOTAL % FACULTY AMOUNT FUNDED
LIBRARIAN FUNDED TOTAL # FACULTY IN RANK WITHIN DEPARTMENT
BY DEPT IN RANK RANK Total Funding FED NIH STATE LOCAL FDTN COMM OTHER check IN RANK* RESEARCH PER RANK
LIBRARY 1 Librarian 8,227 8,227 - - - - - 8,227 7 14% 8,227
Total 1 8,227 8,227 - - - - - 8,227 7 14% 8,227
*All Librarians are on tenure-track or tenured.
TOTAL TOTAL % FACULTY AMOUNT FUNDED
INSTRUCTORS FUNDED TOTAL # FACULTY IN RANK WITHIN DEPARTMENT
DEPT IN RANK RANK Total Funding FED NIH STATE LOCAL FDTN COMM OTHER check IN RANK* RESEARCH PER RANK
OB/GYN 0 Instructor 0 0 0 0 0 0 0 0 4 0 0
FAMILY MED 0 Instructor 0 0 0 0 0 0 0 0 3 0 0
PEDIATRICS 0 Instructor 0 0 0 0 0 0 0 0 2 0 0
INTERNAL MED 0 Instructor 0 0 0 0 0 0 0 0 2 0 0
NEUROPSYCHIATRY 0 Instructor 0 0 0 0 0 0 0 0 2 0 0
LIBRARY 0 Instructor 0 0 0 0 0 0 0 0 1 0 0
Total 0 - - - - - - - - 14 0% -
*None are on tenure-track or tenured
TOTAL SOM 75 ALL 46,428,718$ 24,061,135$ 1,561,836$ 250,000$ 19,755,702$ 740,045$ 60,000$ 46,428,718$ 267 28% 619,050$
SCHOOL OF MEDICINE - BLUEPRINT 2012Question 2C. Amount of sponsored research funding per faculty member in 2012 (by rank, type of funding, and by department if applicable).
18
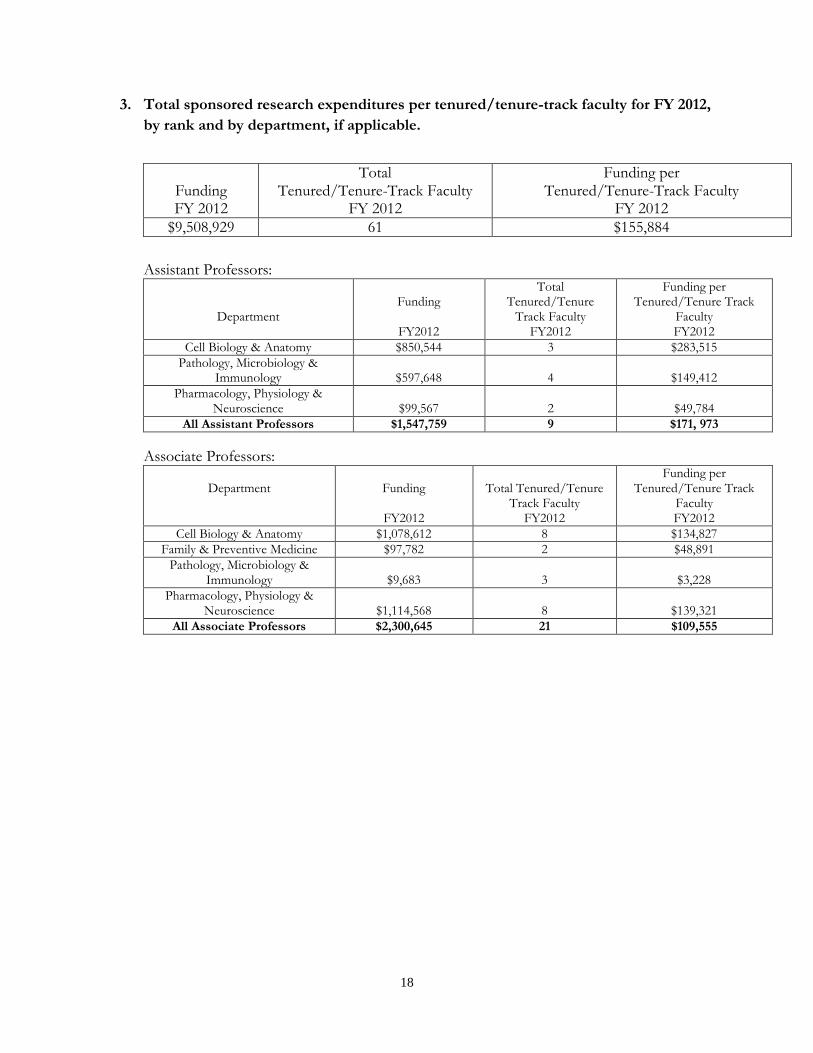
3. Total sponsored research expenditures per tenured/tenure-track faculty for FY 2012,
by rank and by department, if applicable.
Assistant Professors:
Department
Funding
FY2012
Total Tenured/Tenure
Track Faculty FY2012
Funding per Tenured/Tenure Track
Faculty FY2012
Cell Biology & Anatomy $850,544 3 $283,515
Pathology, Microbiology & Immunology $597,648 4 $149,412
Pharmacology, Physiology & Neuroscience $99,567 2 $49,784
All Assistant Professors $1,547,759 9 $171, 973
Associate Professors:
Department
Funding
FY2012
Total Tenured/Tenure Track Faculty
FY2012
Funding per Tenured/Tenure Track
Faculty FY2012
Cell Biology & Anatomy $1,078,612 8 $134,827
Family & Preventive Medicine $97,782 2 $48,891
Pathology, Microbiology & Immunology $9,683 3 $3,228
Pharmacology, Physiology & Neuroscience $1,114,568 8 $139,321
All Associate Professors $2,300,645 21 $109,555
Funding FY 2012
Total Tenured/Tenure-Track Faculty
FY 2012
Funding per Tenured/Tenure-Track Faculty
FY 2012
$9,508,929 61 $155,884
19
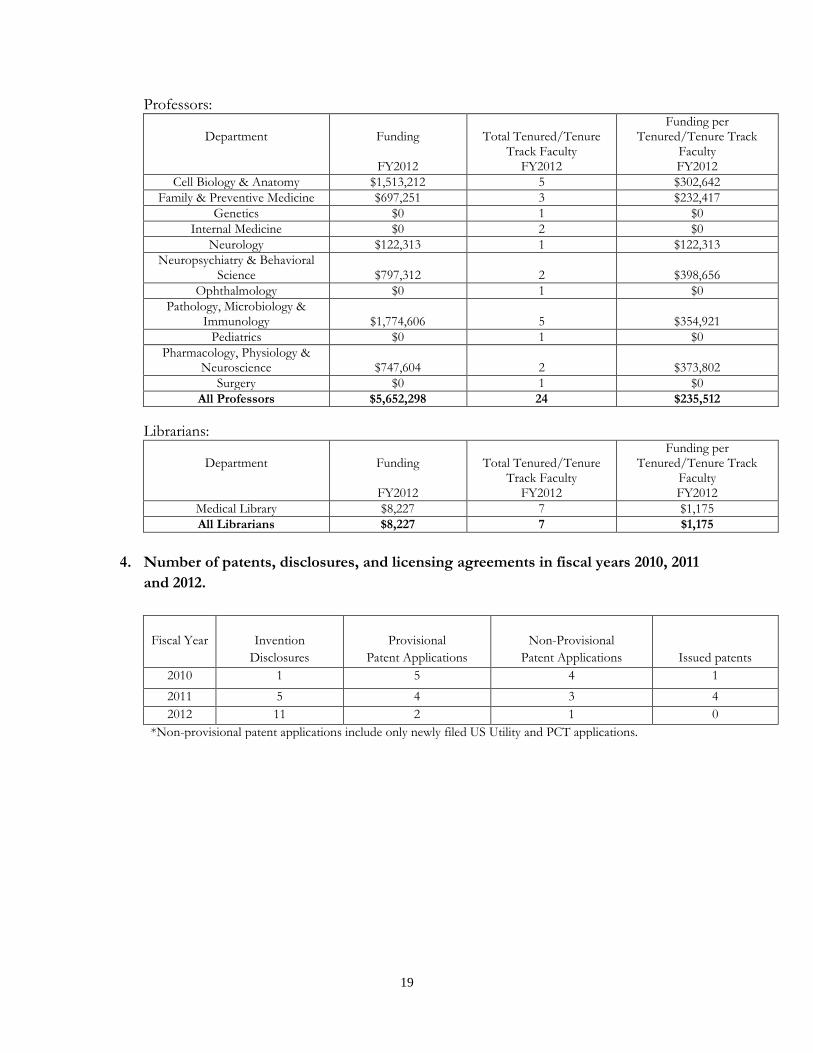
Professors:
Department
Funding
FY2012
Total Tenured/Tenure Track Faculty
FY2012
Funding per Tenured/Tenure Track
Faculty FY2012
Cell Biology & Anatomy $1,513,212 5 $302,642
Family & Preventive Medicine $697,251 3 $232,417
Genetics $0 1 $0
Internal Medicine $0 2 $0
Neurology $122,313 1 $122,313
Neuropsychiatry & Behavioral Science $797,312 2 $398,656
Ophthalmology $0 1 $0
Pathology, Microbiology & Immunology $1,774,606 5 $354,921
Pediatrics $0 1 $0
Pharmacology, Physiology & Neuroscience $747,604 2 $373,802
Surgery $0 1 $0
All Professors $5,652,298 24 $235,512
Librarians:
Department
Funding
FY2012
Total Tenured/Tenure Track Faculty
FY2012
Funding per Tenured/Tenure Track
Faculty FY2012
Medical Library $8,227 7 $1,175
All Librarians $8,227 7 $1,175
4. Number of patents, disclosures, and licensing agreements in fiscal years 2010, 2011
and 2012.
Fiscal Year
Invention
Disclosures
Provisional
Patent Applications
Non-Provisional
Patent Applications
Issued patents
2010 1 5 4 1
2011 5 4 3 4
2012 11 2 1 0
*Non-provisional patent applications include only newly filed US Utility and PCT applications.
20
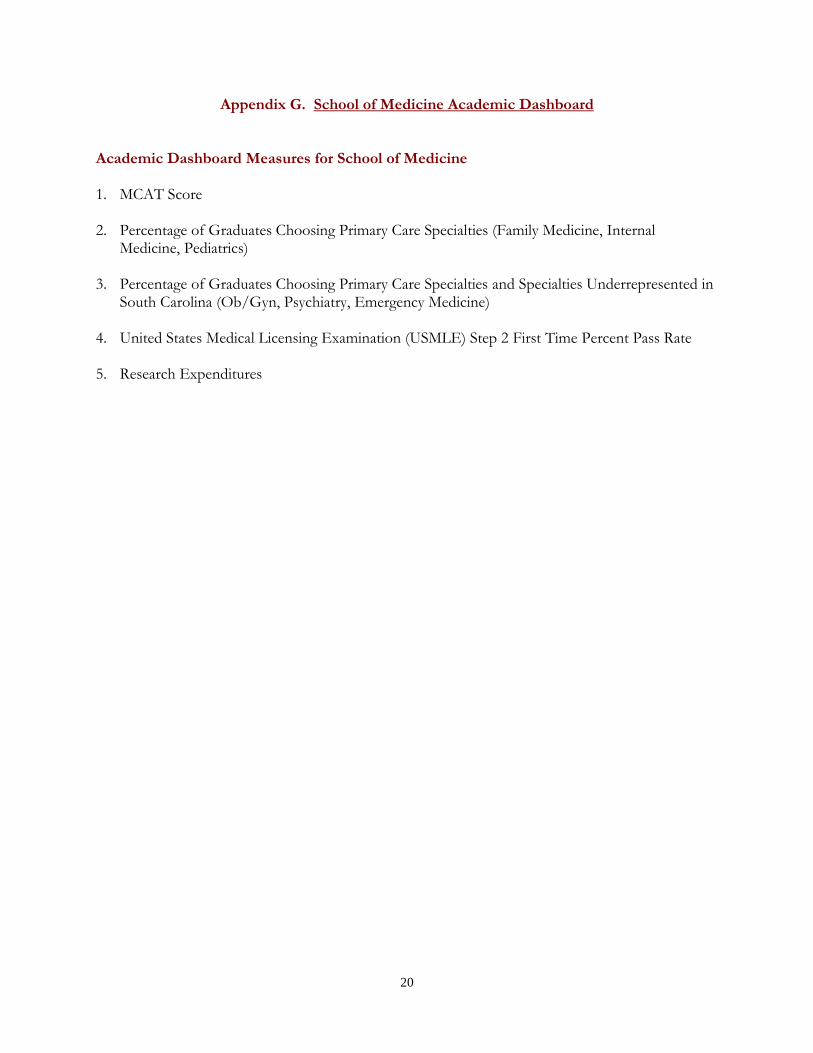
Appendix G. School of Medicine Academic Dashboard
Academic Dashboard Measures for School of Medicine 1. MCAT Score
2. Percentage of Graduates Choosing Primary Care Specialties (Family Medicine, Internal Medicine, Pediatrics)
3. Percentage of Graduates Choosing Primary Care Specialties and Specialties Underrepresented in
South Carolina (Ob/Gyn, Psychiatry, Emergency Medicine) 4. United States Medical Licensing Examination (USMLE) Step 2 First Time Percent Pass Rate
5. Research Expenditures
21
No. 1: MCAT Score
Source: Association of American Medical Colleges/Medical School Admission
Requirements, 2013.
27
28
29
30
31
32
33
34
2010 2011
MCAT Score
USC Cola
Peers
Aspirants
22
No. 2: Percentage of Graduates Choosing Primary Care Specialties (Family Medicine, Internal Medicine, Pediatrics)
Source: Association of American Medical Colleges/Medical School Admission Requirements, 2013.
National Graduate Medical Education Census.
0
5
10
15
20
25
30
35
40
45
50
2010 2011
Percentage of Graduates Choosing Primary Care Specialties (Family Medicine, Internal Medicine, Pediatrics)
USC Cola
Peers
Aspirants
23
No. 3: Percentage of Graduates Choosing Primary Care Specialties and Specialties Underrepresented in South Carolina (Ob/Gyn, Psychiatry, Emergency Medicine)
Source: Association of American Medical Colleges/Medical School Admission Requirements, 2013.
National Graduate Medical Education Census.
0
10
20
30
40
50
60
70
80
2010 2011
Percentage of Graduates Choosing Primary Care Specialties and Specialties Underrepresented in South Carolina
(Ob/Gyn, Psychiatry, Emergency Medicine)
USC Cola
Peers
Aspirants
24
No. 4: USMLE Step 2 Clinical Knowledge Examination First Time Percent Pass Rate
Source: National Board of Medical Examiners. Performance of Examinees Taking
USMLE® Step 2 Clinical Knowledge (CK) for the First Time, 2013.
94
95
96
97
98
99
100
2008 2009 2010 2011 2012
USMLE Step 2 Clinical Knowledge Examination First Time
Percent Pass Rate
USC
National
25
No. 5: Research Expenditures
Source: University of South Carolina Sponsored Awards Management Awards & Reports
0
10,000,000
20,000,000
30,000,000
40,000,000
50,000,000
60,000,000
2008 2009 2010 2011 2012
Research Expenditures
Total
Federal
NIH