Embed Size (px)
Citation preview
ARTICLEPEDIATRICS Volume 138 , number 1 , July 2016 :e 20153809
BMI-for-Age and Weight-for-Length in Children 0 to 2 YearsKayla R. Furlong, MSc, a Laura N. Anderson, PhD, a, b Huiying Kang, c, d Gerald Lebovic, PhD, d, e Patricia C. Parkin, MD, FRCPC, a, e, f, g Jonathon L. Maguire, MD, MSc, FRCPC, d, e, f, g, h, i Deborah L. O’Connor, RD, PhD, h Catherine S. Birken, MD, MSc, FRCPC, a, e, f, g on behalf of the TARGet Kids! Collaboration
abstractOBJECTIVES: To determine the agreement between weight-for-length and BMI-for-age in
children 0 to <2 years by using research-collected data, examine factors that may affect
agreement, and determine if agreement differs between research- and routinely collected
data.
METHODS: Cross-sectional data on healthy, term-born children (n = 1632) aged 0 to <2 years
attending the TARGet Kids! practice-based research network in Toronto, Canada (December
2008–October 2014) were collected. Multiple visits for each child were included. Length
(cm) and weight (kg) measurements were obtained by trained research assistants during
research visits, and by nonresearch staff during all other visits. BMI-for-age z-scores were
compared with weight-for-length z-scores (the criterion measure).
RESULTS: The correlation between weight-for-length and BMI-for-age was strong (r = 0.986,
P < .0001) and Bland-Altman plots revealed good agreement (difference = −0.08, SD =
0.20, P = .91). A small proportion (6.3%) of observations were misclassified and most
misclassifications occurred near the percentile cutoffs. There were no differences by age
and sex. Agreement was similar between research- and routinely collected data (r = 0.99, P
< .001; mean difference −0.84, SD = 0.20, P = .67).
CONCLUSIONS: Weight-for-length and BMI-for-age demonstrated high agreement with low
misclassification. BMI-for-age may be an appropriate indicator of growth in the first 2 years
of life and has the potential to be used from birth to adulthood. Additional investigation is
needed to determine if BMI-for-age in children <2 years is associated with future health
outcomes.
aChild Health and Evaluative Sciences, Research Institute, and fPaediatric Outcomes Research Team, Division
of Paediatric Medicine, Department of Paediatrics, The Hospital for Sick Children, Toronto, Ontario, Canada; bDepartment of Clinical Epidemiology and Biostatistics, McMaster University, Hamilton, Ontario, Canada; cDalla
Lana School of Public Health, eInstitute of Health Policy, Management, and Evaluation, and Departments of gPaediatrics and hNutritional Sciences, Faculty of Medicine, University of Toronto, Toronto, Ontario, Canada;
and dThe Applied Research Centre of the Li Ka Shing Knowledge Institute, and iDepartment of Pediatrics, St.
Michael’s Hospital, Toronto, Ontario, Canada
Ms Furlong and Dr Anderson conceptualized and designed the study, contributed to the analysis
and interpretation of the data, and drafted the manuscript; Ms Kang contributed to the analysis
and interpretation of the data; Drs Lebovic and Birken conceptualized and designed the study
and contributed to the analysis and interpretation of the data; Drs Parkin, Maguire, and O’Connor
assisted in refi ning the study design and contributed to the analysis and interpretation of the
data; and all authors contributed to the revision of the manuscript, approved the fi nal version
submitted for publication, and agreed to act as guarantors of the work.
DOI: 10.1542/peds.2015-3809
Accepted for publication Apr 22, 2016 To cite: Furlong KR, Anderson LN, Kang H, et al. BMI-for-Age
and Weight-for-Length in Children 0 to 2 Years. Pediatrics.
2016;138(1):e20153809
WHAT’S KNOWN ON THIS SUBJECT: BMI-for-
age growth charts are now available for
growth monitoring in children younger than 2
years, although weight-for-length remains the
recommended approach. If BMI-for-age performs
similarly to weight-for-length, practitioners could
use the same metric from birth to adulthood.
WHAT THIS STUDY ADDS: Agreement between
weight-for-length and BMI-for-age is very high, with
most misclassifi cations close to the percentile
cutoffs. BMI-for-age appears to be an appropriate
anthropometric alternative in children <2 years.
by guest on February 15, 2019www.aappublications.org/newsDownloaded from
FURLONG et al
Growth monitoring continues
to be the most valuable clinical
and public health tool to monitor
growth and assess the health and
nutritional status of children.1, 2
Growth monitoring of children 0
to 18 years old in primary care is
recommended by numerous expert
bodies worldwide.3–6 In 2006, the
World Health Organization (WHO)
endorsed new growth reference
charts that were constructed from
the monitoring of growth, in a
longitudinal manner, of healthy,
singleton, term-born children in 6
ethnically diverse countries.7, 8
These charts represent ideal
growth in children under optimal
environmental conditions for growth
and have percentile cutoffs that can
be used to classify weight status7, 9
(eg, wasting, overweight, obesity)
that may be practical for growth
monitoring and screening.10–12
Currently, it is recommended that
clinicians assess weight status by
calculating and plotting weight-
for-length in children 0 to <2 years
of age, and then transition to BMI-
for-age in children 2 years of age
and older.3, 13 However, the WHO
Child Growth Standards (2006)
also includes BMI-for-age growth
reference charts for children <2 years
that were not previously available.14
Using 1 tool, such as BMI-for-age,
would give clinicians the ability to
use BMI from birth to adulthood,
track growth trajectories using 1
metric, and avoid the transition
between differing measures after 2
years of age.
The association between weight-for-
length and BMI-for-age in children
<2 years has been explored by others,
but with some limitations.15–17
Similarities in prevalence have been
reported for some (eg, underweight,
overweight, obesity), but not all,
weight status categories when
comparing weight-for-length and
BMI-for-age.16, 17 One study also
reported a good correlation (r = 0.83,
P < .0001) between the 2 measures,
but included children with chronic
diseases and preterm infants in their
comparison.15
Recent studies also suggest
the importance of comparing
agreement between research- and
routinely collected anthropometric
measurements.18, 19 Several pediatric
studies report small differences for
height (∼0.3 – 0.9 cm) and weight
(∼0.01 – 0.04 kg) alone, 20, 21
exemplifying the ability to use
primary care data for population
growth monitoring. It is unknown
whether the agreement between
weight-for-length and BMI-for-age
differs among these data sources.
The primary objective of this study
was to determine the agreement
between weight-for-length and
BMI-for-age in healthy, term-
born children aged 0 to <2 years
using research-collected data.
The secondary objectives were to
examine if age, sex, and weight status
category affect agreement, and if
agreement differs between research-
and routinely collected data.
METHODS
Study Design
Cross-sectional data were collected
through the TARGet Kids! (The
Applied Research Group for Kids)
primary care practice-based
research network in Toronto,
Ontario, Canada. TARGet Kids!
is a collaboration between child
health researchers in the Faculty
of Medicine at the University of
Toronto and primary care physicians
in the university’s Department of
Pediatrics and Department of Family
and Community Medicine. Details
of study recruitment, including
study protocol, have been described
previously.22 The study was
approved by the Hospital for Sick
Children and St Michael’s Hospital
Research Ethics Boards. All parents
of participating children provided
written, informed consent to
participate in the study.
Participants
Children 0 to <2 years were recruited
from 9 pediatric or family medicine
primary care practices during
scheduled well-child visits between
December 2008 and October 2014
(n = 1632). In this study, children
were included if a weight and length
measurement had been obtained
by a trained research assistant on
the same day at any well-child visit
between 0 and 2 years of age. We
excluded children with gestational
age <37 weeks, birth weight <1500 g,
a health condition affecting growth
(eg, failure to thrive, cystic fibrosis),
a chronic illness (except asthma),
severe developmental delay, or the
absence of a parent and/or guardian
fluent in English.
Data Collection
Trained research assistants at each
primary care practice collected
demographic information from
parents by using a standardized
data collection form adapted from
the Canadian Community Health
Survey.23 Demographic information
included age, sex, and maternal
ethnicity. Ethnicity was classified
using a close-ended maternal
ethnicity question designed and
validated by the TARGet Kids!
Collaboration that states: “What
were the ethnic or cultural origins of
your child’s ancestors? (An ancestor
is usually more distinct than a
grandparent.)”24 Response categories
(described elsewhere)22, 24 were
then collapsed into the following
subcategories: European; East, South,
and Southeast Asian; African and
Caribbean; Latin American; West
Asian, Arab, and North African; and
Mixed.
Anthropometric Measurements
Research-collected data included
weight and length measurements
obtained by trained research
2 by guest on February 15, 2019www.aappublications.org/newsDownloaded from
PEDIATRICS Volume 138 , number 1 , July 2016
assistants during a scheduled
well-child visit (ie, a research
visit). Standardized measurement
techniques were used for all
research-collected data; weight (kg)
was measured using a precision
digital scale (± 0.025%; Seca,
Hamburg, Germany), and length (cm)
was measured to the nearest 0.1
cm with a calibrated length board.
Routinely collected data included
weight and length measurements
performed without the presence
of a trained research assistant, and
abstracted from the primary care
health records of these enrolled
children from any other health care
visit. The method of weight and
length ascertainment, including
adherence to recommended
protocols, including the use of
standardized equipment, calibrated
length boards, measurement by
various team members, such as clinic
nurse, physician, or other health care
professional during these visits was
unknown. Research and routine visits
did not occur on the same date. For
both research and routine visits, data
from multiple visits were available
for each child and were included (ie,
repeated measures).
BMI (kg/m2) was calculated as
weight divided by the square of
length.25, 26 Age- and sex-specific
percentiles and the corresponding
z-scores were determined by
using the WHO Child Growth
Standards (2006) for both weight-
for-length and BMI-for-age.3, 27
Percentiles and z-scores were
electronically computed by using
WHO Anthro software (www. who.
int/ childgrowth/ software/ en/ ).
Z-scores were classified into weight
status categories by using the
following percentile cutoffs: severely
underweight (z < 0.1st), underweight
(z < 3rd), normal (3rd ≤ z ≤85th
percentile), at-risk overweight
(z >85th), overweight (z >97th), and
obese (z >99.9th). These cutoffs are
used to describe growth in children 0
to <2 years of age by using the WHO
Child Growth Standards.3
Data Cleaning and Identifying Outliers
Data were assessed for quality by
first identifying weight-for-length
and BMI-for-age z scores < −4.0
and > −5.0.1 For observations with
these values, we reviewed health
records to compare with available
data on previous or subsequent
well-child visits within 2 years. Data
points were removed if there was
a ±1 SD difference from a previous
or subsequent visit. If there was no
previous or subsequent visit, the data
point was also removed.
Statistical Analysis
Descriptive statistics, including
frequency distributions for
categorical variables (eg, age, sex,
ethnicity) and mean (±SD) and
median (interquartile range) for
continuous variables (eg, age,
weight-for-length, and BMI-for-age)
are presented. A Pearson χ2 test
was used to detect the difference in
proportions between weight status
categories.
For our primary analysis, the overall
degree of agreement between
weight-for-length and BMI-for-
age (as continuous variables)
for research-collected data were
evaluated by using a Pearson
correlation coefficient and visually
examined agreement by using a
Bland-Altman plot (with 95% limits
of agreement).
For our secondary analysis, we
evaluated the Pearson correlation
coefficients stratified by age, sex,
and weight status categories. The
McNemar χ2 test was used to test
the difference in the proportion of
observations classified into each
weight status category by using
weight-for-length or BMI-for-age
(eg, an observation classified as
normal weight status using weight-
for-length, but overweight using
BMI-for-age). A scatterplot of
weight-for-length and BMI-for-age
was graphed to visually inspect
misclassification between growth
status categories. Sensitivity,
specificity, positive predictive values
(PPV), and negative predictive
values (NPV) were also calculated
to determine the influence of weight
status category by using weight-
for-length as the criterion measure.
Weight-for-length was selected as
the criterion measures because it is
the currently recommended method
of growth monitoring in this age
group.3, 13
All descriptive statistics and analyses
described previously were then
conducted for routinely collected
data to determine the difference in
agreement between research- and
routinely collected data. All data were
analyzed by using R v.3.0.3 (Murray
Hill, NJ). All hypotheses were
2-sided and P < .05 was considered
statistically significant.
RESULTS
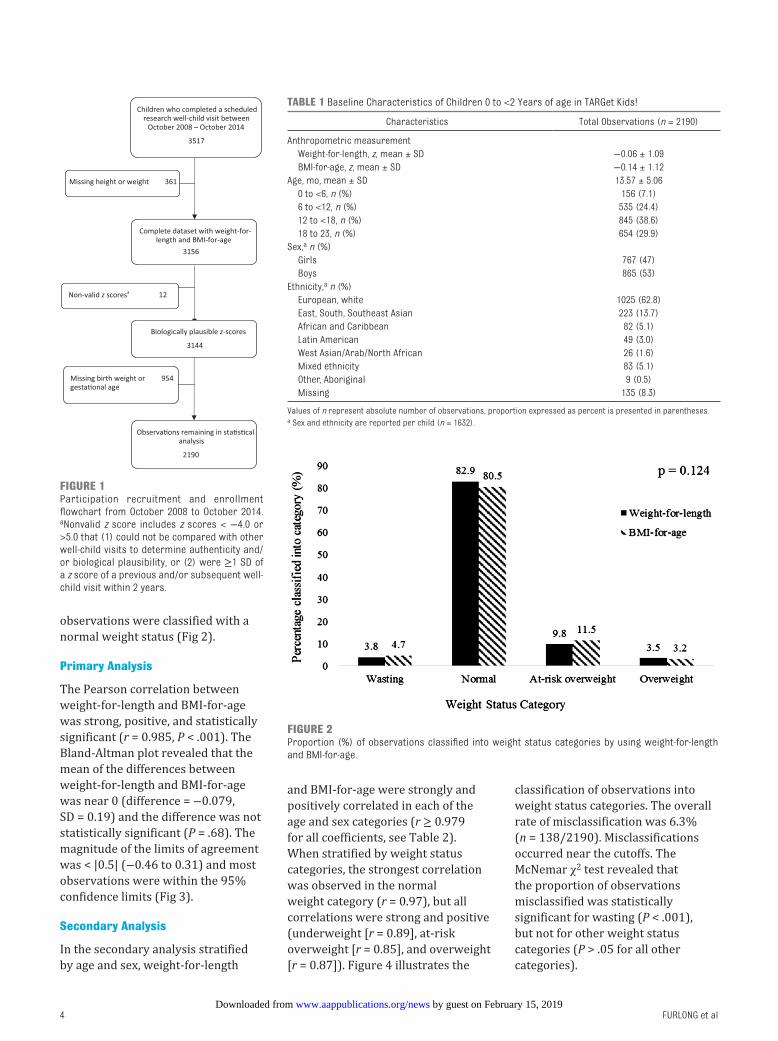
A total of 1632 children aged 0 to <2
years were enrolled in TARGet Kids!
between October 2008 and October
2014. Measurements from 3517
research well-child visits from these
children were available for analysis.
After the exclusion of missing data
points (height, weight, gestational
age, and birth weight) and nonvalid
z scores, 2190 observations remained
for inclusion in the analysis (see
Fig 1). Children were of mainly
European descent (62.8%), although
the population was ethnically
diverse and boys comprised 53.6%
of the children (Table 1). Of the
observations included, the median
age was 13.6 months (SD = 5.06).
The mean weight-for-length z score
was −0.06 (SD = 1.09); the mean
BMI-for-age z score was −0.14
(SD = 1.12, Table 1). The proportion of
observations classified with a normal
weight status by using weight-for-
length was 82.9% (n = 1815). For
BMI-for-age, 80.5% (n = 1764) of
3 by guest on February 15, 2019www.aappublications.org/newsDownloaded from
FURLONG et al
observations were classified with a
normal weight status (Fig 2).
Primary Analysis
The Pearson correlation between
weight-for-length and BMI-for-age
was strong, positive, and statistically
significant (r = 0.985, P < .001). The
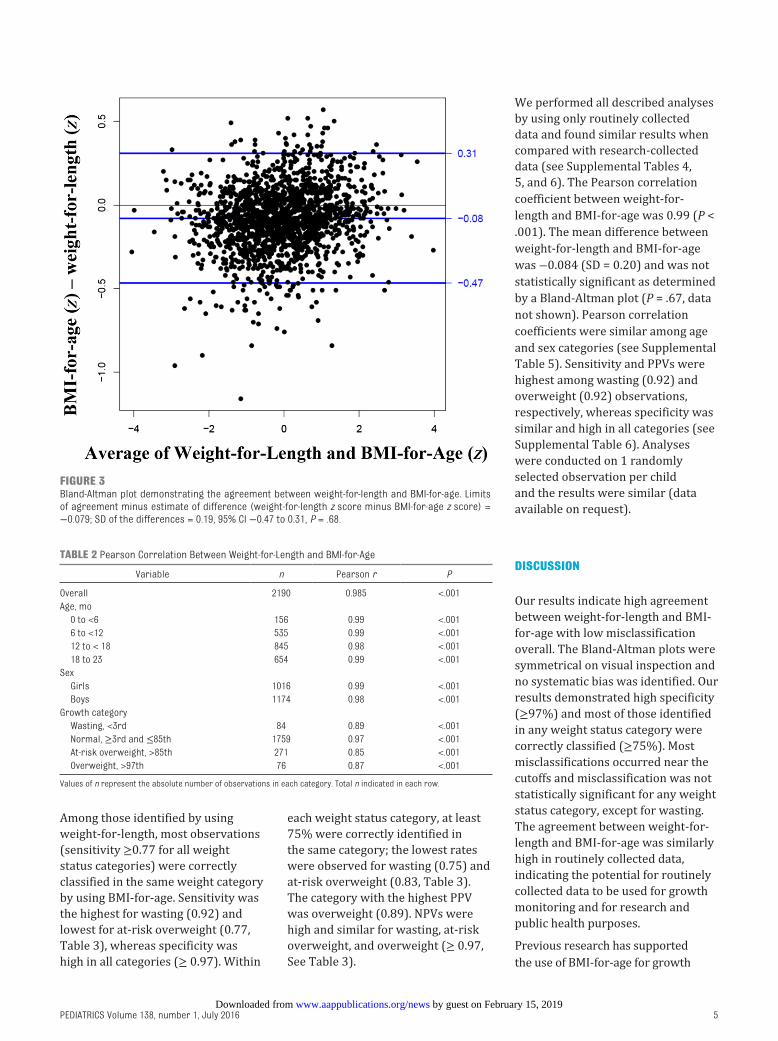
Bland-Altman plot revealed that the
mean of the differences between
weight-for-length and BMI-for-age
was near 0 (difference = −0.079,
SD = 0.19) and the difference was not
statistically significant (P = .68). The
magnitude of the limits of agreement
was < |0.5| (−0.46 to 0.31) and most
observations were within the 95%
confidence limits (Fig 3).
Secondary Analysis
In the secondary analysis stratified
by age and sex, weight-for-length
and BMI-for-age were strongly and
positively correlated in each of the
age and sex categories (r ≥ 0.979
for all coefficients, see Table 2).
When stratified by weight status
categories, the strongest correlation
was observed in the normal
weight category (r = 0.97), but all
correlations were strong and positive
(underweight [r = 0.89], at-risk
overweight [r = 0.85], and overweight
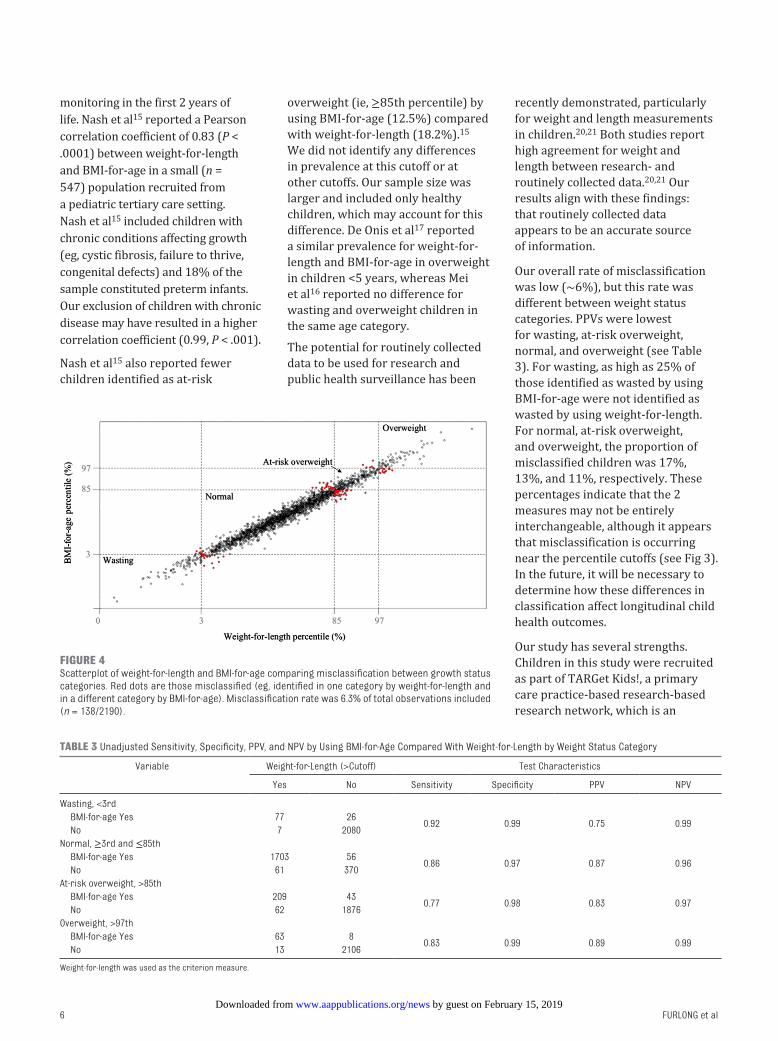
[r = 0.87]). Figure 4 illustrates the
classification of observations into
weight status categories. The overall
rate of misclassification was 6.3%
(n = 138/2190). Misclassifications
occurred near the cutoffs. The
McNemar χ2 test revealed that
the proportion of observations
misclassified was statistically
significant for wasting (P < .001),
but not for other weight status
categories (P > .05 for all other
categories).
4
FIGURE 1Participation recruitment and enrollment fl owchart from October 2008 to October 2014. aNonvalid z score includes z scores < −4.0 or >5.0 that (1) could not be compared with other well-child visits to determine authenticity and/or biological plausibility, or (2) were ≥1 SD of a z score of a previous and/or subsequent well-child visit within 2 years.
TABLE 1 Baseline Characteristics of Children 0 to <2 Years of age in TARGet Kids!
Characteristics Total Observations (n = 2190)
Anthropometric measurement
Weight-for-length, z, mean ± SD −0.06 ± 1.09
BMI-for-age, z, mean ± SD −0.14 ± 1.12
Age, mo, mean ± SD 13.57 ± 5.06
0 to <6, n (%) 156 (7.1)
6 to <12, n (%) 535 (24.4)
12 to <18, n (%) 845 (38.6)
18 to 23, n (%) 654 (29.9)
Sex, a n (%)
Girls 767 (47)
Boys 865 (53)
Ethnicity, a n (%)
European, white 1025 (62.8)
East, South, Southeast Asian 223 (13.7)
African and Caribbean 82 (5.1)
Latin American 49 (3.0)
West Asian/Arab/North African 26 (1.6)
Mixed ethnicity 83 (5.1)
Other, Aboriginal 9 (0.5)
Missing 135 (8.3)
Values of n represent absolute number of observations, proportion expressed as percent is presented in parentheses.a Sex and ethnicity are reported per child (n = 1632).
FIGURE 2Proportion (%) of observations classifi ed into weight status categories by using weight-for-length and BMI-for-age.
by guest on February 15, 2019www.aappublications.org/newsDownloaded from
PEDIATRICS Volume 138 , number 1 , July 2016
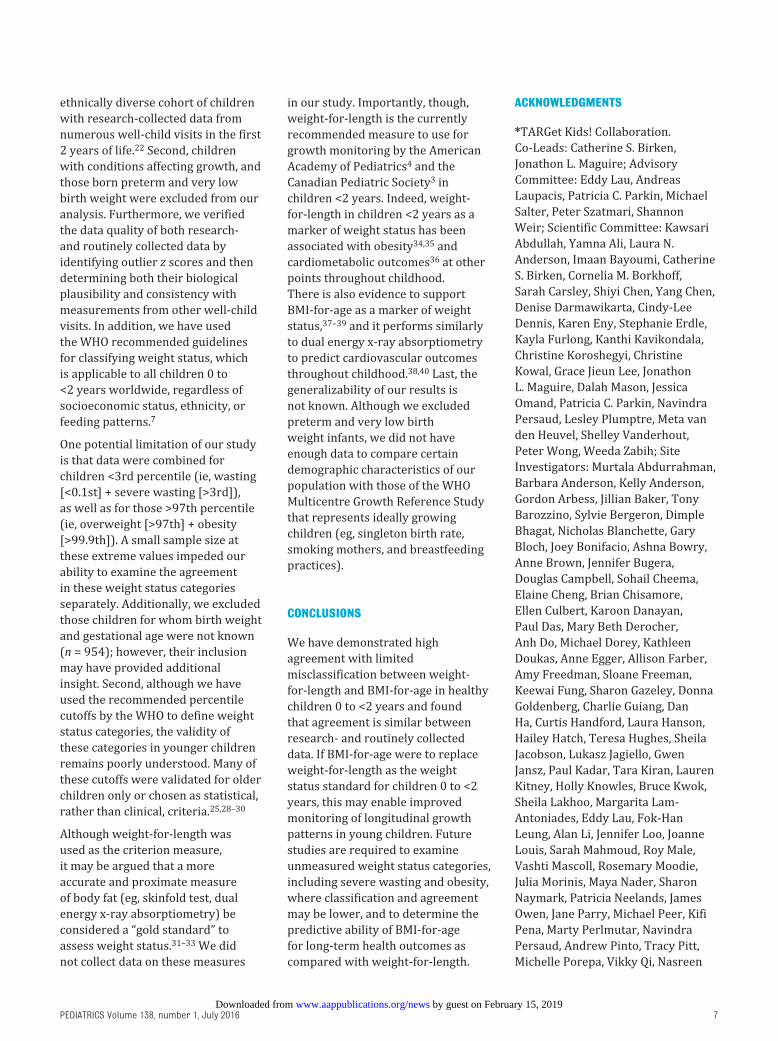
Among those identified by using
weight-for-length, most observations
(sensitivity ≥0.77 for all weight
status categories) were correctly
classified in the same weight category
by using BMI-for-age. Sensitivity was
the highest for wasting (0.92) and
lowest for at-risk overweight (0.77,
Table 3), whereas specificity was
high in all categories (≥ 0.97). Within
each weight status category, at least
75% were correctly identified in
the same category; the lowest rates
were observed for wasting (0.75) and
at-risk overweight (0.83, Table 3).
The category with the highest PPV
was overweight (0.89). NPVs were
high and similar for wasting, at-risk
overweight, and overweight (≥ 0.97,
See Table 3).
We performed all described analyses
by using only routinely collected
data and found similar results when
compared with research-collected
data (see Supplemental Tables 4,
5, and 6). The Pearson correlation
coefficient between weight-for-
length and BMI-for-age was 0.99 (P <
.001). The mean difference between
weight-for-length and BMI-for-age
was −0.084 (SD = 0.20) and was not
statistically significant as determined
by a Bland-Altman plot (P = .67, data
not shown). Pearson correlation
coefficients were similar among age
and sex categories (see Supplemental
Table 5). Sensitivity and PPVs were
highest among wasting (0.92) and
overweight (0.92) observations,
respectively, whereas specificity was
similar and high in all categories (see
Supplemental Table 6). Analyses
were conducted on 1 randomly
selected observation per child
and the results were similar (data
available on request).
DISCUSSION
Our results indicate high agreement
between weight-for-length and BMI-
for-age with low misclassification
overall. The Bland-Altman plots were
symmetrical on visual inspection and
no systematic bias was identified. Our
results demonstrated high specificity
(≥97%) and most of those identified
in any weight status category were
correctly classified (≥75%). Most
misclassifications occurred near the
cutoffs and misclassification was not
statistically significant for any weight
status category, except for wasting.
The agreement between weight-for-
length and BMI-for-age was similarly
high in routinely collected data,
indicating the potential for routinely
collected data to be used for growth
monitoring and for research and
public health purposes.
Previous research has supported
the use of BMI-for-age for growth
5
FIGURE 3Bland-Altman plot demonstrating the agreement between weight-for-length and BMI-for-age. Limits of agreement minus estimate of difference (weight-for-length z score minus BMI-for-age z score) = −0.079; SD of the differences = 0.19, 95% CI −0.47 to 0.31, P = .68.
TABLE 2 Pearson Correlation Between Weight-for-Length and BMI-for-Age
Variable n Pearson r P
Overall 2190 0.985 <.001
Age, mo
0 to <6 156 0.99 <.001
6 to <12 535 0.99 <.001
12 to < 18 845 0.98 <.001
18 to 23 654 0.99 <.001
Sex
Girls 1016 0.99 <.001
Boys 1174 0.98 <.001
Growth category
Wasting, <3rd 84 0.89 <.001
Normal, ≥3rd and ≤85th 1759 0.97 <.001
At-risk overweight, >85th 271 0.85 <.001
Overweight, >97th 76 0.87 <.001
Values of n represent the absolute number of observations in each category. Total n indicated in each row.
by guest on February 15, 2019www.aappublications.org/newsDownloaded from
FURLONG et al
monitoring in the first 2 years of
life. Nash et al15 reported a Pearson
correlation coefficient of 0.83 (P <
.0001) between weight-for-length
and BMI-for-age in a small (n =
547) population recruited from
a pediatric tertiary care setting.
Nash et al15 included children with
chronic conditions affecting growth
(eg, cystic fibrosis, failure to thrive,
congenital defects) and 18% of the
sample constituted preterm infants.
Our exclusion of children with chronic
disease may have resulted in a higher
correlation coefficient (0.99, P < .001).
Nash et al15 also reported fewer
children identified as at-risk
overweight (ie, ≥85th percentile) by
using BMI-for-age (12.5%) compared
with weight-for-length (18.2%).15
We did not identify any differences
in prevalence at this cutoff or at
other cutoffs. Our sample size was
larger and included only healthy
children, which may account for this
difference. De Onis et al17 reported
a similar prevalence for weight-for-
length and BMI-for-age in overweight
in children <5 years, whereas Mei
et al16 reported no difference for
wasting and overweight children in
the same age category.
The potential for routinely collected
data to be used for research and
public health surveillance has been
recently demonstrated, particularly
for weight and length measurements
in children.20, 21 Both studies report
high agreement for weight and
length between research- and
routinely collected data.20, 21 Our
results align with these findings:
that routinely collected data
appears to be an accurate source
of information.
Our overall rate of misclassification
was low (∼6%), but this rate was
different between weight status
categories. PPVs were lowest
for wasting, at-risk overweight,
normal, and overweight (see Table
3). For wasting, as high as 25% of
those identified as wasted by using
BMI-for-age were not identified as
wasted by using weight-for-length.
For normal, at-risk overweight,
and overweight, the proportion of
misclassified children was 17%,
13%, and 11%, respectively. These
percentages indicate that the 2
measures may not be entirely
interchangeable, although it appears
that misclassification is occurring
near the percentile cutoffs (see Fig 3).
In the future, it will be necessary to
determine how these differences in
classification affect longitudinal child
health outcomes.
Our study has several strengths.
Children in this study were recruited
as part of TARGet Kids!, a primary
care practice-based research-based
research network, which is an
6
FIGURE 4Scatterplot of weight-for-length and BMI-for-age comparing misclassifi cation between growth status categories. Red dots are those misclassifi ed (eg, identifi ed in one category by weight-for-length and in a different category by BMI-for-age). Misclassifi cation rate was 6.3% of total observations included (n = 138/2190).
TABLE 3 Unadjusted Sensitivity, Specifi city, PPV, and NPV by Using BMI-for-Age Compared With Weight-for-Length by Weight Status Category
Variable Weight-for-Length (>Cutoff) Test Characteristics
Yes No Sensitivity Specifi city PPV NPV
Wasting, <3rd
BMI-for-age Yes 77 260.92 0.99 0.75 0.99
No 7 2080
Normal, ≥3rd and ≤85th
BMI-for-age Yes 1703 560.86 0.97 0.87 0.96
No 61 370
At-risk overweight, >85th
BMI-for-age Yes 209 430.77 0.98 0.83 0.97
No 62 1876
Overweight, >97th
BMI-for-age Yes 63 80.83 0.99 0.89 0.99
No 13 2106
Weight-for-length was used as the criterion measure.
by guest on February 15, 2019www.aappublications.org/newsDownloaded from
PEDIATRICS Volume 138 , number 1 , July 2016
ethnically diverse cohort of children
with research-collected data from
numerous well-child visits in the first
2 years of life.22 Second, children
with conditions affecting growth, and
those born preterm and very low
birth weight were excluded from our
analysis. Furthermore, we verified
the data quality of both research-
and routinely collected data by
identifying outlier z scores and then
determining both their biological
plausibility and consistency with
measurements from other well-child
visits. In addition, we have used
the WHO recommended guidelines
for classifying weight status, which
is applicable to all children 0 to
<2 years worldwide, regardless of
socioeconomic status, ethnicity, or
feeding patterns.7
One potential limitation of our study
is that data were combined for
children <3rd percentile (ie, wasting
[<0.1st] + severe wasting [>3rd]),
as well as for those >97th percentile
(ie, overweight [>97th] + obesity
[>99.9th]). A small sample size at
these extreme values impeded our
ability to examine the agreement
in these weight status categories
separately. Additionally, we excluded
those children for whom birth weight
and gestational age were not known
(n = 954); however, their inclusion
may have provided additional
insight. Second, although we have
used the recommended percentile
cutoffs by the WHO to define weight
status categories, the validity of
these categories in younger children
remains poorly understood. Many of
these cutoffs were validated for older
children only or chosen as statistical,
rather than clinical, criteria.25, 28–30
Although weight-for-length was
used as the criterion measure,
it may be argued that a more
accurate and proximate measure
of body fat (eg, skinfold test, dual
energy x-ray absorptiometry) be
considered a “gold standard” to
assess weight status.31–33 We did
not collect data on these measures
in our study. Importantly, though,
weight-for-length is the currently
recommended measure to use for
growth monitoring by the American
Academy of Pediatrics4 and the
Canadian Pediatric Society3 in
children <2 years. Indeed, weight-
for-length in children <2 years as a
marker of weight status has been
associated with obesity34, 35 and
cardiometabolic outcomes36 at other
points throughout childhood.
There is also evidence to support
BMI-for-age as a marker of weight
status, 37–39 and it performs similarly
to dual energy x-ray absorptiometry
to predict cardiovascular outcomes
throughout childhood.38, 40 Last, the
generalizability of our results is
not known. Although we excluded
preterm and very low birth
weight infants, we did not have
enough data to compare certain
demographic characteristics of our
population with those of the WHO
Multicentre Growth Reference Study
that represents ideally growing
children (eg, singleton birth rate,
smoking mothers, and breastfeeding
practices).
CONCLUSIONS
We have demonstrated high
agreement with limited
misclassification between weight-
for-length and BMI-for-age in healthy
children 0 to <2 years and found
that agreement is similar between
research- and routinely collected
data. If BMI-for-age were to replace
weight-for-length as the weight
status standard for children 0 to <2
years, this may enable improved
monitoring of longitudinal growth
patterns in young children. Future
studies are required to examine
unmeasured weight status categories,
including severe wasting and obesity,
where classification and agreement
may be lower, and to determine the
predictive ability of BMI-for-age
for long-term health outcomes as
compared with weight-for-length.
ACKNOWLEDGMENTS
*TARGet Kids! Collaboration.
Co-Leads: Catherine S. Birken,
Jonathon L. Maguire; Advisory
Committee: Eddy Lau, Andreas
Laupacis, Patricia C. Parkin, Michael
Salter, Peter Szatmari, Shannon
Weir; Scientific Committee: Kawsari
Abdullah, Yamna Ali, Laura N.
Anderson, Imaan Bayoumi, Catherine
S. Birken, Cornelia M. Borkhoff,
Sarah Carsley, Shiyi Chen, Yang Chen,
Denise Darmawikarta, Cindy-Lee
Dennis, Karen Eny, Stephanie Erdle,
Kayla Furlong, Kanthi Kavikondala,
Christine Koroshegyi, Christine
Kowal, Grace Jieun Lee, Jonathon
L. Maguire, Dalah Mason, Jessica
Omand, Patricia C. Parkin, Navindra
Persaud, Lesley Plumptre, Meta van
den Heuvel, Shelley Vanderhout,
Peter Wong, Weeda Zabih; Site
Investigators: Murtala Abdurrahman,
Barbara Anderson, Kelly Anderson,
Gordon Arbess, Jillian Baker, Tony
Barozzino, Sylvie Bergeron, Dimple
Bhagat, Nicholas Blanchette, Gary
Bloch, Joey Bonifacio, Ashna Bowry,
Anne Brown, Jennifer Bugera,
Douglas Campbell, Sohail Cheema,
Elaine Cheng, Brian Chisamore,
Ellen Culbert, Karoon Danayan,
Paul Das, Mary Beth Derocher,
Anh Do, Michael Dorey, Kathleen
Doukas, Anne Egger, Allison Farber,
Amy Freedman, Sloane Freeman,
Keewai Fung, Sharon Gazeley, Donna
Goldenberg, Charlie Guiang, Dan
Ha, Curtis Handford, Laura Hanson,
Hailey Hatch, Teresa Hughes, Sheila
Jacobson, Lukasz Jagiello, Gwen
Jansz, Paul Kadar, Tara Kiran, Lauren
Kitney, Holly Knowles, Bruce Kwok,
Sheila Lakhoo, Margarita Lam-
Antoniades, Eddy Lau, Fok-Han
Leung, Alan Li, Jennifer Loo, Joanne
Louis, Sarah Mahmoud, Roy Male,
Vashti Mascoll, Rosemary Moodie,
Julia Morinis, Maya Nader, Sharon
Naymark, Patricia Neelands, James
Owen, Jane Parry, Michael Peer, Kifi
Pena, Marty Perlmutar, Navindra
Persaud, Andrew Pinto, Tracy Pitt,
Michelle Porepa, Vikky Qi, Nasreen
7 by guest on February 15, 2019www.aappublications.org/newsDownloaded from
FURLONG et al
Ramji, Noor Ramji, Jesleen Rana,
Alana Rosenthal, Katherine Rouleau,
Janet Saunderson, Rahul Saxena,
Vanna Schiralli, Michael Sgro, Susan
Shepherd, Hafiz Shuja, Barbara
Smiltnieks, Cinntha Srikanthan,
Carolyn Taylor, Suzanne Turner,
Fatima Uddin, Joanne Vaughan,
Thea Weisdorf, Sheila Wijayasinghe,
Peter Wong, Anne Wormsbecker,
Ethel Ying, Elizabeth Young, Michael
Zajdman, Ian Zenlea; Research
Team: Charmaine Camacho, Arthana
Chandraraj, Dharma Dalwadi,
Ayesha Islam, Thivia Jegathesan,
Tarandeep Malhi, Megan Smith,
Laurie Thompson; Applied Health
Research Center: Christopher Allen,
Bryan Boodhoo, Judith Hall, Peter
Juni, Gerald Lebovic, Karen Pope,
Jodi Shim, Kevin Thorpe; Mount Sinai
Services Laboratory: Azar Azad.
We thank all of the participating
families for their time and
involvement in TARGet Kids! and are
grateful to all practitioners who are
currently involved in the TARGet Kids!
practice-based research network.
REFERENCES
1. World Health Organization. Physical
status: the use and interpretation of
anthropometry. Report of a WHO Expert
Committee. World Health Organ Tech
Rep Ser. 1995;854:1–452
2. de Onis M, Habicht JP. Anthropometric
reference data for international
use: recommendations from a
World Health Organization Expert
Committee. Am J Clin Nutr. 1996;64(4):
650–658
3. Dietitians of Canada, Canadian
Paediatric Society, College of Family
Physicians of Canada, Community
Health Nurses of Canada, Secker D.
Promoting optimal monitoring of child
growth in Canada: using the new WHO
growth charts. Can J Diet Pract Res.
2010;71(1):e1–e3
4. Grummer-Strawn LM, Reinold C, Krebs
NF; Centers for Disease Control and
Prevention (CDC). Use of World Health
Organization and CDC growth charts
for children aged 0-59 months in the
United States. MMWR Recomm Rep.
2010;59(RR-9):1–15
5. James DC, Lessen R; American Dietetic
Association. Position of the American
Dietetic Association: promoting and
supporting breastfeeding. J Am Diet
Assoc. 2009;109(11):1926–1942
6. Canadian Task Force on Preventive
Health Care. Recommendations
for growth monitoring, and
prevention and management of
overweight and obesity in children
and youth in primary care. CMAJ.
2015;187(6):411–421
7. WHO Multicentre Growth Reference
Study Group. WHO Child Growth
Standards based on length/height,
weight and age. Acta Paediatr Suppl.
2006;450:76–85
8. de Onis M, Garza C, Victora CG,
Onyango AW, Frongillo EA, Martines J.
The WHO Multicentre Growth
Reference Study: planning, study
design, and methodology. Food
Nutr Bull. 2004;25(1 Suppl):
S15–S26
9. de Onis M, Lobstein T. Defi ning
obesity risk status in the general
childhood population: which cut-offs
should we use? Int J Pediatr Obes.
2010;5(6):458–460
10. Neira M, de Onis M. The Spanish
strategy for nutrition, physical activity
and the prevention of obesity. Br J
Nutr. 2006;96(suppl 1):S8–S11
11. de Onis M. Preventing childhood
overweight and obesity. J Pediatr (Rio
J). 2015;91(2):105–107
12. de Onis M, Martínez-Costa C, Núñez F,
Nguefack-Tsague G, Montal A, Brines J.
Association between WHO cut-offs
for childhood overweight and
obesity and cardiometabolic risk.
Public Health Nutr. 2013;16(4):
625–630
13. Gibson R. Principles of Nutritional
Assessment. 2nd ed. New York, NY:
Oxford University Press; 2005
8
ABBREVIATIONS
NPV: negative predictive value
PPV: positive predictive value
TARGet Kids!: The Applied
Research Group
for Kids!
WHO: World Health Organization
Address correspondence to Catherine Birken, MD, Child Health and Evaluative Sciences, Research Institute, Division of Paediatric Medicine, Department of
Paediatrics, The Hospital for Sick Children, Rm 109801, 10th Fl, Peter Gilgan Centre for Research and Learning, 686 Bay St, Toronto, ON M5H 0A4 Canada. E-mail:
PEDIATRICS (ISSN Numbers: Print, 0031-4005; Online, 1098-4275).
Copyright © 2016 by the American Academy of Pediatrics
FINANCIAL DISCLOSURE: The authors have indicated they have no fi nancial relationships relevant to this article to disclose.
FUNDING: Funding of the TARGet Kids! research network was provided by the Canadian Institutes of Health Research Institute of Human Development, Child and
Youth Health, the Canadian Institutes of Health Research Institute of Nutrition, Metabolism and Diabetes, the SickKids Foundation, and the St. Michael’s Hospital
Foundation. The Paediatric Outcomes Research Team is supported by a grant from The Hospital for Sick Children Foundation. The funding agencies had no role
in the design and conduct of the study, the collection, management, analysis and interpretation of the data, or the preparation, review, and approval of the
manuscript.
POTENTIAL CONFLICT OF INTEREST: The authors have indicated they have no potential confl icts of interest to disclose.
by guest on February 15, 2019www.aappublications.org/newsDownloaded from
PEDIATRICS Volume 138 , number 1 , July 2016
14. WHO Multicentre Growth Reference
Study Group. WHO Child Growth
Standards: Length/Height-for-
Age, Weight-for-Age, Weight-for-
Length, Weight-for-Height and Body
Mass Index-for-Age: Methods and
Development. Geneva, Switzerland:
World Health Organization; 2006
15. Nash A, Secker D, Corey M, Dunn
M, O’Connor DL. Field testing of the
2006 World Health Organization
growth charts from birth to 2 years:
assessment of hospital undernutrition
and overnutrition rates and the
usefulness of BMI. JPEN J Parenter
Enteral Nutr. 2008;32(2):145–153
16. Mei Z, Ogden CL, Flegal KM, Grummer-
Strawn LM. Comparison of the
prevalence of shortness, underweight,
and overweight among US children
aged 0 to 59 months by using the CDC
2000 and the WHO 2006 growth charts.
J Pediatr. 2008;153(5):622–628
17. de Onis M, Blössner M, Borghi E. Global
prevalence and trends of overweight
and obesity among preschool children.
Am J Clin Nutr. 2010;92(5):1257–1264
18. Weiskopf NG, Weng C. Methods and
dimensions of electronic health record
data quality assessment: enabling
reuse for clinical research. J Am Med
Inform Assoc. 2013;20(1):144–151
19. Weiner MG, Embi PJ. Toward reuse
of clinical data for research and
quality improvement: the end of
the beginning? Ann Intern Med.
2009;151(5):359–360
20. Bryant M, Santorelli G, Fairley L, et al;
Born in Bradford Childhood Obesity
Scientifi c Group. Agreement between
routine and research measurement
of infant height and weight. Arch Dis
Child. 2015;100(1):24–29
21. Howe LD, Tilling K, Lawlor DA. Accuracy
of height and weight data from
child health records. Arch Dis Child.
2009;94(12):950–954
22. Carsley S, Borkhoff CM, Maguire JL, et
al; TARGet Kids! Collaboration Cohort
profi le: The Applied Research Group
for Kids (TARGet Kids!). Int J Epidemiol.
2015;44(3):776–788
23. Statistics Canada. Canadian
Community Health Survey 2010.
Available at: http:// www23. statcan. gc.
ca/ imdb- bmdi/ instrument/ 3226_ Q1_
V7- eng. pdf
24. Omand JA, Carsley S, Darling PB, et al;
TARGet Kids! Collaboration. Evaluating
the accuracy of a geographic
closed-ended approach to ethnicity
measurement, a practical alternative.
Ann Epidemiol. 2014;24(4):246–253
25. Mei Z, Grummer-Strawn LM, Pietrobelli
A, Goulding A, Goran MI, Dietz WH.
Validity of body mass index compared
with other body-composition screening
indexes for the assessment of body
fatness in children and adolescents.
Am J Clin Nutr. 2002;75(6):978–985
26. Pietrobelli A, Faith MS, Allison DB,
Gallagher D, Chiumello G, Heymsfi eld
SB. Body mass index as a measure
of adiposity among children and
adolescents: a validation study. J
Pediatr. 1998;132(2):204–210
27. de Onis M, Garza C, Victora CG. The
WHO Multicentre Growth Reference
Study: strategy for developing a new
international growth reference. Forum
Nutr. 2003;56:238–240
28. Waterlow JC, Buzina R, Keller W,
Lane JM, Nichaman MZ, Tanner JM.
The presentation and use of height
and weight data for comparing the
nutritional status of groups of children
under the age of 10 years. Bull World
Health Organ. 1977;55(4):489–498
29. Zhang Z, Lai HJ. Comparison of the
use of body mass index percentiles
and percentage of ideal body weight
to screen for malnutrition in children
with cystic fi brosis. Am J Clin Nutr.
2004;80(4):982–991
30. Onyango AW, de Onis M, Caroli M, et
al. Field-testing the WHO child growth
standards in four countries. J Nutr.
2007;137(1):149–152
31. Albanese CV, Diessel E, Genant
HK. Clinical applications of body
composition measurements using DXA.
J Clin Densitom. 2003;6(2):75–85
32. Hussain Z, Jafar T, Zaman MU, Parveen
R, Saeed F. Correlations of skin fold
thickness and validation of prediction
equations using DEXA as the gold
standard for estimation of body fat
composition in Pakistani children. BMJ
Open. 2014;4(4):e004194
33. Fields DA, Goran MI. Body composition
techniques and the four-compartment
model in children. J Appl Physiol
(1985). 2000;89(2):613–620
34. Rifas-Shiman SL, Gillman MW, Oken E,
Kleinman K, Taveras EM. Similarity of
the CDC and WHO weight-for-length
growth charts in predicting risk of
obesity at age 5 years. Obesity (Silver
Spring). 2012;20(6):1261–1265
35. Taveras EM, Rifas-Shiman SL, Belfort
MB, Kleinman KP, Oken E, Gillman MW.
Weight status in the fi rst 6 months
of life and obesity at 3 years of age.
Pediatrics. 2009;123(4):1177–1183
36. Belfort MB, Rifas-Shiman SL, Rich-
Edwards J, Kleinman KP, Gillman MW.
Size at birth, infant growth, and blood
pressure at three years of age. J
Pediatr. 2007;151(6):670–674
37. Dencker M, Thorsson O, Lindén C,
Wollmer P, Andersen LB, Karlsson
MK. BMI and objectively measured
body fat and body fat distribution in
prepubertal children. Clin Physiol
Funct Imaging. 2007;27(1):12–16
38. Steinberger J, Jacobs DR, Raatz
S, Moran A, Hong CP, Sinaiko
AR. Comparison of body fatness
measurements by BMI and skinfolds
vs dual energy X-ray absorptiometry
and their relation to cardiovascular
risk factors in adolescents. Int J Obes.
2005;29(11):1346–1352
39. Freedman DS, Wang J, Thornton JC,
et al. Classifi cation of body fatness by
body mass index-for-age categories
among children. Arch Pediatr Adolesc
Med. 2009;163(9):805–811
40. Lindsay RS, Hanson RL, Roumain
J, Ravussin E, Knowler WC,
Tataranni PA. Body mass index as
a measure of adiposity in children
and adolescents: relationship to
adiposity by dual energy x-ray
absorptiometry and to cardiovascular
risk factors. J Clin Endocrinol Metab.
2001;86(9):4061–4067
9 by guest on February 15, 2019www.aappublications.org/newsDownloaded from
DOI: 10.1542/peds.2015-3809 originally published online June 24, 2016; 2016;138;Pediatrics
behalf of the TARGet Kids! CollaborationParkin, Jonathon L. Maguire, Deborah L. O'Connor, Catherine S. Birken and on
Kayla R. Furlong, Laura N. Anderson, Huiying Kang, Gerald Lebovic, Patricia C.BMI-for-Age and Weight-for-Length in Children 0 to 2 Years
ServicesUpdated Information &
http://pediatrics.aappublications.org/content/138/1/e20153809including high resolution figures, can be found at:
Referenceshttp://pediatrics.aappublications.org/content/138/1/e20153809#BIBLThis article cites 34 articles, 9 of which you can access for free at:
Subspecialty Collections
http://www.aappublications.org/cgi/collection/obesity_new_subObesityine_subhttp://www.aappublications.org/cgi/collection/evidence-based_medicEvidence-Based Medicinefollowing collection(s): This article, along with others on similar topics, appears in the
Permissions & Licensing
http://www.aappublications.org/site/misc/Permissions.xhtmlin its entirety can be found online at: Information about reproducing this article in parts (figures, tables) or
Reprintshttp://www.aappublications.org/site/misc/reprints.xhtmlInformation about ordering reprints can be found online:
by guest on February 15, 2019www.aappublications.org/newsDownloaded from
DOI: 10.1542/peds.2015-3809 originally published online June 24, 2016; 2016;138;Pediatrics
behalf of the TARGet Kids! CollaborationParkin, Jonathon L. Maguire, Deborah L. O'Connor, Catherine S. Birken and on
Kayla R. Furlong, Laura N. Anderson, Huiying Kang, Gerald Lebovic, Patricia C.BMI-for-Age and Weight-for-Length in Children 0 to 2 Years
http://pediatrics.aappublications.org/content/138/1/e20153809located on the World Wide Web at:
The online version of this article, along with updated information and services, is
http://pediatrics.aappublications.org/content/suppl/2016/06/22/peds.2015-3809.DCSupplementalData Supplement at:
1073-0397. ISSN:60007. Copyright © 2016 by the American Academy of Pediatrics. All rights reserved. Print
the American Academy of Pediatrics, 141 Northwest Point Boulevard, Elk Grove Village, Illinois,has been published continuously since 1948. Pediatrics is owned, published, and trademarked by Pediatrics is the official journal of the American Academy of Pediatrics. A monthly publication, it
by guest on February 15, 2019www.aappublications.org/newsDownloaded from