Embed Size (px)
Citation preview
BOARD OF TRUSTEES
THE CITY UNIVERSITY OF NEW YORK
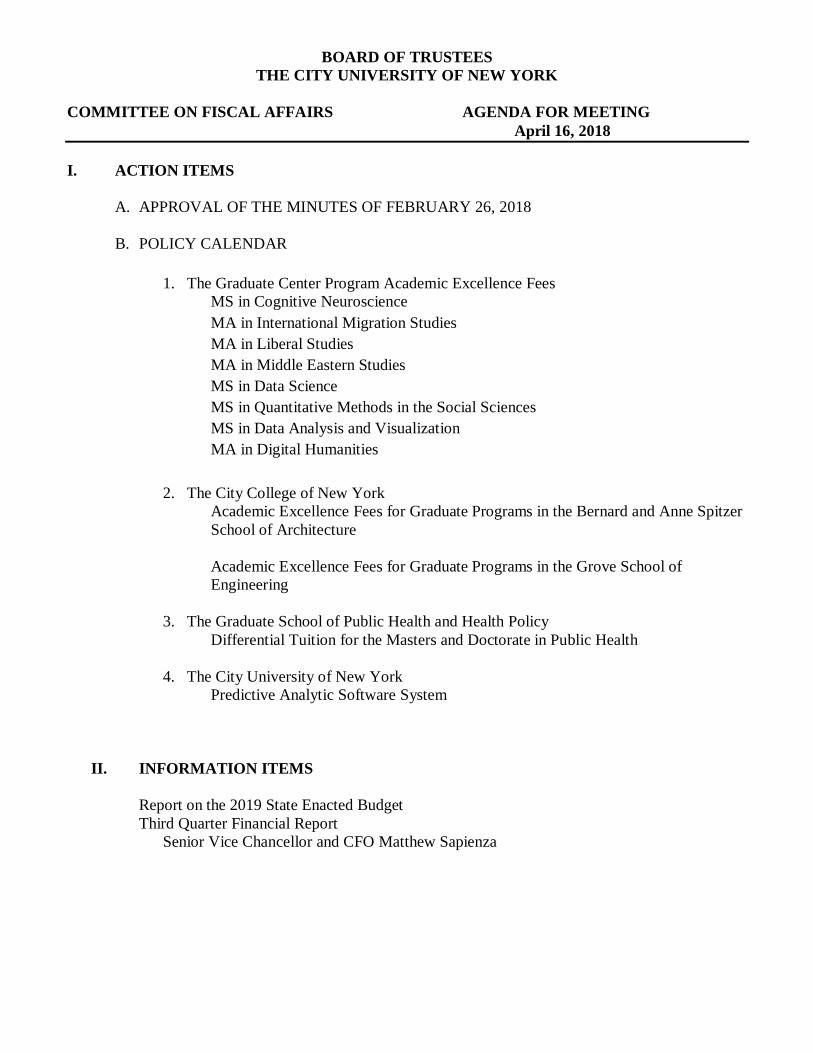
COMMITTEE ON FISCAL AFFAIRS AGENDA FOR MEETING
April 16, 2018
I. ACTION ITEMS
A. APPROVAL OF THE MINUTES OF FEBRUARY 26, 2018
B. POLICY CALENDAR
1. The Graduate Center Program Academic Excellence Fees
MS in Cognitive Neuroscience
MA in International Migration Studies
MA in Liberal Studies
MA in Middle Eastern Studies
MS in Data Science
MS in Quantitative Methods in the Social Sciences
MS in Data Analysis and Visualization
MA in Digital Humanities
2. The City College of New York
Academic Excellence Fees for Graduate Programs in the Bernard and Anne Spitzer
School of Architecture
Academic Excellence Fees for Graduate Programs in the Grove School of
Engineering
3. The Graduate School of Public Health and Health Policy
Differential Tuition for the Masters and Doctorate in Public Health
4. The City University of New York
Predictive Analytic Software System
II. INFORMATION ITEMS
Report on the 2019 State Enacted Budget
Third Quarter Financial Report
Senior Vice Chancellor and CFO Matthew Sapienza
BOARD OF TRUSTEES THE CITY UNIVERSITY OF NEW YORK
COMMITTEE ON MINUTES OF THE MEETING FISCAL AFFAIRS FEBRUARY 26, 2018
1
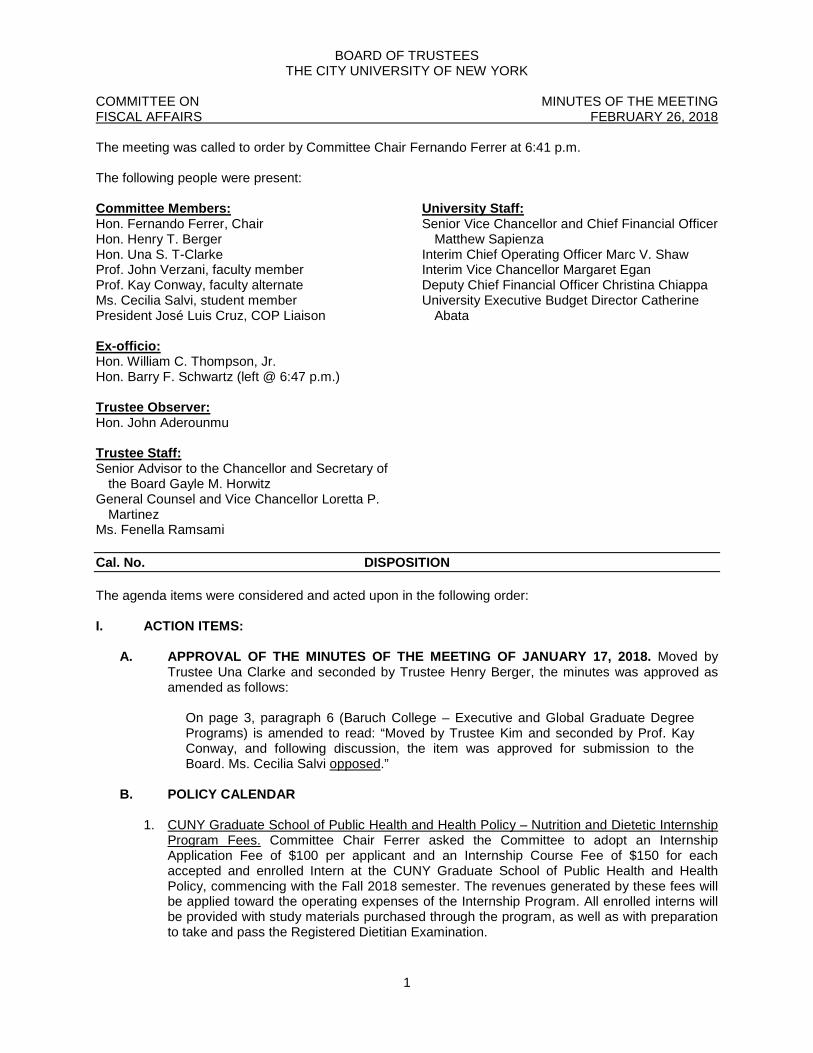
The meeting was called to order by Committee Chair Fernando Ferrer at 6:41 p.m. The following people were present: Committee Members: Hon. Fernando Ferrer, Chair Hon. Henry T. Berger Hon. Una S. T-Clarke Prof. John Verzani, faculty member Prof. Kay Conway, faculty alternate Ms. Cecilia Salvi, student member President José Luis Cruz, COP Liaison Ex-officio: Hon. William C. Thompson, Jr. Hon. Barry F. Schwartz (left @ 6:47 p.m.) Trustee Observer: Hon. John Aderounmu Trustee Staff: Senior Advisor to the Chancellor and Secretary of
the Board Gayle M. Horwitz General Counsel and Vice Chancellor Loretta P.
Martinez Ms. Fenella Ramsami
University Staff: Senior Vice Chancellor and Chief Financial Officer
Matthew Sapienza Interim Chief Operating Officer Marc V. Shaw Interim Vice Chancellor Margaret Egan Deputy Chief Financial Officer Christina Chiappa University Executive Budget Director Catherine
Abata
Cal. No. DISPOSITION
The agenda items were considered and acted upon in the following order: I. ACTION ITEMS:
A. APPROVAL OF THE MINUTES OF THE MEETING OF JANUARY 17, 2018. Moved by
Trustee Una Clarke and seconded by Trustee Henry Berger, the minutes was approved as amended as follows:
On page 3, paragraph 6 (Baruch College – Executive and Global Graduate Degree Programs) is amended to read: “Moved by Trustee Kim and seconded by Prof. Kay Conway, and following discussion, the item was approved for submission to the Board. Ms. Cecilia Salvi opposed.”
B. POLICY CALENDAR
1. CUNY Graduate School of Public Health and Health Policy – Nutrition and Dietetic Internship
Program Fees. Committee Chair Ferrer asked the Committee to adopt an Internship Application Fee of $100 per applicant and an Internship Course Fee of $150 for each accepted and enrolled Intern at the CUNY Graduate School of Public Health and Health Policy, commencing with the Fall 2018 semester. The revenues generated by these fees will be applied toward the operating expenses of the Internship Program. All enrolled interns will be provided with study materials purchased through the program, as well as with preparation to take and pass the Registered Dietitian Examination.
BOARD OF TRUSTEES THE CITY UNIVERSITY OF NEW YORK
COMMITTEE ON MINUTES OF THE MEETING FISCAL AFFAIRS FEBRUARY 26, 2018
2
2. The City College of New York – Program Fee for New Certificate Program in Premedical and Pre-Health Studies for Post-Baccalaureate Students. Committee Chair Ferrer asked the Committee to adopt a schedule of academic program fees of $235 per credit for resident and non-resident full-time and part-time students enrolled in the post-baccalaureate certificate program in premedical and pre-health studies in the Division of Science at The City College of New York, effective with the Fall 2018 semester. The Division of Science at City College has a successful premedical and pre-health program that mainly serves undergraduate students. Post-baccalaureate students have unfortunately been unable to benefit from its services. As a result, these students are unable to complete the science courses that are a prerequisite for applying to professional schools or graduate programs in health professions. With the proposed fees, the program at CCNY will provide enrolled students with a guarantee of completion, and the college will open an additional section of each required course that is reserved for post-baccalaureate students. The revenues from the fees will also be used to provide salaries of lecturers, lab techs, teaching assistants and support services, including academic advisement, tutoring and workshops. A discussion about the program fee followed, including the structure of fees, allocation of funds, outreach, and student government/student consultation. University Student Senate Chair and Trustee John Aderounmu requested that the Committee be provided with a breakdown of academic excellence fee expenditures for all CUNY graduate programs at its next scheduled meeting. Senior Vice Chancellor and Chief Financial Officer (SVC&CFO) Matthew Sapienza shared a few comments, highlighting that generated revenues from the academic excellence fees are used to invest in the facilities; however, it is not a direct facilities fee. University Faculty Senate Chair and Trustee Kay Conway inquired about non-matriculated tuition.
3. Hunter College – Academic Excellence Fee for Graduate Programs, School of Education. Committee Chair Ferrer asked the Committee to approve the extension of academic excellence fees to students in all master’s level graduate programs in the School of Education at Hunter College. At its meeting on October 1, 2015, the Board of Trustees approved a schedule of academic excellence fees for students in certain graduate programs in the School of Education at Hunter College, effective with the Spring 2016 semester. The academic excellence fees that are up for consideration this evening would be applied to those master’s and advanced certificate programs which prepare candidates for professional, alternative, and additional certification in general and special education across Adolescent, Childhood, Early Childhood, and K-12 certification areas, as well as those master’s and advanced certificate programs which lead to licensure and/or certification for School Building and School District Leadership, Applied Behavioral Analysis, Educational Psychology, and Rehabilitation Counseling and Visual Rehabilitation and Orientation and Mobility Teaching, effective with the new students in the Fall 2018 semester. A discussion about the academic excellence fee followed, including the allocation of funds, the benefits of the fee, and student government/student consultation. Moved by Committee Chair Ferrer and seconded by Trustee Clarke, and following discussion, items I.B.1 through I.B.3 were approved for submission to the Board. Ms. Cecilia Salvi opposed.
BOARD OF TRUSTEES THE CITY UNIVERSITY OF NEW YORK
COMMITTEE ON MINUTES OF THE MEETING FISCAL AFFAIRS FEBRUARY 26, 2018
3
4. Central Office – Administrative Excellence Initiative. Committee Chair Ferrer stated that the University will engage the Institute for State and Local Governance (CUNY ISLG) operations management team to develop and implement a strategic plan to meet the goals of the Administrative Excellence Initiative. CUNY ISLG will work closely with CUNY administrative staff to identify initiatives, research best practice, analyze fiscal impact and develop implementation plans, over the next four years, to bring best practice to the administrative functions that support the academic mission, making every effort to be lean and resourceful in all areas of operations and administration. CUNY ISLG, in partnership with CUNY administrative staff, will conduct their work in four phases, at a total cost not to exceed $5.7 million, with the implementation of these initiatives beginning in the Spring of 2018 and continuing through Fiscal Year 2021. This cost is exclusive of the cost of contractors that CUNY ISLG may engage to provide functional expertise where necessary. Overall, the four-year initiative will achieve over $75 million in savings for reinvestment in academic priorities identified in the 2016-2017 Master Plan. Interim Chief Operating Officer Marc Shaw provided further information on the Administrative Excellence Initiative. Interim Vice Chancellor Margaret Egan then presented the project description and approach of the Initiative, noting that the University has a savings target of $75 million over four years. A discussion about the efficiency projects of the Initiative followed, including campus diversity and inclusion, expense budget and capital costs, staffing assurance, procurement system, redirection of savings, campus integration relating to design and development phases, and community economic development. Moved by Trustee Berger and seconded by Trustee Clarke, and following discussion, the item was unanimously approved for submission to the Board.
II. INFORMATION ITEM:
Preliminary FY2019 Initial Allocations
SVC&CFO Sapienza reported on the University’s FY2019 Tax-Levy Preliminary Budget, highlighting that the Federal Budget for next year could have adverse implications for both the State and the City, as well as a direct negative impact on CUNY. He further explained how the Prosper Act, a proposed House bill, would result in the loss of $9 million in Federal Work-Study funds for CUNY and the elimination of Supplemental Education Opportunity Grant (SEOG). A discussion about the report followed, including unfunded mandatory expenses, preliminary allocations held in reserve, transparency and accountability, contingency plans relating to risk and uncertainties, and maximizing efforts in Washington to further CUNY’s mission.
Committee Chair Ferrer moved to go into Executive Session at 7:46 p.m. This motion was seconded by Trustee Berger. CONVENING OF EXECUTIVE SESSION: Committee Chair Ferrer called for an Executive Session pursuant to Section 105, Article 7, of the Public Officers Law, to discuss information regarding matters related to a potential appointment of a corporation. The Committee met in Executive Session from 7:49 p.m. to 8:29 p.m.
The Committee reconvened in Public Session. Committee Chair Ferrer moved to adjourn the meeting. The motion was seconded by Trustee Berger and the meeting was adjourned at 8:30 p.m.
CUNY GRADUATE CENTER
ACADEMIC EXCELLENCE FEES – MASTER’S PROGRAMS
WHEREAS, the Graduate Center’s Master’s Programs offer students outstanding academic and
professional opportunities, are innovative and interdisciplinary in their visions and curriculum, and
are distinctive within the University, and
WHEREAS, these Master’s Programs aim to integrate learning opportunities, skills, and
experiences that best train students for a wide range of future careers into their curriculum and into
the overall student experience, and
WHEREAS, specialized academic advising, specialized career services, expert research support,
library services, networking services, and other relevant curricular projects are costly activities,
but are key to advancing Master’s students inside and outside of academia, and
WHEREAS, additional resources are necessary to maintain and enhance the excellence of these
Master’s offerings, be it
RESOLVED, that the Board of Trustees adopt academic excellence fees to students in eight
interdisciplinary master’s programs at the Graduate Center. The fees will be effective in the Fall
2018 semester for entering students and will be $100 per credit. They fees will apply to the
following master’s programs:
MS in Cognitive Neuroscience
MA in International Migration Studies
MA in Liberal Studies
MA in Middle Eastern Studies
MS in Data Science
MS in Quantitative Methods in the Social Sciences
MS in Data Analysis and Visualization
MA in Digital Humanities
EXPLANATION: The Graduate Center is ideally situated to offer Master’s students a premium
experience, thereby providing the students with exceptional value for their tuition. Master’s
students are taught by full-time faculty members with outstanding academic records, and the
students additionally benefit from interaction with the Graduate Center’s highly selective pool of
advanced, research-active doctoral students. Even with the excellence fee, the students will pay
much lower tuition than at other leading institutions in the area. The academic excellence fee is
being sought only for interdisciplinary programs involving significant additional costs in
technology, advising, and research support. Decisions about specific fee allocations will be made
in consultation with program faculty and students.
THE CITY COLLEGE OF NEW YORK
ACADEMIC EXCELLENCE FEE FOR GRADUATE PROGRAMS IN THE BERNARD
AND ANNE SPITZER SCHOOL OF ARCHITECTURE
WHEREAS, rapidly expanding demands on architectural professional education are causing
steadily increasing cost pressures on the schools of architecture throughout the country and
particularly on the Spitzer School at City College, and
WHEREAS, the City College of New York’s Spitzer School of Architecture requires additional
resources to meet the steadily increasing costs of educating professional school students, and to
meet the demands of progressively complex, competitive, and demanding public, financial and
regulatory environments in which Architecture students will find themselves as they enter the
profession and become licensed architects, and
WHEREAS, the current tuition revenue generated by the Spitzer School of Architecture is not
enough to cover programmatic costs, and
WHEREAS, the median salary of architects is $76,930 per year nationally, be it
RESOLVED, that The Board of Trustees adopt a schedule of Academic Excellence Fees for
students in all graduate degree granting programs in the Bernard and Anne Spitzer School of
Architecture at City College, effective with the Fall 2018 semester. The Academic Excellence
Fee will be $500 per semester for graduate students, and be it further
RESOLVED, that City College will provide to the Board of Trustees Fiscal Committee, by the
end of September of each year, an accounting of the academic excellence fees spent in the prior
fiscal year.
EXPLANATION: the City College of New York proposes an Academic Excellence Fee of $500
per semester for graduate students in the School of Architecture. This fee is necessary for the
College to be able to offer competitive salaries to professionally licensed faculty members and
make upgrades to ever changing technology. In addition, architectural schools are under pressure
to provide students with increasingly complex and costly technology required to practice
architecture and support sophisticated construction practices. It is becoming more difficult to
adequately prepare these students for success as they enter a rapidly changing profession with
increasing responsibility to lead environmental stewardship, positive societal impacts, and
progressive construction and technological innovation.
With the revenues generated from this Academic Excellence Fee, City College commits to
making the following investments:
1. Supplement regular full-time and adjunct course instruction with classroom specialists
and consultants-experts. Visiting experts are increasingly necessary to provide special
seminars and instruction through in-studio consultation directly to students over and
above standard classroom teaching thus enhancing the student’s capabilities to engage in
an expansive and comprehensive process of design;
2. Maintain (and in some areas, reduce) section sizes particularly in required studio
courses to allow maximum opportunities for student learning with optimal faculty
contact;
3. Provide widespread student access to sophisticated technology throughout the programs.
Industry and professional trends involving digital and automated technologies put
demands on architecture programs and present a number of increasing financial
pressures that were not present just a few years ago. To adequately serve the students’
learning needs, the College will add new technologies and update existing equipment and
systems on a regular basis.
4. Expand student travel experiences. It is now a norm for professional architecture,
landscape architecture, and urban design programs to organize studio and other course
trips as an integral part of class activity. Travel, in-city and beyond, allows our students
to remain competitive and stay current with globalizing trends and evolving professional
opportunities.
This proposal would not apply to the Joint Degree Program in Sustainability in the Urban
Environment since it is a collaborative program based in multiple divisions of the college.
THE CITY COLLEGE
ACADEMIC EXCELLENCE FEES FOR GRADUATE PROGRAMS IN THE GROVE
SCHOOL OF ENGINEERING
WHEREAS, the Grove School (the School) of engineering occupies a very unique position within
New York State, New York City and the nation for its role in public engineering education, its
access mission and its record of providing upward mobility through engineering careers for its
mostly first generation and immigrant students, and
WHEREAS, the demand for engineering has remained strong over the School’s history; and
WHEREAS, the School is in need of critical upgrades of equipment, software and technology for
its aging teaching laboratories and design spaces, and
WHEREAS, the embedded laboratory and design experiences throughout the engineering
curriculum, and associated staff, equipment, supplies, computing resources and facilities required
to run them, results in higher expenses to educate engineers. At City College, in particular, the
cost of educating an Engineering student is twice the tuition that these students pay, and
WHEREAS, institutions across the country have addressed the higher cost of educating engineers
by assessing differential tuition or fees to support engineering programs; this added cost to is
viewed as being specific to engineering and explicitly reserved for the delivery of quality
engineering instruction, and
WHEREAS, graduate students receive starting salaries of nearly $80,000, engineering graduates
nationally earn a median salary of $91,679 per year and have one of the lowest unemployment
rates of all majors, at 2.5%, be it
RESOLVED, that the Board of Trustees adopt a schedule of Academic Excellence fees for all
students in graduate programs in the Grove School of Engineering at City College, effective with
the Fall 2018 semester. The Academic Excellence Fee for graduate students will be $250 per
semester for in-state students and $30 per credit hour for out of state students. The fees will be
applicable for all new graduate students entering the program, however, the fees will be phased in
for continuing students at rates determined by the College, and be it further
RESOLVED, that City College will provide to the Board of Trustees Fiscal Committee, by the
end of September of each year, an accounting of the academic excellence fees spent in the prior
fiscal year.
EXPLANATION: Academic Excellence fees are required by the City College Grove School of
Engineering to meet the steadily increasing costs of educating professional school students. The
school needs additional support if it is to meet the demands of progressively complex, competitive,
and demanding public, financial and regulatory environments. With the revenues generated from
the Academic Excellence fee, City College commits to make the following investments in the

Grove School of Engineering: purchase of new equipment, supplies and software, upgrades and
modernization of equipment and facilities, additional staffing for laboratories and design spaces to
include technicians and graduate student teaching assistants, the hiring of additional adjuncts as
needed, hiring of additional advisors, expansion of academic support and tutors, and increased
course offerings.
GRADUATE SCHOOL OF PUBLIC HEALTH AND HEALTH POLICY
DIFFERENTIAL TUITION REQUEST FOR THE MASTERS AND DOCTORATE IN
PUBLIC HEALTH
WHEREAS, The CUNY Graduate School of Public Health and Health Policy (GSPHHP)
requires a differential tuition increase in order to provide optimal support and opportunity to our
students and to sustain competitive educational programs, and
WHEREAS, GSPHHP degrees are highly marketable, with over 90% of recent graduates
attaining employment or continuing their studies, 85% working in a field related to their graduate
degree, and over 65% earning $60,000 or more annually within a year of graduation, and
WHEREAS, the current tuition revenue generated by the Masters and Doctorate in Public Health
(MPH and DPH, respectively), is not enough to cover programmatic costs at an optimal level,
and
WHEREAS, The New York State Education Law Sec. 6206 allows The City University of New
York to charge differential tuition rates as long as there is no differential among like degree
programs, and
WHEREAS, the MPH/DPH program at the CUNY Graduate School of Public Health and Health
Policy is the only such program at the City University of New York, be it
RESOLVED, that t he Boar d o f T rust ees adopt a differential tuition charge for the
Masters and Doctorate in Public Health at the CUNY Graduate School of Public Health and
Health Policy, effective with the Fall 2018 semester as set forth in the schedule below; and be it
further
RESOLVED, that the Graduate School of Public Health and Health Policy will account for and
report on the program supplement separately; and be it further
RESOLVED, that the Graduate School of Public Health and Health Policy will provide to the
Board of Trustees Fiscal Committee, by the end of September of each year, an accounting of the
differential tuition revenues spent in the prior fiscal year.
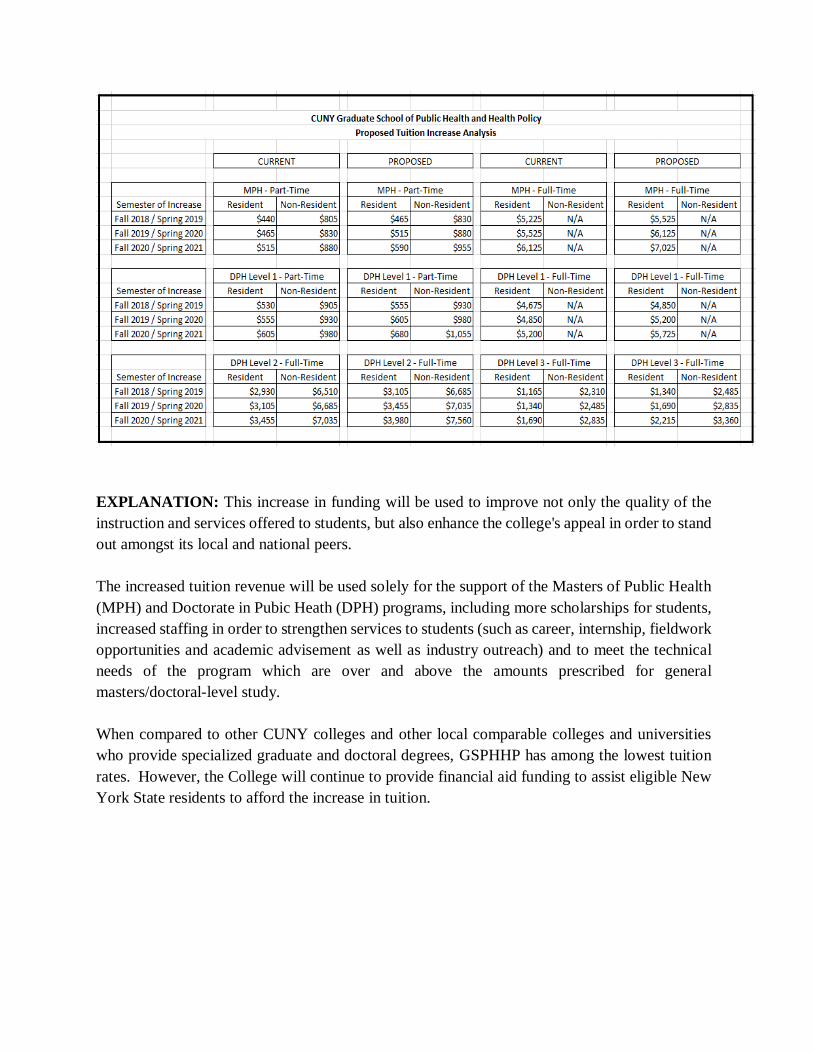
EXPLANATION: This increase in funding will be used to improve not only the quality of the
instruction and services offered to students, but also enhance the college's appeal in order to stand
out amongst its local and national peers.
The increased tuition revenue will be used solely for the support of the Masters of Public Health
(MPH) and Doctorate in Pubic Heath (DPH) programs, including more scholarships for students,
increased staffing in order to strengthen services to students (such as career, internship, fieldwork
opportunities and academic advisement as well as industry outreach) and to meet the technical
needs of the program which are over and above the amounts prescribed for general
masters/doctoral-level study.
When compared to other CUNY colleges and other local comparable colleges and universities
who provide specialized graduate and doctoral degrees, GSPHHP has among the lowest tuition
rates. However, the College will continue to provide financial aid funding to assist eligible New
York State residents to afford the increase in tuition.
THE CITY UNIVERSITY OF NEW YORK
PREDICTIVE ANALYTIC SOFTWARE SYSTEM TO SUPPORT ACADEMIC
ADVISEMENT
WHEREAS, academic advisement and predictive analytics systems are being adopted by
colleges and universities across the nation, to great effect. According to a research snapshot
from EDUCAUSE, 21-40% of higher education institutions had deployed academic
advisement and predictive analytics solutions as of 2016, and
WHEREAS, the Lincoln Report by the American Academy of Arts and Sciences lists ten
recommendations for public research universities that seek to improve student outcomes,
one of which is to “track student performance in real time and intervene appropriately to
improve student success.” The report references an article in The Atlantic that cites Georgia
State University’s remarkable success in raising retention and graduation rates, and lauds
their use of academic advisement and predictive analytics technology to improve
outcomes, and
WHEREAS, a comprehensive academic advisement and predictive analytics solution for
our senior colleges is an important component of CUNY’s academic technology strategy
in support of college completion goals, be it
RESOLVED, that the Board of Trustees authorize the General Counsel to execute a
contract with Education Advisory Board to provide an academic advisement and predictive
analytic software system and related consulting services to CUNY’s senior colleges. The
contract is being awarded on the basis of best value to a responsible and responsive offeror
after public advertisement and timely submission of sealed proposals pursuant to law and
University Regulations. The contract term shall be five year. CUNY’s purchase of software
and services under the contract shall not exceed an aggregate of $10,851,000 over the
contract term, chargeable to appropriate funding sources during the applicable fiscal year
or years. The contract shall be subject to approval as to form by the Office of General
Counsel.
EXPLANATION: This predictive analytic software system and the affiliated services
will support academic advisement and data-based decision making at CUNY senior
colleges to better facilitate students’ timely progress toward degree completion.
The system is a comprehensive software and consulting services solution that encompasses
academic advisement caseload management, predictive analytics, early warning, student
communications tools, student-facing mobile application for student onboarding, and
support resources. The solution will:
Enhance college efforts to enable students to make timely progress toward their
degrees with a combination of technology, analytics, and consulting informed by
best practice research.
Help colleges use data and analytics to measurably improve student outcomes and
close achievement gaps.
Help academic advisors and administrators apply the insight they gain from data
analyses and individual student assessments to provide advice and support to
students.
Provide timely data to identify individual students and sub-populations at
academic risk early enough for faculty and staff to intervene by offering
appropriate and coordinated support services.
Enable administrators, advisors and faculty to monitor and measure the
effectiveness of interventions and services, and make timely changes in approach
as needed.
Provide in-person and web-based and resources for faculty and staff on proven best
practices to give them an array of tools and strategies for reaching and supporting
at-risk and struggling students precisely when that support is most needed and most
effective.
Provide a robust, databased academic “early warning” system for academically at-
risk students.
Provide timely data, analytics, and career path information to academic advisors
to help them guide students into academic areas that may be better suited to their
skills, abilities, interests and career goals.
Provide information to students about campus academic support resources and
services.
The system will work in conjunction with CUNY’s existing Degree Works and CUNYfirst
systems and will complement those systems.
The City University of New York
FY2018 Third Quarter Financial Report
University Budget Office
April 9, 2018
i
The City University of New York Financial Report Overview
The Financial Report provides expenditure, revenue, enrollment, and staffing data for the individual colleges as well as University totals. This information is presented both graphically and in tabular format. Comparison of Expenditures to Resources The comparison of total expenditures to total revenue provides the projected year-end condition of each college. Total resources include tax-levy allocations, non tax levy funds, as well as centrally administered expenditures such as fringes. Non tax levy funds for the senior colleges includes Research Foundation funds, legislative initiatives, and Income Fund Reimbursable (IFR) resources, which are made up of self-supporting programs, including Adult and Continuing Education and technology fees. Ledger three community college funds include revenues from language immersion programs and non-miscellaneous income. Community college Adult and Continuing Education (ACE) revenue and expenditures are excluded from this report. City University Tuition Reimbursable Account (CUTRA) and reserve balances are used to offset expenditures above total resources. CUTRA and reserve funds are unexpended tuition revenue collections above target for previous years. Expenditures Projected year end 2017-18 tax levy expenditures are compared to 2016-17 tax levy expenditures in total and by category.
Revenue Revenue data provided includes the FY2018 target and a comparison of FY2018 actual collections to FY2017 actual collections. Enrollment FY2018 Fall Headcount and FTE enrollment are compared FY2017 Fall Headcount and FTE totals. These figures were provided by the Office of Institutional Research and Analysis. Staffing Full-time staff figures are provided for I&DR Teaching, Librarians, Counselors, Other Teaching, Total Faculty, I&DR Support, Non-Instructional, and Civil Service staff for Spring 2018, Fall 2017, and Fall 2016. The sources for these numbers for schools not live in CUNYFirst payroll are the FISM115V and FISM115Z reports (the average salary reports). The source is CUNYFirst for schools that are live in CUNYFirst payroll. College numbers do not include IFR positions. Central numbers include IFR positions.
ii
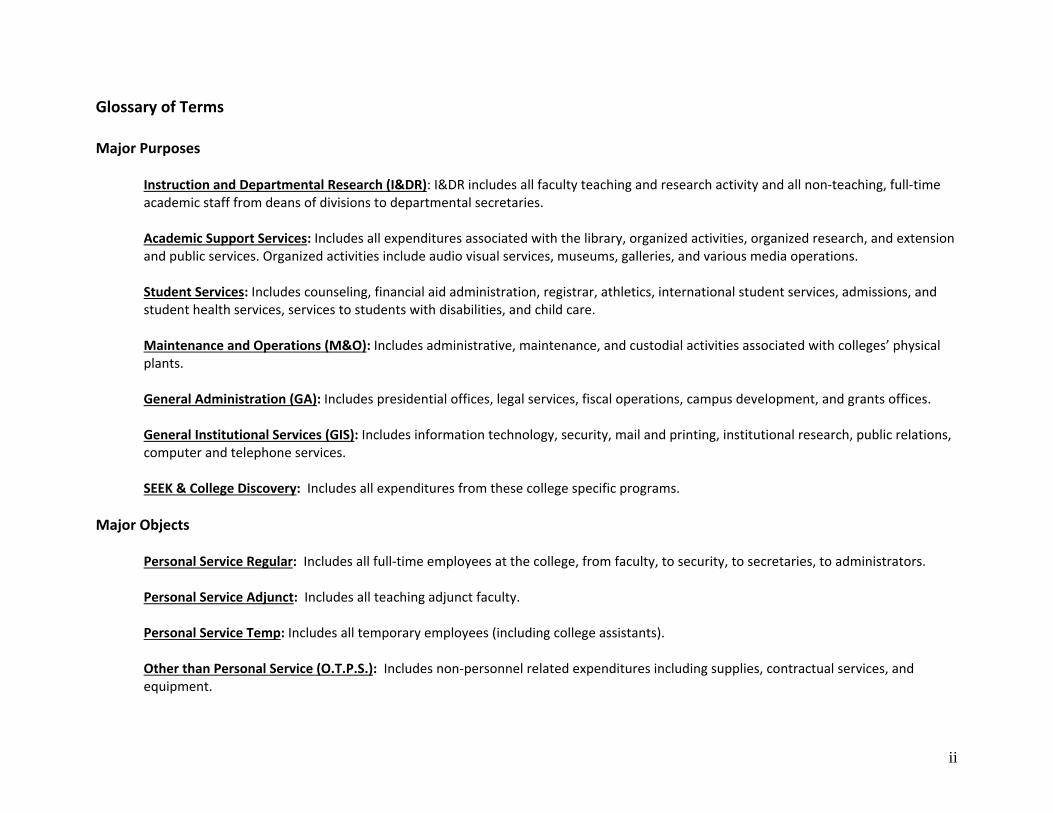
Glossary of Terms Major Purposes
Instruction and Departmental Research (I&DR): I&DR includes all faculty teaching and research activity and all non‐teaching, full‐time academic staff from deans of divisions to departmental secretaries. Academic Support Services: Includes all expenditures associated with the library, organized activities, organized research, and extension and public services. Organized activities include audio visual services, museums, galleries, and various media operations. Student Services: Includes counseling, financial aid administration, registrar, athletics, international student services, admissions, and student health services, services to students with disabilities, and child care. Maintenance and Operations (M&O): Includes administrative, maintenance, and custodial activities associated with colleges’ physical plants. General Administration (GA): Includes presidential offices, legal services, fiscal operations, campus development, and grants offices. General Institutional Services (GIS): Includes information technology, security, mail and printing, institutional research, public relations, computer and telephone services. SEEK & College Discovery: Includes all expenditures from these college specific programs.
Major Objects
Personal Service Regular: Includes all full‐time employees at the college, from faculty, to security, to secretaries, to administrators. Personal Service Adjunct: Includes all teaching adjunct faculty. Personal Service Temp: Includes all temporary employees (including college assistants). Other than Personal Service (O.T.P.S.): Includes non‐personnel related expenditures including supplies, contractual services, and equipment.
EXPENDITURES
4
Tuition Revenue Prior Year ProjectedPending Technology Above Total (Over)/Under CUTRA & Year-end
Budget¹ Allocations Fee Target Resources Expenditures2 Expenditure Reserves Balance
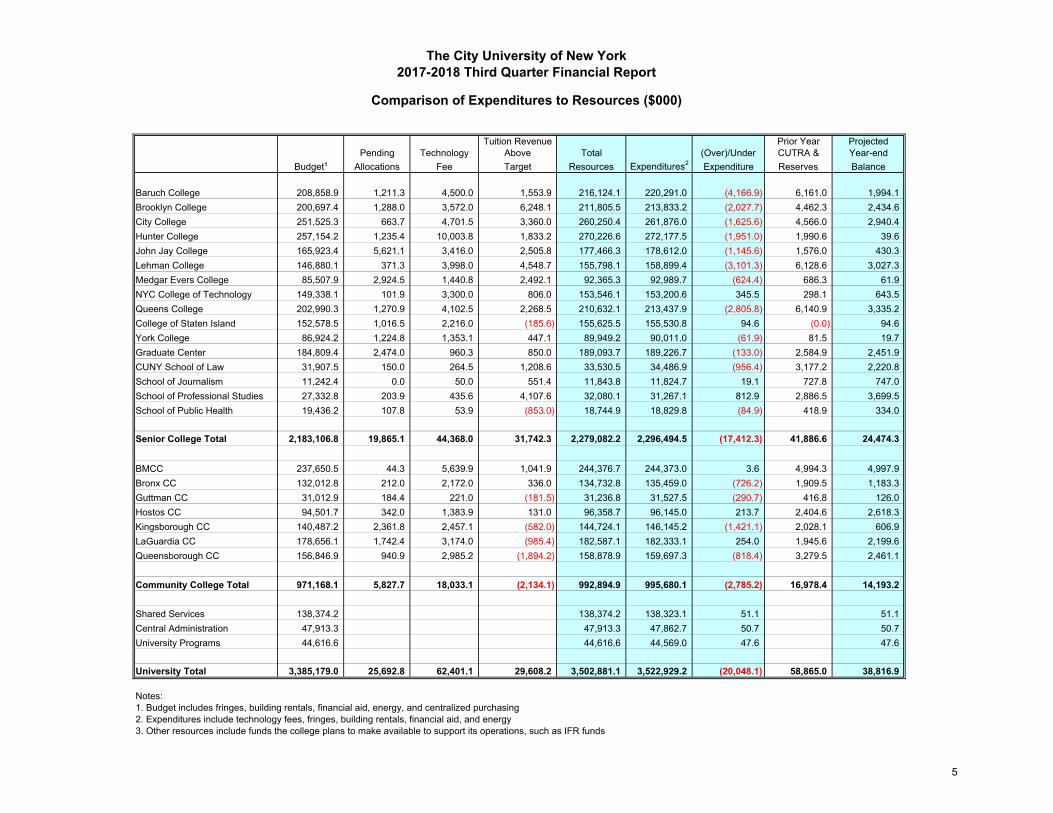
Baruch College 208,858.9 1,211.3 4,500.0 1,553.9 216,124.1 220,291.0 (4,166.9) 6,161.0 1,994.1Brooklyn College 200,697.4 1,288.0 3,572.0 6,248.1 211,805.5 213,833.2 (2,027.7) 4,462.3 2,434.6City College 251,525.3 663.7 4,701.5 3,360.0 260,250.4 261,876.0 (1,625.6) 4,566.0 2,940.4Hunter College 257,154.2 1,235.4 10,003.8 1,833.2 270,226.6 272,177.5 (1,951.0) 1,990.6 39.6John Jay College 165,923.4 5,621.1 3,416.0 2,505.8 177,466.3 178,612.0 (1,145.6) 1,576.0 430.3Lehman College 146,880.1 371.3 3,998.0 4,548.7 155,798.1 158,899.4 (3,101.3) 6,128.6 3,027.3Medgar Evers College 85,507.9 2,924.5 1,440.8 2,492.1 92,365.3 92,989.7 (624.4) 686.3 61.9NYC College of Technology 149,338.1 101.9 3,300.0 806.0 153,546.1 153,200.6 345.5 298.1 643.5Queens College 202,990.3 1,270.9 4,102.5 2,268.5 210,632.1 213,437.9 (2,805.8) 6,140.9 3,335.2College of Staten Island 152,578.5 1,016.5 2,216.0 (185.6) 155,625.5 155,530.8 94.6 (0.0) 94.6York College 86,924.2 1,224.8 1,353.1 447.1 89,949.2 90,011.0 (61.9) 81.5 19.7Graduate Center 184,809.4 2,474.0 960.3 850.0 189,093.7 189,226.7 (133.0) 2,584.9 2,451.9CUNY School of Law 31,907.5 150.0 264.5 1,208.6 33,530.5 34,486.9 (956.4) 3,177.2 2,220.8School of Journalism 11,242.4 0.0 50.0 551.4 11,843.8 11,824.7 19.1 727.8 747.0School of Professional Studies 27,332.8 203.9 435.6 4,107.6 32,080.1 31,267.1 812.9 2,886.5 3,699.5School of Public Health 19,436.2 107.8 53.9 (853.0) 18,744.9 18,829.8 (84.9) 418.9 334.0
Senior College Total 2,183,106.8 19,865.1 44,368.0 31,742.3 2,279,082.2 2,296,494.5 (17,412.3) 41,886.6 24,474.3
BMCC 237,650.5 44.3 5,639.9 1,041.9 244,376.7 244,373.0 3.6 4,994.3 4,997.9Bronx CC 132,012.8 212.0 2,172.0 336.0 134,732.8 135,459.0 (726.2) 1,909.5 1,183.3Guttman CC 31,012.9 184.4 221.0 (181.5) 31,236.8 31,527.5 (290.7) 416.8 126.0Hostos CC 94,501.7 342.0 1,383.9 131.0 96,358.7 96,145.0 213.7 2,404.6 2,618.3Kingsborough CC 140,487.2 2,361.8 2,457.1 (582.0) 144,724.1 146,145.2 (1,421.1) 2,028.1 606.9LaGuardia CC 178,656.1 1,742.4 3,174.0 (985.4) 182,587.1 182,333.1 254.0 1,945.6 2,199.6Queensborough CC 156,846.9 940.9 2,985.2 (1,894.2) 158,878.9 159,697.3 (818.4) 3,279.5 2,461.1
Community College Total 971,168.1 5,827.7 18,033.1 (2,134.1) 992,894.9 995,680.1 (2,785.2) 16,978.4 14,193.2
Shared Services 138,374.2 138,374.2 138,323.1 51.1 51.1Central Administration 47,913.3 47,913.3 47,862.7 50.7 50.7University Programs 44,616.6 44,616.6 44,569.0 47.6 47.6
University Total 3,385,179.0 25,692.8 62,401.1 29,608.2 3,502,881.1 3,522,929.2 (20,048.1) 58,865.0 38,816.9
Notes:1. Budget includes fringes, building rentals, financial aid, energy, and centralized purchasing2. Expenditures include technology fees, fringes, building rentals, financial aid, and energy3. Other resources include funds the college plans to make available to support its operations, such as IFR funds
The City University of New York2017-2018 Third Quarter Financial Report
Comparison of Expenditures to Resources ($000)
5
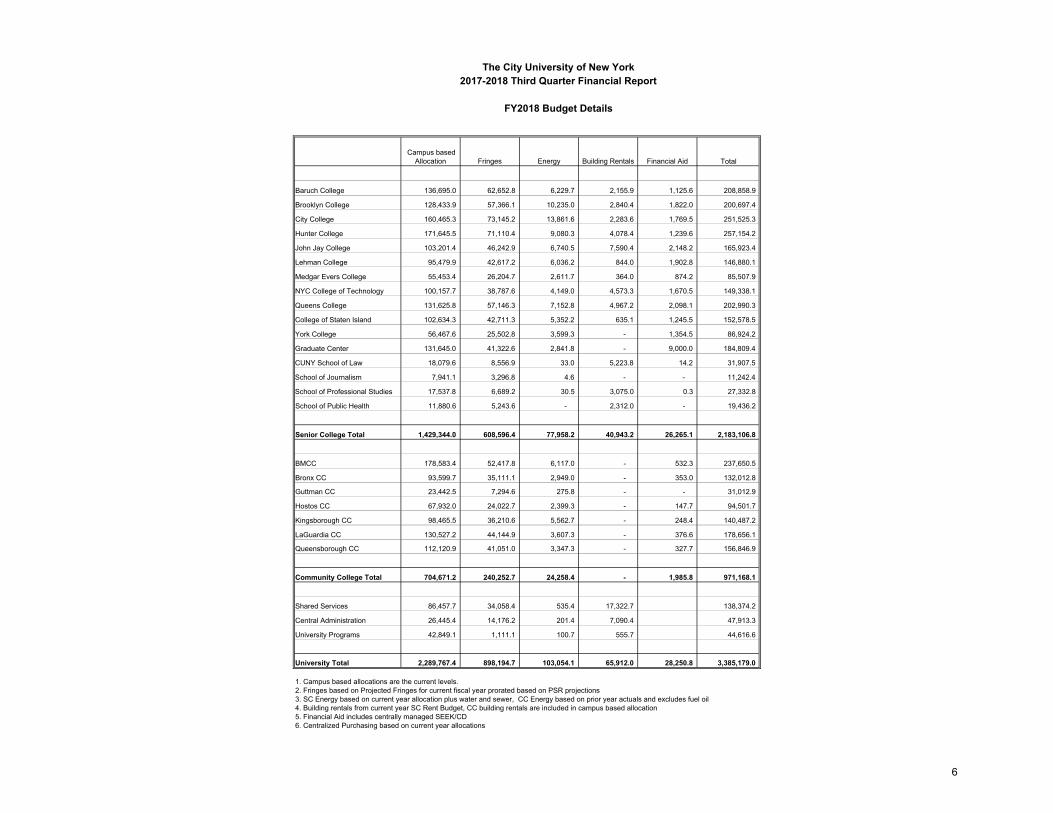
The City University of New York2017-2018 Third Quarter Financial Report
FY2018 Budget Details
Campus based Allocation Fringes Energy Building Rentals Financial Aid Total
Baruch College 136,695.0 62,652.8 6,229.7 2,155.9 1,125.6 208,858.9
Brooklyn College 128,433.9 57,366.1 10,235.0 2,840.4 1,822.0 200,697.4
City College 160,465.3 73,145.2 13,861.6 2,283.6 1,769.5 251,525.3
Hunter College 171,645.5 71,110.4 9,080.3 4,078.4 1,239.6 257,154.2
John Jay College 103,201.4 46,242.9 6,740.5 7,590.4 2,148.2 165,923.4
Lehman College 95,479.9 42,617.2 6,036.2 844.0 1,902.8 146,880.1
Medgar Evers College 55,453.4 26,204.7 2,611.7 364.0 874.2 85,507.9
NYC College of Technology 100,157.7 38,787.6 4,149.0 4,573.3 1,670.5 149,338.1
Queens College 131,625.8 57,146.3 7,152.8 4,967.2 2,098.1 202,990.3
College of Staten Island 102,634.3 42,711.3 5,352.2 635.1 1,245.5 152,578.5
York College 56,467.6 25,502.8 3,599.3 - 1,354.5 86,924.2
Graduate Center 131,645.0 41,322.6 2,841.8 - 9,000.0 184,809.4
CUNY School of Law 18,079.6 8,556.9 33.0 5,223.8 14.2 31,907.5
School of Journalism 7,941.1 3,296.8 4.6 - - 11,242.4
School of Professional Studies 17,537.8 6,689.2 30.5 3,075.0 0.3 27,332.8
School of Public Health 11,880.6 5,243.6 - 2,312.0 - 19,436.2
Senior College Total 1,429,344.0 608,596.4 77,958.2 40,943.2 26,265.1 2,183,106.8
BMCC 178,583.4 52,417.8 6,117.0 - 532.3 237,650.5
Bronx CC 93,599.7 35,111.1 2,949.0 - 353.0 132,012.8
Guttman CC 23,442.5 7,294.6 275.8 - - 31,012.9
Hostos CC 67,932.0 24,022.7 2,399.3 - 147.7 94,501.7
Kingsborough CC 98,465.5 36,210.6 5,562.7 - 248.4 140,487.2
LaGuardia CC 130,527.2 44,144.9 3,607.3 - 376.6 178,656.1
Queensborough CC 112,120.9 41,051.0 3,347.3 - 327.7 156,846.9
Community College Total 704,671.2 240,252.7 24,258.4 - 1,985.8 971,168.1
Shared Services 86,457.7 34,058.4 535.4 17,322.7 138,374.2
Central Administration 26,445.4 14,176.2 201.4 7,090.4 47,913.3
University Programs 42,849.1 1,111.1 100.7 555.7 44,616.6
University Total 2,289,767.4 898,194.7 103,054.1 65,912.0 28,250.8 3,385,179.0
1. Campus based allocations are the current levels.2. Fringes based on Projected Fringes for current fiscal year prorated based on PSR projections3. SC Energy based on current year allocation plus water and sewer, CC Energy based on prior year actuals and excludes fuel oil 4. Building rentals from current year SC Rent Budget, CC building rentals are included in campus based allocation5. Financial Aid includes centrally managed SEEK/CD6. Centralized Purchasing based on current year allocations
6
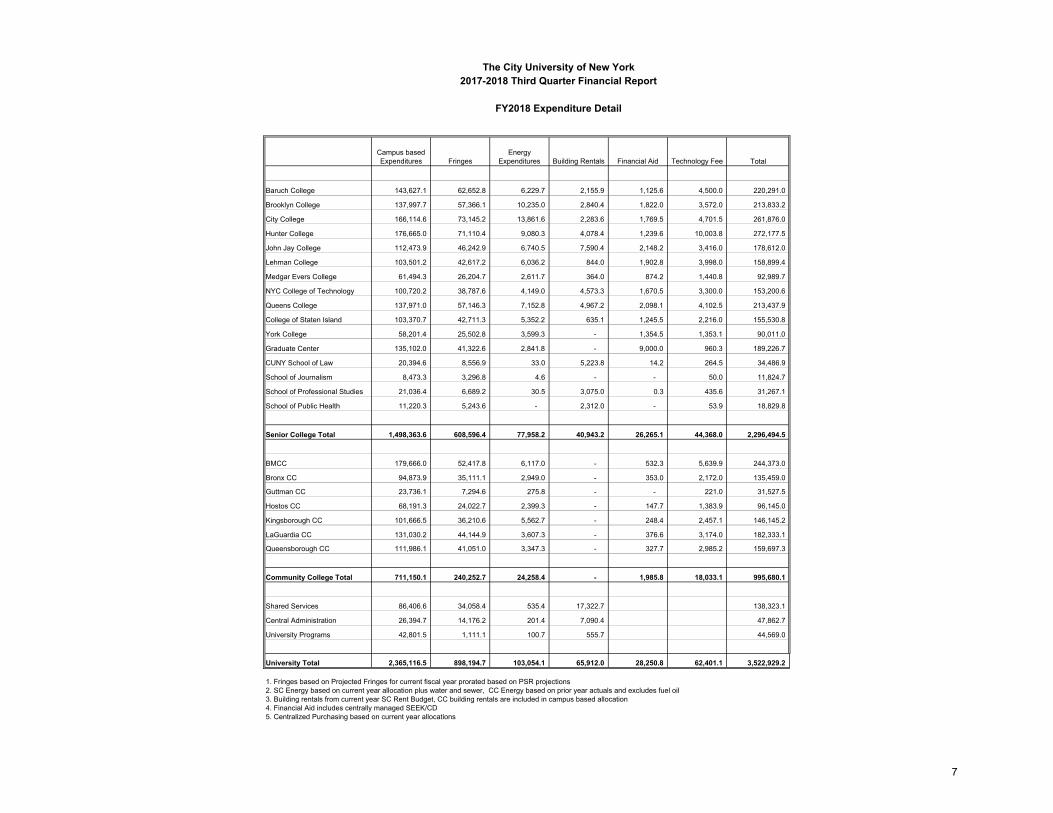
The City University of New York2017-2018 Third Quarter Financial Report
FY2018 Expenditure Detail
Campus based Expenditures Fringes
Energy Expenditures Building Rentals Financial Aid Technology Fee Total
Baruch College 143,627.1 62,652.8 6,229.7 2,155.9 1,125.6 4,500.0 220,291.0
Brooklyn College 137,997.7 57,366.1 10,235.0 2,840.4 1,822.0 3,572.0 213,833.2
City College 166,114.6 73,145.2 13,861.6 2,283.6 1,769.5 4,701.5 261,876.0
Hunter College 176,665.0 71,110.4 9,080.3 4,078.4 1,239.6 10,003.8 272,177.5
John Jay College 112,473.9 46,242.9 6,740.5 7,590.4 2,148.2 3,416.0 178,612.0
Lehman College 103,501.2 42,617.2 6,036.2 844.0 1,902.8 3,998.0 158,899.4
Medgar Evers College 61,494.3 26,204.7 2,611.7 364.0 874.2 1,440.8 92,989.7
NYC College of Technology 100,720.2 38,787.6 4,149.0 4,573.3 1,670.5 3,300.0 153,200.6
Queens College 137,971.0 57,146.3 7,152.8 4,967.2 2,098.1 4,102.5 213,437.9
College of Staten Island 103,370.7 42,711.3 5,352.2 635.1 1,245.5 2,216.0 155,530.8
York College 58,201.4 25,502.8 3,599.3 - 1,354.5 1,353.1 90,011.0
Graduate Center 135,102.0 41,322.6 2,841.8 - 9,000.0 960.3 189,226.7
CUNY School of Law 20,394.6 8,556.9 33.0 5,223.8 14.2 264.5 34,486.9
School of Journalism 8,473.3 3,296.8 4.6 - - 50.0 11,824.7
School of Professional Studies 21,036.4 6,689.2 30.5 3,075.0 0.3 435.6 31,267.1
School of Public Health 11,220.3 5,243.6 - 2,312.0 - 53.9 18,829.8
Senior College Total 1,498,363.6 608,596.4 77,958.2 40,943.2 26,265.1 44,368.0 2,296,494.5
BMCC 179,666.0 52,417.8 6,117.0 - 532.3 5,639.9 244,373.0
Bronx CC 94,873.9 35,111.1 2,949.0 - 353.0 2,172.0 135,459.0
Guttman CC 23,736.1 7,294.6 275.8 - - 221.0 31,527.5
Hostos CC 68,191.3 24,022.7 2,399.3 - 147.7 1,383.9 96,145.0
Kingsborough CC 101,666.5 36,210.6 5,562.7 - 248.4 2,457.1 146,145.2
LaGuardia CC 131,030.2 44,144.9 3,607.3 - 376.6 3,174.0 182,333.1
Queensborough CC 111,986.1 41,051.0 3,347.3 - 327.7 2,985.2 159,697.3
Community College Total 711,150.1 240,252.7 24,258.4 - 1,985.8 18,033.1 995,680.1
Shared Services 86,406.6 34,058.4 535.4 17,322.7 138,323.1
Central Administration 26,394.7 14,176.2 201.4 7,090.4 47,862.7
University Programs 42,801.5 1,111.1 100.7 555.7 44,569.0
University Total 2,365,116.5 898,194.7 103,054.1 65,912.0 28,250.8 62,401.1 3,522,929.2
1. Fringes based on Projected Fringes for current fiscal year prorated based on PSR projections2. SC Energy based on current year allocation plus water and sewer, CC Energy based on prior year actuals and excludes fuel oil 3. Building rentals from current year SC Rent Budget, CC building rentals are included in campus based allocation4. Financial Aid includes centrally managed SEEK/CD5. Centralized Purchasing based on current year allocations
7
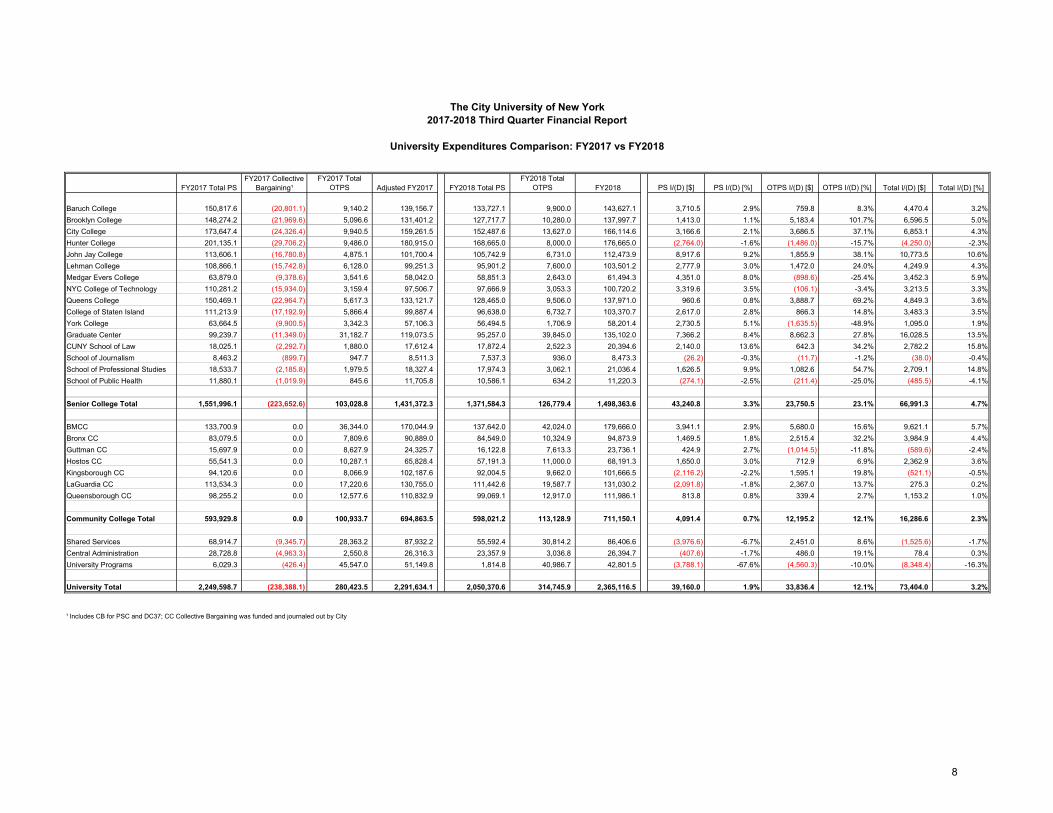
The City University of New York2017-2018 Third Quarter Financial Report
University Expenditures Comparison: FY2017 vs FY2018
FY2017 Total PSFY2017 Collective
Bargaining¹FY2017 Total
OTPS Adjusted FY2017 FY2018 Total PSFY2018 Total
OTPS FY2018 PS I/(D) [$] PS I/(D) [%] OTPS I/(D) [$] OTPS I/(D) [%] Total I/(D) [$] Total I/(D) [%]
Baruch College 150,817.6 (20,801.1) 9,140.2 139,156.7 133,727.1 9,900.0 143,627.1 3,710.5 2.9% 759.8 8.3% 4,470.4 3.2%Brooklyn College 148,274.2 (21,969.6) 5,096.6 131,401.2 127,717.7 10,280.0 137,997.7 1,413.0 1.1% 5,183.4 101.7% 6,596.5 5.0%City College 173,647.4 (24,326.4) 9,940.5 159,261.5 152,487.6 13,627.0 166,114.6 3,166.6 2.1% 3,686.5 37.1% 6,853.1 4.3%Hunter College 201,135.1 (29,706.2) 9,486.0 180,915.0 168,665.0 8,000.0 176,665.0 (2,764.0) -1.6% (1,486.0) -15.7% (4,250.0) -2.3%John Jay College 113,606.1 (16,780.8) 4,875.1 101,700.4 105,742.9 6,731.0 112,473.9 8,917.6 9.2% 1,855.9 38.1% 10,773.5 10.6%Lehman College 108,866.1 (15,742.8) 6,128.0 99,251.3 95,901.2 7,600.0 103,501.2 2,777.9 3.0% 1,472.0 24.0% 4,249.9 4.3%Medgar Evers College 63,879.0 (9,378.6) 3,541.6 58,042.0 58,851.3 2,643.0 61,494.3 4,351.0 8.0% (898.6) -25.4% 3,452.3 5.9%NYC College of Technology 110,281.2 (15,934.0) 3,159.4 97,506.7 97,666.9 3,053.3 100,720.2 3,319.6 3.5% (106.1) -3.4% 3,213.5 3.3%Queens College 150,469.1 (22,964.7) 5,617.3 133,121.7 128,465.0 9,506.0 137,971.0 960.6 0.8% 3,888.7 69.2% 4,849.3 3.6%College of Staten Island 111,213.9 (17,192.9) 5,866.4 99,887.4 96,638.0 6,732.7 103,370.7 2,617.0 2.8% 866.3 14.8% 3,483.3 3.5%York College 63,664.5 (9,900.5) 3,342.3 57,106.3 56,494.5 1,706.9 58,201.4 2,730.5 5.1% (1,635.5) -48.9% 1,095.0 1.9%Graduate Center 99,239.7 (11,349.0) 31,182.7 119,073.5 95,257.0 39,845.0 135,102.0 7,366.2 8.4% 8,662.3 27.8% 16,028.5 13.5%CUNY School of Law 18,025.1 (2,292.7) 1,880.0 17,612.4 17,872.4 2,522.3 20,394.6 2,140.0 13.6% 642.3 34.2% 2,782.2 15.8%School of Journalism 8,463.2 (899.7) 947.7 8,511.3 7,537.3 936.0 8,473.3 (26.2) -0.3% (11.7) -1.2% (38.0) -0.4%School of Professional Studies 18,533.7 (2,185.8) 1,979.5 18,327.4 17,974.3 3,062.1 21,036.4 1,626.5 9.9% 1,082.6 54.7% 2,709.1 14.8%School of Public Health 11,880.1 (1,019.9) 845.6 11,705.8 10,586.1 634.2 11,220.3 (274.1) -2.5% (211.4) -25.0% (485.5) -4.1%
Senior College Total 1,551,996.1 (223,652.6) 103,028.8 1,431,372.3 1,371,584.3 126,779.4 1,498,363.6 43,240.8 3.3% 23,750.5 23.1% 66,991.3 4.7%
BMCC 133,700.9 0.0 36,344.0 170,044.9 137,642.0 42,024.0 179,666.0 3,941.1 2.9% 5,680.0 15.6% 9,621.1 5.7%Bronx CC 83,079.5 0.0 7,809.6 90,889.0 84,549.0 10,324.9 94,873.9 1,469.5 1.8% 2,515.4 32.2% 3,984.9 4.4%Guttman CC 15,697.9 0.0 8,627.9 24,325.7 16,122.8 7,613.3 23,736.1 424.9 2.7% (1,014.5) -11.8% (589.6) -2.4%Hostos CC 55,541.3 0.0 10,287.1 65,828.4 57,191.3 11,000.0 68,191.3 1,650.0 3.0% 712.9 6.9% 2,362.9 3.6%Kingsborough CC 94,120.6 0.0 8,066.9 102,187.6 92,004.5 9,662.0 101,666.5 (2,116.2) -2.2% 1,595.1 19.8% (521.1) -0.5%LaGuardia CC 113,534.3 0.0 17,220.6 130,755.0 111,442.6 19,587.7 131,030.2 (2,091.8) -1.8% 2,367.0 13.7% 275.3 0.2%Queensborough CC 98,255.2 0.0 12,577.6 110,832.9 99,069.1 12,917.0 111,986.1 813.8 0.8% 339.4 2.7% 1,153.2 1.0%
Community College Total 593,929.8 0.0 100,933.7 694,863.5 598,021.2 113,128.9 711,150.1 4,091.4 0.7% 12,195.2 12.1% 16,286.6 2.3%
Shared Services 68,914.7 (9,345.7) 28,363.2 87,932.2 55,592.4 30,814.2 86,406.6 (3,976.6) -6.7% 2,451.0 8.6% (1,525.6) -1.7%Central Administration 28,728.8 (4,963.3) 2,550.8 26,316.3 23,357.9 3,036.8 26,394.7 (407.6) -1.7% 486.0 19.1% 78.4 0.3%University Programs 6,029.3 (426.4) 45,547.0 51,149.8 1,814.8 40,986.7 42,801.5 (3,788.1) -67.6% (4,560.3) -10.0% (8,348.4) -16.3%
University Total 2,249,598.7 (238,388.1) 280,423.5 2,291,634.1 2,050,370.6 314,745.9 2,365,116.5 39,160.0 1.9% 33,836.4 12.1% 73,404.0 3.2%
¹ Includes CB for PSC and DC37; CC Collective Bargaining was funded and journaled out by City
8
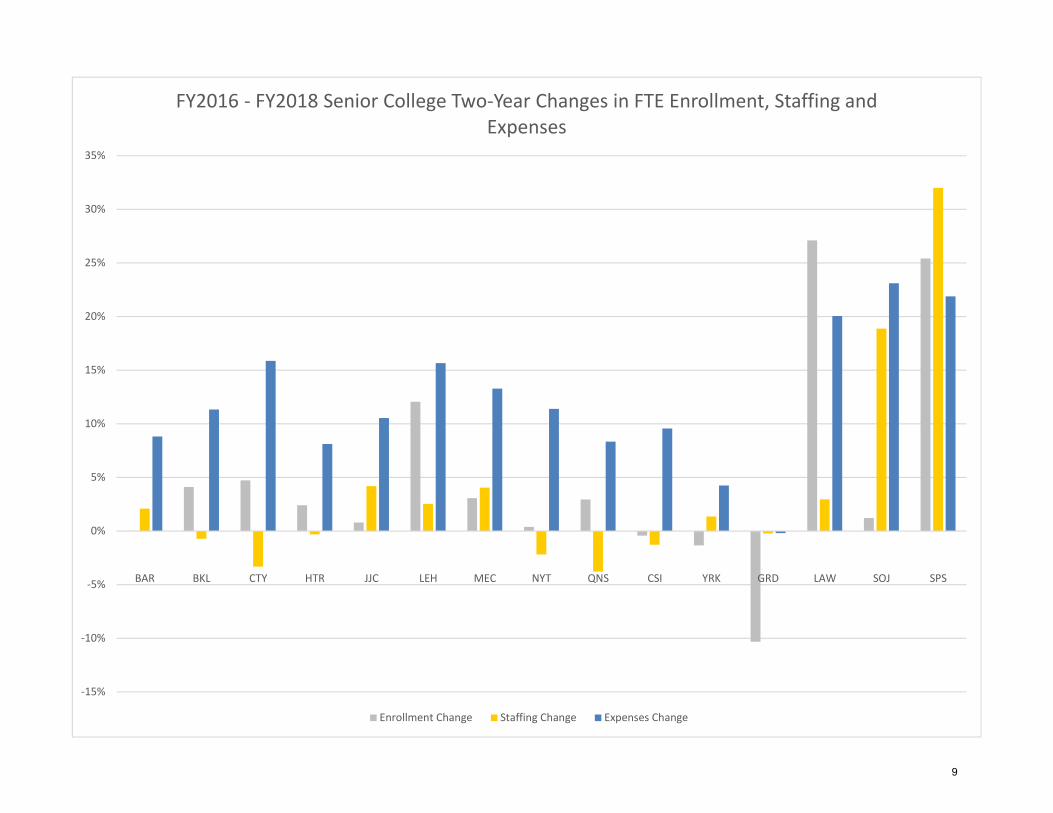
‐15%
‐10%
‐5%
0%
5%
10%
15%
20%
25%
30%
35%
BAR BKL CTY HTR JJC LEH MEC NYT QNS CSI YRK GRD LAW SOJ SPS
FY2016 ‐ FY2018 Senior College Two‐Year Changes in FTE Enrollment, Staffing and Expenses
Enrollment Change Staffing Change Expenses Change
9
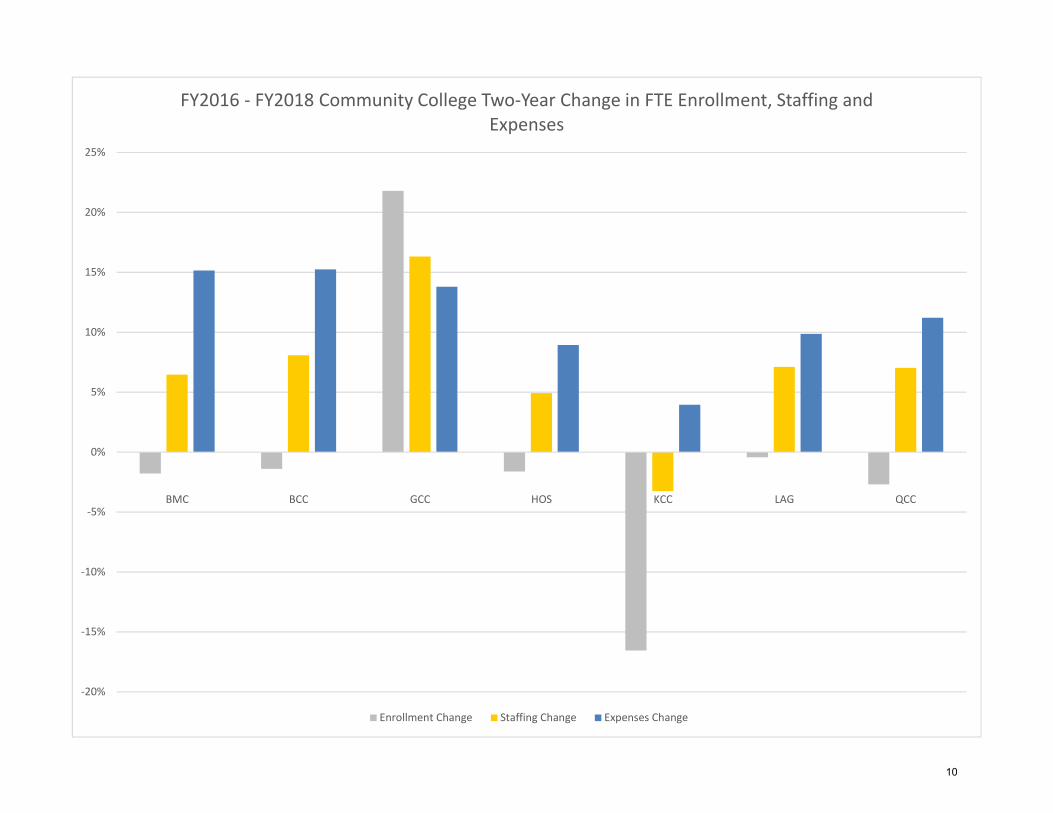
‐20%
‐15%
‐10%
‐5%
0%
5%
10%
15%
20%
25%
BMC BCC GCC HOS KCC LAG QCC
FY2016 ‐ FY2018 Community College Two‐Year Change in FTE Enrollment, Staffing and Expenses
Enrollment Change Staffing Change Expenses Change
10
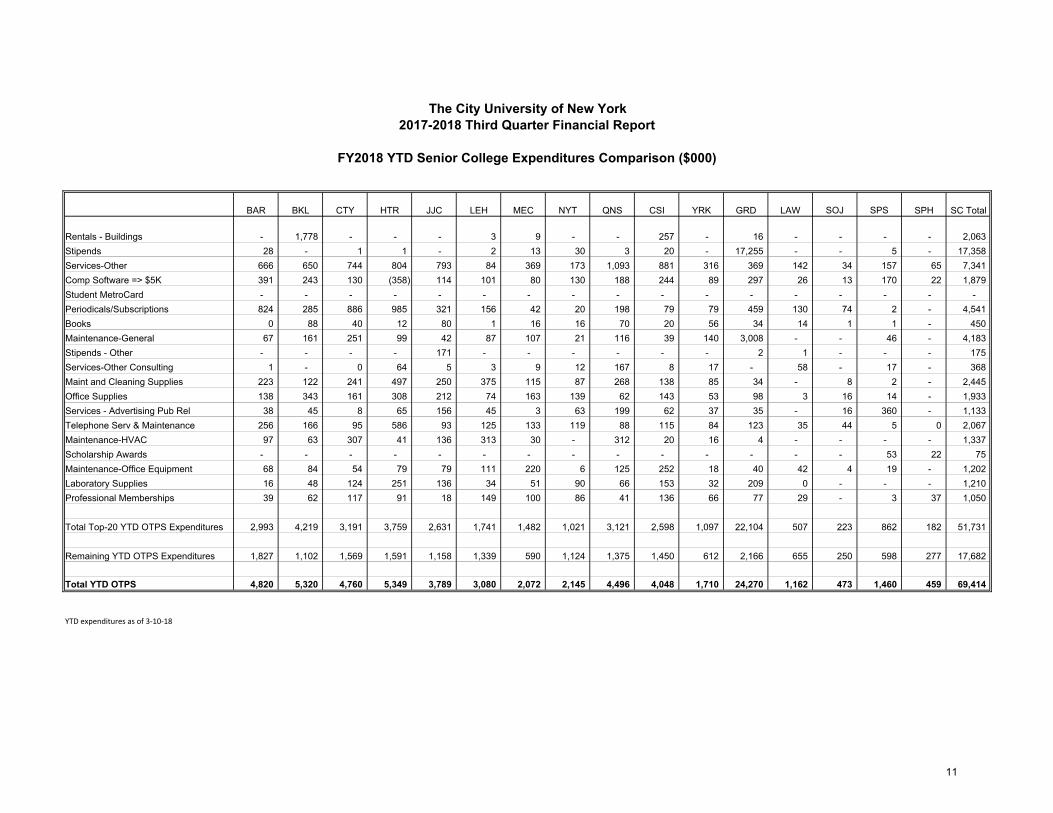
The City University of New York2017-2018 Third Quarter Financial Report
FY2018 YTD Senior College Expenditures Comparison ($000)
BAR BKL CTY HTR JJC LEH MEC NYT QNS CSI YRK GRD LAW SOJ SPS SPH SC Total
Rentals - Buildings - 1,778 - - - 3 9 - - 257 - 16 - - - - 2,063 Stipends 28 - 1 1 - 2 13 30 3 20 - 17,255 - - 5 - 17,358 Services-Other 666 650 744 804 793 84 369 173 1,093 881 316 369 142 34 157 65 7,341 Comp Software => $5K 391 243 130 (358) 114 101 80 130 188 244 89 297 26 13 170 22 1,879 Student MetroCard - - - - - - - - - - - - - - - - - Periodicals/Subscriptions 824 285 886 985 321 156 42 20 198 79 79 459 130 74 2 - 4,541 Books 0 88 40 12 80 1 16 16 70 20 56 34 14 1 1 - 450 Maintenance-General 67 161 251 99 42 87 107 21 116 39 140 3,008 - - 46 - 4,183 Stipends - Other - - - - 171 - - - - - - 2 1 - - - 175 Services-Other Consulting 1 - 0 64 5 3 9 12 167 8 17 - 58 - 17 - 368 Maint and Cleaning Supplies 223 122 241 497 250 375 115 87 268 138 85 34 - 8 2 - 2,445 Office Supplies 138 343 161 308 212 74 163 139 62 143 53 98 3 16 14 - 1,933 Services - Advertising Pub Rel 38 45 8 65 156 45 3 63 199 62 37 35 - 16 360 - 1,133 Telephone Serv & Maintenance 256 166 95 586 93 125 133 119 88 115 84 123 35 44 5 0 2,067 Maintenance-HVAC 97 63 307 41 136 313 30 - 312 20 16 4 - - - - 1,337 Scholarship Awards - - - - - - - - - - - - - - 53 22 75 Maintenance-Office Equipment 68 84 54 79 79 111 220 6 125 252 18 40 42 4 19 - 1,202 Laboratory Supplies 16 48 124 251 136 34 51 90 66 153 32 209 0 - - - 1,210 Professional Memberships 39 62 117 91 18 149 100 86 41 136 66 77 29 - 3 37 1,050
Total Top-20 YTD OTPS Expenditures 2,993 4,219 3,191 3,759 2,631 1,741 1,482 1,021 3,121 2,598 1,097 22,104 507 223 862 182 51,731
Remaining YTD OTPS Expenditures 1,827 1,102 1,569 1,591 1,158 1,339 590 1,124 1,375 1,450 612 2,166 655 250 598 277 17,682
Total YTD OTPS 4,820 5,320 4,760 5,349 3,789 3,080 2,072 2,145 4,496 4,048 1,710 24,270 1,162 473 1,460 459 69,414
YTD expenditures as of 3‐10‐18
11
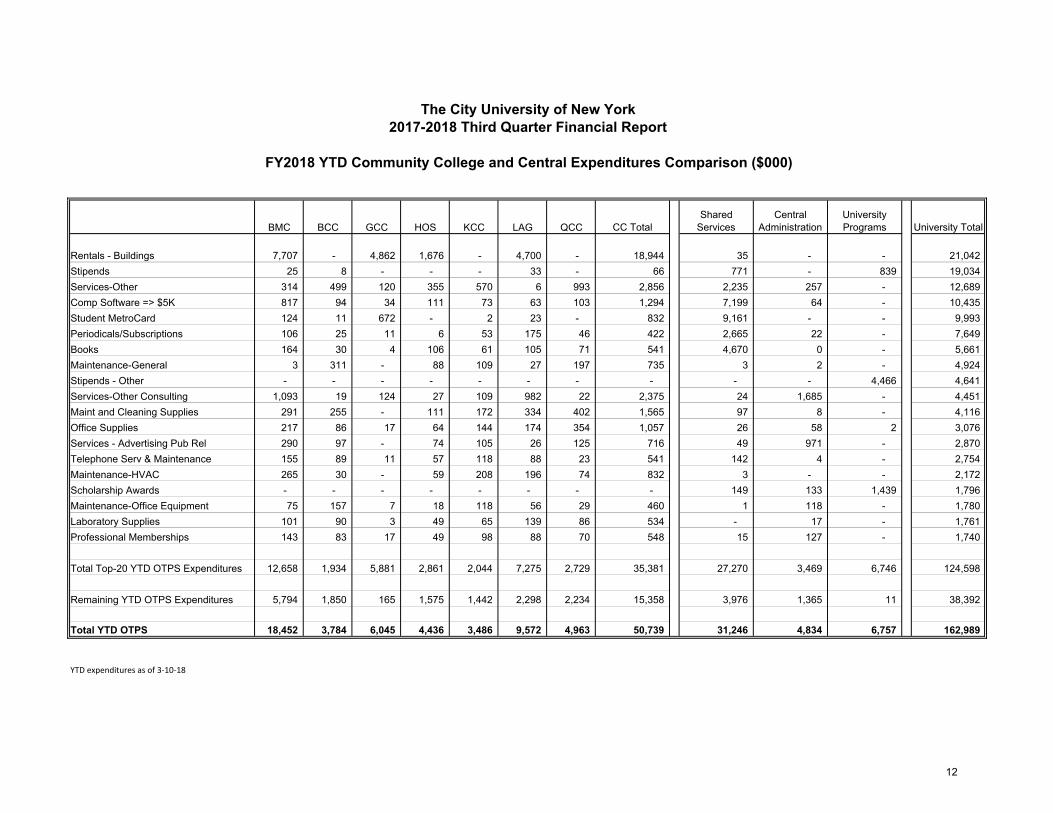
The City University of New York2017-2018 Third Quarter Financial Report
FY2018 YTD Community College and Central Expenditures Comparison ($000)
BMC BCC GCC HOS KCC LAG QCC CC TotalShared
ServicesCentral
AdministrationUniversity Programs University Total
Rentals - Buildings 7,707 - 4,862 1,676 - 4,700 - 18,944 35 - - 21,042 Stipends 25 8 - - - 33 - 66 771 - 839 19,034 Services-Other 314 499 120 355 570 6 993 2,856 2,235 257 - 12,689 Comp Software => $5K 817 94 34 111 73 63 103 1,294 7,199 64 - 10,435 Student MetroCard 124 11 672 - 2 23 - 832 9,161 - - 9,993 Periodicals/Subscriptions 106 25 11 6 53 175 46 422 2,665 22 - 7,649 Books 164 30 4 106 61 105 71 541 4,670 0 - 5,661 Maintenance-General 3 311 - 88 109 27 197 735 3 2 - 4,924 Stipends - Other - - - - - - - - - - 4,466 4,641 Services-Other Consulting 1,093 19 124 27 109 982 22 2,375 24 1,685 - 4,451 Maint and Cleaning Supplies 291 255 - 111 172 334 402 1,565 97 8 - 4,116 Office Supplies 217 86 17 64 144 174 354 1,057 26 58 2 3,076 Services - Advertising Pub Rel 290 97 - 74 105 26 125 716 49 971 - 2,870 Telephone Serv & Maintenance 155 89 11 57 118 88 23 541 142 4 - 2,754 Maintenance-HVAC 265 30 - 59 208 196 74 832 3 - - 2,172 Scholarship Awards - - - - - - - - 149 133 1,439 1,796 Maintenance-Office Equipment 75 157 7 18 118 56 29 460 1 118 - 1,780 Laboratory Supplies 101 90 3 49 65 139 86 534 - 17 - 1,761 Professional Memberships 143 83 17 49 98 88 70 548 15 127 - 1,740
Total Top-20 YTD OTPS Expenditures 12,658 1,934 5,881 2,861 2,044 7,275 2,729 35,381 27,270 3,469 6,746 124,598
Remaining YTD OTPS Expenditures 5,794 1,850 165 1,575 1,442 2,298 2,234 15,358 3,976 1,365 11 38,392
Total YTD OTPS 18,452 3,784 6,045 4,436 3,486 9,572 4,963 50,739 31,246 4,834 6,757 162,989
YTD expenditures as of 3‐10‐18
12
REVENUE
13
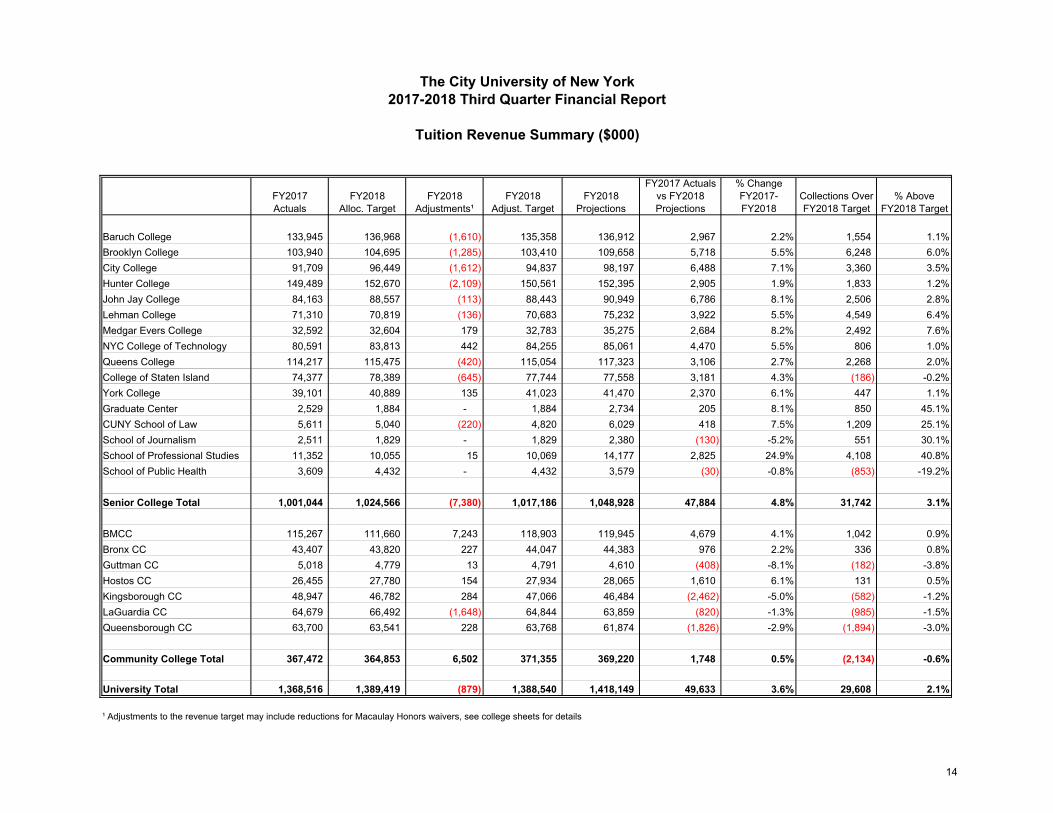
FY2017 Actuals % Change FY2017 FY2018 FY2018 FY2018 FY2018 vs FY2018 FY2017- Collections Over % AboveActuals Alloc. Target Adjustments¹ Adjust. Target Projections Projections FY2018 FY2018 Target FY2018 Target
Baruch College 133,945 136,968 (1,610) 135,358 136,912 2,967 2.2% 1,554 1.1%Brooklyn College 103,940 104,695 (1,285) 103,410 109,658 5,718 5.5% 6,248 6.0%City College 91,709 96,449 (1,612) 94,837 98,197 6,488 7.1% 3,360 3.5%Hunter College 149,489 152,670 (2,109) 150,561 152,395 2,905 1.9% 1,833 1.2%John Jay College 84,163 88,557 (113) 88,443 90,949 6,786 8.1% 2,506 2.8%Lehman College 71,310 70,819 (136) 70,683 75,232 3,922 5.5% 4,549 6.4%Medgar Evers College 32,592 32,604 179 32,783 35,275 2,684 8.2% 2,492 7.6%NYC College of Technology 80,591 83,813 442 84,255 85,061 4,470 5.5% 806 1.0%Queens College 114,217 115,475 (420) 115,054 117,323 3,106 2.7% 2,268 2.0%College of Staten Island 74,377 78,389 (645) 77,744 77,558 3,181 4.3% (186) -0.2%York College 39,101 40,889 135 41,023 41,470 2,370 6.1% 447 1.1%Graduate Center 2,529 1,884 - 1,884 2,734 205 8.1% 850 45.1%CUNY School of Law 5,611 5,040 (220) 4,820 6,029 418 7.5% 1,209 25.1%School of Journalism 2,511 1,829 - 1,829 2,380 (130) -5.2% 551 30.1%School of Professional Studies 11,352 10,055 15 10,069 14,177 2,825 24.9% 4,108 40.8%School of Public Health 3,609 4,432 - 4,432 3,579 (30) -0.8% (853) -19.2%
Senior College Total 1,001,044 1,024,566 (7,380) 1,017,186 1,048,928 47,884 4.8% 31,742 3.1%
BMCC 115,267 111,660 7,243 118,903 119,945 4,679 4.1% 1,042 0.9%Bronx CC 43,407 43,820 227 44,047 44,383 976 2.2% 336 0.8%Guttman CC 5,018 4,779 13 4,791 4,610 (408) -8.1% (182) -3.8%Hostos CC 26,455 27,780 154 27,934 28,065 1,610 6.1% 131 0.5%Kingsborough CC 48,947 46,782 284 47,066 46,484 (2,462) -5.0% (582) -1.2%LaGuardia CC 64,679 66,492 (1,648) 64,844 63,859 (820) -1.3% (985) -1.5%Queensborough CC 63,700 63,541 228 63,768 61,874 (1,826) -2.9% (1,894) -3.0%
Community College Total 367,472 364,853 6,502 371,355 369,220 1,748 0.5% (2,134) -0.6%
University Total 1,368,516 1,389,419 (879) 1,388,540 1,418,149 49,633 3.6% 29,608 2.1%
¹ Adjustments to the revenue target may include reductions for Macaulay Honors waivers, see college sheets for details
Tuition Revenue Summary ($000)
2017-2018 Third Quarter Financial ReportThe City University of New York
14
The City University of New York2017-2018 Third Quarter Financial Report
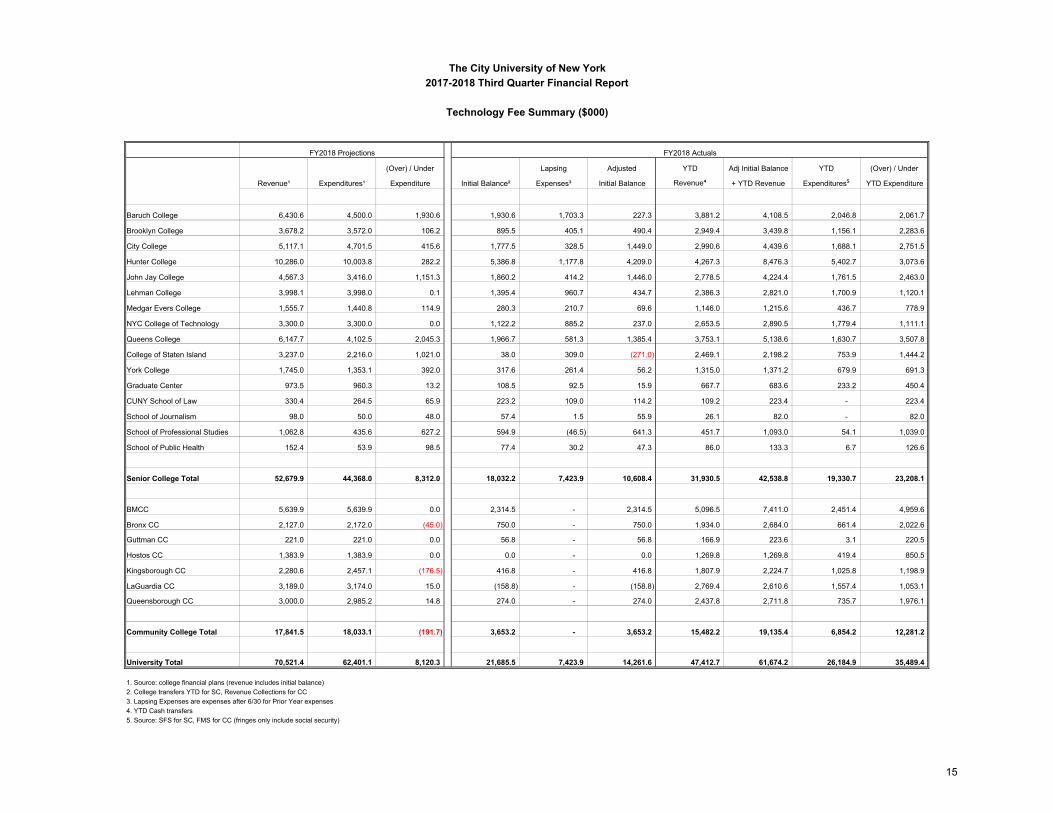
Technology Fee Summary ($000)
(Over) / Under Lapsing Adjusted YTD Adj Initial Balance YTD (Over) / Under
Revenue¹ Expenditures¹ Expenditure Initial Balance² Expenses³ Initial Balance Revenue⁴ + YTD Revenue Expenditures⁵ YTD Expenditure
Baruch College 6,430.6 4,500.0 1,930.6 1,930.6 1,703.3 227.3 3,881.2 4,108.5 2,046.8 2,061.7
Brooklyn College 3,678.2 3,572.0 106.2 895.5 405.1 490.4 2,949.4 3,439.8 1,156.1 2,283.6
City College 5,117.1 4,701.5 415.6 1,777.5 328.5 1,449.0 2,990.6 4,439.6 1,688.1 2,751.5
Hunter College 10,286.0 10,003.8 282.2 5,386.8 1,177.8 4,209.0 4,267.3 8,476.3 5,402.7 3,073.6
John Jay College 4,567.3 3,416.0 1,151.3 1,860.2 414.2 1,446.0 2,778.5 4,224.4 1,761.5 2,463.0
Lehman College 3,998.1 3,998.0 0.1 1,395.4 960.7 434.7 2,386.3 2,821.0 1,700.9 1,120.1
Medgar Evers College 1,555.7 1,440.8 114.9 280.3 210.7 69.6 1,146.0 1,215.6 436.7 778.9
NYC College of Technology 3,300.0 3,300.0 0.0 1,122.2 885.2 237.0 2,653.5 2,890.5 1,779.4 1,111.1
Queens College 6,147.7 4,102.5 2,045.3 1,966.7 581.3 1,385.4 3,753.1 5,138.6 1,630.7 3,507.8
College of Staten Island 3,237.0 2,216.0 1,021.0 38.0 309.0 (271.0) 2,469.1 2,198.2 753.9 1,444.2
York College 1,745.0 1,353.1 392.0 317.6 261.4 56.2 1,315.0 1,371.2 679.9 691.3
Graduate Center 973.5 960.3 13.2 108.5 92.5 15.9 667.7 683.6 233.2 450.4
CUNY School of Law 330.4 264.5 65.9 223.2 109.0 114.2 109.2 223.4 - 223.4
School of Journalism 98.0 50.0 48.0 57.4 1.5 55.9 26.1 82.0 - 82.0
School of Professional Studies 1,062.8 435.6 627.2 594.9 (46.5) 641.3 451.7 1,093.0 54.1 1,039.0
School of Public Health 152.4 53.9 98.5 77.4 30.2 47.3 86.0 133.3 6.7 126.6
Senior College Total 52,679.9 44,368.0 8,312.0 18,032.2 7,423.9 10,608.4 31,930.5 42,538.8 19,330.7 23,208.1
BMCC 5,639.9 5,639.9 0.0 2,314.5 - 2,314.5 5,096.5 7,411.0 2,451.4 4,959.6
Bronx CC 2,127.0 2,172.0 (45.0) 750.0 - 750.0 1,934.0 2,684.0 661.4 2,022.6
Guttman CC 221.0 221.0 0.0 56.8 - 56.8 166.9 223.6 3.1 220.5
Hostos CC 1,383.9 1,383.9 0.0 0.0 - 0.0 1,269.8 1,269.8 419.4 850.5
Kingsborough CC 2,280.6 2,457.1 (176.5) 416.8 - 416.8 1,807.9 2,224.7 1,025.8 1,198.9
LaGuardia CC 3,189.0 3,174.0 15.0 (158.8) - (158.8) 2,769.4 2,610.6 1,557.4 1,053.1
Queensborough CC 3,000.0 2,985.2 14.8 274.0 - 274.0 2,437.8 2,711.8 735.7 1,976.1
Community College Total 17,841.5 18,033.1 (191.7) 3,653.2 - 3,653.2 15,482.2 19,135.4 6,854.2 12,281.2
University Total 70,521.4 62,401.1 8,120.3 21,685.5 7,423.9 14,261.6 47,412.7 61,674.2 26,184.9 35,489.4
1. Source: college financial plans (revenue includes initial balance)2. College transfers YTD for SC, Revenue Collections for CC3. Lapsing Expenses are expenses after 6/30 for Prior Year expenses4. YTD Cash transfers5. Source: SFS for SC, FMS for CC (fringes only include social security)
FY2018 Projections FY2018 Actuals
15
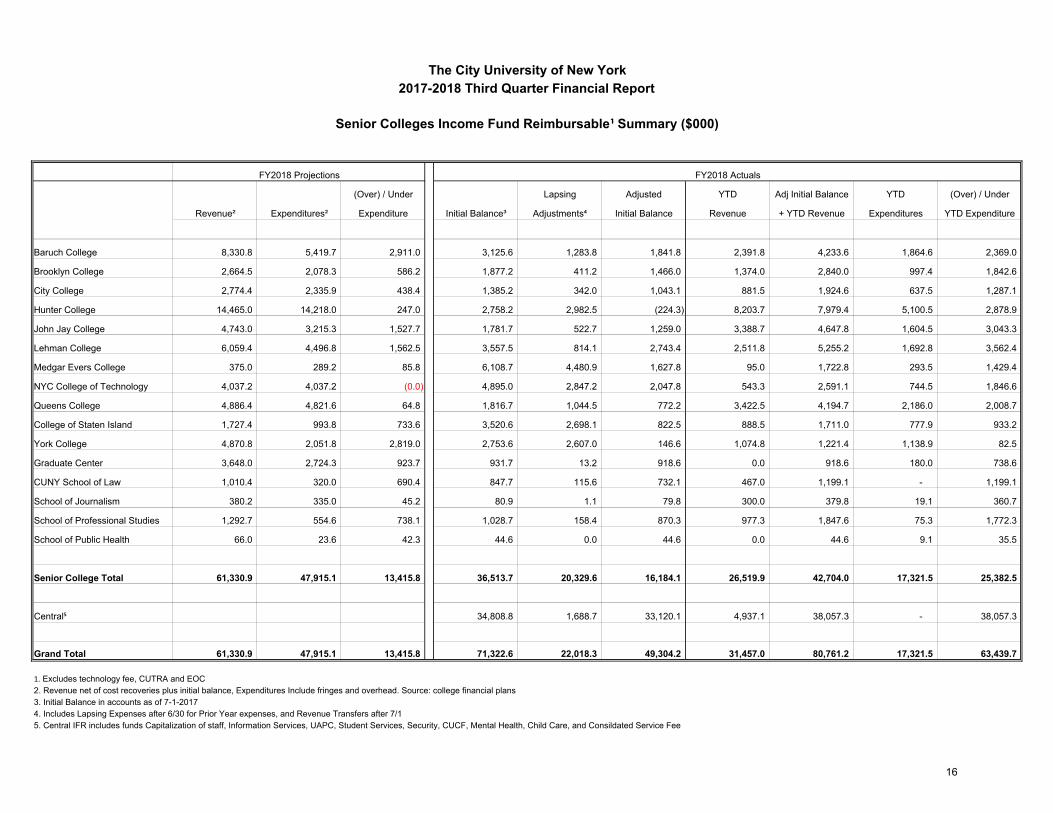
The City University of New York2017-2018 Third Quarter Financial Report
Senior Colleges Income Fund Reimbursable¹ Summary ($000)
(Over) / Under Lapsing Adjusted YTD Adj Initial Balance YTD (Over) / Under
Revenue² Expenditures² Expenditure Initial Balance³ Adjustments⁴ Initial Balance Revenue + YTD Revenue Expenditures YTD Expenditure
Baruch College 8,330.8 5,419.7 2,911.0 3,125.6 1,283.8 1,841.8 2,391.8 4,233.6 1,864.6 2,369.0
Brooklyn College 2,664.5 2,078.3 586.2 1,877.2 411.2 1,466.0 1,374.0 2,840.0 997.4 1,842.6
City College 2,774.4 2,335.9 438.4 1,385.2 342.0 1,043.1 881.5 1,924.6 637.5 1,287.1
Hunter College 14,465.0 14,218.0 247.0 2,758.2 2,982.5 (224.3) 8,203.7 7,979.4 5,100.5 2,878.9
John Jay College 4,743.0 3,215.3 1,527.7 1,781.7 522.7 1,259.0 3,388.7 4,647.8 1,604.5 3,043.3
Lehman College 6,059.4 4,496.8 1,562.5 3,557.5 814.1 2,743.4 2,511.8 5,255.2 1,692.8 3,562.4
Medgar Evers College 375.0 289.2 85.8 6,108.7 4,480.9 1,627.8 95.0 1,722.8 293.5 1,429.4
NYC College of Technology 4,037.2 4,037.2 (0.0) 4,895.0 2,847.2 2,047.8 543.3 2,591.1 744.5 1,846.6
Queens College 4,886.4 4,821.6 64.8 1,816.7 1,044.5 772.2 3,422.5 4,194.7 2,186.0 2,008.7
College of Staten Island 1,727.4 993.8 733.6 3,520.6 2,698.1 822.5 888.5 1,711.0 777.9 933.2
York College 4,870.8 2,051.8 2,819.0 2,753.6 2,607.0 146.6 1,074.8 1,221.4 1,138.9 82.5
Graduate Center 3,648.0 2,724.3 923.7 931.7 13.2 918.6 0.0 918.6 180.0 738.6
CUNY School of Law 1,010.4 320.0 690.4 847.7 115.6 732.1 467.0 1,199.1 - 1,199.1
School of Journalism 380.2 335.0 45.2 80.9 1.1 79.8 300.0 379.8 19.1 360.7
School of Professional Studies 1,292.7 554.6 738.1 1,028.7 158.4 870.3 977.3 1,847.6 75.3 1,772.3
School of Public Health 66.0 23.6 42.3 44.6 0.0 44.6 0.0 44.6 9.1 35.5
Senior College Total 61,330.9 47,915.1 13,415.8 36,513.7 20,329.6 16,184.1 26,519.9 42,704.0 17,321.5 25,382.5
Central⁵ 34,808.8 1,688.7 33,120.1 4,937.1 38,057.3 - 38,057.3
Grand Total 61,330.9 47,915.1 13,415.8 71,322.6 22,018.3 49,304.2 31,457.0 80,761.2 17,321.5 63,439.7
1. Excludes technology fee, CUTRA and EOC2. Revenue net of cost recoveries plus initial balance, Expenditures Include fringes and overhead. Source: college financial plans3. Initial Balance in accounts as of 7-1-20174. Includes Lapsing Expenses after 6/30 for Prior Year expenses, and Revenue Transfers after 7/15. Central IFR includes funds Capitalization of staff, Information Services, UAPC, Student Services, Security, CUCF, Mental Health, Child Care, and Consildated Service Fee
FY2018 Projections FY2018 Actuals
16
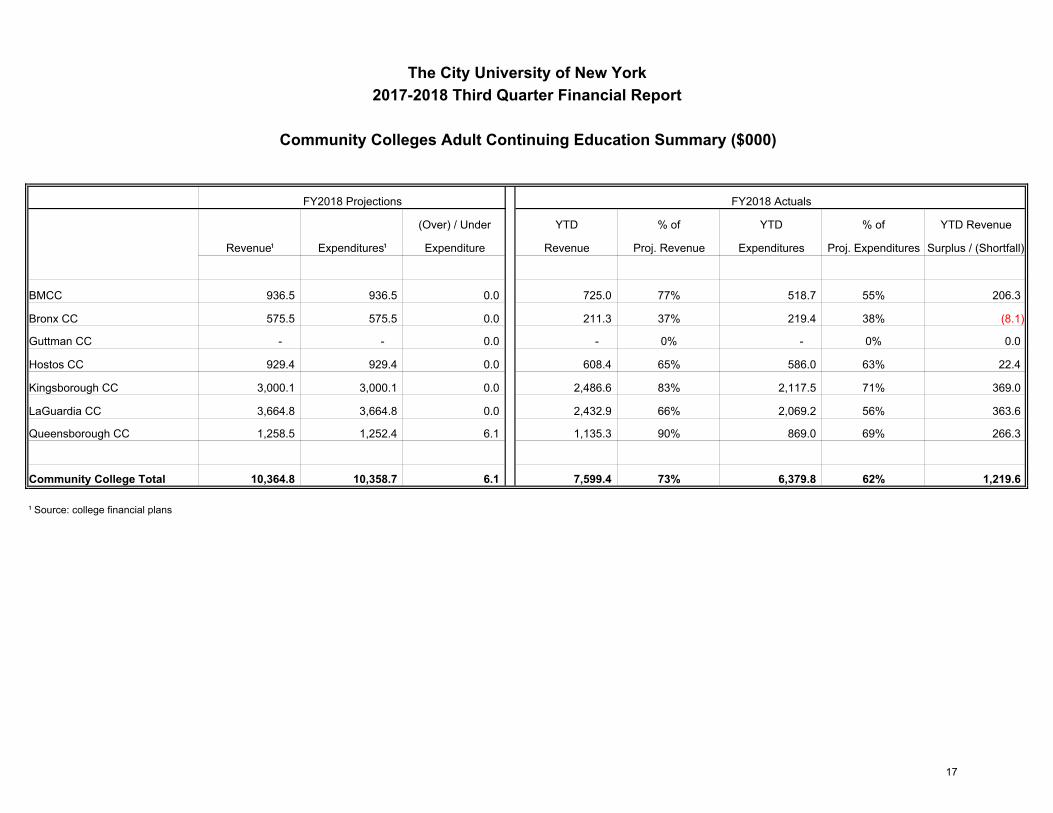
The City University of New York2017-2018 Third Quarter Financial Report
Community Colleges Adult Continuing Education Summary ($000)
(Over) / Under YTD % of YTD % of YTD Revenue
Revenue¹ Expenditures¹ Expenditure Revenue Proj. Revenue Expenditures Proj. Expenditures Surplus / (Shortfall)
BMCC 936.5 936.5 0.0 725.0 77% 518.7 55% 206.3
Bronx CC 575.5 575.5 0.0 211.3 37% 219.4 38% (8.1)
Guttman CC - - 0.0 - 0% - 0% 0.0
Hostos CC 929.4 929.4 0.0 608.4 65% 586.0 63% 22.4
Kingsborough CC 3,000.1 3,000.1 0.0 2,486.6 83% 2,117.5 71% 369.0
LaGuardia CC 3,664.8 3,664.8 0.0 2,432.9 66% 2,069.2 56% 363.6
Queensborough CC 1,258.5 1,252.4 6.1 1,135.3 90% 869.0 69% 266.3
Community College Total 10,364.8 10,358.7 6.1 7,599.4 73% 6,379.8 62% 1,219.6
¹ Source: college financial plans
FY2018 Projections FY2018 Actuals
17

ENROLLMENT
18
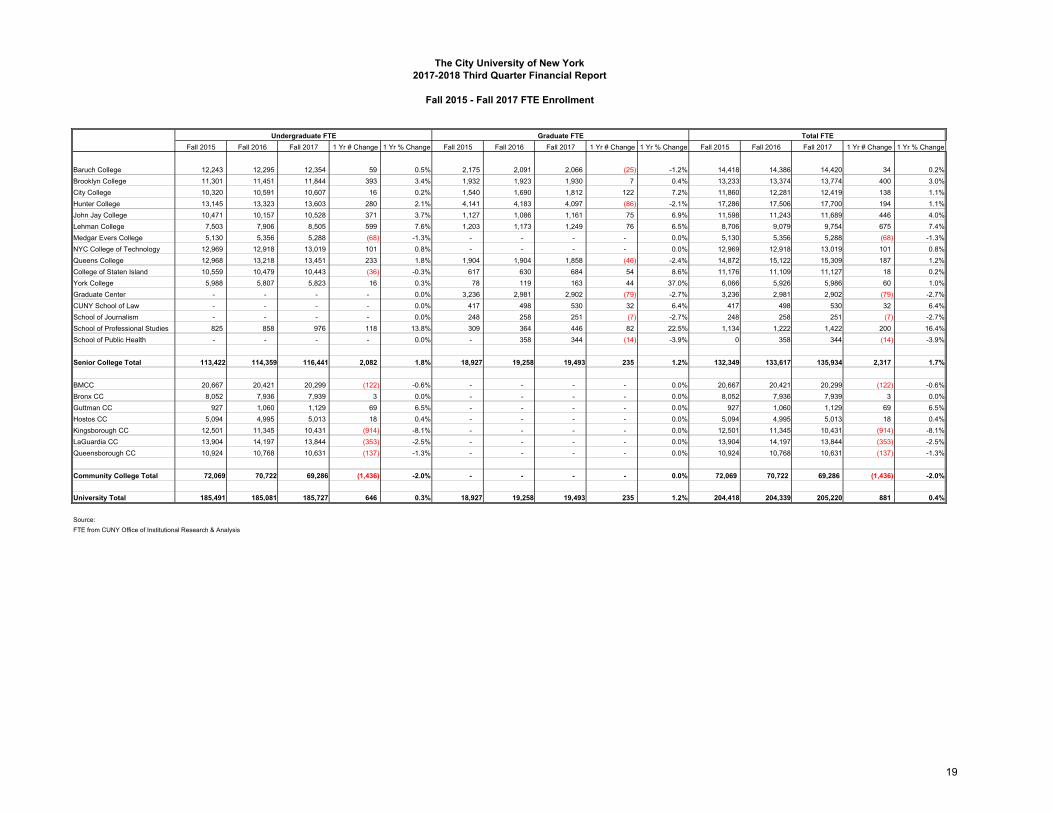
The City University of New York2017-2018 Third Quarter Financial Report
Fall 2015 - Fall 2017 FTE Enrollment
Undergraduate FTE Graduate FTE Total FTEFall 2015 Fall 2016 Fall 2017 1 Yr # Change 1 Yr % Change Fall 2015 Fall 2016 Fall 2017 1 Yr # Change 1 Yr % Change Fall 2015 Fall 2016 Fall 2017 1 Yr # Change 1 Yr % Change
Baruch College 12,243 12,295 12,354 59 0.5% 2,175 2,091 2,066 (25) -1.2% 14,418 14,386 14,420 34 0.2%Brooklyn College 11,301 11,451 11,844 393 3.4% 1,932 1,923 1,930 7 0.4% 13,233 13,374 13,774 400 3.0%City College 10,320 10,591 10,607 16 0.2% 1,540 1,690 1,812 122 7.2% 11,860 12,281 12,419 138 1.1%Hunter College 13,145 13,323 13,603 280 2.1% 4,141 4,183 4,097 (86) -2.1% 17,286 17,506 17,700 194 1.1%John Jay College 10,471 10,157 10,528 371 3.7% 1,127 1,086 1,161 75 6.9% 11,598 11,243 11,689 446 4.0%Lehman College 7,503 7,906 8,505 599 7.6% 1,203 1,173 1,249 76 6.5% 8,706 9,079 9,754 675 7.4%Medgar Evers College 5,130 5,356 5,288 (68) -1.3% - - - - 0.0% 5,130 5,356 5,288 (68) -1.3%NYC College of Technology 12,969 12,918 13,019 101 0.8% - - - - 0.0% 12,969 12,918 13,019 101 0.8%Queens College 12,968 13,218 13,451 233 1.8% 1,904 1,904 1,858 (46) -2.4% 14,872 15,122 15,309 187 1.2%College of Staten Island 10,559 10,479 10,443 (36) -0.3% 617 630 684 54 8.6% 11,176 11,109 11,127 18 0.2%York College 5,988 5,807 5,823 16 0.3% 78 119 163 44 37.0% 6,066 5,926 5,986 60 1.0%Graduate Center - - - - 0.0% 3,236 2,981 2,902 (79) -2.7% 3,236 2,981 2,902 (79) -2.7%CUNY School of Law - - - - 0.0% 417 498 530 32 6.4% 417 498 530 32 6.4%School of Journalism - - - - 0.0% 248 258 251 (7) -2.7% 248 258 251 (7) -2.7%School of Professional Studies 825 858 976 118 13.8% 309 364 446 82 22.5% 1,134 1,222 1,422 200 16.4%School of Public Health - - - - 0.0% - 358 344 (14) -3.9% 0 358 344 (14) -3.9%
Senior College Total 113,422 114,359 116,441 2,082 1.8% 18,927 19,258 19,493 235 1.2% 132,349 133,617 135,934 2,317 1.7%
BMCC 20,667 20,421 20,299 (122) -0.6% - - - - 0.0% 20,667 20,421 20,299 (122) -0.6%Bronx CC 8,052 7,936 7,939 3 0.0% - - - - 0.0% 8,052 7,936 7,939 3 0.0%Guttman CC 927 1,060 1,129 69 6.5% - - - - 0.0% 927 1,060 1,129 69 6.5%Hostos CC 5,094 4,995 5,013 18 0.4% - - - - 0.0% 5,094 4,995 5,013 18 0.4%Kingsborough CC 12,501 11,345 10,431 (914) -8.1% - - - - 0.0% 12,501 11,345 10,431 (914) -8.1%LaGuardia CC 13,904 14,197 13,844 (353) -2.5% - - - - 0.0% 13,904 14,197 13,844 (353) -2.5%Queensborough CC 10,924 10,768 10,631 (137) -1.3% - - - - 0.0% 10,924 10,768 10,631 (137) -1.3%
Community College Total 72,069 70,722 69,286 (1,436) -2.0% - - - - 0.0% 72,069 70,722 69,286 (1,436) -2.0%
University Total 185,491 185,081 185,727 646 0.3% 18,927 19,258 19,493 235 1.2% 204,418 204,339 205,220 881 0.4%
Source: FTE from CUNY Office of Institutional Research & Analysis
19
FULL TIMESTAFFING
20
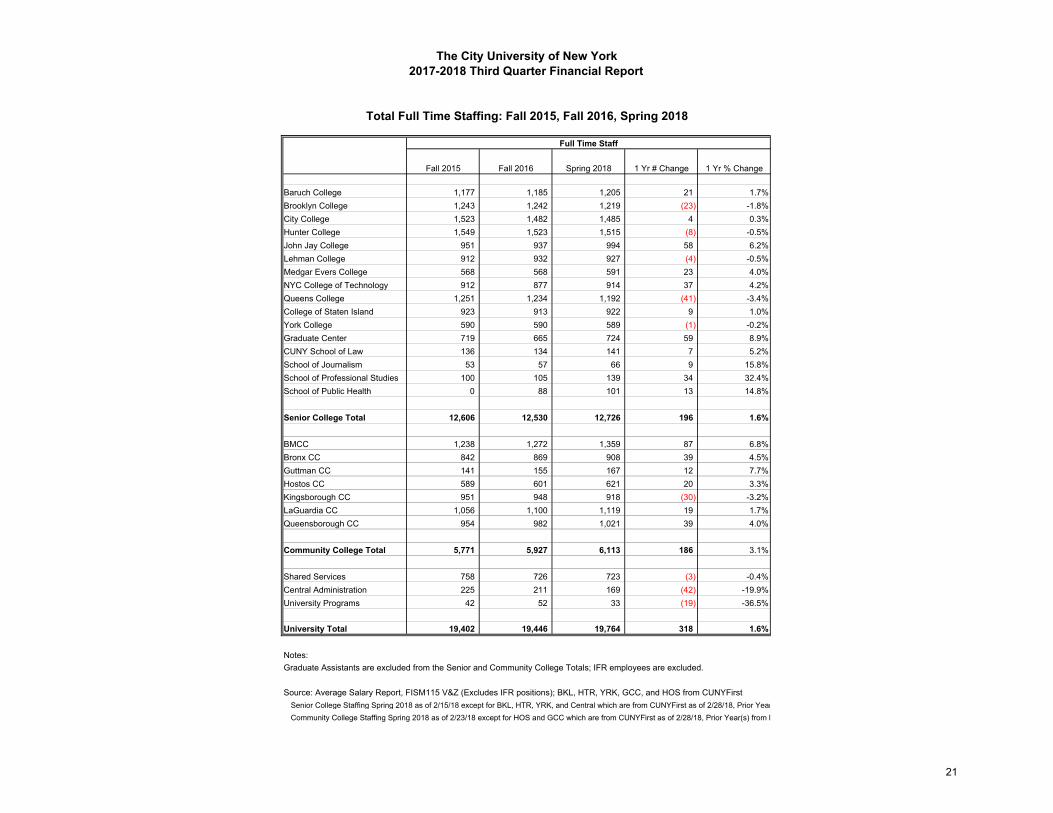
Fall 2015 Fall 2016 Spring 2018 1 Yr # Change 1 Yr % Change
Baruch College 1,177 1,185 1,205 21 1.7%Brooklyn College 1,243 1,242 1,219 (23) -1.8%City College 1,523 1,482 1,485 4 0.3%Hunter College 1,549 1,523 1,515 (8) -0.5%John Jay College 951 937 994 58 6.2%Lehman College 912 932 927 (4) -0.5%Medgar Evers College 568 568 591 23 4.0%NYC College of Technology 912 877 914 37 4.2%Queens College 1,251 1,234 1,192 (41) -3.4%College of Staten Island 923 913 922 9 1.0%York College 590 590 589 (1) -0.2%Graduate Center 719 665 724 59 8.9%CUNY School of Law 136 134 141 7 5.2%School of Journalism 53 57 66 9 15.8%School of Professional Studies 100 105 139 34 32.4%School of Public Health 0 88 101 13 14.8%
Senior College Total 12,606 12,530 12,726 196 1.6%
BMCC 1,238 1,272 1,359 87 6.8%Bronx CC 842 869 908 39 4.5%Guttman CC 141 155 167 12 7.7%Hostos CC 589 601 621 20 3.3%Kingsborough CC 951 948 918 (30) -3.2%LaGuardia CC 1,056 1,100 1,119 19 1.7%Queensborough CC 954 982 1,021 39 4.0%
Community College Total 5,771 5,927 6,113 186 3.1%
Shared Services 758 726 723 (3) -0.4%Central Administration 225 211 169 (42) -19.9%University Programs 42 52 33 (19) -36.5%
University Total 19,402 19,446 19,764 318 1.6%
Notes:Graduate Assistants are excluded from the Senior and Community College Totals; IFR employees are excluded.
Source: Average Salary Report, FISM115 V&Z (Excludes IFR positions); BKL, HTR, YRK, GCC, and HOS from CUNYFirstSenior College Staffing Spring 2018 as of 2/15/18 except for BKL, HTR, YRK, and Central which are from CUNYFirst as of 2/28/18, Prior YearCommunity College Staffing Spring 2018 as of 2/23/18 except for HOS and GCC which are from CUNYFirst as of 2/28/18, Prior Year(s) from l
2017-2018 Third Quarter Financial ReportThe City University of New York
Full Time Staff
Total Full Time Staffing: Fall 2015, Fall 2016, Spring 2018
21
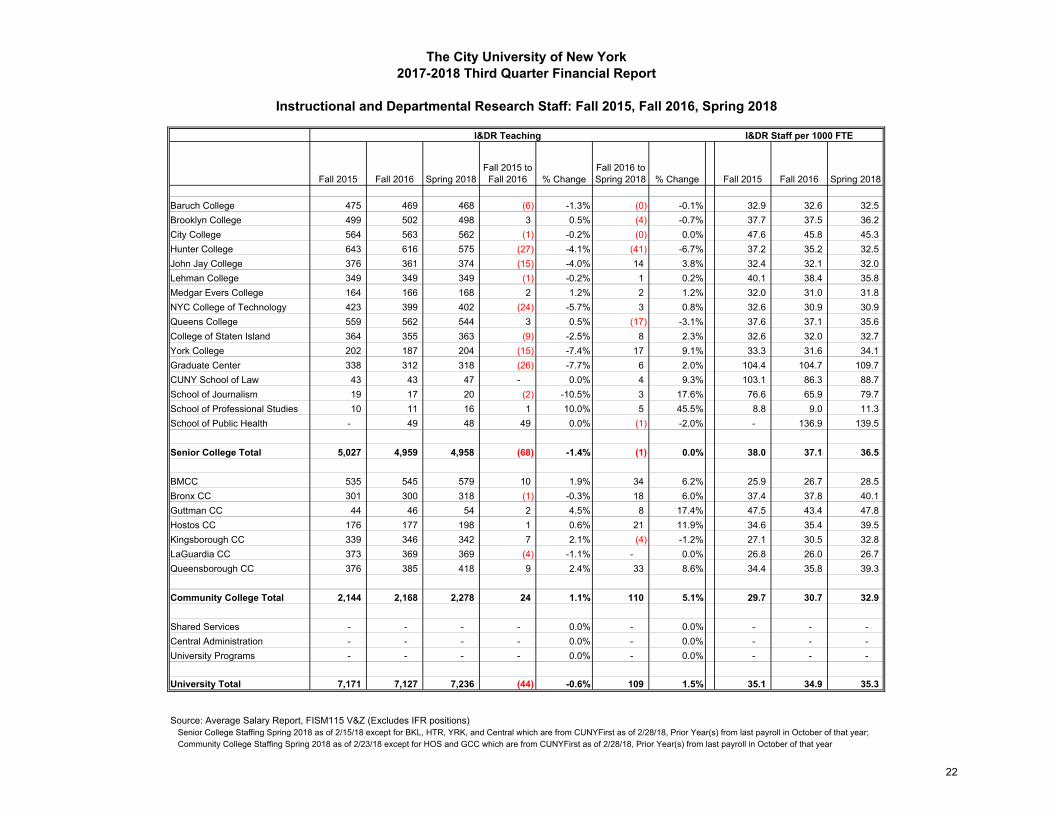
Fall 2015 Fall 2016 Spring 2018Fall 2015 to
Fall 2016 % Change Fall 2016 to Spring 2018 % Change Fall 2015 Fall 2016 Spring 2018
Baruch College 475 469 468 (6) -1.3% (0) -0.1% 32.9 32.6 32.5 Brooklyn College 499 502 498 3 0.5% (4) -0.7% 37.7 37.5 36.2 City College 564 563 562 (1) -0.2% (0) 0.0% 47.6 45.8 45.3 Hunter College 643 616 575 (27) -4.1% (41) -6.7% 37.2 35.2 32.5 John Jay College 376 361 374 (15) -4.0% 14 3.8% 32.4 32.1 32.0 Lehman College 349 349 349 (1) -0.2% 1 0.2% 40.1 38.4 35.8 Medgar Evers College 164 166 168 2 1.2% 2 1.2% 32.0 31.0 31.8 NYC College of Technology 423 399 402 (24) -5.7% 3 0.8% 32.6 30.9 30.9 Queens College 559 562 544 3 0.5% (17) -3.1% 37.6 37.1 35.6 College of Staten Island 364 355 363 (9) -2.5% 8 2.3% 32.6 32.0 32.7 York College 202 187 204 (15) -7.4% 17 9.1% 33.3 31.6 34.1 Graduate Center 338 312 318 (26) -7.7% 6 2.0% 104.4 104.7 109.7 CUNY School of Law 43 43 47 - 0.0% 4 9.3% 103.1 86.3 88.7 School of Journalism 19 17 20 (2) -10.5% 3 17.6% 76.6 65.9 79.7 School of Professional Studies 10 11 16 1 10.0% 5 45.5% 8.8 9.0 11.3 School of Public Health - 49 48 49 0.0% (1) -2.0% - 136.9 139.5
Senior College Total 5,027 4,959 4,958 (68) -1.4% (1) 0.0% 38.0 37.1 36.5
BMCC 535 545 579 10 1.9% 34 6.2% 25.9 26.7 28.5 Bronx CC 301 300 318 (1) -0.3% 18 6.0% 37.4 37.8 40.1 Guttman CC 44 46 54 2 4.5% 8 17.4% 47.5 43.4 47.8 Hostos CC 176 177 198 1 0.6% 21 11.9% 34.6 35.4 39.5 Kingsborough CC 339 346 342 7 2.1% (4) -1.2% 27.1 30.5 32.8 LaGuardia CC 373 369 369 (4) -1.1% - 0.0% 26.8 26.0 26.7 Queensborough CC 376 385 418 9 2.4% 33 8.6% 34.4 35.8 39.3
Community College Total 2,144 2,168 2,278 24 1.1% 110 5.1% 29.7 30.7 32.9
Shared Services - - - - 0.0% - 0.0% - - - Central Administration - - - - 0.0% - 0.0% - - - University Programs - - - - 0.0% - 0.0% - - -
University Total 7,171 7,127 7,236 (44) -0.6% 109 1.5% 35.1 34.9 35.3
Source: Average Salary Report, FISM115 V&Z (Excludes IFR positions)Senior College Staffing Spring 2018 as of 2/15/18 except for BKL, HTR, YRK, and Central which are from CUNYFirst as of 2/28/18, Prior Year(s) from last payroll in October of that year; Community College Staffing Spring 2018 as of 2/23/18 except for HOS and GCC which are from CUNYFirst as of 2/28/18, Prior Year(s) from last payroll in October of that year
I&DR Teaching I&DR Staff per 1000 FTE
Instructional and Departmental Research Staff: Fall 2015, Fall 2016, Spring 2018
2017-2018 Third Quarter Financial ReportThe City University of New York
22
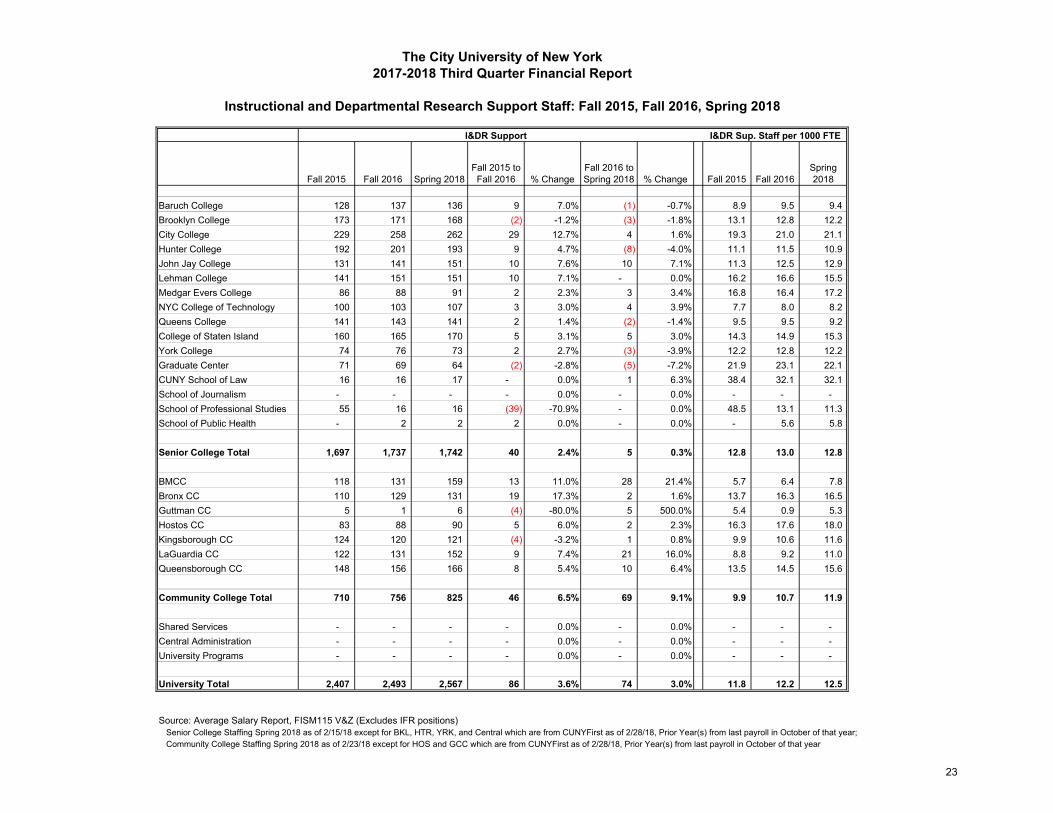
Fall 2015 Fall 2016 Spring 2018Fall 2015 to
Fall 2016 % Change Fall 2016 to Spring 2018 % Change Fall 2015 Fall 2016
Spring 2018
Baruch College 128 137 136 9 7.0% (1) -0.7% 8.9 9.5 9.4 Brooklyn College 173 171 168 (2) -1.2% (3) -1.8% 13.1 12.8 12.2 City College 229 258 262 29 12.7% 4 1.6% 19.3 21.0 21.1 Hunter College 192 201 193 9 4.7% (8) -4.0% 11.1 11.5 10.9 John Jay College 131 141 151 10 7.6% 10 7.1% 11.3 12.5 12.9 Lehman College 141 151 151 10 7.1% - 0.0% 16.2 16.6 15.5 Medgar Evers College 86 88 91 2 2.3% 3 3.4% 16.8 16.4 17.2 NYC College of Technology 100 103 107 3 3.0% 4 3.9% 7.7 8.0 8.2 Queens College 141 143 141 2 1.4% (2) -1.4% 9.5 9.5 9.2 College of Staten Island 160 165 170 5 3.1% 5 3.0% 14.3 14.9 15.3 York College 74 76 73 2 2.7% (3) -3.9% 12.2 12.8 12.2 Graduate Center 71 69 64 (2) -2.8% (5) -7.2% 21.9 23.1 22.1 CUNY School of Law 16 16 17 - 0.0% 1 6.3% 38.4 32.1 32.1 School of Journalism - - - - 0.0% - 0.0% - - - School of Professional Studies 55 16 16 (39) -70.9% - 0.0% 48.5 13.1 11.3 School of Public Health - 2 2 2 0.0% - 0.0% - 5.6 5.8
Senior College Total 1,697 1,737 1,742 40 2.4% 5 0.3% 12.8 13.0 12.8
BMCC 118 131 159 13 11.0% 28 21.4% 5.7 6.4 7.8 Bronx CC 110 129 131 19 17.3% 2 1.6% 13.7 16.3 16.5 Guttman CC 5 1 6 (4) -80.0% 5 500.0% 5.4 0.9 5.3 Hostos CC 83 88 90 5 6.0% 2 2.3% 16.3 17.6 18.0 Kingsborough CC 124 120 121 (4) -3.2% 1 0.8% 9.9 10.6 11.6 LaGuardia CC 122 131 152 9 7.4% 21 16.0% 8.8 9.2 11.0 Queensborough CC 148 156 166 8 5.4% 10 6.4% 13.5 14.5 15.6
Community College Total 710 756 825 46 6.5% 69 9.1% 9.9 10.7 11.9
Shared Services - - - - 0.0% - 0.0% - - - Central Administration - - - - 0.0% - 0.0% - - - University Programs - - - - 0.0% - 0.0% - - -
University Total 2,407 2,493 2,567 86 3.6% 74 3.0% 11.8 12.2 12.5
Source: Average Salary Report, FISM115 V&Z (Excludes IFR positions)Senior College Staffing Spring 2018 as of 2/15/18 except for BKL, HTR, YRK, and Central which are from CUNYFirst as of 2/28/18, Prior Year(s) from last payroll in October of that year; Community College Staffing Spring 2018 as of 2/23/18 except for HOS and GCC which are from CUNYFirst as of 2/28/18, Prior Year(s) from last payroll in October of that year
I&DR Support I&DR Sup. Staff per 1000 FTE
Instructional and Departmental Research Support Staff: Fall 2015, Fall 2016, Spring 2018
2017-2018 Third Quarter Financial ReportThe City University of New York
23
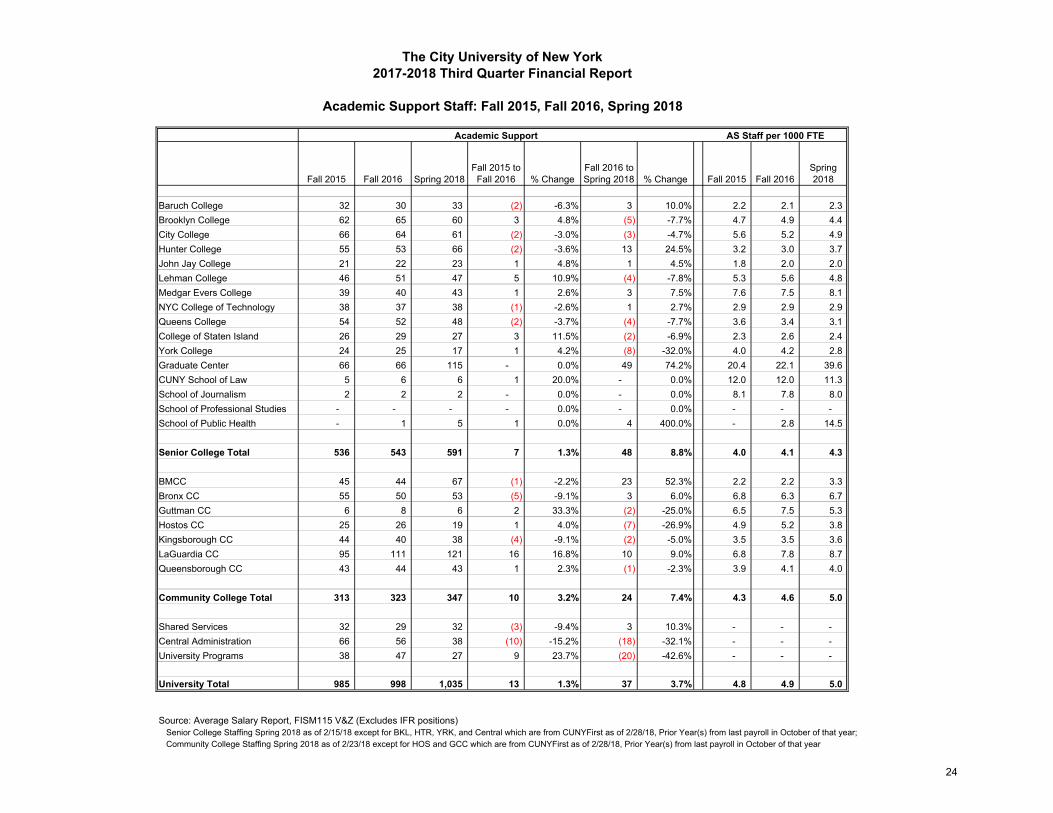
Fall 2015 Fall 2016 Spring 2018Fall 2015 to
Fall 2016 % Change Fall 2016 to Spring 2018 % Change Fall 2015 Fall 2016
Spring 2018
Baruch College 32 30 33 (2) -6.3% 3 10.0% 2.2 2.1 2.3 Brooklyn College 62 65 60 3 4.8% (5) -7.7% 4.7 4.9 4.4 City College 66 64 61 (2) -3.0% (3) -4.7% 5.6 5.2 4.9 Hunter College 55 53 66 (2) -3.6% 13 24.5% 3.2 3.0 3.7 John Jay College 21 22 23 1 4.8% 1 4.5% 1.8 2.0 2.0 Lehman College 46 51 47 5 10.9% (4) -7.8% 5.3 5.6 4.8 Medgar Evers College 39 40 43 1 2.6% 3 7.5% 7.6 7.5 8.1 NYC College of Technology 38 37 38 (1) -2.6% 1 2.7% 2.9 2.9 2.9 Queens College 54 52 48 (2) -3.7% (4) -7.7% 3.6 3.4 3.1 College of Staten Island 26 29 27 3 11.5% (2) -6.9% 2.3 2.6 2.4 York College 24 25 17 1 4.2% (8) -32.0% 4.0 4.2 2.8 Graduate Center 66 66 115 - 0.0% 49 74.2% 20.4 22.1 39.6 CUNY School of Law 5 6 6 1 20.0% - 0.0% 12.0 12.0 11.3 School of Journalism 2 2 2 - 0.0% - 0.0% 8.1 7.8 8.0 School of Professional Studies - - - - 0.0% - 0.0% - - - School of Public Health - 1 5 1 0.0% 4 400.0% - 2.8 14.5
Senior College Total 536 543 591 7 1.3% 48 8.8% 4.0 4.1 4.3
BMCC 45 44 67 (1) -2.2% 23 52.3% 2.2 2.2 3.3 Bronx CC 55 50 53 (5) -9.1% 3 6.0% 6.8 6.3 6.7 Guttman CC 6 8 6 2 33.3% (2) -25.0% 6.5 7.5 5.3 Hostos CC 25 26 19 1 4.0% (7) -26.9% 4.9 5.2 3.8 Kingsborough CC 44 40 38 (4) -9.1% (2) -5.0% 3.5 3.5 3.6 LaGuardia CC 95 111 121 16 16.8% 10 9.0% 6.8 7.8 8.7 Queensborough CC 43 44 43 1 2.3% (1) -2.3% 3.9 4.1 4.0
Community College Total 313 323 347 10 3.2% 24 7.4% 4.3 4.6 5.0
Shared Services 32 29 32 (3) -9.4% 3 10.3% - - - Central Administration 66 56 38 (10) -15.2% (18) -32.1% - - - University Programs 38 47 27 9 23.7% (20) -42.6% - - -
University Total 985 998 1,035 13 1.3% 37 3.7% 4.8 4.9 5.0
Source: Average Salary Report, FISM115 V&Z (Excludes IFR positions)Senior College Staffing Spring 2018 as of 2/15/18 except for BKL, HTR, YRK, and Central which are from CUNYFirst as of 2/28/18, Prior Year(s) from last payroll in October of that year; Community College Staffing Spring 2018 as of 2/23/18 except for HOS and GCC which are from CUNYFirst as of 2/28/18, Prior Year(s) from last payroll in October of that year
The City University of New York
AS Staff per 1000 FTE
Academic Support Staff: Fall 2015, Fall 2016, Spring 2018
Academic Support
2017-2018 Third Quarter Financial Report
24
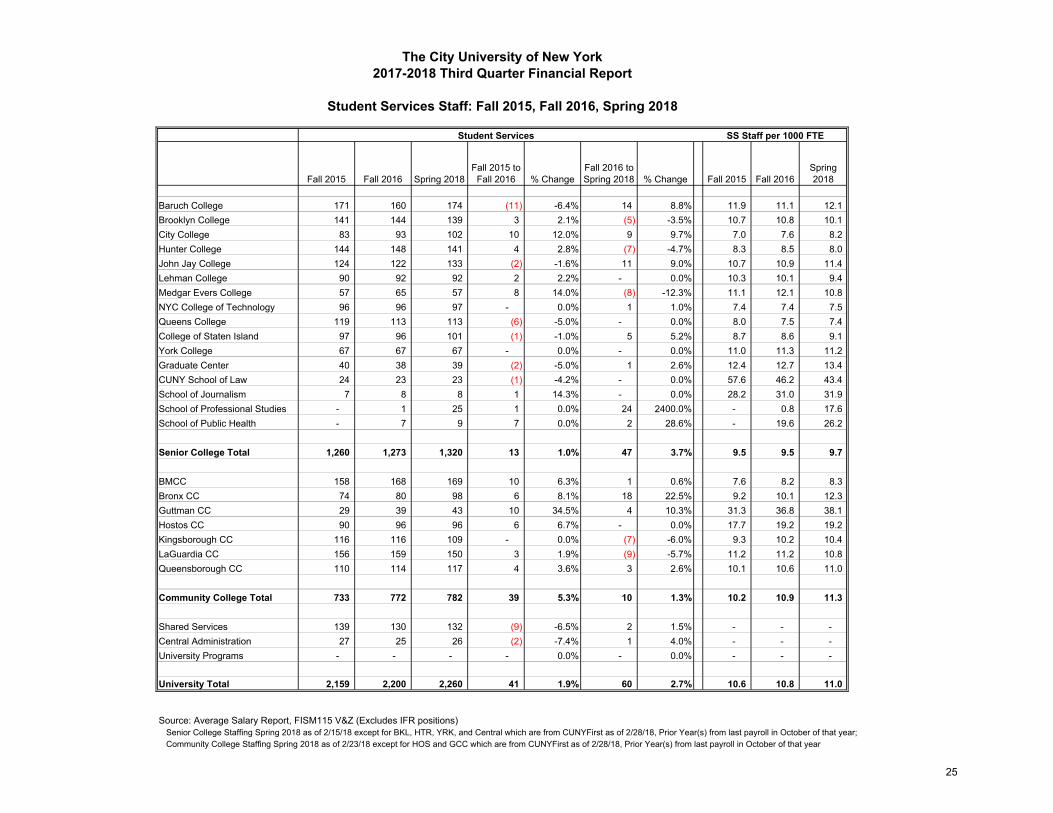
Fall 2015 Fall 2016 Spring 2018Fall 2015 to
Fall 2016 % Change Fall 2016 to Spring 2018 % Change Fall 2015 Fall 2016
Spring 2018
Baruch College 171 160 174 (11) -6.4% 14 8.8% 11.9 11.1 12.1 Brooklyn College 141 144 139 3 2.1% (5) -3.5% 10.7 10.8 10.1 City College 83 93 102 10 12.0% 9 9.7% 7.0 7.6 8.2 Hunter College 144 148 141 4 2.8% (7) -4.7% 8.3 8.5 8.0 John Jay College 124 122 133 (2) -1.6% 11 9.0% 10.7 10.9 11.4 Lehman College 90 92 92 2 2.2% - 0.0% 10.3 10.1 9.4 Medgar Evers College 57 65 57 8 14.0% (8) -12.3% 11.1 12.1 10.8 NYC College of Technology 96 96 97 - 0.0% 1 1.0% 7.4 7.4 7.5 Queens College 119 113 113 (6) -5.0% - 0.0% 8.0 7.5 7.4 College of Staten Island 97 96 101 (1) -1.0% 5 5.2% 8.7 8.6 9.1 York College 67 67 67 - 0.0% - 0.0% 11.0 11.3 11.2 Graduate Center 40 38 39 (2) -5.0% 1 2.6% 12.4 12.7 13.4 CUNY School of Law 24 23 23 (1) -4.2% - 0.0% 57.6 46.2 43.4 School of Journalism 7 8 8 1 14.3% - 0.0% 28.2 31.0 31.9 School of Professional Studies - 1 25 1 0.0% 24 2400.0% - 0.8 17.6 School of Public Health - 7 9 7 0.0% 2 28.6% - 19.6 26.2
Senior College Total 1,260 1,273 1,320 13 1.0% 47 3.7% 9.5 9.5 9.7
BMCC 158 168 169 10 6.3% 1 0.6% 7.6 8.2 8.3 Bronx CC 74 80 98 6 8.1% 18 22.5% 9.2 10.1 12.3 Guttman CC 29 39 43 10 34.5% 4 10.3% 31.3 36.8 38.1 Hostos CC 90 96 96 6 6.7% - 0.0% 17.7 19.2 19.2 Kingsborough CC 116 116 109 - 0.0% (7) -6.0% 9.3 10.2 10.4 LaGuardia CC 156 159 150 3 1.9% (9) -5.7% 11.2 11.2 10.8 Queensborough CC 110 114 117 4 3.6% 3 2.6% 10.1 10.6 11.0
Community College Total 733 772 782 39 5.3% 10 1.3% 10.2 10.9 11.3
Shared Services 139 130 132 (9) -6.5% 2 1.5% - - - Central Administration 27 25 26 (2) -7.4% 1 4.0% - - - University Programs - - - - 0.0% - 0.0% - - -
University Total 2,159 2,200 2,260 41 1.9% 60 2.7% 10.6 10.8 11.0
Source: Average Salary Report, FISM115 V&Z (Excludes IFR positions)Senior College Staffing Spring 2018 as of 2/15/18 except for BKL, HTR, YRK, and Central which are from CUNYFirst as of 2/28/18, Prior Year(s) from last payroll in October of that year; Community College Staffing Spring 2018 as of 2/23/18 except for HOS and GCC which are from CUNYFirst as of 2/28/18, Prior Year(s) from last payroll in October of that year
SS Staff per 1000 FTE
Student Services Staff: Fall 2015, Fall 2016, Spring 2018
2017-2018 Third Quarter Financial ReportThe City University of New York
Student Services
25
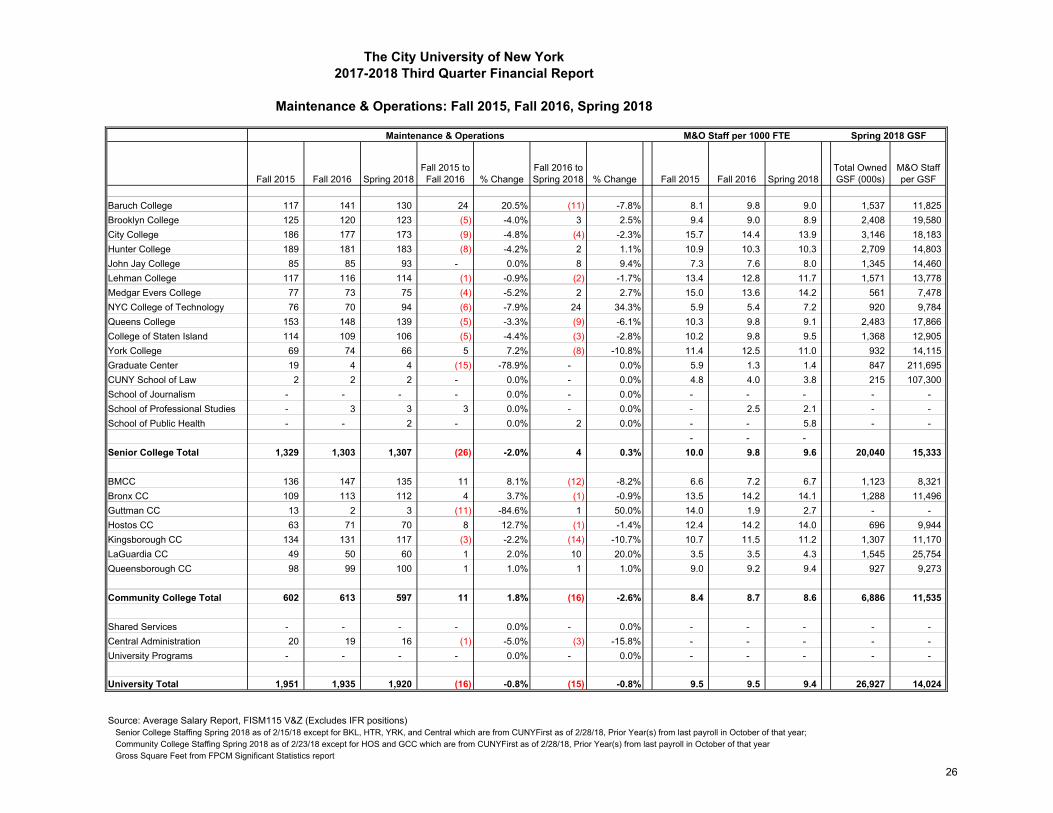
Fall 2015 Fall 2016 Spring 2018Fall 2015 to
Fall 2016 % Change Fall 2016 to Spring 2018 % Change Fall 2015 Fall 2016 Spring 2018
Total Owned GSF (000s)
M&O Staff per GSF
Baruch College 117 141 130 24 20.5% (11) -7.8% 8.1 9.8 9.0 1,537 11,825 Brooklyn College 125 120 123 (5) -4.0% 3 2.5% 9.4 9.0 8.9 2,408 19,580 City College 186 177 173 (9) -4.8% (4) -2.3% 15.7 14.4 13.9 3,146 18,183 Hunter College 189 181 183 (8) -4.2% 2 1.1% 10.9 10.3 10.3 2,709 14,803 John Jay College 85 85 93 - 0.0% 8 9.4% 7.3 7.6 8.0 1,345 14,460 Lehman College 117 116 114 (1) -0.9% (2) -1.7% 13.4 12.8 11.7 1,571 13,778 Medgar Evers College 77 73 75 (4) -5.2% 2 2.7% 15.0 13.6 14.2 561 7,478 NYC College of Technology 76 70 94 (6) -7.9% 24 34.3% 5.9 5.4 7.2 920 9,784 Queens College 153 148 139 (5) -3.3% (9) -6.1% 10.3 9.8 9.1 2,483 17,866 College of Staten Island 114 109 106 (5) -4.4% (3) -2.8% 10.2 9.8 9.5 1,368 12,905 York College 69 74 66 5 7.2% (8) -10.8% 11.4 12.5 11.0 932 14,115 Graduate Center 19 4 4 (15) -78.9% - 0.0% 5.9 1.3 1.4 847 211,695 CUNY School of Law 2 2 2 - 0.0% - 0.0% 4.8 4.0 3.8 215 107,300 School of Journalism - - - - 0.0% - 0.0% - - - - - School of Professional Studies - 3 3 3 0.0% - 0.0% - 2.5 2.1 - - School of Public Health - - 2 - 0.0% 2 0.0% - - 5.8 - -
- - - Senior College Total 1,329 1,303 1,307 (26) -2.0% 4 0.3% 10.0 9.8 9.6 20,040 15,333
BMCC 136 147 135 11 8.1% (12) -8.2% 6.6 7.2 6.7 1,123 8,321 Bronx CC 109 113 112 4 3.7% (1) -0.9% 13.5 14.2 14.1 1,288 11,496 Guttman CC 13 2 3 (11) -84.6% 1 50.0% 14.0 1.9 2.7 - - Hostos CC 63 71 70 8 12.7% (1) -1.4% 12.4 14.2 14.0 696 9,944 Kingsborough CC 134 131 117 (3) -2.2% (14) -10.7% 10.7 11.5 11.2 1,307 11,170 LaGuardia CC 49 50 60 1 2.0% 10 20.0% 3.5 3.5 4.3 1,545 25,754 Queensborough CC 98 99 100 1 1.0% 1 1.0% 9.0 9.2 9.4 927 9,273
Community College Total 602 613 597 11 1.8% (16) -2.6% 8.4 8.7 8.6 6,886 11,535
Shared Services - - - - 0.0% - 0.0% - - - - - Central Administration 20 19 16 (1) -5.0% (3) -15.8% - - - - - University Programs - - - - 0.0% - 0.0% - - - - -
University Total 1,951 1,935 1,920 (16) -0.8% (15) -0.8% 9.5 9.5 9.4 26,927 14,024
Source: Average Salary Report, FISM115 V&Z (Excludes IFR positions)Senior College Staffing Spring 2018 as of 2/15/18 except for BKL, HTR, YRK, and Central which are from CUNYFirst as of 2/28/18, Prior Year(s) from last payroll in October of that year; Community College Staffing Spring 2018 as of 2/23/18 except for HOS and GCC which are from CUNYFirst as of 2/28/18, Prior Year(s) from last payroll in October of that yearGross Square Feet from FPCM Significant Statistics report
Spring 2018 GSFM&O Staff per 1000 FTE
Maintenance & Operations: Fall 2015, Fall 2016, Spring 2018
2017-2018 Third Quarter Financial ReportThe City University of New York
Maintenance & Operations
26
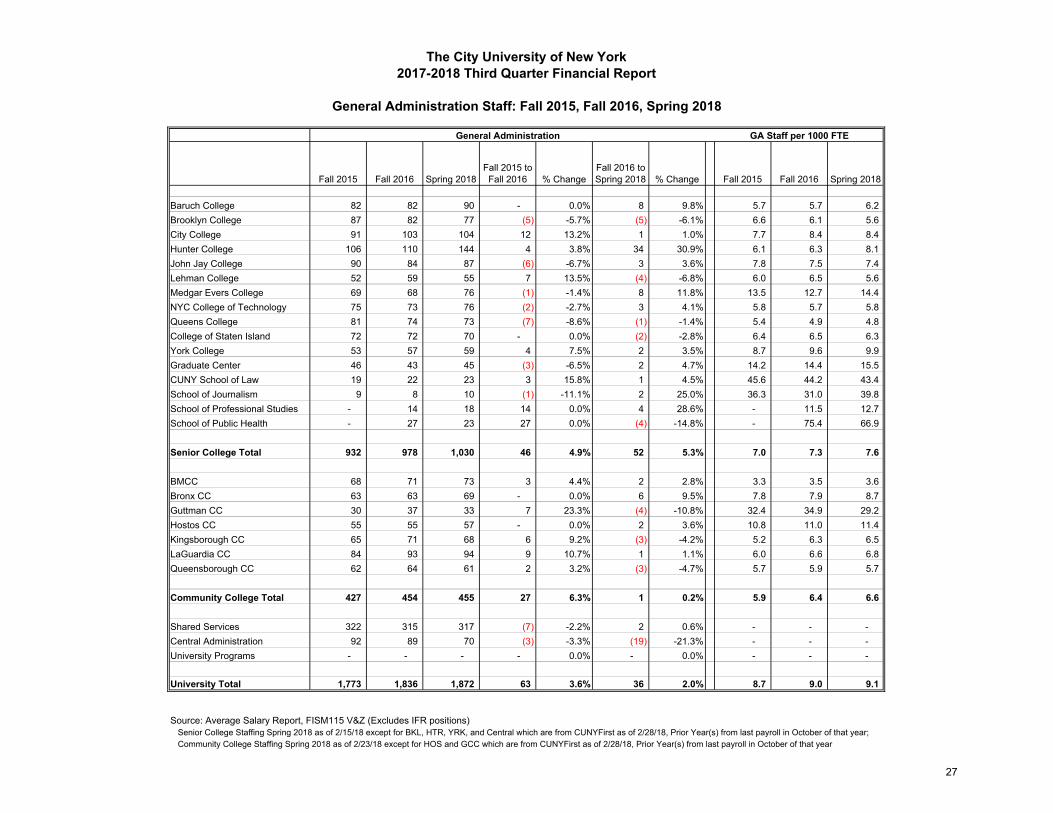
Fall 2015 Fall 2016 Spring 2018Fall 2015 to
Fall 2016 % Change Fall 2016 to Spring 2018 % Change Fall 2015 Fall 2016 Spring 2018
Baruch College 82 82 90 - 0.0% 8 9.8% 5.7 5.7 6.2 Brooklyn College 87 82 77 (5) -5.7% (5) -6.1% 6.6 6.1 5.6 City College 91 103 104 12 13.2% 1 1.0% 7.7 8.4 8.4 Hunter College 106 110 144 4 3.8% 34 30.9% 6.1 6.3 8.1 John Jay College 90 84 87 (6) -6.7% 3 3.6% 7.8 7.5 7.4 Lehman College 52 59 55 7 13.5% (4) -6.8% 6.0 6.5 5.6 Medgar Evers College 69 68 76 (1) -1.4% 8 11.8% 13.5 12.7 14.4 NYC College of Technology 75 73 76 (2) -2.7% 3 4.1% 5.8 5.7 5.8 Queens College 81 74 73 (7) -8.6% (1) -1.4% 5.4 4.9 4.8 College of Staten Island 72 72 70 - 0.0% (2) -2.8% 6.4 6.5 6.3 York College 53 57 59 4 7.5% 2 3.5% 8.7 9.6 9.9 Graduate Center 46 43 45 (3) -6.5% 2 4.7% 14.2 14.4 15.5 CUNY School of Law 19 22 23 3 15.8% 1 4.5% 45.6 44.2 43.4 School of Journalism 9 8 10 (1) -11.1% 2 25.0% 36.3 31.0 39.8 School of Professional Studies - 14 18 14 0.0% 4 28.6% - 11.5 12.7 School of Public Health - 27 23 27 0.0% (4) -14.8% - 75.4 66.9
Senior College Total 932 978 1,030 46 4.9% 52 5.3% 7.0 7.3 7.6
BMCC 68 71 73 3 4.4% 2 2.8% 3.3 3.5 3.6 Bronx CC 63 63 69 - 0.0% 6 9.5% 7.8 7.9 8.7 Guttman CC 30 37 33 7 23.3% (4) -10.8% 32.4 34.9 29.2 Hostos CC 55 55 57 - 0.0% 2 3.6% 10.8 11.0 11.4 Kingsborough CC 65 71 68 6 9.2% (3) -4.2% 5.2 6.3 6.5 LaGuardia CC 84 93 94 9 10.7% 1 1.1% 6.0 6.6 6.8 Queensborough CC 62 64 61 2 3.2% (3) -4.7% 5.7 5.9 5.7
Community College Total 427 454 455 27 6.3% 1 0.2% 5.9 6.4 6.6
Shared Services 322 315 317 (7) -2.2% 2 0.6% - - - Central Administration 92 89 70 (3) -3.3% (19) -21.3% - - - University Programs - - - - 0.0% - 0.0% - - -
University Total 1,773 1,836 1,872 63 3.6% 36 2.0% 8.7 9.0 9.1
Source: Average Salary Report, FISM115 V&Z (Excludes IFR positions)Senior College Staffing Spring 2018 as of 2/15/18 except for BKL, HTR, YRK, and Central which are from CUNYFirst as of 2/28/18, Prior Year(s) from last payroll in October of that year; Community College Staffing Spring 2018 as of 2/23/18 except for HOS and GCC which are from CUNYFirst as of 2/28/18, Prior Year(s) from last payroll in October of that year
GA Staff per 1000 FTE
General Administration Staff: Fall 2015, Fall 2016, Spring 2018
2017-2018 Third Quarter Financial ReportThe City University of New York
General Administration
27
Fall 2015 Fall 2016 Spring 2018Fall 2015 to
Fall 2016 % Change Fall 2016 to Spring 2018 % Change Fall 2015 Fall 2016
Spring 2018
Baruch College 163 158 164 (5) -3.1% 6 3.8% 11.3 11.0 11.4 Brooklyn College 149 153 148 4 2.7% (5) -3.3% 11.3 11.4 10.7 City College 223 199 197 (24) -10.8% (2) -1.0% 18.8 16.2 15.9 Hunter College 200 194 209 (6) -3.0% 15 7.7% 11.6 11.1 11.8 John Jay College 113 113 122 - 0.0% 9 8.0% 9.7 10.1 10.4 Lehman College 110 105 110 (5) -4.5% 5 4.8% 12.6 11.6 11.3 Medgar Evers College 63 61 73 (2) -3.2% 12 19.7% 12.3 11.4 13.8 NYC College of Technology 94 91 91 (3) -3.2% - 0.0% 7.2 7.0 7.0 Queens College 122 118 110 (4) -3.3% (8) -6.8% 8.2 7.8 7.2 College of Staten Island 83 81 79 (2) -2.4% (2) -2.5% 7.4 7.3 7.1 York College 93 98 94 5 5.4% (4) -4.1% 15.3 16.5 15.7 Graduate Center 90 86 89 (4) -4.4% 3 3.5% 27.8 28.8 30.7 CUNY School of Law 27 22 23 (5) -18.5% 1 4.5% 64.7 44.2 43.4 School of Journalism 8 22 26 14 175.0% 4 18.2% 32.3 85.3 103.6 School of Professional Studies 11 20 21 9 81.8% 1 5.0% 9.7 16.4 14.8 School of Public Health - 2 12 2 0.0% 10 500.0% - 5.6 34.9
Senior College Total 1,549 1,523 1,568 (26) -1.7% 45 3.0% 11.7 11.4 11.5
BMCC 165 157 161 (8) -4.8% 4 2.5% 8.0 7.7 7.9 Bronx CC 118 127 119 9 7.6% (8) -6.3% 14.7 16.0 15.0 Guttman CC 9 22 22 13 144.4% - 0.0% 9.7 20.8 19.5 Hostos CC 90 84 88 (6) -6.7% 4 4.8% 17.7 16.8 17.6 Kingsborough CC 123 117 116 (6) -4.9% (1) -0.9% 9.8 10.3 11.1 LaGuardia CC 168 180 164 12 7.1% (16) -8.9% 12.1 12.7 11.8 Queensborough CC 106 109 107 3 2.8% (2) -1.8% 9.7 10.1 10.1
Community College Total 779 796 777 17 2.2% (19) -2.4% 10.8 11.3 11.2
Shared Services 265 252 242 (13) -4.9% (10) -4.0% - - - Central Administration 20 22 19 2 10.0% (3) -13.6% - - - University Programs - - - - 0.0% - 0.0% - - -
University Total 2,613 2,593 2,606 (20) -0.8% 13 0.5% 12.8 12.7 12.7
Source: Average Salary Report, FISM115 V&Z (Excludes IFR positions)Senior College Staffing Spring 2018 as of 2/15/18 except for BKL, HTR, YRK, and Central which are from CUNYFirst as of 2/28/18, Prior Year(s) from last payroll in October of that yeaCommunity College Staffing Spring 2018 as of 2/23/18 except for HOS and GCC which are from CUNYFirst as of 2/28/18, Prior Year(s) from last payroll in October of that year
GIS Staff per 1000 FTE
General Institutional Services Staff: Fall 2015, Fall 2016, Spring 2018
2017-2018 Third Quarter Financial ReportThe City University of New York
General Institutional Services
28
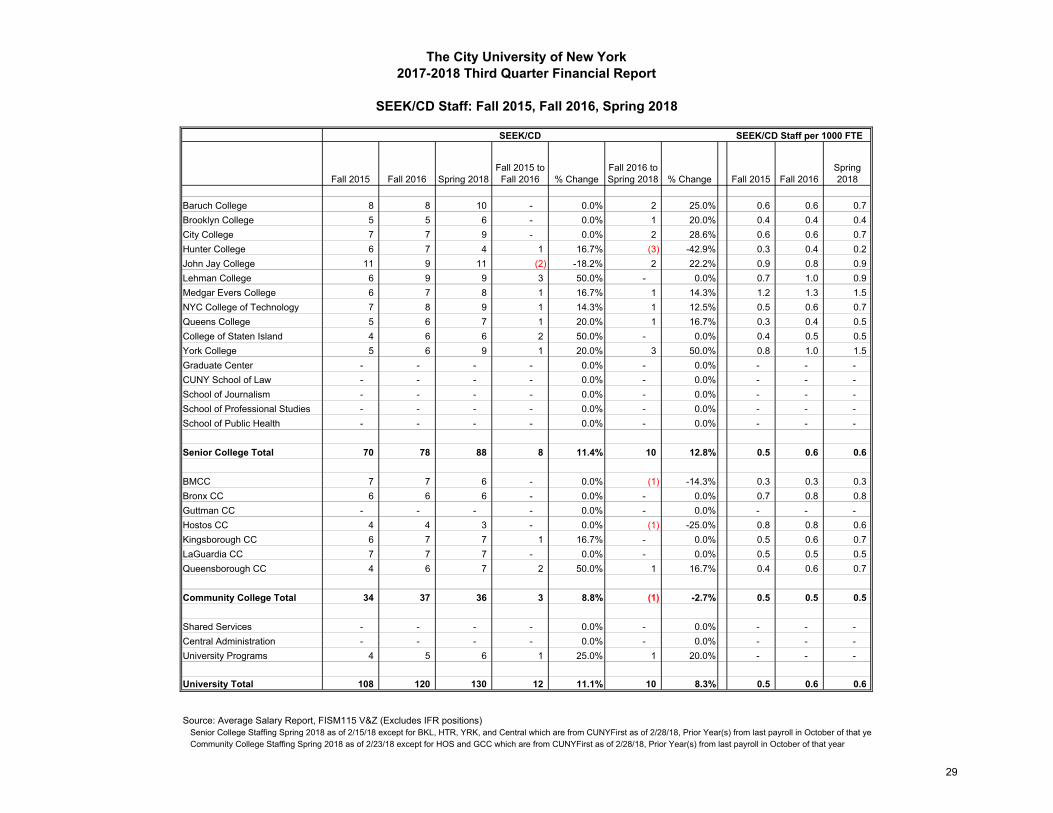
Fall 2015 Fall 2016 Spring 2018Fall 2015 to
Fall 2016 % Change Fall 2016 to Spring 2018 % Change Fall 2015 Fall 2016
Spring 2018
Baruch College 8 8 10 - 0.0% 2 25.0% 0.6 0.6 0.7 Brooklyn College 5 5 6 - 0.0% 1 20.0% 0.4 0.4 0.4 City College 7 7 9 - 0.0% 2 28.6% 0.6 0.6 0.7 Hunter College 6 7 4 1 16.7% (3) -42.9% 0.3 0.4 0.2 John Jay College 11 9 11 (2) -18.2% 2 22.2% 0.9 0.8 0.9 Lehman College 6 9 9 3 50.0% - 0.0% 0.7 1.0 0.9 Medgar Evers College 6 7 8 1 16.7% 1 14.3% 1.2 1.3 1.5 NYC College of Technology 7 8 9 1 14.3% 1 12.5% 0.5 0.6 0.7 Queens College 5 6 7 1 20.0% 1 16.7% 0.3 0.4 0.5 College of Staten Island 4 6 6 2 50.0% - 0.0% 0.4 0.5 0.5 York College 5 6 9 1 20.0% 3 50.0% 0.8 1.0 1.5 Graduate Center - - - - 0.0% - 0.0% - - - CUNY School of Law - - - - 0.0% - 0.0% - - - School of Journalism - - - - 0.0% - 0.0% - - - School of Professional Studies - - - - 0.0% - 0.0% - - - School of Public Health - - - - 0.0% - 0.0% - - -
Senior College Total 70 78 88 8 11.4% 10 12.8% 0.5 0.6 0.6
BMCC 7 7 6 - 0.0% (1) -14.3% 0.3 0.3 0.3 Bronx CC 6 6 6 - 0.0% - 0.0% 0.7 0.8 0.8 Guttman CC - - - - 0.0% - 0.0% - - - Hostos CC 4 4 3 - 0.0% (1) -25.0% 0.8 0.8 0.6 Kingsborough CC 6 7 7 1 16.7% - 0.0% 0.5 0.6 0.7 LaGuardia CC 7 7 7 - 0.0% - 0.0% 0.5 0.5 0.5 Queensborough CC 4 6 7 2 50.0% 1 16.7% 0.4 0.6 0.7
Community College Total 34 37 36 3 8.8% (1) -2.7% 0.5 0.5 0.5
Shared Services - - - - 0.0% - 0.0% - - - Central Administration - - - - 0.0% - 0.0% - - - University Programs 4 5 6 1 25.0% 1 20.0% - - -
University Total 108 120 130 12 11.1% 10 8.3% 0.5 0.6 0.6
Source: Average Salary Report, FISM115 V&Z (Excludes IFR positions)Senior College Staffing Spring 2018 as of 2/15/18 except for BKL, HTR, YRK, and Central which are from CUNYFirst as of 2/28/18, Prior Year(s) from last payroll in October of that yeaCommunity College Staffing Spring 2018 as of 2/23/18 except for HOS and GCC which are from CUNYFirst as of 2/28/18, Prior Year(s) from last payroll in October of that year
SEEK/CD Staff per 1000 FTE
SEEK/CD Staff: Fall 2015, Fall 2016, Spring 2018
2017-2018 Third Quarter Financial ReportThe City University of New York
SEEK/CD
29
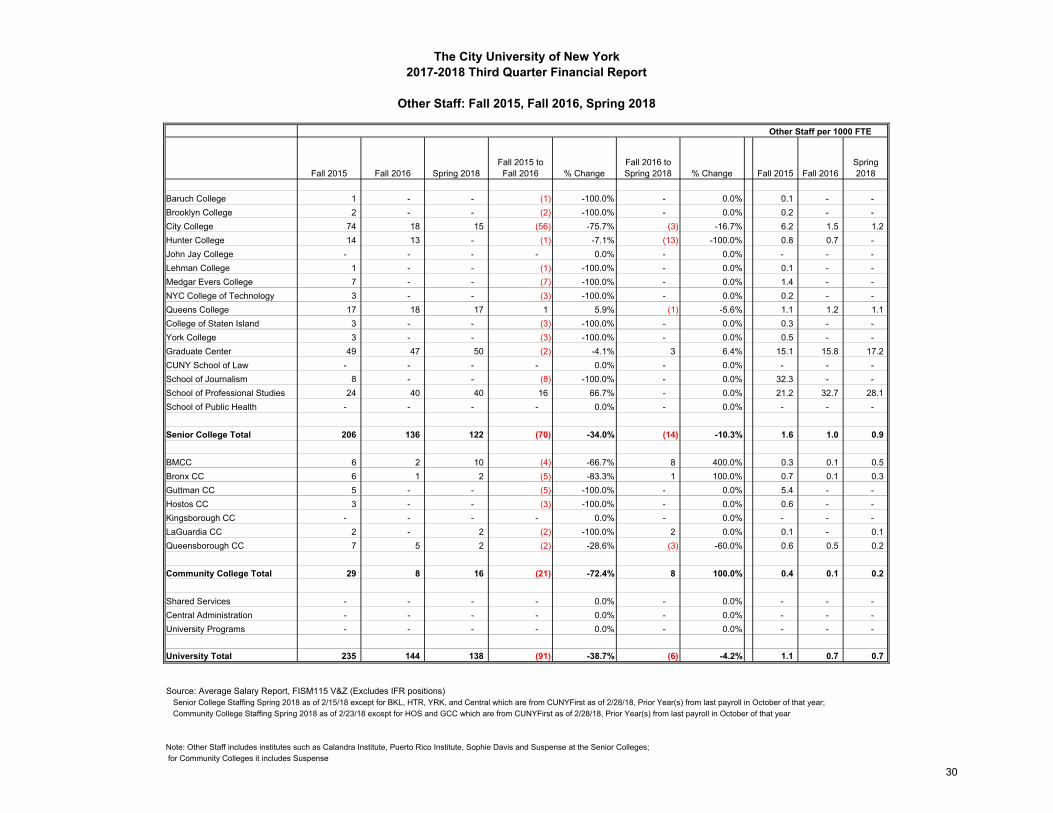
Fall 2015 Fall 2016 Spring 2018Fall 2015 to
Fall 2016 % Change Fall 2016 to Spring 2018 % Change Fall 2015 Fall 2016
Spring 2018
Baruch College 1 - - (1) -100.0% - 0.0% 0.1 - - Brooklyn College 2 - - (2) -100.0% - 0.0% 0.2 - - City College 74 18 15 (56) -75.7% (3) -16.7% 6.2 1.5 1.2 Hunter College 14 13 - (1) -7.1% (13) -100.0% 0.8 0.7 - John Jay College - - - - 0.0% - 0.0% - - - Lehman College 1 - - (1) -100.0% - 0.0% 0.1 - - Medgar Evers College 7 - - (7) -100.0% - 0.0% 1.4 - - NYC College of Technology 3 - - (3) -100.0% - 0.0% 0.2 - - Queens College 17 18 17 1 5.9% (1) -5.6% 1.1 1.2 1.1 College of Staten Island 3 - - (3) -100.0% - 0.0% 0.3 - - York College 3 - - (3) -100.0% - 0.0% 0.5 - - Graduate Center 49 47 50 (2) -4.1% 3 6.4% 15.1 15.8 17.2 CUNY School of Law - - - - 0.0% - 0.0% - - - School of Journalism 8 - - (8) -100.0% - 0.0% 32.3 - - School of Professional Studies 24 40 40 16 66.7% - 0.0% 21.2 32.7 28.1 School of Public Health - - - - 0.0% - 0.0% - - -
Senior College Total 206 136 122 (70) -34.0% (14) -10.3% 1.6 1.0 0.9
BMCC 6 2 10 (4) -66.7% 8 400.0% 0.3 0.1 0.5 Bronx CC 6 1 2 (5) -83.3% 1 100.0% 0.7 0.1 0.3 Guttman CC 5 - - (5) -100.0% - 0.0% 5.4 - - Hostos CC 3 - - (3) -100.0% - 0.0% 0.6 - - Kingsborough CC - - - - 0.0% - 0.0% - - - LaGuardia CC 2 - 2 (2) -100.0% 2 0.0% 0.1 - 0.1 Queensborough CC 7 5 2 (2) -28.6% (3) -60.0% 0.6 0.5 0.2
Community College Total 29 8 16 (21) -72.4% 8 100.0% 0.4 0.1 0.2
Shared Services - - - - 0.0% - 0.0% - - - Central Administration - - - - 0.0% - 0.0% - - - University Programs - - - - 0.0% - 0.0% - - -
University Total 235 144 138 (91) -38.7% (6) -4.2% 1.1 0.7 0.7
Source: Average Salary Report, FISM115 V&Z (Excludes IFR positions)Senior College Staffing Spring 2018 as of 2/15/18 except for BKL, HTR, YRK, and Central which are from CUNYFirst as of 2/28/18, Prior Year(s) from last payroll in October of that year; Community College Staffing Spring 2018 as of 2/23/18 except for HOS and GCC which are from CUNYFirst as of 2/28/18, Prior Year(s) from last payroll in October of that year
Note: Other Staff includes institutes such as Calandra Institute, Puerto Rico Institute, Sophie Davis and Suspense at the Senior Colleges; for Community Colleges it includes Suspense
The City University of New York
Other Staff per 1000 FTE
Other Staff: Fall 2015, Fall 2016, Spring 2018
2017-2018 Third Quarter Financial Report
30
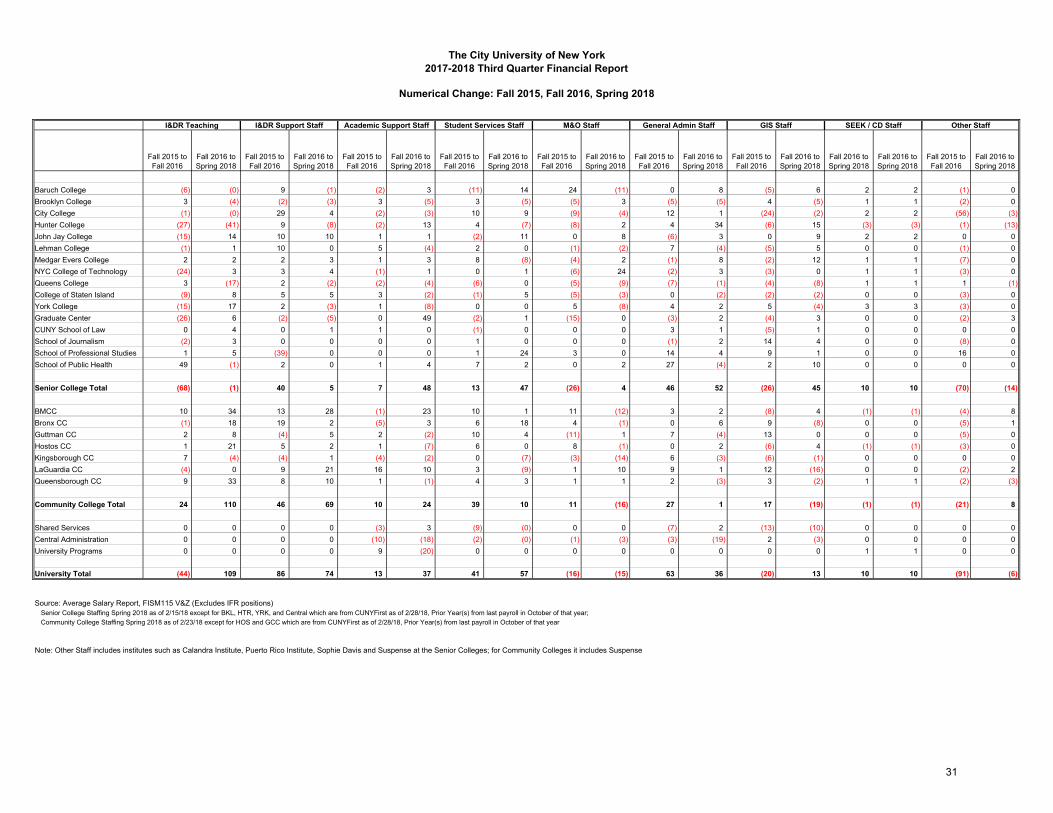
Numerical Change: Fall 2015, Fall 2016, Spring 2018
Fall 2015 to Fall 2016
Fall 2016 to Spring 2018
Fall 2015 to Fall 2016
Fall 2016 to Spring 2018
Fall 2015 to Fall 2016
Fall 2016 to Spring 2018
Fall 2015 to Fall 2016
Fall 2016 to Spring 2018
Fall 2015 to Fall 2016
Fall 2016 to Spring 2018
Fall 2015 to Fall 2016
Fall 2016 to Spring 2018
Fall 2015 to Fall 2016
Fall 2016 to Spring 2018
Fall 2016 to Spring 2018
Fall 2016 to Spring 2018
Fall 2015 to Fall 2016
Fall 2016 to Spring 2018
Baruch College (6) (0) 9 (1) (2) 3 (11) 14 24 (11) 0 8 (5) 6 2 2 (1) 0Brooklyn College 3 (4) (2) (3) 3 (5) 3 (5) (5) 3 (5) (5) 4 (5) 1 1 (2) 0City College (1) (0) 29 4 (2) (3) 10 9 (9) (4) 12 1 (24) (2) 2 2 (56) (3)Hunter College (27) (41) 9 (8) (2) 13 4 (7) (8) 2 4 34 (6) 15 (3) (3) (1) (13)John Jay College (15) 14 10 10 1 1 (2) 11 0 8 (6) 3 0 9 2 2 0 0Lehman College (1) 1 10 0 5 (4) 2 0 (1) (2) 7 (4) (5) 5 0 0 (1) 0Medgar Evers College 2 2 2 3 1 3 8 (8) (4) 2 (1) 8 (2) 12 1 1 (7) 0NYC College of Technology (24) 3 3 4 (1) 1 0 1 (6) 24 (2) 3 (3) 0 1 1 (3) 0Queens College 3 (17) 2 (2) (2) (4) (6) 0 (5) (9) (7) (1) (4) (8) 1 1 1 (1)College of Staten Island (9) 8 5 5 3 (2) (1) 5 (5) (3) 0 (2) (2) (2) 0 0 (3) 0York College (15) 17 2 (3) 1 (8) 0 0 5 (8) 4 2 5 (4) 3 3 (3) 0Graduate Center (26) 6 (2) (5) 0 49 (2) 1 (15) 0 (3) 2 (4) 3 0 0 (2) 3CUNY School of Law 0 4 0 1 1 0 (1) 0 0 0 3 1 (5) 1 0 0 0 0School of Journalism (2) 3 0 0 0 0 1 0 0 0 (1) 2 14 4 0 0 (8) 0School of Professional Studies 1 5 (39) 0 0 0 1 24 3 0 14 4 9 1 0 0 16 0School of Public Health 49 (1) 2 0 1 4 7 2 0 2 27 (4) 2 10 0 0 0 0
Senior College Total (68) (1) 40 5 7 48 13 47 (26) 4 46 52 (26) 45 10 10 (70) (14)
BMCC 10 34 13 28 (1) 23 10 1 11 (12) 3 2 (8) 4 (1) (1) (4) 8Bronx CC (1) 18 19 2 (5) 3 6 18 4 (1) 0 6 9 (8) 0 0 (5) 1Guttman CC 2 8 (4) 5 2 (2) 10 4 (11) 1 7 (4) 13 0 0 0 (5) 0Hostos CC 1 21 5 2 1 (7) 6 0 8 (1) 0 2 (6) 4 (1) (1) (3) 0Kingsborough CC 7 (4) (4) 1 (4) (2) 0 (7) (3) (14) 6 (3) (6) (1) 0 0 0 0LaGuardia CC (4) 0 9 21 16 10 3 (9) 1 10 9 1 12 (16) 0 0 (2) 2Queensborough CC 9 33 8 10 1 (1) 4 3 1 1 2 (3) 3 (2) 1 1 (2) (3)
Community College Total 24 110 46 69 10 24 39 10 11 (16) 27 1 17 (19) (1) (1) (21) 8
Shared Services 0 0 0 0 (3) 3 (9) (0) 0 0 (7) 2 (13) (10) 0 0 0 0Central Administration 0 0 0 0 (10) (18) (2) (0) (1) (3) (3) (19) 2 (3) 0 0 0 0University Programs 0 0 0 0 9 (20) 0 0 0 0 0 0 0 0 1 1 0 0
University Total (44) 109 86 74 13 37 41 57 (16) (15) 63 36 (20) 13 10 10 (91) (6)
Source: Average Salary Report, FISM115 V&Z (Excludes IFR positions)Senior College Staffing Spring 2018 as of 2/15/18 except for BKL, HTR, YRK, and Central which are from CUNYFirst as of 2/28/18, Prior Year(s) from last payroll in October of that year; Community College Staffing Spring 2018 as of 2/23/18 except for HOS and GCC which are from CUNYFirst as of 2/28/18, Prior Year(s) from last payroll in October of that year
Note: Other Staff includes institutes such as Calandra Institute, Puerto Rico Institute, Sophie Davis and Suspense at the Senior Colleges; for Community Colleges it includes Suspense
The City University of New York2017-2018 Third Quarter Financial Report
I&DR Teaching I&DR Support Staff Academic Support Staff Other StaffStudent Services Staff M&O Staff General Admin Staff GIS Staff SEEK / CD Staff
31
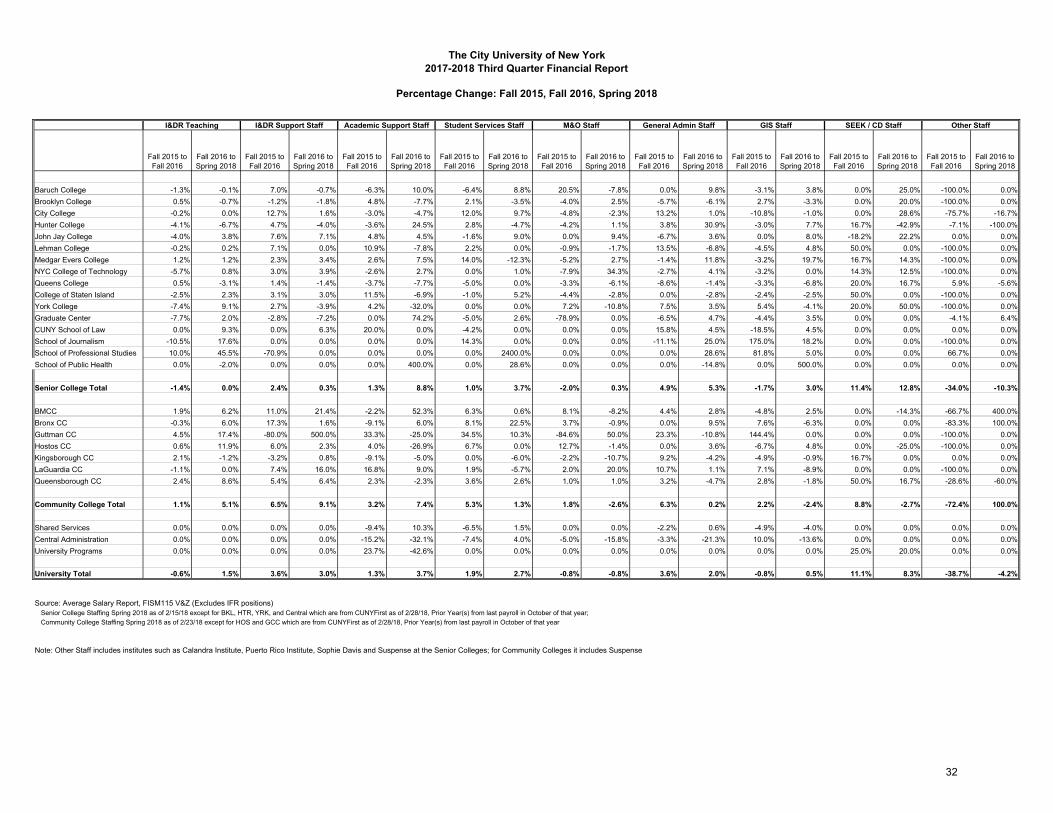
Percentage Change: Fall 2015, Fall 2016, Spring 2018
Fall 2015 to Fall 2016
Fall 2016 to Spring 2018
Fall 2015 to Fall 2016
Fall 2016 to Spring 2018
Fall 2015 to Fall 2016
Fall 2016 to Spring 2018
Fall 2015 to Fall 2016
Fall 2016 to Spring 2018
Fall 2015 to Fall 2016
Fall 2016 to Spring 2018
Fall 2015 to Fall 2016
Fall 2016 to Spring 2018
Fall 2015 to Fall 2016
Fall 2016 to Spring 2018
Fall 2015 to Fall 2016
Fall 2016 to Spring 2018
Fall 2015 to Fall 2016
Fall 2016 to Spring 2018
Baruch College -1.3% -0.1% 7.0% -0.7% -6.3% 10.0% -6.4% 8.8% 20.5% -7.8% 0.0% 9.8% -3.1% 3.8% 0.0% 25.0% -100.0% 0.0%Brooklyn College 0.5% -0.7% -1.2% -1.8% 4.8% -7.7% 2.1% -3.5% -4.0% 2.5% -5.7% -6.1% 2.7% -3.3% 0.0% 20.0% -100.0% 0.0%City College -0.2% 0.0% 12.7% 1.6% -3.0% -4.7% 12.0% 9.7% -4.8% -2.3% 13.2% 1.0% -10.8% -1.0% 0.0% 28.6% -75.7% -16.7%Hunter College -4.1% -6.7% 4.7% -4.0% -3.6% 24.5% 2.8% -4.7% -4.2% 1.1% 3.8% 30.9% -3.0% 7.7% 16.7% -42.9% -7.1% -100.0%John Jay College -4.0% 3.8% 7.6% 7.1% 4.8% 4.5% -1.6% 9.0% 0.0% 9.4% -6.7% 3.6% 0.0% 8.0% -18.2% 22.2% 0.0% 0.0%Lehman College -0.2% 0.2% 7.1% 0.0% 10.9% -7.8% 2.2% 0.0% -0.9% -1.7% 13.5% -6.8% -4.5% 4.8% 50.0% 0.0% -100.0% 0.0%Medgar Evers College 1.2% 1.2% 2.3% 3.4% 2.6% 7.5% 14.0% -12.3% -5.2% 2.7% -1.4% 11.8% -3.2% 19.7% 16.7% 14.3% -100.0% 0.0%NYC College of Technology -5.7% 0.8% 3.0% 3.9% -2.6% 2.7% 0.0% 1.0% -7.9% 34.3% -2.7% 4.1% -3.2% 0.0% 14.3% 12.5% -100.0% 0.0%Queens College 0.5% -3.1% 1.4% -1.4% -3.7% -7.7% -5.0% 0.0% -3.3% -6.1% -8.6% -1.4% -3.3% -6.8% 20.0% 16.7% 5.9% -5.6%College of Staten Island -2.5% 2.3% 3.1% 3.0% 11.5% -6.9% -1.0% 5.2% -4.4% -2.8% 0.0% -2.8% -2.4% -2.5% 50.0% 0.0% -100.0% 0.0%York College -7.4% 9.1% 2.7% -3.9% 4.2% -32.0% 0.0% 0.0% 7.2% -10.8% 7.5% 3.5% 5.4% -4.1% 20.0% 50.0% -100.0% 0.0%Graduate Center -7.7% 2.0% -2.8% -7.2% 0.0% 74.2% -5.0% 2.6% -78.9% 0.0% -6.5% 4.7% -4.4% 3.5% 0.0% 0.0% -4.1% 6.4%CUNY School of Law 0.0% 9.3% 0.0% 6.3% 20.0% 0.0% -4.2% 0.0% 0.0% 0.0% 15.8% 4.5% -18.5% 4.5% 0.0% 0.0% 0.0% 0.0%School of Journalism -10.5% 17.6% 0.0% 0.0% 0.0% 0.0% 14.3% 0.0% 0.0% 0.0% -11.1% 25.0% 175.0% 18.2% 0.0% 0.0% -100.0% 0.0%School of Professional Studies 10.0% 45.5% -70.9% 0.0% 0.0% 0.0% 0.0% 2400.0% 0.0% 0.0% 0.0% 28.6% 81.8% 5.0% 0.0% 0.0% 66.7% 0.0%School of Public Health 0.0% -2.0% 0.0% 0.0% 0.0% 400.0% 0.0% 28.6% 0.0% 0.0% 0.0% -14.8% 0.0% 500.0% 0.0% 0.0% 0.0% 0.0%
Senior College Total -1.4% 0.0% 2.4% 0.3% 1.3% 8.8% 1.0% 3.7% -2.0% 0.3% 4.9% 5.3% -1.7% 3.0% 11.4% 12.8% -34.0% -10.3%
BMCC 1.9% 6.2% 11.0% 21.4% -2.2% 52.3% 6.3% 0.6% 8.1% -8.2% 4.4% 2.8% -4.8% 2.5% 0.0% -14.3% -66.7% 400.0%Bronx CC -0.3% 6.0% 17.3% 1.6% -9.1% 6.0% 8.1% 22.5% 3.7% -0.9% 0.0% 9.5% 7.6% -6.3% 0.0% 0.0% -83.3% 100.0%Guttman CC 4.5% 17.4% -80.0% 500.0% 33.3% -25.0% 34.5% 10.3% -84.6% 50.0% 23.3% -10.8% 144.4% 0.0% 0.0% 0.0% -100.0% 0.0%Hostos CC 0.6% 11.9% 6.0% 2.3% 4.0% -26.9% 6.7% 0.0% 12.7% -1.4% 0.0% 3.6% -6.7% 4.8% 0.0% -25.0% -100.0% 0.0%Kingsborough CC 2.1% -1.2% -3.2% 0.8% -9.1% -5.0% 0.0% -6.0% -2.2% -10.7% 9.2% -4.2% -4.9% -0.9% 16.7% 0.0% 0.0% 0.0%LaGuardia CC -1.1% 0.0% 7.4% 16.0% 16.8% 9.0% 1.9% -5.7% 2.0% 20.0% 10.7% 1.1% 7.1% -8.9% 0.0% 0.0% -100.0% 0.0%Queensborough CC 2.4% 8.6% 5.4% 6.4% 2.3% -2.3% 3.6% 2.6% 1.0% 1.0% 3.2% -4.7% 2.8% -1.8% 50.0% 16.7% -28.6% -60.0%
Community College Total 1.1% 5.1% 6.5% 9.1% 3.2% 7.4% 5.3% 1.3% 1.8% -2.6% 6.3% 0.2% 2.2% -2.4% 8.8% -2.7% -72.4% 100.0%
Shared Services 0.0% 0.0% 0.0% 0.0% -9.4% 10.3% -6.5% 1.5% 0.0% 0.0% -2.2% 0.6% -4.9% -4.0% 0.0% 0.0% 0.0% 0.0%Central Administration 0.0% 0.0% 0.0% 0.0% -15.2% -32.1% -7.4% 4.0% -5.0% -15.8% -3.3% -21.3% 10.0% -13.6% 0.0% 0.0% 0.0% 0.0%University Programs 0.0% 0.0% 0.0% 0.0% 23.7% -42.6% 0.0% 0.0% 0.0% 0.0% 0.0% 0.0% 0.0% 0.0% 25.0% 20.0% 0.0% 0.0%
University Total -0.6% 1.5% 3.6% 3.0% 1.3% 3.7% 1.9% 2.7% -0.8% -0.8% 3.6% 2.0% -0.8% 0.5% 11.1% 8.3% -38.7% -4.2%
Source: Average Salary Report, FISM115 V&Z (Excludes IFR positions)Senior College Staffing Spring 2018 as of 2/15/18 except for BKL, HTR, YRK, and Central which are from CUNYFirst as of 2/28/18, Prior Year(s) from last payroll in October of that year; Community College Staffing Spring 2018 as of 2/23/18 except for HOS and GCC which are from CUNYFirst as of 2/28/18, Prior Year(s) from last payroll in October of that year
Note: Other Staff includes institutes such as Calandra Institute, Puerto Rico Institute, Sophie Davis and Suspense at the Senior Colleges; for Community Colleges it includes Suspense
Other Staff
The City University of New York2017-2018 Third Quarter Financial Report
I&DR Teaching I&DR Support Staff Academic Support Staff Student Services Staff M&O Staff General Admin Staff GIS Staff SEEK / CD Staff
32
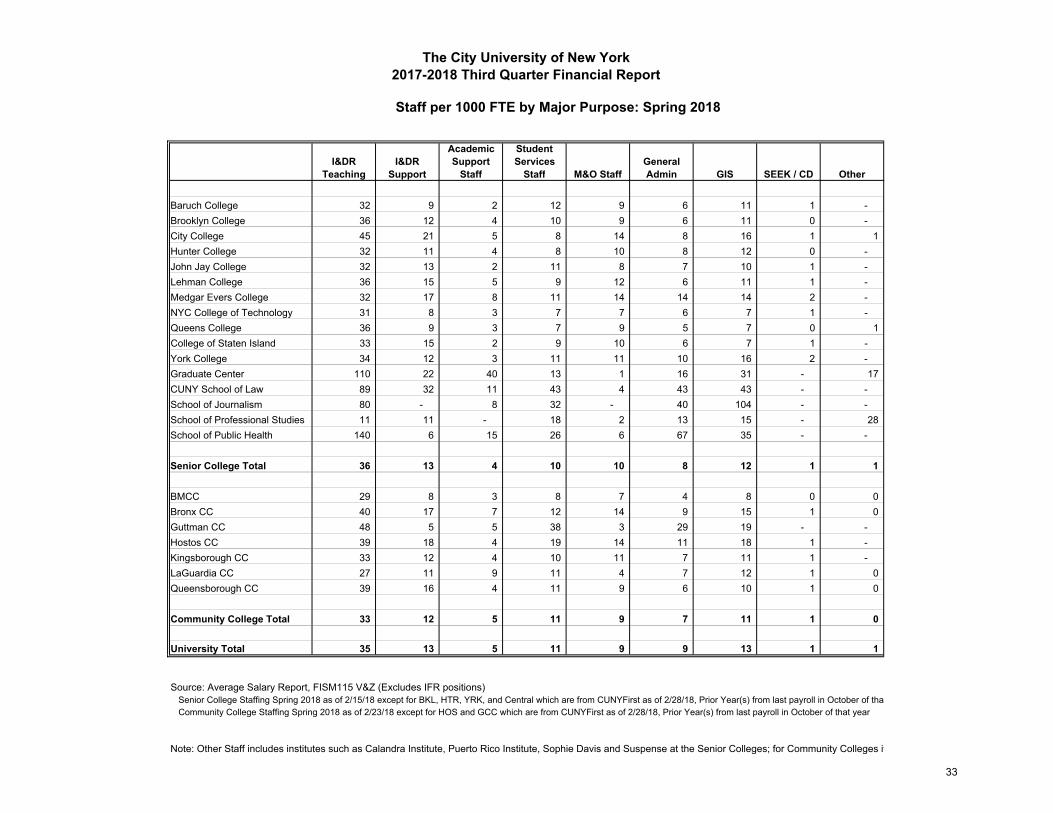
Staff per 1000 FTE by Major Purpose: Spring 2018
I&DR Teaching
I&DR Support
Academic Support
Staff
Student Services
Staff M&O StaffGeneral Admin GIS SEEK / CD Other
Baruch College 32 9 2 12 9 6 11 1 - Brooklyn College 36 12 4 10 9 6 11 0 - City College 45 21 5 8 14 8 16 1 1 Hunter College 32 11 4 8 10 8 12 0 - John Jay College 32 13 2 11 8 7 10 1 - Lehman College 36 15 5 9 12 6 11 1 - Medgar Evers College 32 17 8 11 14 14 14 2 - NYC College of Technology 31 8 3 7 7 6 7 1 - Queens College 36 9 3 7 9 5 7 0 1 College of Staten Island 33 15 2 9 10 6 7 1 - York College 34 12 3 11 11 10 16 2 - Graduate Center 110 22 40 13 1 16 31 - 17 CUNY School of Law 89 32 11 43 4 43 43 - - School of Journalism 80 - 8 32 - 40 104 - - School of Professional Studies 11 11 - 18 2 13 15 - 28 School of Public Health 140 6 15 26 6 67 35 - -
Senior College Total 36 13 4 10 10 8 12 1 1
BMCC 29 8 3 8 7 4 8 0 0 Bronx CC 40 17 7 12 14 9 15 1 0 Guttman CC 48 5 5 38 3 29 19 - - Hostos CC 39 18 4 19 14 11 18 1 - Kingsborough CC 33 12 4 10 11 7 11 1 - LaGuardia CC 27 11 9 11 4 7 12 1 0 Queensborough CC 39 16 4 11 9 6 10 1 0
Community College Total 33 12 5 11 9 7 11 1 0
University Total 35 13 5 11 9 9 13 1 1
Source: Average Salary Report, FISM115 V&Z (Excludes IFR positions)Senior College Staffing Spring 2018 as of 2/15/18 except for BKL, HTR, YRK, and Central which are from CUNYFirst as of 2/28/18, Prior Year(s) from last payroll in October of thatCommunity College Staffing Spring 2018 as of 2/23/18 except for HOS and GCC which are from CUNYFirst as of 2/28/18, Prior Year(s) from last payroll in October of that year
Note: Other Staff includes institutes such as Calandra Institute, Puerto Rico Institute, Sophie Davis and Suspense at the Senior Colleges; for Community Colleges it
The City University of New York2017-2018 Third Quarter Financial Report
33
UNIVERSITYSUMMARIES
34
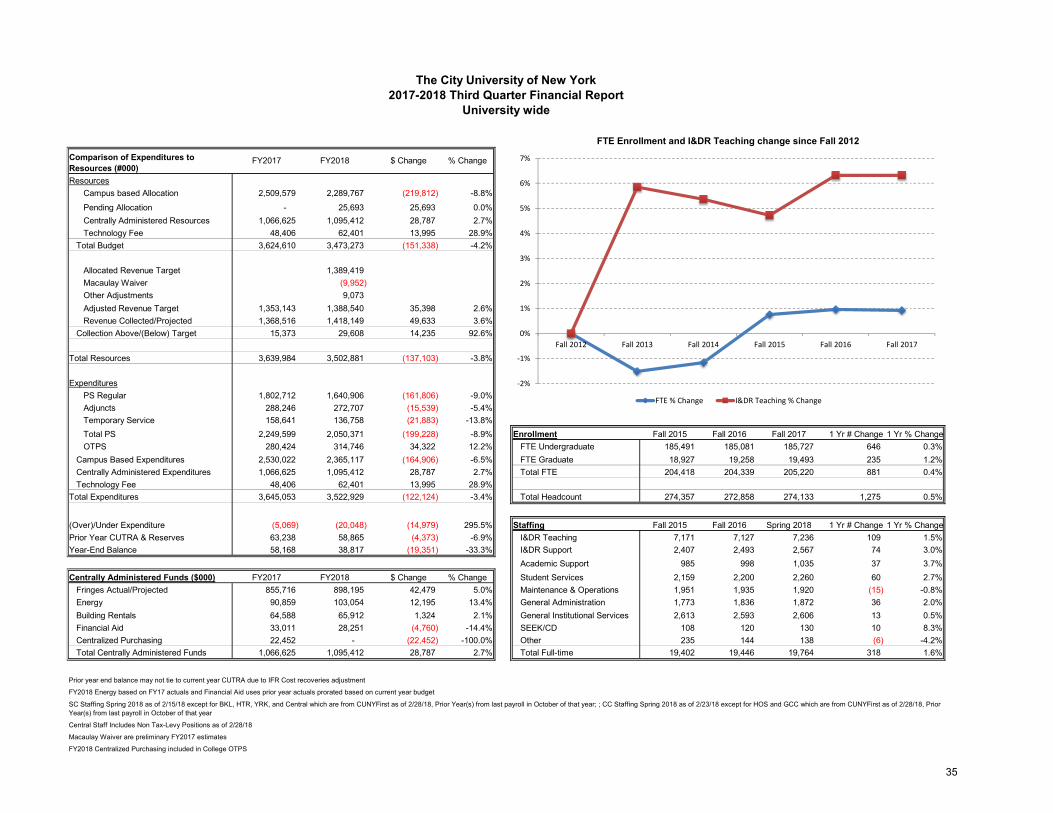
ResourcesCampus based Allocation 2,509,579 2,289,767 (219,812) -8.8%Pending Allocation - 25,693 25,693 0.0%Centrally Administered Resources 1,066,625 1,095,412 28,787 2.7% Fall 2012 Fall 2013 Fall 2014 Fa Fall 2017Technology Fee 48,406 62,401 13,995 28.9%
Total Budget 3,624,610 3,473,273 (151,338) -4.2% FTE % Change 0.0% -1.5% -1.2% # 1.0% 0.9%I&DR Teaching % Change 0.0% 5.8% 5.4% # 6.3% 6.3%
Allocated Revenue Target 1,389,419 Macaulay Waiver (9,952) Other Adjustments 9,073 Adjusted Revenue Target 1,353,143 1,388,540 35,398 2.6%Revenue Collected/Projected 1,368,516 1,418,149 49,633 3.6%
Collection Above/(Below) Target 15,373 29,608 14,235 92.6%
Total Resources 3,639,984 3,502,881 (137,103) -3.8%
ExpendituresPS Regular 1,802,712 1,640,906 (161,806) -9.0%Adjuncts 288,246 272,707 (15,539) -5.4%Temporary Service 158,641 136,758 (21,883) -13.8%Total PS 2,249,599 2,050,371 (199,228) -8.9% Enrollment Fall 2015 Fall 2016 Fall 2017 1 Yr # Change 1 Yr % ChangeOTPS 280,424 314,746 34,322 12.2% FTE Undergraduate 185,491 185,081 185,727 646 0.3%
Campus Based Expenditures 2,530,022 2,365,117 (164,906) -6.5% FTE Graduate 18,927 19,258 19,493 235 1.2%Centrally Administered Expenditures 1,066,625 1,095,412 28,787 2.7% Total FTE 204,418 204,339 205,220 881 0.4%Technology Fee 48,406 62,401 13,995 28.9%
Total Expenditures 3,645,053 3,522,929 (122,124) -3.4% Total Headcount 274,357 272,858 274,133 1,275 0.5%
(Over)/Under Expenditure (5,069) (20,048) (14,979) 295.5% Staffing Fall 2015 Fall 2016 Spring 2018 1 Yr # Change 1 Yr % ChangePrior Year CUTRA & Reserves 63,238 58,865 (4,373) -6.9% I&DR Teaching 7,171 7,127 7,236 109 1.5%Year-End Balance 58,168 38,817 (19,351) -33.3% I&DR Support 2,407 2,493 2,567 74 3.0%
Academic Support 985 998 1,035 37 3.7%Centrally Administered Funds ($000) FY2017 FY2018 $ Change % Change Student Services 2,159 2,200 2,260 60 2.7%
Fringes Actual/Projected 855,716 898,195 42,479 5.0% Maintenance & Operations 1,951 1,935 1,920 (15) -0.8%Energy 90,859 103,054 12,195 13.4% General Administration 1,773 1,836 1,872 36 2.0%Building Rentals 64,588 65,912 1,324 2.1% General Institutional Services 2,613 2,593 2,606 13 0.5%Financial Aid 33,011 28,251 (4,760) -14.4% SEEK/CD 108 120 130 10 8.3%Centralized Purchasing 22,452 - (22,452) -100.0% Other 235 144 138 (6) -4.2%Total Centrally Administered Funds 1,066,625 1,095,412 28,787 2.7% Total Full-time 19,402 19,446 19,764 318 1.6%
Prior year end balance may not tie to current year CUTRA due to IFR Cost recoveries adjustment
FY2018 Energy based on FY17 actuals and Financial Aid uses prior year actuals prorated based on current year budget
Central Staff Includes Non Tax-Levy Positions as of 2/28/18
Macaulay Waiver are preliminary FY2017 estimates
FY2018 Centralized Purchasing included in College OTPS
SC Staffing Spring 2018 as of 2/15/18 except for BKL, HTR, YRK, and Central which are from CUNYFirst as of 2/28/18, Prior Year(s) from last payroll in October of that year; ; CC Staffing Spring 2018 as of 2/23/18 except for HOS and GCC which are from CUNYFirst as of 2/28/18, Prior Year(s) from last payroll in October of that year
Fall 2016
The City University of New York2017-2018 Third Quarter Financial Report
University wide
Comparison of Expenditures to Resources (#000)
FY2017 FY2018 $ Change % Change
FTE Enrollment and I&DR Teaching change since Fall 2012
‐2%
‐1%
0%
1%
2%
3%
4%
5%
6%
7%
Fall 2012 Fall 2013 Fall 2014 Fall 2015 Fall 2016 Fall 2017
FTE % Change I&DR Teaching % Change
35
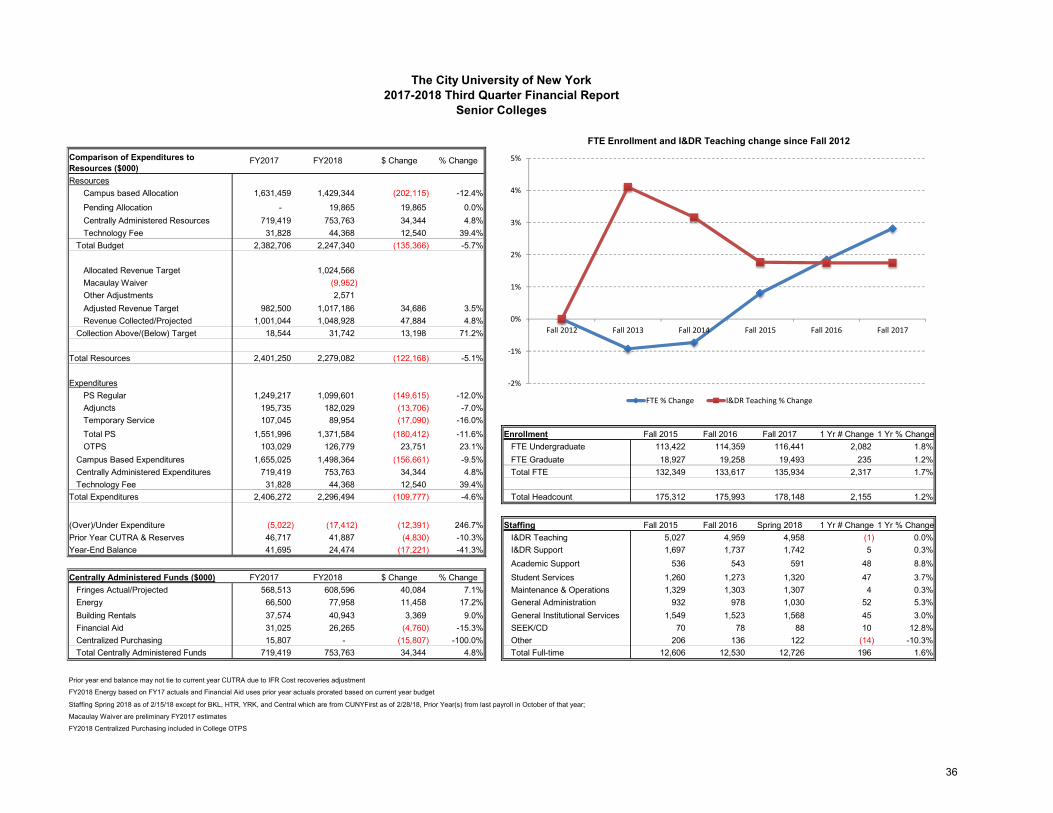
ResourcesCampus based Allocation 1,631,459 1,429,344 (202,115) -12.4%Pending Allocation - 19,865 19,865 0.0%Centrally Administered Resources 719,419 753,763 34,344 4.8% Fall 2012 Fall 2013 Fall 2014 FaTechnology Fee 31,828 44,368 12,540 39.4%
Total Budget 2,382,706 2,247,340 (135,366) -5.7% FTE % Change 0.0% -0.9% -0.7% # 1.8% 2.8%I&DR Teaching % Change 0.0% 4.1% 3.2% # 1.7% 1.7%
Allocated Revenue Target 1,024,566 Macaulay Waiver (9,952) Other Adjustments 2,571 Adjusted Revenue Target 982,500 1,017,186 34,686 3.5%Revenue Collected/Projected 1,001,044 1,048,928 47,884 4.8%
Collection Above/(Below) Target 18,544 31,742 13,198 71.2%
Total Resources 2,401,250 2,279,082 (122,168) -5.1%
ExpendituresPS Regular 1,249,217 1,099,601 (149,615) -12.0%Adjuncts 195,735 182,029 (13,706) -7.0%Temporary Service 107,045 89,954 (17,090) -16.0%Total PS 1,551,996 1,371,584 (180,412) -11.6% Enrollment Fall 2015 Fall 2016 Fall 2017 1 Yr # Change 1 Yr % ChangeOTPS 103,029 126,779 23,751 23.1% FTE Undergraduate 113,422 114,359 116,441 2,082 1.8%
Campus Based Expenditures 1,655,025 1,498,364 (156,661) -9.5% FTE Graduate 18,927 19,258 19,493 235 1.2%Centrally Administered Expenditures 719,419 753,763 34,344 4.8% Total FTE 132,349 133,617 135,934 2,317 1.7%Technology Fee 31,828 44,368 12,540 39.4%
Total Expenditures 2,406,272 2,296,494 (109,777) -4.6% Total Headcount 175,312 175,993 178,148 2,155 1.2%
(Over)/Under Expenditure (5,022) (17,412) (12,391) 246.7% Staffing Fall 2015 Fall 2016 Spring 2018 1 Yr # Change 1 Yr % ChangePrior Year CUTRA & Reserves 46,717 41,887 (4,830) -10.3% I&DR Teaching 5,027 4,959 4,958 (1) 0.0%Year-End Balance 41,695 24,474 (17,221) -41.3% I&DR Support 1,697 1,737 1,742 5 0.3%
Academic Support 536 543 591 48 8.8%Centrally Administered Funds ($000) FY2017 FY2018 $ Change % Change Student Services 1,260 1,273 1,320 47 3.7%
Fringes Actual/Projected 568,513 608,596 40,084 7.1% Maintenance & Operations 1,329 1,303 1,307 4 0.3%Energy 66,500 77,958 11,458 17.2% General Administration 932 978 1,030 52 5.3%Building Rentals 37,574 40,943 3,369 9.0% General Institutional Services 1,549 1,523 1,568 45 3.0%Financial Aid 31,025 26,265 (4,760) -15.3% SEEK/CD 70 78 88 10 12.8%Centralized Purchasing 15,807 - (15,807) -100.0% Other 206 136 122 (14) -10.3%Total Centrally Administered Funds 719,419 753,763 34,344 4.8% Total Full-time 12,606 12,530 12,726 196 1.6%
Prior year end balance may not tie to current year CUTRA due to IFR Cost recoveries adjustment
FY2018 Energy based on FY17 actuals and Financial Aid uses prior year actuals prorated based on current year budget
Staffing Spring 2018 as of 2/15/18 except for BKL, HTR, YRK, and Central which are from CUNYFirst as of 2/28/18, Prior Year(s) from last payroll in October of that year;
Macaulay Waiver are preliminary FY2017 estimates
FY2018 Centralized Purchasing included in College OTPS
Fall 2016 Fall 2017
The City University of New York2017-2018 Third Quarter Financial Report
Senior Colleges
Comparison of Expenditures to Resources ($000)
FY2017 FY2018 $ Change % Change
FTE Enrollment and I&DR Teaching change since Fall 2012
‐2%
‐1%
0%
1%
2%
3%
4%
5%
Fall 2012 Fall 2013 Fall 2014 Fall 2015 Fall 2016 Fall 2017
FTE % Change I&DR Teaching % Change
36
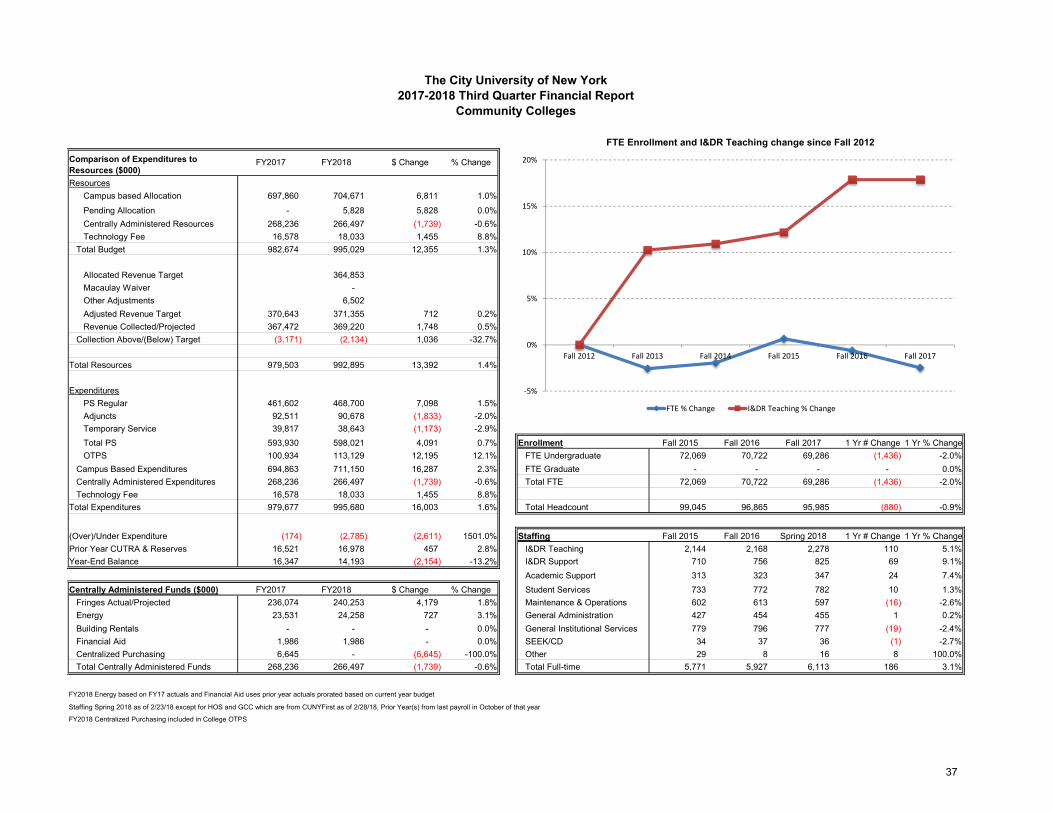
ResourcesCampus based Allocation 697,860 704,671 6,811 1.0%Pending Allocation - 5,828 5,828 0.0%Centrally Administered Resources 268,236 266,497 (1,739) -0.6% Fall 2012 Fall 2013 Fall 2014 FaTechnology Fee 16,578 18,033 1,455 8.8%
Total Budget 982,674 995,029 12,355 1.3% FTE % Change 0.0% -2.6% -2.0% # -0.6% -2.5%I&DR Teaching % Change 0.0% 10.2% 10.9% # 17.8% 17.8%
Allocated Revenue Target 364,853 Macaulay Waiver - Other Adjustments 6,502 Adjusted Revenue Target 370,643 371,355 712 0.2%Revenue Collected/Projected 367,472 369,220 1,748 0.5%
Collection Above/(Below) Target (3,171) (2,134) 1,036 -32.7%
Total Resources 979,503 992,895 13,392 1.4%
ExpendituresPS Regular 461,602 468,700 7,098 1.5%Adjuncts 92,511 90,678 (1,833) -2.0%Temporary Service 39,817 38,643 (1,173) -2.9%Total PS 593,930 598,021 4,091 0.7% Enrollment Fall 2015 Fall 2016 Fall 2017 1 Yr # Change 1 Yr % ChangeOTPS 100,934 113,129 12,195 12.1% FTE Undergraduate 72,069 70,722 69,286 (1,436) -2.0%
Campus Based Expenditures 694,863 711,150 16,287 2.3% FTE Graduate - - - - 0.0%Centrally Administered Expenditures 268,236 266,497 (1,739) -0.6% Total FTE 72,069 70,722 69,286 (1,436) -2.0%Technology Fee 16,578 18,033 1,455 8.8%
Total Expenditures 979,677 995,680 16,003 1.6% Total Headcount 99,045 96,865 95,985 (880) -0.9%
(Over)/Under Expenditure (174) (2,785) (2,611) 1501.0% Staffing Fall 2015 Fall 2016 Spring 2018 1 Yr # Change 1 Yr % ChangePrior Year CUTRA & Reserves 16,521 16,978 457 2.8% I&DR Teaching 2,144 2,168 2,278 110 5.1%Year-End Balance 16,347 14,193 (2,154) -13.2% I&DR Support 710 756 825 69 9.1%
Academic Support 313 323 347 24 7.4%Centrally Administered Funds ($000) FY2017 FY2018 $ Change % Change Student Services 733 772 782 10 1.3%
Fringes Actual/Projected 236,074 240,253 4,179 1.8% Maintenance & Operations 602 613 597 (16) -2.6%Energy 23,531 24,258 727 3.1% General Administration 427 454 455 1 0.2%Building Rentals - - - 0.0% General Institutional Services 779 796 777 (19) -2.4%Financial Aid 1,986 1,986 - 0.0% SEEK/CD 34 37 36 (1) -2.7%Centralized Purchasing 6,645 - (6,645) -100.0% Other 29 8 16 8 100.0%Total Centrally Administered Funds 268,236 266,497 (1,739) -0.6% Total Full-time 5,771 5,927 6,113 186 3.1%
FY2018 Energy based on FY17 actuals and Financial Aid uses prior year actuals prorated based on current year budget
Staffing Spring 2018 as of 2/23/18 except for HOS and GCC which are from CUNYFirst as of 2/28/18, Prior Year(s) from last payroll in October of that year
FY2018 Centralized Purchasing included in College OTPS
Fall 2016 Fall 2017
The City University of New York2017-2018 Third Quarter Financial Report
Community Colleges
Comparison of Expenditures to Resources ($000)
FY2017 FY2018 $ Change % Change
FTE Enrollment and I&DR Teaching change since Fall 2012
‐5%
0%
5%
10%
15%
20%
Fall 2012 Fall 2013 Fall 2014 Fall 2015 Fall 2016 Fall 2017
FTE % Change I&DR Teaching % Change
37
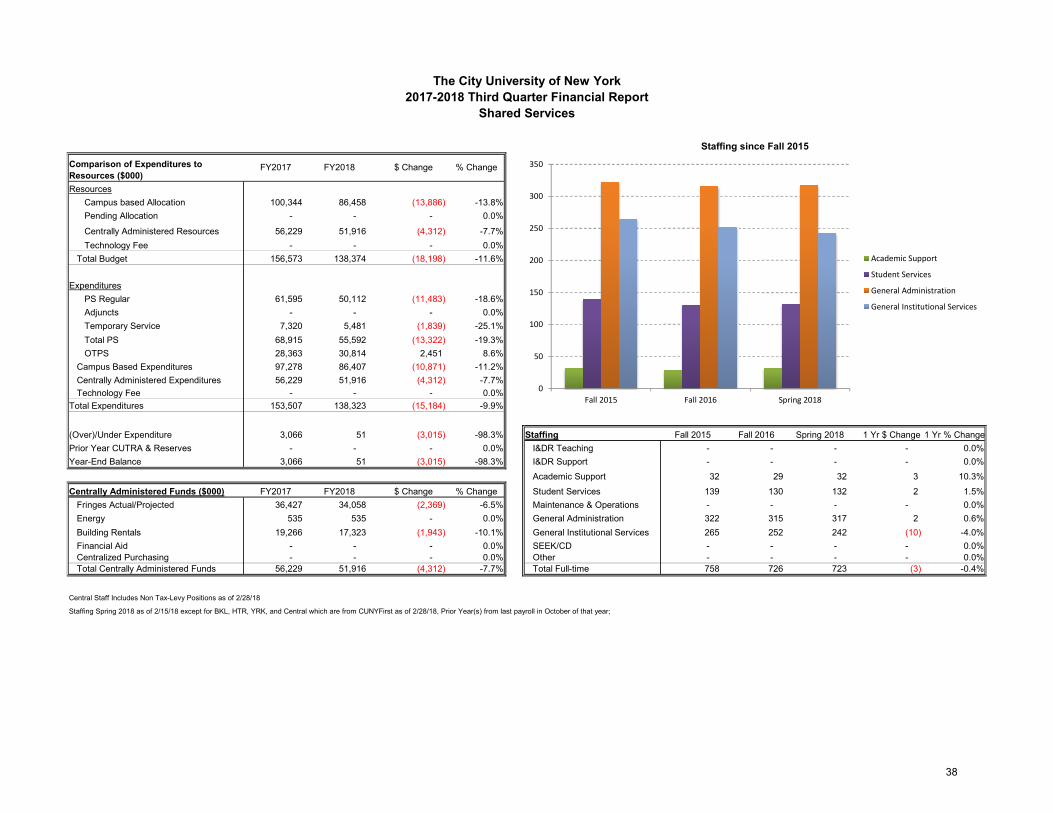
ResourcesCampus based Allocation 100,344 86,458 (13,886) -13.8%Pending Allocation - - - 0.0%
Centrally Administered Resources 56,229 51,916 (4,312) -7.7% Fall 2017Technology Fee - - - 0.0% Fall 2012 Fall 2013 Fall 2014 Fa
Total Budget 156,573 138,374 (18,198) -11.6% FTE % Change
Expenditures Enrollment Fall 2015 Fall 2016 Fall 2017 1 Yr $ Change 1 Yr % ChangePS Regular 61,595 50,112 (11,483) -18.6% FTE Undergraduate - 0.0%Adjuncts - - - 0.0% FTE Graduate - 0.0%Temporary Service 7,320 5,481 (1,839) -25.1% Total FTE - - - - 0.0%Total PS 68,915 55,592 (13,322) -19.3%OTPS 28,363 30,814 2,451 8.6% Total Headcount - 0.0%
Campus Based Expenditures 97,278 86,407 (10,871) -11.2%Centrally Administered Expenditures 56,229 51,916 (4,312) -7.7%Technology Fee - - - 0.0%
Total Expenditures 153,507 138,323 (15,184) -9.9% #N/A
(Over)/Under Expenditure 3,066 51 (3,015) -98.3% Staffing Fall 2015 Fall 2016 Spring 2018 1 Yr $ Change 1 Yr % ChangePrior Year CUTRA & Reserves - - - 0.0% I&DR Teaching - - - - 0.0%Year-End Balance 3,066 51 (3,015) -98.3% I&DR Support - - - - 0.0%
Academic Support 32 29 32 3 10.3%Centrally Administered Funds ($000) FY2017 FY2018 $ Change % Change Student Services 139 130 132 2 1.5%
Fringes Actual/Projected 36,427 34,058 (2,369) -6.5% Maintenance & Operations - - - - 0.0%Energy 535 535 - 0.0% General Administration 322 315 317 2 0.6%Building Rentals 19,266 17,323 (1,943) -10.1% General Institutional Services 265 252 242 (10) -4.0%Financial Aid - - - 0.0% SEEK/CD - - - - 0.0%Centralized Purchasing - - - 0.0% Other - - - - 0.0%Total Centrally Administered Funds 56,229 51,916 (4,312) -7.7% Total Full-time 758 726 723 (3) -0.4%
Other Metrics ($) FY2017 FY2018 1 Yr # Change 1 Yr% ChangeCentral Staff Includes Non Tax-Levy Positions as of 2/28/18 Revenue per FTE ((Tuition+Tech Fee)/Total FTE) - - - 0.0%Staffing Spring 2018 as of 2/15/18 except for BKL, HTR, YRK, and Central which are from CUNYFirst as of 2/28/18, Prior Year(s) from last payroll in October of that year;
Fall 2016 Fall 2017
The City University of New York2017-2018 Third Quarter Financial Report
Shared Services
Staffing since Fall 2015
Comparison of Expenditures to Resources ($000)
FY2017 FY2018 $ Change % Change
0
50
100
150
200
250
300
350
Fall 2015 Fall 2016 Spring 2018
Academic Support
Student Services
General Administration
General Institutional Services
38
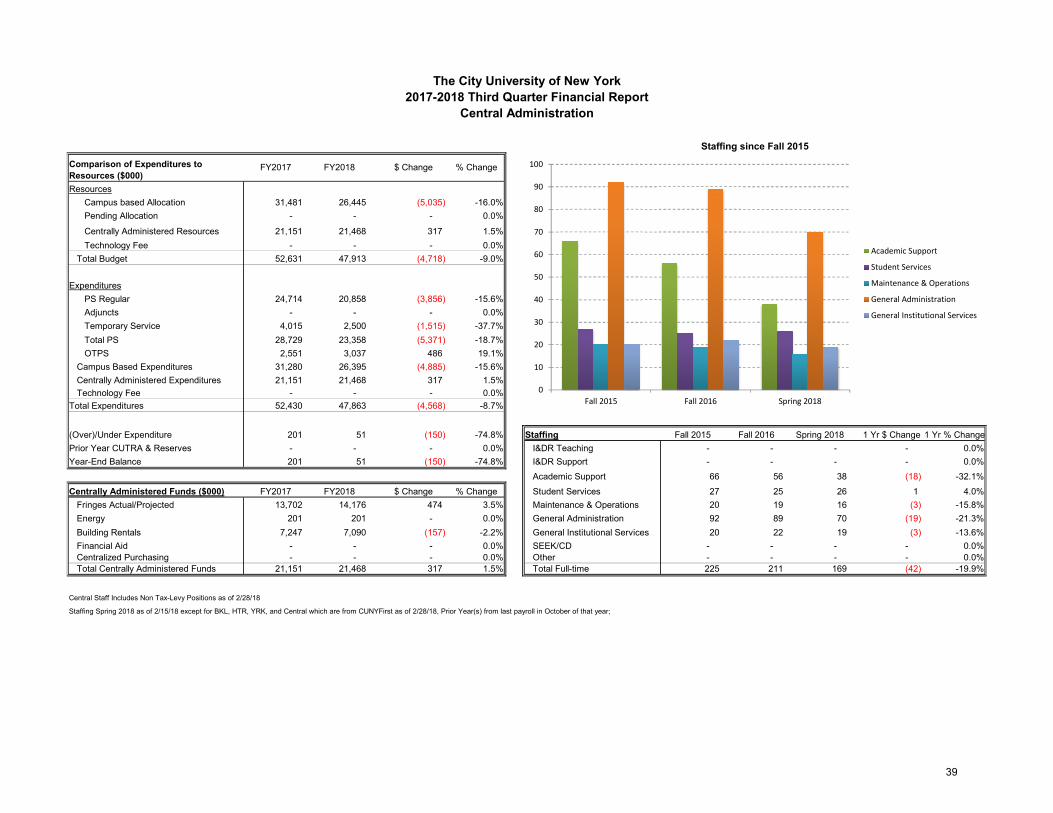
ResourcesCampus based Allocation 31,481 26,445 (5,035) -16.0%Pending Allocation - - - 0.0%
Centrally Administered Resources 21,151 21,468 317 1.5% Fall 2017Technology Fee - - - 0.0% Fall 2012 Fall 2013 Fall 2014 Fa
Total Budget 52,631 47,913 (4,718) -9.0% FTE % Change
Expenditures Enrollment Fall 2015 Fall 2016 Fall 2017 1 Yr $ Change 1 Yr % ChangePS Regular 24,714 20,858 (3,856) -15.6% FTE Undergraduate - 0.0%Adjuncts - - - 0.0% FTE Graduate - 0.0%Temporary Service 4,015 2,500 (1,515) -37.7% Total FTE - - - - 0.0%Total PS 28,729 23,358 (5,371) -18.7%OTPS 2,551 3,037 486 19.1% Total Headcount - 0.0%
Campus Based Expenditures 31,280 26,395 (4,885) -15.6%Centrally Administered Expenditures 21,151 21,468 317 1.5%Technology Fee - - - 0.0%
Total Expenditures 52,430 47,863 (4,568) -8.7% #N/A
(Over)/Under Expenditure 201 51 (150) -74.8% Staffing Fall 2015 Fall 2016 Spring 2018 1 Yr $ Change 1 Yr % ChangePrior Year CUTRA & Reserves - - - 0.0% I&DR Teaching - - - - 0.0%Year-End Balance 201 51 (150) -74.8% I&DR Support - - - - 0.0%
Academic Support 66 56 38 (18) -32.1%Centrally Administered Funds ($000) FY2017 FY2018 $ Change % Change Student Services 27 25 26 1 4.0%
Fringes Actual/Projected 13,702 14,176 474 3.5% Maintenance & Operations 20 19 16 (3) -15.8%Energy 201 201 - 0.0% General Administration 92 89 70 (19) -21.3%Building Rentals 7,247 7,090 (157) -2.2% General Institutional Services 20 22 19 (3) -13.6%Financial Aid - - - 0.0% SEEK/CD - - - - 0.0%Centralized Purchasing - - - 0.0% Other - - - - 0.0%Total Centrally Administered Funds 21,151 21,468 317 1.5% Total Full-time 225 211 169 (42) -19.9%
Other Metrics ($) FY2017 FY2018 1 Yr # Change 1 Yr% ChangeCentral Staff Includes Non Tax-Levy Positions as of 2/28/18 Revenue per FTE ((Tuition+Tech Fee)/Total FTE) - - - 0.0%Staffing Spring 2018 as of 2/15/18 except for BKL, HTR, YRK, and Central which are from CUNYFirst as of 2/28/18, Prior Year(s) from last payroll in October of that year;
Fall 2016 Fall 2017
The City University of New York2017-2018 Third Quarter Financial Report
Central Administration
Staffing since Fall 2015
Comparison of Expenditures to Resources ($000)
FY2017 FY2018 $ Change % Change
0
10
20
30
40
50
60
70
80
90
100
Fall 2015 Fall 2016 Spring 2018
Academic Support
Student Services
Maintenance & Operations
General Administration
General Institutional Services
39
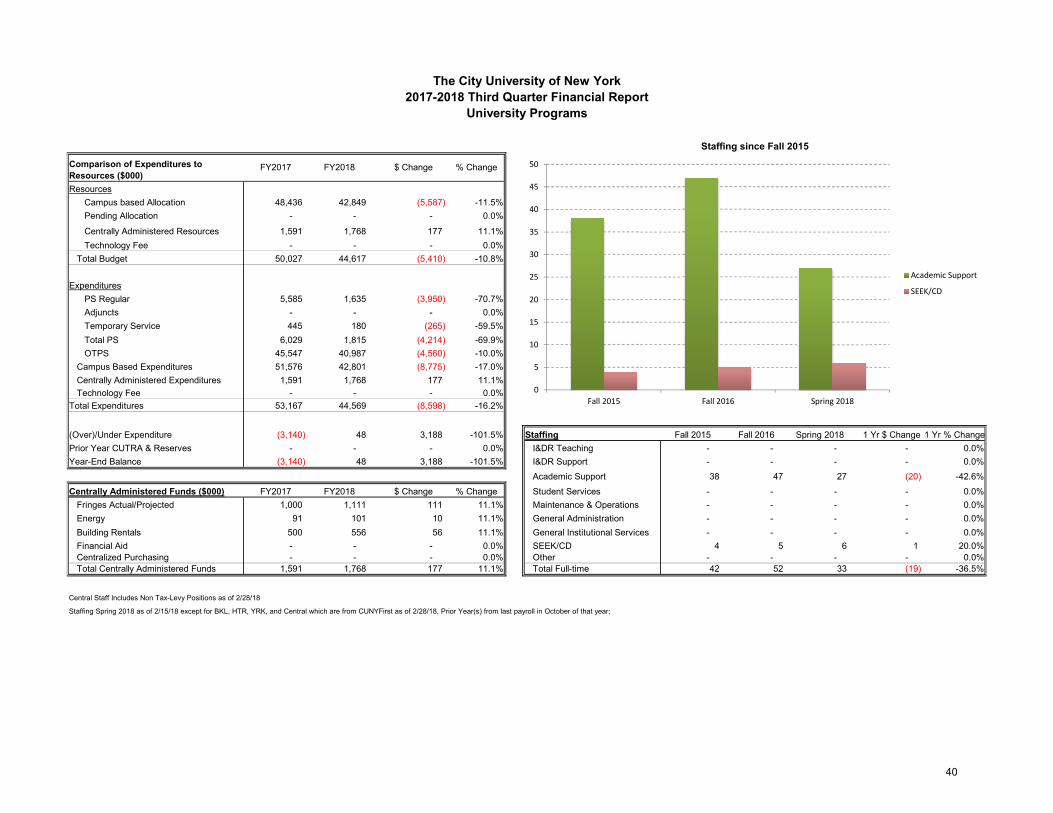
ResourcesCampus based Allocation 48,436 42,849 (5,587) -11.5%Pending Allocation - - - 0.0%
Centrally Administered Resources 1,591 1,768 177 11.1% Fall 2017Technology Fee - - - 0.0% Fall 2012 Fall 2013 Fall 2014 Fa
Total Budget 50,027 44,617 (5,410) -10.8% FTE % Change
Expenditures Enrollment Fall 2015 Fall 2016 Fall 2017 1 Yr $ Change 1 Yr % ChangePS Regular 5,585 1,635 (3,950) -70.7% FTE Undergraduate - 0.0%Adjuncts - - - 0.0% FTE Graduate - 0.0%Temporary Service 445 180 (265) -59.5% Total FTE - - - - 0.0%Total PS 6,029 1,815 (4,214) -69.9%OTPS 45,547 40,987 (4,560) -10.0% Total Headcount - 0.0%
Campus Based Expenditures 51,576 42,801 (8,775) -17.0%Centrally Administered Expenditures 1,591 1,768 177 11.1%Technology Fee - - - 0.0%
Total Expenditures 53,167 44,569 (8,598) -16.2% #N/A
(Over)/Under Expenditure (3,140) 48 3,188 -101.5% Staffing Fall 2015 Fall 2016 Spring 2018 1 Yr $ Change 1 Yr % ChangePrior Year CUTRA & Reserves - - - 0.0% I&DR Teaching - - - - 0.0%Year-End Balance (3,140) 48 3,188 -101.5% I&DR Support - - - - 0.0%
Academic Support 38 47 27 (20) -42.6%Centrally Administered Funds ($000) FY2017 FY2018 $ Change % Change Student Services - - - - 0.0%
Fringes Actual/Projected 1,000 1,111 111 11.1% Maintenance & Operations - - - - 0.0%Energy 91 101 10 11.1% General Administration - - - - 0.0%Building Rentals 500 556 56 11.1% General Institutional Services - - - - 0.0%Financial Aid - - - 0.0% SEEK/CD 4 5 6 1 20.0%Centralized Purchasing - - - 0.0% Other - - - - 0.0%Total Centrally Administered Funds 1,591 1,768 177 11.1% Total Full-time 42 52 33 (19) -36.5%
Other Metrics ($) FY2017 FY2018 1 Yr # Change 1 Yr% ChangeCentral Staff Includes Non Tax-Levy Positions as of 2/28/18 Revenue per FTE ((Tuition+Tech Fee)/Total FTE) - - - 0.0%Staffing Spring 2018 as of 2/15/18 except for BKL, HTR, YRK, and Central which are from CUNYFirst as of 2/28/18, Prior Year(s) from last payroll in October of that year;
Fall 2016 Fall 2017
The City University of New York2017-2018 Third Quarter Financial Report
University Programs
Staffing since Fall 2015
Comparison of Expenditures to Resources ($000)
FY2017 FY2018 $ Change % Change
0
5
10
15
20
25
30
35
40
45
50
Fall 2015 Fall 2016 Spring 2018
Academic Support
SEEK/CD
40
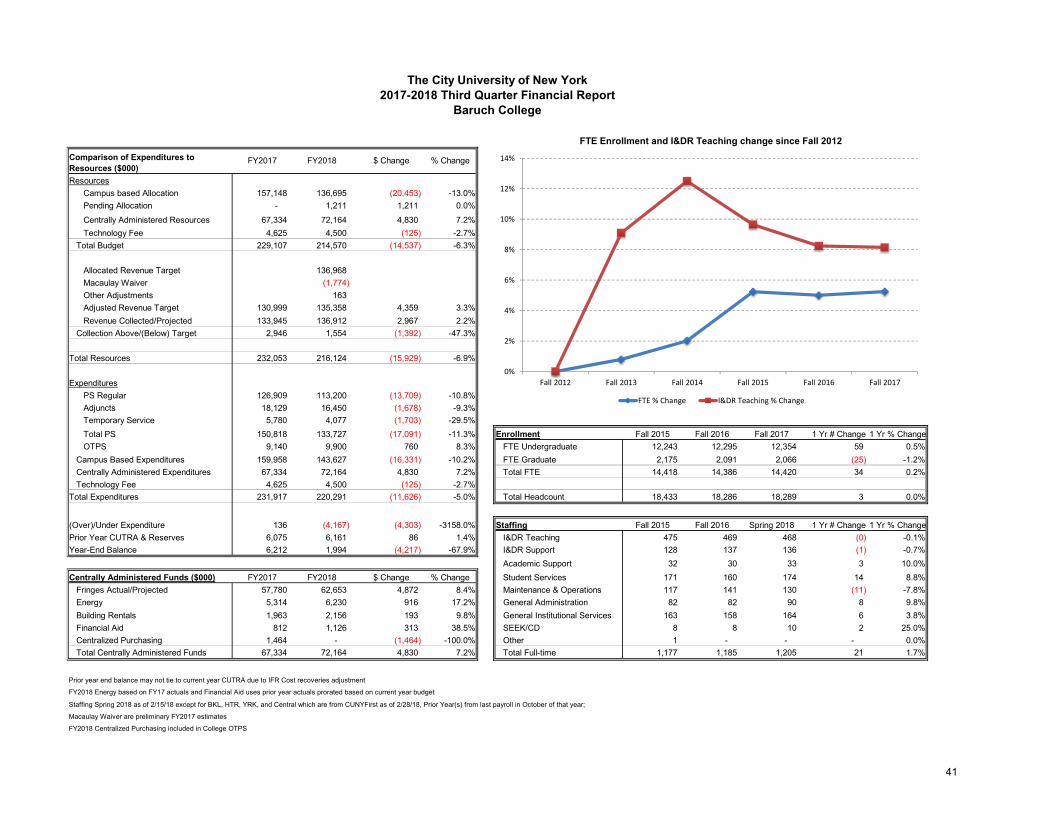
ResourcesCampus based Allocation 157,148 136,695 (20,453) -13.0%Pending Allocation - 1,211 1,211 0.0%Centrally Administered Resources 67,334 72,164 4,830 7.2% Fall 2017Technology Fee 4,625 4,500 (125) -2.7% Fall 2012 Fall 2013 Fall 2014 Fa
Total Budget 229,107 214,570 (14,537) -6.3% FTE % ChangeFTE % Change 0.0% 0.8% 2.0% # 5.0% 5.2%
Allocated Revenue Target 136,968 I&DR Teaching % Change 0.0% 9.1% 12.5% # 8.2% 8.1%Macaulay Waiver (1,774) Other Adjustments 163 Adjusted Revenue Target 130,999 135,358 4,359 3.3%Revenue Collected/Projected 133,945 136,912 2,967 2.2%
Collection Above/(Below) Target 2,946 1,554 (1,392) -47.3%
Total Resources 232,053 216,124 (15,929) -6.9%
ExpendituresPS Regular 126,909 113,200 (13,709) -10.8%Adjuncts 18,129 16,450 (1,678) -9.3%Temporary Service 5,780 4,077 (1,703) -29.5% Fall 2017Total PS 150,818 133,727 (17,091) -11.3% Enrollment Fall 2015 Fall 2016 Fall 2017 1 Yr # Change 1 Yr % ChangeOTPS 9,140 9,900 760 8.3% FTE Undergraduate 12,243 12,295 12,354 59 0.5%
Campus Based Expenditures 159,958 143,627 (16,331) -10.2% FTE Graduate 2,175 2,091 2,066 (25) -1.2%Centrally Administered Expenditures 67,334 72,164 4,830 7.2% Total FTE 14,418 14,386 14,420 34 0.2%Technology Fee 4,625 4,500 (125) -2.7%
Total Expenditures 231,917 220,291 (11,626) -5.0% Total Headcount 18,433 18,286 18,289 3 0.0%
(Over)/Under Expenditure 136 (4,167) (4,303) -3158.0% Staffing Fall 2015 Fall 2016 Spring 2018 1 Yr # Change 1 Yr % ChangePrior Year CUTRA & Reserves 6,075 6,161 86 1.4% I&DR Teaching 475 469 468 (0) -0.1%Year-End Balance 6,212 1,994 (4,217) -67.9% I&DR Support 128 137 136 (1) -0.7%
Academic Support 32 30 33 3 10.0%Centrally Administered Funds ($000) FY2017 FY2018 $ Change % Change Student Services 171 160 174 14 8.8%
Fringes Actual/Projected 57,780 62,653 4,872 8.4% Maintenance & Operations 117 141 130 (11) -7.8%Energy 5,314 6,230 916 17.2% General Administration 82 82 90 8 9.8%Building Rentals 1,963 2,156 193 9.8% General Institutional Services 163 158 164 6 3.8%Financial Aid 812 1,126 313 38.5% SEEK/CD 8 8 10 2 25.0%Centralized Purchasing 1,464 - (1,464) -100.0% Other 1 - - - 0.0%Total Centrally Administered Funds 67,334 72,164 4,830 7.2% Total Full-time 1,177 1,185 1,205 21 1.7%
Prior year end balance may not tie to current year CUTRA due to IFR Cost recoveries adjustment
FY2018 Energy based on FY17 actuals and Financial Aid uses prior year actuals prorated based on current year budget
Staffing Spring 2018 as of 2/15/18 except for BKL, HTR, YRK, and Central which are from CUNYFirst as of 2/28/18, Prior Year(s) from last payroll in October of that year;
Macaulay Waiver are preliminary FY2017 estimates
FY2018 Centralized Purchasing included in College OTPS
The City University of New York
Comparison of Expenditures to Resources ($000)
FY2017 FY2018 $ Change % Change
Fall 2016 Fall 2017
FTE Enrollment and I&DR Teaching change since Fall 2012
Baruch College2017-2018 Third Quarter Financial Report
0%
2%
4%
6%
8%
10%
12%
14%
Fall 2012 Fall 2013 Fall 2014 Fall 2015 Fall 2016 Fall 2017
FTE % Change I&DR Teaching % Change
41
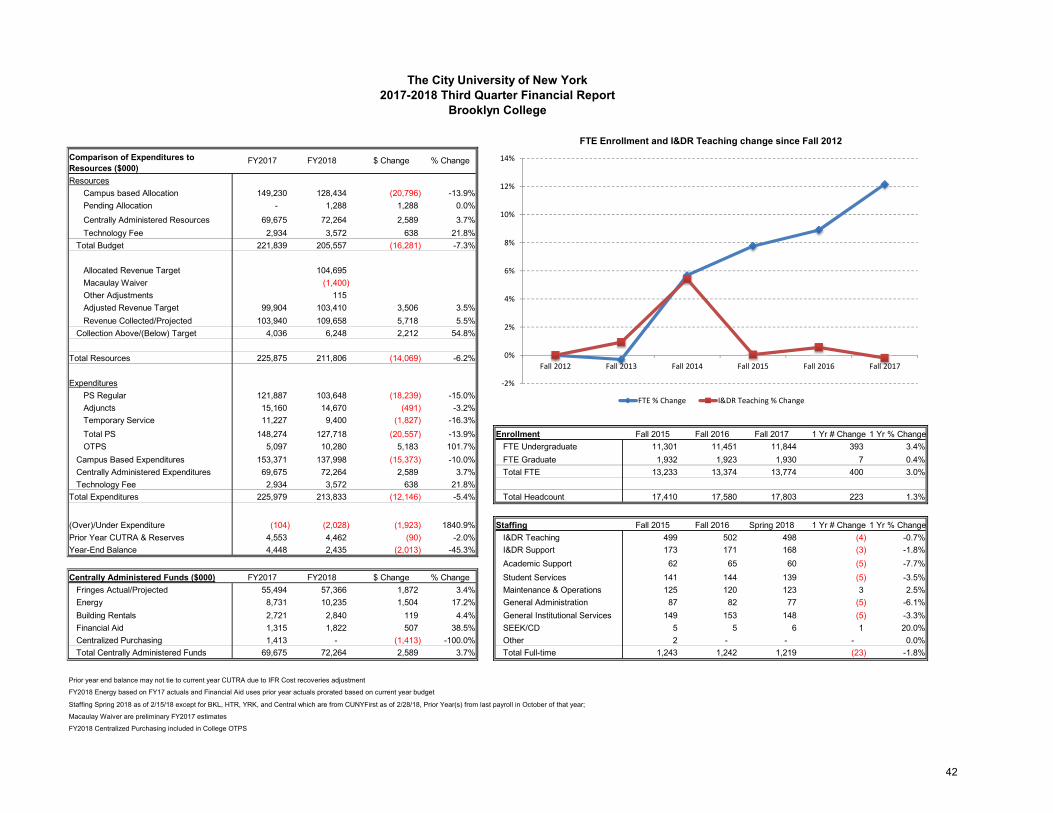
ResourcesCampus based Allocation 149,230 128,434 (20,796) -13.9%Pending Allocation - 1,288 1,288 0.0%Centrally Administered Resources 69,675 72,264 2,589 3.7% Fall 2017Technology Fee 2,934 3,572 638 21.8% Fall 2012 Fall 2013 Fall 2014 Fa
Total Budget 221,839 205,557 (16,281) -7.3% FTE % ChangeFTE % Change 0.0% -0.3% 5.7% # 8.9% 12.2%
Allocated Revenue Target 104,695 I&DR Teaching % Change 0.0% 0.9% 5.4% # 0.6% -0.2%Macaulay Waiver (1,400) Other Adjustments 115 Adjusted Revenue Target 99,904 103,410 3,506 3.5%Revenue Collected/Projected 103,940 109,658 5,718 5.5%
Collection Above/(Below) Target 4,036 6,248 2,212 54.8%
Total Resources 225,875 211,806 (14,069) -6.2%
ExpendituresPS Regular 121,887 103,648 (18,239) -15.0%Adjuncts 15,160 14,670 (491) -3.2%Temporary Service 11,227 9,400 (1,827) -16.3% Fall 2017Total PS 148,274 127,718 (20,557) -13.9% Enrollment Fall 2015 Fall 2016 Fall 2017 1 Yr # Change 1 Yr % ChangeOTPS 5,097 10,280 5,183 101.7% FTE Undergraduate 11,301 11,451 11,844 393 3.4%
Campus Based Expenditures 153,371 137,998 (15,373) -10.0% FTE Graduate 1,932 1,923 1,930 7 0.4%Centrally Administered Expenditures 69,675 72,264 2,589 3.7% Total FTE 13,233 13,374 13,774 400 3.0%Technology Fee 2,934 3,572 638 21.8%
Total Expenditures 225,979 213,833 (12,146) -5.4% Total Headcount 17,410 17,580 17,803 223 1.3%
(Over)/Under Expenditure (104) (2,028) (1,923) 1840.9% Staffing Fall 2015 Fall 2016 Spring 2018 1 Yr # Change 1 Yr % ChangePrior Year CUTRA & Reserves 4,553 4,462 (90) -2.0% I&DR Teaching 499 502 498 (4) -0.7%Year-End Balance 4,448 2,435 (2,013) -45.3% I&DR Support 173 171 168 (3) -1.8%
Academic Support 62 65 60 (5) -7.7%Centrally Administered Funds ($000) FY2017 FY2018 $ Change % Change Student Services 141 144 139 (5) -3.5%
Fringes Actual/Projected 55,494 57,366 1,872 3.4% Maintenance & Operations 125 120 123 3 2.5%Energy 8,731 10,235 1,504 17.2% General Administration 87 82 77 (5) -6.1%Building Rentals 2,721 2,840 119 4.4% General Institutional Services 149 153 148 (5) -3.3%Financial Aid 1,315 1,822 507 38.5% SEEK/CD 5 5 6 1 20.0%Centralized Purchasing 1,413 - (1,413) -100.0% Other 2 - - - 0.0%Total Centrally Administered Funds 69,675 72,264 2,589 3.7% Total Full-time 1,243 1,242 1,219 (23) -1.8%
Prior year end balance may not tie to current year CUTRA due to IFR Cost recoveries adjustment
FY2018 Energy based on FY17 actuals and Financial Aid uses prior year actuals prorated based on current year budget
Staffing Spring 2018 as of 2/15/18 except for BKL, HTR, YRK, and Central which are from CUNYFirst as of 2/28/18, Prior Year(s) from last payroll in October of that year;
Macaulay Waiver are preliminary FY2017 estimates
FY2018 Centralized Purchasing included in College OTPS
Fall 2016 Fall 2017
The City University of New York2017-2018 Third Quarter Financial Report
Brooklyn College
Comparison of Expenditures to Resources ($000)
FY2017 FY2018 $ Change % Change
FTE Enrollment and I&DR Teaching change since Fall 2012
‐2%
0%
2%
4%
6%
8%
10%
12%
14%
Fall 2012 Fall 2013 Fall 2014 Fall 2015 Fall 2016 Fall 2017
FTE % Change I&DR Teaching % Change
42
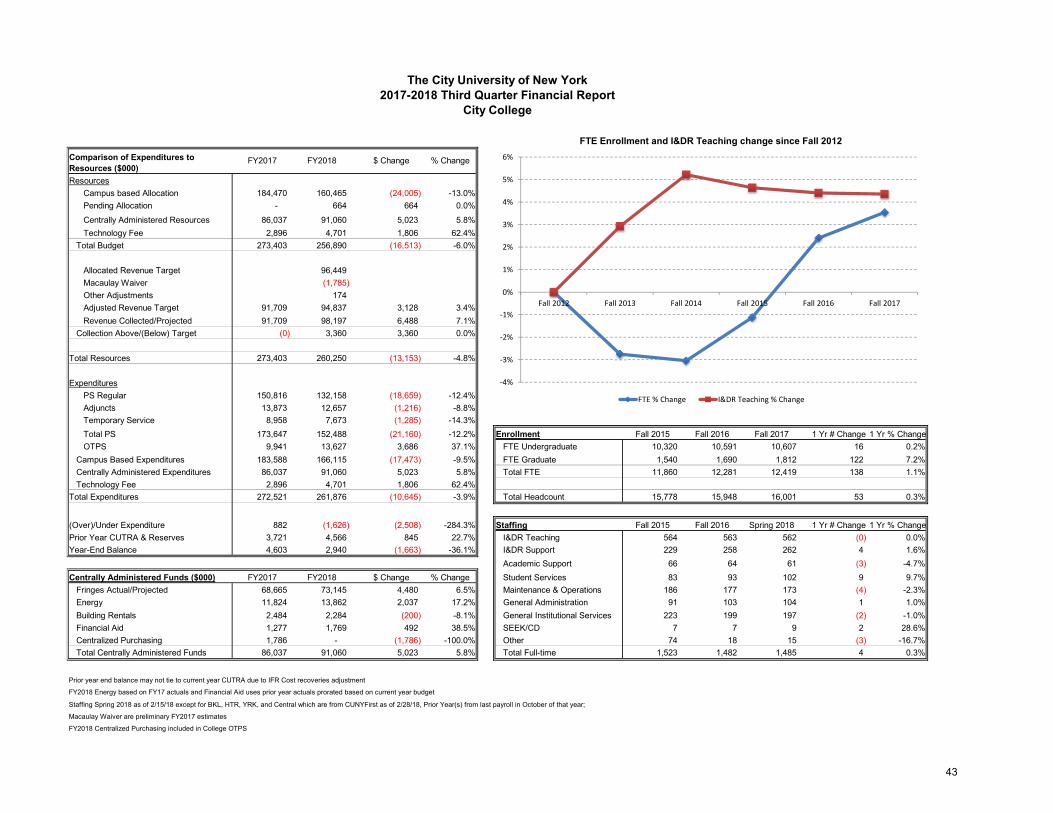
ResourcesCampus based Allocation 184,470 160,465 (24,005) -13.0%Pending Allocation - 664 664 0.0%Centrally Administered Resources 86,037 91,060 5,023 5.8% Fall 2017Technology Fee 2,896 4,701 1,806 62.4% Fall 2012 Fall 2013 Fall 2014 Fa
Total Budget 273,403 256,890 (16,513) -6.0% FTE % ChangeFTE % Change 0.0% -2.8% -3.0% # 2.4% 3.5%
Allocated Revenue Target 96,449 I&DR Teaching % Change 0.0% 2.9% 5.2% # 4.4% 4.4%Macaulay Waiver (1,785) Other Adjustments 174 Adjusted Revenue Target 91,709 94,837 3,128 3.4%Revenue Collected/Projected 91,709 98,197 6,488 7.1%
Collection Above/(Below) Target (0) 3,360 3,360 0.0%
Total Resources 273,403 260,250 (13,153) -4.8%
ExpendituresPS Regular 150,816 132,158 (18,659) -12.4%Adjuncts 13,873 12,657 (1,216) -8.8%Temporary Service 8,958 7,673 (1,285) -14.3% Fall 2017Total PS 173,647 152,488 (21,160) -12.2% Enrollment Fall 2015 Fall 2016 Fall 2017 1 Yr # Change 1 Yr % ChangeOTPS 9,941 13,627 3,686 37.1% FTE Undergraduate 10,320 10,591 10,607 16 0.2%
Campus Based Expenditures 183,588 166,115 (17,473) -9.5% FTE Graduate 1,540 1,690 1,812 122 7.2%Centrally Administered Expenditures 86,037 91,060 5,023 5.8% Total FTE 11,860 12,281 12,419 138 1.1%Technology Fee 2,896 4,701 1,806 62.4%
Total Expenditures 272,521 261,876 (10,645) -3.9% Total Headcount 15,778 15,948 16,001 53 0.3%
(Over)/Under Expenditure 882 (1,626) (2,508) -284.3% Staffing Fall 2015 Fall 2016 Spring 2018 1 Yr # Change 1 Yr % ChangePrior Year CUTRA & Reserves 3,721 4,566 845 22.7% I&DR Teaching 564 563 562 (0) 0.0%Year-End Balance 4,603 2,940 (1,663) -36.1% I&DR Support 229 258 262 4 1.6%
Academic Support 66 64 61 (3) -4.7%Centrally Administered Funds ($000) FY2017 FY2018 $ Change % Change Student Services 83 93 102 9 9.7%
Fringes Actual/Projected 68,665 73,145 4,480 6.5% Maintenance & Operations 186 177 173 (4) -2.3%Energy 11,824 13,862 2,037 17.2% General Administration 91 103 104 1 1.0%Building Rentals 2,484 2,284 (200) -8.1% General Institutional Services 223 199 197 (2) -1.0%Financial Aid 1,277 1,769 492 38.5% SEEK/CD 7 7 9 2 28.6%Centralized Purchasing 1,786 - (1,786) -100.0% Other 74 18 15 (3) -16.7%Total Centrally Administered Funds 86,037 91,060 5,023 5.8% Total Full-time 1,523 1,482 1,485 4 0.3%
Prior year end balance may not tie to current year CUTRA due to IFR Cost recoveries adjustment
FY2018 Energy based on FY17 actuals and Financial Aid uses prior year actuals prorated based on current year budget
Staffing Spring 2018 as of 2/15/18 except for BKL, HTR, YRK, and Central which are from CUNYFirst as of 2/28/18, Prior Year(s) from last payroll in October of that year;
Macaulay Waiver are preliminary FY2017 estimates
FY2018 Centralized Purchasing included in College OTPS
Fall 2016 Fall 2017
The City University of New York2017-2018 Third Quarter Financial Report
City College
Comparison of Expenditures to Resources ($000)
FY2017 FY2018 $ Change % Change
FTE Enrollment and I&DR Teaching change since Fall 2012
‐4%
‐3%
‐2%
‐1%
0%
1%
2%
3%
4%
5%
6%
Fall 2012 Fall 2013 Fall 2014 Fall 2015 Fall 2016 Fall 2017
FTE % Change I&DR Teaching % Change
43
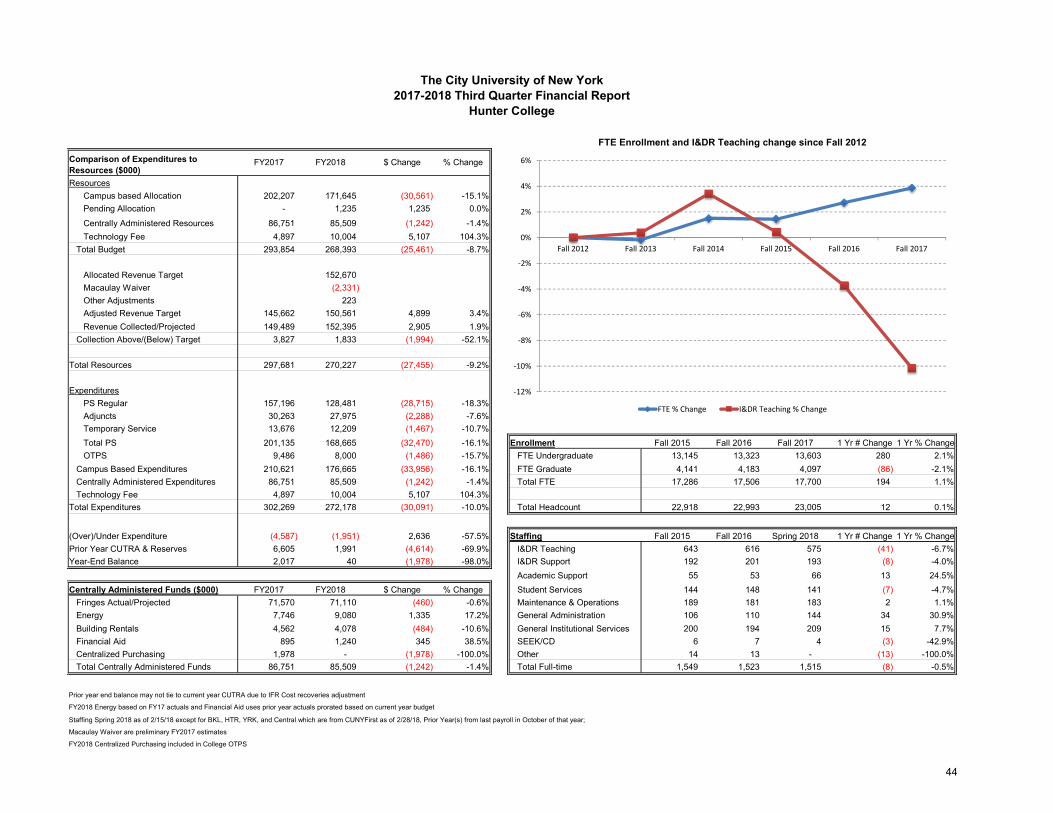
ResourcesCampus based Allocation 202,207 171,645 (30,561) -15.1%Pending Allocation - 1,235 1,235 0.0%Centrally Administered Resources 86,751 85,509 (1,242) -1.4% Fall 2017Technology Fee 4,897 10,004 5,107 104.3% Fall 2012 Fall 2013 Fall 2014 Fa
Total Budget 293,854 268,393 (25,461) -8.7% FTE % ChangeFTE % Change 0.0% -0.2% 1.5% # 2.7% 3.9%
Allocated Revenue Target 152,670 I&DR Teaching % Change 0.0% 0.4% 3.4% # -3.7% -10.2%Macaulay Waiver (2,331) Other Adjustments 223 Adjusted Revenue Target 145,662 150,561 4,899 3.4%Revenue Collected/Projected 149,489 152,395 2,905 1.9%
Collection Above/(Below) Target 3,827 1,833 (1,994) -52.1%
Total Resources 297,681 270,227 (27,455) -9.2%
ExpendituresPS Regular 157,196 128,481 (28,715) -18.3%Adjuncts 30,263 27,975 (2,288) -7.6%Temporary Service 13,676 12,209 (1,467) -10.7% Fall 2017Total PS 201,135 168,665 (32,470) -16.1% Enrollment Fall 2015 Fall 2016 Fall 2017 1 Yr # Change 1 Yr % ChangeOTPS 9,486 8,000 (1,486) -15.7% FTE Undergraduate 13,145 13,323 13,603 280 2.1%
Campus Based Expenditures 210,621 176,665 (33,956) -16.1% FTE Graduate 4,141 4,183 4,097 (86) -2.1%Centrally Administered Expenditures 86,751 85,509 (1,242) -1.4% Total FTE 17,286 17,506 17,700 194 1.1%Technology Fee 4,897 10,004 5,107 104.3%
Total Expenditures 302,269 272,178 (30,091) -10.0% Total Headcount 22,918 22,993 23,005 12 0.1%
(Over)/Under Expenditure (4,587) (1,951) 2,636 -57.5% Staffing Fall 2015 Fall 2016 Spring 2018 1 Yr # Change 1 Yr % ChangePrior Year CUTRA & Reserves 6,605 1,991 (4,614) -69.9% I&DR Teaching 643 616 575 (41) -6.7%Year-End Balance 2,017 40 (1,978) -98.0% I&DR Support 192 201 193 (8) -4.0%
Academic Support 55 53 66 13 24.5%Centrally Administered Funds ($000) FY2017 FY2018 $ Change % Change Student Services 144 148 141 (7) -4.7%
Fringes Actual/Projected 71,570 71,110 (460) -0.6% Maintenance & Operations 189 181 183 2 1.1%Energy 7,746 9,080 1,335 17.2% General Administration 106 110 144 34 30.9%Building Rentals 4,562 4,078 (484) -10.6% General Institutional Services 200 194 209 15 7.7%Financial Aid 895 1,240 345 38.5% SEEK/CD 6 7 4 (3) -42.9%Centralized Purchasing 1,978 - (1,978) -100.0% Other 14 13 - (13) -100.0%Total Centrally Administered Funds 86,751 85,509 (1,242) -1.4% Total Full-time 1,549 1,523 1,515 (8) -0.5%
Prior year end balance may not tie to current year CUTRA due to IFR Cost recoveries adjustment
FY2018 Energy based on FY17 actuals and Financial Aid uses prior year actuals prorated based on current year budget
Staffing Spring 2018 as of 2/15/18 except for BKL, HTR, YRK, and Central which are from CUNYFirst as of 2/28/18, Prior Year(s) from last payroll in October of that year;
Macaulay Waiver are preliminary FY2017 estimates
FY2018 Centralized Purchasing included in College OTPS
Fall 2016 Fall 2017
The City University of New York2017-2018 Third Quarter Financial Report
Hunter College
Comparison of Expenditures to Resources ($000)
FY2017 FY2018 $ Change % Change
FTE Enrollment and I&DR Teaching change since Fall 2012
‐12%
‐10%
‐8%
‐6%
‐4%
‐2%
0%
2%
4%
6%
Fall 2012 Fall 2013 Fall 2014 Fall 2015 Fall 2016 Fall 2017
FTE % Change I&DR Teaching % Change
44
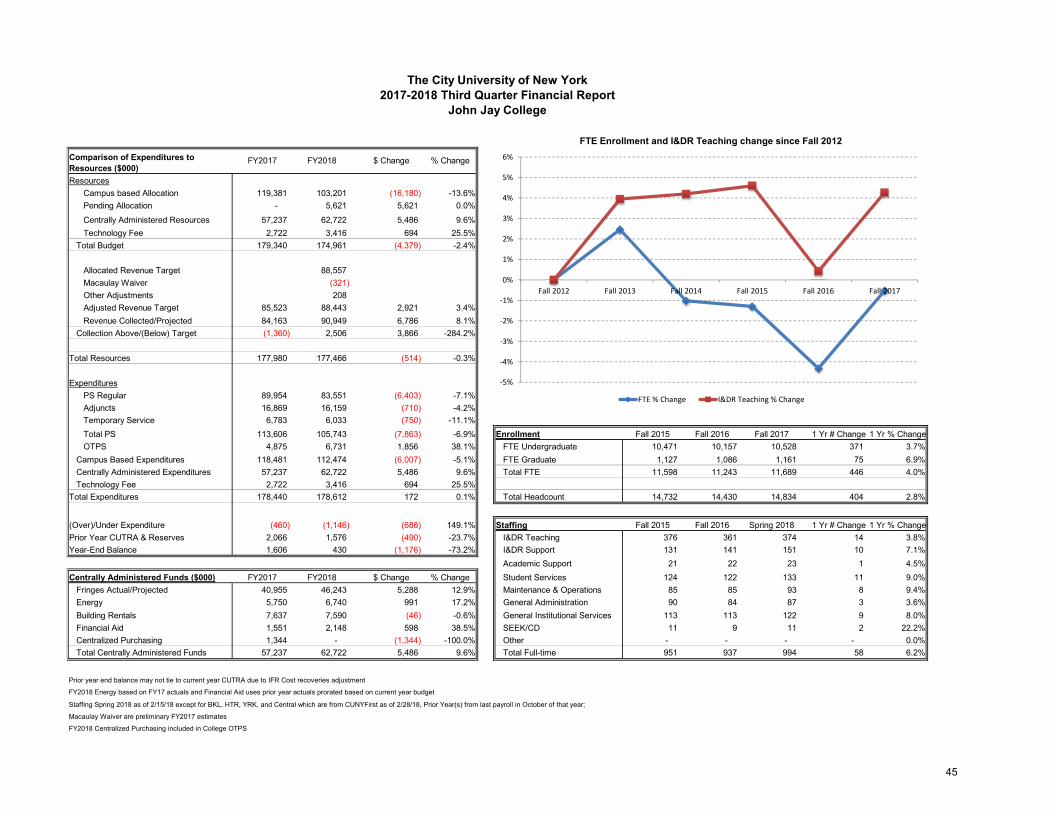
ResourcesCampus based Allocation 119,381 103,201 (16,180) -13.6%Pending Allocation - 5,621 5,621 0.0%Centrally Administered Resources 57,237 62,722 5,486 9.6% Fall 2017Technology Fee 2,722 3,416 694 25.5% Fall 2012 Fall 2013 Fall 2014 Fa
Total Budget 179,340 174,961 (4,379) -2.4% FTE % ChangeFTE % Change 0.0% 2.5% -1.0% # -4.3% -0.5%
Allocated Revenue Target 88,557 I&DR Teaching % Change 0.0% 3.9% 4.2% # 0.4% 4.3%Macaulay Waiver (321) Other Adjustments 208 Adjusted Revenue Target 85,523 88,443 2,921 3.4%Revenue Collected/Projected 84,163 90,949 6,786 8.1%
Collection Above/(Below) Target (1,360) 2,506 3,866 -284.2%
Total Resources 177,980 177,466 (514) -0.3%
ExpendituresPS Regular 89,954 83,551 (6,403) -7.1%Adjuncts 16,869 16,159 (710) -4.2%Temporary Service 6,783 6,033 (750) -11.1% Fall 2017Total PS 113,606 105,743 (7,863) -6.9% Enrollment Fall 2015 Fall 2016 Fall 2017 1 Yr # Change 1 Yr % ChangeOTPS 4,875 6,731 1,856 38.1% FTE Undergraduate 10,471 10,157 10,528 371 3.7%
Campus Based Expenditures 118,481 112,474 (6,007) -5.1% FTE Graduate 1,127 1,086 1,161 75 6.9%Centrally Administered Expenditures 57,237 62,722 5,486 9.6% Total FTE 11,598 11,243 11,689 446 4.0%Technology Fee 2,722 3,416 694 25.5%
Total Expenditures 178,440 178,612 172 0.1% Total Headcount 14,732 14,430 14,834 404 2.8%
(Over)/Under Expenditure (460) (1,146) (686) 149.1% Staffing Fall 2015 Fall 2016 Spring 2018 1 Yr # Change 1 Yr % ChangePrior Year CUTRA & Reserves 2,066 1,576 (490) -23.7% I&DR Teaching 376 361 374 14 3.8%Year-End Balance 1,606 430 (1,176) -73.2% I&DR Support 131 141 151 10 7.1%
Academic Support 21 22 23 1 4.5%Centrally Administered Funds ($000) FY2017 FY2018 $ Change % Change Student Services 124 122 133 11 9.0%
Fringes Actual/Projected 40,955 46,243 5,288 12.9% Maintenance & Operations 85 85 93 8 9.4%Energy 5,750 6,740 991 17.2% General Administration 90 84 87 3 3.6%Building Rentals 7,637 7,590 (46) -0.6% General Institutional Services 113 113 122 9 8.0%Financial Aid 1,551 2,148 598 38.5% SEEK/CD 11 9 11 2 22.2%Centralized Purchasing 1,344 - (1,344) -100.0% Other - - - - 0.0%Total Centrally Administered Funds 57,237 62,722 5,486 9.6% Total Full-time 951 937 994 58 6.2%
Prior year end balance may not tie to current year CUTRA due to IFR Cost recoveries adjustment
FY2018 Energy based on FY17 actuals and Financial Aid uses prior year actuals prorated based on current year budget
Staffing Spring 2018 as of 2/15/18 except for BKL, HTR, YRK, and Central which are from CUNYFirst as of 2/28/18, Prior Year(s) from last payroll in October of that year;
Macaulay Waiver are preliminary FY2017 estimates
FY2018 Centralized Purchasing included in College OTPS
Fall 2016 Fall 2017
The City University of New York2017-2018 Third Quarter Financial Report
John Jay College
Comparison of Expenditures to Resources ($000)
FY2017 FY2018 $ Change % Change
FTE Enrollment and I&DR Teaching change since Fall 2012
‐5%
‐4%
‐3%
‐2%
‐1%
0%
1%
2%
3%
4%
5%
6%
Fall 2012 Fall 2013 Fall 2014 Fall 2015 Fall 2016 Fall 2017
FTE % Change I&DR Teaching % Change
45
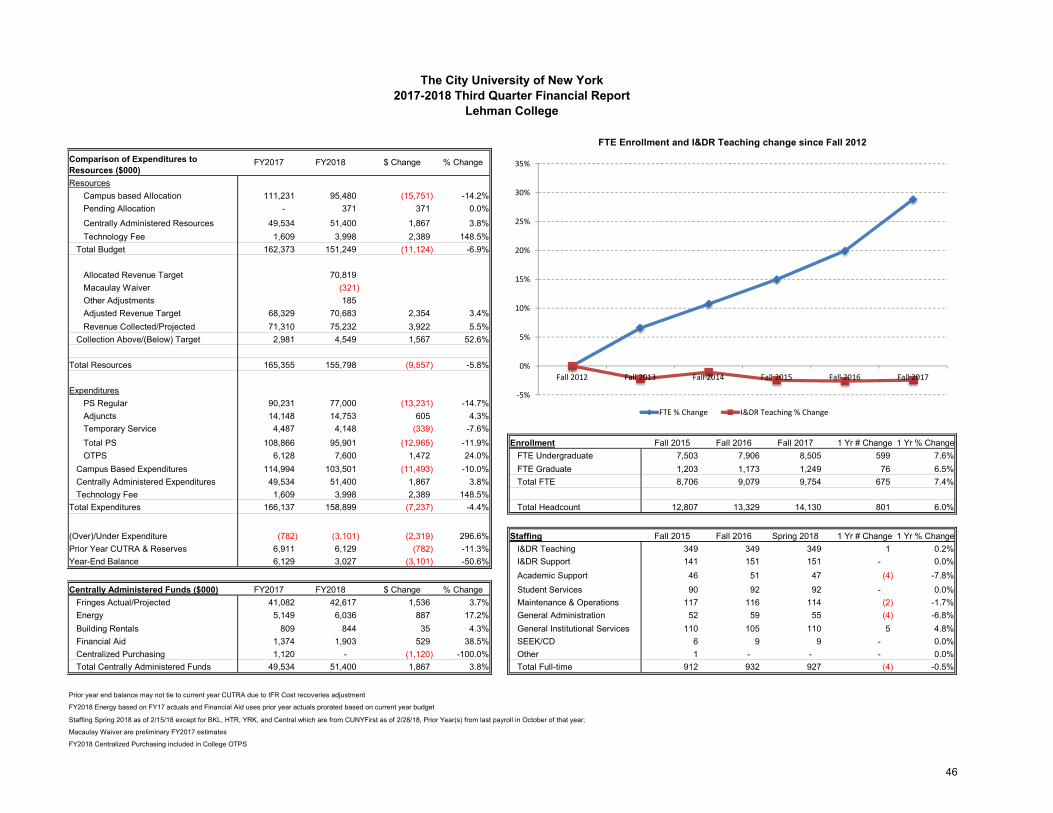
ResourcesCampus based Allocation 111,231 95,480 (15,751) -14.2%Pending Allocation - 371 371 0.0%Centrally Administered Resources 49,534 51,400 1,867 3.8% Fall 2017Technology Fee 1,609 3,998 2,389 148.5% Fall 2012 Fall 2013 Fall 2014 Fa
Total Budget 162,373 151,249 (11,124) -6.9% FTE % ChangeFTE % Change 0.0% 6.6% 10.7% # 19.9% 28.8%
Allocated Revenue Target 70,819 I&DR Teaching % Change 0.0% -2.3% -1.1% # -2.6% -2.5%Macaulay Waiver (321) Other Adjustments 185 Adjusted Revenue Target 68,329 70,683 2,354 3.4%Revenue Collected/Projected 71,310 75,232 3,922 5.5%
Collection Above/(Below) Target 2,981 4,549 1,567 52.6%
Total Resources 165,355 155,798 (9,557) -5.8%
ExpendituresPS Regular 90,231 77,000 (13,231) -14.7%Adjuncts 14,148 14,753 605 4.3%Temporary Service 4,487 4,148 (339) -7.6% Fall 2017Total PS 108,866 95,901 (12,965) -11.9% Enrollment Fall 2015 Fall 2016 Fall 2017 1 Yr # Change 1 Yr % ChangeOTPS 6,128 7,600 1,472 24.0% FTE Undergraduate 7,503 7,906 8,505 599 7.6%
Campus Based Expenditures 114,994 103,501 (11,493) -10.0% FTE Graduate 1,203 1,173 1,249 76 6.5%Centrally Administered Expenditures 49,534 51,400 1,867 3.8% Total FTE 8,706 9,079 9,754 675 7.4%Technology Fee 1,609 3,998 2,389 148.5%
Total Expenditures 166,137 158,899 (7,237) -4.4% Total Headcount 12,807 13,329 14,130 801 6.0%
(Over)/Under Expenditure (782) (3,101) (2,319) 296.6% Staffing Fall 2015 Fall 2016 Spring 2018 1 Yr # Change 1 Yr % ChangePrior Year CUTRA & Reserves 6,911 6,129 (782) -11.3% I&DR Teaching 349 349 349 1 0.2%Year-End Balance 6,129 3,027 (3,101) -50.6% I&DR Support 141 151 151 - 0.0%
Academic Support 46 51 47 (4) -7.8%Centrally Administered Funds ($000) FY2017 FY2018 $ Change % Change Student Services 90 92 92 - 0.0%
Fringes Actual/Projected 41,082 42,617 1,536 3.7% Maintenance & Operations 117 116 114 (2) -1.7%Energy 5,149 6,036 887 17.2% General Administration 52 59 55 (4) -6.8%Building Rentals 809 844 35 4.3% General Institutional Services 110 105 110 5 4.8%Financial Aid 1,374 1,903 529 38.5% SEEK/CD 6 9 9 - 0.0%Centralized Purchasing 1,120 - (1,120) -100.0% Other 1 - - - 0.0%Total Centrally Administered Funds 49,534 51,400 1,867 3.8% Total Full-time 912 932 927 (4) -0.5%
Prior year end balance may not tie to current year CUTRA due to IFR Cost recoveries adjustment
FY2018 Energy based on FY17 actuals and Financial Aid uses prior year actuals prorated based on current year budget
Staffing Spring 2018 as of 2/15/18 except for BKL, HTR, YRK, and Central which are from CUNYFirst as of 2/28/18, Prior Year(s) from last payroll in October of that year;
Macaulay Waiver are preliminary FY2017 estimates
FY2018 Centralized Purchasing included in College OTPS
Fall 2016 Fall 2017
The City University of New York2017-2018 Third Quarter Financial Report
Lehman College
Comparison of Expenditures to Resources ($000)
FY2017 FY2018 $ Change % Change
FTE Enrollment and I&DR Teaching change since Fall 2012
‐5%
0%
5%
10%
15%
20%
25%
30%
35%
Fall 2012 Fall 2013 Fall 2014 Fall 2015 Fall 2016 Fall 2017
FTE % Change I&DR Teaching % Change
46
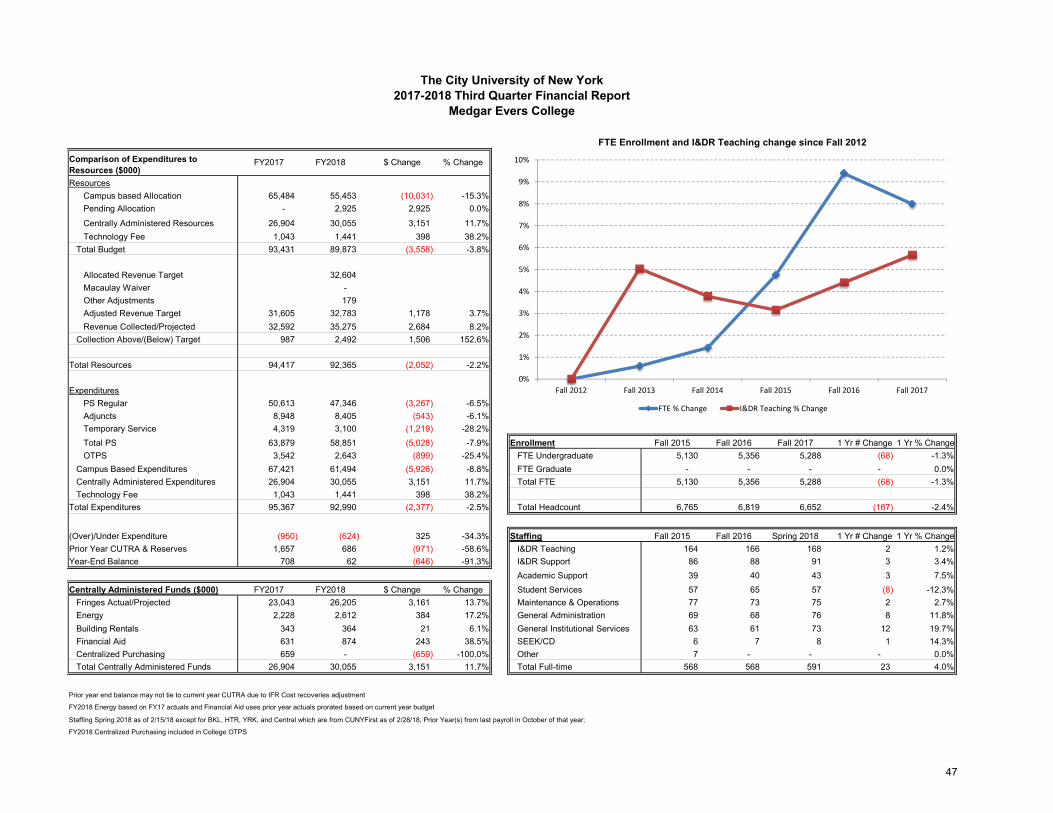
ResourcesCampus based Allocation 65,484 55,453 (10,031) -15.3%Pending Allocation - 2,925 2,925 0.0%Centrally Administered Resources 26,904 30,055 3,151 11.7% Fall 2017Technology Fee 1,043 1,441 398 38.2% Fall 2012 Fall 2013 Fall 2014 Fa
Total Budget 93,431 89,873 (3,558) -3.8% FTE % ChangeFTE % Change 0.0% 0.6% 1.4% # 9.4% 8.0%
Allocated Revenue Target 32,604 I&DR Teaching % Change 0.0% 5.0% 3.8% # 4.4% 5.7%Macaulay Waiver - Other Adjustments 179 Adjusted Revenue Target 31,605 32,783 1,178 3.7%Revenue Collected/Projected 32,592 35,275 2,684 8.2%
Collection Above/(Below) Target 987 2,492 1,506 152.6%
Total Resources 94,417 92,365 (2,052) -2.2%
ExpendituresPS Regular 50,613 47,346 (3,267) -6.5%Adjuncts 8,948 8,405 (543) -6.1%Temporary Service 4,319 3,100 (1,219) -28.2% Fall 2017Total PS 63,879 58,851 (5,028) -7.9% Enrollment Fall 2015 Fall 2016 Fall 2017 1 Yr # Change 1 Yr % ChangeOTPS 3,542 2,643 (899) -25.4% FTE Undergraduate 5,130 5,356 5,288 (68) -1.3%
Campus Based Expenditures 67,421 61,494 (5,926) -8.8% FTE Graduate - - - - 0.0%Centrally Administered Expenditures 26,904 30,055 3,151 11.7% Total FTE 5,130 5,356 5,288 (68) -1.3%Technology Fee 1,043 1,441 398 38.2%
Total Expenditures 95,367 92,990 (2,377) -2.5% Total Headcount 6,765 6,819 6,652 (167) -2.4%
(Over)/Under Expenditure (950) (624) 325 -34.3% Staffing Fall 2015 Fall 2016 Spring 2018 1 Yr # Change 1 Yr % ChangePrior Year CUTRA & Reserves 1,657 686 (971) -58.6% I&DR Teaching 164 166 168 2 1.2%Year-End Balance 708 62 (646) -91.3% I&DR Support 86 88 91 3 3.4%
Academic Support 39 40 43 3 7.5%Centrally Administered Funds ($000) FY2017 FY2018 $ Change % Change Student Services 57 65 57 (8) -12.3%
Fringes Actual/Projected 23,043 26,205 3,161 13.7% Maintenance & Operations 77 73 75 2 2.7%Energy 2,228 2,612 384 17.2% General Administration 69 68 76 8 11.8%Building Rentals 343 364 21 6.1% General Institutional Services 63 61 73 12 19.7%Financial Aid 631 874 243 38.5% SEEK/CD 6 7 8 1 14.3%Centralized Purchasing 659 - (659) -100.0% Other 7 - - - 0.0%Total Centrally Administered Funds 26,904 30,055 3,151 11.7% Total Full-time 568 568 591 23 4.0%
Prior year end balance may not tie to current year CUTRA due to IFR Cost recoveries adjustment
FY2018 Energy based on FY17 actuals and Financial Aid uses prior year actuals prorated based on current year budget
Staffing Spring 2018 as of 2/15/18 except for BKL, HTR, YRK, and Central which are from CUNYFirst as of 2/28/18, Prior Year(s) from last payroll in October of that year;
FY2018 Centralized Purchasing included in College OTPS
Fall 2016 Fall 2017
The City University of New York2017-2018 Third Quarter Financial Report
Medgar Evers College
Comparison of Expenditures to Resources ($000)
FY2017 FY2018 $ Change % Change
FTE Enrollment and I&DR Teaching change since Fall 2012
0%
1%
2%
3%
4%
5%
6%
7%
8%
9%
10%
Fall 2012 Fall 2013 Fall 2014 Fall 2015 Fall 2016 Fall 2017
FTE % Change I&DR Teaching % Change
47
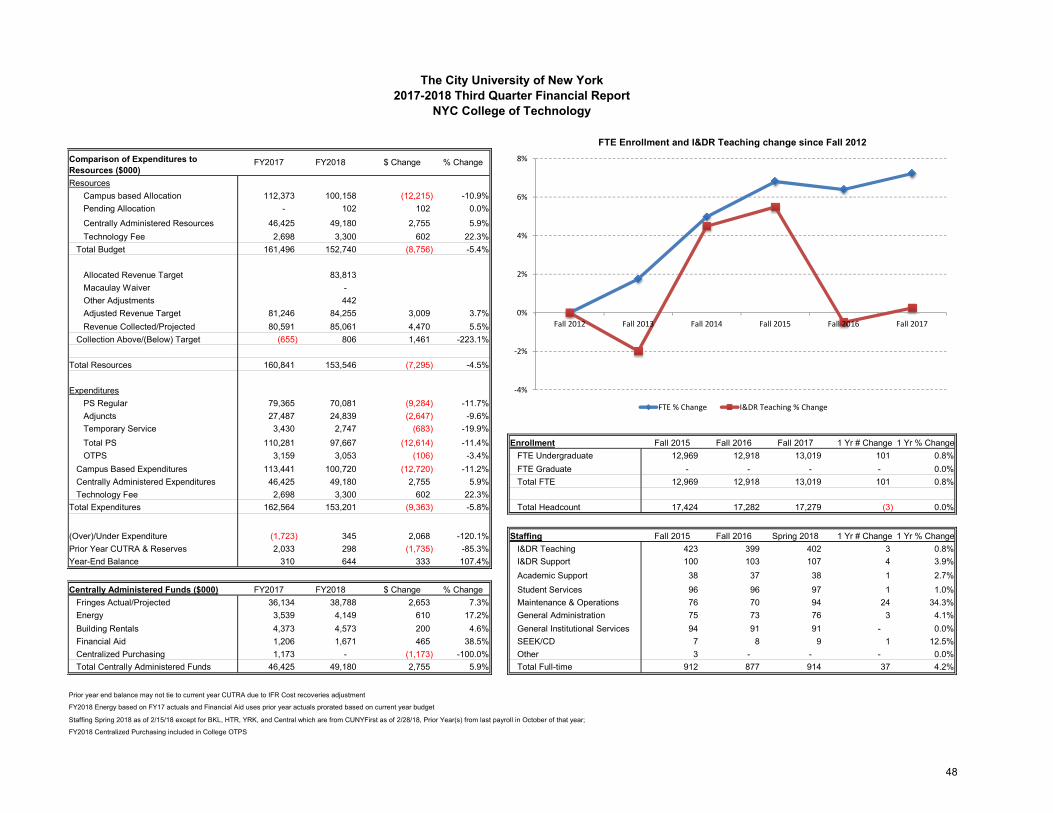
ResourcesCampus based Allocation 112,373 100,158 (12,215) -10.9%Pending Allocation - 102 102 0.0%Centrally Administered Resources 46,425 49,180 2,755 5.9% Fall 2017Technology Fee 2,698 3,300 602 22.3% Fall 2012 Fall 2013 Fall 2014 Fa
Total Budget 161,496 152,740 (8,756) -5.4% FTE % ChangeFTE % Change 0.0% 1.8% 5.0% # 6.4% 7.2%
Allocated Revenue Target 83,813 I&DR Teaching % Change 0.0% -2.0% 4.5% # -0.5% 0.2%Macaulay Waiver - Other Adjustments 442 Adjusted Revenue Target 81,246 84,255 3,009 3.7%Revenue Collected/Projected 80,591 85,061 4,470 5.5%
Collection Above/(Below) Target (655) 806 1,461 -223.1%
Total Resources 160,841 153,546 (7,295) -4.5%
ExpendituresPS Regular 79,365 70,081 (9,284) -11.7%Adjuncts 27,487 24,839 (2,647) -9.6%Temporary Service 3,430 2,747 (683) -19.9% Fall 2017Total PS 110,281 97,667 (12,614) -11.4% Enrollment Fall 2015 Fall 2016 Fall 2017 1 Yr # Change 1 Yr % ChangeOTPS 3,159 3,053 (106) -3.4% FTE Undergraduate 12,969 12,918 13,019 101 0.8%
Campus Based Expenditures 113,441 100,720 (12,720) -11.2% FTE Graduate - - - - 0.0%Centrally Administered Expenditures 46,425 49,180 2,755 5.9% Total FTE 12,969 12,918 13,019 101 0.8%Technology Fee 2,698 3,300 602 22.3%
Total Expenditures 162,564 153,201 (9,363) -5.8% Total Headcount 17,424 17,282 17,279 (3) 0.0%
(Over)/Under Expenditure (1,723) 345 2,068 -120.1% Staffing Fall 2015 Fall 2016 Spring 2018 1 Yr # Change 1 Yr % ChangePrior Year CUTRA & Reserves 2,033 298 (1,735) -85.3% I&DR Teaching 423 399 402 3 0.8%Year-End Balance 310 644 333 107.4% I&DR Support 100 103 107 4 3.9%
Academic Support 38 37 38 1 2.7%Centrally Administered Funds ($000) FY2017 FY2018 $ Change % Change Student Services 96 96 97 1 1.0%
Fringes Actual/Projected 36,134 38,788 2,653 7.3% Maintenance & Operations 76 70 94 24 34.3%Energy 3,539 4,149 610 17.2% General Administration 75 73 76 3 4.1%Building Rentals 4,373 4,573 200 4.6% General Institutional Services 94 91 91 - 0.0%Financial Aid 1,206 1,671 465 38.5% SEEK/CD 7 8 9 1 12.5%Centralized Purchasing 1,173 - (1,173) -100.0% Other 3 - - - 0.0%Total Centrally Administered Funds 46,425 49,180 2,755 5.9% Total Full-time 912 877 914 37 4.2%
Prior year end balance may not tie to current year CUTRA due to IFR Cost recoveries adjustment
FY2018 Energy based on FY17 actuals and Financial Aid uses prior year actuals prorated based on current year budget
Staffing Spring 2018 as of 2/15/18 except for BKL, HTR, YRK, and Central which are from CUNYFirst as of 2/28/18, Prior Year(s) from last payroll in October of that year;
FY2018 Centralized Purchasing included in College OTPS
Fall 2016 Fall 2017
The City University of New York2017-2018 Third Quarter Financial Report
NYC College of Technology
Comparison of Expenditures to Resources ($000)
FY2017 FY2018 $ Change % Change
FTE Enrollment and I&DR Teaching change since Fall 2012
‐4%
‐2%
0%
2%
4%
6%
8%
Fall 2012 Fall 2013 Fall 2014 Fall 2015 Fall 2016 Fall 2017
FTE % Change I&DR Teaching % Change
48
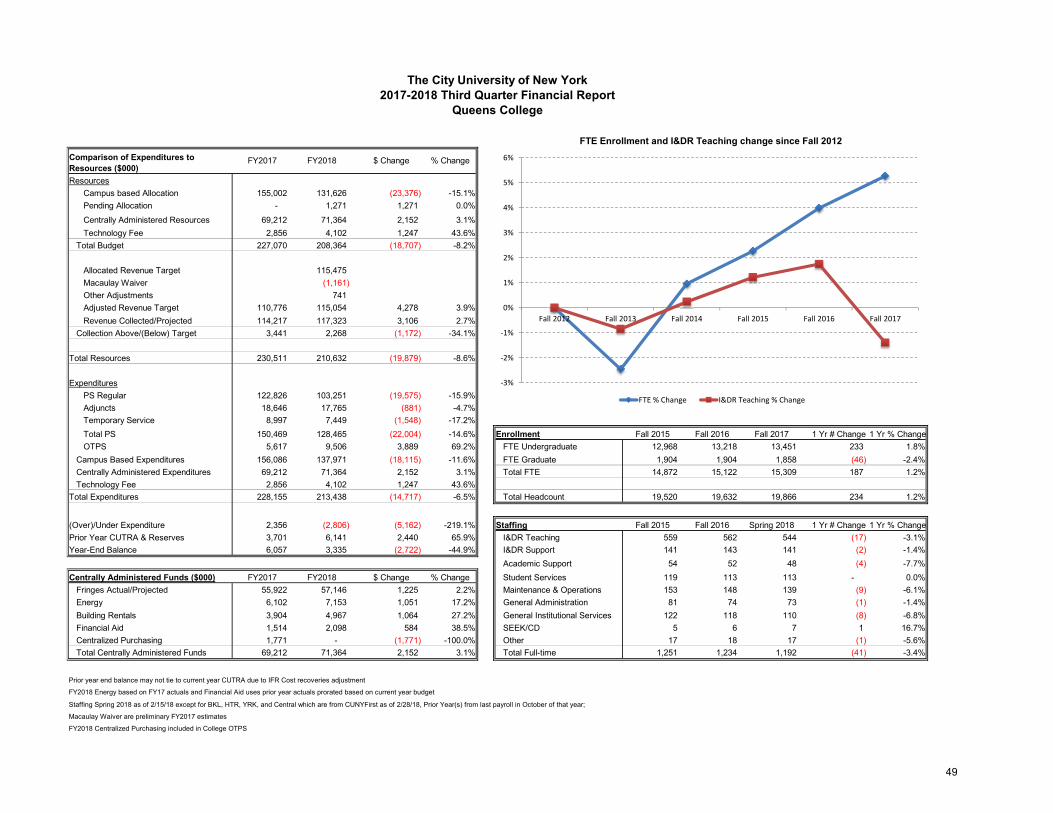
ResourcesCampus based Allocation 155,002 131,626 (23,376) -15.1%Pending Allocation - 1,271 1,271 0.0%Centrally Administered Resources 69,212 71,364 2,152 3.1% Fall 2017Technology Fee 2,856 4,102 1,247 43.6% Fall 2012 Fall 2013 Fall 2014 Fa
Total Budget 227,070 208,364 (18,707) -8.2% FTE % ChangeFTE % Change 0.0% -2.5% 1.0% # 4.0% 5.3%
Allocated Revenue Target 115,475 I&DR Teaching % Change 0.0% -0.9% 0.2% # 1.7% -1.4%Macaulay Waiver (1,161) Other Adjustments 741 Adjusted Revenue Target 110,776 115,054 4,278 3.9%Revenue Collected/Projected 114,217 117,323 3,106 2.7%
Collection Above/(Below) Target 3,441 2,268 (1,172) -34.1%
Total Resources 230,511 210,632 (19,879) -8.6%
ExpendituresPS Regular 122,826 103,251 (19,575) -15.9%Adjuncts 18,646 17,765 (881) -4.7%Temporary Service 8,997 7,449 (1,548) -17.2% Fall 2017Total PS 150,469 128,465 (22,004) -14.6% Enrollment Fall 2015 Fall 2016 Fall 2017 1 Yr # Change 1 Yr % ChangeOTPS 5,617 9,506 3,889 69.2% FTE Undergraduate 12,968 13,218 13,451 233 1.8%
Campus Based Expenditures 156,086 137,971 (18,115) -11.6% FTE Graduate 1,904 1,904 1,858 (46) -2.4%Centrally Administered Expenditures 69,212 71,364 2,152 3.1% Total FTE 14,872 15,122 15,309 187 1.2%Technology Fee 2,856 4,102 1,247 43.6%
Total Expenditures 228,155 213,438 (14,717) -6.5% Total Headcount 19,520 19,632 19,866 234 1.2%
(Over)/Under Expenditure 2,356 (2,806) (5,162) -219.1% Staffing Fall 2015 Fall 2016 Spring 2018 1 Yr # Change 1 Yr % ChangePrior Year CUTRA & Reserves 3,701 6,141 2,440 65.9% I&DR Teaching 559 562 544 (17) -3.1%Year-End Balance 6,057 3,335 (2,722) -44.9% I&DR Support 141 143 141 (2) -1.4%
Academic Support 54 52 48 (4) -7.7%Centrally Administered Funds ($000) FY2017 FY2018 $ Change % Change Student Services 119 113 113 - 0.0%
Fringes Actual/Projected 55,922 57,146 1,225 2.2% Maintenance & Operations 153 148 139 (9) -6.1%Energy 6,102 7,153 1,051 17.2% General Administration 81 74 73 (1) -1.4%Building Rentals 3,904 4,967 1,064 27.2% General Institutional Services 122 118 110 (8) -6.8%Financial Aid 1,514 2,098 584 38.5% SEEK/CD 5 6 7 1 16.7%Centralized Purchasing 1,771 - (1,771) -100.0% Other 17 18 17 (1) -5.6%Total Centrally Administered Funds 69,212 71,364 2,152 3.1% Total Full-time 1,251 1,234 1,192 (41) -3.4%
Prior year end balance may not tie to current year CUTRA due to IFR Cost recoveries adjustment
FY2018 Energy based on FY17 actuals and Financial Aid uses prior year actuals prorated based on current year budget
Staffing Spring 2018 as of 2/15/18 except for BKL, HTR, YRK, and Central which are from CUNYFirst as of 2/28/18, Prior Year(s) from last payroll in October of that year;
Macaulay Waiver are preliminary FY2017 estimates
FY2018 Centralized Purchasing included in College OTPS
Fall 2016 Fall 2017
The City University of New York2017-2018 Third Quarter Financial Report
Queens College
Comparison of Expenditures to Resources ($000)
FY2017 FY2018 $ Change % Change
FTE Enrollment and I&DR Teaching change since Fall 2012
‐3%
‐2%
‐1%
0%
1%
2%
3%
4%
5%
6%
Fall 2012 Fall 2013 Fall 2014 Fall 2015 Fall 2016 Fall 2017
FTE % Change I&DR Teaching % Change
49
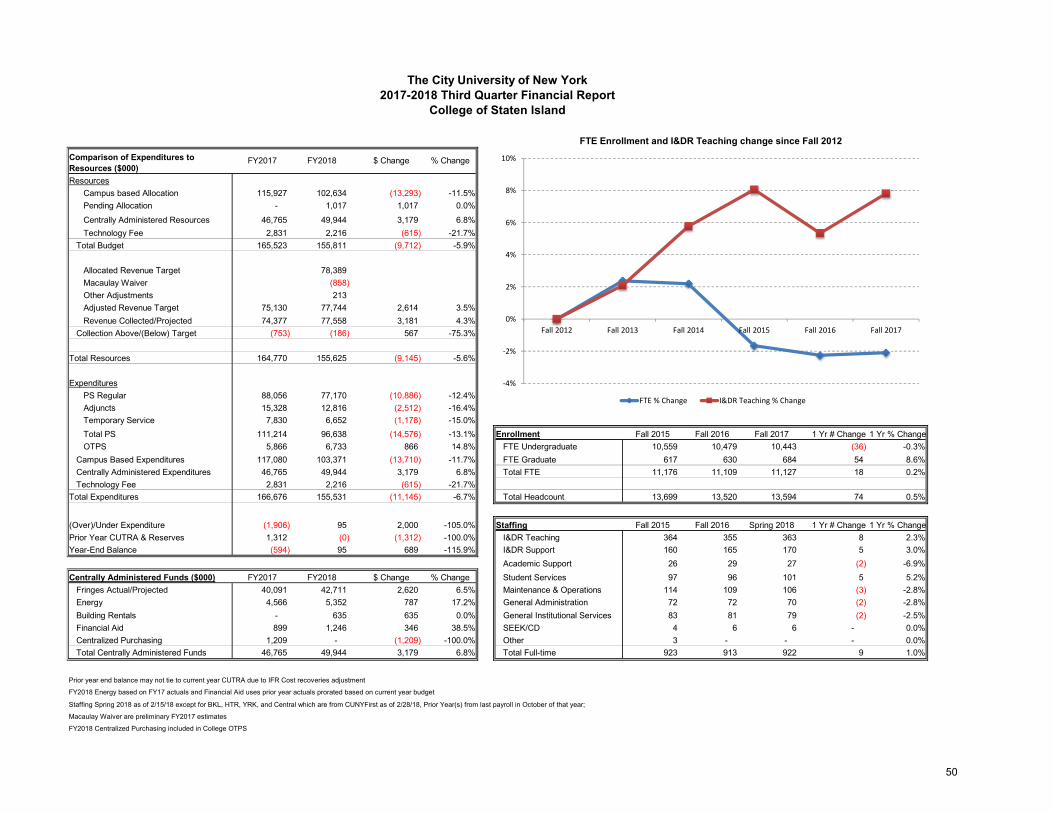
ResourcesCampus based Allocation 115,927 102,634 (13,293) -11.5%Pending Allocation - 1,017 1,017 0.0%Centrally Administered Resources 46,765 49,944 3,179 6.8% Fall 2017Technology Fee 2,831 2,216 (615) -21.7% Fall 2012 Fall 2013 Fall 2014 Fa
Total Budget 165,523 155,811 (9,712) -5.9% FTE % ChangeFTE % Change 0.0% 2.4% 2.2% # -2.3% -2.1%
Allocated Revenue Target 78,389 I&DR Teaching % Change 0.0% 2.1% 5.8% # 5.3% 7.8%Macaulay Waiver (858) Other Adjustments 213 Adjusted Revenue Target 75,130 77,744 2,614 3.5%Revenue Collected/Projected 74,377 77,558 3,181 4.3%
Collection Above/(Below) Target (753) (186) 567 -75.3%
Total Resources 164,770 155,625 (9,145) -5.6%
ExpendituresPS Regular 88,056 77,170 (10,886) -12.4%Adjuncts 15,328 12,816 (2,512) -16.4%Temporary Service 7,830 6,652 (1,178) -15.0% Fall 2017Total PS 111,214 96,638 (14,576) -13.1% Enrollment Fall 2015 Fall 2016 Fall 2017 1 Yr # Change 1 Yr % ChangeOTPS 5,866 6,733 866 14.8% FTE Undergraduate 10,559 10,479 10,443 (36) -0.3%
Campus Based Expenditures 117,080 103,371 (13,710) -11.7% FTE Graduate 617 630 684 54 8.6%Centrally Administered Expenditures 46,765 49,944 3,179 6.8% Total FTE 11,176 11,109 11,127 18 0.2%Technology Fee 2,831 2,216 (615) -21.7%
Total Expenditures 166,676 155,531 (11,145) -6.7% Total Headcount 13,699 13,520 13,594 74 0.5%
(Over)/Under Expenditure (1,906) 95 2,000 -105.0% Staffing Fall 2015 Fall 2016 Spring 2018 1 Yr # Change 1 Yr % ChangePrior Year CUTRA & Reserves 1,312 (0) (1,312) -100.0% I&DR Teaching 364 355 363 8 2.3%Year-End Balance (594) 95 689 -115.9% I&DR Support 160 165 170 5 3.0%
Academic Support 26 29 27 (2) -6.9%Centrally Administered Funds ($000) FY2017 FY2018 $ Change % Change Student Services 97 96 101 5 5.2%
Fringes Actual/Projected 40,091 42,711 2,620 6.5% Maintenance & Operations 114 109 106 (3) -2.8%Energy 4,566 5,352 787 17.2% General Administration 72 72 70 (2) -2.8%Building Rentals - 635 635 0.0% General Institutional Services 83 81 79 (2) -2.5%Financial Aid 899 1,246 346 38.5% SEEK/CD 4 6 6 - 0.0%Centralized Purchasing 1,209 - (1,209) -100.0% Other 3 - - - 0.0%Total Centrally Administered Funds 46,765 49,944 3,179 6.8% Total Full-time 923 913 922 9 1.0%
Prior year end balance may not tie to current year CUTRA due to IFR Cost recoveries adjustment
FY2018 Energy based on FY17 actuals and Financial Aid uses prior year actuals prorated based on current year budget
Staffing Spring 2018 as of 2/15/18 except for BKL, HTR, YRK, and Central which are from CUNYFirst as of 2/28/18, Prior Year(s) from last payroll in October of that year;
Macaulay Waiver are preliminary FY2017 estimates
FY2018 Centralized Purchasing included in College OTPS
Fall 2016 Fall 2017
The City University of New York2017-2018 Third Quarter Financial Report
College of Staten Island
Comparison of Expenditures to Resources ($000)
FY2017 FY2018 $ Change % Change
FTE Enrollment and I&DR Teaching change since Fall 2012
‐4%
‐2%
0%
2%
4%
6%
8%
10%
Fall 2012 Fall 2013 Fall 2014 Fall 2015 Fall 2016 Fall 2017
FTE % Change I&DR Teaching % Change
50
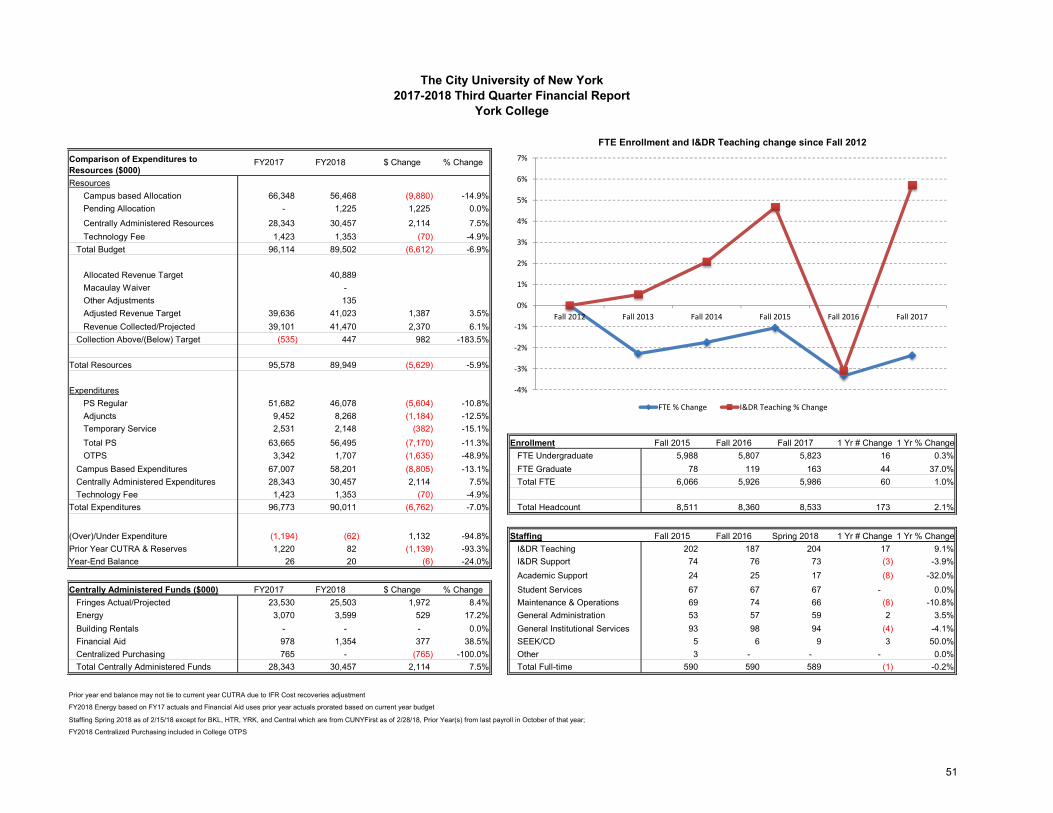
ResourcesCampus based Allocation 66,348 56,468 (9,880) -14.9%Pending Allocation - 1,225 1,225 0.0%Centrally Administered Resources 28,343 30,457 2,114 7.5% Fall 2017Technology Fee 1,423 1,353 (70) -4.9% Fall 2012 Fall 2013 Fall 2014 Fa
Total Budget 96,114 89,502 (6,612) -6.9% FTE % ChangeFTE % Change 0.0% -2.3% -1.7% # -3.3% -2.4%
Allocated Revenue Target 40,889 I&DR Teaching % Change 0.0% 0.5% 2.1% # -3.1% 5.7%Macaulay Waiver - Other Adjustments 135 Adjusted Revenue Target 39,636 41,023 1,387 3.5%Revenue Collected/Projected 39,101 41,470 2,370 6.1%
Collection Above/(Below) Target (535) 447 982 -183.5%
Total Resources 95,578 89,949 (5,629) -5.9%
ExpendituresPS Regular 51,682 46,078 (5,604) -10.8%Adjuncts 9,452 8,268 (1,184) -12.5%Temporary Service 2,531 2,148 (382) -15.1% Fall 2017Total PS 63,665 56,495 (7,170) -11.3% Enrollment Fall 2015 Fall 2016 Fall 2017 1 Yr # Change 1 Yr % ChangeOTPS 3,342 1,707 (1,635) -48.9% FTE Undergraduate 5,988 5,807 5,823 16 0.3%
Campus Based Expenditures 67,007 58,201 (8,805) -13.1% FTE Graduate 78 119 163 44 37.0%Centrally Administered Expenditures 28,343 30,457 2,114 7.5% Total FTE 6,066 5,926 5,986 60 1.0%Technology Fee 1,423 1,353 (70) -4.9%
Total Expenditures 96,773 90,011 (6,762) -7.0% Total Headcount 8,511 8,360 8,533 173 2.1%
(Over)/Under Expenditure (1,194) (62) 1,132 -94.8% Staffing Fall 2015 Fall 2016 Spring 2018 1 Yr # Change 1 Yr % ChangePrior Year CUTRA & Reserves 1,220 82 (1,139) -93.3% I&DR Teaching 202 187 204 17 9.1%Year-End Balance 26 20 (6) -24.0% I&DR Support 74 76 73 (3) -3.9%
Academic Support 24 25 17 (8) -32.0%Centrally Administered Funds ($000) FY2017 FY2018 $ Change % Change Student Services 67 67 67 - 0.0%
Fringes Actual/Projected 23,530 25,503 1,972 8.4% Maintenance & Operations 69 74 66 (8) -10.8%Energy 3,070 3,599 529 17.2% General Administration 53 57 59 2 3.5%Building Rentals - - - 0.0% General Institutional Services 93 98 94 (4) -4.1%Financial Aid 978 1,354 377 38.5% SEEK/CD 5 6 9 3 50.0%Centralized Purchasing 765 - (765) -100.0% Other 3 - - - 0.0%Total Centrally Administered Funds 28,343 30,457 2,114 7.5% Total Full-time 590 590 589 (1) -0.2%
Prior year end balance may not tie to current year CUTRA due to IFR Cost recoveries adjustment
FY2018 Energy based on FY17 actuals and Financial Aid uses prior year actuals prorated based on current year budget
Staffing Spring 2018 as of 2/15/18 except for BKL, HTR, YRK, and Central which are from CUNYFirst as of 2/28/18, Prior Year(s) from last payroll in October of that year;
FY2018 Centralized Purchasing included in College OTPS
Fall 2016 Fall 2017
The City University of New York2017-2018 Third Quarter Financial Report
York College
Comparison of Expenditures to Resources ($000)
FY2017 FY2018 $ Change % Change
FTE Enrollment and I&DR Teaching change since Fall 2012
‐4%
‐3%
‐2%
‐1%
0%
1%
2%
3%
4%
5%
6%
7%
Fall 2012 Fall 2013 Fall 2014 Fall 2015 Fall 2016 Fall 2017
FTE % Change I&DR Teaching % Change
51
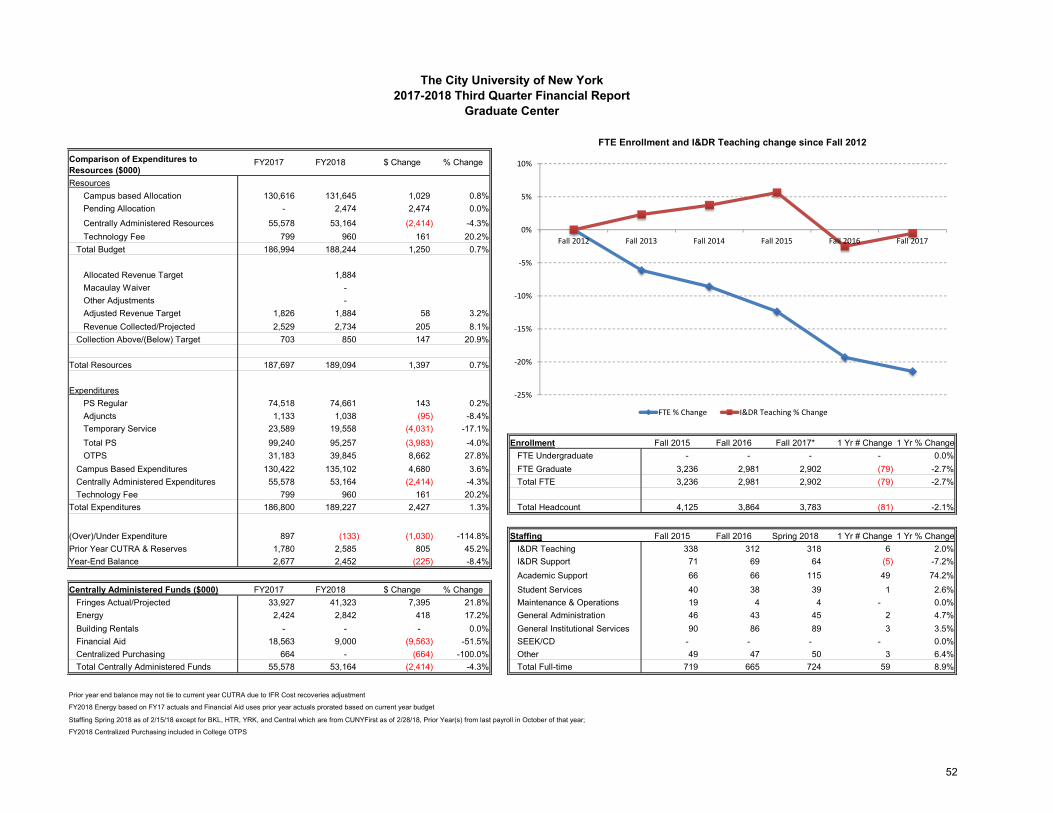
ResourcesCampus based Allocation 130,616 131,645 1,029 0.8%Pending Allocation - 2,474 2,474 0.0%Centrally Administered Resources 55,578 53,164 (2,414) -4.3% Fall 2017Technology Fee 799 960 161 20.2% Fall 2012 Fall 2013 Fall 2014 Fa
Total Budget 186,994 188,244 1,250 0.7% FTE % ChangeFTE % Change 0.0% -6.1% -8.6% # -19.3% -21.4%
Allocated Revenue Target 1,884 I&DR Teaching % Change 0.0% 2.3% 3.7% # -2.5% -0.5%Macaulay Waiver - Other Adjustments - Adjusted Revenue Target 1,826 1,884 58 3.2%Revenue Collected/Projected 2,529 2,734 205 8.1%
Collection Above/(Below) Target 703 850 147 20.9%
Total Resources 187,697 189,094 1,397 0.7%
ExpendituresPS Regular 74,518 74,661 143 0.2%Adjuncts 1,133 1,038 (95) -8.4%Temporary Service 23,589 19,558 (4,031) -17.1% Fall 2017Total PS 99,240 95,257 (3,983) -4.0% Enrollment Fall 2015 Fall 2016 Fall 2017* 1 Yr # Change 1 Yr % ChangeOTPS 31,183 39,845 8,662 27.8% FTE Undergraduate - - - - 0.0%
Campus Based Expenditures 130,422 135,102 4,680 3.6% FTE Graduate 3,236 2,981 2,902 (79) -2.7%Centrally Administered Expenditures 55,578 53,164 (2,414) -4.3% Total FTE 3,236 2,981 2,902 (79) -2.7%Technology Fee 799 960 161 20.2%
Total Expenditures 186,800 189,227 2,427 1.3% Total Headcount 4,125 3,864 3,783 (81) -2.1%
(Over)/Under Expenditure 897 (133) (1,030) -114.8% Staffing Fall 2015 Fall 2016 Spring 2018 1 Yr # Change 1 Yr % ChangePrior Year CUTRA & Reserves 1,780 2,585 805 45.2% I&DR Teaching 338 312 318 6 2.0%Year-End Balance 2,677 2,452 (225) -8.4% I&DR Support 71 69 64 (5) -7.2%
Academic Support 66 66 115 49 74.2%Centrally Administered Funds ($000) FY2017 FY2018 $ Change % Change Student Services 40 38 39 1 2.6%
Fringes Actual/Projected 33,927 41,323 7,395 21.8% Maintenance & Operations 19 4 4 - 0.0%Energy 2,424 2,842 418 17.2% General Administration 46 43 45 2 4.7%Building Rentals - - - 0.0% General Institutional Services 90 86 89 3 3.5%Financial Aid 18,563 9,000 (9,563) -51.5% SEEK/CD - - - - 0.0%Centralized Purchasing 664 - (664) -100.0% Other 49 47 50 3 6.4%Total Centrally Administered Funds 55,578 53,164 (2,414) -4.3% Total Full-time 719 665 724 59 8.9%
Prior year end balance may not tie to current year CUTRA due to IFR Cost recoveries adjustment
FY2018 Energy based on FY17 actuals and Financial Aid uses prior year actuals prorated based on current year budget
Staffing Spring 2018 as of 2/15/18 except for BKL, HTR, YRK, and Central which are from CUNYFirst as of 2/28/18, Prior Year(s) from last payroll in October of that year;
FY2018 Centralized Purchasing included in College OTPS
Fall 2016 Fall 2017
The City University of New York2017-2018 Third Quarter Financial Report
Graduate Center
Comparison of Expenditures to Resources ($000)
FY2017 FY2018 $ Change % Change
FTE Enrollment and I&DR Teaching change since Fall 2012
‐25%
‐20%
‐15%
‐10%
‐5%
0%
5%
10%
Fall 2012 Fall 2013 Fall 2014 Fall 2015 Fall 2016 Fall 2017
FTE % Change I&DR Teaching % Change
52
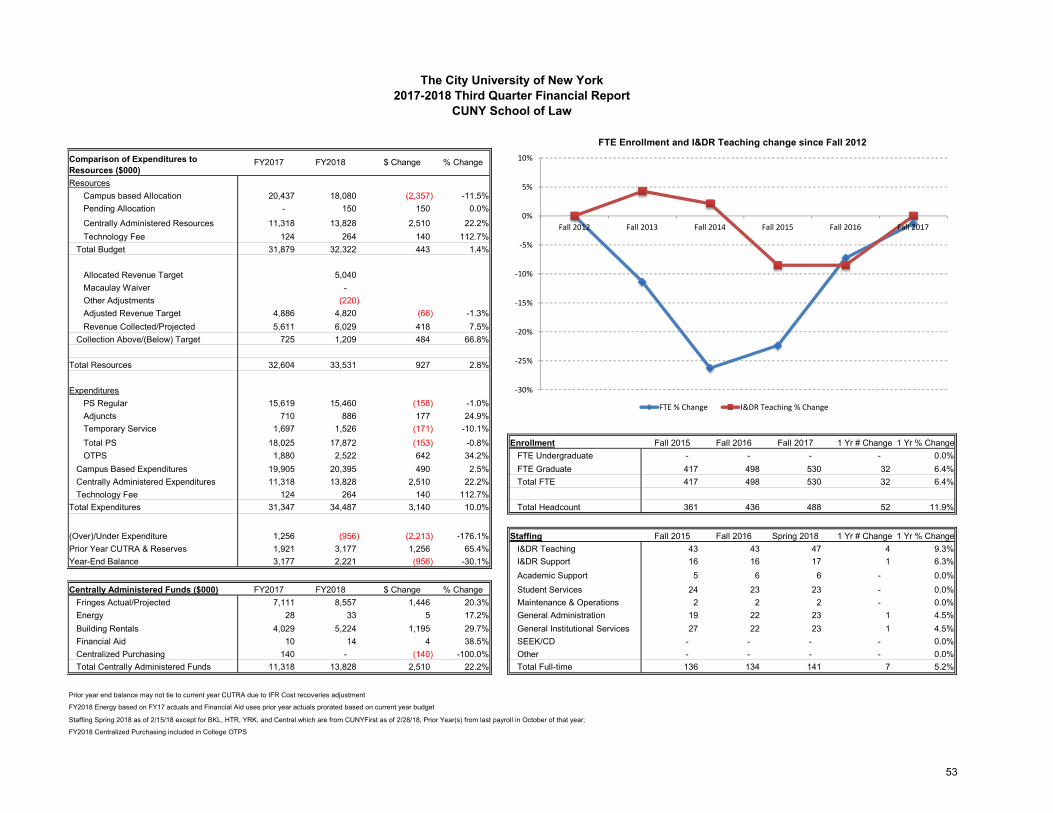
ResourcesCampus based Allocation 20,437 18,080 (2,357) -11.5%Pending Allocation - 150 150 0.0%Centrally Administered Resources 11,318 13,828 2,510 22.2% Fall 2017Technology Fee 124 264 140 112.7% Fall 2012 Fall 2013 Fall 2014 Fa
Total Budget 31,879 32,322 443 1.4% FTE % ChangeFTE % Change 0.0% -11.4% -26.3% # -7.3% -1.3%
Allocated Revenue Target 5,040 I&DR Teaching % Change 0.0% 4.3% 2.1% # -8.5% 0.0%Macaulay Waiver - Other Adjustments (220) Adjusted Revenue Target 4,886 4,820 (66) -1.3%Revenue Collected/Projected 5,611 6,029 418 7.5%
Collection Above/(Below) Target 725 1,209 484 66.8%
Total Resources 32,604 33,531 927 2.8%
ExpendituresPS Regular 15,619 15,460 (158) -1.0%Adjuncts 710 886 177 24.9%Temporary Service 1,697 1,526 (171) -10.1% Fall 2017Total PS 18,025 17,872 (153) -0.8% Enrollment Fall 2015 Fall 2016 Fall 2017 1 Yr # Change 1 Yr % ChangeOTPS 1,880 2,522 642 34.2% FTE Undergraduate - - - - 0.0%
Campus Based Expenditures 19,905 20,395 490 2.5% FTE Graduate 417 498 530 32 6.4%Centrally Administered Expenditures 11,318 13,828 2,510 22.2% Total FTE 417 498 530 32 6.4%Technology Fee 124 264 140 112.7%
Total Expenditures 31,347 34,487 3,140 10.0% Total Headcount 361 436 488 52 11.9%
(Over)/Under Expenditure 1,256 (956) (2,213) -176.1% Staffing Fall 2015 Fall 2016 Spring 2018 1 Yr # Change 1 Yr % ChangePrior Year CUTRA & Reserves 1,921 3,177 1,256 65.4% I&DR Teaching 43 43 47 4 9.3%Year-End Balance 3,177 2,221 (956) -30.1% I&DR Support 16 16 17 1 6.3%
Academic Support 5 6 6 - 0.0%Centrally Administered Funds ($000) FY2017 FY2018 $ Change % Change Student Services 24 23 23 - 0.0%
Fringes Actual/Projected 7,111 8,557 1,446 20.3% Maintenance & Operations 2 2 2 - 0.0%Energy 28 33 5 17.2% General Administration 19 22 23 1 4.5%Building Rentals 4,029 5,224 1,195 29.7% General Institutional Services 27 22 23 1 4.5%Financial Aid 10 14 4 38.5% SEEK/CD - - - - 0.0%Centralized Purchasing 140 - (140) -100.0% Other - - - - 0.0%Total Centrally Administered Funds 11,318 13,828 2,510 22.2% Total Full-time 136 134 141 7 5.2%
Prior year end balance may not tie to current year CUTRA due to IFR Cost recoveries adjustment
FY2018 Energy based on FY17 actuals and Financial Aid uses prior year actuals prorated based on current year budget
Staffing Spring 2018 as of 2/15/18 except for BKL, HTR, YRK, and Central which are from CUNYFirst as of 2/28/18, Prior Year(s) from last payroll in October of that year;
FY2018 Centralized Purchasing included in College OTPS
Fall 2016 Fall 2017
The City University of New York2017-2018 Third Quarter Financial Report
CUNY School of Law
Comparison of Expenditures to Resources ($000)
FY2017 FY2018 $ Change % Change
FTE Enrollment and I&DR Teaching change since Fall 2012
‐30%
‐25%
‐20%
‐15%
‐10%
‐5%
0%
5%
10%
Fall 2012 Fall 2013 Fall 2014 Fall 2015 Fall 2016 Fall 2017
FTE % Change I&DR Teaching % Change
53
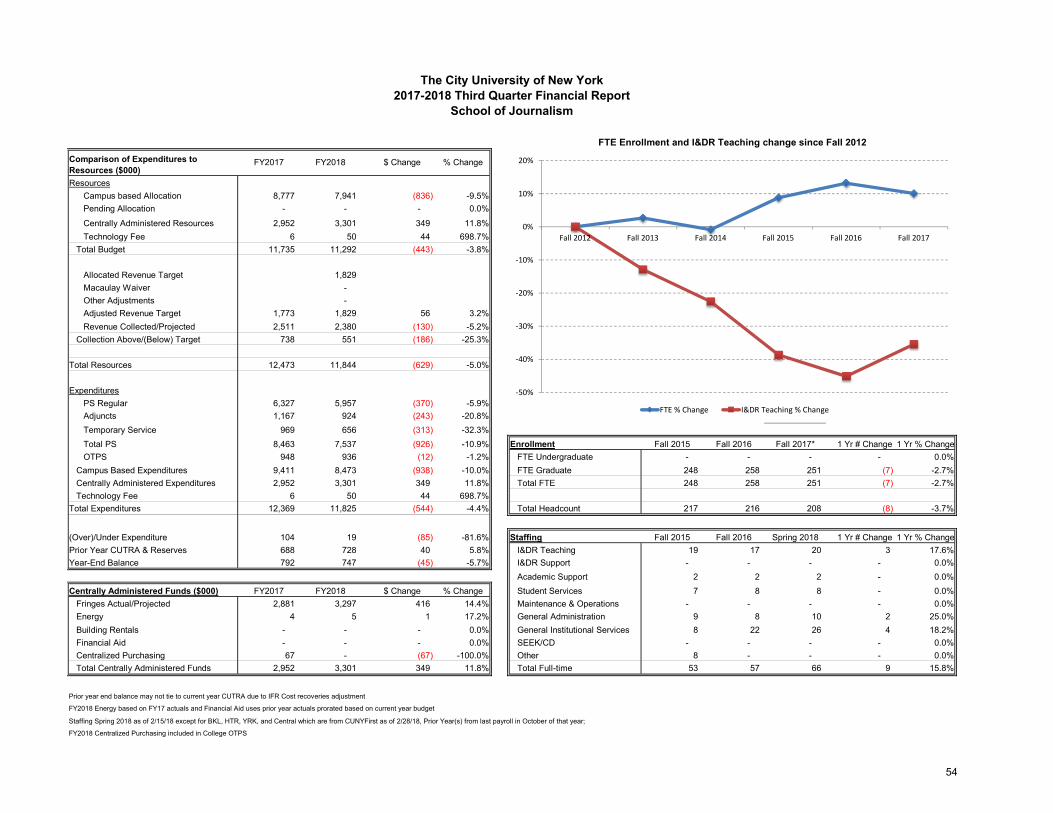
ResourcesCampus based Allocation 8,777 7,941 (836) -9.5%Pending Allocation - - - 0.0%Centrally Administered Resources 2,952 3,301 349 11.8% Fall 2017Technology Fee 6 50 44 698.7% Fall 2012 Fall 2013 Fall 2014 Fa
Total Budget 11,735 11,292 (443) -3.8% FTE % ChangeFTE % Change 0.0% 2.6% -0.9% # 13.2% 10.1%
Allocated Revenue Target 1,829 I&DR Teaching % Change 0.0% -12.9% -22.6% # -45.2% -35.5%Macaulay Waiver - Other Adjustments - Adjusted Revenue Target 1,773 1,829 56 3.2%Revenue Collected/Projected 2,511 2,380 (130) -5.2%
Collection Above/(Below) Target 738 551 (186) -25.3%
Total Resources 12,473 11,844 (629) -5.0%
ExpendituresPS Regular 6,327 5,957 (370) -5.9%Adjuncts 1,167 924 (243) -20.8%Temporary Service 969 656 (313) -32.3% Fall 2017Total PS 8,463 7,537 (926) -10.9% Enrollment Fall 2015 Fall 2016 Fall 2017* 1 Yr # Change 1 Yr % ChangeOTPS 948 936 (12) -1.2% FTE Undergraduate - - - - 0.0%
Campus Based Expenditures 9,411 8,473 (938) -10.0% FTE Graduate 248 258 251 (7) -2.7%Centrally Administered Expenditures 2,952 3,301 349 11.8% Total FTE 248 258 251 (7) -2.7%Technology Fee 6 50 44 698.7%
Total Expenditures 12,369 11,825 (544) -4.4% Total Headcount 217 216 208 (8) -3.7%
(Over)/Under Expenditure 104 19 (85) -81.6% Staffing Fall 2015 Fall 2016 Spring 2018 1 Yr # Change 1 Yr % ChangePrior Year CUTRA & Reserves 688 728 40 5.8% I&DR Teaching 19 17 20 3 17.6%Year-End Balance 792 747 (45) -5.7% I&DR Support - - - - 0.0%
Academic Support 2 2 2 - 0.0%Centrally Administered Funds ($000) FY2017 FY2018 $ Change % Change Student Services 7 8 8 - 0.0%
Fringes Actual/Projected 2,881 3,297 416 14.4% Maintenance & Operations - - - - 0.0%Energy 4 5 1 17.2% General Administration 9 8 10 2 25.0%Building Rentals - - - 0.0% General Institutional Services 8 22 26 4 18.2%Financial Aid - - - 0.0% SEEK/CD - - - - 0.0%Centralized Purchasing 67 - (67) -100.0% Other 8 - - - 0.0%Total Centrally Administered Funds 2,952 3,301 349 11.8% Total Full-time 53 57 66 9 15.8%
Prior year end balance may not tie to current year CUTRA due to IFR Cost recoveries adjustment
FY2018 Energy based on FY17 actuals and Financial Aid uses prior year actuals prorated based on current year budget
Staffing Spring 2018 as of 2/15/18 except for BKL, HTR, YRK, and Central which are from CUNYFirst as of 2/28/18, Prior Year(s) from last payroll in October of that year;
FY2018 Centralized Purchasing included in College OTPS
Fall 2016 Fall 2017
The City University of New York2017-2018 Third Quarter Financial Report
School of Journalism
Comparison of Expenditures to Resources ($000)
FY2017 FY2018 $ Change % Change
FTE Enrollment and I&DR Teaching change since Fall 2012
‐50%
‐40%
‐30%
‐20%
‐10%
0%
10%
20%
Fall 2012 Fall 2013 Fall 2014 Fall 2015 Fall 2016 Fall 2017
FTE % Change I&DR Teaching % Change
54
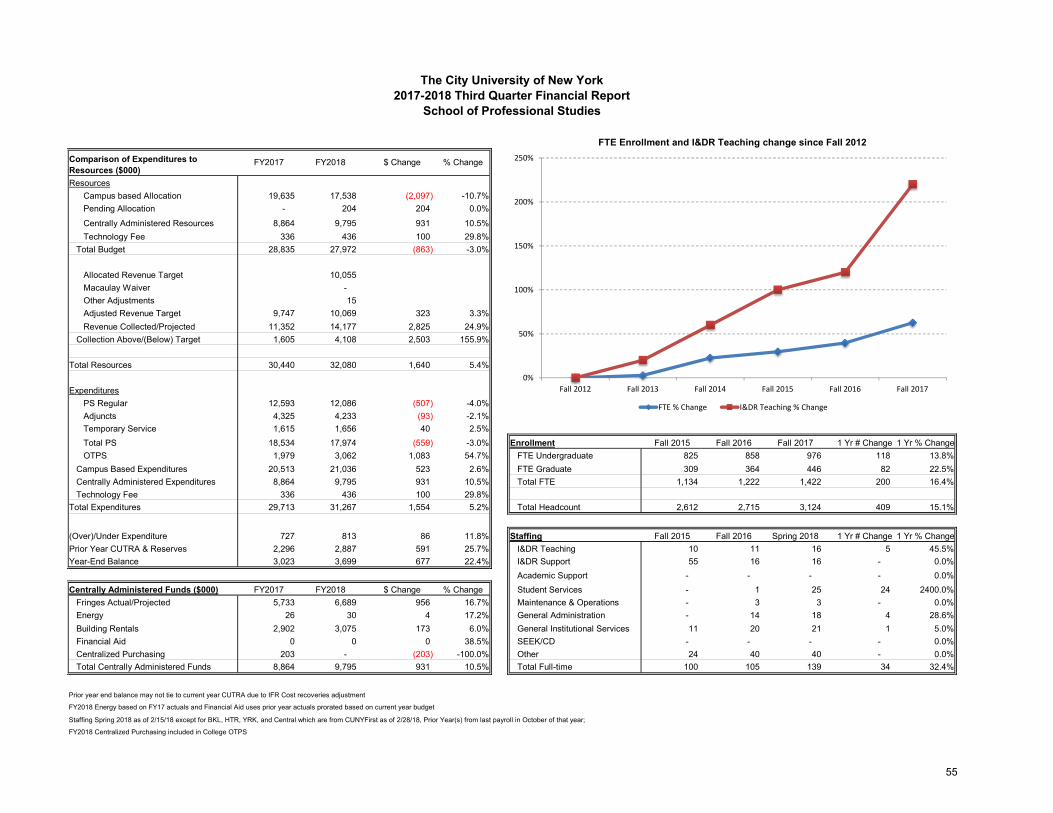
ResourcesCampus based Allocation 19,635 17,538 (2,097) -10.7%Pending Allocation - 204 204 0.0%Centrally Administered Resources 8,864 9,795 931 10.5% Fall 2017Technology Fee 336 436 100 29.8% Fall 2012 Fall 2013 Fall 2014 Fa
Total Budget 28,835 27,972 (863) -3.0% FTE % ChangeFTE % Change 0.0% 2.7% 22.5% # 39.7% 62.5%
Allocated Revenue Target 10,055 I&DR Teaching % Change 0.0% 20.0% 60.0% # 120.0% 220.0%Macaulay Waiver - Other Adjustments 15 Adjusted Revenue Target 9,747 10,069 323 3.3%Revenue Collected/Projected 11,352 14,177 2,825 24.9%
Collection Above/(Below) Target 1,605 4,108 2,503 155.9%
Total Resources 30,440 32,080 1,640 5.4%
ExpendituresPS Regular 12,593 12,086 (507) -4.0%Adjuncts 4,325 4,233 (93) -2.1%Temporary Service 1,615 1,656 40 2.5% Fall 2017Total PS 18,534 17,974 (559) -3.0% Enrollment Fall 2015 Fall 2016 Fall 2017 1 Yr # Change 1 Yr % ChangeOTPS 1,979 3,062 1,083 54.7% FTE Undergraduate 825 858 976 118 13.8%
Campus Based Expenditures 20,513 21,036 523 2.6% FTE Graduate 309 364 446 82 22.5%Centrally Administered Expenditures 8,864 9,795 931 10.5% Total FTE 1,134 1,222 1,422 200 16.4%Technology Fee 336 436 100 29.8%
Total Expenditures 29,713 31,267 1,554 5.2% Total Headcount 2,612 2,715 3,124 409 15.1%
(Over)/Under Expenditure 727 813 86 11.8% Staffing Fall 2015 Fall 2016 Spring 2018 1 Yr # Change 1 Yr % ChangePrior Year CUTRA & Reserves 2,296 2,887 591 25.7% I&DR Teaching 10 11 16 5 45.5%Year-End Balance 3,023 3,699 677 22.4% I&DR Support 55 16 16 - 0.0%
Academic Support - - - - 0.0%Centrally Administered Funds ($000) FY2017 FY2018 $ Change % Change Student Services - 1 25 24 2400.0%
Fringes Actual/Projected 5,733 6,689 956 16.7% Maintenance & Operations - 3 3 - 0.0%Energy 26 30 4 17.2% General Administration - 14 18 4 28.6%Building Rentals 2,902 3,075 173 6.0% General Institutional Services 11 20 21 1 5.0%Financial Aid 0 0 0 38.5% SEEK/CD - - - - 0.0%Centralized Purchasing 203 - (203) -100.0% Other 24 40 40 - 0.0%Total Centrally Administered Funds 8,864 9,795 931 10.5% Total Full-time 100 105 139 34 32.4%
Prior year end balance may not tie to current year CUTRA due to IFR Cost recoveries adjustment
FY2018 Energy based on FY17 actuals and Financial Aid uses prior year actuals prorated based on current year budget
Staffing Spring 2018 as of 2/15/18 except for BKL, HTR, YRK, and Central which are from CUNYFirst as of 2/28/18, Prior Year(s) from last payroll in October of that year;
FY2018 Centralized Purchasing included in College OTPS
Fall 2016 Fall 2017
The City University of New York2017-2018 Third Quarter Financial Report
School of Professional Studies
Comparison of Expenditures to Resources ($000)
FY2017 FY2018 $ Change % Change
FTE Enrollment and I&DR Teaching change since Fall 2012
0%
50%
100%
150%
200%
250%
Fall 2012 Fall 2013 Fall 2014 Fall 2015 Fall 2016 Fall 2017
FTE % Change I&DR Teaching % Change
55
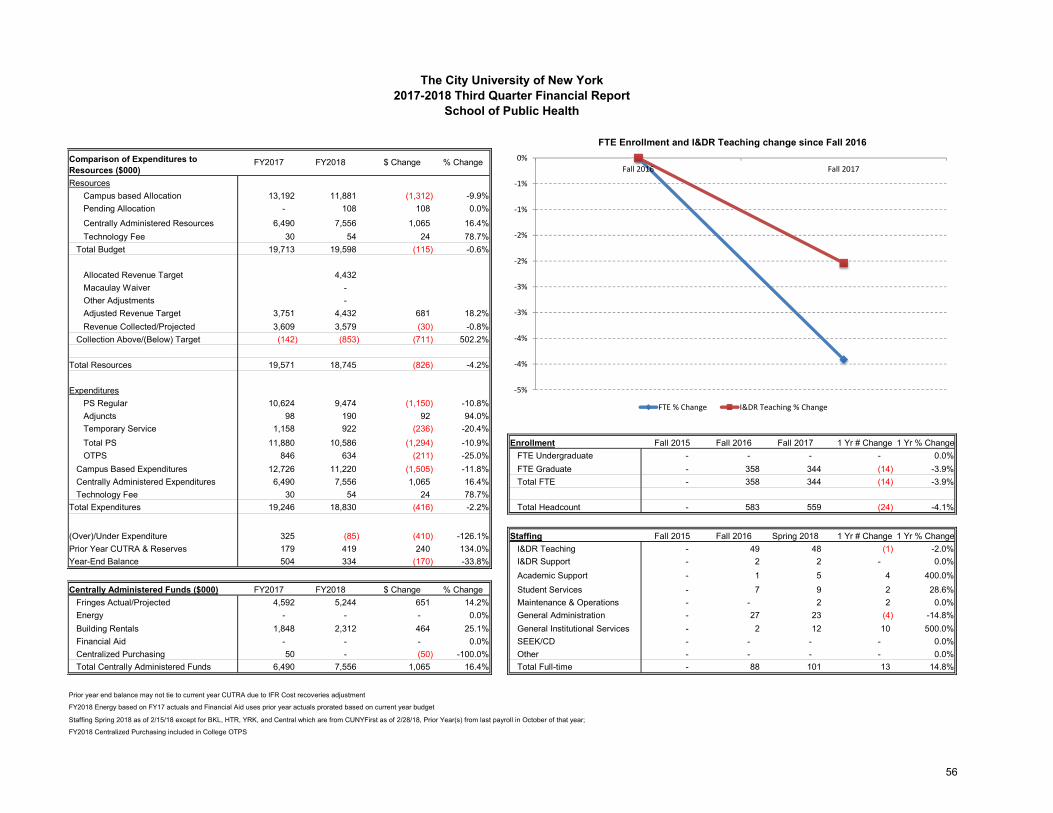
ResourcesCampus based Allocation 13,192 11,881 (1,312) -9.9%Pending Allocation - 108 108 0.0%Centrally Administered Resources 6,490 7,556 1,065 16.4% Fall 2017Technology Fee 30 54 24 78.7% Fall 2012 Fall 2013 Fall 2014 Fa
Total Budget 19,713 19,598 (115) -0.6% FTE % ChangeFTE % Change 0.0% 0.0% 0.0% # 0.0% -3.9%
Allocated Revenue Target 4,432 I&DR Teaching % Change 0.0% 0.0% 0.0% # 0.0% -2.0%Macaulay Waiver - Other Adjustments - Adjusted Revenue Target 3,751 4,432 681 18.2%Revenue Collected/Projected 3,609 3,579 (30) -0.8%
Collection Above/(Below) Target (142) (853) (711) 502.2%
Total Resources 19,571 18,745 (826) -4.2%
ExpendituresPS Regular 10,624 9,474 (1,150) -10.8%Adjuncts 98 190 92 94.0%Temporary Service 1,158 922 (236) -20.4% Fall 2017Total PS 11,880 10,586 (1,294) -10.9% Enrollment Fall 2015 Fall 2016 Fall 2017 1 Yr # Change 1 Yr % ChangeOTPS 846 634 (211) -25.0% FTE Undergraduate - - - - 0.0%
Campus Based Expenditures 12,726 11,220 (1,505) -11.8% FTE Graduate - 358 344 (14) -3.9%Centrally Administered Expenditures 6,490 7,556 1,065 16.4% Total FTE - 358 344 (14) -3.9%Technology Fee 30 54 24 78.7%
Total Expenditures 19,246 18,830 (416) -2.2% Total Headcount - 583 559 (24) -4.1%
(Over)/Under Expenditure 325 (85) (410) -126.1% Staffing Fall 2015 Fall 2016 Spring 2018 1 Yr # Change 1 Yr % ChangePrior Year CUTRA & Reserves 179 419 240 134.0% I&DR Teaching - 49 48 (1) -2.0%Year-End Balance 504 334 (170) -33.8% I&DR Support - 2 2 - 0.0%
Academic Support - 1 5 4 400.0%Centrally Administered Funds ($000) FY2017 FY2018 $ Change % Change Student Services - 7 9 2 28.6%
Fringes Actual/Projected 4,592 5,244 651 14.2% Maintenance & Operations - - 2 2 0.0%Energy - - - 0.0% General Administration - 27 23 (4) -14.8%Building Rentals 1,848 2,312 464 25.1% General Institutional Services - 2 12 10 500.0%Financial Aid - - - 0.0% SEEK/CD - - - - 0.0%Centralized Purchasing 50 - (50) -100.0% Other - - - - 0.0%Total Centrally Administered Funds 6,490 7,556 1,065 16.4% Total Full-time - 88 101 13 14.8%
Prior year end balance may not tie to current year CUTRA due to IFR Cost recoveries adjustment
FY2018 Energy based on FY17 actuals and Financial Aid uses prior year actuals prorated based on current year budget
Staffing Spring 2018 as of 2/15/18 except for BKL, HTR, YRK, and Central which are from CUNYFirst as of 2/28/18, Prior Year(s) from last payroll in October of that year;
FY2018 Centralized Purchasing included in College OTPS
Fall 2016 Fall 2017
The City University of New York2017-2018 Third Quarter Financial Report
School of Public Health
Comparison of Expenditures to Resources ($000)
FY2017 FY2018 $ Change % Change
FTE Enrollment and I&DR Teaching change since Fall 2016
‐5%
‐4%
‐4%
‐3%
‐3%
‐2%
‐2%
‐1%
‐1%
0%Fall 2016 Fall 2017
FTE % Change I&DR Teaching % Change
56
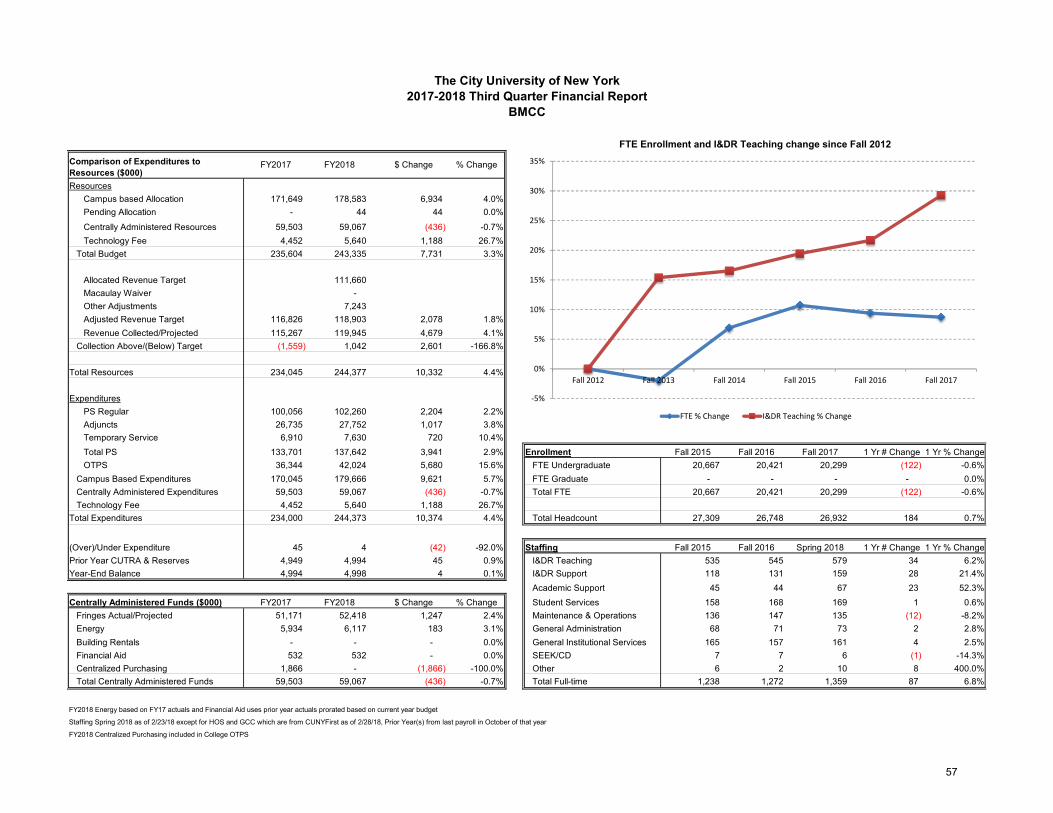
ResourcesCampus based Allocation 171,649 178,583 6,934 4.0%Pending Allocation - 44 44 0.0%
Centrally Administered Resources 59,503 59,067 (436) -0.7% Fall 2017Technology Fee 4,452 5,640 1,188 26.7% Fall 2012 Fall 2013 Fall 2014 Fa
Total Budget 235,604 243,335 7,731 3.3% FTE % ChangeFTE % Change 0.0% -2.0% 6.9% # 9.4% 8.7%
Allocated Revenue Target 111,660 I&DR Teaching % Change 0.0% 15.4% 16.5% # 21.7% 29.2%Macaulay Waiver - Other Adjustments 7,243 Adjusted Revenue Target 116,826 118,903 2,078 1.8%Revenue Collected/Projected 115,267 119,945 4,679 4.1%
Collection Above/(Below) Target (1,559) 1,042 2,601 -166.8%
Total Resources 234,045 244,377 10,332 4.4%
ExpendituresPS Regular 100,056 102,260 2,204 2.2%Adjuncts 26,735 27,752 1,017 3.8%Temporary Service 6,910 7,630 720 10.4% Fall 2017Total PS 133,701 137,642 3,941 2.9% Enrollment Fall 2015 Fall 2016 Fall 2017 1 Yr # Change 1 Yr % ChangeOTPS 36,344 42,024 5,680 15.6% FTE Undergraduate 20,667 20,421 20,299 (122) -0.6%
Campus Based Expenditures 170,045 179,666 9,621 5.7% FTE Graduate - - - - 0.0%Centrally Administered Expenditures 59,503 59,067 (436) -0.7% Total FTE 20,667 20,421 20,299 (122) -0.6%Technology Fee 4,452 5,640 1,188 26.7%
Total Expenditures 234,000 244,373 10,374 4.4% Total Headcount 27,309 26,748 26,932 184 0.7%
(Over)/Under Expenditure 45 4 (42) -92.0% Staffing Fall 2015 Fall 2016 Spring 2018 1 Yr # Change 1 Yr % ChangePrior Year CUTRA & Reserves 4,949 4,994 45 0.9% I&DR Teaching 535 545 579 34 6.2%Year-End Balance 4,994 4,998 4 0.1% I&DR Support 118 131 159 28 21.4%
Academic Support 45 44 67 23 52.3%Centrally Administered Funds ($000) FY2017 FY2018 $ Change % Change Student Services 158 168 169 1 0.6%
Fringes Actual/Projected 51,171 52,418 1,247 2.4% Maintenance & Operations 136 147 135 (12) -8.2%Energy 5,934 6,117 183 3.1% General Administration 68 71 73 2 2.8%Building Rentals - - - 0.0% General Institutional Services 165 157 161 4 2.5%Financial Aid 532 532 - 0.0% SEEK/CD 7 7 6 (1) -14.3%Centralized Purchasing 1,866 - (1,866) -100.0% Other 6 2 10 8 400.0%Total Centrally Administered Funds 59,503 59,067 (436) -0.7% Total Full-time 1,238 1,272 1,359 87 6.8%
FY2018 Energy based on FY17 actuals and Financial Aid uses prior year actuals prorated based on current year budget
Staffing Spring 2018 as of 2/23/18 except for HOS and GCC which are from CUNYFirst as of 2/28/18, Prior Year(s) from last payroll in October of that year
FY2018 Centralized Purchasing included in College OTPS
Fall 2016 Fall 2017
The City University of New York2017-2018 Third Quarter Financial Report
BMCC
Comparison of Expenditures to Resources ($000)
FY2017 FY2018 $ Change % Change
FTE Enrollment and I&DR Teaching change since Fall 2012
‐5%
0%
5%
10%
15%
20%
25%
30%
35%
Fall 2012 Fall 2013 Fall 2014 Fall 2015 Fall 2016 Fall 2017
FTE % Change I&DR Teaching % Change
57
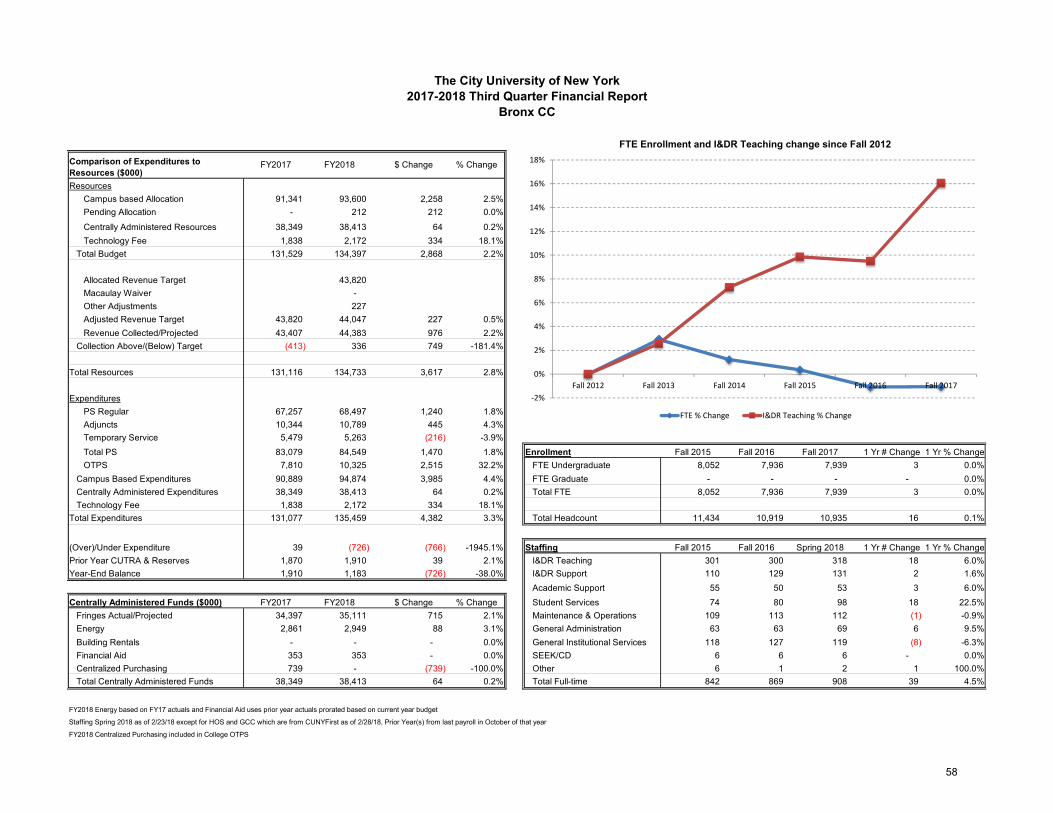
ResourcesCampus based Allocation 91,341 93,600 2,258 2.5%Pending Allocation - 212 212 0.0%
Centrally Administered Resources 38,349 38,413 64 0.2% Fall 2017Technology Fee 1,838 2,172 334 18.1% Fall 2012 Fall 2013 Fall 2014 Fa
Total Budget 131,529 134,397 2,868 2.2% FTE % ChangeFTE % Change 0.0% 2.9% 1.2% # -1.1% -1.0%
Allocated Revenue Target 43,820 I&DR Teaching % Change 0.0% 2.6% 7.3% # 9.5% 16.1%Macaulay Waiver - Other Adjustments 227 Adjusted Revenue Target 43,820 44,047 227 0.5%Revenue Collected/Projected 43,407 44,383 976 2.2%
Collection Above/(Below) Target (413) 336 749 -181.4%
Total Resources 131,116 134,733 3,617 2.8%
ExpendituresPS Regular 67,257 68,497 1,240 1.8%Adjuncts 10,344 10,789 445 4.3%Temporary Service 5,479 5,263 (216) -3.9% Fall 2017Total PS 83,079 84,549 1,470 1.8% Enrollment Fall 2015 Fall 2016 Fall 2017 1 Yr # Change 1 Yr % ChangeOTPS 7,810 10,325 2,515 32.2% FTE Undergraduate 8,052 7,936 7,939 3 0.0%
Campus Based Expenditures 90,889 94,874 3,985 4.4% FTE Graduate - - - - 0.0%Centrally Administered Expenditures 38,349 38,413 64 0.2% Total FTE 8,052 7,936 7,939 3 0.0%Technology Fee 1,838 2,172 334 18.1%
Total Expenditures 131,077 135,459 4,382 3.3% Total Headcount 11,434 10,919 10,935 16 0.1%
(Over)/Under Expenditure 39 (726) (766) -1945.1% Staffing Fall 2015 Fall 2016 Spring 2018 1 Yr # Change 1 Yr % ChangePrior Year CUTRA & Reserves 1,870 1,910 39 2.1% I&DR Teaching 301 300 318 18 6.0%Year-End Balance 1,910 1,183 (726) -38.0% I&DR Support 110 129 131 2 1.6%
Academic Support 55 50 53 3 6.0%Centrally Administered Funds ($000) FY2017 FY2018 $ Change % Change Student Services 74 80 98 18 22.5%
Fringes Actual/Projected 34,397 35,111 715 2.1% Maintenance & Operations 109 113 112 (1) -0.9%Energy 2,861 2,949 88 3.1% General Administration 63 63 69 6 9.5%Building Rentals - - - 0.0% General Institutional Services 118 127 119 (8) -6.3%Financial Aid 353 353 - 0.0% SEEK/CD 6 6 6 - 0.0%Centralized Purchasing 739 - (739) -100.0% Other 6 1 2 1 100.0%Total Centrally Administered Funds 38,349 38,413 64 0.2% Total Full-time 842 869 908 39 4.5%
FY2018 Energy based on FY17 actuals and Financial Aid uses prior year actuals prorated based on current year budget
Staffing Spring 2018 as of 2/23/18 except for HOS and GCC which are from CUNYFirst as of 2/28/18, Prior Year(s) from last payroll in October of that year
FY2018 Centralized Purchasing included in College OTPS
Fall 2016 Fall 2017
The City University of New York2017-2018 Third Quarter Financial Report
Bronx CC
Comparison of Expenditures to Resources ($000)
FY2017 FY2018 $ Change % Change
FTE Enrollment and I&DR Teaching change since Fall 2012
‐2%
0%
2%
4%
6%
8%
10%
12%
14%
16%
18%
Fall 2012 Fall 2013 Fall 2014 Fall 2015 Fall 2016 Fall 2017
FTE % Change I&DR Teaching % Change
58
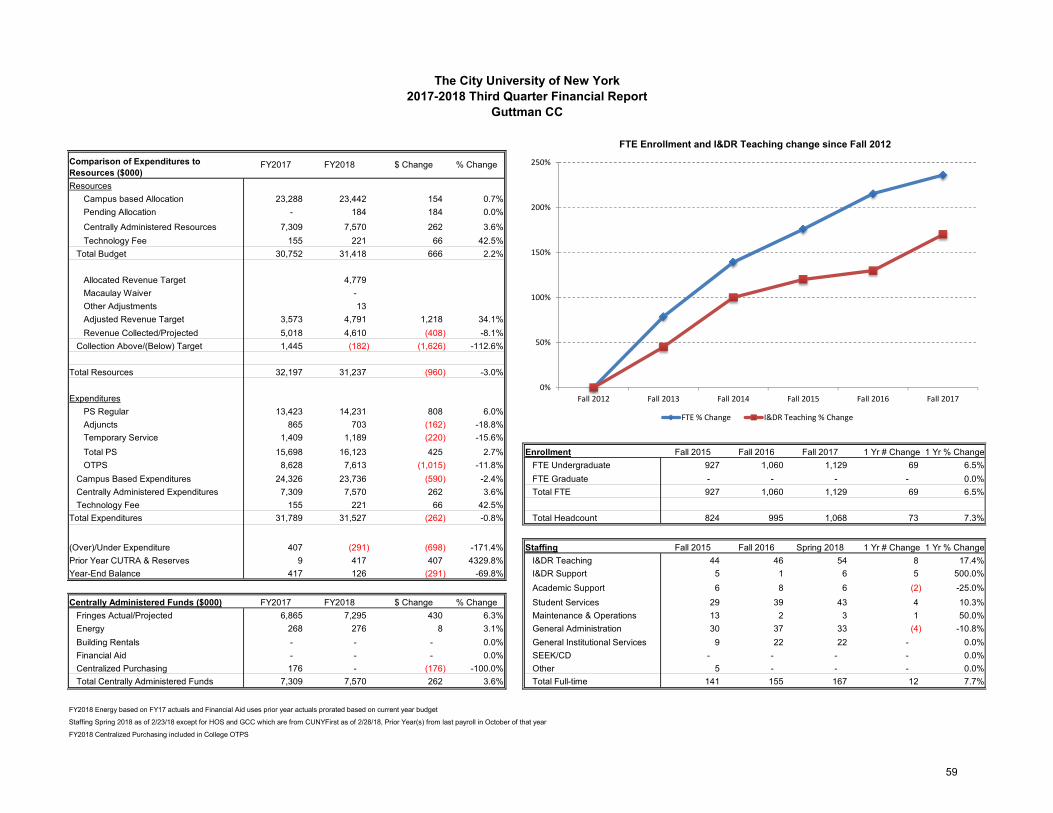
ResourcesCampus based Allocation 23,288 23,442 154 0.7%Pending Allocation - 184 184 0.0%
Centrally Administered Resources 7,309 7,570 262 3.6% Fall 2017Technology Fee 155 221 66 42.5% Fall 2012 Fall 2013 Fall 2014 Fa
Total Budget 30,752 31,418 666 2.2% FTE % ChangeFTE % Change 0.0% 78.9% 139.3% # 215.5% 236.0%
Allocated Revenue Target 4,779 I&DR Teaching % Change 0.0% 45.0% 100.0% # 130.0% 170.0%Macaulay Waiver - Other Adjustments 13 Adjusted Revenue Target 3,573 4,791 1,218 34.1%Revenue Collected/Projected 5,018 4,610 (408) -8.1%
Collection Above/(Below) Target 1,445 (182) (1,626) -112.6%
Total Resources 32,197 31,237 (960) -3.0%
ExpendituresPS Regular 13,423 14,231 808 6.0%Adjuncts 865 703 (162) -18.8%Temporary Service 1,409 1,189 (220) -15.6% Fall 2017Total PS 15,698 16,123 425 2.7% Enrollment Fall 2015 Fall 2016 Fall 2017 1 Yr # Change 1 Yr % ChangeOTPS 8,628 7,613 (1,015) -11.8% FTE Undergraduate 927 1,060 1,129 69 6.5%
Campus Based Expenditures 24,326 23,736 (590) -2.4% FTE Graduate - - - - 0.0%Centrally Administered Expenditures 7,309 7,570 262 3.6% Total FTE 927 1,060 1,129 69 6.5%Technology Fee 155 221 66 42.5%
Total Expenditures 31,789 31,527 (262) -0.8% Total Headcount 824 995 1,068 73 7.3%
(Over)/Under Expenditure 407 (291) (698) -171.4% Staffing Fall 2015 Fall 2016 Spring 2018 1 Yr # Change 1 Yr % ChangePrior Year CUTRA & Reserves 9 417 407 4329.8% I&DR Teaching 44 46 54 8 17.4%Year-End Balance 417 126 (291) -69.8% I&DR Support 5 1 6 5 500.0%
Academic Support 6 8 6 (2) -25.0%Centrally Administered Funds ($000) FY2017 FY2018 $ Change % Change Student Services 29 39 43 4 10.3%
Fringes Actual/Projected 6,865 7,295 430 6.3% Maintenance & Operations 13 2 3 1 50.0%Energy 268 276 8 3.1% General Administration 30 37 33 (4) -10.8%Building Rentals - - - 0.0% General Institutional Services 9 22 22 - 0.0%Financial Aid - - - 0.0% SEEK/CD - - - - 0.0%Centralized Purchasing 176 - (176) -100.0% Other 5 - - - 0.0%Total Centrally Administered Funds 7,309 7,570 262 3.6% Total Full-time 141 155 167 12 7.7%
FY2018 Energy based on FY17 actuals and Financial Aid uses prior year actuals prorated based on current year budget
Staffing Spring 2018 as of 2/23/18 except for HOS and GCC which are from CUNYFirst as of 2/28/18, Prior Year(s) from last payroll in October of that year
FY2018 Centralized Purchasing included in College OTPS
Fall 2016 Fall 2017
The City University of New York2017-2018 Third Quarter Financial Report
Guttman CC
Comparison of Expenditures to Resources ($000)
FY2017 FY2018 $ Change % Change
FTE Enrollment and I&DR Teaching change since Fall 2012
0%
50%
100%
150%
200%
250%
Fall 2012 Fall 2013 Fall 2014 Fall 2015 Fall 2016 Fall 2017
FTE % Change I&DR Teaching % Change
59
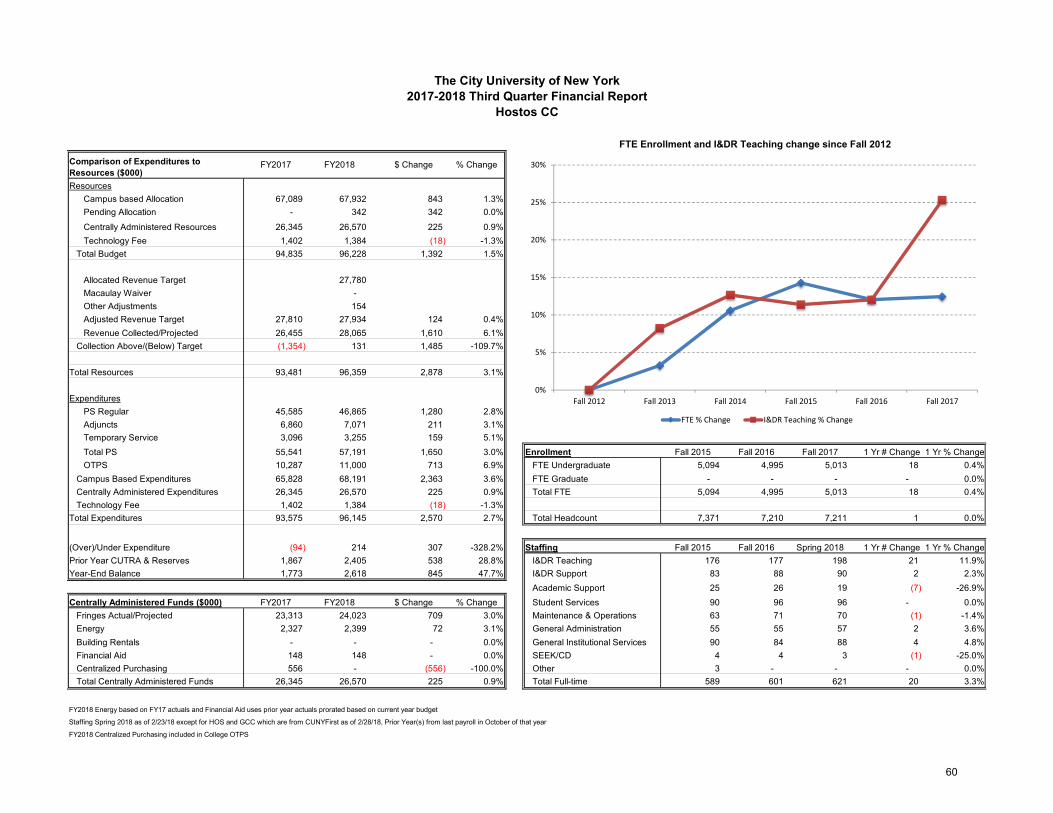
ResourcesCampus based Allocation 67,089 67,932 843 1.3%Pending Allocation - 342 342 0.0%
Centrally Administered Resources 26,345 26,570 225 0.9% Fall 2017Technology Fee 1,402 1,384 (18) -1.3% Fall 2012 Fall 2013 Fall 2014 Fa
Total Budget 94,835 96,228 1,392 1.5% FTE % ChangeFTE % Change 0.0% 3.3% 10.6% # 12.0% 12.4%
Allocated Revenue Target 27,780 I&DR Teaching % Change 0.0% 8.2% 12.7% # 12.0% 25.3%Macaulay Waiver - Other Adjustments 154 Adjusted Revenue Target 27,810 27,934 124 0.4%Revenue Collected/Projected 26,455 28,065 1,610 6.1%
Collection Above/(Below) Target (1,354) 131 1,485 -109.7%
Total Resources 93,481 96,359 2,878 3.1%
ExpendituresPS Regular 45,585 46,865 1,280 2.8%Adjuncts 6,860 7,071 211 3.1%Temporary Service 3,096 3,255 159 5.1% Fall 2017Total PS 55,541 57,191 1,650 3.0% Enrollment Fall 2015 Fall 2016 Fall 2017 1 Yr # Change 1 Yr % ChangeOTPS 10,287 11,000 713 6.9% FTE Undergraduate 5,094 4,995 5,013 18 0.4%
Campus Based Expenditures 65,828 68,191 2,363 3.6% FTE Graduate - - - - 0.0%Centrally Administered Expenditures 26,345 26,570 225 0.9% Total FTE 5,094 4,995 5,013 18 0.4%Technology Fee 1,402 1,384 (18) -1.3%
Total Expenditures 93,575 96,145 2,570 2.7% Total Headcount 7,371 7,210 7,211 1 0.0%
(Over)/Under Expenditure (94) 214 307 -328.2% Staffing Fall 2015 Fall 2016 Spring 2018 1 Yr # Change 1 Yr % ChangePrior Year CUTRA & Reserves 1,867 2,405 538 28.8% I&DR Teaching 176 177 198 21 11.9%Year-End Balance 1,773 2,618 845 47.7% I&DR Support 83 88 90 2 2.3%
Academic Support 25 26 19 (7) -26.9%Centrally Administered Funds ($000) FY2017 FY2018 $ Change % Change Student Services 90 96 96 - 0.0%
Fringes Actual/Projected 23,313 24,023 709 3.0% Maintenance & Operations 63 71 70 (1) -1.4%Energy 2,327 2,399 72 3.1% General Administration 55 55 57 2 3.6%Building Rentals - - - 0.0% General Institutional Services 90 84 88 4 4.8%Financial Aid 148 148 - 0.0% SEEK/CD 4 4 3 (1) -25.0%Centralized Purchasing 556 - (556) -100.0% Other 3 - - - 0.0%Total Centrally Administered Funds 26,345 26,570 225 0.9% Total Full-time 589 601 621 20 3.3%
FY2018 Energy based on FY17 actuals and Financial Aid uses prior year actuals prorated based on current year budget
Staffing Spring 2018 as of 2/23/18 except for HOS and GCC which are from CUNYFirst as of 2/28/18, Prior Year(s) from last payroll in October of that year
FY2018 Centralized Purchasing included in College OTPS
Fall 2016 Fall 2017
The City University of New York2017-2018 Third Quarter Financial Report
Hostos CC
Comparison of Expenditures to Resources ($000)
FY2017 FY2018 $ Change % Change
FTE Enrollment and I&DR Teaching change since Fall 2012
0%
5%
10%
15%
20%
25%
30%
Fall 2012 Fall 2013 Fall 2014 Fall 2015 Fall 2016 Fall 2017
FTE % Change I&DR Teaching % Change
60
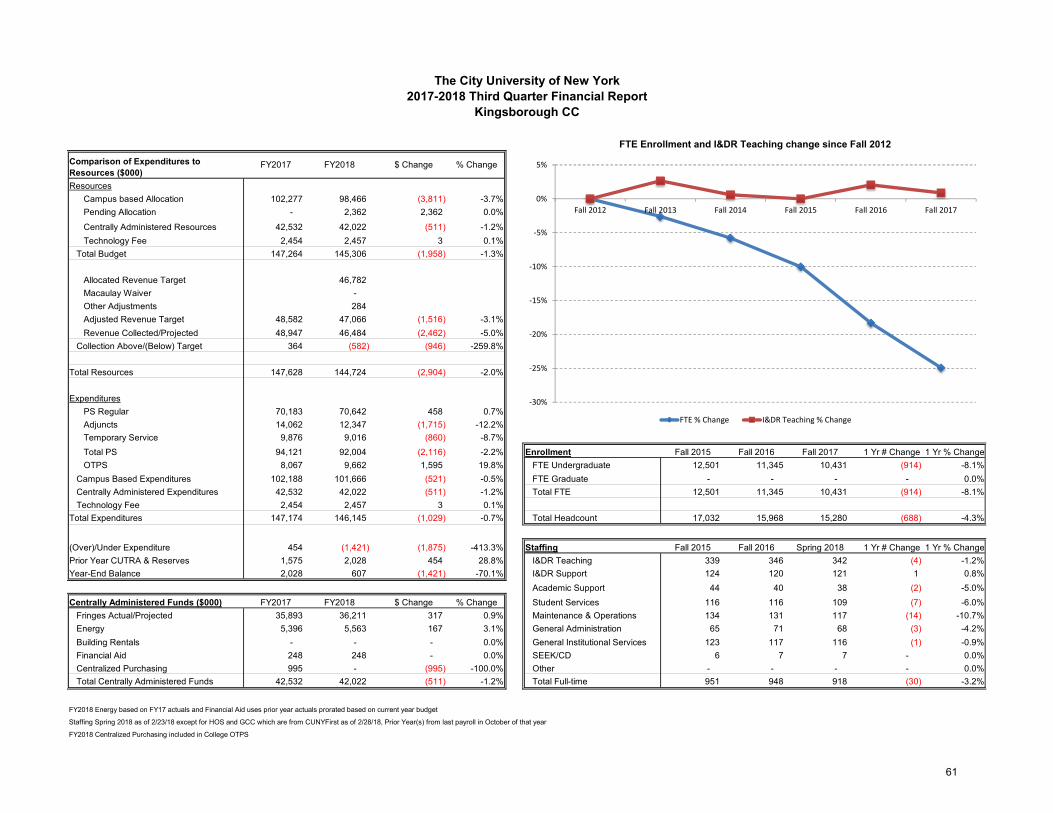
ResourcesCampus based Allocation 102,277 98,466 (3,811) -3.7%Pending Allocation - 2,362 2,362 0.0%
Centrally Administered Resources 42,532 42,022 (511) -1.2% Fall 2017Technology Fee 2,454 2,457 3 0.1% Fall 2012 Fall 2013 Fall 2014 Fa
Total Budget 147,264 145,306 (1,958) -1.3% FTE % ChangeFTE % Change 0.0% -2.6% -5.8% # -18.3% -24.9%
Allocated Revenue Target 46,782 I&DR Teaching % Change 0.0% 2.7% 0.6% # 2.1% 0.9%Macaulay Waiver - Other Adjustments 284 Adjusted Revenue Target 48,582 47,066 (1,516) -3.1%Revenue Collected/Projected 48,947 46,484 (2,462) -5.0%
Collection Above/(Below) Target 364 (582) (946) -259.8%
Total Resources 147,628 144,724 (2,904) -2.0%
ExpendituresPS Regular 70,183 70,642 458 0.7%Adjuncts 14,062 12,347 (1,715) -12.2%Temporary Service 9,876 9,016 (860) -8.7% Fall 2017Total PS 94,121 92,004 (2,116) -2.2% Enrollment Fall 2015 Fall 2016 Fall 2017 1 Yr # Change 1 Yr % ChangeOTPS 8,067 9,662 1,595 19.8% FTE Undergraduate 12,501 11,345 10,431 (914) -8.1%
Campus Based Expenditures 102,188 101,666 (521) -0.5% FTE Graduate - - - - 0.0%Centrally Administered Expenditures 42,532 42,022 (511) -1.2% Total FTE 12,501 11,345 10,431 (914) -8.1%Technology Fee 2,454 2,457 3 0.1%
Total Expenditures 147,174 146,145 (1,029) -0.7% Total Headcount 17,032 15,968 15,280 (688) -4.3%
(Over)/Under Expenditure 454 (1,421) (1,875) -413.3% Staffing Fall 2015 Fall 2016 Spring 2018 1 Yr # Change 1 Yr % ChangePrior Year CUTRA & Reserves 1,575 2,028 454 28.8% I&DR Teaching 339 346 342 (4) -1.2%Year-End Balance 2,028 607 (1,421) -70.1% I&DR Support 124 120 121 1 0.8%
Academic Support 44 40 38 (2) -5.0%Centrally Administered Funds ($000) FY2017 FY2018 $ Change % Change Student Services 116 116 109 (7) -6.0%
Fringes Actual/Projected 35,893 36,211 317 0.9% Maintenance & Operations 134 131 117 (14) -10.7%Energy 5,396 5,563 167 3.1% General Administration 65 71 68 (3) -4.2%Building Rentals - - - 0.0% General Institutional Services 123 117 116 (1) -0.9%Financial Aid 248 248 - 0.0% SEEK/CD 6 7 7 - 0.0%Centralized Purchasing 995 - (995) -100.0% Other - - - - 0.0%Total Centrally Administered Funds 42,532 42,022 (511) -1.2% Total Full-time 951 948 918 (30) -3.2%
FY2018 Energy based on FY17 actuals and Financial Aid uses prior year actuals prorated based on current year budget
Staffing Spring 2018 as of 2/23/18 except for HOS and GCC which are from CUNYFirst as of 2/28/18, Prior Year(s) from last payroll in October of that year
FY2018 Centralized Purchasing included in College OTPS
Fall 2016 Fall 2017
The City University of New York2017-2018 Third Quarter Financial Report
Kingsborough CC
Comparison of Expenditures to Resources ($000)
FY2017 FY2018 $ Change % Change
FTE Enrollment and I&DR Teaching change since Fall 2012
‐30%
‐25%
‐20%
‐15%
‐10%
‐5%
0%
5%
Fall 2012 Fall 2013 Fall 2014 Fall 2015 Fall 2016 Fall 2017
FTE % Change I&DR Teaching % Change
61
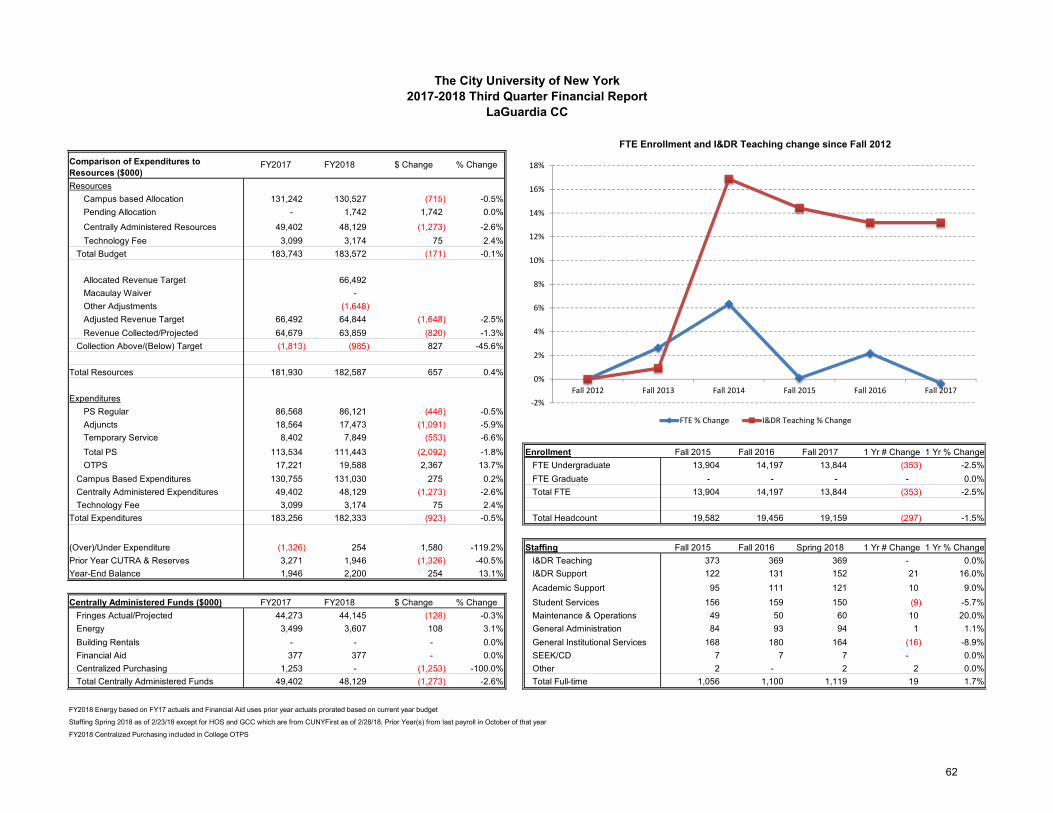
ResourcesCampus based Allocation 131,242 130,527 (715) -0.5%Pending Allocation - 1,742 1,742 0.0%
Centrally Administered Resources 49,402 48,129 (1,273) -2.6% Fall 2017Technology Fee 3,099 3,174 75 2.4% Fall 2012 Fall 2013 Fall 2014 Fa
Total Budget 183,743 183,572 (171) -0.1% FTE % ChangeFTE % Change 0.0% 2.6% 6.3% # 2.2% -0.4%
Allocated Revenue Target 66,492 I&DR Teaching % Change 0.0% 0.9% 16.9% # 13.2% 13.2%Macaulay Waiver - Other Adjustments (1,648) Adjusted Revenue Target 66,492 64,844 (1,648) -2.5%Revenue Collected/Projected 64,679 63,859 (820) -1.3%
Collection Above/(Below) Target (1,813) (985) 827 -45.6%
Total Resources 181,930 182,587 657 0.4%
ExpendituresPS Regular 86,568 86,121 (448) -0.5%Adjuncts 18,564 17,473 (1,091) -5.9%Temporary Service 8,402 7,849 (553) -6.6% Fall 2017Total PS 113,534 111,443 (2,092) -1.8% Enrollment Fall 2015 Fall 2016 Fall 2017 1 Yr # Change 1 Yr % ChangeOTPS 17,221 19,588 2,367 13.7% FTE Undergraduate 13,904 14,197 13,844 (353) -2.5%
Campus Based Expenditures 130,755 131,030 275 0.2% FTE Graduate - - - - 0.0%Centrally Administered Expenditures 49,402 48,129 (1,273) -2.6% Total FTE 13,904 14,197 13,844 (353) -2.5%Technology Fee 3,099 3,174 75 2.4%
Total Expenditures 183,256 182,333 (923) -0.5% Total Headcount 19,582 19,456 19,159 (297) -1.5%
(Over)/Under Expenditure (1,326) 254 1,580 -119.2% Staffing Fall 2015 Fall 2016 Spring 2018 1 Yr # Change 1 Yr % ChangePrior Year CUTRA & Reserves 3,271 1,946 (1,326) -40.5% I&DR Teaching 373 369 369 - 0.0%Year-End Balance 1,946 2,200 254 13.1% I&DR Support 122 131 152 21 16.0%
Academic Support 95 111 121 10 9.0%Centrally Administered Funds ($000) FY2017 FY2018 $ Change % Change Student Services 156 159 150 (9) -5.7%
Fringes Actual/Projected 44,273 44,145 (128) -0.3% Maintenance & Operations 49 50 60 10 20.0%Energy 3,499 3,607 108 3.1% General Administration 84 93 94 1 1.1%Building Rentals - - - 0.0% General Institutional Services 168 180 164 (16) -8.9%Financial Aid 377 377 - 0.0% SEEK/CD 7 7 7 - 0.0%Centralized Purchasing 1,253 - (1,253) -100.0% Other 2 - 2 2 0.0%Total Centrally Administered Funds 49,402 48,129 (1,273) -2.6% Total Full-time 1,056 1,100 1,119 19 1.7%
FY2018 Energy based on FY17 actuals and Financial Aid uses prior year actuals prorated based on current year budget
Staffing Spring 2018 as of 2/23/18 except for HOS and GCC which are from CUNYFirst as of 2/28/18, Prior Year(s) from last payroll in October of that year
FY2018 Centralized Purchasing included in College OTPS
Fall 2016 Fall 2017
The City University of New York2017-2018 Third Quarter Financial Report
LaGuardia CC
Comparison of Expenditures to Resources ($000)
FY2017 FY2018 $ Change % Change
FTE Enrollment and I&DR Teaching change since Fall 2012
‐2%
0%
2%
4%
6%
8%
10%
12%
14%
16%
18%
Fall 2012 Fall 2013 Fall 2014 Fall 2015 Fall 2016 Fall 2017
FTE % Change I&DR Teaching % Change
62
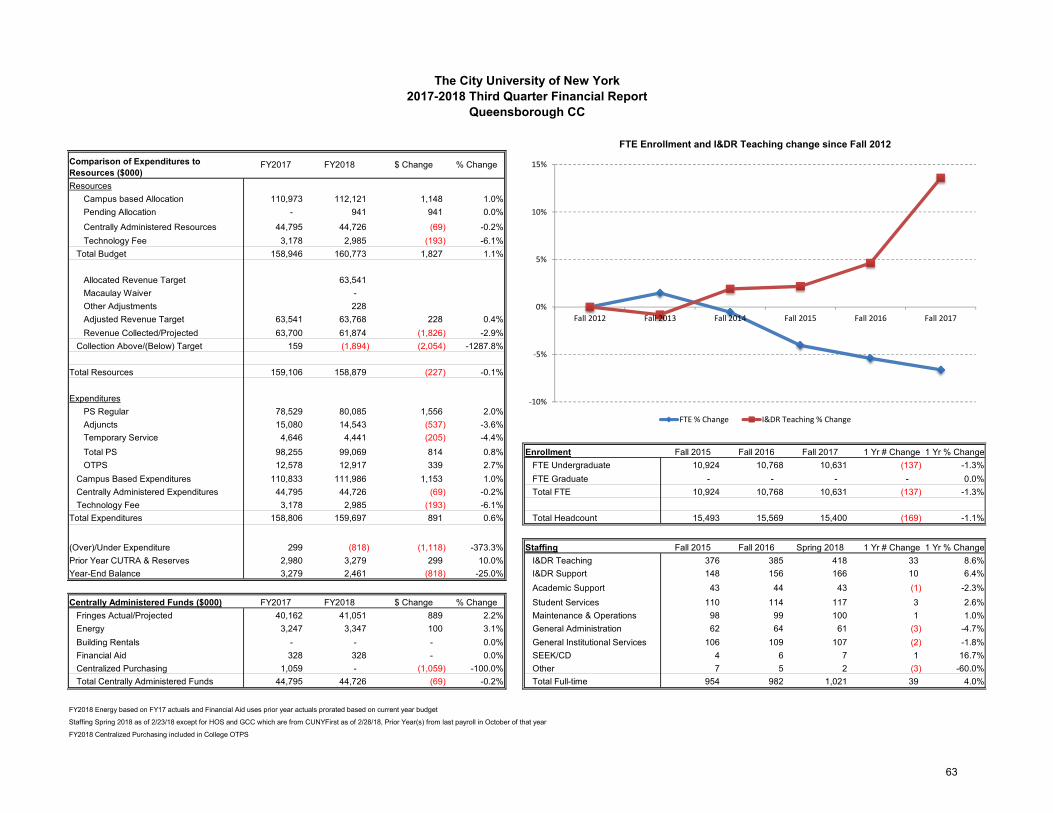
ResourcesCampus based Allocation 110,973 112,121 1,148 1.0%Pending Allocation - 941 941 0.0%
Centrally Administered Resources 44,795 44,726 (69) -0.2% Fall 2017Technology Fee 3,178 2,985 (193) -6.1% Fall 2012 Fall 2013 Fall 2014 Fa
Total Budget 158,946 160,773 1,827 1.1% FTE % ChangeFTE % Change 0.0% 1.5% -0.5% # -5.4% -6.6%
Allocated Revenue Target 63,541 I&DR Teaching % Change 0.0% -0.8% 1.9% # 4.6% 13.6%Macaulay Waiver - Other Adjustments 228 Adjusted Revenue Target 63,541 63,768 228 0.4%Revenue Collected/Projected 63,700 61,874 (1,826) -2.9%
Collection Above/(Below) Target 159 (1,894) (2,054) -1287.8%
Total Resources 159,106 158,879 (227) -0.1%
ExpendituresPS Regular 78,529 80,085 1,556 2.0%Adjuncts 15,080 14,543 (537) -3.6%Temporary Service 4,646 4,441 (205) -4.4% Fall 2017Total PS 98,255 99,069 814 0.8% Enrollment Fall 2015 Fall 2016 Fall 2017 1 Yr # Change 1 Yr % ChangeOTPS 12,578 12,917 339 2.7% FTE Undergraduate 10,924 10,768 10,631 (137) -1.3%
Campus Based Expenditures 110,833 111,986 1,153 1.0% FTE Graduate - - - - 0.0%Centrally Administered Expenditures 44,795 44,726 (69) -0.2% Total FTE 10,924 10,768 10,631 (137) -1.3%Technology Fee 3,178 2,985 (193) -6.1%
Total Expenditures 158,806 159,697 891 0.6% Total Headcount 15,493 15,569 15,400 (169) -1.1%
(Over)/Under Expenditure 299 (818) (1,118) -373.3% Staffing Fall 2015 Fall 2016 Spring 2018 1 Yr # Change 1 Yr % ChangePrior Year CUTRA & Reserves 2,980 3,279 299 10.0% I&DR Teaching 376 385 418 33 8.6%Year-End Balance 3,279 2,461 (818) -25.0% I&DR Support 148 156 166 10 6.4%
Academic Support 43 44 43 (1) -2.3%Centrally Administered Funds ($000) FY2017 FY2018 $ Change % Change Student Services 110 114 117 3 2.6%
Fringes Actual/Projected 40,162 41,051 889 2.2% Maintenance & Operations 98 99 100 1 1.0%Energy 3,247 3,347 100 3.1% General Administration 62 64 61 (3) -4.7%Building Rentals - - - 0.0% General Institutional Services 106 109 107 (2) -1.8%Financial Aid 328 328 - 0.0% SEEK/CD 4 6 7 1 16.7%Centralized Purchasing 1,059 - (1,059) -100.0% Other 7 5 2 (3) -60.0%Total Centrally Administered Funds 44,795 44,726 (69) -0.2% Total Full-time 954 982 1,021 39 4.0%
FY2018 Energy based on FY17 actuals and Financial Aid uses prior year actuals prorated based on current year budget
Staffing Spring 2018 as of 2/23/18 except for HOS and GCC which are from CUNYFirst as of 2/28/18, Prior Year(s) from last payroll in October of that year
FY2018 Centralized Purchasing included in College OTPS
Fall 2016 Fall 2017
The City University of New York2017-2018 Third Quarter Financial Report
Queensborough CC
Comparison of Expenditures to Resources ($000)
FY2017 FY2018 $ Change % Change
FTE Enrollment and I&DR Teaching change since Fall 2012
‐10%
‐5%
0%
5%
10%
15%
Fall 2012 Fall 2013 Fall 2014 Fall 2015 Fall 2016 Fall 2017
FTE % Change I&DR Teaching % Change
63