Embed Size (px)
Citation preview

BokSmart 2010 Age vs Weight CAtegory rugby
Copyright BokSmart © 2010
Age vs Weight Category Rugby
1
AGE-GROUP VS. WEIGHT GROUP RUGBY
Professor Mike LambertJared Forbes James BrownMRC/UCT Research Unit for Exercise Science and Sports Medicine, Department of Human Biology,
University of Cape Town
Contact details:
Professor Mike Lambert,
P.O. Box 115,
Newlands,7725,
021-650 4558
Authors Biography
Mike Lambert is the Editor-in-chief of the South African Journal of Sports Medicine and a Professor in
the MRC/UCT Research Unit for Exercise Science and Sports Medicine, University of Cape Town.
James Brown has recently completed his Masters Degree in Exercise Science at the MRC/UCT Research
Unit for Exercise Science and Sports Medicine, University of Cape Town. He has applied to investigate
the efficacy of the BokSmart programme as part of research towards his PhD in the same field.
Jared Forbes has a Masters Degree in Research Psychology from the University of KwaZulu-Natal and is
currently a research assistant in the MRC/UCT Research Unit for Exercise Science and Sports Medicine,
University of Cape Town.
Copyright BokSmart © 2010
Age vs Weight Category Rugby
2
INTRODUCTIONThe increased competitiveness of schoolboy rugby has resulted in the players becoming bigger and
stronger. For example, the average body mass of players at Craven Week has increased by 10 kg (6.6%)
since 196814. This increase in body mass can be attributed to resistance training. Indeed, the players at
Craven Week who engage in resistance training are on average about 8 kg heavier than the players that
do not do any resistance training8. Furthermore, the average bodyweight of the boys that are selected
for the South African Schools team at the end of the Craven Week tournament is also about 8 kg heavier
than the average weight of the boys who do not make the team8. It is clear that the heavier players have
a competitive advantage, or from another perspective, one can argue that the smaller players are at a
disadvantage when it comes to being selected for high-level teams.
Another factor which accounts for varying sizes amongst players of the same age is the different rates
of development, particularly the onset of puberty. This has been discussed in more detail in another
paper13. The main points arising from this paper were:
• schoolboyrugbyplayersarebecomingbiggerandstronger
• thesizedifferencebetweentheeliteandaverageadolescentplayerisalsoincreasing
• latedevelopersmaybelosttothegameiftheyarenotproperlymanaged
• thedisparityinbodysizebefore,duringandafterpubertymayincreasetheriskofinjury
These findings result in two possible scenarios for smaller players. Firstly, the smaller, talented players
will choose sports in which they can express their talent and not be limited by their lack of size, as
would be the case in rugby. This option would result in much talent being lost to rugby. Some players
in this group may be late developers, who possess superior skills associated with success in rugby.
However, despite possessing skills, these players may be overlooked because of their lack of size at the
juniorlevel.Iftheseplayersarenotmanagedappropriately,theirsuperiorskillsmaynoteverhavean
opportunity to manifest and develop fully. The second scenario is that the smaller players may choose
toplayrugbybutwillalwaysbeatanincreasedriskofinjurybecausetheywillbeplayingagainstboys
who are bigger and stronger. This raises questions about whether the game needs to be managed
differently to cater for these smaller players, particularly during the pre-pubertal years where most of
the variation in size exists13.
There are two possible management strategies which can be considered: either the laws of the game
arechangedtominimisetheimpactofvaryingsizeduringthejunioryears,orthematchesareplayed
with the teams defined by weight group rather than by age group. The goal of having weight, rather
thanage,categories,atthejuniorlevelwouldbetonarrowthesizedifferencewhichexistsinjunior
players, and provide more opportunities for smaller players to excel. Ostensibly this would provide
abetterenvironment for skillsdevelopmentand reduce the riskof injury.Anargument forweight
Copyright BokSmart © 2010
Age vs Weight Category Rugby
3
categories has been made before, with a suggestion that there should be an introduction of lightweight
competition at the international level, including a lightweight rugby World Cup19. This approach would
allow countries with smaller people an opportunity to compete equally.
On the negative side, weight categories would detract from the “spirit of the game”, which promotes
and encourages different sizes and skills for the various playing positions. Therefore the answer to the
questionofwhetherrugbyshouldbeplayedaccordingtoweightgroupsatjuniorlevelisnotasimple
one. To provide an evidence-based answer to this question it is necessary to examine the pros and
consofjuniorrugbyplayedaccordingtoeitheragegrouporweightgroup.Thisevidenceneedsto
beconsideredaccordingtotheriskofinjury,physicalfitness,skillandcognitivedevelopment.Each
of these aspects is an important part of the debate and needs to be considered carefully before an
evidence-based opinion can be made. The long-term talent models29 that other top rugby-playing
countries (Australia and New Zealand) have adopted for their youth will also be discussed. Finally,
recommendations pertaining to the South African situation will be made based on the available
evidence.
ASPECTS OF MATURITY IN CHILDREN WITH INCREASING AGEFor the purpose of this discussion maturity can be considered based on physical, motor and cognitive
functions. A good player needs to be well developed for his age in all these categories – a deficiency in
any category will result in impaired performances. If the player does not have an intuitive coach this will
result in lower self-esteem, lower self-confidence and may lead to the player stopping playing rugby
or moving to another sport which caters for his physical and psychological needs. The next section will
discuss research applicable to physical, motor and cognitive development in the context of maturity of
rugby players.
Physical development
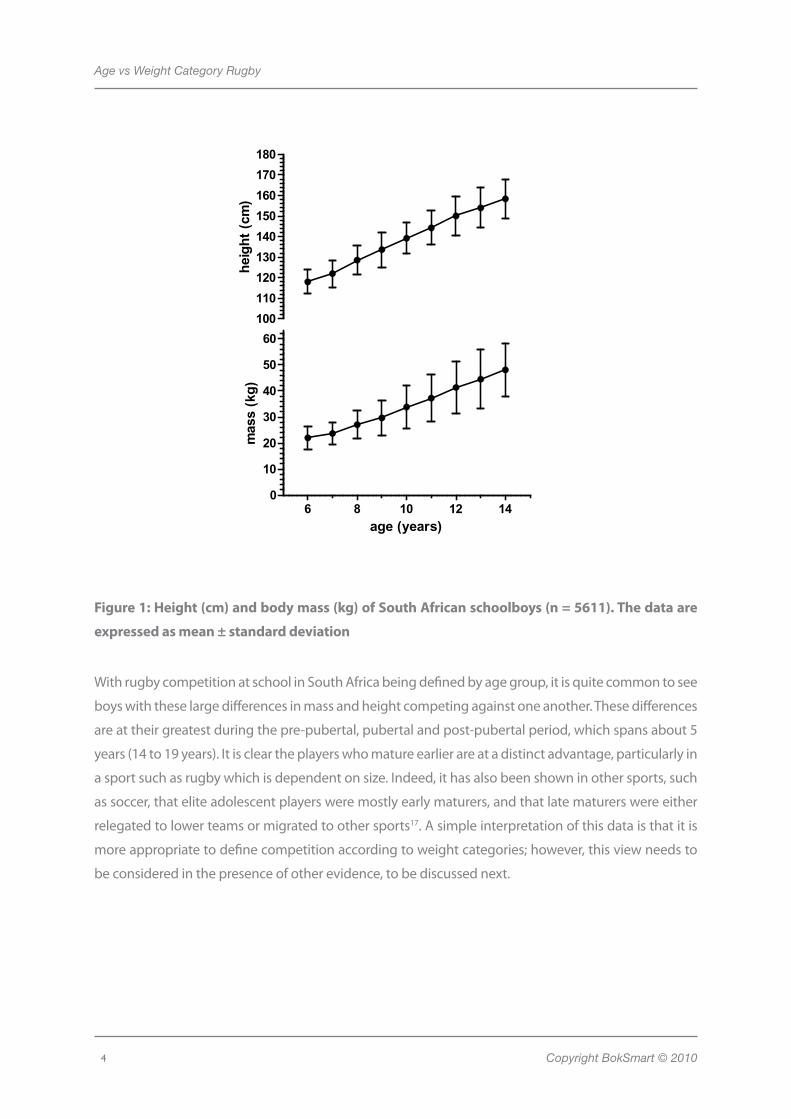
The increase in height and mass of South African schoolboys with increasing age (6 to 14 years) is shown
in Figure 1. As expected, their body mass and height increased consistently through their developing
years up to puberty5. The variation in height and mass at each age group is clearly shown by the spread
of values around each data point (expressed as standard deviations in Figure 1). For example, a large
10-year-old may have a similar body mass to an average-sized 13-year-old, or a large ten-year old may
be more than 20 kg heavy heavier than a smaller boy from the same age group.
Copyright BokSmart © 2010
Age vs Weight Category Rugby
4
Figure 1: Height (cm) and body mass (kg) of South African schoolboys (n = 5611). The data are
expressed as mean ± standard deviation
With rugby competition at school in South Africa being defined by age group, it is quite common to see
boys with these large differences in mass and height competing against one another. These differences
are at their greatest during the pre-pubertal, pubertal and post-pubertal period, which spans about 5
years (14 to 19 years). It is clear the players who mature earlier are at a distinct advantage, particularly in
a sport such as rugby which is dependent on size. Indeed, it has also been shown in other sports, such
as soccer, that elite adolescent players were mostly early maturers, and that late maturers were either
relegated to lower teams or migrated to other sports17. A simple interpretation of this data is that it is
more appropriate to define competition according to weight categories; however, this view needs to
be considered in the presence of other evidence, to be discussed next.
100110120130140150160170180
heig
ht (c
m)
6 8 10 12 140
10
20
30
40
50
60
age (years)
mas
s (k
g)
Copyright BokSmart © 2010
Age vs Weight Category Rugby
5
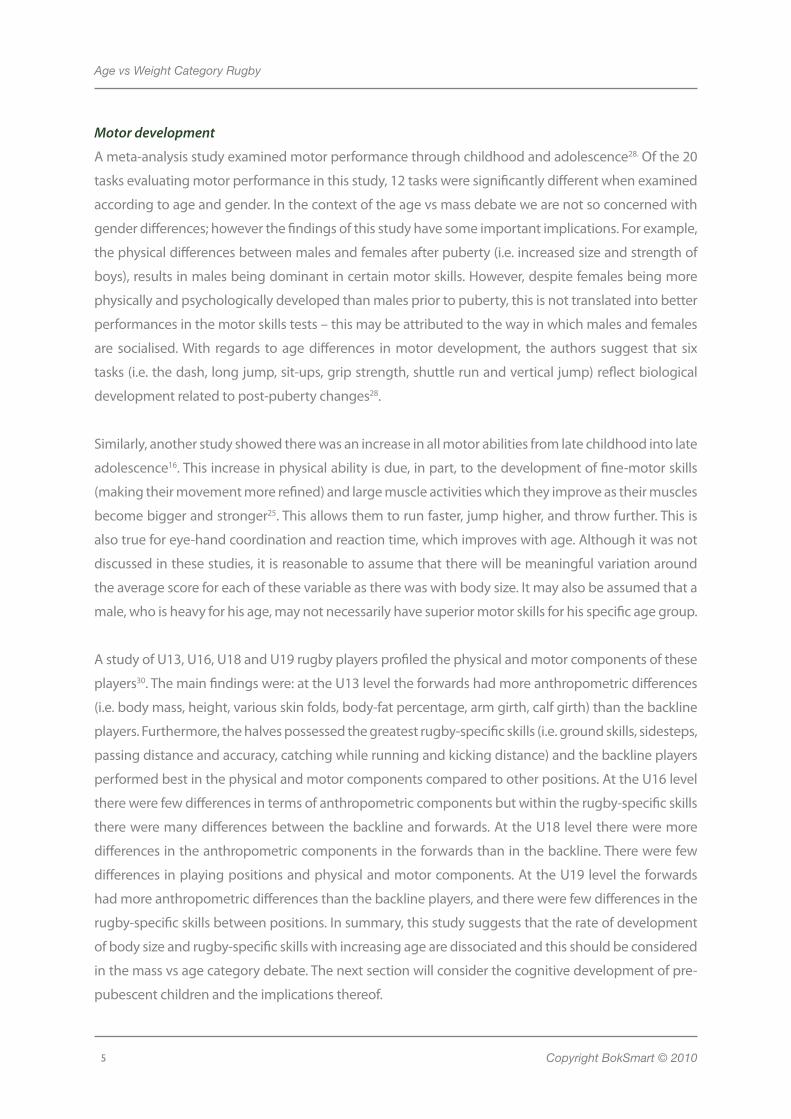
Motor development
A meta-analysis study examined motor performance through childhood and adolescence28. Of the 20
tasks evaluating motor performance in this study, 12 tasks were significantly different when examined
according to age and gender. In the context of the age vs mass debate we are not so concerned with
gender differences; however the findings of this study have some important implications. For example,
the physical differences between males and females after puberty (i.e. increased size and strength of
boys), results in males being dominant in certain motor skills. However, despite females being more
physically and psychologically developed than males prior to puberty, this is not translated into better
performances in the motor skills tests – this may be attributed to the way in which males and females
are socialised. With regards to age differences in motor development, the authors suggest that six
tasks(i.e.thedash,longjump,sit-ups,gripstrength,shuttlerunandverticaljump)reflectbiological
development related to post-puberty changes28.
Similarly, another study showed there was an increase in all motor abilities from late childhood into late
adolescence16. This increase in physical ability is due, in part, to the development of fine-motor skills
(making their movement more refined) and large muscle activities which they improve as their muscles
become bigger and stronger25.Thisallowsthemtorunfaster,jumphigher,andthrowfurther.Thisis
also true for eye-hand coordination and reaction time, which improves with age. Although it was not
discussed in these studies, it is reasonable to assume that there will be meaningful variation around
the average score for each of these variable as there was with body size. It may also be assumed that a
male, who is heavy for his age, may not necessarily have superior motor skills for his specific age group.
A study of U13, U16, U18 and U19 rugby players profiled the physical and motor components of these
players30. The main findings were: at the U13 level the forwards had more anthropometric differences
(i.e. body mass, height, various skin folds, body-fat percentage, arm girth, calf girth) than the backline
players. Furthermore, the halves possessed the greatest rugby-specific skills (i.e. ground skills, sidesteps,
passing distance and accuracy, catching while running and kicking distance) and the backline players
performed best in the physical and motor components compared to other positions. At the U16 level
there were few differences in terms of anthropometric components but within the rugby-specific skills
there were many differences between the backline and forwards. At the U18 level there were more
differences in the anthropometric components in the forwards than in the backline. There were few
differences in playing positions and physical and motor components. At the U19 level the forwards
had more anthropometric differences than the backline players, and there were few differences in the
rugby-specific skills between positions. In summary, this study suggests that the rate of development
of body size and rugby-specific skills with increasing age are dissociated and this should be considered
in the mass vs age category debate. The next section will consider the cognitive development of pre-
pubescent children and the implications thereof.
Copyright BokSmart © 2010
Age vs Weight Category Rugby
6
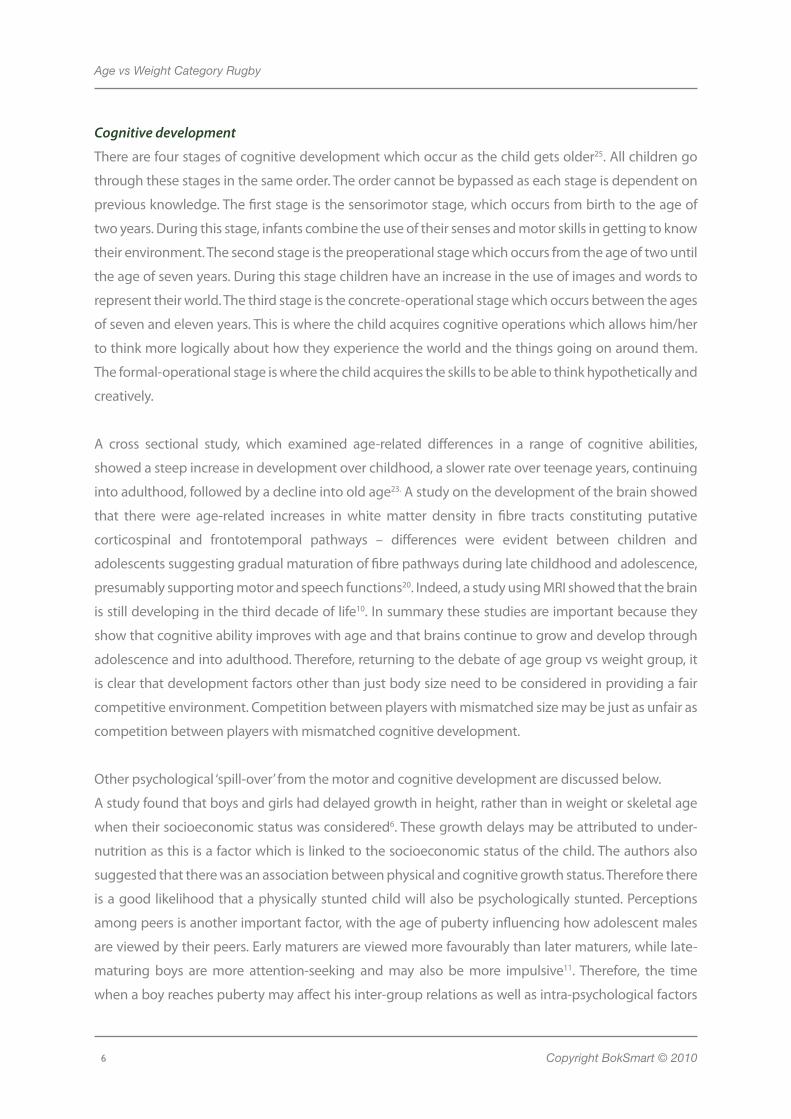
Cognitive development
There are four stages of cognitive development which occur as the child gets older25. All children go
through these stages in the same order. The order cannot be bypassed as each stage is dependent on
previous knowledge. The first stage is the sensorimotor stage, which occurs from birth to the age of
two years. During this stage, infants combine the use of their senses and motor skills in getting to know
their environment. The second stage is the preoperational stage which occurs from the age of two until
the age of seven years. During this stage children have an increase in the use of images and words to
represent their world. The third stage is the concrete-operational stage which occurs between the ages
of seven and eleven years. This is where the child acquires cognitive operations which allows him/her
to think more logically about how they experience the world and the things going on around them.
The formal-operational stage is where the child acquires the skills to be able to think hypothetically and
creatively.
A cross sectional study, which examined age-related differences in a range of cognitive abilities,
showed a steep increase in development over childhood, a slower rate over teenage years, continuing
into adulthood, followed by a decline into old age23. A study on the development of the brain showed
that there were age-related increases in white matter density in fibre tracts constituting putative
corticospinal and frontotemporal pathways – differences were evident between children and
adolescents suggesting gradual maturation of fibre pathways during late childhood and adolescence,
presumably supporting motor and speech functions20. Indeed, a study using MRI showed that the brain
is still developing in the third decade of life10. In summary these studies are important because they
show that cognitive ability improves with age and that brains continue to grow and develop through
adolescence and into adulthood. Therefore, returning to the debate of age group vs weight group, it
isclearthatdevelopmentfactorsotherthanjustbodysizeneedtobeconsideredinprovidingafair
competitiveenvironment.Competitionbetweenplayerswithmismatchedsizemaybejustasunfairas
competition between players with mismatched cognitive development.
Other psychological ‘spill-over’ from the motor and cognitive development are discussed below.
A study found that boys and girls had delayed growth in height, rather than in weight or skeletal age
when their socioeconomic status was considered6. These growth delays may be attributed to under-
nutrition as this is a factor which is linked to the socioeconomic status of the child. The authors also
suggested that there was an association between physical and cognitive growth status. Therefore there
is a good likelihood that a physically stunted child will also be psychologically stunted. Perceptions
amongpeersisanotherimportantfactor,withtheageofpubertyinfluencinghowadolescentmales
are viewed by their peers. Early maturers are viewed more favourably than later maturers, while late-
maturing boys are more attention-seeking and may also be more impulsive11. Therefore, the time
when a boy reaches puberty may affect his inter-group relations as well as intra-psychological factors
Copyright BokSmart © 2010
Age vs Weight Category Rugby
7
such as self-esteem and self-confidence. This may also have a bearing on his psychological maturity.
This is supported by a more recent study which showed that gross motor ability affected perceived
athletic competence21. This study also showed that perceived athletic competence was an important
determinant of self-worth.
In summary, making children with large differences in cognitive development compete against one
another may result in similar problems which occur when children with differences in body size are
allowed to compete. The next section will consider the relationship between variations in body size
andriskofinjury.
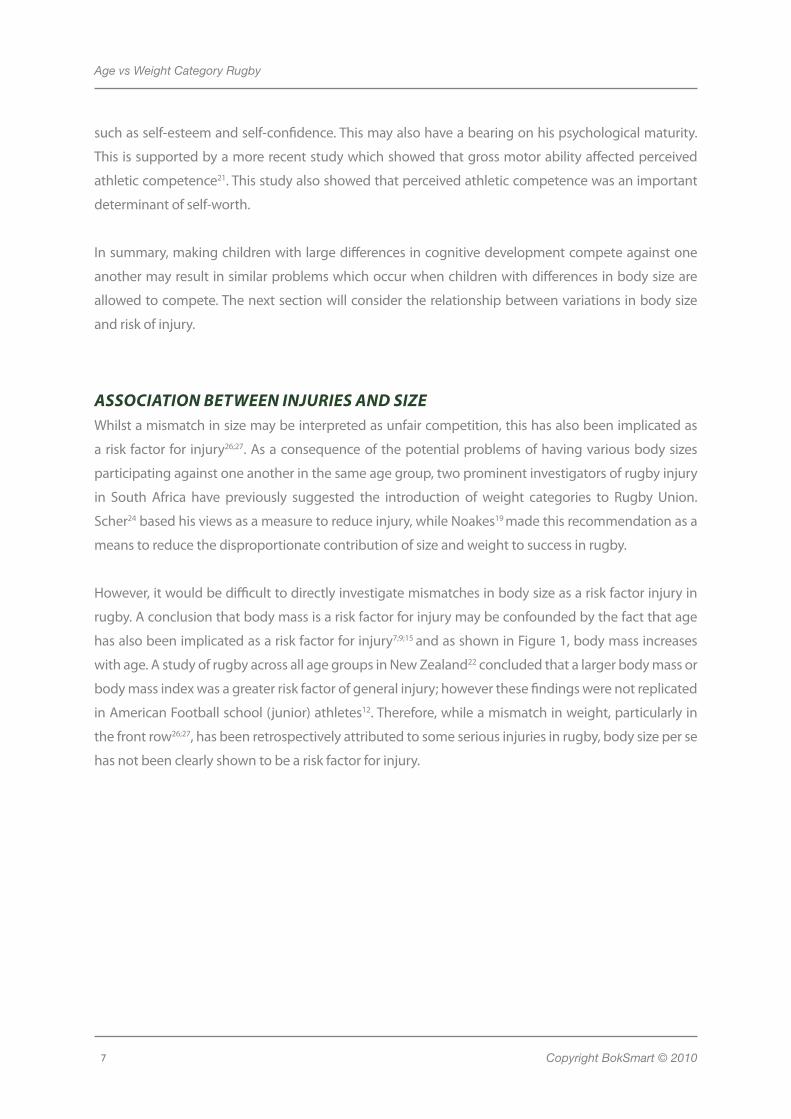
ASSOCIATION BETWEEN INJURIES AND SIZEWhilst a mismatch in size may be interpreted as unfair competition, this has also been implicated as
ariskfactorfor injury26;27. As a consequence of the potential problems of having various body sizes
participatingagainstoneanotherinthesameagegroup,twoprominentinvestigatorsofrugbyinjury
in South Africa have previously suggested the introduction of weight categories to Rugby Union.
Scher24basedhisviewsasameasuretoreduceinjury,whileNoakes19 made this recommendation as a
means to reduce the disproportionate contribution of size and weight to success in rugby.
However,itwouldbedifficulttodirectlyinvestigatemismatchesinbodysizeasariskfactorinjuryin
rugby.Aconclusionthatbodymassisariskfactorforinjurymaybeconfoundedbythefactthatage
hasalsobeenimplicatedasariskfactorforinjury7;9;15 and as shown in Figure 1, body mass increases
with age. A study of rugby across all age groups in New Zealand22 concluded that a larger body mass or
bodymassindexwasagreaterriskfactorofgeneralinjury;howeverthesefindingswerenotreplicated
inAmericanFootballschool(junior)athletes12. Therefore, while a mismatch in weight, particularly in
the front row26;27,hasbeenretrospectivelyattributedtosomeseriousinjuriesinrugby,bodysizeperse
hasnotbeenclearlyshowntobeariskfactorforinjury.
Copyright BokSmart © 2010
Age vs Weight Category Rugby
8
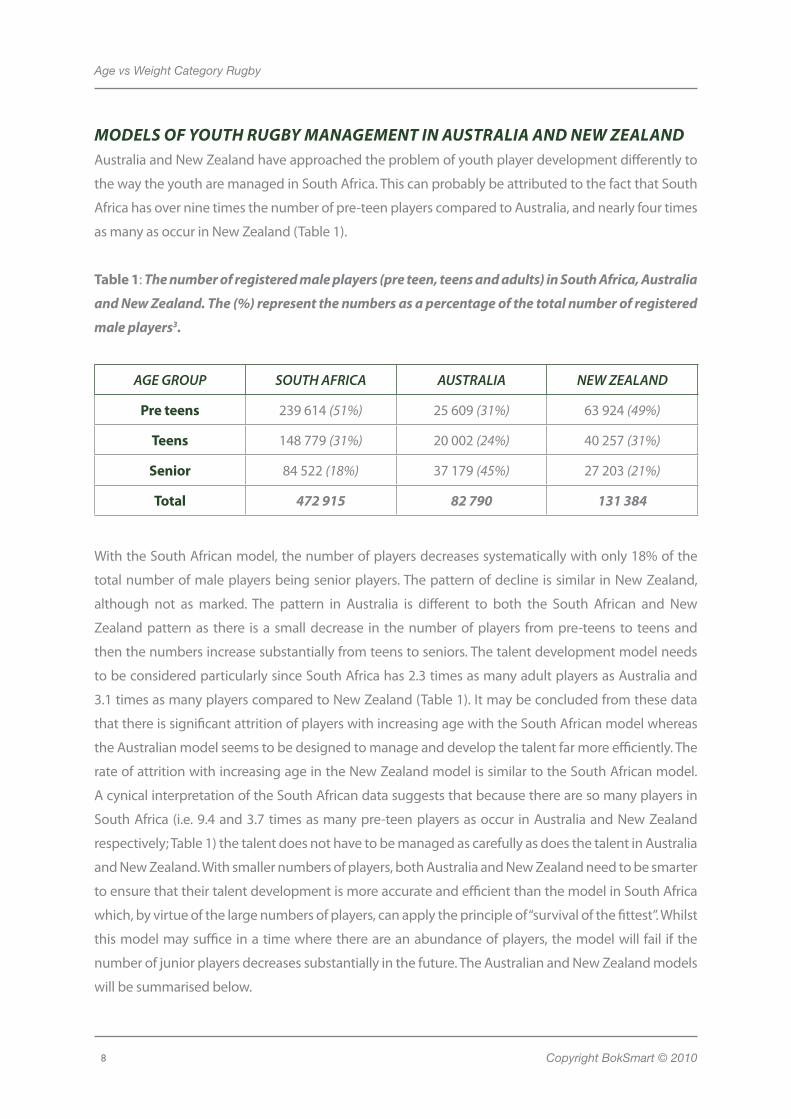
MODELS OF YOUTH RUGBY MANAGEMENT IN AUSTRALIA AND NEW ZEALANDAustralia and New Zealand have approached the problem of youth player development differently to
the way the youth are managed in South Africa. This can probably be attributed to the fact that South
Africa has over nine times the number of pre-teen players compared to Australia, and nearly four times
as many as occur in New Zealand (Table 1).
Table 1: The number of registered male players (pre teen, teens and adults) in South Africa, Australia
and New Zealand. The (%) represent the numbers as a percentage of the total number of registered
male players3.
AGE GROUP SOUTH AFRICA AUSTRALIA NEW ZEALAND
Pre teens 239 614 (51%) 25 609 (31%) 63 924 (49%)
Teens 148 779 (31%) 20 002 (24%) 40 257 (31%)
Senior 84 522 (18%) 37 179 (45%) 27 203 (21%)
Total 472 915 82 790 131 384
With the South African model, the number of players decreases systematically with only 18% of the
total number of male players being senior players. The pattern of decline is similar in New Zealand,
although not as marked. The pattern in Australia is different to both the South African and New
Zealand pattern as there is a small decrease in the number of players from pre-teens to teens and
then the numbers increase substantially from teens to seniors. The talent development model needs
to be considered particularly since South Africa has 2.3 times as many adult players as Australia and
3.1 times as many players compared to New Zealand (Table 1). It may be concluded from these data
that there is significant attrition of players with increasing age with the South African model whereas
the Australian model seems to be designed to manage and develop the talent far more efficiently. The
rate of attrition with increasing age in the New Zealand model is similar to the South African model.
A cynical interpretation of the South African data suggests that because there are so many players in
South Africa (i.e. 9.4 and 3.7 times as many pre-teen players as occur in Australia and New Zealand
respectively; Table 1) the talent does not have to be managed as carefully as does the talent in Australia
and New Zealand. With smaller numbers of players, both Australia and New Zealand need to be smarter
to ensure that their talent development is more accurate and efficient than the model in South Africa
which, by virtue of the large numbers of players, can apply the principle of “survival of the fittest”. Whilst
this model may suffice in a time where there are an abundance of players, the model will fail if the
numberofjuniorplayersdecreasessubstantiallyinthefuture.TheAustralianandNewZealandmodels
will be summarised below.
Copyright BokSmart © 2010
Age vs Weight Category Rugby
9
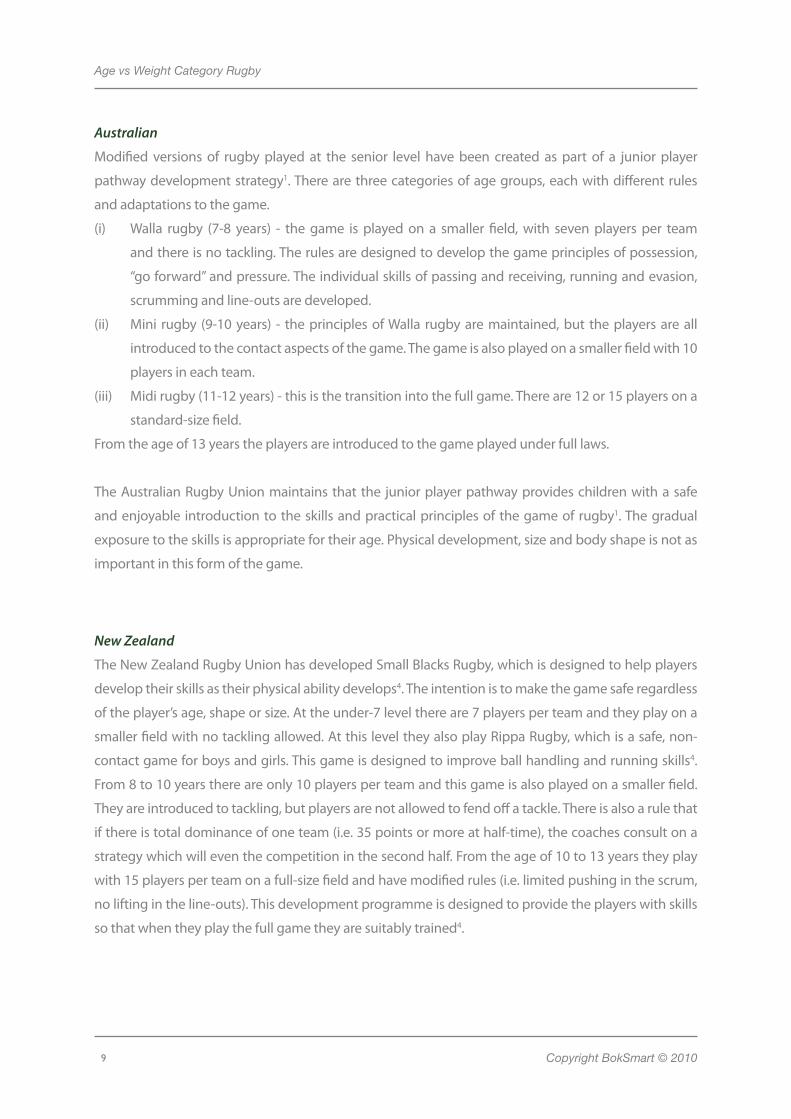
Australian
Modified versionsof rugbyplayed at the senior level havebeen created aspart of a juniorplayer
pathway development strategy1. There are three categories of age groups, each with different rules
and adaptations to the game.
(i) Walla rugby (7-8 years) - the game is played on a smaller field, with seven players per team
and there is no tackling. The rules are designed to develop the game principles of possession,
“go forward” and pressure. The individual skills of passing and receiving, running and evasion,
scrumming and line-outs are developed.
(ii) Mini rugby (9-10 years) - the principles of Walla rugby are maintained, but the players are all
introduced to the contact aspects of the game. The game is also played on a smaller field with 10
players in each team.
(iii) Midi rugby (11-12 years) - this is the transition into the full game. There are 12 or 15 players on a
standard-size field.
From the age of 13 years the players are introduced to the game played under full laws.
TheAustralianRugbyUnionmaintainsthatthe juniorplayerpathwayprovideschildrenwithasafe
andenjoyable introductiontotheskillsandpracticalprinciplesofthegameofrugby1. The gradual
exposure to the skills is appropriate for their age. Physical development, size and body shape is not as
important in this form of the game.
New Zealand
The New Zealand Rugby Union has developed Small Blacks Rugby, which is designed to help players
develop their skills as their physical ability develops4. The intention is to make the game safe regardless
of the player’s age, shape or size. At the under-7 level there are 7 players per team and they play on a
smaller field with no tackling allowed. At this level they also play Rippa Rugby, which is a safe, non-
contact game for boys and girls. This game is designed to improve ball handling and running skills4.
From 8 to 10 years there are only 10 players per team and this game is also played on a smaller field.
They are introduced to tackling, but players are not allowed to fend off a tackle. There is also a rule that
if there is total dominance of one team (i.e. 35 points or more at half-time), the coaches consult on a
strategy which will even the competition in the second half. From the age of 10 to 13 years they play
with 15 players per team on a full-size field and have modified rules (i.e. limited pushing in the scrum,
no lifting in the line-outs). This development programme is designed to provide the players with skills
so that when they play the full game they are suitably trained4.
Copyright BokSmart © 2010
Age vs Weight Category Rugby
10
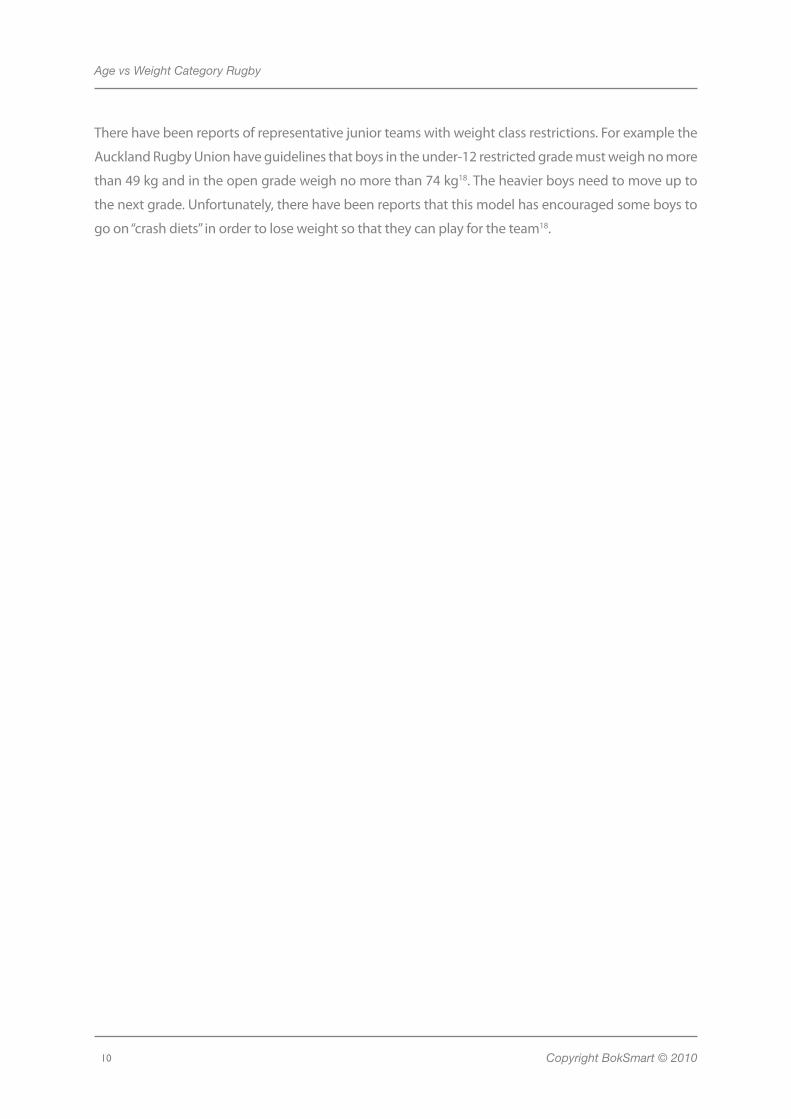
Therehavebeenreportsofrepresentativejuniorteamswithweightclassrestrictions.Forexamplethe
Auckland Rugby Union have guidelines that boys in the under-12 restricted grade must weigh no more
than 49 kg and in the open grade weigh no more than 74 kg18. The heavier boys need to move up to
the next grade. Unfortunately, there have been reports that this model has encouraged some boys to
go on “crash diets” in order to lose weight so that they can play for the team18.
Copyright BokSmart © 2010
Age vs Weight Category Rugby
11
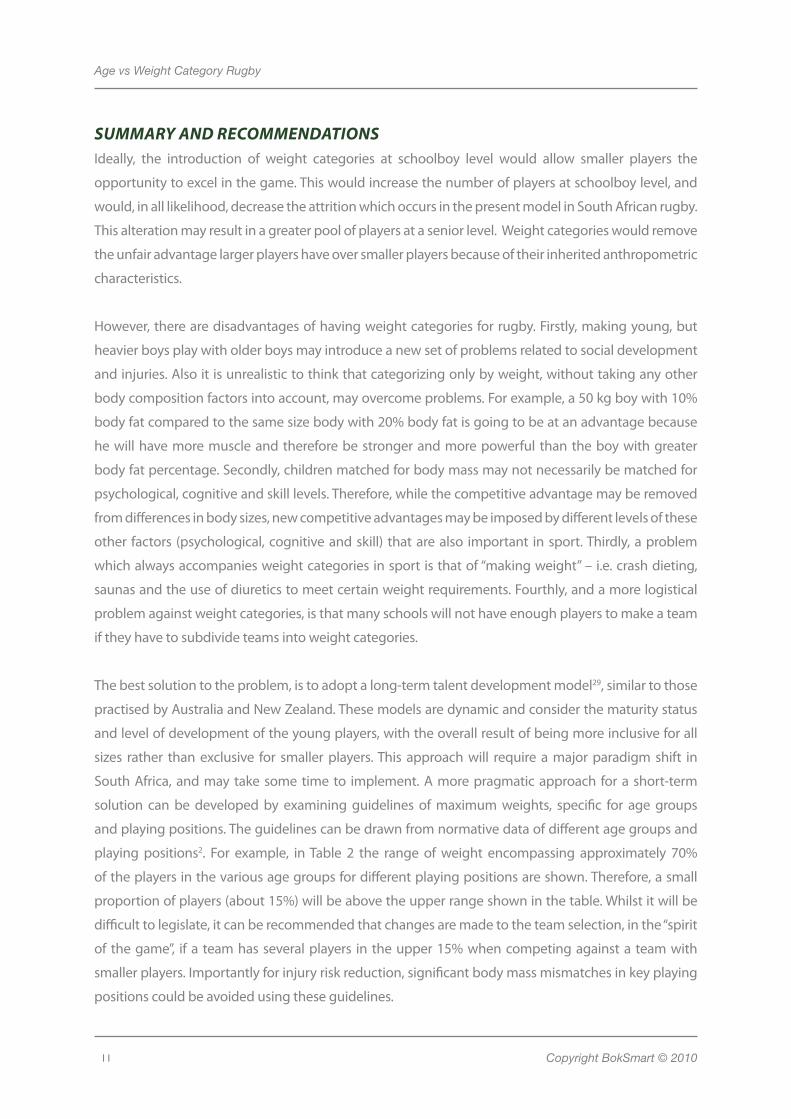
SUMMARY AND RECOMMENDATIONSIdeally, the introduction of weight categories at schoolboy level would allow smaller players the
opportunity to excel in the game. This would increase the number of players at schoolboy level, and
would, in all likelihood, decrease the attrition which occurs in the present model in South African rugby.
This alteration may result in a greater pool of players at a senior level. Weight categories would remove
the unfair advantage larger players have over smaller players because of their inherited anthropometric
characteristics.
However, there are disadvantages of having weight categories for rugby. Firstly, making young, but
heavier boys play with older boys may introduce a new set of problems related to social development
andinjuries.Alsoitisunrealistictothinkthatcategorizingonlybyweight,withouttakinganyother
body composition factors into account, may overcome problems. For example, a 50 kg boy with 10%
body fat compared to the same size body with 20% body fat is going to be at an advantage because
he will have more muscle and therefore be stronger and more powerful than the boy with greater
body fat percentage. Secondly, children matched for body mass may not necessarily be matched for
psychological, cognitive and skill levels. Therefore, while the competitive advantage may be removed
from differences in body sizes, new competitive advantages may be imposed by different levels of these
other factors (psychological, cognitive and skill) that are also important in sport. Thirdly, a problem
which always accompanies weight categories in sport is that of “making weight” – i.e. crash dieting,
saunas and the use of diuretics to meet certain weight requirements. Fourthly, and a more logistical
problem against weight categories, is that many schools will not have enough players to make a team
if they have to subdivide teams into weight categories.
The best solution to the problem, is to adopt a long-term talent development model29, similar to those
practised by Australia and New Zealand. These models are dynamic and consider the maturity status
and level of development of the young players, with the overall result of being more inclusive for all
sizes rather thanexclusive for smallerplayers.This approachwill require amajorparadigmshift in
South Africa, and may take some time to implement. A more pragmatic approach for a short-term
solution can be developed by examining guidelines of maximum weights, specific for age groups
and playing positions. The guidelines can be drawn from normative data of different age groups and
playing positions2. For example, in Table 2 the range of weight encompassing approximately 70%
of the players in the various age groups for different playing positions are shown. Therefore, a small
proportion of players (about 15%) will be above the upper range shown in the table. Whilst it will be
difficult to legislate, it can be recommended that changes are made to the team selection, in the “spirit
of the game”, if a team has several players in the upper 15% when competing against a team with
smallerplayers.Importantlyforinjuryriskreduction,significantbodymassmismatchesinkeyplaying
positions could be avoided using these guidelines.
Copyright BokSmart © 2010
Age vs Weight Category Rugby
12
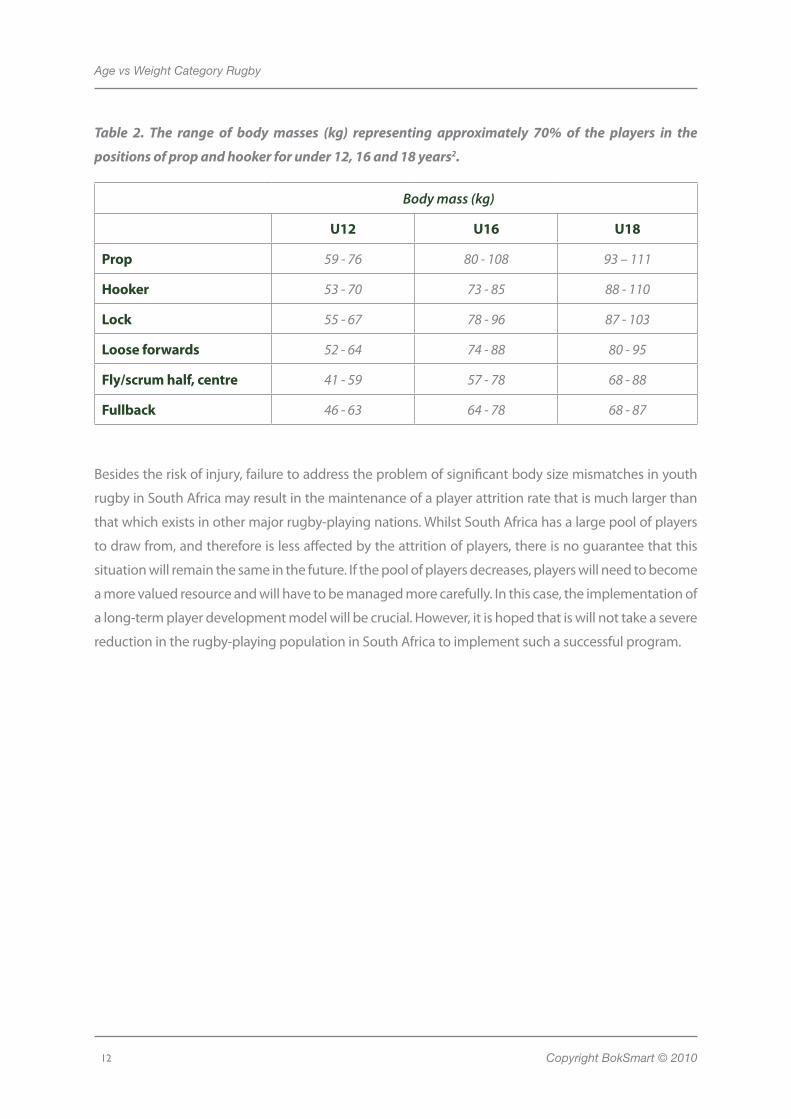
Table 2. The range of body masses (kg) representing approximately 70% of the players in the
positions of prop and hooker for under 12, 16 and 18 years2.
Body mass (kg)
U12 U16 U18
Prop 59 - 76 80 - 108 93 – 111
Hooker 53 - 70 73 - 85 88 - 110
Lock 55 - 67 78 - 96 87 - 103
Loose forwards 52 - 64 74 - 88 80 - 95
Fly/scrum half, centre 41 - 59 57 - 78 68 - 88
Fullback 46 - 63 64 - 78 68 - 87
Besidestheriskofinjury,failuretoaddresstheproblemofsignificantbodysizemismatchesinyouth
rugby in South Africa may result in the maintenance of a player attrition rate that is much larger than
thatwhichexistsinothermajorrugby-playingnations.WhilstSouthAfricahasalargepoolofplayers
to draw from, and therefore is less affected by the attrition of players, there is no guarantee that this
situation will remain the same in the future. If the pool of players decreases, players will need to become
a more valued resource and will have to be managed more carefully. In this case, the implementation of
a long-term player development model will be crucial. However, it is hoped that is will not take a severe
reduction in the rugby-playing population in South Africa to implement such a successful program.
Copyright BokSmart © 2010
Age vs Weight Category Rugby
13
REFERENCES
1) Australian Rugby Union. website [ 2010 Available from: URL:www.rugby.com.au/community_
rugby/playing_rugby/playing_rugby_landing_page,77260.html
2) BokSmart National Rugby safety Programme. website [ 2010 Available from: URL:http://www.
sarugby.co.za/boksmart/Default.aspx?contentId=18962
3) International Rugby Board. website [ 2010 Available from: URL:http://www.irb.com/
4) New Zealand Rugby Union. website [ 2010 Available from: URL:http://www.nzrugby.co.nz/
SmallBlacks/tabid/933/Default.aspx
5) ARMSTRONG, M.E., LAMBERT, M.I., SHARWOOD, K.A., AND LAMBERT, E.V. Obesity and
overweight in South African primary school children -- the Health of the Nation Study. S Afr
Med J 96:439-444. 2006
6) BOGIN, B., AND MACVEAN, R.B. The relationship of socioeconomic status and sex to body size,
skeletal maturation, and cognitive status of Guatemala City schoolchildren. Child Development
54:115-128. 1983
7) BOHU, Y., JULIA, M., BAGATE, C., PEYRIN, J.C., COLONNA, J.P., THOREUX, P., AND PASCAL-
MOUSSELLARD,H.DecliningincidenceofcatastrophiccervicalspineinjuriesinFrenchrugby:
1996-2006. Am J Sports Med 37:319-323. 2009
8) DURANDT, J. personal communication: Craven week study 2002 -2009. South African rugby,
internal report 2010
9) GABBETT,T.J.Incidenceofinjuryinjuniorandseniorrugbyleagueplayers.SportsMed34:849-
859. 2004
10) GLUCKMAN, P.D., AND HANSON, M.A. Evolution, development and timing of puberty. Trends in
Endocrinology & Metabolism 17:7-12. 2006
11) JONES, M.C. Psychological correlates of somatic development. Child Development 36:899-911.
1965
12) KNOWLES, S.B., MARSHALL, S.W., BOWLING, M.J., LOOMIS, D., MILLIKAN, R., YANG, J., AND
MUELLER,F.O.Riskfactorsforinjuryamonghighschoolfootballplayers.Epidemiology20:302-
310. 2009
Copyright BokSmart © 2010
Age vs Weight Category Rugby
14
13) LAMBERT MI, BROWN J, FORBES J. Skeletal development and the associated risk of catastrophic
head,neckandspineinjury.www.Boksmart.com,1-23.2010.
14) LAMBERT, M.I., COLQUHOUN, A., AND DURANDT, J. Body mass of players at Craven week.
unpublished report 2008
15) LEE,A.J.,ANDGARRAWAY,W.M.Epidemiologicalcomparisonofinjuriesinschoolandsenior
club rugby. Br J Sports Med 30:213-217. 1996
16) LEFEVRE, J., BEUNEN, G., STEENS, G., CLAESSENS, A., AND RENSON, R. Motor performance
during adolescence and age thirty as related to age at peak height velocity. Annals of Human
Biology 17:423-435. 1990
17) MALINA, R.M., PENA REYES, M.E., EISENMANN, J.C., HORTA, L., RODRIGUES, J., AND MILLER, R.
Height, mass and skeletal maturity of elite Portuguese soccer players aged 11-16 years. J Sports
Sci 18:685-693. 2000
18) Neville A, Paul G. Crash diet rugby boys. website [ 2010 Available from: URL:http://www.
nzherald.co.nz/news/print.cfm?objectid=10570063
19) NOAKES, T.D., AND DU PLESSIS, M. Rugby without risk. J.L van Schaik Publishers, 1996.
20) PAUS, T., ZIJDENBOS, A., WORSLEY, K., COLLINS, D.L., BLUMENTHAL, J., GIEDD, J.N., RAPOPORT,
J.L., AND EVANS, A.C. Structural maturation of neural pathways in children and adolescents: In
vivo study. Science 283:1908. 1999
21) PIEK, J.P., BAYNAM, G.B., AND BARRETT, N.C. The relationship between fine and gross motor
ability, self-perceptions and self-worth in children and adolescents. Human Movement Science
25:65-75. 2006
22) QUARRIE, K.L., ALSOP, J.C., WALLER, A.E., BIRD, Y.N., MARSHALL, S.W., AND CHALMERS, D.J. The
NewZealand rugby injury andperformanceproject.VI. A prospective cohort study of risk
factorsforinjuryinrugbyunionfootball.BrJSportsMed35:157-166.2001
23) SALTHOUSE,T.A.Independenceofage-relatedinfluencesoncognitiveabilitiesacrossthelife
span. Developmental Psychology 34:851-864. 1998
24) SCHER,A.T.Rugbyinjuriestothecervicalspinalcord.SAfrMedJ56:205.1979
25) SHAFFER, D.R. Developmental Psychology: Childhood and Adolescence (6th ed). Wadsworth,
2002.
Copyright BokSmart © 2010
Age vs Weight Category Rugby
15
26) SILVER,J.R.Injuriesofthespinesustainedduringrugby.BrJSportsMed26:253-258.1992
27) SILVER,J.R.SpinalinjuriesinsportsintheUK.BrJSportsMed27:115-120.1993
28) THOMAS, J.R., AND FRENCH, K.E. Gender differences across age in motor performance: A meta-
analysis. Psychological Bulletin 98:260-282. 1985
29) VAEYENS, R., LENOIR, M., WILLIAMS, A.M., AND PHILIPPAERTS, R.M. Talent identification and
development programmes in sport : current models and future directions. Sports Med 38:703-
714. 2008
30) VAN GENT, M.M., AND SPAMER, E.J. Comparisons of positional groups in terms of anthropometric,
rugby-specific skills, physical and motor components among U 13, U 16, U 18 and U 19 elite
rugby players. Kinesiology 37:50-63. 2005