Embed Size (px)
Citation preview
26004 9 April 2018 5:55 PM Proof 626004 9 April 2018 5:55 PM Proof 6 26004 9 April 2018 5:55 PM Proof 6 26004 9 April 2018 5:55 PM Proof 6
Carrier Commerce: Unlocking the Power of Mobile Partnerships
Boku, Inc. Annual Report and Accounts for the year ended 31 December 2017
Stock code: BOKU
Boku, Inc. Annual Report and Accounts for the year ended 31 Decem
ber 2017
26004 Boku AR2017.indd 3 09/04/2018 17:56:06
26004 9 April 2018 5:55 PM Proof 626004 9 April 2018 5:55 PM Proof 6
Boku is the world’s leading independent Direct CarrierBilling company.
Boku’s technology delivers a low friction way for mobile phone users to buy things and charge them to their phone bill or pre-paid balance. Merchants like Apple, Sony, Spotify, Google, Microsoft, Netflix and Facebook use Boku to acquire more paying users.With more than 5 billion phones in the world, Boku can reach more customers than Facebook or Visa.
Customers
We maintain a corporate website containing a wide range of information of interest to investors and stakeholders: www.boku.com
Boku Inc Annual Report and Accounts for the year ended 31 December 2017 www.boku.com
Strategic Report
26004 Boku AR2017.indd 4 09/04/2018 17:56:06
26004 9 April 2018 5:55 PM Proof 6 26004 9 April 2018 5:55 PM Proof 6
Highlights Contents
Strategic ReportChairman’s Statement 02Market Opportunity 04Our Offering 06Our Business Model 08Our Competitive Advantages 09Our Strategy 10Chief Executive’s Statement 11Chief Financial Officer’s Report 14Our Principal Risks and Uncertainties 18
GovernanceBoard of Directors 20Senior Management 22Corporate Governance Report 23Report Of The Audit Committee 26Directors’ Remuneration Report 28Directors’ Report 34Directors’ Responsibility Statement 36
FinancialsIndependent Auditors’ Report 37Consolidated Statement of Comprehensive Income 42Consolidated Statement of Financial Position 43Consolidated Statement of Changes in Equity 44Consolidated Statement of Cash Flows 45Notes to the Consolidated Financial Information 46
Read more in the Chief Financial Officer’s Report
Read more in the Chief Executive’s Statement
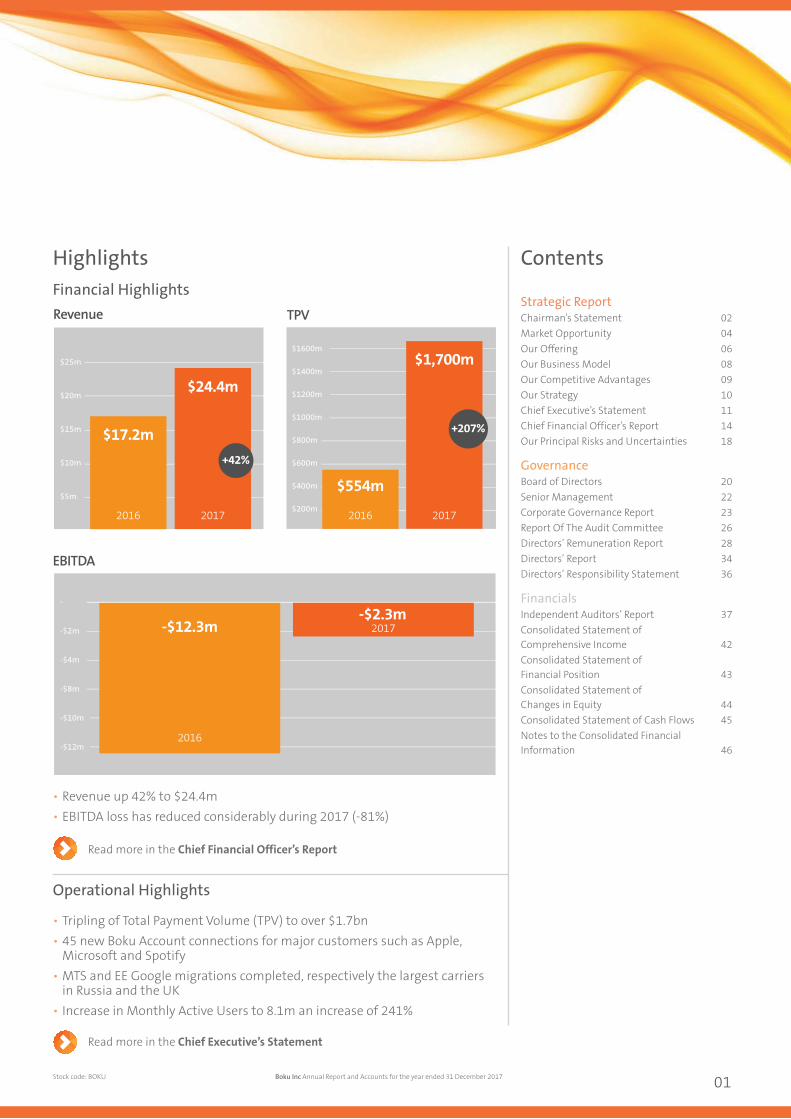
Financial Highlights
Operational Highlights
• Tripling of Total Payment Volume (TPV) to over $1.7bn• 45 new Boku Account connections for major customers such as Apple,
Microsoft and Spotify• MTS and EE Google migrations completed, respectively the largest carriers
in Russia and the UK• Increase in Monthly Active Users to 8.1m an increase of 241%
• Revenue up 42% to $24.4m• EBITDA loss has reduced considerably during 2017 (-81%)
$1600m
$1400m
$1200m
$1000m
$800m
$600m
$400m
$200m2016 2017
EBITDA
Revenue TPV
2016 2017
$25m
$20m
$15m
$10m
$5m
+42%
+207%
-
-$2m
-$4m
-$8m
-$10m
-$12m
2017
2016
$17.2m
$24.4m
$554m
$1,700m
-$12.3m-$2.3m
Stock code: BOKU Boku Inc Annual Report and Accounts for the year ended 31 December 2017 01
26004 Boku AR2017.indd 1 09/04/2018 17:56:08
26004 9 April 2018 5:55 PM Proof 6
Chairman’s Statement
Boku has always been a dynamic company, one that has had to adapt to a rapidly changing market environment and develop and deliver products that our customers demand. Four years ago, the Company was primarily engaged in enabling providers of PC games to monetise their users, but, with the growth of app stores, casual gamers switched their attention to mobile devices. The Company needed to retool and rebuild its products to make them appropriate for this new environment. This was a substantial change and required significant investment, which has now led to Boku’s emergence as the largest company of its type internationally, serving many of the world’s largest digital merchants and is successfully allowing them to acquire new paying users globally.
The Executive Team at Boku implemented a strategy which involved generating very considerable growth in the number and value of payments handled. Total Payment Volume increased threefold to more than $1.7 billion in 2017. This level of increase brings the potential for scaling challenges, but the management team have proved equal to the task. The extra processing was handled with lower overall costs.
From a corporate perspective, 2017 saw Boku achieve two important milestones:
First, the Company delivered a substantial increase in revenues off a lower cost base and secondly the Company changed from being a private company to being a public one. Both of these events are linked and significant. Without the materially improved financials, Boku would not have been able to complete the IPO nor have received such a positive reaction from investors. I would like to take this opportunity to welcome our new Shareholders in the Company.
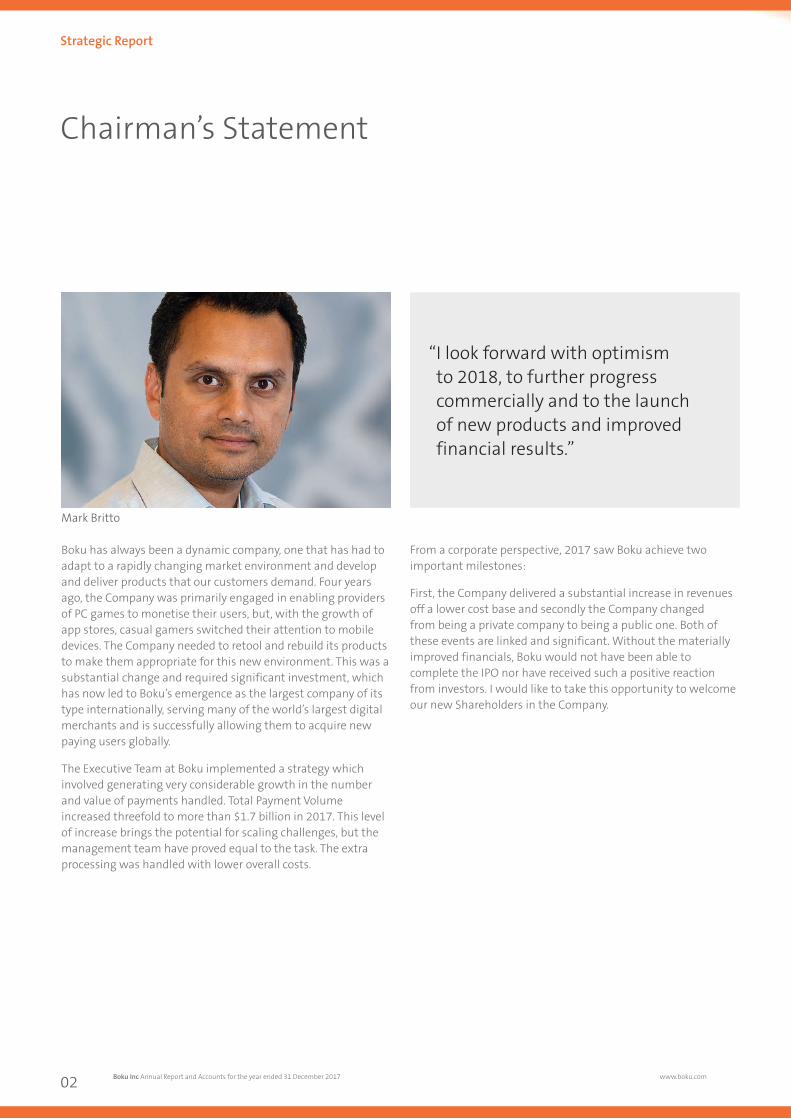
Mark Britto
“ I look forward with optimism to 2018, to further progress commercially and to the launch of new products and improved financial results.”
Boku Inc Annual Report and Accounts for the year ended 31 December 2017 www.boku.com02
Strategic Report
26004 Boku AR2017.indd 2 09/04/2018 17:56:08
26004 9 April 2018 5:55 PM Proof 6 26004 9 April 2018 5:55 PM Proof 6
The IPO has led to a change in the composition of our Board. Several Directors who have worked with the Company to help its development over many years have moved to take on new challenges and opportunities, I wish to place on record my thanks to David Weiden, Kevin Harvey and Paul McGuire for their service. In addition, I would like to welcome Keith Butcher to the Board. He has a fine track record in the public markets having been CFO of both Datacash and Optimal Payments (now Paysafe). His experience will be invaluable to the Board and we look forward to him assuming the Chairmanship of the Audit Committee.
Notwithstanding the progress that the Company has made in the past year, there are always new mountains to climb, new territories to conquer. Boku will continue to invest in new opportunities leveraging its core capability in connecting together the Mobile Network Operators of the world who, collectively, reach more than 5 billion people with mobile phones. The Boku Acquire product that supports bundling was supported by integrating into the carriers point of sale and provisioning systems and we believe that there is still considerable value to unlock from our network. The funds raised in the IPO will provide us with the resources to both optimize our existing business and to invest in new capabilities.
I look forward with optimism to 2018 to further progress commercially and in the launch of new products and improved financial results.
Mark BrittoNon-Executive Chairman 9 April 2018
Stock code: BOKU Boku Inc Annual Report and Accounts for the year ended 31 December 2017 03
26004 Boku AR2017.indd 3 09/04/2018 17:56:09
26004 9 April 2018 5:55 PM Proof 6
Market Opportunity
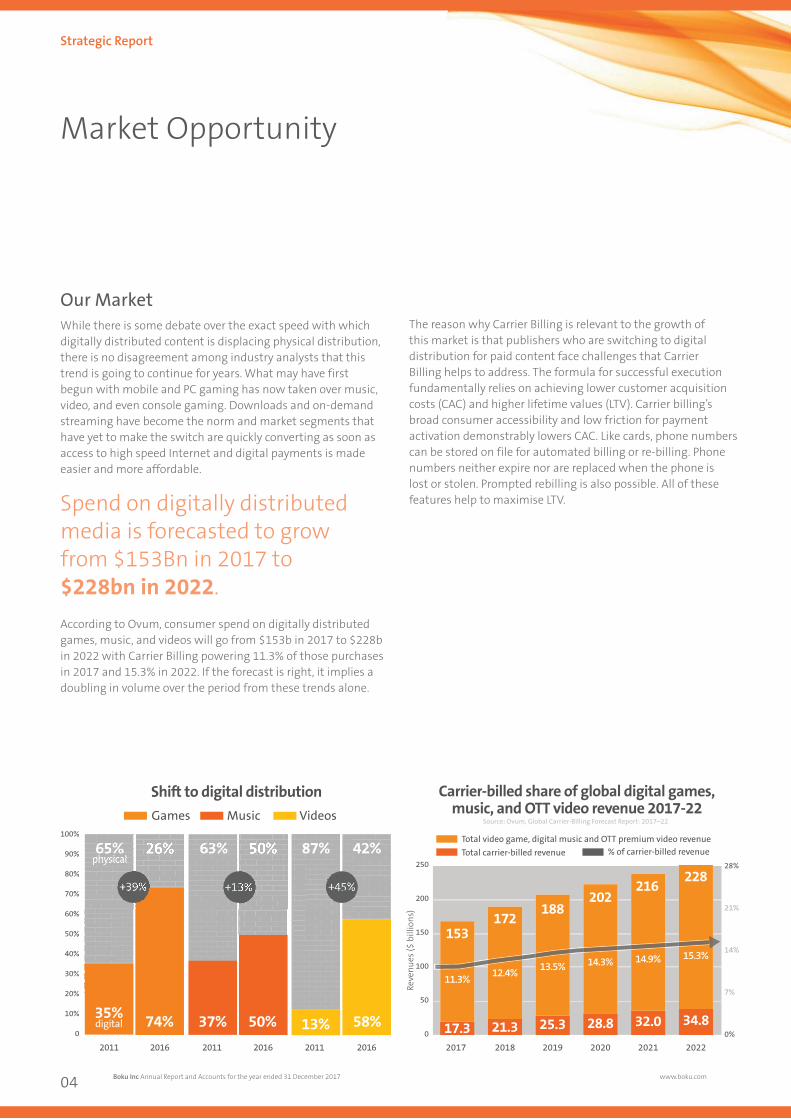
Our MarketWhile there is some debate over the exact speed with which digitally distributed content is displacing physical distribution, there is no disagreement among industry analysts that this trend is going to continue for years. What may have first begun with mobile and PC gaming has now taken over music, video, and even console gaming. Downloads and on-demand streaming have become the norm and market segments that have yet to make the switch are quickly converting as soon as access to high speed Internet and digital payments is made easier and more affordable.
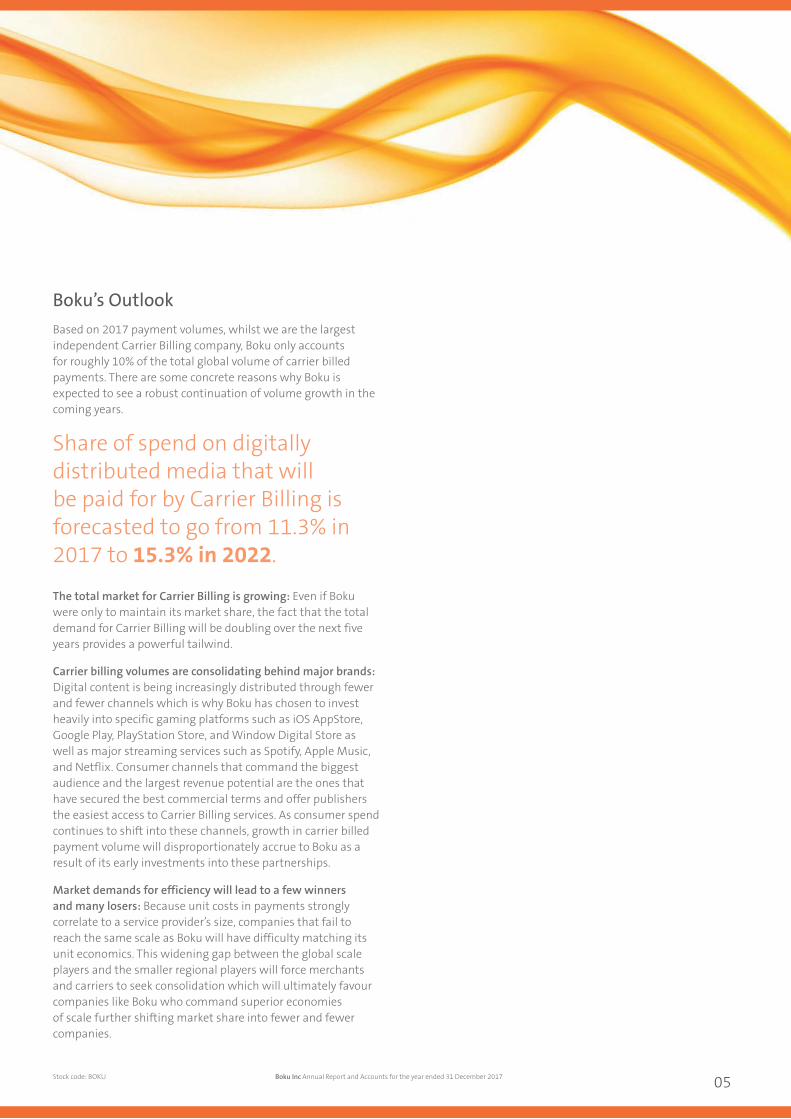
According to Ovum, consumer spend on digitally distributed games, music, and videos will go from $153b in 2017 to $228b in 2022 with Carrier Billing powering 11.3% of those purchases in 2017 and 15.3% in 2022. If the forecast is right, it implies a doubling in volume over the period from these trends alone.
The reason why Carrier Billing is relevant to the growth of this market is that publishers who are switching to digital distribution for paid content face challenges that Carrier Billing helps to address. The formula for successful execution fundamentally relies on achieving lower customer acquisition costs (CAC) and higher lifetime values (LTV). Carrier billing’s broad consumer accessibility and low friction for payment activation demonstrably lowers CAC. Like cards, phone numbers can be stored on file for automated billing or re-billing. Phone numbers neither expire nor are replaced when the phone is lost or stolen. Prompted rebilling is also possible. All of these features help to maximise LTV.Spend on digitally distributed
media is forecasted to grow from $153Bn in 2017 to $228bn in 2022.
Total video game, digital music and OTT premium video revenueTotal carrier-billed revenue % of carrier-billed revenue
100%
90%
80%
70%
60%
50%
40%
30%
20%
10%
0
65%physical
35%digital
26%
74%
63% 50%
50%
87%
13%
42%
58%2011 2016 2011 2016 2011 2016
Shift to digital distribution
250
200
150
100
50
0
2017 2018 2019 2020 2021 2022
28%
21%
14%
7%
0%
Carrier-billed share of global digital games, music, and OTT video revenue 2017-22
34.8
228
32.0
216
28.8
202
25.3
188
21.3
172
17.3
153
Reve
nues
($ b
illio
ns)
Source: Ovum, Global Carrier-Billing Forecast Report: 2017–22
+45%+13%+39%
37%
Games Music Videos
15.3%14.9%14.3%13.5%12.4%11.3%
Boku Inc Annual Report and Accounts for the year ended 31 December 2017 www.boku.com04
Strategic Report
26004 Boku AR2017.indd 4 09/04/2018 17:56:10
26004 9 April 2018 5:55 PM Proof 6 26004 9 April 2018 5:55 PM Proof 6
Boku’s Outlook Based on 2017 payment volumes, whilst we are the largest independent Carrier Billing company, Boku only accounts for roughly 10% of the total global volume of carrier billed payments. There are some concrete reasons why Boku is expected to see a robust continuation of volume growth in the coming years.
The total market for Carrier Billing is growing: Even if Boku were only to maintain its market share, the fact that the total demand for Carrier Billing will be doubling over the next five years provides a powerful tailwind.
Carrier billing volumes are consolidating behind major brands: Digital content is being increasingly distributed through fewer and fewer channels which is why Boku has chosen to invest heavily into specific gaming platforms such as iOS AppStore, Google Play, PlayStation Store, and Window Digital Store as well as major streaming services such as Spotify, Apple Music, and Netflix. Consumer channels that command the biggest audience and the largest revenue potential are the ones that have secured the best commercial terms and offer publishers the easiest access to Carrier Billing services. As consumer spend continues to shift into these channels, growth in carrier billed payment volume will disproportionately accrue to Boku as a result of its early investments into these partnerships.
Market demands for efficiency will lead to a few winners and many losers: Because unit costs in payments strongly correlate to a service provider’s size, companies that fail to reach the same scale as Boku will have difficulty matching its unit economics. This widening gap between the global scale players and the smaller regional players will force merchants and carriers to seek consolidation which will ultimately favour companies like Boku who command superior economies of scale further shifting market share into fewer and fewer companies.
Billi
ons
(USD
)
Share of spend on digitally distributed media that will be paid for by Carrier Billing is forecasted to go from 11.3% in 2017 to 15.3% in 2022.
Stock code: BOKU Boku Inc Annual Report and Accounts for the year ended 31 December 2017 05
26004 Boku AR2017.indd 5 09/04/2018 17:56:10
26004 9 April 2018 5:55 PM Proof 6
Our Offering
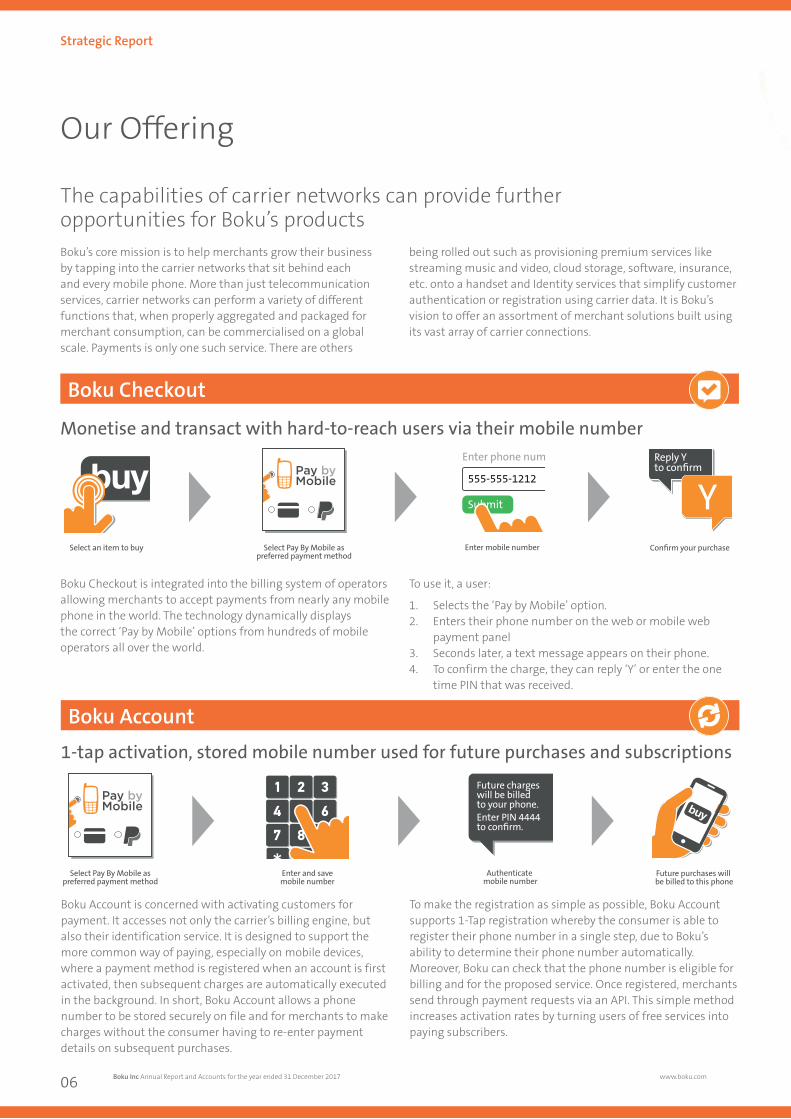
The capabilities of carrier networks can provide further opportunities for Boku’s products
Monetise and transact with hard-to-reach users via their mobile number
Select an item to buy Select Pay By Mobile aspreferred payment method
Reply Y to con�rm
YCon�rm your purchase
Enter phone number
Submit
555-555-1212
Enter mobile number
Select Pay By Mobile aspreferred payment method
*Enter and savemobile number
Future purchases will be billed to this phone
Future chargeswill be billedto your phone.Enter PIN 4444 to con�rm.
Authenticate mobile number
Sign up for anexclusive offerfrom My-telco!
GO!
From: my-telco.comTo: Customer
Discovery via telco promo
Start yourexclusive trial today!
Start!
https://www.my-telco.com
Service is added to plan via telco website
my-telco 31£
Subsequent charges incurredare billed by telco
Offer activation viapurchased service app
Thanks for signing up for
through My-telco.
Welcome!
APP
Boku Checkout
Boku Checkout is integrated into the billing system of operators allowing merchants to accept payments from nearly any mobile phone in the world. The technology dynamically displays the correct ‘Pay by Mobile’ options from hundreds of mobile operators all over the world.
To use it, a user:
1. Selects the ‘Pay by Mobile’ option.2. Enters their phone number on the web or mobile web
payment panel3. Seconds later, a text message appears on their phone.4. To confirm the charge, they can reply ‘Y’ or enter the one
time PIN that was received.
1-tap activation, stored mobile number used for future purchases and subscriptions
Boku Account
Boku Account is concerned with activating customers for payment. It accesses not only the carrier’s billing engine, but also their identification service. It is designed to support the more common way of paying, especially on mobile devices, where a payment method is registered when an account is first activated, then subsequent charges are automatically executed in the background. In short, Boku Account allows a phone number to be stored securely on file and for merchants to make charges without the consumer having to re-enter payment details on subsequent purchases.
To make the registration as simple as possible, Boku Account supports 1-Tap registration whereby the consumer is able to register their phone number in a single step, due to Boku’s ability to determine their phone number automatically. Moreover, Boku can check that the phone number is eligible for billing and for the proposed service. Once registered, merchants send through payment requests via an API. This simple method increases activation rates by turning users of free services into paying subscribers.
Select an item to buy Select Pay By Mobile aspreferred payment method
Reply Y to con�rm
YCon�rm your purchase
Enter phone number
Submit
555-555-1212
Enter mobile number
Select Pay By Mobile aspreferred payment method
*Enter and savemobile number
Future purchases will be billed to this phone
Future chargeswill be billedto your phone.Enter PIN 4444 to con�rm.
Authenticate mobile number
Sign up for anexclusive offerfrom My-telco!
GO!
From: my-telco.comTo: Customer
Discovery via telco promo
Start yourexclusive trial today!
Start!
https://www.my-telco.com
Service is added to plan via telco website
my-telco 31£
Subsequent charges incurredare billed by telco
Offer activation viapurchased service app
Thanks for signing up for
through My-telco.
Welcome!
APP
Boku’s core mission is to help merchants grow their business by tapping into the carrier networks that sit behind each and every mobile phone. More than just telecommunication services, carrier networks can perform a variety of different functions that, when properly aggregated and packaged for merchant consumption, can be commercialised on a global scale. Payments is only one such service. There are others
being rolled out such as provisioning premium services like streaming music and video, cloud storage, software, insurance, etc. onto a handset and Identity services that simplify customer authentication or registration using carrier data. It is Boku’s vision to offer an assortment of merchant solutions built using its vast array of carrier connections.
Boku Inc Annual Report and Accounts for the year ended 31 December 2017 www.boku.com06
Strategic Report
26004 Boku AR2017.indd 6 09/04/2018 17:56:11
26004 9 April 2018 5:55 PM Proof 6 26004 9 April 2018 5:55 PM Proof 6
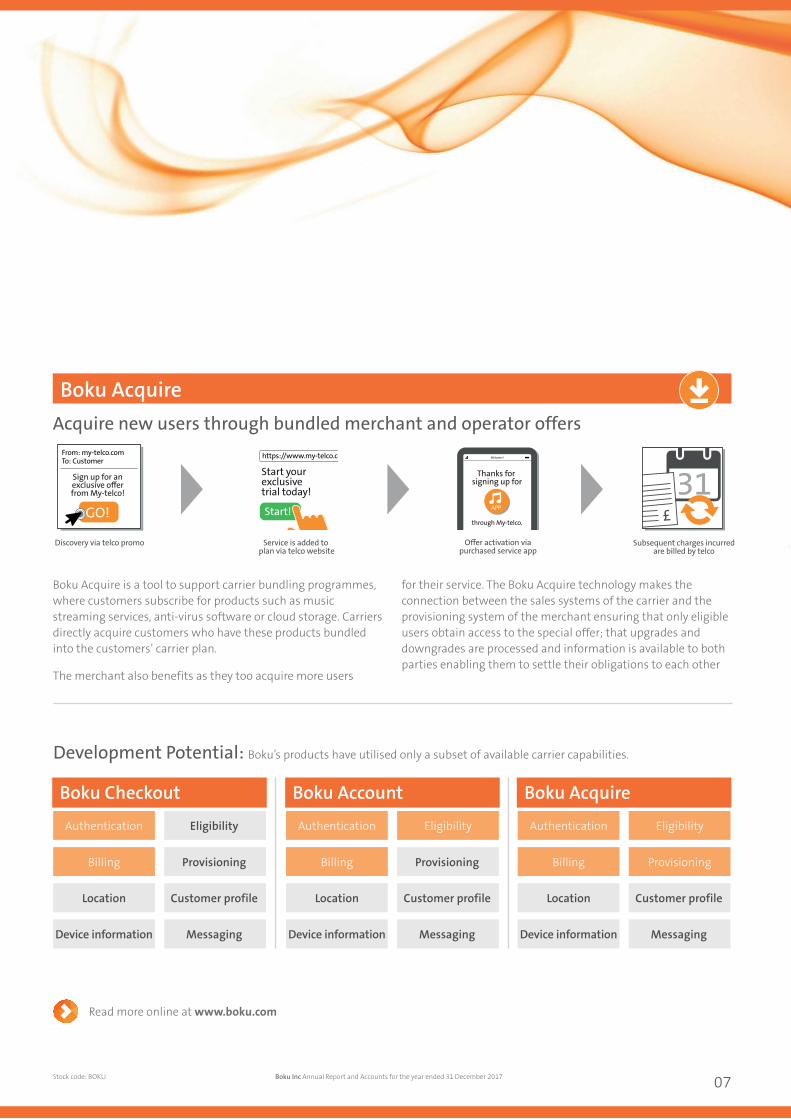
Development Potential: Boku’s products have utilised only a subset of available carrier capabilities.
Boku Checkout Boku Account Boku Acquire
Authentication Eligibility Authentication AuthenticationEligibility Eligibility
Billing Provisioning
Location Customer profile Location LocationCustomer profile Customer profile
Device information Messaging Device information Device informationMessaging Messaging
Billing Provisioning Billing Provisioning
Read more online at www.boku.com
Select an item to buy Select Pay By Mobile aspreferred payment method
Reply Y to con�rm
YCon�rm your purchase
Enter phone number
Submit
555-555-1212
Enter mobile number
Select Pay By Mobile aspreferred payment method
*Enter and savemobile number
Future purchases will be billed to this phone
Future chargeswill be billedto your phone.Enter PIN 4444 to con�rm.
Authenticate mobile number
Sign up for anexclusive offerfrom My-telco!
GO!
From: my-telco.comTo: Customer
Discovery via telco promo
Start yourexclusive trial today!
Start!
https://www.my-telco.com
Service is added to plan via telco website
my-telco 31£
Subsequent charges incurredare billed by telco
Offer activation viapurchased service app
Thanks for signing up for
through My-telco.
Welcome!
APP
Acquire new users through bundled merchant and operator offers
Boku Acquire
Boku Acquire is a tool to support carrier bundling programmes, where customers subscribe for products such as music streaming services, anti-virus software or cloud storage. Carriers directly acquire customers who have these products bundled into the customers’ carrier plan.
The merchant also benefits as they too acquire more users
for their service. The Boku Acquire technology makes the connection between the sales systems of the carrier and the provisioning system of the merchant ensuring that only eligible users obtain access to the special offer; that upgrades and downgrades are processed and information is available to both parties enabling them to settle their obligations to each other
Select an item to buy Select Pay By Mobile aspreferred payment method
Reply Y to con�rm
YCon�rm your purchase
Enter phone number
Submit
555-555-1212
Enter mobile number
Select Pay By Mobile aspreferred payment method
*Enter and savemobile number
Future purchases will be billed to this phone
Future chargeswill be billedto your phone.Enter PIN 4444 to con�rm.
Authenticate mobile number
Sign up for anexclusive offerfrom My-telco!
GO!
From: my-telco.comTo: Customer
Discovery via telco promo
Start yourexclusive trial today!
Start!
https://www.my-telco.com
Service is added to plan via telco website
my-telco 31£
Subsequent charges incurredare billed by telco
Offer activation viapurchased service app
Thanks for signing up for
through My-telco.
Welcome!
APP
Stock code: BOKU Boku Inc Annual Report and Accounts for the year ended 31 December 2017 07
26004 Boku AR2017.indd 7 09/04/2018 17:56:12
26004 9 April 2018 5:55 PM Proof 6
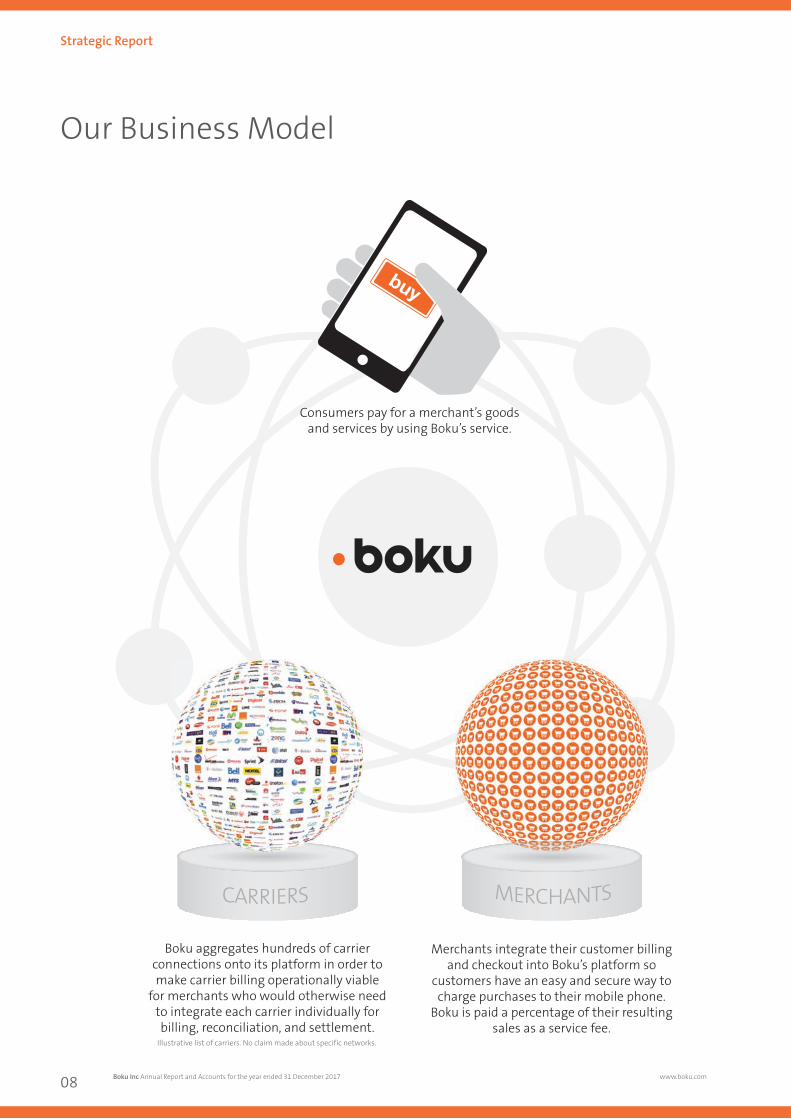
Our Business Model
Boku aggregates hundreds of carrier connections onto its platform in order to make carrier billing operationally viable
for merchants who would otherwise need to integrate each carrier individually for billing, reconciliation, and settlement.
Merchants integrate their customer billing and checkout into Boku’s platform so
customers have an easy and secure way to charge purchases to their mobile phone.
Boku is paid a percentage of their resulting sales as a service fee.
Consumers pay for a merchant’s goods and services by using Boku’s service.
Illustrative list of carriers. No claim made about specific networks.
Boku Inc Annual Report and Accounts for the year ended 31 December 2017 www.boku.com08
Strategic Report
26004 Boku AR2017.indd 8 09/04/2018 17:56:13
26004 9 April 2018 5:55 PM Proof 6 26004 9 April 2018 5:55 PM Proof 6
Our Competitive Advantages
PlatformBoku has invested in its systems and platform to ensure a high performance, high resilience, high capacity system operating in active-active mode. During peak hours, the platform currently processes enough transactions to handle over $25B/yr in payment volume. Furthermore, load testing has demonstrated the platform can exceed $100B/yr in payment volume without any degradation in performance.
Skilled peopleBoku has an experienced management team, with expertise in web, mobile, and financial services. With a global technical staff of 80 employees specializing in mobile operator integrations, no company in the world can onboard and support as many carriers as Boku.
Intellectual property portfolioThe Group has a healthy IP portfolio with 73 patents granted and 52 pending.
Relationships with merchantsBoku has relationships with many of the key digital platforms. Although contractual exclusivity is not common in the payments business, Apple, Sony, Netflix, and Facebook only process Carrier Billing transactions with Boku and Boku is one of two providers for Spotify and Microsoft. Boku is the sole provider of Carrier Billing services for most of its other merchants.
Relationships with carriersBoku’s relationships with carriers is unique because Boku typically acts as a key channel to their various tier 1 merchants where it is not uncommon for most of a carriers’ billing volume to come through Boku. The scale of Boku’s reach means carriers can enjoy a unique level of global monitoring and anomaly detection, superior business intelligence, and unmatched unit economics.
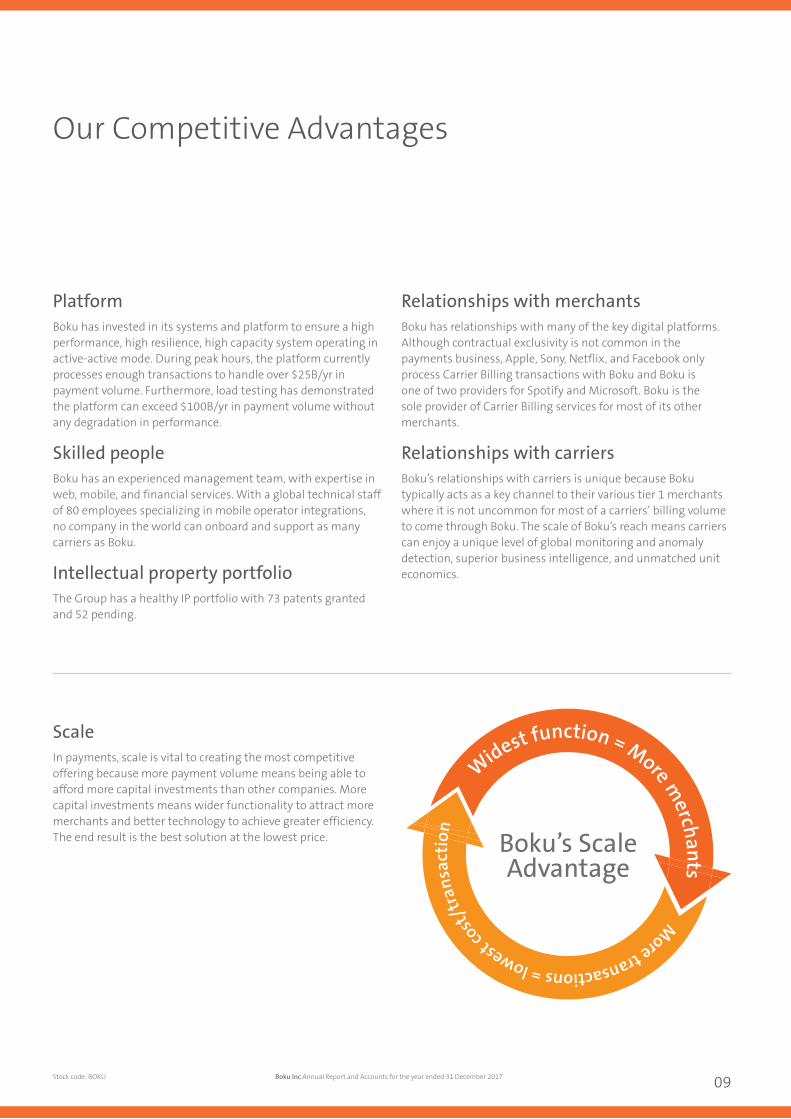
ScaleIn payments, scale is vital to creating the most competitive offering because more payment volume means being able to afford more capital investments than other companies. More capital investments means wider functionality to attract more merchants and better technology to achieve greater efficiency. The end result is the best solution at the lowest price.
Widest function = More merchants
M
ore transactions = lowest cost
/tra
nsac
tion
Boku’s Scale Advantage
Stock code: BOKU Boku Inc Annual Report and Accounts for the year ended 31 December 2017 09
26004 Boku AR2017.indd 9 09/04/2018 17:56:13
26004 9 April 2018 5:55 PM Proof 6
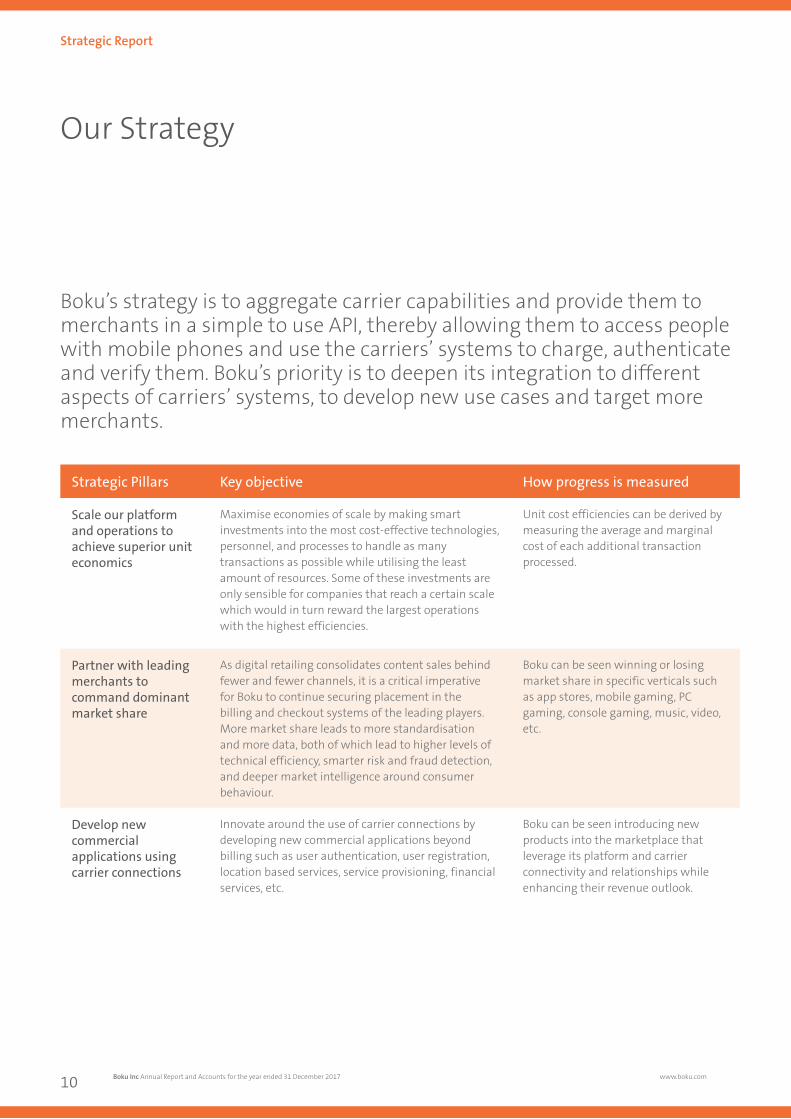
Our Strategy
Boku’s strategy is to aggregate carrier capabilities and provide them to merchants in a simple to use API, thereby allowing them to access people with mobile phones and use the carriers’ systems to charge, authenticate and verify them. Boku’s priority is to deepen its integration to different aspects of carriers’ systems, to develop new use cases and target more merchants.
Strategic Pillars Key objective How progress is measured
Scale our platform and operations to achieve superior unit economics
Maximise economies of scale by making smart investments into the most cost-effective technologies, personnel, and processes to handle as many transactions as possible while utilising the least amount of resources. Some of these investments are only sensible for companies that reach a certain scale which would in turn reward the largest operations with the highest efficiencies.
Unit cost efficiencies can be derived by measuring the average and marginal cost of each additional transaction processed.
Partner with leading merchants to command dominant market share
As digital retailing consolidates content sales behind fewer and fewer channels, it is a critical imperative for Boku to continue securing placement in the billing and checkout systems of the leading players. More market share leads to more standardisation and more data, both of which lead to higher levels of technical efficiency, smarter risk and fraud detection, and deeper market intelligence around consumer behaviour.
Boku can be seen winning or losing market share in specific verticals such as app stores, mobile gaming, PC gaming, console gaming, music, video, etc.
Develop new commercial applications using carrier connections
Innovate around the use of carrier connections by developing new commercial applications beyond billing such as user authentication, user registration, location based services, service provisioning, financial services, etc.
Boku can be seen introducing new products into the marketplace that leverage its platform and carrier connectivity and relationships while enhancing their revenue outlook.
Boku Inc Annual Report and Accounts for the year ended 31 December 2017 www.boku.com10
Strategic Report
26004 Boku AR2017.indd 10 09/04/2018 17:56:13

26004 9 April 2018 5:55 PM Proof 6 26004 9 April 2018 5:55 PM Proof 6
Chief Executive’s Statement
Business descriptionBoku is a Carrier Commerce company. By connecting to the Boku platform, our merchants, who include most of the world’s biggest digital companies, enable their users with a mobile phone, to buy their products and services and charge them to their bills or pre-paid balances. Boku operates a worldwide network of connections to Mobile Network Operators and is developing its reach and quality all the time.
On the surface, Boku operates as a payment company but, practically speaking, the job our merchants hire us to do is acquire new paying users. It turns out that paying for stuff with your phone bill or prepaid balance is a great way to do that. More people have phones than bank accounts and it’s just more convenient to pay for something on your phone with your phone number – especially when our technology can discover it automatically. Millions of people all around the world are now using Boku’s technology to pay and the number of monthly active users has more doubled over the course of 2017 to over 8 million.
For our merchants, we offer a single connection to many network operators around the world. It’s a tough job to build such a global network as connections are not standardised. We see considerable potential to exploit this unique asset, touching as it does more than 5bn users (essentially the world’s adult population) in new ways to create new products that add value at other parts of the e-commerce value chain.
In the here and now, today’s business is built on the market for digitally distributed content – a market valued at $153bn in 2017 and growing strongly. It comprises games, music and videos whether distributed directly, or through mobile app stores. Boku processes transactions for almost all of the big players in this expanding industry, including Apple, Facebook, Netflix, Spotify, Blizzard Activision, Sony and Tencent/Riot Games, mostly as their sole or main provider.
We make money by taking a small cut of the transaction value that we process. Broadly speaking, our costs are stable, each extra transaction costs a minimal amount to process so, once the costs of the platform have been covered, extra revenue drops straight through to the bottom line.
Jon Prideaux
“ We’ve grown considerably over the last year and have a plan in implementation to continue growing into the future, without materially impacting our cost base.”
Stock code: BOKU Boku Inc Annual Report and Accounts for the year ended 31 December 2017 11
26004 Boku AR2017.indd 11 09/04/2018 17:56:13
26004 9 April 2018 5:55 PM Proof 6
Chief Executive’s Statement
StrategySize is important. In payments it really is. Scale allows you to simultaneously carry the cost base that offers the widest array of services whilst also having the lowest unit cost. Additionally, in a world of big data, scale allows you to do a better job of optimising your product: big data requires big datasets. Scale also allows you to work together with carrier partners who can see better returns on investment for them from upgrading their connections to Boku compared with a smaller operator.
Boku has always sought to be the scale player.
Our strategy is not to be geographically broad, to plant more flags in ever more obscure parts of the map, but rather to work with the merchants that present the biggest opportunities in the biggest possible markets. We go to these places because, as Willie Sutton, the Depression era criminal, when asked why he robbed banks, said “That’s where the money is”. Big companies in big markets generate more revenue than small merchants in peripheral ones. It is a common misconception that Carrier Billing is a solution for emerging markets: Boku has demonstrated that the advanced economies of Europe, Asia and the Middle East offer fertile territory for our customer acquisition method and payment mechanism.
Our strategy also seeks to exploit the scale achieved by our partners, the Mobile Network Operators. Collectively they connect to more than 5 Billion consumers – potentially the world’s largest connected community; bigger than social networks like Facebook or other payment networks like Visa. Through those connections they can present a distinctive range of capabilities. Mobile Network Operators know customer behaviour, the devices they carry, their location and their transactions which is not available from any other source. The problem is that hitherto, those capabilities have been only accessible one carrier at a time, their collective value diminished by “Balkanisation”. By acting as a middleware player, providing the connective tissue, Boku can unlock this value and develop new services reaching beyond the carriers’ billing capabilities to address other parts of the ecommerce value chain.
Whilst digitally distributed content at $153 billion is a material market, it represents by most estimates, a mere 5% of global e-commerce, it is our objective to add value to registration, verification and location based services across all types of merchant and not just at the time of the transaction.
Highlights From 20172017 has been a significant year for Boku. We achieved growth in our financial and non-financial KPIs. Total Payment Volume (TPV) increased by more than 200% to $1.7 billion and monthly active users more than doubled to over 8 million users, making us the world’s largest independent Carrier Billing company.
We also rolled out 45 Boku Account connections in 2017 for customers like Apple, Spotify, Microsoft and for Google traffic, a 67% increase on 2016’s number; and increased productivity allowed us to halve the cost of each deployment. These extra connections drove our growth, as did the application of our Boku Optimise technology which tunes the operation of app stores and Merchant Connections so as to yield the maximum amount of revenue from each connection, without breaching regulatory limits or exposing carriers to unnecessary risks of bad debt.
Boku Optimise was a key factor in a couple of notable wins of 2017. Two more Mobile Network Operators looked at the alternatives and decided to switch the connection for their Google traffic over to Boku. MTS, with more than 78m subscribers is the largest mobile network operator in Europe, and EE with more than 30 million connections is the UK’s biggest network and Europe’s biggest 4G network. They join amongst others, O2 in Germany and KPN in the Netherlands, in switching to Boku to process their Google traffic. Both networks have benefited from Boku Optimise technology which has boosted their traffic by double digit amounts in comparison to their previous providers. Uniquely, Boku can help optimise traffic by having access to material multi-merchant datasets.
We were also pleased to start the rollout of Blizzard Activision, the Western world’s largest interactive entertainment company in 2017 and also to take our newest product Boku Acquire into new countries including South Korea, Portugal, Israel and Mexico.
Boku Inc Annual Report and Accounts for the year ended 31 December 2017 www.boku.com12
Strategic Report
26004 Boku AR2017.indd 12 09/04/2018 17:56:13
26004 9 April 2018 5:55 PM Proof 6 26004 9 April 2018 5:55 PM Proof 6
OperationsNo one gives you credit for running your system. It’s table stakes in a business like ours, like keeping the lights on or the water coming out of the taps, people only notice when things are going wrong. That doesn’t mean that it’s simple or straightforward. At peak, transactions come flooding into the Boku system at approaching 200 transactions per second. The number of transactions that we handle has nearly tripled in the last year.
Boku has about 150 employees based all around the world, the majority of whom work on our technology. Our team has developed a system with in-built redundancy, active/active capability and with the ability to handle both today’s volumes and future proofed to handle the growth anticipated for the coming years. The system has been tested to more than 400 transactions per second without any material impact on latency measures.
Together with their non-technical colleagues, Boku’s operations in San Francisco, Mumbai, London, , Munich, Dusseldorf, Paris, Riga, Sao Paulo, Milan, Tokyo, Beijing, Taipei and Singapore provide a full service offering to our carrier partners and merchant customers wherever they need it and provide 24x7 support from our Network Operations Centre.
Strategy for growthWe’ve grown considerably over the last year and have a plan in implementation to continue growing into the future, without materially impacting our cost base. Growth, for Boku, in our core business comes from three fundamental sources:
• Growth from new deployments: most of our large customers have a considerable pipeline – collectively more than 100 - of new connections that they would like to activate. By connecting to more mobile phone networks, users who never had the chance to pay by Boku before are now able to do so.
• Growth from maturity within connection: but that’s not all, once a Mobile Network Operator goes live, its subscribers have the opportunity, but not necessarily the reason to use Boku. That takes time. People discover us gradually as a by-product of their normal behaviour. Perhaps it comes when they set up a new device or when they try to pay for something within an app store or subscribe to a streaming music service. Then they’re presented with the opportunity to buy and charge to their phone bill or prepaid balance. This
phenomenon means that once a new connection is launched there is a maturity cycle that lasts for years before the total number of users on a particular connection stabilises. Put simply, last year’s connections will continue to grow this year.
• Growth in the underlying market: the market for digitally distributed content is growing around 10% Compound Annual Growth Rate (CAGR) on a worldwide basis, which provides a strong wind at our backs even in mature deployments.
Boku is not content though with simply driving growth through its carrier network from billing applications, as mentioned above we’re keen to launch new products in the areas of registration, verification and location, exploiting our core competence of connecting at scale to many carriers. At the time of our IPO we said that we would use some of the funds that we raised make investments in this area, with a view to making revenues in the 2019/2020 timeframe.
Boku has launched a new division, Boku Labs, which is developing these opportunities and I hope to make further announcements throughout the year, as we come closer to launch which may be through either organic or inorganic routes.
Current Trading and Outlook2017 has been a year of extraordinary growth for Boku and I look forward to 2018 with considerable optimism. All our forward indicators are on green and the graphs are moving up and to the right. We are confident that we will meet market expectations for revenue and continue being EBITDA positive. With revenue growth, a stable cost base and cost of sale and sufficient cash to finance our working capital and investment needs, we are confident that the Company will continue to make considerable progress in 2018.
I wish to thank our new shareholders, customers and carrier partners for their support and confidence and our employees for the extraordinary job that they do every day.
Jon PrideauxChief Executive Officer 9 April 2018
Stock code: BOKU Boku Inc Annual Report and Accounts for the year ended 31 December 2017 13
26004 Boku AR2017.indd 13 09/04/2018 17:56:14
26004 9 April 2018 5:55 PM Proof 6
Chief Financial Officer’s Report
Stuart Neal
“ The Company is now in a favourable position to build further value with growing revenues, positive monthly EBITDA and rapidly approaching free-cashflow generation.”
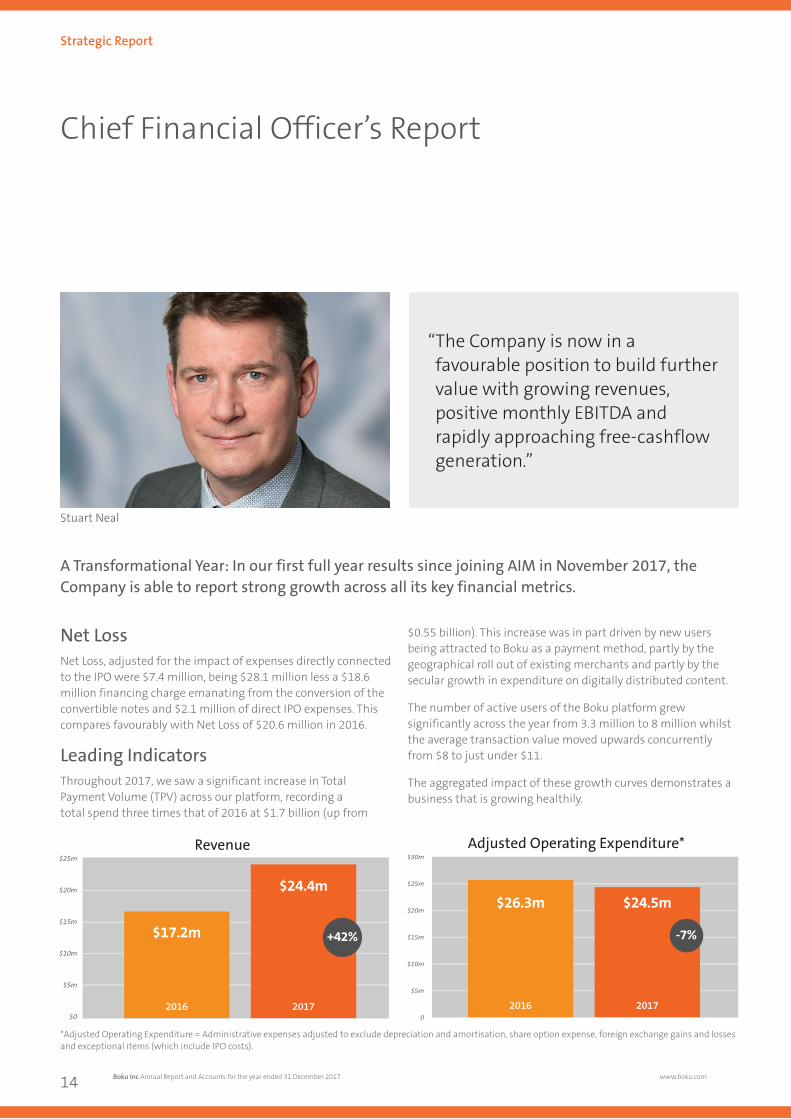
A Transformational Year: In our first full year results since joining AIM in November 2017, the Company is able to report strong growth across all its key financial metrics.
Net Loss Net Loss, adjusted for the impact of expenses directly connected to the IPO were $7.4 million, being $28.1 million less a $18.6 million financing charge emanating from the conversion of the convertible notes and $2.1 million of direct IPO expenses. This compares favourably with Net Loss of $20.6 million in 2016.
Leading IndicatorsThroughout 2017, we saw a significant increase in Total Payment Volume (TPV) across our platform, recording a total spend three times that of 2016 at $1.7 billion (up from
$0.55 billion). This increase was in part driven by new users being attracted to Boku as a payment method, partly by the geographical roll out of existing merchants and partly by the secular growth in expenditure on digitally distributed content.
The number of active users of the Boku platform grew significantly across the year from 3.3 million to 8 million whilst the average transaction value moved upwards concurrently from $8 to just under $11.
The aggregated impact of these growth curves demonstrates a business that is growing healthily.
CoGS
$25m
$20m
$15m
$10m
$5m
$0
Revenue
$24.4m
2017
$17.2m
2016
$2,000m
$1,500m
$1,000m
$500m
$0
Total Payment Volume
$1,700m
2017
$554m2016
$3.5m
$3.0m
$2.5m
$2.0m
$1.5m
$1.0m
$0.5m
0
$30m
$25m
$20m
$15m
$10m
$5m
0
Adjusted Operating Expenditure*
+207%
+42%
$24.5m
2017
$26.3m
2016
-7%
$2.3m
2017
$3.2m
2016
-22%
*Adjusted Operating Expenditure = Administrative expenses adjusted to exclude depreciation and amortisation, share option expense, foreign exchange gains and losses and exceptional items (which include IPO costs).
Boku Inc Annual Report and Accounts for the year ended 31 December 2017 www.boku.com14
Strategic Report
26004 Boku AR2017.indd 14 09/04/2018 17:56:15
26004 9 April 2018 5:55 PM Proof 6 26004 9 April 2018 5:55 PM Proof 6
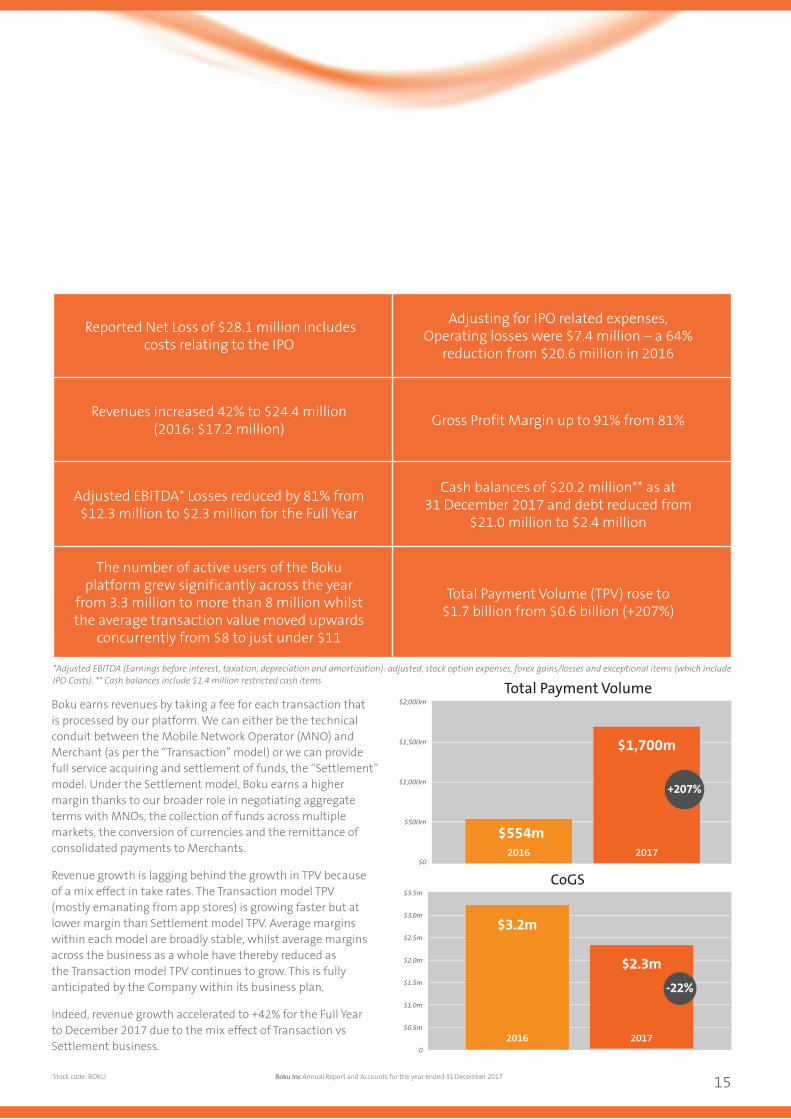
Boku earns revenues by taking a fee for each transaction that is processed by our platform. We can either be the technical conduit between the Mobile Network Operator (MNO) and Merchant (as per the “Transaction” model) or we can provide full service acquiring and settlement of funds, the “Settlement” model. Under the Settlement model, Boku earns a higher margin thanks to our broader role in negotiating aggregate terms with MNOs, the collection of funds across multiple markets, the conversion of currencies and the remittance of consolidated payments to Merchants.
Revenue growth is lagging behind the growth in TPV because of a mix effect in take rates. The Transaction model TPV (mostly emanating from app stores) is growing faster but at lower margin than Settlement model TPV. Average margins within each model are broadly stable, whilst average margins across the business as a whole have thereby reduced as the Transaction model TPV continues to grow. This is fully anticipated by the Company within its business plan.
Indeed, revenue growth accelerated to +42% for the Full Year to December 2017 due to the mix effect of Transaction vs Settlement business.
Reported Net Loss of $28.1 million includes costs relating to the IPO
Adjusting for IPO related expenses, Operating losses were $7.4 million – a 64%
reduction from $20.6 million in 2016
Revenues increased 42% to $24.4 million (2016: $17.2 million) Gross Profit Margin up to 91% from 81%
Adjusted EBITDA* Losses reduced by 81% from $12.3 million to $2.3 million for the Full Year
Cash balances of $20.2 million** as at 31 December 2017 and debt reduced from
$21.0 million to $2.4 million
The number of active users of the Boku platform grew significantly across the year
from 3.3 million to more than 8 million whilst the average transaction value moved upwards
concurrently from $8 to just under $11
Total Payment Volume (TPV) rose to $1.7 billion from $0.6 billion (+207%)
CoGS
$25m
$20m
$15m
$10m
$5m
$0
Revenue
$24.4m
2017
$17.2m
2016
$2,000m
$1,500m
$1,000m
$500m
$0
Total Payment Volume
$1,700m
2017
$554m2016
$3.5m
$3.0m
$2.5m
$2.0m
$1.5m
$1.0m
$0.5m
0
$30m
$25m
$20m
$15m
$10m
$5m
0
Adjusted Operating Expenditure*
+207%
+42%
$24.5m
2017
$26.3m
2016
-7%
$2.3m
2017
$3.2m
2016
-22%
*Adjusted EBITDA (Earnings before interest, taxation, depreciation and amortization): adjusted, stock option expenses, forex gains/losses and exceptional items (which include IPO Costs). ** Cash balances include $1.4 million restricted cash items
Stock code: BOKU Boku Inc Annual Report and Accounts for the year ended 31 December 2017 15
26004 Boku AR2017.indd 15 09/04/2018 17:56:15
26004 9 April 2018 5:55 PM Proof 6
Chief Financial Officer’s Report
Revenue and Gross MarginBoku’s revenue performance over previous years reflects a business that has made an effective transformation – from its initial focus on supporting social gaming on Desktop to now supporting the App Economy and the consumption of digital goods and services (including games) over devices and via app stores.
During 2017 Boku delivered strong revenues of $24.4 million (42% growth on 2016) as the Company’s strategy of supporting providers of digital goods and services, by helping them attract new paying users, really started to bear fruit.
The Company has a diversified portfolio of merchants, whom we serve either directly, in the case of music subscriptions, games consoles, online gaming; or indirectly, via our connections to the app stores.
2017 revenue increased by 42% on TPV that was up 207%, the difference being accounted for by the change in average take rates across the business from 3.1% to 1.4%, for the reasons described above.
With increased volume and a diversified customer base come the benefits of scale and the Company has successfully leveraged its relative buying power to lower our Cost of Goods Sold – both in unit terms and in absolute terms – down to $2.3 million from $3.2 million on TPV which has trebled.
As a consequence, our Gross Profit Margins have increased to 91% from 81% and Gross Profit at $22.1 million is 58% higher than 2016.
Operating ExpenditureTotal Adjusted Operating Expenditure (Adjusted to exclude depreciation, amortization, stock option expenses, foreign exchange gains and losses and exceptional items – which include IPO costs) of $24.5 million was $1.8 million (7%) lower than 2016 total expenditure.
Staff costs have reduced 3% over the period to $17.2 million from $17.8 million. Full Time Employee (FTE) levels have broadly remained flat in the business overall at 150, whilst the geographical split has changed with some specific engineering functions moved to our Mumbai technical centre from San Francisco.
Efficiencies in the running cost of Boku operations, combined with a ruthless focus on discretionary expenditure, account for the remainder of the year on year reduction in expenses. .
In 2017, we re-classified the costs associated with MNO Deductions from Operating Expenditure to Cost of Goods Sold – this more accurately reflects the nature of these costs which are, for the most part, passed on to merchants through increased revenue. The net effect of this change was zero at Adjusted EBITDA level, but a decrease in both Gross Profit and Adjusted Operating Expenditure of $0.3 million and $0.4 million in 2017 and 2016 respectively.
The Company capitalised a total of $0.1 million of internally developed software costs during the year (2016: $1.4m).
Operating ResultReported operating losses were reduced to $8.4 million in 2017 from $19.9 million in 2016, this improvement can be broken down as follows:
Adjusted EBITDA continued to improve throughout the second half of 2017, bringing full year adjusted EBITDA loss down to $2.3 million from £12.3 million the year before, reflecting strong revenue growth combined with lower expenses noting:
• Depreciation and Amortisation were broadly flat ($3.0 million down from $3.2 million).
• Foreign Exchange (FX) gains of $0.4 million reverse a $0.2 million loss in 2016 – Boku reports in USD, however many of the money flows which arise from operating the Settlement model are in various currencies, most notably GBP, EUR and JPY. A $0.4 million gain represents just 0.02% of TPV for the year. The Company operates forward FX contracts to hedge our foreign currency exposure.
• Exceptional costs of $2.6 million incorporate the costs relating to the IPO secondary issue ($2.1 million) plus some reorganisation expenses.
• Stock Option expenses normalised in 2017 at $0.9 million (2016: $2.1 million reflected a reprice of the 2009 Stock Option Plan)
Boku Inc Annual Report and Accounts for the year ended 31 December 2017 www.boku.com16
Strategic Report
26004 Boku AR2017.indd 16 09/04/2018 17:56:16
26004 9 April 2018 5:55 PM Proof 6 26004 9 April 2018 5:55 PM Proof 6
Financing ExpensesFinancing costs of $19.6 million include $18.6 million non-cash accounting expense relating to the Convertible Note which converted to Common Stock at the IPO date.
Balance Sheet and CashflowFollowing the IPO the company has significantly strengthened its Balance Sheet with increased cash balances, less short term debt and the removal of the convertible note – as promised to investors during the IPO process.
Boku raised £15 / $20 million gross (c. £13 / $17 million net) funds from the IPO in November 2017. As stipulated before the IPO, Boku’s intent is to direct 50% of the net funds towards growth generating activities and 50% towards paying down short term, working capital facilities as part of a general “tidy up” of the Company’s balance sheet and reduction in cost of funding.
As at December 31st 2017, our working capital facility with Silicon Valley Bank was paid down to $2.4 million from $6.0 million as at 31 December 2016. We also ceased utilising a factoring arrangement in Boku AG during December (previously employed as a means of accelerating cash collections) – this had the effect of increasing our receivables whilst utilising approximately $4 million in cash.
The $15 million convertible note, raised in 2016 was converted in full to common stock at the point of IPO thus reducing non-current liabilities. Total Loans and Borrowings were thereby reduced from $21.0 million (excluding the impact of factoring) to $2.4 million over the period.
The Company closed the year with $20.2 million cash balances - cash used to fund operations over the year was $6.8 million compared with $11.4 million in 2016.
Increases in MNO Receivables and Merchant Payables over the period ($21.1 million and $17.4 million respectively) reflect underlying growth within the Settlement model business – whereby MNO receivables are collected and aggregated shortly prior to merchant remittances being paid. Receivables have grown faster than Payables over the year due partly to the impact of the Company reversing out of factoring in Boku AG.
There was no material movement in the USD value of Intangible Assets on our balance sheet as amortisation costs for the year ($3.0 million) were offset by a currency revaluation of acquired goodwill in Boku AG which is held in EUR and converted to USD upon consolidation.
Looking AheadThe Company is now in a favourable position to build further value with growing revenues, improving EBITDA and rapidly approaching free-cashflow generation. With a stronger balance sheet, we are also able to make appropriate investments to explore new areas for growth to fuel new revenues in 2019 and beyond.
Stuart Neal Chief Financial Officer 9 April 2018
We switched to Boku to process our Google Direct Carrier Billing traffic in September 2017. Since then, the stability and performance of the service has improved and the volume has gone up by more than 30%.
Andrey Marakov
Director of Financial Technologies, MTS, Russia
“ “
Stock code: BOKU Boku Inc Annual Report and Accounts for the year ended 31 December 2017 17
26004 Boku AR2017.indd 17 09/04/2018 17:56:16
26004 9 April 2018 5:55 PM Proof 6
Our Principal Risks and Uncertainties
Financial Risks Examples of mitigating activities include:
Loss of major merchant
Loss of one or more major merchants of the Group could result in a material loss of revenue and profit for the Group. The Group derived 67.9% of its revenue in FY2017 from four customers each of which accounted for more than 10% of Group Revenue.
Building and maintaining close relationships with merchants to determine and adapt to their needs, providing the solutions and flexibility that they require, including dedicated account management for major merchants.
Movements in foreign currency exchange rates
The majority of the Group’s revenues are derived outside of the USA and therefore, fluctuations in currency exchange rates may adversely affect the reported financial condition of the Group.
The Group uses foreign exchange contracts to manage its exposure to adverse fluctuations in foreign exchange rates.
Failure of suppliers to pay receivables when due
The Company is reliant on third parties, including MNOs and SMS aggregators to pay significant amounts due from them in a timely manner as specified under contract. A large scale failure to do so would have a material effect on the Group’s financial condition or operating results.
Developing strong relationships with MNOs and aggregators.
Effective credit control and management of receivables.
Regulatory and Legal Risks Examples of mitigating activities include:
Changes to the regulatory environment
Changes in the law and regulatory framework which prohibit the provision of services by some of Group’s suppliers or customers could have a material adverse effect on the Group.
For example, the Group’s business could also be adversely affected by:• an increase in “Know-your-customer” regulations aimed at money
laundering and affecting small content providers;• increases in regulation particularly in the European Community or the US
concerning the issuance of e-money;
Diversifying the range of services available to all types of customers to mitigate the impact of any single regulatory change
Continuing to invest in solutions that improve the Group’s ability to manage credit risk and fraud and ensure compliance with regulations.
Employing and retaining experienced risk and compliance staff who can monitor any changes and ensure timely compliance.
Managing the risk in our businessEffective risk management is critical to achieving the Group’s objectives. Boku has an adequate system of controls in place to manage risks and conducts regular reviews of the major risks which may affect our business and financial performance. Risks are identified, evaluated and mitigated through a combination of a “top down” approach (driven by the Audit Committee and the Board) and a “bottom up” process (originating from the operations).
ResponsibilityThe Board has oversight responsibility for the effective management of all major risks affecting the Group. In each area, the Board is supported by members of the executive management team and other managers with key functional responsibilities.
Risk analysisThe Group’s principal risks can be categorised as ‘financial’. ‘operational’, ‘regulatory and legal’, or ‘market’ risks as shown in the tables below.
Boku Inc Annual Report and Accounts for the year ended 31 December 2017 www.boku.com18
Strategic Report
26004 Boku AR2017.indd 18 09/04/2018 17:56:17
26004 9 April 2018 5:55 PM Proof 6 26004 9 April 2018 5:55 PM Proof 6
Market Risks Examples of mitigating activities include:
Competitive environment
The Group operates in rapidly evolving payments markets where service provision is intensely competitive and subject to rapid technological change. The Company faces competition from other providers of direct Carrier Billing and alternative payment providers.
The Group anticipates that it will continue to face competition as new companies enter the Group’s markets and alternative payment products and technologies become available. The results of such increased competition may adversely affect our financial results.
Investing in new products, markets and technologies and improving relationships with key merchants and carriers.
Launching new payment products and developing the Group’s offerings to meet changing client demands and market preferences.
Develop the necessary expertise and experience to sell and deliver new products and technologies to new and existing clients.
Operational Risks Examples of mitigating activities include:
Attracting and retaining the best talent
The Group’s success depends on its ability to attract and retain key management and skilled technical employees. If the Group is unable to identify, attract, motivate and retain well-qualified and engaged personnel, this could have a material effect on the Group’s reputation, business, operations and financial performance.
Developing the skills and capabilities of staff as part of talent management. Creating opportunities within the Group for personal development and career enhancement. Recruiting specialised, experienced staff.
Cyber Security and Data Protection
The Group IT environments may be subject to hacking, data theft or other cyber security threats which may harm customer relationships and the market perception of the effectiveness and resilience of the Group’s products and services. Such an attack may also have a material adverse effect on the Group’s financial position.
Ensuring the group has the systems in place to defend against potential cyber security threats.
Building resilience within the platform to mitigate the impact of an attack in the event of a successful penetration.
Stock code: BOKU Boku Inc Annual Report and Accounts for the year ended 31 December 2017 19
26004 Boku AR2017.indd 19 09/04/2018 17:56:17

26004 9 April 2018 5:55 PM Proof 5
Board Of Directors
Mr Mark Britto (Non-Executive Chairman)
With over 20 years as an entrepreneur, sales and financial services executive, Mark Britto is currently the Senior Vice President and General Manager for Global Credit at PayPal. He also serves as Boku’s Non-Executive Chairman. Mr Britto founded Boku after six years as the Chief Executive Officer of Ingenio, a service marketplace and performance advertising company, which he led to a 2007 acquisition by AT&T. Prior to Ingenio, Mr Britto spent 4 years as Senior Vice President of worldwide services and sales at Amazon.com. Mr Britto’s first start-up, Accept.com, was bought by Amazon.com in 1999 and served as the primary backbone of Amazon’s global payments platform. Mr Britto began his career in senior credit and risk management roles at leading national banks FirstUSA and Bank of America.
Mr Jonathan (Jon) Prideaux (Chief Executive Officer)
Jon Prideaux has nearly 30 years of payments experience. He was an early Visa Europe employee and key contributor to its growth, leaving in 2006 as Executive Vice President of Marketing. He started Visa Europe’s ecommerce division, was the lead executive on the introduction of Chip and PIN technology and oversaw product launches such as Visa Electron and V PAY. He served on the Board of EMVCo, was the Chairman of the Compliance Committee and was a member of Visa’s Global Product and Brand Councils. Since leaving Visa, Mr Prideaux served as Deputy Chief Executive Officer for SecureTrading, where he doubled transaction numbers and quadrupled profitability. He then led a management buy in at Shopcreator, the e-commerce software platform. He joined Boku in 2012 and has been CEO since 2014
Mr Stuart Neal (Chief Financial Officer)
Prior to re-joining Boku in 2017, Stuart Neal was advising new technology ventures, bringing to market cutting edge technology in AI Machine Learning, Crypto Currency and Blockchain. Previously, he was Chief Commercial Officer at Vocalink Zapp (acquired by Mastercard), building distribution channels and creating merchant demand for their Pay by Bank App product. Mr Neal was also Commercial Director at Barclaycard, Europe’s second largest card acquirer, where he oversaw the roll out of contactless payments across the UK market. He has held senior Commercial and Finance positions within a number of blue chip corporations including GlaxoSmithKline, Worldcom and Virgin Media. Mr Neal was previously Chief Financial Officer of Boku between 2012 and 2014.
Governance
Boku Inc Annual Report and Accounts for the year ended 31 December 2017 www.boku.com20
26004 Boku AR2017.indd 20 09/04/2018 17:56:18

26004 9 April 2018 5:55 PM Proof 5 26004 9 April 2018 5:55 PM Proof 5
Dr Richard Hargreaves (Non-Executive Director)
Richard Hargreaves co-founded Endeavour Ventures in 2006 and has been investing in and advising companies for over 30 years. He began his career at 3i plc where he spent ten years before starting Baronsmead and launched one of the first VCTs – Baronsmead VCT. He sold this to Friends Ivory & Sime plc in 1995 (it later became ISIS Equity Partners). Mr Hargreaves was Managing Director of their unquoted investment business at that time which had £180 million funds under management. Mr Hargreaves is a former chairman of the British Venture Capital and Private Equity Association (BVCA). He has significant experience as a non-executive director on both public and private company boards. He is a graduate of the University of Cambridge and has an MSc and PhD from Imperial College, London. Richard is the Chairman of Boku’s Remuneration Committee.
Mr Clint Smith (Non-Executive Director)
Clint Smith is currently the Senior Vice President of Corporate Development and General Counsel for DataStax, Inc., a California-based technology company. Mr Smith has previously held management positions with UUNET, Macromedia, MySQL and TrialPay. He has served on the board of directors of Yub, Inc., an e-commerce company acquired in 2014 by Quotient and TrialPay, Inc., a payments company acquired in 2015 by Visa. Mr Smith is currently Chairman of the Audit Committee and will handover to Mr Butcher who will handle the 2018 Audit.
Mr Keith Butcher (Non-Executive Director)
Over the course of his career, Mr Butcher has held Chief Financial Officer roles at several high-growth technology and e-commerce companies, including PaySafe Group, Flomerics and DataCash Group. In each of these roles, he played an instrumental role in streamlining costs, improving investor relations and guiding the companies through successful mergers and acquisitions. During his tenure as Chief Financial Officer at PaySafe Group, formerly known as Optimal Payments, Mr Butcher guided the company through three significant acquisitions that helped transform the company into a £2 billion business. This included the company’s successful acquisition of Skrill in 2015 for €1.2 billion, which propelled PaySafe Group into the FTSE 250. Mr Butcher will chair Boku’s Audit Committee.
Stock code: BOKU Boku Inc Annual Report and Accounts for the year ended 31 December 2017 21
26004 Boku AR2017.indd 21 09/04/2018 17:56:18
26004 9 April 2018 5:55 PM Proof 5
Senior Management
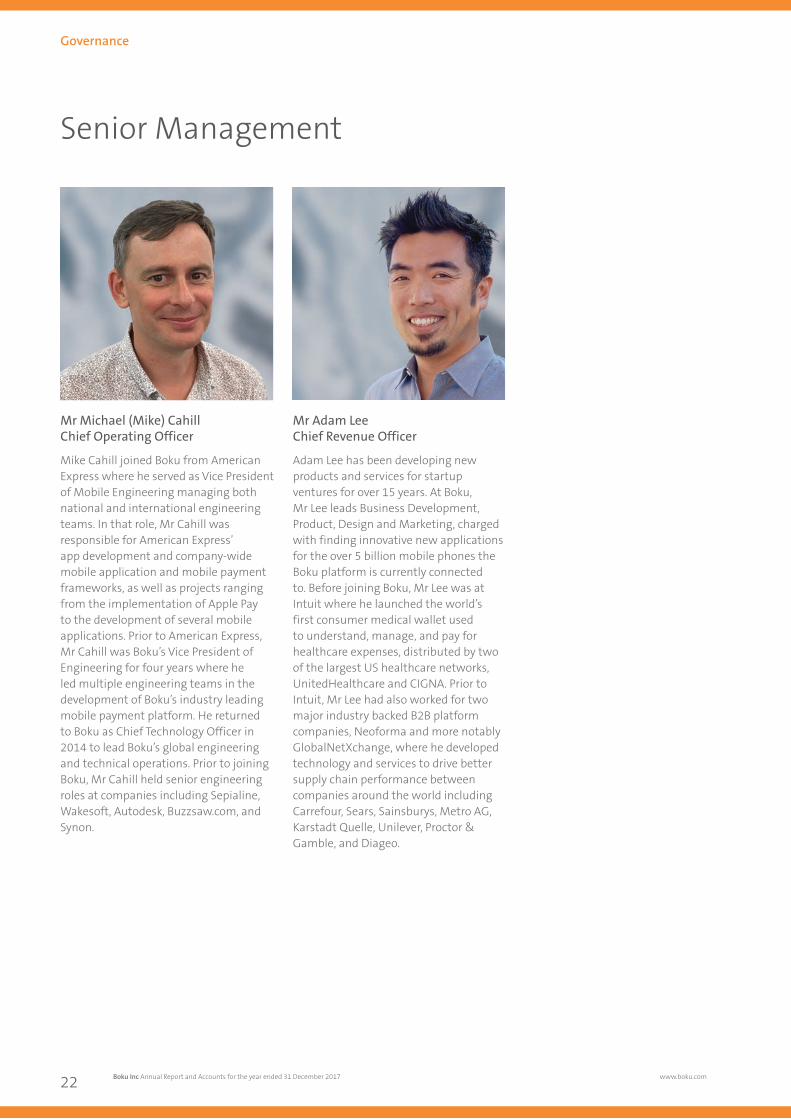
Mr Michael (Mike) Cahill Chief Operating Officer
Mike Cahill joined Boku from American Express where he served as Vice President of Mobile Engineering managing both national and international engineering teams. In that role, Mr Cahill was responsible for American Express’ app development and company-wide mobile application and mobile payment frameworks, as well as projects ranging from the implementation of Apple Pay to the development of several mobile applications. Prior to American Express, Mr Cahill was Boku’s Vice President of Engineering for four years where he led multiple engineering teams in the development of Boku’s industry leading mobile payment platform. He returned to Boku as Chief Technology Officer in 2014 to lead Boku’s global engineering and technical operations. Prior to joining Boku, Mr Cahill held senior engineering roles at companies including Sepialine, Wakesoft, Autodesk, Buzzsaw.com, and Synon.
Mr Adam Lee Chief Revenue Officer
Adam Lee has been developing new products and services for startup ventures for over 15 years. At Boku, Mr Lee leads Business Development, Product, Design and Marketing, charged with finding innovative new applications for the over 5 billion mobile phones the Boku platform is currently connected to. Before joining Boku, Mr Lee was at Intuit where he launched the world’s first consumer medical wallet used to understand, manage, and pay for healthcare expenses, distributed by two of the largest US healthcare networks, UnitedHealthcare and CIGNA. Prior to Intuit, Mr Lee had also worked for two major industry backed B2B platform companies, Neoforma and more notably GlobalNetXchange, where he developed technology and services to drive better supply chain performance between companies around the world including Carrefour, Sears, Sainsburys, Metro AG, Karstadt Quelle, Unilever, Proctor & Gamble, and Diageo.
Governance
Boku Inc Annual Report and Accounts for the year ended 31 December 2017 www.boku.com22
26004 Boku AR2017.indd 22 09/04/2018 17:56:19
26004 9 April 2018 5:55 PM Proof 5 26004 9 April 2018 5:55 PM Proof 5
Corporate Governance Report
Boku follows the Corporate Governance Code to the extent appropriate for a company of its size and nature and will be making further disclosures to comply with changes to AIM Rule 26, effective 28th September 2018.
The Company’s principal place of business is the UK. The Company is incorporated in and subject to the laws of the State of Delaware, United States, and is subject to the exclusive jurisdiction of the Delaware Courts and the Company’s Certificate of Incorporation and Bylaws. As such, the rights of shareholders may differ from the rights of shareholders in a UK incorporated company.
Nevertheless, the Company has voluntarily embraced key provisions of the Corporate Governance Code such as:
• The majority of our Board comprises non-executive Directors, two of which are independent. Neither Mr Britto, the Non-Executive Chairman, nor Mr Smith is considered independent. Mr Hargreaves is the Senior Independent Director.
• The Company has made certain amendments to its Charter to confirm that it is subject to the Code on Takeovers and Mergers.
• By rotation, Directors are subject to reappointment by a shareholder vote at our Annual General Meeting. Mr Smith and Mr Butcher are up for re-election at the meeting scheduled for 23rd May, though Mr Smith has indicated that he will not stand.
• There is a clear division of responsibilities between the Non-Executive Chairman and Chief Executive.
• The Audit Committee is currently comprised of four non-executive Directors, with Mr Smith as Chairman. Mr Butcher will assume the Chairmanship for the 2018 audit.
• The Remuneration Committee comprises exclusively non-executive Directors namely Mr Hargreaves (Chairman), Mr Butcher and Mr Britto. Remuneration policy is subject to an advisory vote at the Annual General Meeting.
• The Board does not consider it necessary to establish a Nominations Committee
The Board composition and responsibilitiesThe Board currently consists of a non-executive Chairman, the Chief Executive Officer, the Chief Financial Officer and three non-executive Directors. There is a clear division of responsibilities between the chairman and the executive officers and the Board considers two of the non-executive Directors to be independent of management. The composition of the Board ensures that no single individual or group of individuals is able to dominate the decision-making process. Details of the individual Directors and their biographies are set out on pages 20 to 21.
The Directors evaluate the balance of skills, knowledge and experience of the Board when defining the role and capabilities required for new appointments.
The Board is responsible for management of the business, setting the strategic direction and policies. The Board meets regularly to attend to any issues which requires their attention and oversees the financial position of the Company monitoring the business and affairs on behalf of the shareholders, to whom the Directors are accountable. The Board will also address issues relating to internal control and the Company’s approach to risk management.
The day-to-day management of the Company’s business is delegated to the Chief Executive Officer and the Executive Management Team.
The Board meets at least once every two months to review, formulate and approve the Company’s strategy, budgets, corporate actions and oversee the Company’s progress towards its goals.
It has established an Audit Committee and a Remuneration Committee with formally delegated duties and responsibilities and with written terms of reference.
Details of the individual Directors and their biographies are set out on pages 20 to 21.
Stock code: BOKU Boku Inc Annual Report and Accounts for the year ended 31 December 2017 23
26004 Boku AR2017.indd 23 09/04/2018 17:56:19
26004 9 April 2018 5:55 PM Proof 5
Corporate Governance Report
Audit CommitteeThe Audit Committee is chaired by Clint Smith and its other members are Richard Hargreaves and Mark Britto, all of whom are non-executive Directors. The Audit Committee meets formally at least two times a year and otherwise as required. It has the responsibility for ensuring that the financial performance of the Company is properly reported on and reviewed and its role includes monitoring the integrity of the financial statements of the Company (including annual and interim accounts and results announcements), reviewing internal control and risk management systems, reviewing any changes to accounting policies, reviewing and monitoring the extent of the non-audit services undertaken by external auditors, and advising on the appointment of external auditors. Mr Smith will handover the Chairmanship to Mr Butcher for the 2018 Audit.
Remuneration CommitteeThe Remuneration Committee is chaired by Richard Hargreaves and its other members are Mark Britto and Keith Butcher, all of whom are non-executive Directors. The Remuneration Committee meets not less than once a year and at such other times as required. It has the responsibility for determining, within the agreed terms of reference, the Company’s policy on the remuneration packages of the Company’s chief executive, chairman, and the executive Directors and such other members of the executive management as it is designated to consider. The remuneration of non-executive Directors is a matter for the chairman and executive Directors of the Board. No director or manager is allowed to partake in any discussions as to their own remuneration. In addition, the Remuneration Committee has the responsibility for reviewing the structure, size and composition (including the skills, knowledge and experience) of the Board and giving full consideration to succession planning.
A full report of the Audit Committee can be found on pages 26 to 27.
A full report of the Remuneration Committee can be found on pages 28 to 33.
Microsoft uses Mobile Operator Billing to acquire new paying users. We’ve been working with Boku on the Microsoft Digital Store right from the start. They are a trusted partner and have helped us to launch in dozens of countries on three continents.
Grahame Riddell
Director of Carrier Billing, Microsoft Digital Store
“ “
Governance
Boku Inc Annual Report and Accounts for the year ended 31 December 2017 www.boku.com24
26004 Boku AR2017.indd 24 09/04/2018 17:56:19
26004 9 April 2018 5:55 PM Proof 5 26004 9 April 2018 5:55 PM Proof 5
Share Dealing codeThe Company has adopted a dealing code for the Directors and all employees, which is appropriate for a company whose stock is admitted to trading on AIM. The Company will take all reasonable steps to ensure compliance by the Directors and employees with the terms of that dealing code.
ShareholdersThe Board is committed to regular and effective communication with shareholders and will provide annual and interim statutory financial reports, investor and analyst presentations, regular trading and business updates to the London Stock Exchange. At the Annual General Meeting all shareholders will have the opportunity to meet and ask questions of the Board of Directors. The next Annual General Meeting is scheduled for 23rd May 2018.
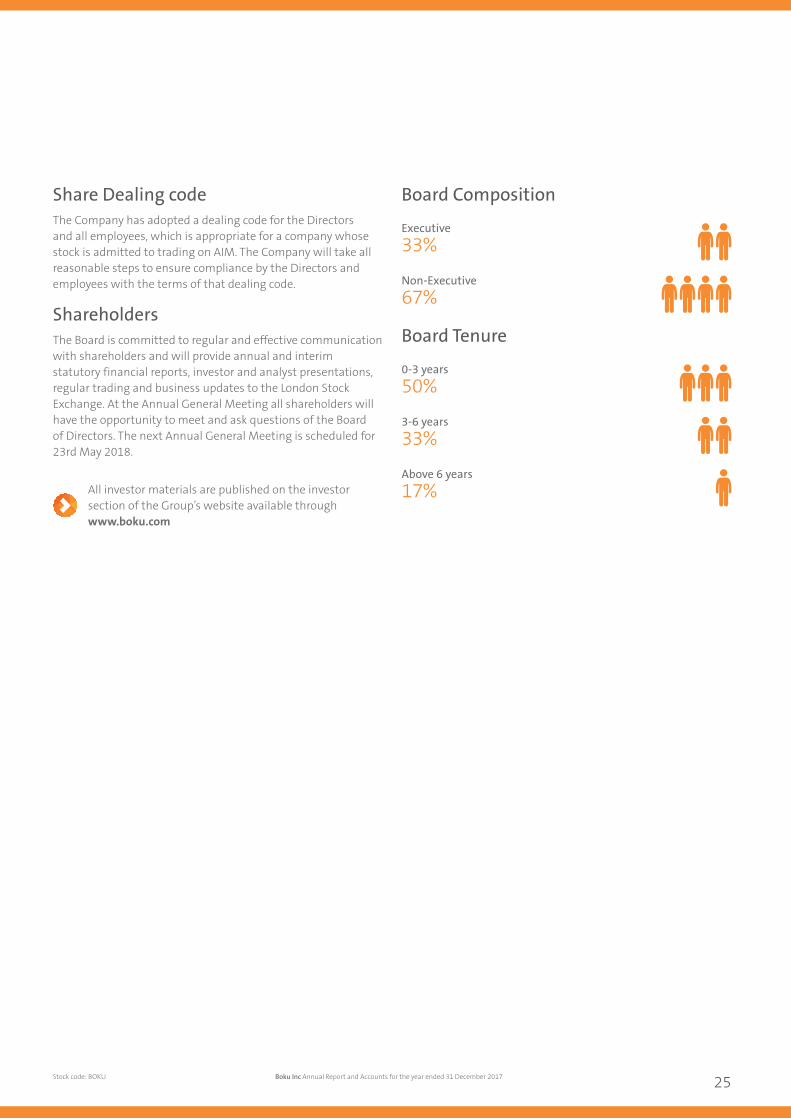
Board Composition
Executive33%
Non-Executive67%
Board Tenure
0-3 years50%
3-6 years33%
Above 6 years17%All investor materials are published on the investor
section of the Group’s website available through www.boku.com
Stock code: BOKU Boku Inc Annual Report and Accounts for the year ended 31 December 2017 25
26004 Boku AR2017.indd 25 09/04/2018 17:56:19
26004 9 April 2018 5:55 PM Proof 5
Report Of The Audit Committee
2017 was a year of considerable change for Boku as we began life as a public company on AIM on the 20th November.
Becoming public has heightened the importance and profile of the governance and control environment across the business and placed even greater emphasis on the role of the Audit Committee (“the Committee”) than ever before.
The integrity of the Group’s financial reporting and the effectiveness of its internal controls and risk management processes are of upmost importance to the Board, as I am sure they are to shareholders.
Audit Committee StructureBoku has operated with an Audit Committee since before its IPO in 2017 and the committee continues to have primary responsibility for managing and assessing the activities of the Company’s external auditors.
The Audit Committee reports to the Boku Board; all non-executive Directors, namely Mr Smith, Mr Butcher, Mr Hargreaves and Mr Britto, are members of the committee. It meets, as a minimum, twice each year, usually to coincide with the financial reporting timetable.
The Chairman of Audit Committee is currently Mr Smith. Mr Butcher will assume the Chairmanship for the 2018 Audit.
ResponsibilitiesThe Audit Committee meets primarily to review the independent audit report of Boku’s external auditors, but also has the wider responsibilities as set out below:
• provide formal and transparent arrangements for considering how to apply the financial reporting and internal control principles set out in the UK Corporate Governance code, and to maintain an appropriate relationship with the Company’s auditors, as required by section C.3 of the UK Corporate Governance Code;
• monitor the integrity of the financial statements of the Company and any formal announcements relating to the Company’s financial performance, reviewing significant financial reporting judgments contained in them;
• review the Company’s internal financial controls and the Company’s internal control and risk management systems;
• review arrangements by which staff of the Company may, in confidence, raise concerns about possible improprieties in matters of financial reporting or other matters and ensure that arrangements are in place for the proportionate and independent investigation of such matters and for appropriate follow-up action;
• consider the need for an internal audit function and, if considered necessary, monitor and review the effectiveness of the Company’s internal audit function;
• make recommendations to the board, for it to put to the stockholders for their approval in a general meeting of the stockholders, in relation to the appointment, re-appointment and removal of the external auditor and to approve the remuneration and terms of engagement of the external auditor;
• review and monitor the external auditor’s independence and objectivity and the effectiveness of the audit process, taking into consideration relevant professional and regulatory requirements;
• develop and implement policy on the engagement of the external auditor to supply non-audit services, taking into account relevant ethical guidance regarding the provision of non-audit services by the external audit firm; and
• report to the Board, identifying any matters in respect of which it considers that action or improvement is needed and make recommendations as to the steps to be taken.
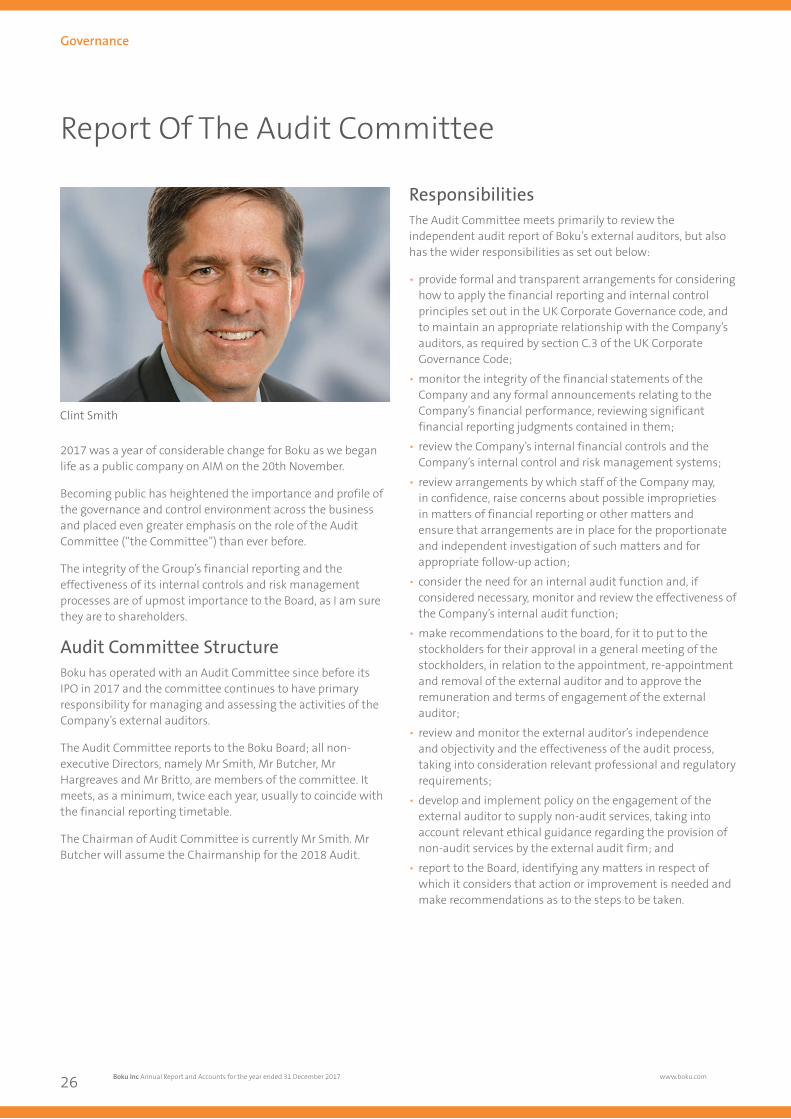
Clint Smith
Governance
Boku Inc Annual Report and Accounts for the year ended 31 December 2017 www.boku.com26
26004 Boku AR2017.indd 26 09/04/2018 17:56:19
26004 9 April 2018 5:55 PM Proof 5 26004 9 April 2018 5:55 PM Proof 5
External AuditThe scope of the audit work undertaken by external auditors is agreed in partnership with the Audit Committee and typically covers the following areas:
• the External Auditor’s overall work plan for the forthcoming year
• the External Auditor’s fee• the major issues that arose during the course of the audit and
their resolution• key accounting and audit judgements and estimates• the levels of errors identified during the audit, and• recommendations made by the External Auditor in their
management letters and the adequacy of management’s response.
The Audit Committee meets privately with the External Auditor in the absence of management to review matters within their sphere of interest and responsibility.
Boku changed its external audit firm at the point of IPO and moved from having separate audit firms for each of its main subsidiaries (US, UK and Germany) to having one group audit firm in BDO.
BDO has taken responsibility for the Boku, Inc. group audit for the 2017 Full Year accounts.
Internal AuditBoku does not currently employ an internal audit function - as is typical for a company of Boku’s size – however, the need for one will be reviewed by the Audit Committee on a periodic basis.
Risk and Governance FrameworkThe Board in conjunction with the Audit Committee regularly reviews Boku’s internal control system.
Boku has a dedicated Risk & Compliance Team staffed by experienced professionals whose primary area of focus is to ensure that the Company remain compliant with all relevant regulation, most notably the FCA in the UK/EU (issuer of our e-money license) and relevant local Telecoms regulation within each specific market; in addition to broader regulatory requirements such as GDPR and PSD2 within the EU.
Please refer to pages 18 to 19 for a more detailed review of the Company’s Principal Risks and Uncertainties
Activities of the Audit Committee Over the Past YearReview of key revenue accruals – the committee conducted a review of material revenue accruals prior to the IPO and were comfortable that appropriate accounting treatment was being applied.
Appointment of BDO as new group auditors – following a thorough market review, the committee appointed BDO as group auditor for the 2017 Full Year Boku, Inc. group audit; the committee also discussed the scope of non-audit services for which it might be appropriate to engage BDO in 2018.
Sign off of pre-IPO IFRS converted financial statements – the committee oversaw the generation of financial statements which underpinned the Boku’s listing as a public company on AIM.
Looking AheadThe Audit Committee will continue to work with the Board, Management and BDO to review and, as appropriate, enhance the reporting and control environment across the business, with particular focus on impact assessment of and adherence to incoming financial reporting standards such as IFRS 15 Revenue Recognition.
We will also continue to closely track identified risks across the business to ensure effective mitigating strategies are implemented.
Clint Smith Audit Committee Chairman 9 April 2018
Stock code: BOKU Boku Inc Annual Report and Accounts for the year ended 31 December 2017 27
26004 Boku AR2017.indd 27 09/04/2018 17:56:20
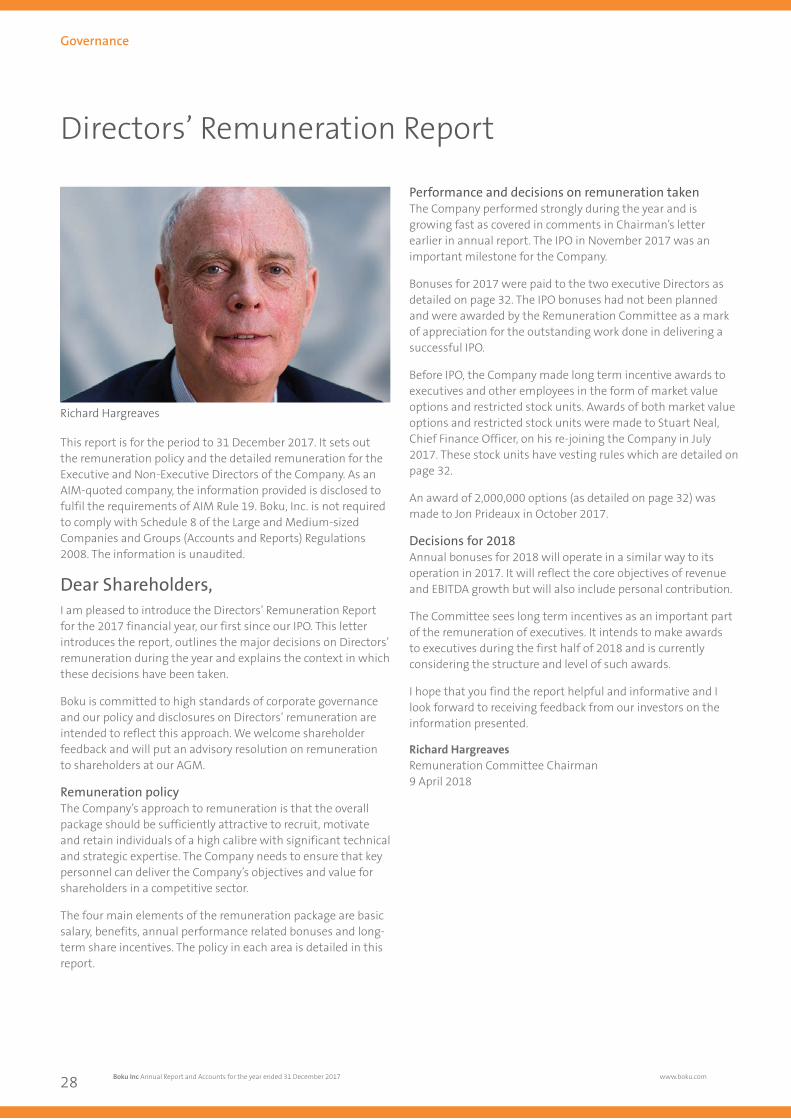
26004 9 April 2018 5:55 PM Proof 5
Directors’ Remuneration Report
This report is for the period to 31 December 2017. It sets out the remuneration policy and the detailed remuneration for the Executive and Non-Executive Directors of the Company. As an AIM-quoted company, the information provided is disclosed to fulfil the requirements of AIM Rule 19. Boku, Inc. is not required to comply with Schedule 8 of the Large and Medium-sized Companies and Groups (Accounts and Reports) Regulations 2008. The information is unaudited.
Dear Shareholders,I am pleased to introduce the Directors’ Remuneration Report for the 2017 financial year, our first since our IPO. This letter introduces the report, outlines the major decisions on Directors’ remuneration during the year and explains the context in which these decisions have been taken.
Boku is committed to high standards of corporate governance and our policy and disclosures on Directors’ remuneration are intended to reflect this approach. We welcome shareholder feedback and will put an advisory resolution on remuneration to shareholders at our AGM.
Remuneration policyThe Company’s approach to remuneration is that the overall package should be sufficiently attractive to recruit, motivate and retain individuals of a high calibre with significant technical and strategic expertise. The Company needs to ensure that key personnel can deliver the Company’s objectives and value for shareholders in a competitive sector.
The four main elements of the remuneration package are basic salary, benefits, annual performance related bonuses and long-term share incentives. The policy in each area is detailed in this report.
Performance and decisions on remuneration taken The Company performed strongly during the year and is growing fast as covered in comments in Chairman’s letter earlier in annual report. The IPO in November 2017 was an important milestone for the Company.
Bonuses for 2017 were paid to the two executive Directors as detailed on page 32. The IPO bonuses had not been planned and were awarded by the Remuneration Committee as a mark of appreciation for the outstanding work done in delivering a successful IPO.
Before IPO, the Company made long term incentive awards to executives and other employees in the form of market value options and restricted stock units. Awards of both market value options and restricted stock units were made to Stuart Neal, Chief Finance Officer, on his re-joining the Company in July 2017. These stock units have vesting rules which are detailed on page 32.
An award of 2,000,000 options (as detailed on page 32) was made to Jon Prideaux in October 2017.
Decisions for 2018Annual bonuses for 2018 will operate in a similar way to its operation in 2017. It will reflect the core objectives of revenue and EBITDA growth but will also include personal contribution.
The Committee sees long term incentives as an important part of the remuneration of executives. It intends to make awards to executives during the first half of 2018 and is currently considering the structure and level of such awards.
I hope that you find the report helpful and informative and I look forward to receiving feedback from our investors on the information presented.
Richard HargreavesRemuneration Committee Chairman9 April 2018
Richard Hargreaves
Governance
Boku Inc Annual Report and Accounts for the year ended 31 December 2017 www.boku.com28
26004 Boku AR2017.indd 28 09/04/2018 17:56:20
26004 9 April 2018 5:55 PM Proof 5 26004 9 April 2018 5:55 PM Proof 5
Composition of CommitteeThe Committee members since IPO have been Richard Hargreaves (Chairman), Mark Britto and Keith Butcher. The Committee will normally meet three times a year to review the remuneration of the Executive Directors and other Executive Team members. The views of the Chief Executive are sought in respect of awards to the other Executive Director and Executive Team members.
Remuneration policyThe Committee’s overall approach is focused on ensuring the Company’s remuneration policy is aligned with shareholders’ interests whilst also enabling the Company to attract, retain and motivate high quality executive management. The Committee will take into account periodic external comparisons to examine current market trends and practices at equivalent roles in similar companies.
Base SalaryBase salary for each Executive Director is reviewed annually by the Committee, taking account of the Director’s performance, experience and responsibilities. Changes are normally effective 1st January. The Committee takes salary levels paid by companies of a similar size and nature into account but also considers wider economic factors and the performance of the Group as a whole.
Annual bonusBonuses are paid at the discretion of the Committee. The Committee’s general policy is that Executive Directors should receive a bonus for the achievement of stretching performance targets. Currently the Company applies revenue, EBITDA and personal performance targets.
Bonuses for achievement of target performance will be paid in cash on a half-yearly basis. Bonuses for over performance will only be paid annually. The Committee has discretion to make adjustments to the level of bonus to avoid unintended consequences of the basic workings of the plan.
The bonus scheme extends to the other two executives who are members of the Executive Management Team.
Long term incentives Before IPO, the Company made long term incentive awards to executives and other employees in the form of market value options and restricted stock units. In general restricted stock units vest and convert into common shares on the anniversary of admission to AIM. Details of awards currently held by Directors are set out later in this report. Before the IPO, Mark Britto received share incentive awards. No further share incentive awards will be made to him.
The Committee sees long term incentives as an important part of the remuneration of executives, to align them with shareholders and reward them for strong performance. The Committee intends to make awards to executives during the first half of 2018, and on an annual basis thereafter, and is currently considering the structure and level of such awards. Awards to executive Directors will have a minimum normal vesting period of three years.
Pension provision The Company operates a stakeholder pension scheme for UK employees. Executive Directors participate on the same basis as other employees
BenefitsThe Company provides the option for employees to participate in the private healthcare plan. Mr Prideaux did not avail himself of this option in 2017. Mr Neal did participate for three months.
Remuneration of non-executive Directors The fees paid to the non-executive Directors are determined by the Board. They receive an annual fee and additional fees for chairing board committees. Non-executive Directors are not entitled to receive any bonus, long term incentive awards or other benefits. Non-executive Directors are entitled to reasonable expenses incurred in the performance of their duties.
Stock code: BOKU Boku Inc Annual Report and Accounts for the year ended 31 December 2017 29
26004 Boku AR2017.indd 29 09/04/2018 17:56:20
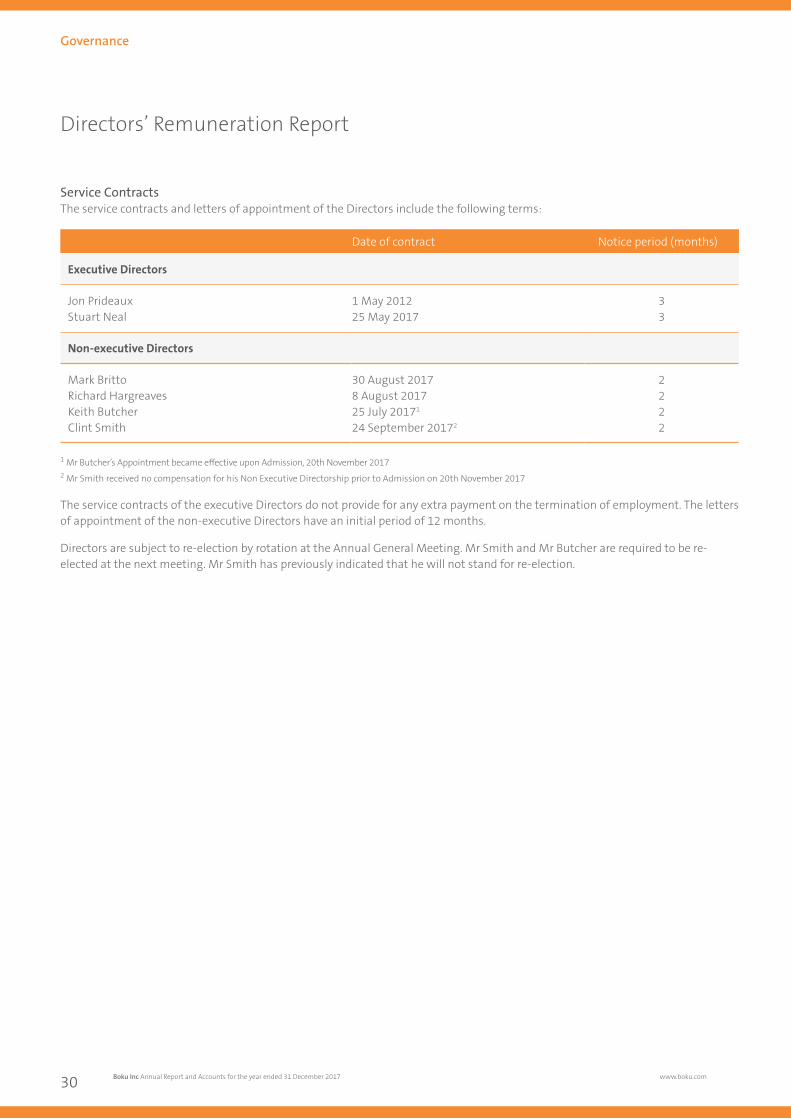
26004 9 April 2018 5:55 PM Proof 5
Directors’ Remuneration Report
Service ContractsThe service contracts and letters of appointment of the Directors include the following terms:
Date of contract Notice period (months)
Executive Directors
Jon PrideauxStuart Neal
1 May 201225 May 2017
33
Non-executive Directors
Mark BrittoRichard HargreavesKeith ButcherClint Smith
30 August 20178 August 201725 July 20171
24 September 20172
2222
1 Mr Butcher’s Appointment became effective upon Admission, 20th November 20172 Mr Smith received no compensation for his Non Executive Directorship prior to Admission on 20th November 2017
The service contracts of the executive Directors do not provide for any extra payment on the termination of employment. The letters of appointment of the non-executive Directors have an initial period of 12 months.
Directors are subject to re-election by rotation at the Annual General Meeting. Mr Smith and Mr Butcher are required to be re-elected at the next meeting. Mr Smith has previously indicated that he will not stand for re-election.
Governance
Boku Inc Annual Report and Accounts for the year ended 31 December 2017 www.boku.com30
26004 Boku AR2017.indd 30 09/04/2018 17:56:20
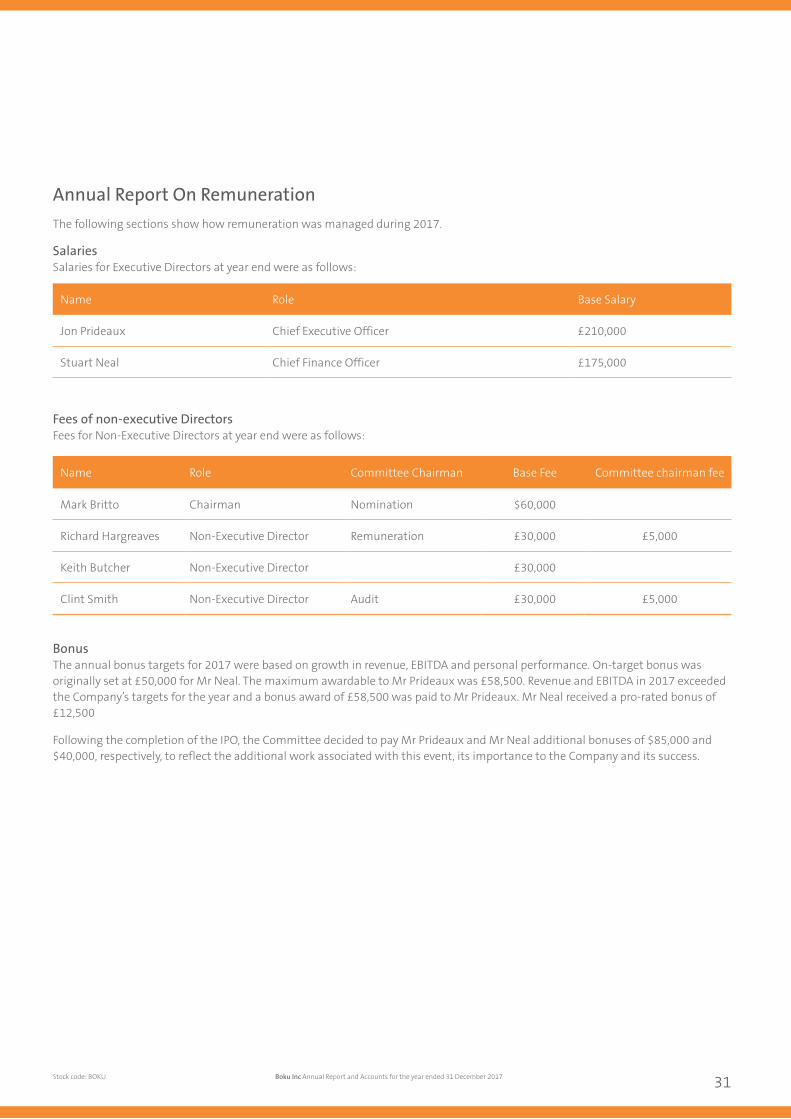
26004 9 April 2018 5:55 PM Proof 5 26004 9 April 2018 5:55 PM Proof 5
Annual Report On Remuneration The following sections show how remuneration was managed during 2017.
SalariesSalaries for Executive Directors at year end were as follows:
Fees of non-executive DirectorsFees for Non-Executive Directors at year end were as follows:
Name Role Committee Chairman Base Fee Committee chairman fee
Mark Britto Chairman Nomination $60,000
Richard Hargreaves Non-Executive Director Remuneration £30,000 £5,000
Keith Butcher Non-Executive Director £30,000
Clint Smith Non-Executive Director Audit £30,000 £5,000
BonusThe annual bonus targets for 2017 were based on growth in revenue, EBITDA and personal performance. On-target bonus was originally set at £50,000 for Mr Neal. The maximum awardable to Mr Prideaux was £58,500. Revenue and EBITDA in 2017 exceeded the Company’s targets for the year and a bonus award of £58,500 was paid to Mr Prideaux. Mr Neal received a pro-rated bonus of £12,500
Following the completion of the IPO, the Committee decided to pay Mr Prideaux and Mr Neal additional bonuses of $85,000 and $40,000, respectively, to reflect the additional work associated with this event, its importance to the Company and its success.
Name Role Base Salary
Jon Prideaux Chief Executive Officer £210,000
Stuart Neal Chief Finance Officer £175,000
Stock code: BOKU Boku Inc Annual Report and Accounts for the year ended 31 December 2017 31
26004 Boku AR2017.indd 31 09/04/2018 17:56:20
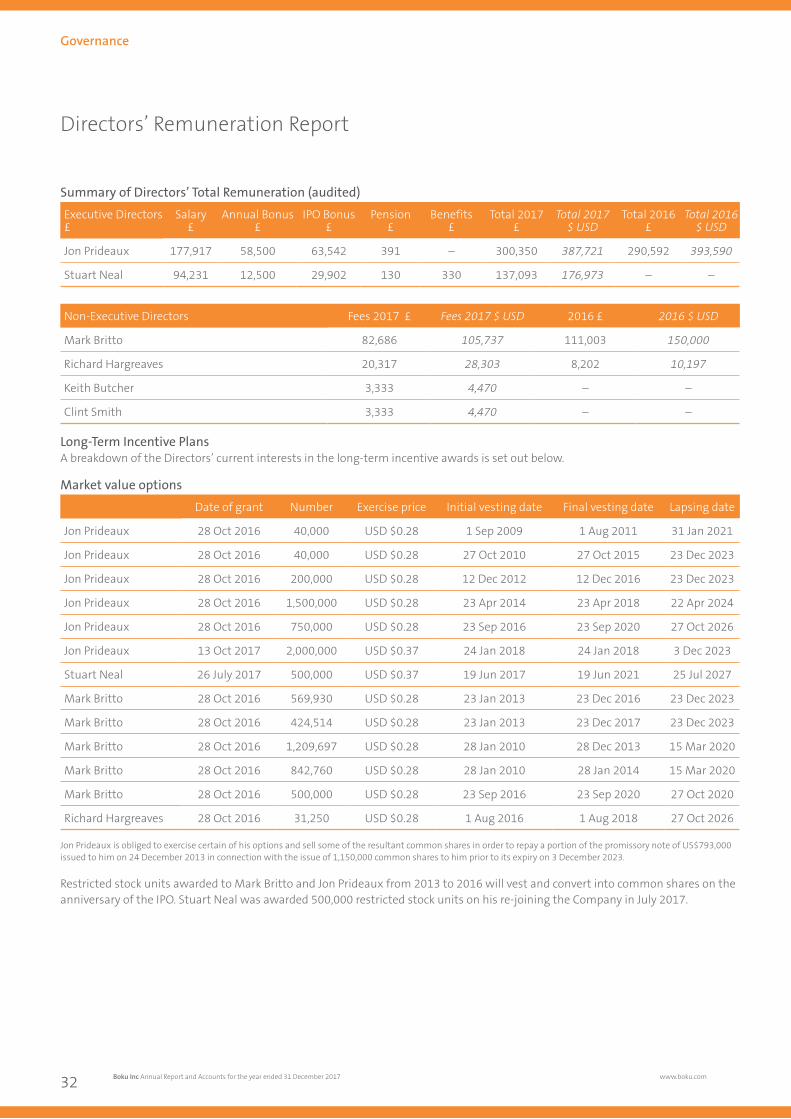
26004 9 April 2018 5:55 PM Proof 5
Directors’ Remuneration Report
Summary of Directors’ Total Remuneration (audited)
Executive Directors Salary Annual Bonus IPO Bonus Pension Benefits Total 2017 Total 2017 Total 2016 Total 2016£ £ £ £ £ £ £ $ USD £ $ USD
Jon Prideaux 177,917 58,500 63,542 391 – 300,350 387,721 290,592 393,590
Stuart Neal 94,231 12,500 29,902 130 330 137,093 176,973 – –
Non-Executive Directors Fees 2017 £ Fees 2017 $ USD 2016 £ 2016 $ USD
Mark Britto 82,686 105,737 111,003 150,000
Richard Hargreaves 20,317 28,303 8,202 10,197
Keith Butcher 3,333 4,470 – –
Clint Smith 3,333 4,470 – –
Long-Term Incentive PlansA breakdown of the Directors’ current interests in the long-term incentive awards is set out below.
Market value options
Date of grant Number Exercise price Initial vesting date Final vesting date Lapsing date
Jon Prideaux 28 Oct 2016 40,000 USD $0.28 1 Sep 2009 1 Aug 2011 31 Jan 2021
Jon Prideaux 28 Oct 2016 40,000 USD $0.28 27 Oct 2010 27 Oct 2015 23 Dec 2023
Jon Prideaux 28 Oct 2016 200,000 USD $0.28 12 Dec 2012 12 Dec 2016 23 Dec 2023
Jon Prideaux 28 Oct 2016 1,500,000 USD $0.28 23 Apr 2014 23 Apr 2018 22 Apr 2024
Jon Prideaux 28 Oct 2016 750,000 USD $0.28 23 Sep 2016 23 Sep 2020 27 Oct 2026
Jon Prideaux 13 Oct 2017 2,000,000 USD $0.37 24 Jan 2018 24 Jan 2018 3 Dec 2023
Stuart Neal 26 July 2017 500,000 USD $0.37 19 Jun 2017 19 Jun 2021 25 Jul 2027
Mark Britto 28 Oct 2016 569,930 USD $0.28 23 Jan 2013 23 Dec 2016 23 Dec 2023
Mark Britto 28 Oct 2016 424,514 USD $0.28 23 Jan 2013 23 Dec 2017 23 Dec 2023
Mark Britto 28 Oct 2016 1,209,697 USD $0.28 28 Jan 2010 28 Dec 2013 15 Mar 2020
Mark Britto 28 Oct 2016 842,760 USD $0.28 28 Jan 2010 28 Jan 2014 15 Mar 2020
Mark Britto 28 Oct 2016 500,000 USD $0.28 23 Sep 2016 23 Sep 2020 27 Oct 2020
Richard Hargreaves 28 Oct 2016 31,250 USD $0.28 1 Aug 2016 1 Aug 2018 27 Oct 2026
Jon Prideaux is obliged to exercise certain of his options and sell some of the resultant common shares in order to repay a portion of the promissory note of US$793,000 issued to him on 24 December 2013 in connection with the issue of 1,150,000 common shares to him prior to its expiry on 3 December 2023.
Restricted stock units awarded to Mark Britto and Jon Prideaux from 2013 to 2016 will vest and convert into common shares on the anniversary of the IPO. Stuart Neal was awarded 500,000 restricted stock units on his re-joining the Company in July 2017.
Governance
Boku Inc Annual Report and Accounts for the year ended 31 December 2017 www.boku.com32
26004 Boku AR2017.indd 32 09/04/2018 17:56:20
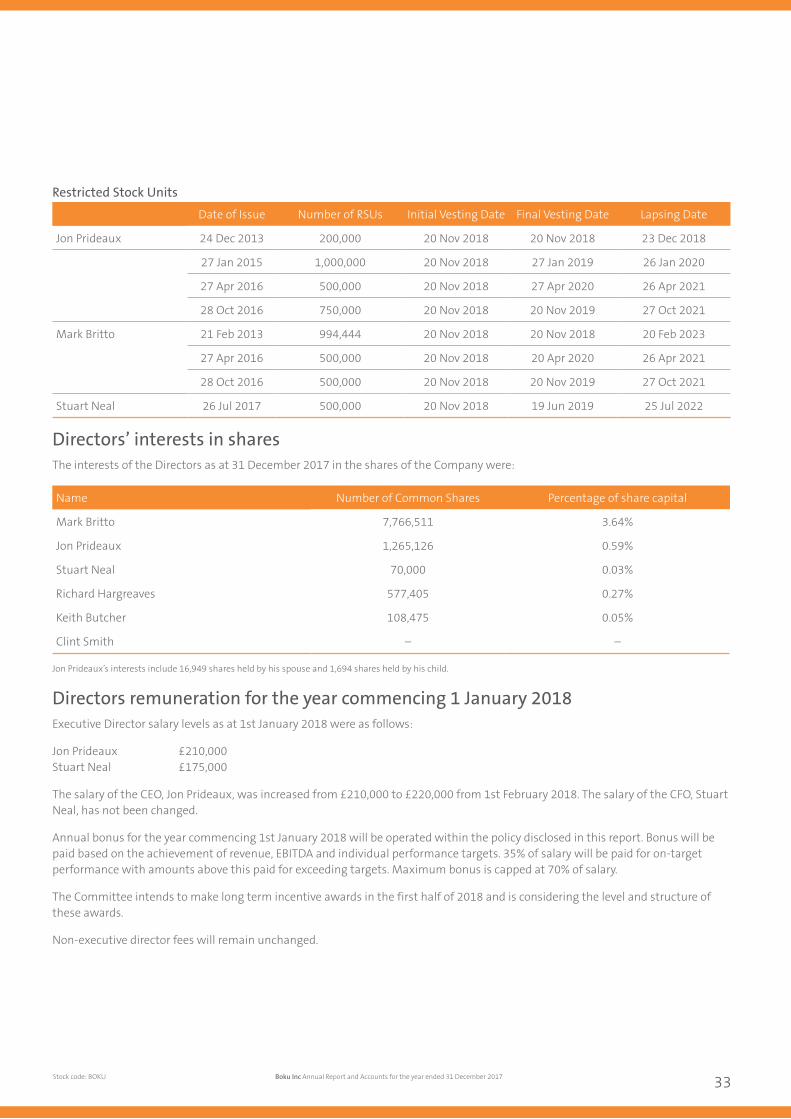
26004 9 April 2018 5:55 PM Proof 5 26004 9 April 2018 5:55 PM Proof 5
Restricted Stock Units
Date of Issue Number of RSUs Initial Vesting Date Final Vesting Date Lapsing Date
Jon Prideaux 24 Dec 2013 200,000 20 Nov 2018 20 Nov 2018 23 Dec 2018
27 Jan 2015 1,000,000 20 Nov 2018 27 Jan 2019 26 Jan 2020
27 Apr 2016 500,000 20 Nov 2018 27 Apr 2020 26 Apr 2021
28 Oct 2016 750,000 20 Nov 2018 20 Nov 2019 27 Oct 2021
Mark Britto 21 Feb 2013 994,444 20 Nov 2018 20 Nov 2018 20 Feb 2023
27 Apr 2016 500,000 20 Nov 2018 20 Apr 2020 26 Apr 2021
28 Oct 2016 500,000 20 Nov 2018 20 Nov 2019 27 Oct 2021
Stuart Neal 26 Jul 2017 500,000 20 Nov 2018 19 Jun 2019 25 Jul 2022
Directors’ interests in sharesThe interests of the Directors as at 31 December 2017 in the shares of the Company were:
Name Number of Common Shares Percentage of share capital
Mark Britto 7,766,511 3.64%
Jon Prideaux 1,265,126 0.59%
Stuart Neal 70,000 0.03%
Richard Hargreaves 577,405 0.27%
Keith Butcher 108,475 0.05%
Clint Smith – –
Jon Prideaux’s interests include 16,949 shares held by his spouse and 1,694 shares held by his child.
Directors remuneration for the year commencing 1 January 2018Executive Director salary levels as at 1st January 2018 were as follows:
Jon Prideaux £210,000Stuart Neal £175,000
The salary of the CEO, Jon Prideaux, was increased from £210,000 to £220,000 from 1st February 2018. The salary of the CFO, Stuart Neal, has not been changed.
Annual bonus for the year commencing 1st January 2018 will be operated within the policy disclosed in this report. Bonus will be paid based on the achievement of revenue, EBITDA and individual performance targets. 35% of salary will be paid for on-target performance with amounts above this paid for exceeding targets. Maximum bonus is capped at 70% of salary.
The Committee intends to make long term incentive awards in the first half of 2018 and is considering the level and structure of these awards.
Non-executive director fees will remain unchanged.
Stock code: BOKU Boku Inc Annual Report and Accounts for the year ended 31 December 2017 33
26004 Boku AR2017.indd 33 09/04/2018 17:56:20
26004 9 April 2018 5:55 PM Proof 5
Directors’ Report
The Directors present their report and the audited financial statements for Boku, Inc. for the year ended 31 December 2017.
The preparation of financial statements is in compliance with IFRS as issued by the International Accounting Standards Board (“IASB”).
Principal ActivitiesBoku, Inc. is a holding company.
The principal activity of the Boku, Inc. and its subsidiaries (“the Group”) is the provision of mobile billing and payment solutions for Mobile Network Operators and merchants. These solutions enable consumers to make online payments using their mobile devices.
Business review and future developmentsThe review of the period’s activities, operations, future developments and key risks is contained in the Strategic Report on pages 2 to 19.
DirectorsThe Directors who held office during the period and subsequently were as follows:
1. Mark Britto2. Jon Prideaux 3. Stuart Neal (appointed on 20 November 2017)4. Richard Hargreaves5. Keith Butcher (appointed on 20 November 2017)6. Clint Smith
With regard to the appointment and replacement of Directors, the Company is governed by its Charter (the US equivalent of the Articles of Association) and related legislation. The Charter may be amended by special resolution of the shareholders.
Directors’ interestsThe Remuneration and Audit Committee reports can be found of pages 28 and 26 respectively.
Directors’ share options and interests in shares can be found in the remuneration report on page 32.
Directors’ indemnitiesThe Company has made qualifying third party indemnity provisions for the benefit of its Directors which were made during the period and remain in force at the date of this report.
DividendsThe Directors do not recommend a final ordinary dividend for the period (2016: £nil).
Post Balance Sheet EventsThere are no material post balance sheet events to disclose.
Financial Risk managementDetails of financial risk management are provided in note 3 to the accounts.
Political and charitable contributionsThe Group made no charitable or political contributions during the period.
Internal ControlThe Board has overall responsibility for the Group’s system of internal control and for reviewing its effectiveness. The processes to identify and manage the key risks of the group are an integral part of the internal control environment. Such processes, which are regularly reviewed and improved as necessary, include strategic planning, approval of annual budgets, regular monitoring of performance against budget (including full investigation of significant variances), control of capital expenditure, ensuring proper accounting records are maintained, the appointment of senior management and the setting of high standards for health, safety and environmental performance. The effectiveness of the internal control system and procedures is monitored regularly through a combination of review by management, the results of which are reported to and considered by the Audit Committee. The system of internal control comprises those controls established to provide assurance that the assets of the Group are safeguarded against unauthorized use and to ensure the maintenance of proper accounting records and the reliability of financial information used within the business or for publication. Any system of internal control can only provide reasonable, but not absolute, assurance against material misstatement or loss, as it is designed to manage rather than eliminate the risk of failing to achieve the business objectives of the Group.
Going ConcernThe Directors, having made appropriate enquiries, consider that the Company and the Group as a whole have adequate resources to continue in operational existence for the foreseeable future. Therefore, they continue to adopt the going concern basis in preparing the financial statements.
Purchase of own sharesThe Group does not hold any shares in treasury.
Governance
Boku Inc Annual Report and Accounts for the year ended 31 December 2017 www.boku.com34
26004 Boku AR2017.indd 34 09/04/2018 17:56:21
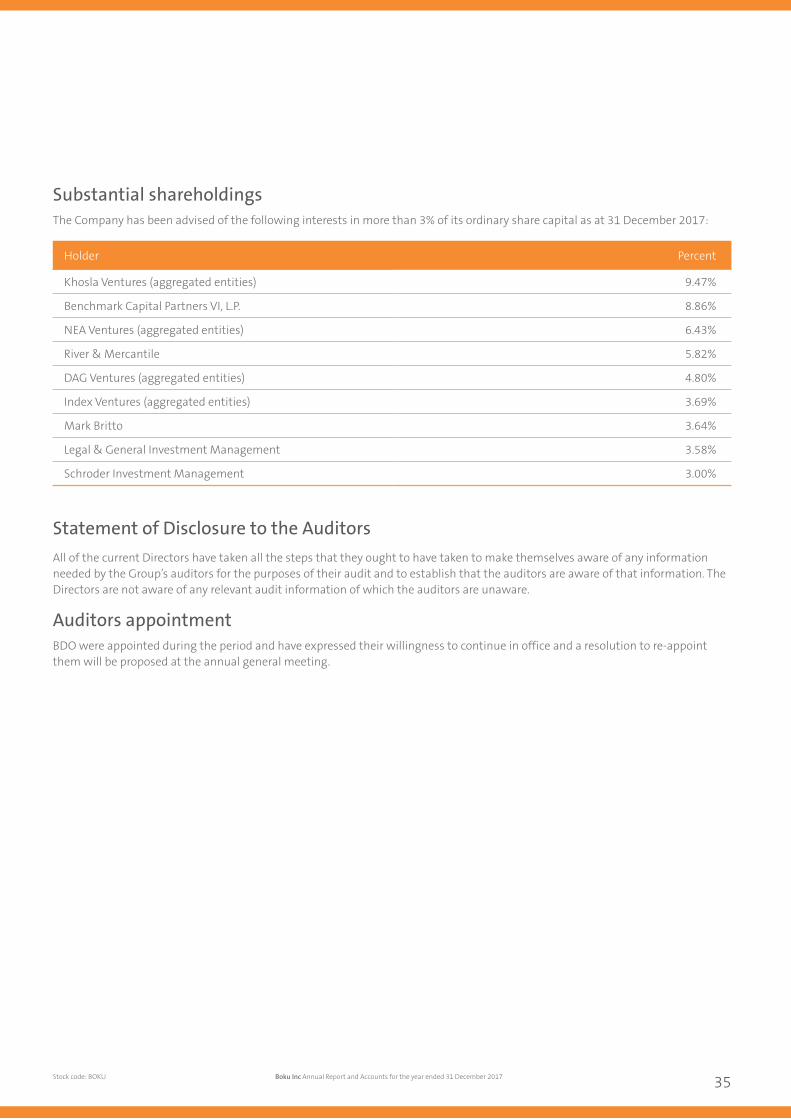
26004 9 April 2018 5:55 PM Proof 5 26004 9 April 2018 5:55 PM Proof 5
Substantial shareholdingsThe Company has been advised of the following interests in more than 3% of its ordinary share capital as at 31 December 2017:
Holder Percent
Khosla Ventures (aggregated entities) 9.47%
Benchmark Capital Partners VI, L.P. 8.86%
NEA Ventures (aggregated entities) 6.43%
River & Mercantile 5.82%
DAG Ventures (aggregated entities) 4.80%
Index Ventures (aggregated entities) 3.69%
Mark Britto 3.64%
Legal & General Investment Management 3.58%
Schroder Investment Management 3.00%
Statement of Disclosure to the AuditorsAll of the current Directors have taken all the steps that they ought to have taken to make themselves aware of any information needed by the Group’s auditors for the purposes of their audit and to establish that the auditors are aware of that information. The Directors are not aware of any relevant audit information of which the auditors are unaware.
Auditors appointmentBDO were appointed during the period and have expressed their willingness to continue in office and a resolution to re-appoint them will be proposed at the annual general meeting.
Stock code: BOKU Boku Inc Annual Report and Accounts for the year ended 31 December 2017 35
26004 Boku AR2017.indd 35 09/04/2018 17:56:21
26004 9 April 2018 5:55 PM Proof 626004 9 April 2018 5:55 PM Proof 5
Directors’ Responsibility Statement
The Directors are responsible for preparing the Annual Report and the financial statements in accordance with applicable law and regulations.
The Company is incorporated in and subject to the laws of the State of Delaware, United Stated, which does not require the Directors to prepare financial statements for each financial year, however the group is required to do so to satisfy the requirements of the AIM Rules for Companies. When preparing the financial statements, the Directors are required to prepare the group financial statements in accordance with an appropriate set of generally accepted accounting principles or practice. The Directors have elected to use International Financial Reporting Standards (IFRSs) as issued by the International Accounting Standards Board.
The Directors must not approve the accounts unless they are satisfied that they give a true and fair view of the state of affairs of the Company and of the profit or loss of the Company for that period. In preparing these financial statements, International Accounting Standard 1 (revised) requires that directors:
• Properly select and apply accounting policies;
• Present information, including accounting policies, in a manner that provides relevant, reliable, comparable and understandable information;
• Provide additional disclosures when compliance with the specific requirements in IFRSs are insufficient to enable users to understand the impact of particular transactions, other events and conditions on the entity’s financial position and financial performance; and
• Make an assessment of the Company’s ability to continue as a going concern.
The Directors are responsible for keeping adequate accounting records that correctly explain the transactions of the Company, enable the financial position of the Company to be determined with reasonable accuracy at any time and allow financial statements to be prepared. They are also responsible for safeguarding the assets of the Company and hence for taking reasonable steps for the prevention and detection of fraud and other irregularities.
The Directors are responsible for the maintenance and integrity of the corporate and financial information included on the Company’s website. Information published on the website is accessible in many countries and legislation in the United Kingdom governing the preparation and dissemination of financial statements may differ from legislation in other jurisdictions. The Directors’ responsibility also extends to the continued integrity of the financial statements contained therein.
By order of the Board
Jon Prideaux Chief Executive Officer9th April 2018
Governance
Boku Inc Annual Report and Accounts for the year ended 31 December 2017 www.boku.com36
26004 Boku AR2017.indd 36 09/04/2018 17:56:21
26004 9 April 2018 5:55 PM Proof 6 26004 9 April 2018 5:55 PM Proof 626004 9 April 2018 5:55 PM Proof 5
Independent auditor’s report to the members of Boku Inc.
OpinionWe have audited the consolidated financial statements of Boku Inc and its subsidiaries (the ‘Group’) for the year ended 31 December, 2017 which comprise the consolidated statement of comprehensive income, the consolidated statement of financial position, the consolidated statement of changes in equity, the consolidated statement of cash flows and notes to the financial statements, including a summary of significant accounting policies.
The financial reporting framework that has been applied in the preparation of the financial statements is applicable law and International Financial Reporting Standards (IFRSs) as issued by the International Accounting Standards Board.
In our opinion:• the financial statements give a true and fair view of the state of the Group’s affairs as at 31 December 2017 and of the Group’s
loss for the year then ended; • the financial statements have been properly prepared in accordance with IFRSs issued by the International Accounting Standards
Board.
Basis for opinionWe conducted our audit in accordance with International Standards on Auditing (UK) (ISAs (UK)) and applicable law. Our responsibilities under those standards are further described in the Auditor’s responsibilities for the audit of the financial statements section of our report. We are independent of the Group in accordance with the ethical requirements that are relevant to our audit of the financial statements in the UK, including the FRC’s Ethical Standard as applied to listed entities, and we have fulfilled our other ethical responsibilities in accordance with these requirements. We believe that the audit evidence we have obtained is sufficient and appropriate to provide a basis for our opinion.
Use of our reportThis report is made solely to the members of Boku Inc (the ‘parent company), as a body, in accordance with the terms of our engagement letter dated 22 December 2017, and should not be used by anyone other than these specified parties or for any other purpose. Our audit work has been undertaken so that we might state to the parent company’s members those matters we are required to state to them in an auditor’s report and for no other purpose. To the fullest extent permitted by law, we do not accept or assume responsibility to anyone other than the parent company and the parent company’s members as a body, for our audit work, for this report, or for the opinions we have formed.
Conclusions relating to going concernWe have nothing to report in respect of the following matters in relation to which the ISAs (UK) require us to report to you where:
• the directors’ use of the going concern basis of accounting in the preparation of the financial statements is not appropriate; or
• the directors have not disclosed in the financial statements any identified material uncertainties that may cast significant doubt about the Group’s ability to continue to adopt the going concern basis of accounting for a period of at least twelve months from the date when the financial statements are authorised for issue.
Stock code: BOKU Boku Inc Annual Report and Accounts for the year ended 31 December 2017 37
26004 Boku AR2017.indd 37 09/04/2018 17:56:21
26004 9 April 2018 5:55 PM Proof 2
Independent Auditor’s Report
Key audit mattersKey audit matters are those matters that, in our professional judgment, were of most significance in our audit of the financial statements of the current period and include the most significant assessed risks of material misstatement (whether or not due to fraud) we identified, including those which had the greatest effect on: the overall audit strategy, the allocation of resources in the audit; and directing the efforts of the engagement team. These matters were addressed in the context of our audit of the financial statements as a whole, and in forming our opinion thereon, and we do not provide a separate opinion on these matters.
Key audit matter How we addressed the matter in our audit
Revenue
See accounting policy and revenue information is in notes 2 and 4 respectively.
We considered there to be a significant audit risk arising from inappropriate or incorrect recognition of revenue, including relating to management override, appropriate application of agent verses principal accounting, cut-off of revenue transactions at the year end and whether the accounting policy is not aligned with IFRS. Furthermore, the presumed risk of improper recognition of revenue due to fraud has also been identified as a significant risk.
Revenue recognition is one of the primary focuses of the engagement team. Due to this focus, revenue recognition is considered to be a key audit matter.
Our procedures included reviewing the group’s adopted revenue recognition policy to ensure that it complies with accounting standards and has been consistently applied throughout the year giving particular attention to IAS 18 ‘revenues’.
We tested revenue where the group acts as an agent through substantive procedures over the gross cash receipts from mobile network operators (‘MNO’s’) and the gross cash payments made to merchants. Our procedures included testing amounts received to carrier statements and cash receipts, and amounts paid to merchant invoices and cash payments.
We tested material revenue transactions recorded near the end of the year and subsequent to the year end to confirm appropriate recognition in the year under audit
We substantively tested the net service fees received to documentation received from the customer and to cash receipts.
Finally, we selected a sample of key contracts for testing. We assessed whether the revenue recognised was in line with the contractual terms, the group’s revenue recognition policy and the relevant accounting standards.
Financials
Boku Inc Annual Report and Accounts for the year ended 31 December 2017 www.boku.com38
26004 Boku AR2017.indd 38 09/04/2018 17:56:21
26004 9 April 2018 5:55 PM Proof 626004 9 April 2018 5:55 PM Proof 2
Key audit matter How we addressed the matter in our audit
Intangible assets, including Goodwill
See accounting policy and intangible assets information in notes 2 and 11 respectively
The group has material intangible assets, including goodwill, arising primarily from acquisitions as part of prior business combinations, and capitalised research and development costs. The group has determined that its intangibles are a single cash generating unit.
We considered there to be a significant audit risk arising in relation to the accuracy and valuation of all intangibles.
The group is required to assess, at each reporting date, whether there are any indicators that assets may be impaired, Such assessment should include consideration of information from both internal and external sources.
Further, notwithstanding whether indicators exist, the recoverability of Goodwill and intangible assets with indefinite useful lives are required to be tested at least annually.
Due to the inherent uncertainty involved in forecasting and discounting future cash flows, we therefore identified the impairment of the carrying value of capitalised development costs as a significant risk.
We first considered the appropriateness of the Group’s conclusions regarding the existence of a single cash generating unit, and considered the nature of the assets held by the group and how these are used to generate revenues and therefore cash flows.
We also evaluated the Group’s assessment of potential impairment indicators noting that no such indicator of impairment had been identified. We considered the evaluation of internal and external information to corroborating data, including in particular management’s projections and forecasts prepared in connection with its annual impairment test, as described further below.
In respect of goodwill we obtained management’s projections of future performance and evaluated the appropriateness of the key inputs and assumptions used, being revenue growth and the discount factor used, as well as considered the sensitivity of those key inputs to the overall conclusion.
In respect of all definite life intangibles (being Merchant relationships, Trademarks and Internally developed software), we obtained management’s evaluation of potential impairment indicators and, where appropriate, obtained management’s projections and evaluated the appropriateness of the key inputs and assumptions used, as noted above, together with evidential matter to support each separate intangibles future value, and considered the sensitivity of those key inputs to the overall conclusion. Finally, we considered the appropriateness of the remaining useful lives and amortisation rates applied on these intangible assets.
We also evaluated the Group’s disclosures relating to its evaluation of impairment indicators and the annual impairment testing as provided in note 11.
Stock code: BOKU Boku Inc Annual Report and Accounts for the year ended 31 December 2017 39
26004 Boku AR2017.indd 39 09/04/2018 17:56:21
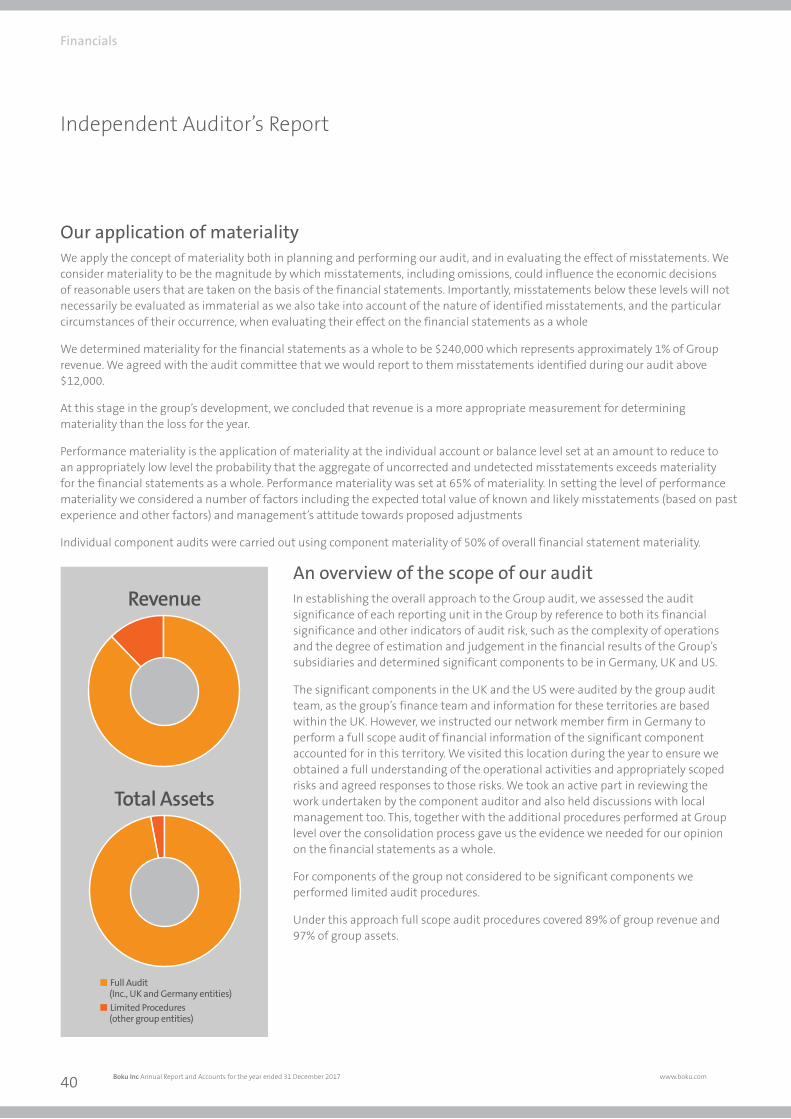
26004 9 April 2018 5:55 PM Proof 2
Independent Auditor’s Report
Our application of materialityWe apply the concept of materiality both in planning and performing our audit, and in evaluating the effect of misstatements. We consider materiality to be the magnitude by which misstatements, including omissions, could influence the economic decisions of reasonable users that are taken on the basis of the financial statements. Importantly, misstatements below these levels will not necessarily be evaluated as immaterial as we also take into account of the nature of identified misstatements, and the particular circumstances of their occurrence, when evaluating their effect on the financial statements as a whole
We determined materiality for the financial statements as a whole to be $240,000 which represents approximately 1% of Group revenue. We agreed with the audit committee that we would report to them misstatements identified during our audit above $12,000.
At this stage in the group’s development, we concluded that revenue is a more appropriate measurement for determining materiality than the loss for the year.
Performance materiality is the application of materiality at the individual account or balance level set at an amount to reduce to an appropriately low level the probability that the aggregate of uncorrected and undetected misstatements exceeds materiality for the financial statements as a whole. Performance materiality was set at 65% of materiality. In setting the level of performance materiality we considered a number of factors including the expected total value of known and likely misstatements (based on past experience and other factors) and management’s attitude towards proposed adjustments
Individual component audits were carried out using component materiality of 50% of overall financial statement materiality.
An overview of the scope of our auditIn establishing the overall approach to the Group audit, we assessed the audit significance of each reporting unit in the Group by reference to both its financial significance and other indicators of audit risk, such as the complexity of operations and the degree of estimation and judgement in the financial results of the Group’s subsidiaries and determined significant components to be in Germany, UK and US.
The significant components in the UK and the US were audited by the group audit team, as the group’s finance team and information for these territories are based within the UK. However, we instructed our network member firm in Germany to perform a full scope audit of financial information of the significant component accounted for in this territory. We visited this location during the year to ensure we obtained a full understanding of the operational activities and appropriately scoped risks and agreed responses to those risks. We took an active part in reviewing the work undertaken by the component auditor and also held discussions with local management too. This, together with the additional procedures performed at Group level over the consolidation process gave us the evidence we needed for our opinion on the financial statements as a whole.
For components of the group not considered to be significant components we performed limited audit procedures.
Under this approach full scope audit procedures covered 89% of group revenue and 97% of group assets.
Revenue
Total Assets
■ Full Audit (Inc., UK and Germany entities)■ Limited Procedures (other group entities)
Financials
Boku Inc Annual Report and Accounts for the year ended 31 December 2017 www.boku.com40
26004 Boku AR2017.indd 40 09/04/2018 17:56:21
26004 9 April 2018 5:55 PM Proof 2 26004 9 April 2018 5:55 PM Proof 2
Other informationThe directors are responsible for the other information. The other information comprises the information included in the annual report other than the financial statements and our auditor’s report thereon. Our opinion on the financial statements does not cover the other information and, except to the extent otherwise explicitly stated in our report, we do not express any form of assurance conclusion thereon.
In connection with our audit of the financial statements, our responsibility is to read the other information and, in doing so, consider whether the other information is materially inconsistent with the financial statements or our knowledge obtained in the audit or otherwise appears to be materially misstated. If we identify such material inconsistencies or apparent material misstatements, we are required to determine whether there is a material misstatement in the financial statements or a material misstatement of the other information. If, based on the work we have performed, we conclude that there is a material misstatement of this other information, we are required to report that fact. We have nothing to report in this regard.
Responsibilities of directorsAs explained more fully in the directors’ responsibilities statement set out on page 36, the directors are responsible for the preparation of the financial statements and for being satisfied that they give a true and fair view, and for such internal control as the directors determine is necessary to enable the preparation of financial statements that are free from material misstatement, whether due to fraud or error.
In preparing the financial statements, the directors are responsible for assessing the Group’s and the parent company’s ability to continue as a going concern, disclosing, as applicable, matters related to going concern and using the going concern basis of accounting unless the directors either intend to liquidate the Group or the parent company or to cease operations, or have no realistic alternative but to do so.
Auditor’s responsibilities for the audit of the financial statementsOur objectives are to obtain reasonable assurance about whether the financial statements as a whole are free from material misstatement, whether due to fraud or error, and to issue an auditor’s report that includes our opinion. Reasonable assurance is a high level of assurance, but is not a guarantee that an audit conducted in accordance with ISAs (UK) will always detect a material misstatement when it exists.
Misstatements can arise from fraud or error and are considered material if, individually or in the aggregate, they could reasonably be expected to influence the economic decisions of users taken on the basis of these financial statements.
A further description of our responsibilities for the audit of the financial statements is located on the Financial Reporting Council’s website at: www.frc.org.uk/auditorsresponsibilities. This description forms part of our auditor’s report.
BDO LLPChartered AccountantsLondon, United Kingdom9 April 2018
BDO LLP is a limited liability partnership registered in England and Wales (with registered number OC305127).
Stock code: BOKU Boku Inc Annual Report and Accounts for the year ended 31 December 2017 41
26004 Boku AR2017.indd 41 09/04/2018 17:56:21
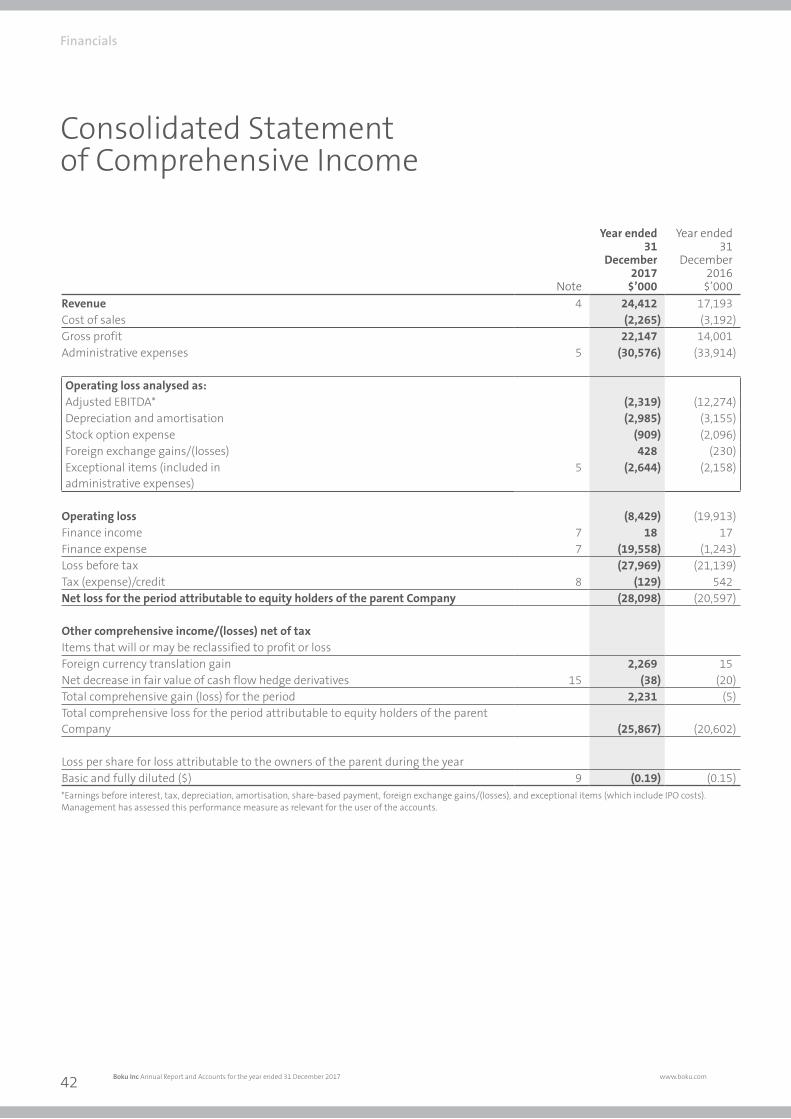
26004 9 April 2018 5:55 PM Proof 6
Consolidated Statement of Comprehensive Income
Note
Year ended31
December2017
$’000
Year ended31
December2016
$’000Revenue 4 24,412 17,193Cost of sales (2,265) (3,192)Gross profit 22,147 14,001Administrative expenses 5 (30,576) (33,914)
Operating loss analysed as:Adjusted EBITDA* (2,319) (12,274)Depreciation and amortisation (2,985) (3,155)Stock option expense (909) (2,096)Foreign exchange gains/(losses) 428 (230)Exceptional items (included in administrative expenses)
5 (2,644) (2,158)
Operating loss (8,429) (19,913)Finance income 7 18 17Finance expense 7 (19,558) (1,243)Loss before tax (27,969) (21,139)Tax (expense)/credit 8 (129) 542Net loss for the period attributable to equity holders of the parent Company (28,098) (20,597)
Other comprehensive income/(losses) net of taxItems that will or may be reclassified to profit or lossForeign currency translation gain 2,269 15Net decrease in fair value of cash flow hedge derivatives 15 (38) (20)Total comprehensive gain (loss) for the period 2,231 (5)Total comprehensive loss for the period attributable to equity holders of the parent Company (25,867) (20,602)
Loss per share for loss attributable to the owners of the parent during the year Basic and fully diluted ($) 9 (0.19) (0.15)*Earnings before interest, tax, depreciation, amortisation, share-based payment, foreign exchange gains/(losses), and exceptional items (which include IPO costs). Management has assessed this performance measure as relevant for the user of the accounts.
Financials
Boku Inc Annual Report and Accounts for the year ended 31 December 2017 www.boku.com42
26004 Boku AR2017.indd 42 09/04/2018 17:56:22
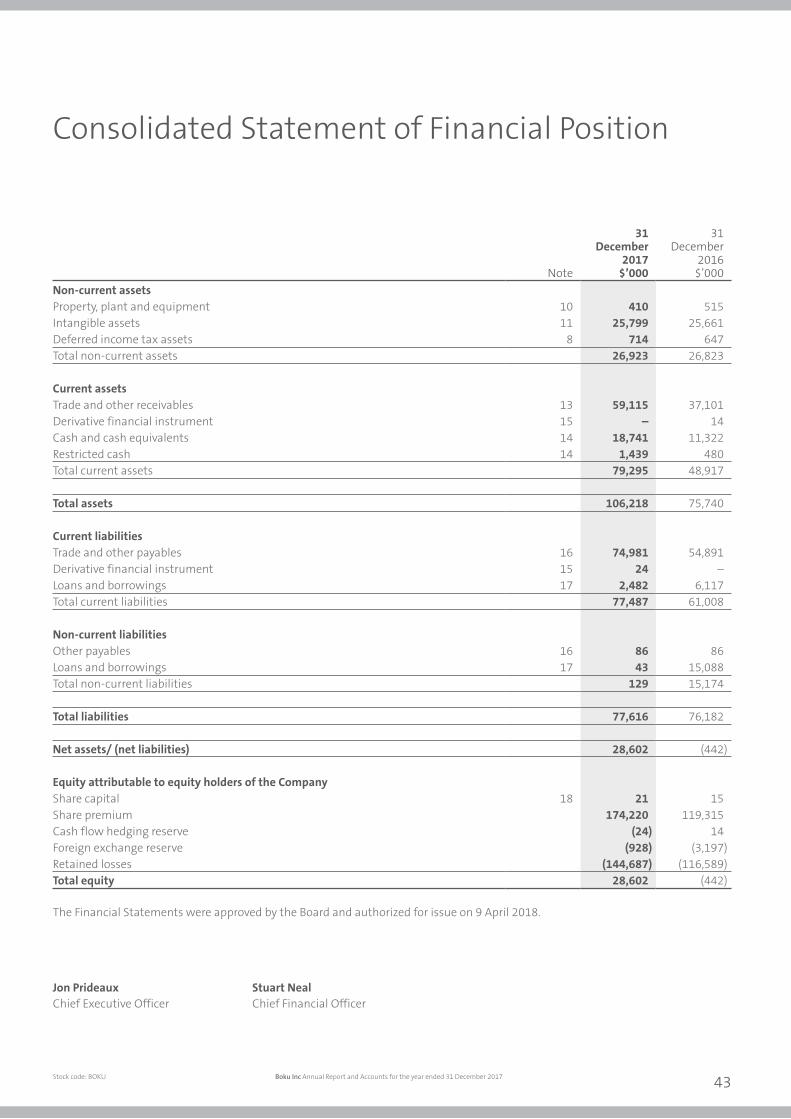
26004 9 April 2018 5:55 PM Proof 6 26004 9 April 2018 5:55 PM Proof 6
Consolidated Statement of Financial Position
Note
31 December
2017$’000
31 December
2016$’000
Non-current assetsProperty, plant and equipment 10 410 515Intangible assets 11 25,799 25,661Deferred income tax assets 8 714 647Total non-current assets 26,923 26,823
Current assetsTrade and other receivables 13 59,115 37,101Derivative financial instrument 15 – 14Cash and cash equivalents 14 18,741 11,322Restricted cash 14 1,439 480Total current assets 79,295 48,917
Total assets 106,218 75,740
Current liabilitiesTrade and other payables 16 74,981 54,891Derivative financial instrument 15 24 –Loans and borrowings 17 2,482 6,117Total current liabilities 77,487 61,008
Non-current liabilitiesOther payables 16 86 86Loans and borrowings 17 43 15,088Total non-current liabilities 129 15,174
Total liabilities 77,616 76,182
Net assets/ (net liabilities) 28,602 (442)
Equity attributable to equity holders of the CompanyShare capital 18 21 15Share premium 174,220 119,315Cash flow hedging reserve (24) 14Foreign exchange reserve (928) (3,197)Retained losses (144,687) (116,589)Total equity 28,602 (442)
The Financial Statements were approved by the Board and authorized for issue on 9 April 2018.
Jon Prideaux Chief Executive Officer
Stuart Neal Chief Financial Officer
Stock code: BOKU Boku Inc Annual Report and Accounts for the year ended 31 December 2017 43
26004 Boku AR2017.indd 43 09/04/2018 17:56:22
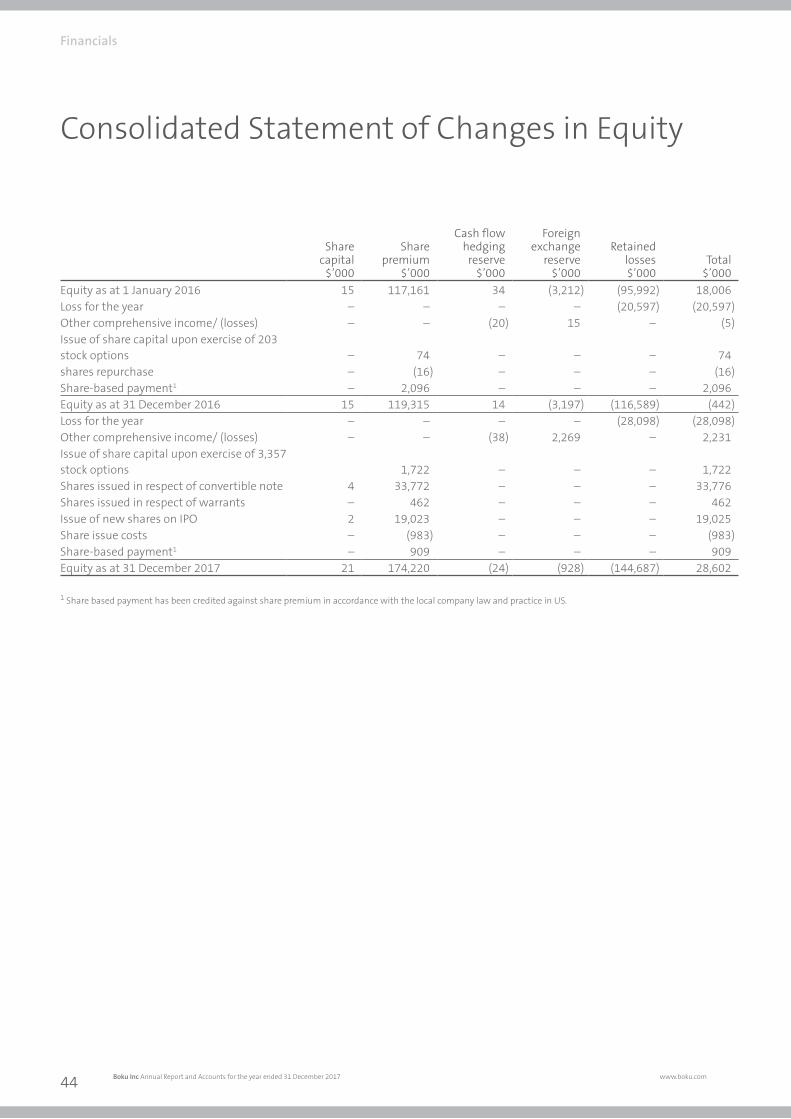
26004 9 April 2018 5:55 PM Proof 6
Share capital
$’000
Share premium
$’000
Cash flow hedging
reserve$’000
Foreign exchange
reserve$’000
Retained losses$’000
Total$’000
Equity as at 1 January 2016 15 117,161 34 (3,212) (95,992) 18,006Loss for the year – – – – (20,597) (20,597)Other comprehensive income/ (losses) – – (20) 15 – (5)Issue of share capital upon exercise of 203 stock options – 74 – – – 74shares repurchase – (16) – – – (16)Share-based payment1 – 2,096 – – – 2,096Equity as at 31 December 2016 15 119,315 14 (3,197) (116,589) (442)Loss for the year – – – – (28,098) (28,098)Other comprehensive income/ (losses) – – (38) 2,269 – 2,231Issue of share capital upon exercise of 3,357 stock options 1,722 – – – 1,722Shares issued in respect of convertible note 4 33,772 – – – 33,776Shares issued in respect of warrants – 462 – – – 462Issue of new shares on IPO 2 19,023 – – – 19,025Share issue costs – (983) – – – (983)Share-based payment1 – 909 – – – 909Equity as at 31 December 2017 21 174,220 (24) (928) (144,687) 28,602
1 Share based payment has been credited against share premium in accordance with the local company law and practice in US.
Consolidated Statement of Changes in Equity
Financials
Boku Inc Annual Report and Accounts for the year ended 31 December 2017 www.boku.com44
26004 Boku AR2017.indd 44 09/04/2018 17:56:22
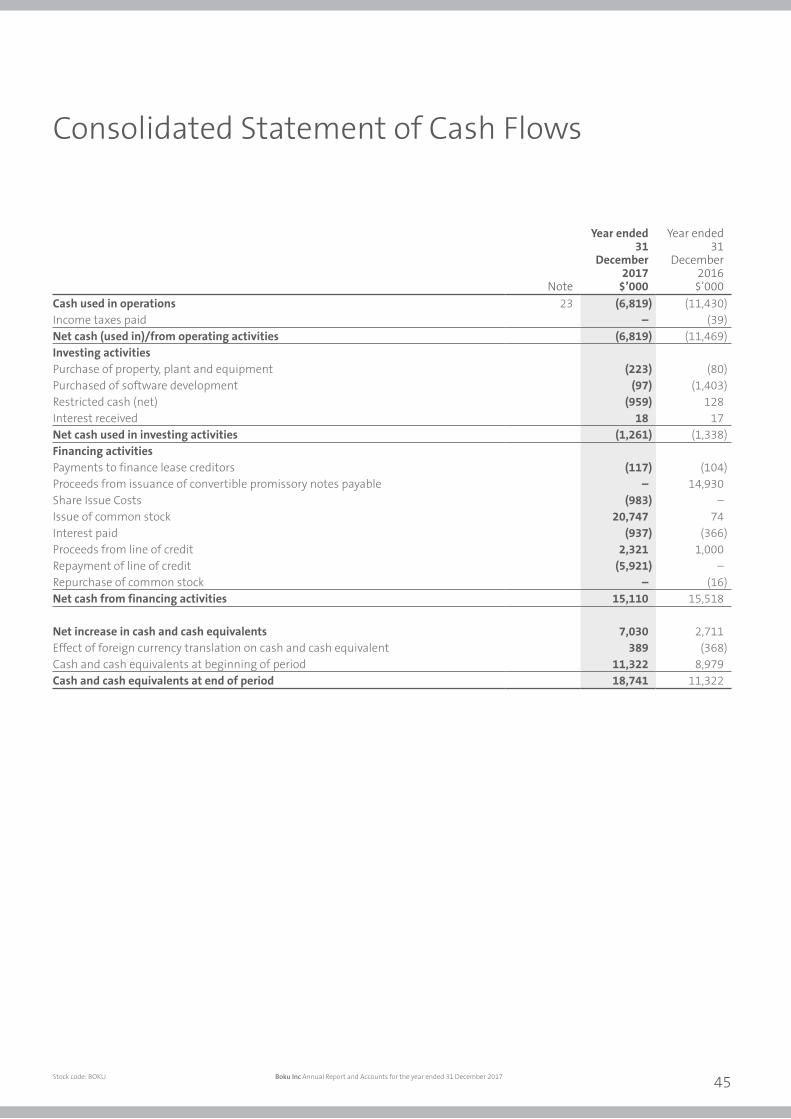
26004 9 April 2018 5:55 PM Proof 6 26004 9 April 2018 5:55 PM Proof 6
Consolidated Statement of Cash Flows
Note
Year ended31
December2017
$’000
Year ended31
December2016
$’000Cash used in operations 23 (6,819) (11,430)Income taxes paid – (39)Net cash (used in)/from operating activities (6,819) (11,469)Investing activitiesPurchase of property, plant and equipment (223) (80)Purchased of software development (97) (1,403)Restricted cash (net) (959) 128Interest received 18 17Net cash used in investing activities (1,261) (1,338)Financing activitiesPayments to finance lease creditors (117) (104)Proceeds from issuance of convertible promissory notes payable – 14,930Share Issue Costs (983) –Issue of common stock 20,747 74Interest paid (937) (366)Proceeds from line of credit 2,321 1,000Repayment of line of credit (5,921) –Repurchase of common stock – (16)Net cash from financing activities 15,110 15,518
Net increase in cash and cash equivalents 7,030 2,711Effect of foreign currency translation on cash and cash equivalent 389 (368)Cash and cash equivalents at beginning of period 11,322 8,979Cash and cash equivalents at end of period 18,741 11,322
Stock code: BOKU Boku Inc Annual Report and Accounts for the year ended 31 December 2017 45
26004 Boku AR2017.indd 45 09/04/2018 17:56:22
26004 9 April 2018 5:55 PM Proof 6
Notes to the Consolidated Financial Statements
1. Corporate InformationThe consolidated financial statements represent the results of Boku, Inc. (“the Company”) and its subsidiaries (together referred to as “the Group”).
Boku, Inc. is a company incorporated and domiciled in the United States of America. The registered office of the Company is located at 735 Battery St., 2nd Floor, and San Francisco, CA 94111, United States.
On 20th November 2017, the Company’s shares were listed on the Alternative Investment Market of the London Stock Exchange (“AIM”).
The principal business of the Group is the provision of mobile billing and payment solutions for Mobile Network Operators and merchants. These solutions enable consumers to make online payments using their mobile devices.
2. Accounting policiesThe financial statements have been prepared using the historical cost convention, as modified by the revaluation of certain derivative financial instruments, as stated in the accounting policies below. These policies have been consistently applied to all periods presented, unless otherwise stated.
Basis of preparationThe consolidated financial statements have been prepared in accordance with International Financial Reporting Standards (IFRSs) as issued by the International Accounting Standards Board.
The preparation of financial statements in compliance with IFRS requires the use of certain critical accounting estimates. It also requires Group management to exercise judgment in applying the Group’s accounting policies. The areas where significant judgments and estimates have been made in preparing the financial statements and their effect are disclosed below.
The presentation currency of the financial statements is US Dollars, rounded to the nearest thousands ($’000) unless otherwise indicated. The Company’s functional currency is US Dollars.
Going concernThe Directors have prepared a cash flow forecast covering a period extending beyond 12 months from the date of these financial statements.
The forecast contains certain assumptions about the performance of the business including growth in future revenue which are deemed high volume and low value in nature, the cost model and margins; and importantly the level of cash recovery from trading. Furthermore, investment in winning customers via marketing expenditure, remains an important function of the forecasts. The Group obtained additional funding through the placement of shares on AIM. Collectively, all will provide working capital to cover both operating activities and the repayment of existing debt facilities. The Directors are aware of the risks and uncertainties facing the business but the assumptions used are the Directors’ best estimate of the future development of the business.
After considering the forecasts and the risks, the Directors have a reasonable expectation that the Group has adequate resources to continue in operational existence for the foreseeable future. For these reasons, they continue to adopt the going concern basis of accounting in preparing the annual financial statements.
Basis of consolidationWhere the Company has control over an investee, it is classified as a subsidiary. The Company controls an investee if all three of the following elements are present: power over the investee, exposure to variable returns from the investee, and the ability of the investor to use its power to affect those variable returns. Control is reassessed whenever facts and circumstances indicate that there may be a change in any of these elements of control.
The consolidated financial statements present the results of the Company and its subsidiaries (“the Group”) as if they formed a single entity. Intercompany transactions and balances between group companies are therefore eliminated in full.
Financials
Boku Inc Annual Report and Accounts for the year ended 31 December 2017 www.boku.com46
26004 Boku AR2017.indd 46 09/04/2018 17:56:22
26004 9 April 2018 5:55 PM Proof 6 26004 9 April 2018 5:55 PM Proof 6
2. Accounting policies continuedThe consolidated financial statements incorporate the results of business combinations using the acquisition method. In the statement of financial position, the acquiree’s identifiable assets, liabilities and contingent liabilities are initially recognised at their fair values at the acquisition date. The results of acquired operations are included in the consolidated statement of comprehensive income from the date on which control is obtained. They are deconsolidated from the date on which control ceases.
A list of the subsidiary undertakings which, in the opinion of the Directors, principally affected the amounts of profit or loss and net assets of the Group is given in note 12 of the financial statements.
Changes in accounting policies and disclosures(a) New and amended standards adopted by the Group
The Group has applied any applicable new standards, amendments to standards and interpretations that are mandatory for the financial year beginning on 1 January 2017. However, none of them has a material impact on the Group’s consolidated financial statements.
(b) New, amended standards, interpretations not yet effective
The following new standards, interpretations and amendments, which are not yet effective and have not been adopted early in these financial statements, will or may have an effect on the Group’s future financial statements:
• IFRS 15 Revenue from Contracts with Customers, effective date 1 January 2018. IFRS 15 is intended to clarify the principles of revenue recognition and establish a single framework for revenue recognition. This standard replaces the previous standard IAS 11 Construction Contracts, IAS18 Revenue and revenue related IFRICs. The core principle is that an entity should recognise revenue to depict the transfer of promised goods or services to customers in an amount that reflects the consideration to which the entity expects to be entitled in exchange for those goods or services. The Directors have reviewed the standard and its potential effects in the context of the Group’s revenue policy and have concluded that, on adoption, there is not expected to be a material impact on or change to the Group’s revenue.
• IFRS 9 Financial Instruments, effective date 1 January 2018. IFRS 9 is a replacement for IAS 39 ‘Financial Instruments’ and covers three distinct areas. Phase 1 contains new requirements for the classification and measurement of financial assets and liabilities. Phase 2 relates to the impairment of financial assets and requires the calculation of impairment on an expected loss basis rather than the current incurred loss basis. Phase 3 relates to less stringent requirements for general hedge accounting. The Group will need to apply an expected credit loss model when calculating impairment losses on its trade and other receivables (both current and non-current). This will potentially result in increased impairment provisions and greater judgement due to the need to factor in forward looking information when estimating the appropriate amount of provisions. In applying IFRS 9 the group must consider the probability of a default occurring over the contractual life of its trade receivables and contracts asset balances on initial recognition of those assets. The directors are in the process of reviewing the potential effects of adopting this standard, and will provide details of the full financial effect of the interims results for the period ending 30 June 2018.
• IFRS 16 Leases, effective date 1 January 2019 sets out the principles for the recognition, measurement, presentation and disclosure of leases for both parties to a contract, i.e. the customer (‘lessee’) and the supplier (‘lessor’). IFRS 16 completes the IASB’s project to improve the financial reporting of leases and replaces the previous leases Standard, IAS 17 Leases, and related Interpretations. If the standard were to be adopted during the current financial period and applied to the operating leases currently in the Group, will bring all operating leases onto the balance sheet in line with the accounting treatment for finance leases. The impact would be an increase in the assets of the company by the amounts showing in note 21. It is envisaged that, as the Group expands, the use of operating leases will increase.
Stock code: BOKU Boku Inc Annual Report and Accounts for the year ended 31 December 2017 47
26004 Boku AR2017.indd 47 09/04/2018 17:56:22
26004 9 April 2018 5:55 PM Proof 6
Notes to the Consolidated Financial Information
2. Accounting policies continuedForeign CurrencyThe main functional currencies for the Company’s subsidiaries are the United States Dollar, Euro and Great Britain Pound.
Foreign currency transactions and balances
i. Foreign currency transactions are translated into the functional currency using the exchange rates prevailing at the dates of the transactions.
ii. Foreign exchange gains and losses resulting from the settlement of such transactions and from the translation at the reporting period end exchange rates of monetary assets and liabilities denominated in foreign currencies are recognised in the income statement.
iii. Share capital, share premium, brought forward earnings are translated using the exchange rates prevailing at the dates of the transactions.
Consolidation of foreign entities
On consolidation, results of the foreign entities are translated from the local functional currency to US$ using average exchange rates during the period. All asset and liabilities are translated from the local functional currency to US$ using the reporting period end exchange rates. These exchange differences arising from the translation of the net investment in foreign entities are recognised in other comprehensive income and accumulated in a separate component of equity.
Exchange differences are recycled to profit or loss as a reclassification adjustment upon disposal of the foreign operation.
Revenue RecognitionRevenue for the Group is measured at the fair value of the consideration received or receivable. The Group recognises revenue for services provided when the amount of revenue can be reliably measured and it is probable that future economic benefits will flow to the entity.
The Group provides a payment platform to facilitate the mobile payment processing of virtual and digital goods purchases and also provides a collection service for amounts due to the merchants.
The Group’s revenue is principally its service fees. These fees are received or receivable:
1. Settlement Model: when it acts as an agent between a merchant and Mobile Network Operators (MNOs) or an aggregator (a middleman between the Group and the MNO). The service fee recognised is the difference between amounts collected from the MNOs or the aggregator and the amounts remitted to merchants; and
2. Transactional Model: from larger virtual and digital merchants who receive the sale collections direct and pay a service fee to the Group.
Amounts collected on behalf of merchantsThe Group recognises accrued income when mobile device users purchase virtual goods and digital goods through the Company’s payment platform. Once the Group receives confirmation of payment information from the Aggregator or the MNO, the Company reverses the accrued income and records the invoiced amount as trade receivable. The period from when the mobile device user purchases the virtual goods or digital goods to when the Group receives payment from Aggregators, or MNO, ranges from less than one month to six months or more. On receipt of this payment, the amount is paid to the merchant for the virtual goods or digital goods sold.
When an amount due to a merchant is still outstanding, the Group recognises and includes this as part of trade payables.
Cost of salesCost of sales is primarily related to the costs incurred by the Group to authorise the transactions of mobile device customers with the associated MNOs.
Financials
Boku Inc Annual Report and Accounts for the year ended 31 December 2017 www.boku.com48
26004 Boku AR2017.indd 48 09/04/2018 17:56:23

26004 9 April 2018 5:55 PM Proof 6 26004 9 April 2018 5:55 PM Proof 6
2. Accounting policies continuedOperating SegmentsOperating segments are reported in a manner consistent with the internal reporting provided to the chief operating decision-maker. The chief operating decision-maker has been identified as the executive management team including the Chief Executive Officer, Chief Financial Officer, Chief Operating Officer and the Chief Revenue Officer.
The Board considers that the Group’s provision of a payment platform for the payment processing of virtual goods and digital goods purchases constitutes one operating and one reporting segment, as defined under IFRS 8. Management reviews the performance of the Group by reference to total results against budget.
Retirement Benefits: Defined contribution schemesThe Company has a 401(k) plan, a type of defined contribution scheme in the United States in which all employees are eligible to participate after meeting eligibility requirements. Participants may elect to have a portion of their salary deferred and contributed to the scheme up to the limit allowed by applicable income tax regulations. The Company has made a matching contribution to the scheme for the year ended 31 December 2017.
Contributions to defined contribution schemes are charged to the consolidated statement of comprehensive income in the year to which they relate.
Share-based paymentsWhere equity settled share options are awarded to employees, the fair value of the options at the date of grant is charged to the consolidated statement of comprehensive income over the vesting period. Non-market vesting conditions are taken into account by adjusting the number of equity instruments expected to vest at each reporting date so that, ultimately, the cumulative amount recognised over the vesting period is based on the number of options that eventually vest.
Where the terms and conditions of options are modified before they vest, the increase in the fair value of the options, measured immediately before and after the modification, is also charged to the consolidated statement of comprehensive income over the remaining vesting period.
Where equity instruments are granted to persons other than employees, the consolidated statement of comprehensive income is charged with the fair value of goods and services received.
Intangible assets(i) GoodwillThe Group uses the acquisition method of accounting for the acquisition of a subsidiary. The consideration transferred is measured at the fair value of the assets given, equity instruments issued and liabilities incurred or assumed at the date of exchange. Costs directly attributable to the acquisition are expensed in the period. Identifiable assets acquired, liabilities and contingent liabilities assumed in a business combination are measured initially at their fair values at the acquisition date.
In respect of business combinations that have occurred since 1 January 2014, goodwill represents the excess of the cost of the acquisition and the Group’s interest fair value of net identifiable assets and liabilities acquired. In respect of business combinations prior to this date, goodwill is included on the basis of its deemed cost, which represents the amount recorded under US GAAP. As permitted by IFRS 1, Goodwill arising on acquisitions prior to 1 January 2014 is stated in accordance with US GAAP and has not been remeasured on transition to IFRS. Goodwill is recognised and measured at the acquisition date.
Goodwill is capitalised as an intangible asset at cost less any accumulated impairment losses. Any impairment in carrying value is being charged to the consolidated statement of comprehensive income. An impairment loss recognised for goodwill is not reversed.
Where the fair value of identifiable assets, liabilities and contingent liabilities exceed the fair value of consideration paid, the excess is credited in full to the consolidated statement of comprehensive income on the acquisition date.
Stock code: BOKU Boku Inc Annual Report and Accounts for the year ended 31 December 2017 49
26004 Boku AR2017.indd 49 09/04/2018 17:56:23
26004 9 April 2018 5:55 PM Proof 6
Notes to the Consolidated Financial Information
2. Accounting policies continuedGoodwill is allocated to appropriate cash generating units (CGUs). Goodwill is not amortised but is tested annually for impairment or whenever events or changes in circumstances indicate that the carrying amount may not be recoverable. The recoverable amount is determined based on value in use calculations. The use of this method requires the estimation of future cash flows and the determination of a discount rate in order to calculate the present value of the cash flows. The major assumptions are disclosed in note 11.
(ii) Intangible assets acquired as part of a business combinationIntangible assets acquired in a business combination are identified and recognised separately from goodwill where they satisfy the definition of an intangible asset. The cost of such intangible assets is their fair value at the acquisition date and comprises Group’s tradenames, merchant relationships and developed technologies. All intangible assets acquired through business combination are amortised over their useful lives.
Subsequent to initial recognition, intangible assets acquired in a business combination are reported at cost less accumulated amortisation and accumulated impairment losses. The carrying values are tested for impairment when there is an indication that the value of the assets might be impaired
(iii) Research and developmentExpenditure on research activities as defined in IFRS is recognised in the income statement as an expense as incurred.
Expenditure on internally developed software products and substantial enhancements to existing software product is recognised as intangible assets only when the following criteria are met:
1. it is technically feasible to develop the product to be used or sold;2. there is an intention to complete and use or sell the product;3. the Group is able to use or sell the product;4. use or sale of the product will generate future economic benefits;5. adequate resources are available to complete the development; and6. expenditure on the development of the product can be measured reliably.
The capitalised expenditure represents costs directly attributable to the development of the asset from the point at which the above criteria are met up to the point at which the product is ready to use. The costs include external direct costs of materials and services consumed in developing and obtaining internal-use computer software, and payroll and payroll-related costs for employees who are directly associated with and who devote time to developing the internal-use software. If the qualifying conditions are not met, such development expenditure is recognised as an expense in the period in which it is incurred.
(iv) Amortisation rates The significant intangibles recognised by the Group and their useful economic lives are as follows:
Intangible asset Useful economic lifeTradenames 10 yearsMerchant relationships 5 yearsDeveloped technologies 1 - 7 years Domain names 5 yearsInternally developed software 3 - 6.75 years
The amortisation expense is recognised within administrative expenses in the consolidated statement of comprehensive income.
Financials
Boku Inc Annual Report and Accounts for the year ended 31 December 2017 www.boku.com50
26004 Boku AR2017.indd 50 09/04/2018 17:56:23
26004 9 April 2018 5:55 PM Proof 6 26004 9 April 2018 5:55 PM Proof 6
2. Accounting policies continuedProperty, plant and equipmentProperty, plant and equipment are held under the cost model and are stated at historical cost less accumulated depreciation and any accumulated impairment losses. Historical cost includes expenditure that is directly attributable to bringing the asset to the location and condition necessary for it to be capable of operating in the manner intended by management.
Depreciation is charged so as to allocate the cost of assets less their residual value over their estimated useful lives, using the straight-line method. The estimated useful lives range as follows:
Office equipment and furniture 3- 5 years on costComputer equipment and software 3- 5 years on cost Leasehold improvement 6.5 years on cost
Cash and cash equivalentsCash and cash equivalents includes cash in hand, deposits held at call with banks, other short term highly liquid investments with original maturities of three months or less.
Restricted cashThe restricted cash does not meet the definition of cash and cash equivalents and is therefore separately disclosed in the Group’s statement of financial position and not part of the cash and cash equivalents for cash flow purposes. These cash amounts are restricted as to withdrawal or use under the terms of certain contractual agreements.
Financial assetsOn initial recognition, the Group classifies its financial assets as either financial assets at fair value through profit or loss, held-to-maturity investments, loans and receivables financial assets, or available-for-sale financial assets, as appropriate. The classification depends on the purpose for which the financial assets were acquired. At each reporting year-end, the financial assets of the Group are all classified as loans and receivables or derivative financial instruments.
The Group has factored certain of its accounts receivable under agreements which it is not committed to underwrite any of the debts transferred. Such amounts are derecognised following the receipt of proceeds from the factoring company.
Loans and receivablesThese assets are non-derivative financial assets with fixed or determinable payments that are not quoted in an active market. They arise principally through the provision of goods and services to customers (trade receivables and accrued income), but also incorporate other types of contractual monetary assets.
They are initially recognised at fair value and measured subsequent to initial recognition at amortised cost using the effective interest rate method, less any impairment loss.
The Group’s loans and receivables and financial assets comprise trade receivables, accrued income, other receivables (excluding prepayments) and cash and cash equivalents.
Loans and receivables - impairmentA provision for impairment of trade and other receivables is recognised when there is objective evidence of impairment as a result of one or more events having an impact on the estimated future cash flow of these assets.
Financial liabilitiesFinancial liabilities are recognised when the Group becomes a party to the contractual agreements of the instrument. The Group’s financial liabilities are all categorised as loans and payables or derivative financial instruments.
Stock code: BOKU Boku Inc Annual Report and Accounts for the year ended 31 December 2017 51
26004 Boku AR2017.indd 51 09/04/2018 17:56:23
26004 9 April 2018 5:55 PM Proof 6
Notes to the Consolidated Financial Information
2. Accounting policies continuedAt initial recognition, • Financial liabilities (trade and other payables, excluding other taxes and social security costs and deferred income), are measured
at their fair value plus, if appropriate, any transaction costs that are directly attributable to the issue of the financial liability. These financial liabilities are subsequently carried at amortised cost.
• Bank borrowings which are initially recognised at fair value net any of transaction costs directly attributable to the issue of the instrument. Such interest-bearing liabilities are subsequently measured at amortised cost ensuring the interest element of the borrowing is expensed over the repayment period at a constant rate.
Derivative financial instruments Hedge accounting is applied to financial assets and liabilities only where all the following criteria are met:
• At the inception of the hedge there is formal designation and documentation of the hedging relationship and the Group’s risk management objective and strategy for undertaking the hedge.
• For cash flow hedges, the hedged item in a forecast transaction is highly probable and presents an exposure to variations in cash flows that could ultimately affect profit or loss.
• The cumulative change in the fair value of the hedging instrument is expected to be between 80-125% of the cumulative change in the fair value or cash flows of the hedged item attributable to the risk hedged (i.e. it is expected to be highly effective).
• The effectiveness of the hedge can be reliably measured.
• The hedge remains highly effective on each date tested.
Cash flow hedgesThe Group from time to time enters into derivative financial instruments such as forward foreign exchange contracts to reduce the potential impact of decreases in the value of the US dollar on receipt payments from Aggregator and MNO.
The effective part of the gain or loss of these forward contracts designated as a hedge of the variability in cash flows of foreign currency risk arising from the above firm commitments are measured at fair value with changes in fair value recognised in other comprehensive income and accumulated in the cash flow hedge reserve. The ineffective portion of the gain or loss of these contracts is recognised in the Group’s profit or loss. The associated gains or losses that were recognised in other comprehensive income shall be reclassified from the cash flow hedge reserve to profit or loss as a reclassification adjustment in the same period during which the hedged forecast cash flows affect profit or loss.
The value of the forward contracts within one year is disclosed separately as derivatives under current assets or liabilities in the Group’s statement of financial positions.
Convertible loan notesThe convertible loan notes issued in 2016 are considered to be a hybrid financial instrument comprising a financial liability (loan) and an embedded derivative liability (share option). The number of shares to be issued will vary as it’s based on the Company’s lowest share price at conversion date. At the date of issue both elements were included in the balance sheet as liabilities and held at fair value. The fair value of the loan element was estimated using the prevailing market interest rate for similar non - convertible debt. Subsequently the convertible loan notes were accounted for as a financial liability at amortised cost.
On conversion of the loan note to equity, any difference between the fair value of the equity issued and the previous fair value of the note is charged to finance expense, within the Consolidated Statement of Comprehensive Income.
Financials
Boku Inc Annual Report and Accounts for the year ended 31 December 2017 www.boku.com52
26004 Boku AR2017.indd 52 09/04/2018 17:56:23
26004 9 April 2018 5:55 PM Proof 6 26004 9 April 2018 5:55 PM Proof 6
2. Accounting policies continuedFair Value HierarchyAll financial instruments measured at fair value must be classified into one of the levels below:
• Level 1: Quoted prices, in active markets.
• Level 2: Fair Inputs other than quoted market prices included within Level 1 that are observable for the asset or liability, either directly or indirectly.
• Level 3: Inputs that are not based on observable market data.
Share CapitalFinancial instruments issued by the Group are treated as equity only to the extent that they do not meet the definition of a financial liability. The Group’s ordinary share capital and preference shares are classified as equity instruments.
Operating leases: lessee Rentals paid under operating leases are charged to the profit or loss on a straight-line basis over the period of the lease.
Leased assets: lesseeWhere assets are financed by leasing agreements that give rights approximating to ownership (finance leases), the assets are treated as if they had been purchased outright. The amount capitalised is the present value of the minimum lease payments payable over the term of the lease. The corresponding leasing commitments are shown as amounts payable to the lessor. Depreciation on the relevant assets is charged to the income statement over the shorter of estimated useful economic life and the term of the lease.
Lease payments are analysed between capital and interest components so that the interest element of the payment is charged to the income statement over the term of the lease and is calculated on an effective interest rate basis. The capital part reduces the amounts payable to the lessor.
Deferred taxationDeferred tax assets and liabilities are recognised where the carrying amount of an asset or liability in the consolidated statement of financial position differs from its tax base, except for differences arising on:
• the initial recognition of goodwill;
• the initial recognition of an asset or liability in a transaction which is not a business combination and at the time of the transaction affects neither accounting or taxable profit; and
• investments in subsidiaries where the Group is able to control the timing of the reversal of the difference and it is probable that the difference will not reverse in the foreseeable future.
Recognition of deferred tax assets is restricted to those instances where it is probable that taxable profit will be available against which the difference can be utilised.
The amount of the asset or liability is determined using tax rates that have been enacted or substantively enacted by the balance sheet date and are expected to apply when the deferred tax liabilities or assets are settled or recovered. Deferred tax balances are not discounted.
Deferred tax assets and liabilities are offset when the Group has a legally enforceable right to offset current tax assets and liabilities and the deferred tax assets and liabilities relate to taxes levied by the same tax authority on either:
• the same taxable group company; or
• different company entities which intend either to settle current tax assets and liabilities on a net basis, or to realise the assets and settle the liabilities simultaneously, in each future period in which significant amounts of deferred tax assets and liabilities are expected to be settled or recovered.
Stock code: BOKU Boku Inc Annual Report and Accounts for the year ended 31 December 2017 53
26004 Boku AR2017.indd 53 09/04/2018 17:56:23
26004 9 April 2018 5:55 PM Proof 6
Notes to the Consolidated Financial Information
2. Accounting policies continuedCritical accounting estimates and judgements The Group makes certain estimates and assumptions regarding the future. Estimates and judgements are continually evaluated based on historical experience and other factors, including the expectations of future events that are believed to be reasonable under the circumstances. In the future, actual experience may differ from these estimates and assumptions. The estimates and assumptions that have a significant risk of causing a material adjustment to the carrying amounts of assets and liabilities within the next financial year are discussed below.
(a) Goodwill, Intangible assets acquired in a business combinationAs set in the accounting policies above, intangible assets acquired in a business combination are capitalised and amortised over their useful lives. Both initial valuations and valuations for subsequent impairment tests are based on risk adjusted future cash flows discounted using appropriate discount rates. These future cash flows will be based on forecasts which are inherently judgemental. Future events could cause the assumptions to change which could have an adverse effect on the future results of the Group. Refer to note 11 for a description of the specific estimates and judgements used and the net book values of intangible assets.
(b) Share-based paymentsThe Group measures the cost of equity-settled transactions with employees by reference to the fair value of the equity instruments at the date at which they are granted. Estimating fair value for share-based payment transactions requires determining the most appropriate valuation model, which is dependent on the terms and conditions of the grant. This estimate also requires determining the most appropriate inputs to the valuation model including the expected life of the share option, volatility and dividend yield and making assumptions about them.
(c) TaxationIn recognising income tax assets and liabilities, management makes estimates of the likely outcome of decisions by tax authorities on transactions and events whose treatment for tax purposes is uncertain. Where the final outcome of such matters is different, or expected to be different, from previous assessments made by management, a change to the carrying value of income tax assets and liabilities will be recorded in the period in which such a determination is made. In recognising deferred tax assets and liabilities management also makes judgements about likely future taxable profits. The carrying values of current tax and deferred tax assets and liabilities are disclosed separately in the consolidated statement of financial position.
3. Financial instruments – Risk ManagementThe Board has overall responsibility for the determination of the Group’s risk management objectives and policies. The overall objective of the Board is to set policies that seek to reduce risk as far as possible without unduly affecting the Group’s competitiveness and flexibility. The Group reports in US$. All funding requirements and financial risks are managed based on policies and procedures adopted by the Board of Directors. The Group does not issue or use financial instruments of a speculative nature.
The Group is exposed to the following financial risks:
• Market risk
• Credit risk
• Liquidity risk
In common with all other businesses, the Group is exposed to risks that arise from its use of financial instruments. The principal financial instruments used by the Group, from which financial instrument risk arises, are as follows:
• Trade and other receivables
• Cash and cash equivalents and restricted cash
• Trade and other payables
• Bank loans
Financials
Boku Inc Annual Report and Accounts for the year ended 31 December 2017 www.boku.com54
26004 Boku AR2017.indd 54 09/04/2018 17:56:23
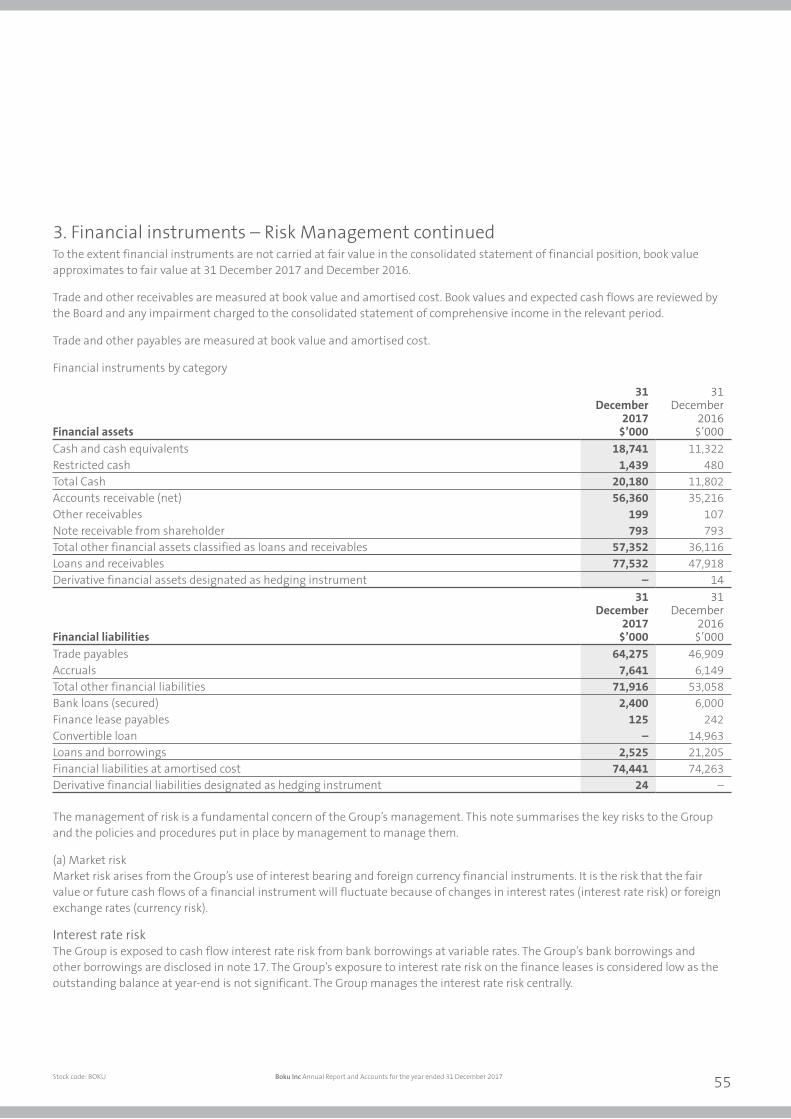
26004 9 April 2018 5:55 PM Proof 6 26004 9 April 2018 5:55 PM Proof 6
3. Financial instruments – Risk Management continuedTo the extent financial instruments are not carried at fair value in the consolidated statement of financial position, book value approximates to fair value at 31 December 2017 and December 2016.
Trade and other receivables are measured at book value and amortised cost. Book values and expected cash flows are reviewed by the Board and any impairment charged to the consolidated statement of comprehensive income in the relevant period.
Trade and other payables are measured at book value and amortised cost.
Financial instruments by category
Financial assets
31 December
2017$’000
31 December
2016$’000
Cash and cash equivalents 18,741 11,322Restricted cash 1,439 480Total Cash 20,180 11,802Accounts receivable (net) 56,360 35,216Other receivables 199 107Note receivable from shareholder 793 793Total other financial assets classified as loans and receivables 57,352 36,116Loans and receivables 77,532 47,918Derivative financial assets designated as hedging instrument – 14
Financial liabilities
31 December
2017$’000
31 December
2016$’000
Trade payables 64,275 46,909Accruals 7,641 6,149Total other financial liabilities 71,916 53,058Bank loans (secured) 2,400 6,000Finance lease payables 125 242Convertible loan – 14,963Loans and borrowings 2,525 21,205Financial liabilities at amortised cost 74,441 74,263Derivative financial liabilities designated as hedging instrument 24 –
The management of risk is a fundamental concern of the Group’s management. This note summarises the key risks to the Group and the policies and procedures put in place by management to manage them.
(a) Market risk Market risk arises from the Group’s use of interest bearing and foreign currency financial instruments. It is the risk that the fair value or future cash flows of a financial instrument will fluctuate because of changes in interest rates (interest rate risk) or foreign exchange rates (currency risk).
Interest rate riskThe Group is exposed to cash flow interest rate risk from bank borrowings at variable rates. The Group’s bank borrowings and other borrowings are disclosed in note 17. The Group’s exposure to interest rate risk on the finance leases is considered low as the outstanding balance at year-end is not significant. The Group manages the interest rate risk centrally.
Stock code: BOKU Boku Inc Annual Report and Accounts for the year ended 31 December 2017 55
26004 Boku AR2017.indd 55 09/04/2018 17:56:23
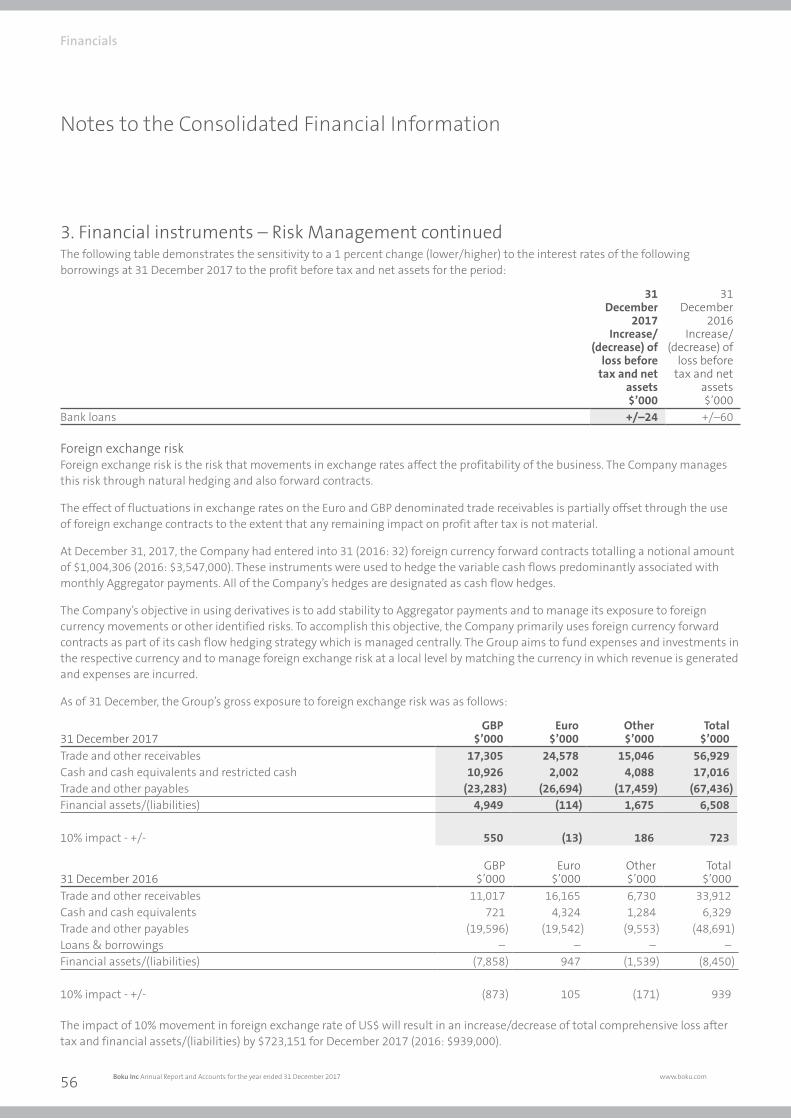
26004 9 April 2018 5:55 PM Proof 6
Notes to the Consolidated Financial Information
3. Financial instruments – Risk Management continuedThe following table demonstrates the sensitivity to a 1 percent change (lower/higher) to the interest rates of the following borrowings at 31 December 2017 to the profit before tax and net assets for the period:
31 December
2017Increase/
(decrease) of loss before
tax and net assets$’000
31 December
2016Increase/
(decrease) of loss before
tax and net assets$’000
Bank loans +/–24 +/–60
Foreign exchange riskForeign exchange risk is the risk that movements in exchange rates affect the profitability of the business. The Company manages this risk through natural hedging and also forward contracts.
The effect of fluctuations in exchange rates on the Euro and GBP denominated trade receivables is partially offset through the use of foreign exchange contracts to the extent that any remaining impact on profit after tax is not material.
At December 31, 2017, the Company had entered into 31 (2016: 32) foreign currency forward contracts totalling a notional amount of $1,004,306 (2016: $3,547,000). These instruments were used to hedge the variable cash flows predominantly associated with monthly Aggregator payments. All of the Company’s hedges are designated as cash flow hedges.
The Company’s objective in using derivatives is to add stability to Aggregator payments and to manage its exposure to foreign currency movements or other identified risks. To accomplish this objective, the Company primarily uses foreign currency forward contracts as part of its cash flow hedging strategy which is managed centrally. The Group aims to fund expenses and investments in the respective currency and to manage foreign exchange risk at a local level by matching the currency in which revenue is generated and expenses are incurred.
As of 31 December, the Group’s gross exposure to foreign exchange risk was as follows:
31 December 2017GBP
$’000Euro
$’000Other$’000
Total$’000
Trade and other receivables 17,305 24,578 15,046 56,929Cash and cash equivalents and restricted cash 10,926 2,002 4,088 17,016Trade and other payables (23,283) (26,694) (17,459) (67,436)Financial assets/(liabilities) 4,949 (114) 1,675 6,508
10% impact - +/- 550 (13) 186 723
31 December 2016GBP
$’000Euro
$’000Other$’000
Total$’000
Trade and other receivables 11,017 16,165 6,730 33,912Cash and cash equivalents 721 4,324 1,284 6,329Trade and other payables (19,596) (19,542) (9,553) (48,691)Loans & borrowings – – – –Financial assets/(liabilities) (7,858) 947 (1,539) (8,450)
10% impact - +/- (873) 105 (171) 939
The impact of 10% movement in foreign exchange rate of US$ will result in an increase/decrease of total comprehensive loss after tax and financial assets/(liabilities) by $723,151 for December 2017 (2016: $939,000).
Financials
Boku Inc Annual Report and Accounts for the year ended 31 December 2017 www.boku.com56
26004 Boku AR2017.indd 56 09/04/2018 17:56:23
26004 9 April 2018 5:55 PM Proof 6 26004 9 April 2018 5:55 PM Proof 6
3. Financial instruments – Risk Management continued(b) Credit risk
Credit risk is the risk of financial loss to the Group if a customer or counterparty to a financial instrument fails to meet its contractual obligations. The Group is mainly exposed to credit risk from credit sales. The Group’s net trade receivables for the three reported periods are disclosed in the financial assets table above.
The Group is exposed to credit risk in respect of these balances such that, if one or more the aggregators or MNOs encounters financial difficulties, this could materially and adversely affect the Group’s financial results. The Group attempts to mitigate credit risk by assessing the credit rating of new customers prior to entering into contracts and by entering contracts with customers with agreed credit terms.
In order to minimise this credit risk, the Group endeavours only to deal with companies which are demonstrably creditworthy and this, together with the aggregate financial exposure, is continuously monitored. The maximum exposure to credit risk is the value of the outstanding amount.
The Company evaluates the collectability of its accounts receivable and provides an allowance for potential credit losses as necessary. The Company has factored accounts receivable as a means of financing and at 31 December 2017, 7% of the Company’s accounts receivable were factored (2016: 5%). The Group can draw down to a maximum of 85% of the trade receivables and paid factoring, collection fee and interest on the drawdown. The fee charged during the year was $542,989 (2016: $170,780) charged to the profit and loss account, under finance expenses. The Group is not committed to underwrite any of the debts transferred and therefore continues to de-recognise the debts sold within trade receivables as the debts would have been settled, following receipts of proceeds from factoring company.
Other receivables are considered to be low risk. The management do not consider that there is any concentration of risk within other receivables. No other receivables have been impaired.
Credit risk on cash and cash equivalents is considered to be small as the counterparties are all substantial banks with high credit ratings. At times, domestic deposits may be in excess of the amount of insurance provided on such deposits. At December 31 2017, cash and cash equivalents of $18,740,583 held in foreign institutions are not insured (2016: $2,766,000). The maximum exposure is the amount of the deposit. To date, the Company has not experienced any losses on its cash and cash equivalent deposits.
Stock code: BOKU Boku Inc Annual Report and Accounts for the year ended 31 December 2017 57
26004 Boku AR2017.indd 57 09/04/2018 17:56:23
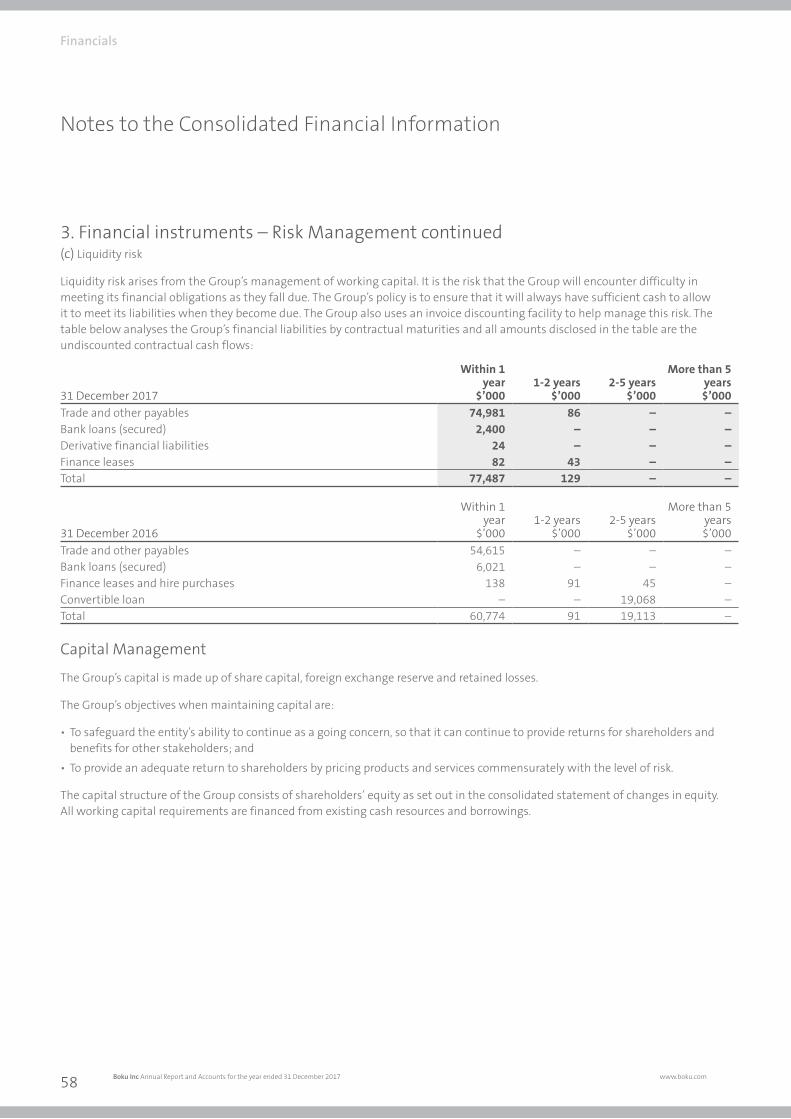
26004 9 April 2018 5:55 PM Proof 6
Notes to the Consolidated Financial Information
3. Financial instruments – Risk Management continued(c) Liquidity risk
Liquidity risk arises from the Group’s management of working capital. It is the risk that the Group will encounter difficulty in meeting its financial obligations as they fall due. The Group’s policy is to ensure that it will always have sufficient cash to allow it to meet its liabilities when they become due. The Group also uses an invoice discounting facility to help manage this risk. The table below analyses the Group’s financial liabilities by contractual maturities and all amounts disclosed in the table are the undiscounted contractual cash flows:
31 December 2017
Within 1 year
$’0001-2 years
$’0002-5 years
$’000
More than 5 years$’000
Trade and other payables 74,981 86 – –Bank loans (secured) 2,400 – – –Derivative financial liabilities 24 – – –Finance leases 82 43 – –Total 77,487 129 – –
31 December 2016
Within 1 year
$’0001-2 years
$’0002-5 years
$’000
More than 5 years$’000
Trade and other payables 54,615 – – –Bank loans (secured) 6,021 – – –Finance leases and hire purchases 138 91 45 –Convertible loan – – 19,068 –Total 60,774 91 19,113 –
Capital Management
The Group’s capital is made up of share capital, foreign exchange reserve and retained losses.
The Group’s objectives when maintaining capital are:
• To safeguard the entity’s ability to continue as a going concern, so that it can continue to provide returns for shareholders and benefits for other stakeholders; and
• To provide an adequate return to shareholders by pricing products and services commensurately with the level of risk.
The capital structure of the Group consists of shareholders’ equity as set out in the consolidated statement of changes in equity. All working capital requirements are financed from existing cash resources and borrowings.
Financials
Boku Inc Annual Report and Accounts for the year ended 31 December 2017 www.boku.com58
26004 Boku AR2017.indd 58 09/04/2018 17:56:24
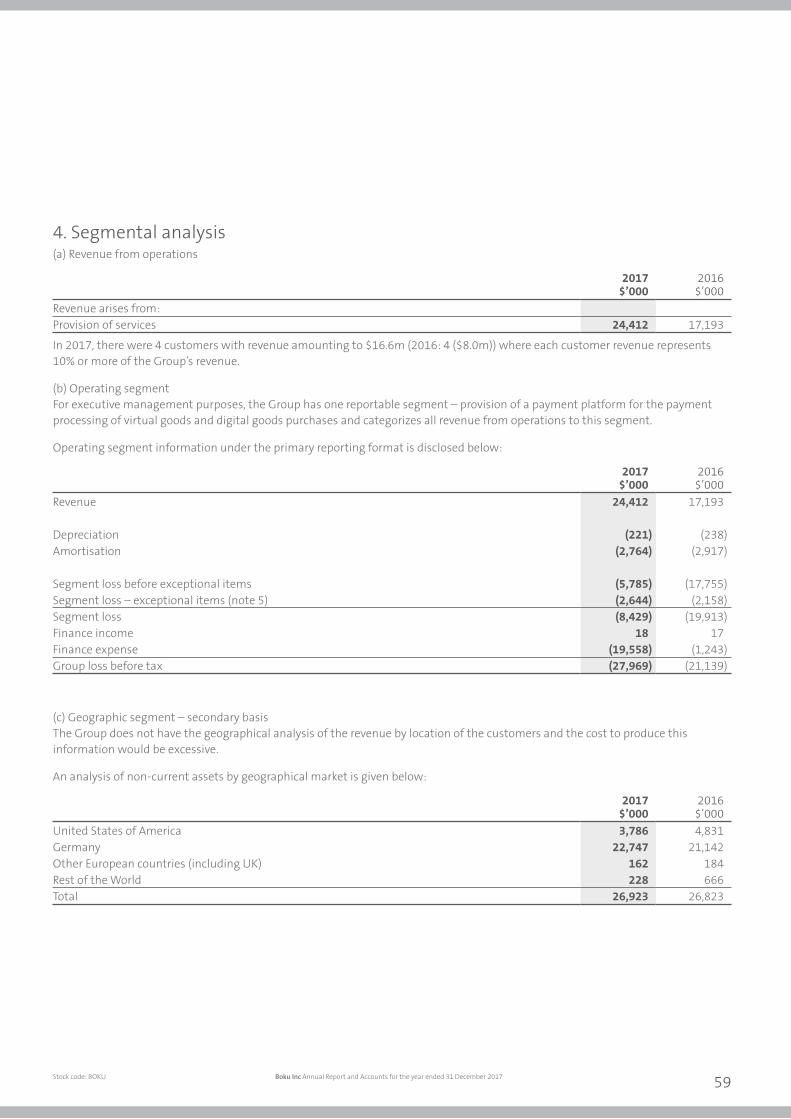
26004 9 April 2018 5:55 PM Proof 6 26004 9 April 2018 5:55 PM Proof 6
4. Segmental analysis(a) Revenue from operations
2017
$’0002016
$’000Revenue arises from:Provision of services 24,412 17,193
In 2017, there were 4 customers with revenue amounting to $16.6m (2016: 4 ($8.0m)) where each customer revenue represents 10% or more of the Group’s revenue.
(b) Operating segment For executive management purposes, the Group has one reportable segment – provision of a payment platform for the payment processing of virtual goods and digital goods purchases and categorizes all revenue from operations to this segment.
Operating segment information under the primary reporting format is disclosed below:
2017
$’0002016
$’000Revenue 24,412 17,193
Depreciation (221) (238)Amortisation (2,764) (2,917)
Segment loss before exceptional items (5,785) (17,755)Segment loss – exceptional items (note 5) (2,644) (2,158)Segment loss (8,429) (19,913)Finance income 18 17Finance expense (19,558) (1,243)Group loss before tax (27,969) (21,139)
(c) Geographic segment – secondary basis The Group does not have the geographical analysis of the revenue by location of the customers and the cost to produce this information would be excessive.
An analysis of non-current assets by geographical market is given below:
2017
$’0002016
$’000United States of America 3,786 4,831Germany 22,747 21,142Other European countries (including UK) 162 184Rest of the World 228 666Total 26,923 26,823
Stock code: BOKU Boku Inc Annual Report and Accounts for the year ended 31 December 2017 59
26004 Boku AR2017.indd 59 09/04/2018 17:56:24
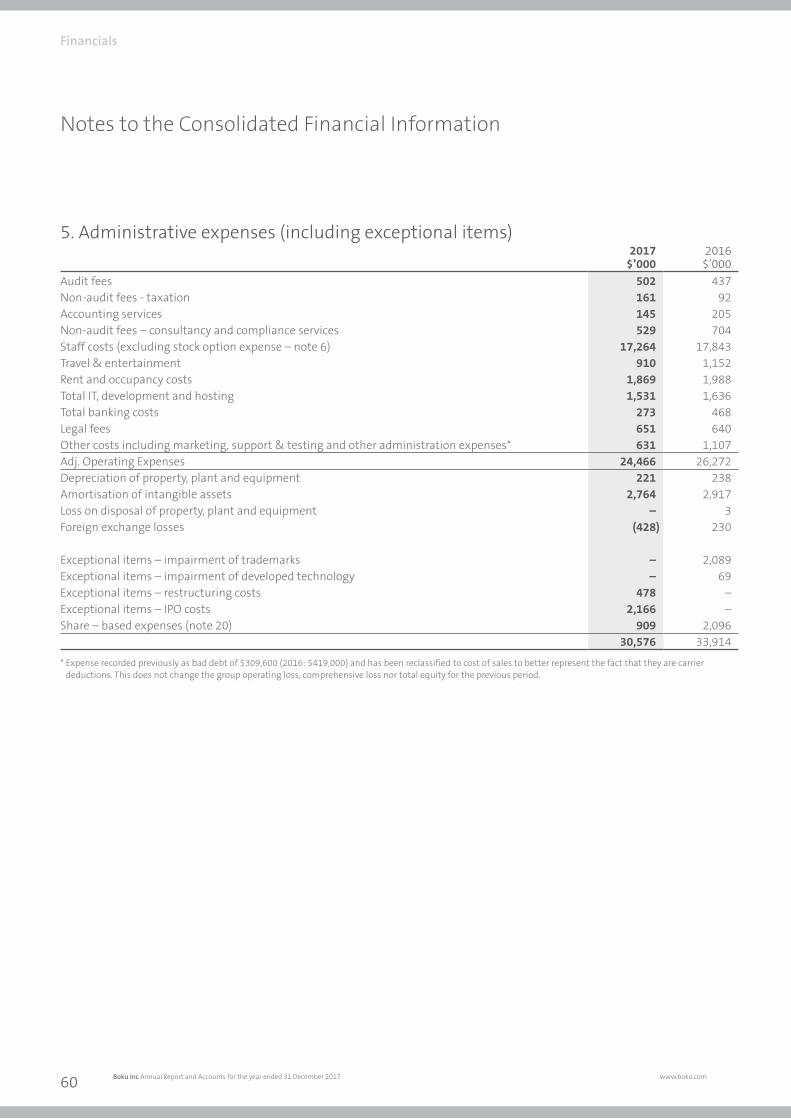
26004 9 April 2018 5:55 PM Proof 6
Notes to the Consolidated Financial Information
5. Administrative expenses (including exceptional items)
2017$’000
2016$’000
Audit fees 502 437Non-audit fees - taxation 161 92Accounting services 145 205Non-audit fees – consultancy and compliance services 529 704Staff costs (excluding stock option expense – note 6) 17,264 17,843Travel & entertainment 910 1,152Rent and occupancy costs 1,869 1,988Total IT, development and hosting 1,531 1,636Total banking costs 273 468Legal fees 651 640Other costs including marketing, support & testing and other administration expenses* 631 1,107Adj. Operating Expenses 24,466 26,272Depreciation of property, plant and equipment 221 238Amortisation of intangible assets 2,764 2,917Loss on disposal of property, plant and equipment – 3Foreign exchange losses (428) 230
Exceptional items – impairment of trademarks – 2,089Exceptional items – impairment of developed technology – 69Exceptional items – restructuring costs 478 –Exceptional items – IPO costs 2,166 –Share – based expenses (note 20) 909 2,096
30,576 33,914
* Expense recorded previously as bad debt of $309,600 (2016: $419,000) and has been reclassified to cost of sales to better represent the fact that they are carrier deductions. This does not change the group operating loss, comprehensive loss nor total equity for the previous period.
Financials
Boku Inc Annual Report and Accounts for the year ended 31 December 2017 www.boku.com60
26004 Boku AR2017.indd 60 09/04/2018 17:56:24
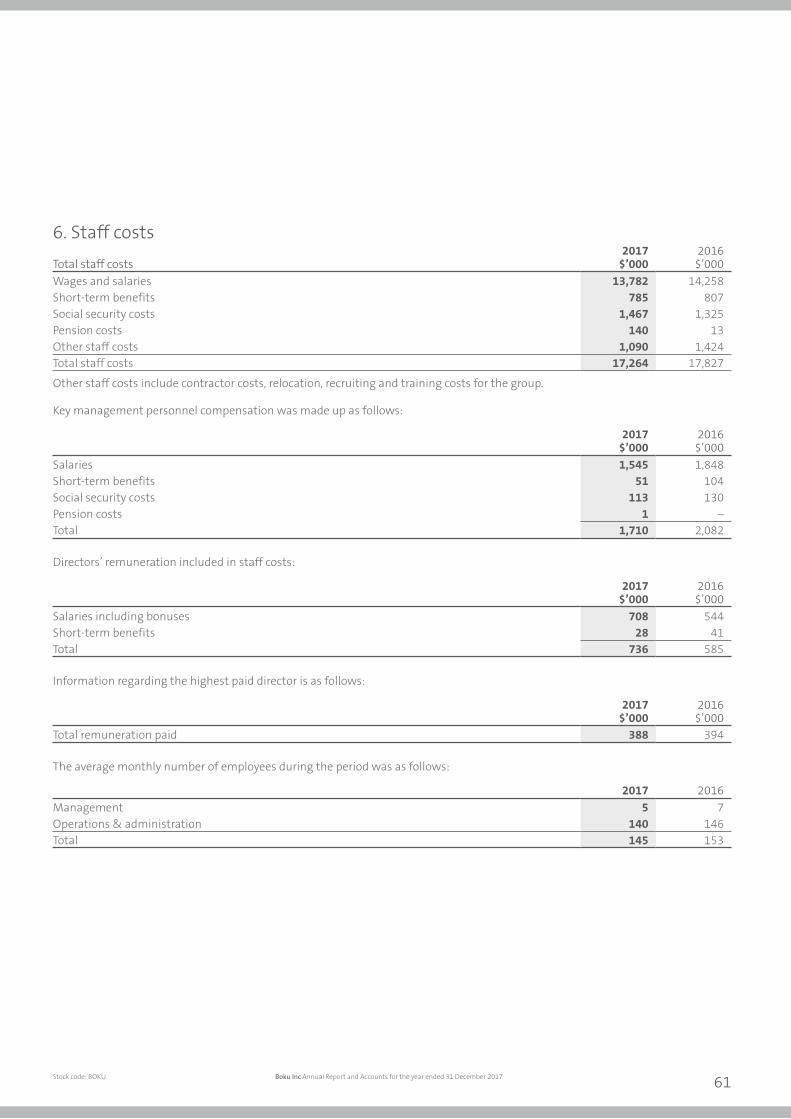
26004 9 April 2018 5:55 PM Proof 6 26004 9 April 2018 5:55 PM Proof 6
6. Staff costsTotal staff costs
2017$’000
2016$’000
Wages and salaries 13,782 14,258 Short-term benefits 785 807Social security costs 1,467 1,325Pension costs 140 13Other staff costs 1,090 1,424Total staff costs 17,264 17,827
Other staff costs include contractor costs, relocation, recruiting and training costs for the group.
Key management personnel compensation was made up as follows:
2017$’000
2016$’000
Salaries 1,545 1,848Short-term benefits 51 104Social security costs 113 130 Pension costs 1 –Total 1,710 2,082
Directors’ remuneration included in staff costs:
2017$’000
2016$’000
Salaries including bonuses 708 544Short-term benefits 28 41Total 736 585
Information regarding the highest paid director is as follows:
2017$’000
2016$’000
Total remuneration paid 388 394
The average monthly number of employees during the period was as follows:
2017 2016Management 5 7Operations & administration 140 146Total 145 153
Stock code: BOKU Boku Inc Annual Report and Accounts for the year ended 31 December 2017 61
26004 Boku AR2017.indd 61 09/04/2018 17:56:24
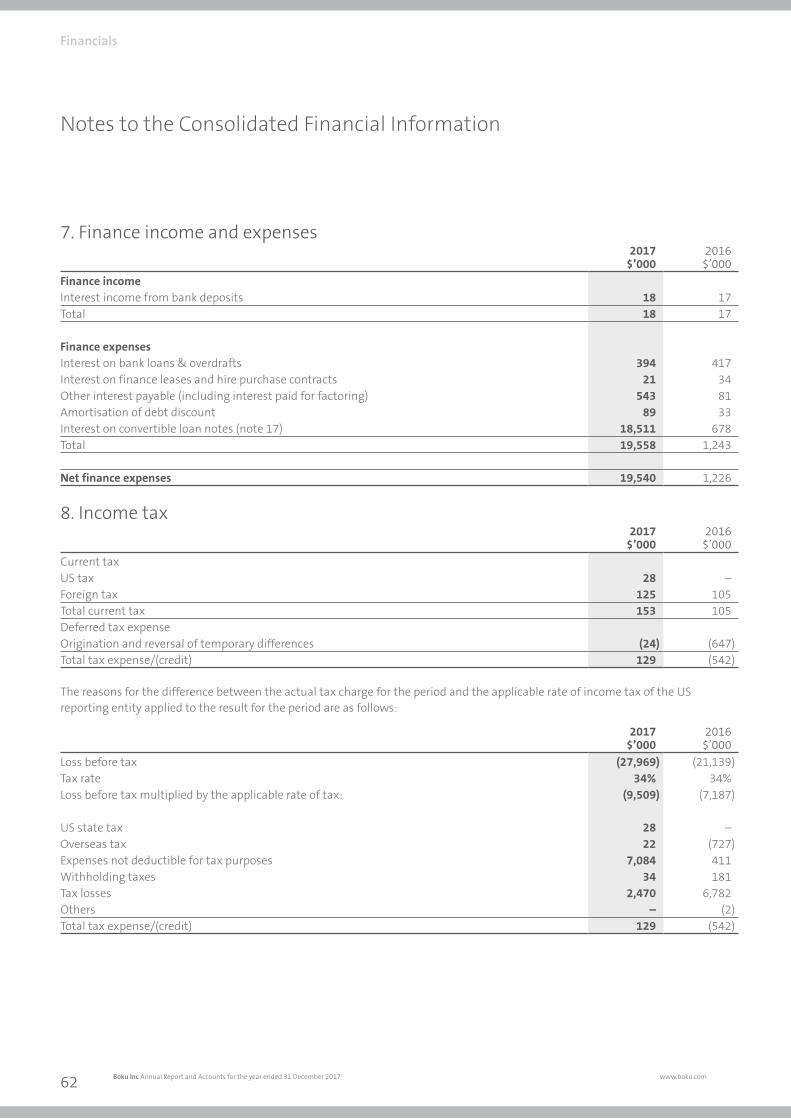
26004 9 April 2018 5:55 PM Proof 6
Notes to the Consolidated Financial Information
7. Finance income and expenses2017
$’0002016
$’000Finance incomeInterest income from bank deposits 18 17Total 18 17
Finance expensesInterest on bank loans & overdrafts 394 417Interest on finance leases and hire purchase contracts 21 34Other interest payable (including interest paid for factoring) 543 81Amortisation of debt discount 89 33Interest on convertible loan notes (note 17) 18,511 678Total 19,558 1,243
Net finance expenses 19,540 1,226
8. Income tax2017
$’0002016
$’000Current taxUS tax 28 –Foreign tax 125 105Total current tax 153 105Deferred tax expenseOrigination and reversal of temporary differences (24) (647)Total tax expense/(credit) 129 (542)
The reasons for the difference between the actual tax charge for the period and the applicable rate of income tax of the US reporting entity applied to the result for the period are as follows:
2017$’000
2016$’000
Loss before tax (27,969) (21,139)Tax rate 34% 34%Loss before tax multiplied by the applicable rate of tax: (9,509) (7,187)
US state tax 28 –Overseas tax 22 (727)Expenses not deductible for tax purposes 7,084 411Withholding taxes 34 181Tax losses 2,470 6,782Others – (2)Total tax expense/(credit) 129 (542)
Financials
Boku Inc Annual Report and Accounts for the year ended 31 December 2017 www.boku.com62
26004 Boku AR2017.indd 62 09/04/2018 17:56:24
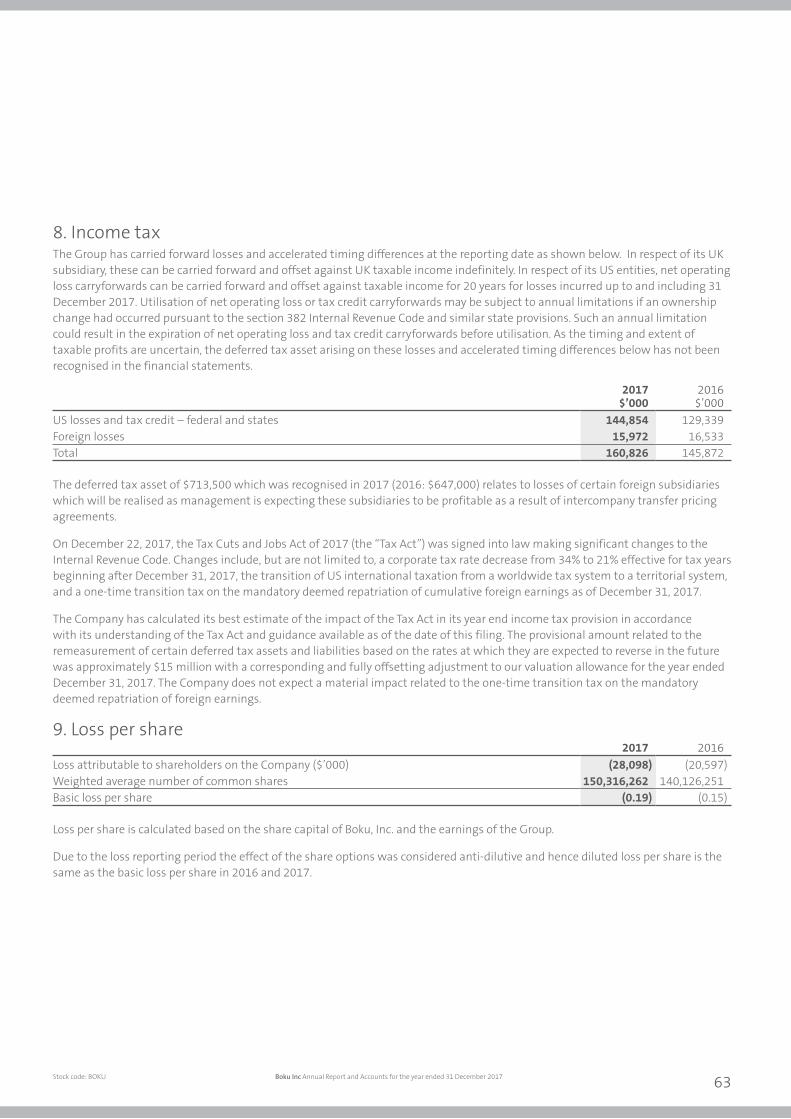
26004 9 April 2018 5:55 PM Proof 6 26004 9 April 2018 5:55 PM Proof 6
8. Income tax The Group has carried forward losses and accelerated timing differences at the reporting date as shown below. In respect of its UK subsidiary, these can be carried forward and offset against UK taxable income indefinitely. In respect of its US entities, net operating loss carryforwards can be carried forward and offset against taxable income for 20 years for losses incurred up to and including 31 December 2017. Utilisation of net operating loss or tax credit carryforwards may be subject to annual limitations if an ownership change had occurred pursuant to the section 382 Internal Revenue Code and similar state provisions. Such an annual limitation could result in the expiration of net operating loss and tax credit carryforwards before utilisation. As the timing and extent of taxable profits are uncertain, the deferred tax asset arising on these losses and accelerated timing differences below has not been recognised in the financial statements.
2017$’000
2016$’000
US losses and tax credit – federal and states 144,854 129,339Foreign losses 15,972 16,533Total 160,826 145,872
The deferred tax asset of $713,500 which was recognised in 2017 (2016: $647,000) relates to losses of certain foreign subsidiaries which will be realised as management is expecting these subsidiaries to be profitable as a result of intercompany transfer pricing agreements.
On December 22, 2017, the Tax Cuts and Jobs Act of 2017 (the “Tax Act”) was signed into law making significant changes to the Internal Revenue Code. Changes include, but are not limited to, a corporate tax rate decrease from 34% to 21% effective for tax years beginning after December 31, 2017, the transition of US international taxation from a worldwide tax system to a territorial system, and a one-time transition tax on the mandatory deemed repatriation of cumulative foreign earnings as of December 31, 2017.
The Company has calculated its best estimate of the impact of the Tax Act in its year end income tax provision in accordance with its understanding of the Tax Act and guidance available as of the date of this filing. The provisional amount related to the remeasurement of certain deferred tax assets and liabilities based on the rates at which they are expected to reverse in the future was approximately $15 million with a corresponding and fully offsetting adjustment to our valuation allowance for the year ended December 31, 2017. The Company does not expect a material impact related to the one-time transition tax on the mandatory deemed repatriation of foreign earnings.
9. Loss per share2017 2016
Loss attributable to shareholders on the Company ($’000) (28,098) (20,597)Weighted average number of common shares 150,316,262 140,126,251 Basic loss per share (0.19) (0.15)
Loss per share is calculated based on the share capital of Boku, Inc. and the earnings of the Group.
Due to the loss reporting period the effect of the share options was considered anti-dilutive and hence diluted loss per share is the same as the basic loss per share in 2016 and 2017.
Stock code: BOKU Boku Inc Annual Report and Accounts for the year ended 31 December 2017 63
26004 Boku AR2017.indd 63 09/04/2018 17:56:24
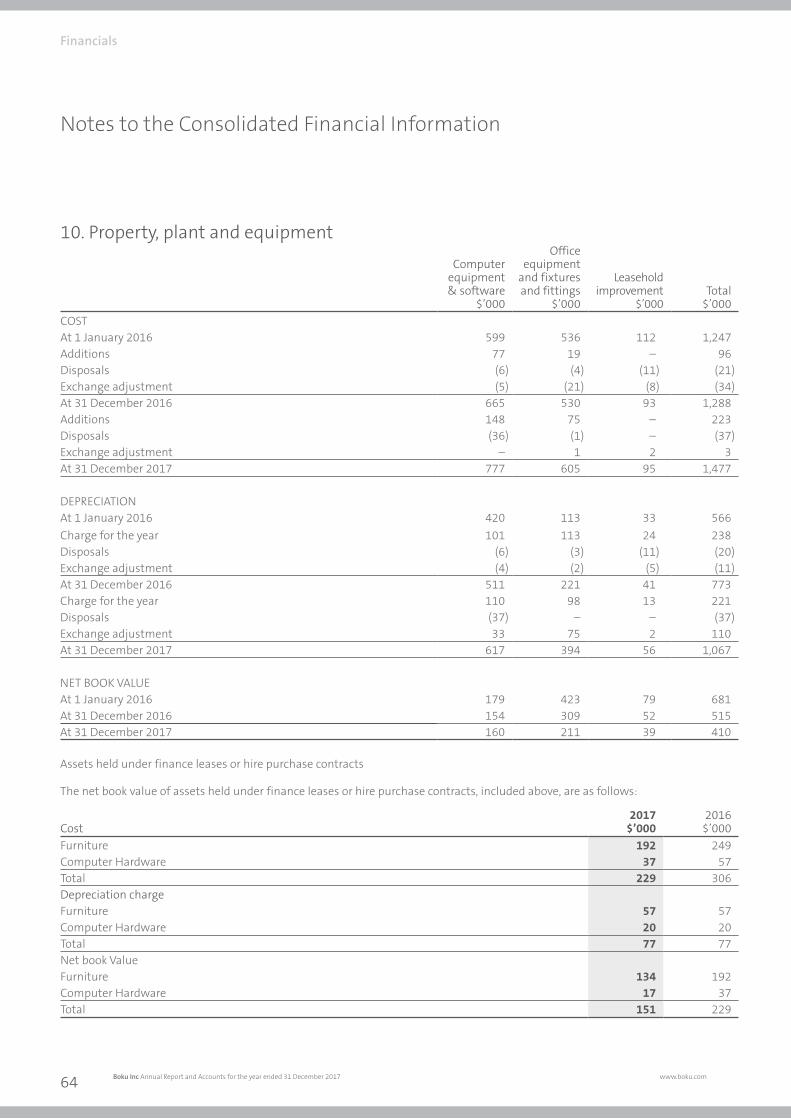
26004 9 April 2018 5:55 PM Proof 6
Notes to the Consolidated Financial Information
10. Property, plant and equipmentComputer
equipment & software
$’000
Office equipment
and fixtures and fittings
$’000
Leasehold improvement
$’000Total
$’000COSTAt 1 January 2016 599 536 112 1,247 Additions 77 19 – 96 Disposals (6) (4) (11) (21)Exchange adjustment (5) (21) (8) (34)At 31 December 2016 665 530 93 1,288 Additions 148 75 – 223Disposals (36) (1) – (37)Exchange adjustment – 1 2 3At 31 December 2017 777 605 95 1,477
DEPRECIATIONAt 1 January 2016 420 113 33 566 Charge for the year 101 113 24 238 Disposals (6) (3) (11) (20)Exchange adjustment (4) (2) (5) (11)At 31 December 2016 511 221 41 773 Charge for the year 110 98 13 221Disposals (37) – – (37)Exchange adjustment 33 75 2 110At 31 December 2017 617 394 56 1,067
NET BOOK VALUEAt 1 January 2016 179 423 79 681At 31 December 2016 154 309 52 515 At 31 December 2017 160 211 39 410
Assets held under finance leases or hire purchase contracts
The net book value of assets held under finance leases or hire purchase contracts, included above, are as follows:
Cost2017
$’0002016
$’000Furniture 192 249Computer Hardware 37 57Total 229 306Depreciation chargeFurniture 57 57Computer Hardware 20 20Total 77 77Net book ValueFurniture 134 192Computer Hardware 17 37Total 151 229
Financials
Boku Inc Annual Report and Accounts for the year ended 31 December 2017 www.boku.com64
26004 Boku AR2017.indd 64 09/04/2018 17:56:24
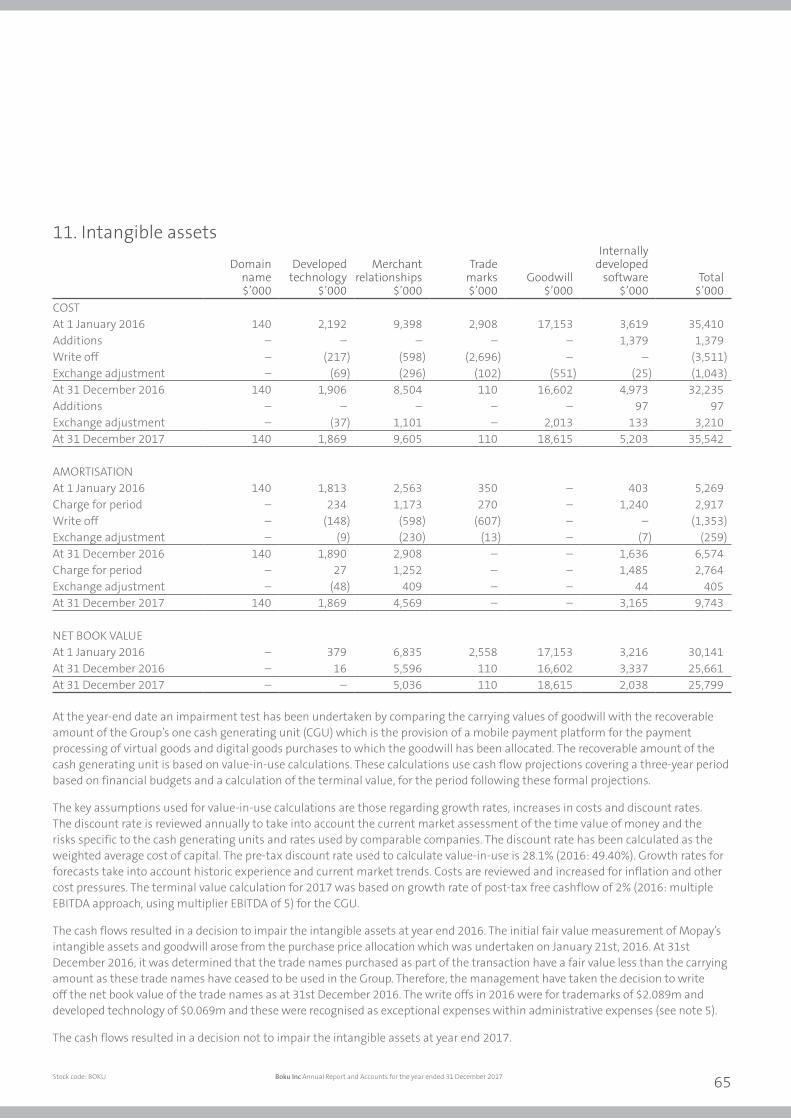
26004 9 April 2018 5:55 PM Proof 6 26004 9 April 2018 5:55 PM Proof 6
11. Intangible assetsDomain
name$’000
Developed technology
$’000
Merchant relationships
$’000
Trade marks$’000
Goodwill$’000
Internally developed
software$’000
Total$’000
COSTAt 1 January 2016 140 2,192 9,398 2,908 17,153 3,619 35,410Additions – – – – – 1,379 1,379Write off – (217) (598) (2,696) – – (3,511)Exchange adjustment – (69) (296) (102) (551) (25) (1,043)At 31 December 2016 140 1,906 8,504 110 16,602 4,973 32,235 Additions – – – – – 97 97Exchange adjustment – (37) 1,101 – 2,013 133 3,210At 31 December 2017 140 1,869 9,605 110 18,615 5,203 35,542
AMORTISATIONAt 1 January 2016 140 1,813 2,563 350 – 403 5,269 Charge for period – 234 1,173 270 – 1,240 2,917 Write off – (148) (598) (607) – – (1,353)Exchange adjustment – (9) (230) (13) – (7) (259)At 31 December 2016 140 1,890 2,908 – – 1,636 6,574 Charge for period – 27 1,252 – – 1,485 2,764Exchange adjustment – (48) 409 – – 44 405At 31 December 2017 140 1,869 4,569 – – 3,165 9,743
NET BOOK VALUEAt 1 January 2016 – 379 6,835 2,558 17,153 3,216 30,141At 31 December 2016 – 16 5,596 110 16,602 3,337 25,661 At 31 December 2017 – – 5,036 110 18,615 2,038 25,799
At the year-end date an impairment test has been undertaken by comparing the carrying values of goodwill with the recoverable amount of the Group’s one cash generating unit (CGU) which is the provision of a mobile payment platform for the payment processing of virtual goods and digital goods purchases to which the goodwill has been allocated. The recoverable amount of the cash generating unit is based on value-in-use calculations. These calculations use cash flow projections covering a three-year period based on financial budgets and a calculation of the terminal value, for the period following these formal projections.
The key assumptions used for value-in-use calculations are those regarding growth rates, increases in costs and discount rates. The discount rate is reviewed annually to take into account the current market assessment of the time value of money and the risks specific to the cash generating units and rates used by comparable companies. The discount rate has been calculated as the weighted average cost of capital. The pre-tax discount rate used to calculate value-in-use is 28.1% (2016: 49.40%). Growth rates for forecasts take into account historic experience and current market trends. Costs are reviewed and increased for inflation and other cost pressures. The terminal value calculation for 2017 was based on growth rate of post-tax free cashflow of 2% (2016: multiple EBITDA approach, using multiplier EBITDA of 5) for the CGU.
The cash flows resulted in a decision to impair the intangible assets at year end 2016. The initial fair value measurement of Mopay’s intangible assets and goodwill arose from the purchase price allocation which was undertaken on January 21st, 2016. At 31st December 2016, it was determined that the trade names purchased as part of the transaction have a fair value less than the carrying amount as these trade names have ceased to be used in the Group. Therefore, the management have taken the decision to write off the net book value of the trade names as at 31st December 2016. The write offs in 2016 were for trademarks of $2.089m and developed technology of $0.069m and these were recognised as exceptional expenses within administrative expenses (see note 5).
The cash flows resulted in a decision not to impair the intangible assets at year end 2017.
Stock code: BOKU Boku Inc Annual Report and Accounts for the year ended 31 December 2017 65
26004 Boku AR2017.indd 65 09/04/2018 17:56:25
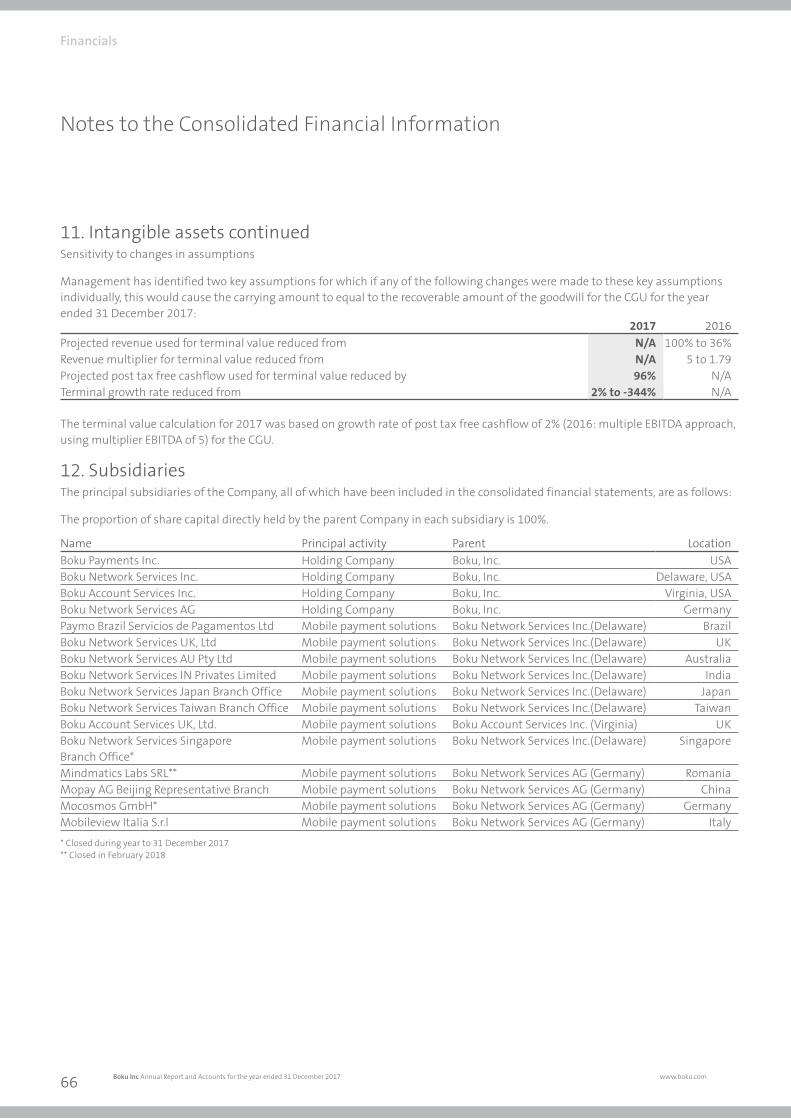
26004 9 April 2018 5:55 PM Proof 6
Notes to the Consolidated Financial Information
11. Intangible assets continuedSensitivity to changes in assumptions
Management has identified two key assumptions for which if any of the following changes were made to these key assumptions individually, this would cause the carrying amount to equal to the recoverable amount of the goodwill for the CGU for the year ended 31 December 2017:
2017 2016Projected revenue used for terminal value reduced from N/A 100% to 36%Revenue multiplier for terminal value reduced from N/A 5 to 1.79Projected post tax free cashflow used for terminal value reduced by 96% N/ATerminal growth rate reduced from 2% to -344% N/A
The terminal value calculation for 2017 was based on growth rate of post tax free cashflow of 2% (2016: multiple EBITDA approach, using multiplier EBITDA of 5) for the CGU.
12. SubsidiariesThe principal subsidiaries of the Company, all of which have been included in the consolidated financial statements, are as follows:
The proportion of share capital directly held by the parent Company in each subsidiary is 100%.
Name Principal activity Parent LocationBoku Payments Inc. Holding Company Boku, Inc. USABoku Network Services Inc. Holding Company Boku, Inc. Delaware, USABoku Account Services Inc. Holding Company Boku, Inc. Virginia, USABoku Network Services AG Holding Company Boku, Inc. GermanyPaymo Brazil Servicios de Pagamentos Ltd Mobile payment solutions Boku Network Services Inc.(Delaware) BrazilBoku Network Services UK, Ltd Mobile payment solutions Boku Network Services Inc.(Delaware) UKBoku Network Services AU Pty Ltd Mobile payment solutions Boku Network Services Inc.(Delaware) AustraliaBoku Network Services IN Privates Limited Mobile payment solutions Boku Network Services Inc.(Delaware) IndiaBoku Network Services Japan Branch Office Mobile payment solutions Boku Network Services Inc.(Delaware) JapanBoku Network Services Taiwan Branch Office Mobile payment solutions Boku Network Services Inc.(Delaware) TaiwanBoku Account Services UK, Ltd. Mobile payment solutions Boku Account Services Inc. (Virginia) UKBoku Network Services Singapore Branch Office*
Mobile payment solutions Boku Network Services Inc.(Delaware) Singapore
Mindmatics Labs SRL** Mobile payment solutions Boku Network Services AG (Germany) RomaniaMopay AG Beijing Representative Branch Mobile payment solutions Boku Network Services AG (Germany) ChinaMocosmos GmbH* Mobile payment solutions Boku Network Services AG (Germany) GermanyMobileview Italia S.r.l Mobile payment solutions Boku Network Services AG (Germany) Italy
* Closed during year to 31 December 2017** Closed in February 2018
Financials
Boku Inc Annual Report and Accounts for the year ended 31 December 2017 www.boku.com66
26004 Boku AR2017.indd 66 09/04/2018 17:56:25
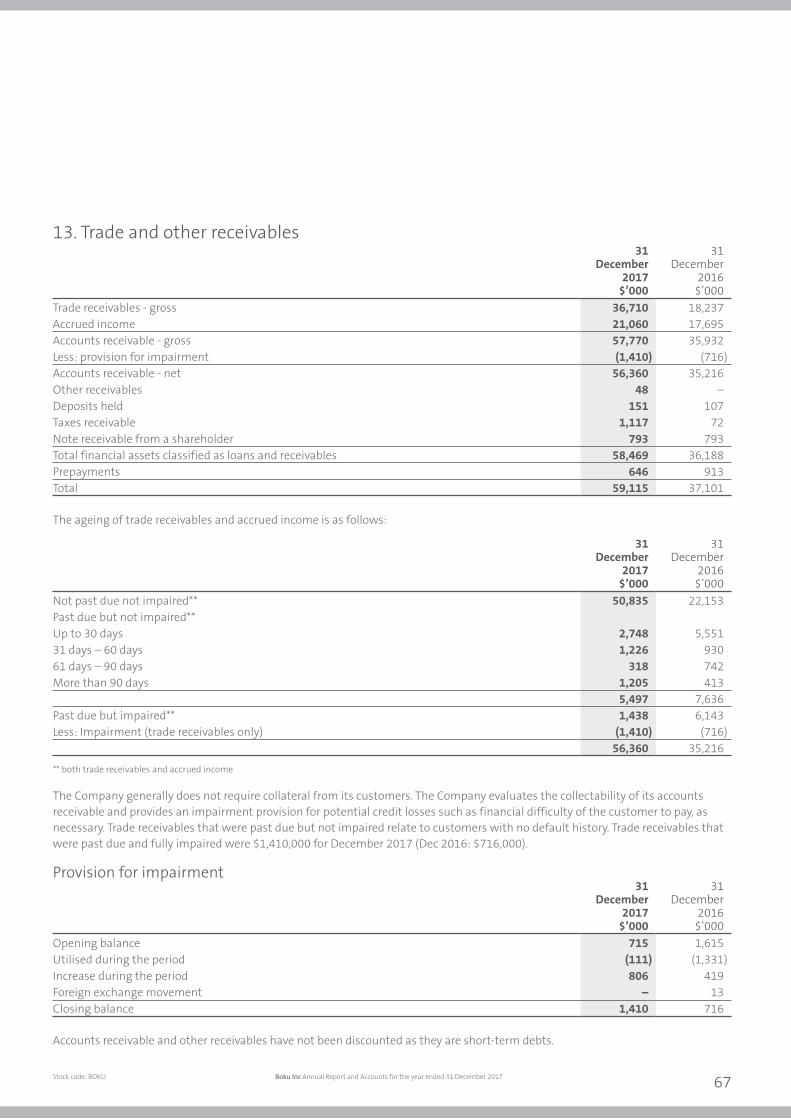
26004 9 April 2018 5:55 PM Proof 6 26004 9 April 2018 5:55 PM Proof 6
13. Trade and other receivables31
December2017
$’000
31 December
2016$’000
Trade receivables - gross 36,710 18,237Accrued income 21,060 17,695Accounts receivable - gross 57,770 35,932Less: provision for impairment (1,410) (716)Accounts receivable - net 56,360 35,216Other receivables 48 –Deposits held 151 107Taxes receivable 1,117 72Note receivable from a shareholder 793 793Total financial assets classified as loans and receivables 58,469 36,188Prepayments 646 913Total 59,115 37,101
The ageing of trade receivables and accrued income is as follows:
31 December
2017$’000
31 December
2016$’000
Not past due not impaired** 50,835 22,153Past due but not impaired**Up to 30 days 2,748 5,55131 days – 60 days 1,226 93061 days – 90 days 318 742More than 90 days 1,205 413
5,497 7,636Past due but impaired** 1,438 6,143Less: Impairment (trade receivables only) (1,410) (716)
56,360 35,216
** both trade receivables and accrued income
The Company generally does not require collateral from its customers. The Company evaluates the collectability of its accounts receivable and provides an impairment provision for potential credit losses such as financial difficulty of the customer to pay, as necessary. Trade receivables that were past due but not impaired relate to customers with no default history. Trade receivables that were past due and fully impaired were $1,410,000 for December 2017 (Dec 2016: $716,000).
Provision for impairment31
December2017
$’000
31 December
2016$’000
Opening balance 715 1,615 Utilised during the period (111) (1,331)Increase during the period 806 419 Foreign exchange movement – 13Closing balance 1,410 716
Accounts receivable and other receivables have not been discounted as they are short-term debts.
Stock code: BOKU Boku Inc Annual Report and Accounts for the year ended 31 December 2017 67
26004 Boku AR2017.indd 67 09/04/2018 17:56:25
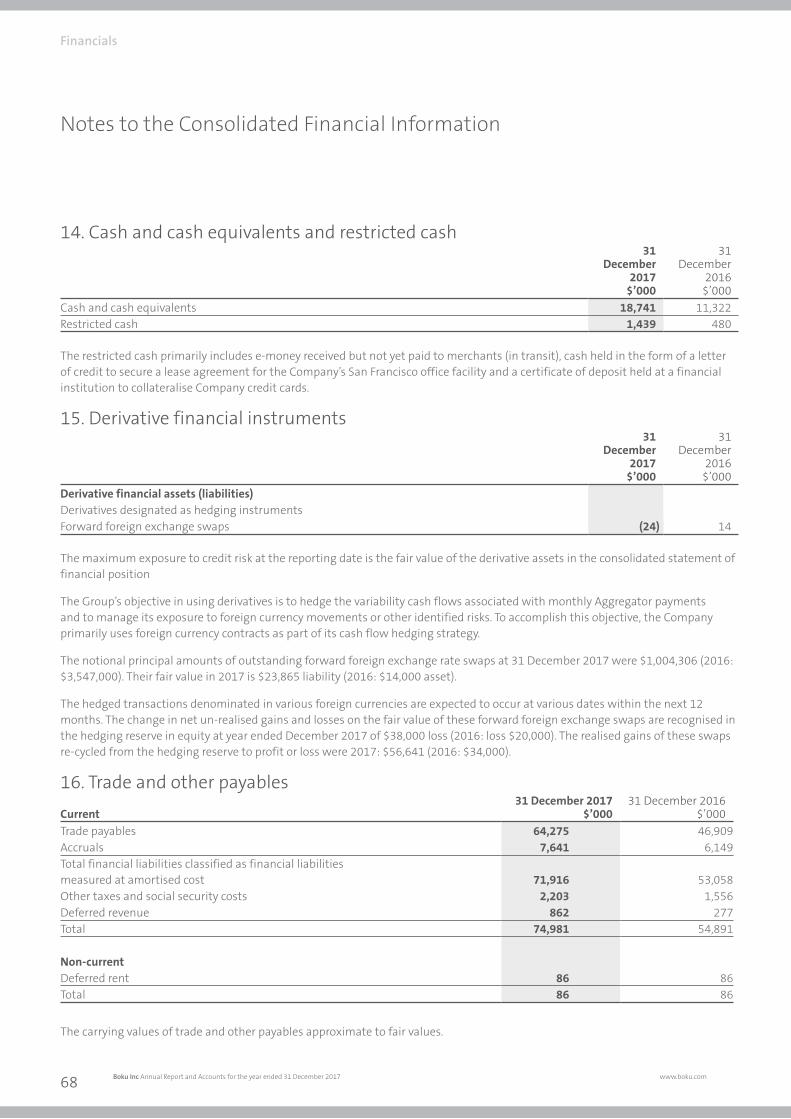
26004 9 April 2018 5:55 PM Proof 6
Notes to the Consolidated Financial Information
14. Cash and cash equivalents and restricted cash31
December2017
$’000
31 December
2016$’000
Cash and cash equivalents 18,741 11,322Restricted cash 1,439 480
The restricted cash primarily includes e-money received but not yet paid to merchants (in transit), cash held in the form of a letter of credit to secure a lease agreement for the Company’s San Francisco office facility and a certificate of deposit held at a financial institution to collateralise Company credit cards.
15. Derivative financial instruments31
December 2017
$’000
31 December
2016$’000
Derivative financial assets (liabilities)Derivatives designated as hedging instrumentsForward foreign exchange swaps (24) 14
The maximum exposure to credit risk at the reporting date is the fair value of the derivative assets in the consolidated statement of financial position
The Group’s objective in using derivatives is to hedge the variability cash flows associated with monthly Aggregator payments and to manage its exposure to foreign currency movements or other identified risks. To accomplish this objective, the Company primarily uses foreign currency contracts as part of its cash flow hedging strategy.
The notional principal amounts of outstanding forward foreign exchange rate swaps at 31 December 2017 were $1,004,306 (2016: $3,547,000). Their fair value in 2017 is $23,865 liability (2016: $14,000 asset).
The hedged transactions denominated in various foreign currencies are expected to occur at various dates within the next 12 months. The change in net un-realised gains and losses on the fair value of these forward foreign exchange swaps are recognised in the hedging reserve in equity at year ended December 2017 of $38,000 loss (2016: loss $20,000). The realised gains of these swaps re-cycled from the hedging reserve to profit or loss were 2017: $56,641 (2016: $34,000).
16. Trade and other payablesCurrent
31 December 2017 $’000
31 December 2016$’000
Trade payables 64,275 46,909Accruals 7,641 6,149Total financial liabilities classified as financial liabilities measured at amortised cost 71,916 53,058Other taxes and social security costs 2,203 1,556Deferred revenue 862 277Total 74,981 54,891
Non-currentDeferred rent 86 86Total 86 86
The carrying values of trade and other payables approximate to fair values.
Financials
Boku Inc Annual Report and Accounts for the year ended 31 December 2017 www.boku.com68
26004 Boku AR2017.indd 68 09/04/2018 17:56:25
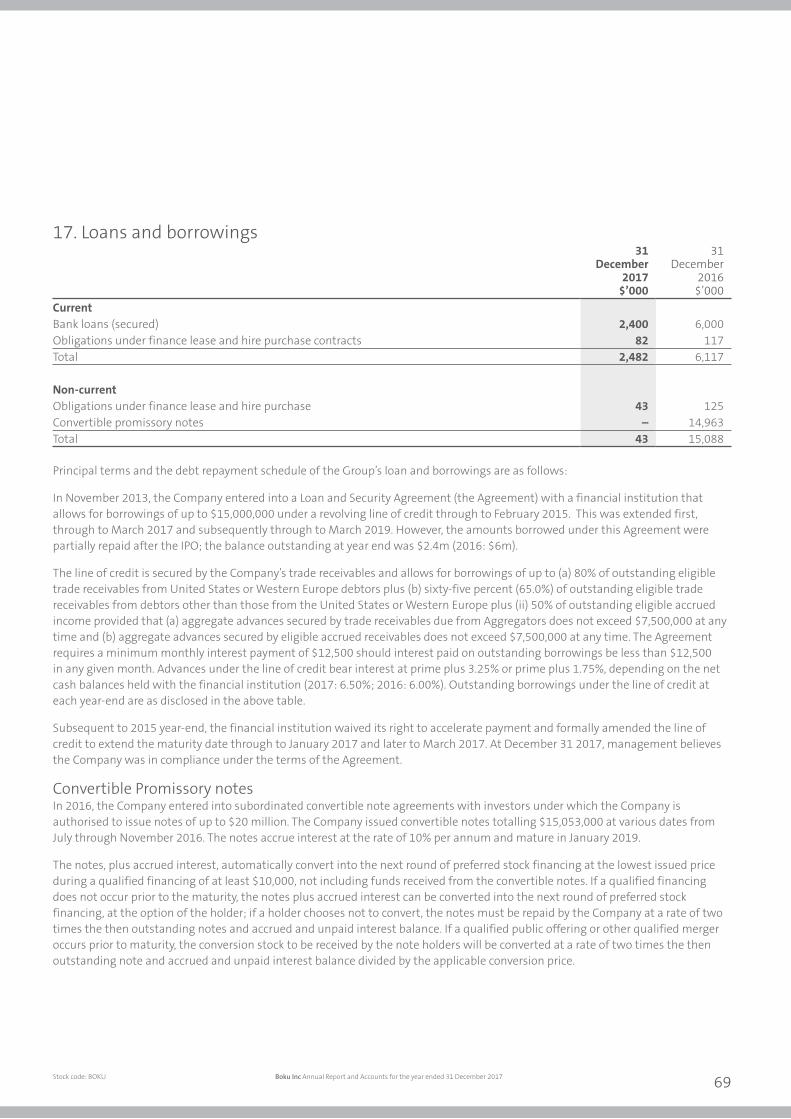
26004 9 April 2018 5:55 PM Proof 6 26004 9 April 2018 5:55 PM Proof 6
17. Loans and borrowings31
December2017
$’000
31 December
2016$’000
CurrentBank loans (secured) 2,400 6,000Obligations under finance lease and hire purchase contracts 82 117Total 2,482 6,117
Non-currentObligations under finance lease and hire purchase 43 125Convertible promissory notes – 14,963Total 43 15,088
Principal terms and the debt repayment schedule of the Group’s loan and borrowings are as follows:
In November 2013, the Company entered into a Loan and Security Agreement (the Agreement) with a financial institution that allows for borrowings of up to $15,000,000 under a revolving line of credit through to February 2015. This was extended first, through to March 2017 and subsequently through to March 2019. However, the amounts borrowed under this Agreement were partially repaid after the IPO; the balance outstanding at year end was $2.4m (2016: $6m).
The line of credit is secured by the Company’s trade receivables and allows for borrowings of up to (a) 80% of outstanding eligible trade receivables from United States or Western Europe debtors plus (b) sixty-five percent (65.0%) of outstanding eligible trade receivables from debtors other than those from the United States or Western Europe plus (ii) 50% of outstanding eligible accrued income provided that (a) aggregate advances secured by trade receivables due from Aggregators does not exceed $7,500,000 at any time and (b) aggregate advances secured by eligible accrued receivables does not exceed $7,500,000 at any time. The Agreement requires a minimum monthly interest payment of $12,500 should interest paid on outstanding borrowings be less than $12,500 in any given month. Advances under the line of credit bear interest at prime plus 3.25% or prime plus 1.75%, depending on the net cash balances held with the financial institution (2017: 6.50%; 2016: 6.00%). Outstanding borrowings under the line of credit at each year-end are as disclosed in the above table.
Subsequent to 2015 year-end, the financial institution waived its right to accelerate payment and formally amended the line of credit to extend the maturity date through to January 2017 and later to March 2017. At December 31 2017, management believes the Company was in compliance under the terms of the Agreement.
Convertible Promissory notesIn 2016, the Company entered into subordinated convertible note agreements with investors under which the Company is authorised to issue notes of up to $20 million. The Company issued convertible notes totalling $15,053,000 at various dates from July through November 2016. The notes accrue interest at the rate of 10% per annum and mature in January 2019.
The notes, plus accrued interest, automatically convert into the next round of preferred stock financing at the lowest issued price during a qualified financing of at least $10,000, not including funds received from the convertible notes. If a qualified financing does not occur prior to the maturity, the notes plus accrued interest can be converted into the next round of preferred stock financing, at the option of the holder; if a holder chooses not to convert, the notes must be repaid by the Company at a rate of two times the then outstanding notes and accrued and unpaid interest balance. If a qualified public offering or other qualified merger occurs prior to maturity, the conversion stock to be received by the note holders will be converted at a rate of two times the then outstanding note and accrued and unpaid interest balance divided by the applicable conversion price.
Stock code: BOKU Boku Inc Annual Report and Accounts for the year ended 31 December 2017 69
26004 Boku AR2017.indd 69 09/04/2018 17:56:25
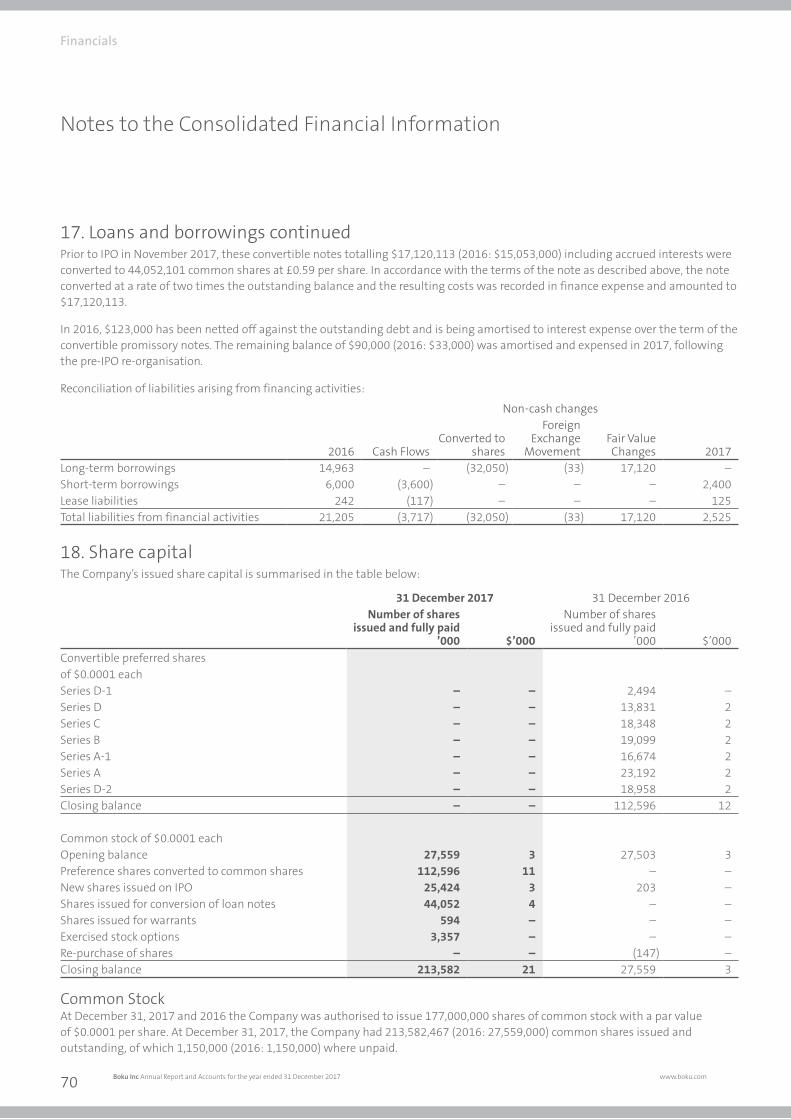
26004 9 April 2018 5:55 PM Proof 6
Notes to the Consolidated Financial Information
17. Loans and borrowings continuedPrior to IPO in November 2017, these convertible notes totalling $17,120,113 (2016: $15,053,000) including accrued interests were converted to 44,052,101 common shares at £0.59 per share. In accordance with the terms of the note as described above, the note converted at a rate of two times the outstanding balance and the resulting costs was recorded in finance expense and amounted to $17,120,113.
In 2016, $123,000 has been netted off against the outstanding debt and is being amortised to interest expense over the term of the convertible promissory notes. The remaining balance of $90,000 (2016: $33,000) was amortised and expensed in 2017, following the pre-IPO re-organisation.
Reconciliation of liabilities arising from financing activities:
2016 Cash Flows
Non-cash changes
2017Converted to
shares
Foreign Exchange
MovementFair Value Changes
Long-term borrowings 14,963 – (32,050) (33) 17,120 –Short-term borrowings 6,000 (3,600) – – – 2,400Lease liabilities 242 (117) – – – 125Total liabilities from financial activities 21,205 (3,717) (32,050) (33) 17,120 2,525
18. Share capitalThe Company’s issued share capital is summarised in the table below:
31 December 2017 31 December 2016Number of shares
issued and fully paid’000 $’000
Number of shares issued and fully paid
’000 $’000Convertible preferred sharesof $0.0001 eachSeries D-1 – – 2,494 –Series D – – 13,831 2Series C – – 18,348 2 Series B – – 19,099 2 Series A-1 – – 16,674 2 Series A – – 23,192 2 Series D-2 – – 18,958 2 Closing balance – – 112,596 12
Common stock of $0.0001 eachOpening balance 27,559 3 27,503 3Preference shares converted to common shares 112,596 11 – –New shares issued on IPO 25,424 3 203 –Shares issued for conversion of loan notes 44,052 4 – –Shares issued for warrants 594 – – –Exercised stock options 3,357 – – –Re-purchase of shares – – (147) –Closing balance 213,582 21 27,559 3
Common StockAt December 31, 2017 and 2016 the Company was authorised to issue 177,000,000 shares of common stock with a par value of $0.0001 per share. At December 31, 2017, the Company had 213,582,467 (2016: 27,559,000) common shares issued and outstanding, of which 1,150,000 (2016: 1,150,000) where unpaid.
Financials
Boku Inc Annual Report and Accounts for the year ended 31 December 2017 www.boku.com70
26004 Boku AR2017.indd 70 09/04/2018 17:56:25
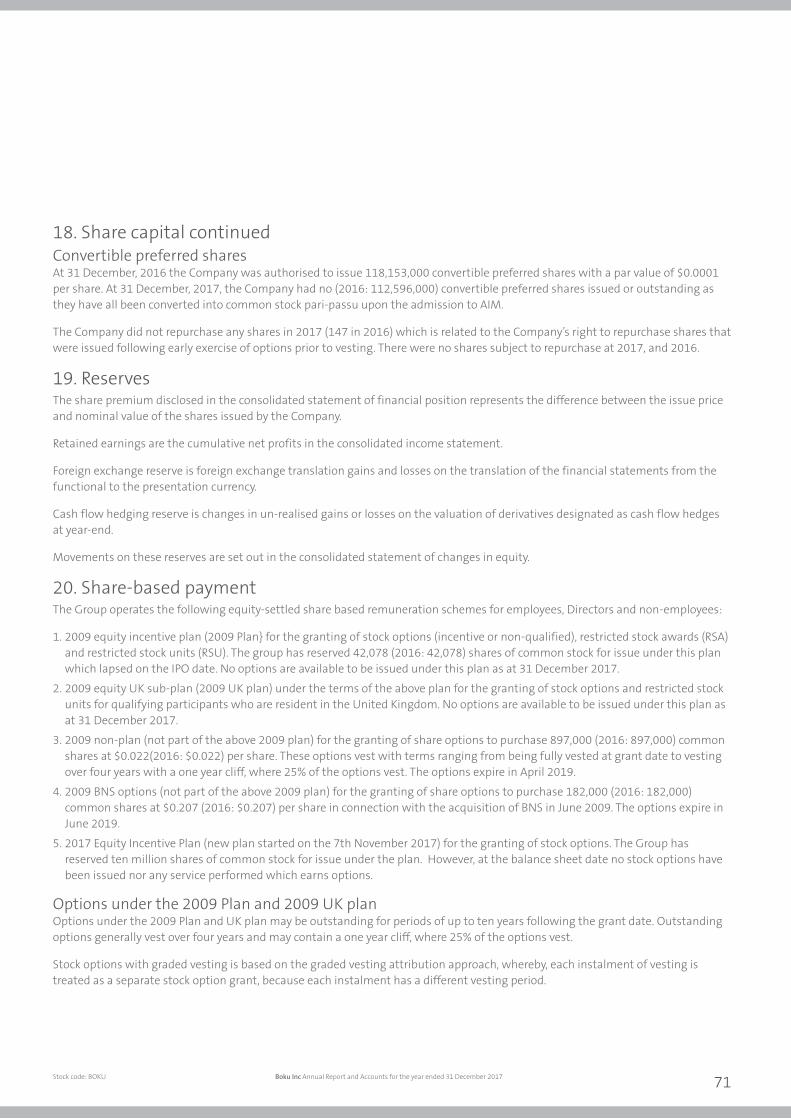
26004 9 April 2018 5:55 PM Proof 6 26004 9 April 2018 5:55 PM Proof 6
18. Share capital continuedConvertible preferred sharesAt 31 December, 2016 the Company was authorised to issue 118,153,000 convertible preferred shares with a par value of $0.0001 per share. At 31 December, 2017, the Company had no (2016: 112,596,000) convertible preferred shares issued or outstanding as they have all been converted into common stock pari-passu upon the admission to AIM.
The Company did not repurchase any shares in 2017 (147 in 2016) which is related to the Company’s right to repurchase shares that were issued following early exercise of options prior to vesting. There were no shares subject to repurchase at 2017, and 2016.
19. ReservesThe share premium disclosed in the consolidated statement of financial position represents the difference between the issue price and nominal value of the shares issued by the Company.
Retained earnings are the cumulative net profits in the consolidated income statement.
Foreign exchange reserve is foreign exchange translation gains and losses on the translation of the financial statements from the functional to the presentation currency.
Cash flow hedging reserve is changes in un-realised gains or losses on the valuation of derivatives designated as cash flow hedges at year-end.
Movements on these reserves are set out in the consolidated statement of changes in equity.
20. Share-based paymentThe Group operates the following equity-settled share based remuneration schemes for employees, Directors and non-employees:
1. 2009 equity incentive plan (2009 Plan} for the granting of stock options (incentive or non-qualified), restricted stock awards (RSA) and restricted stock units (RSU). The group has reserved 42,078 (2016: 42,078) shares of common stock for issue under this plan which lapsed on the IPO date. No options are available to be issued under this plan as at 31 December 2017.
2. 2009 equity UK sub-plan (2009 UK plan) under the terms of the above plan for the granting of stock options and restricted stock units for qualifying participants who are resident in the United Kingdom. No options are available to be issued under this plan as at 31 December 2017.
3. 2009 non-plan (not part of the above 2009 plan) for the granting of share options to purchase 897,000 (2016: 897,000) common shares at $0.022(2016: $0.022) per share. These options vest with terms ranging from being fully vested at grant date to vesting over four years with a one year cliff, where 25% of the options vest. The options expire in April 2019.
4. 2009 BNS options (not part of the above 2009 plan) for the granting of share options to purchase 182,000 (2016: 182,000) common shares at $0.207 (2016: $0.207) per share in connection with the acquisition of BNS in June 2009. The options expire in June 2019.
5. 2017 Equity Incentive Plan (new plan started on the 7th November 2017) for the granting of stock options. The Group has reserved ten million shares of common stock for issue under the plan. However, at the balance sheet date no stock options have been issued nor any service performed which earns options.
Options under the 2009 Plan and 2009 UK plan Options under the 2009 Plan and UK plan may be outstanding for periods of up to ten years following the grant date. Outstanding options generally vest over four years and may contain a one year cliff, where 25% of the options vest.
Stock options with graded vesting is based on the graded vesting attribution approach, whereby, each instalment of vesting is treated as a separate stock option grant, because each instalment has a different vesting period.
Stock code: BOKU Boku Inc Annual Report and Accounts for the year ended 31 December 2017 71
26004 Boku AR2017.indd 71 09/04/2018 17:56:25
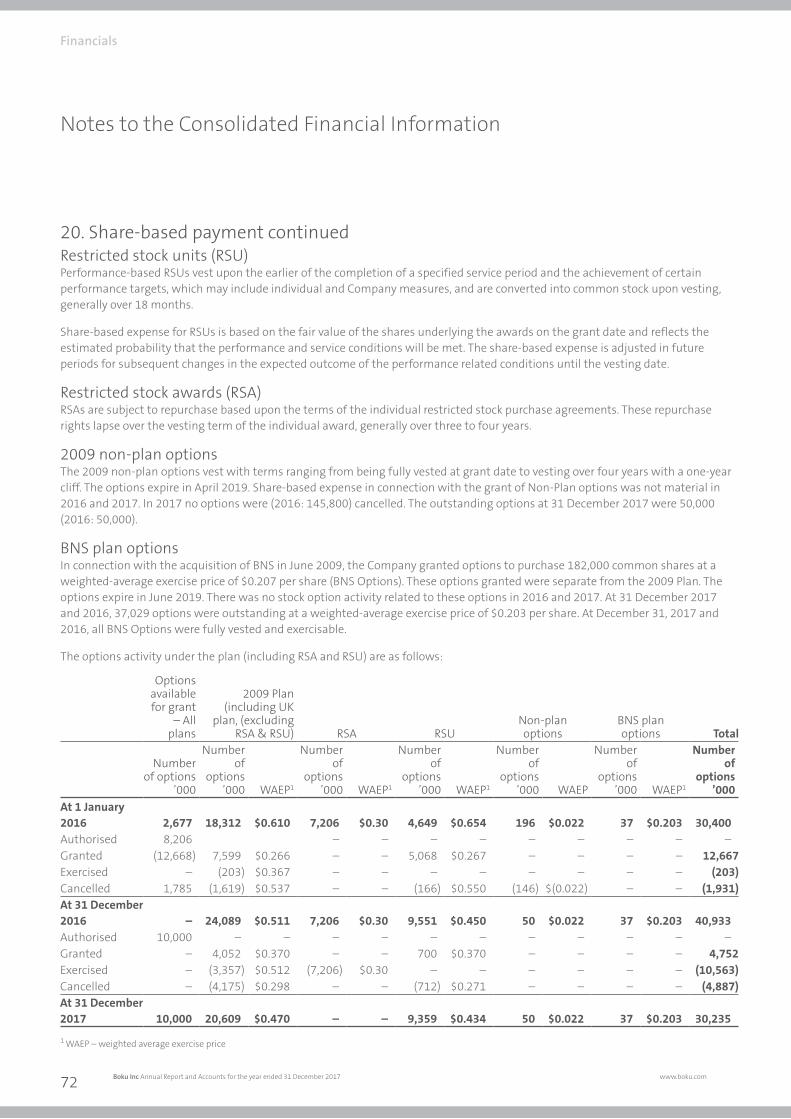
26004 9 April 2018 5:55 PM Proof 6
Notes to the Consolidated Financial Information
20. Share-based payment continuedRestricted stock units (RSU)Performance-based RSUs vest upon the earlier of the completion of a specified service period and the achievement of certain performance targets, which may include individual and Company measures, and are converted into common stock upon vesting, generally over 18 months.
Share-based expense for RSUs is based on the fair value of the shares underlying the awards on the grant date and reflects the estimated probability that the performance and service conditions will be met. The share-based expense is adjusted in future periods for subsequent changes in the expected outcome of the performance related conditions until the vesting date.
Restricted stock awards (RSA)RSAs are subject to repurchase based upon the terms of the individual restricted stock purchase agreements. These repurchase rights lapse over the vesting term of the individual award, generally over three to four years.
2009 non-plan optionsThe 2009 non-plan options vest with terms ranging from being fully vested at grant date to vesting over four years with a one-year cliff. The options expire in April 2019. Share-based expense in connection with the grant of Non-Plan options was not material in 2016 and 2017. In 2017 no options were (2016: 145,800) cancelled. The outstanding options at 31 December 2017 were 50,000 (2016: 50,000).
BNS plan optionsIn connection with the acquisition of BNS in June 2009, the Company granted options to purchase 182,000 common shares at a weighted-average exercise price of $0.207 per share (BNS Options). These options granted were separate from the 2009 Plan. The options expire in June 2019. There was no stock option activity related to these options in 2016 and 2017. At 31 December 2017 and 2016, 37,029 options were outstanding at a weighted-average exercise price of $0.203 per share. At December 31, 2017 and 2016, all BNS Options were fully vested and exercisable.
The options activity under the plan (including RSA and RSU) are as follows:
Options available for grant
– All plans
2009 Plan (including UK
plan, (excluding RSA & RSU) RSA RSU
Non-plan options
BNS plan options Total
Number of options
’000
Number of
options’000 WAEP1
Number of
options’000 WAEP1
Number of
options’000 WAEP1
Number of
options’000 WAEP
Number of
options’000 WAEP1
Number of
options’000
At 1 January 2016 2,677 18,312 $0.610 7,206 $0.30 4,649 $0.654 196 $0.022 37 $0.203 30,400Authorised 8,206 – – – – – – – – –Granted (12,668) 7,599 $0.266 – – 5,068 $0.267 – – – – 12,667Exercised – (203) $0.367 – – – – – – – – (203)Cancelled 1,785 (1,619) $0.537 – – (166) $0.550 (146) $(0.022) – – (1,931)At 31 December 2016 – 24,089 $0.511 7,206 $0.30 9,551 $0.450 50 $0.022 37 $0.203 40,933Authorised 10,000 – – – – – – – – – – –Granted – 4,052 $0.370 – – 700 $0.370 – – – – 4,752Exercised – (3,357) $0.512 (7,206) $0.30 – – – – – – (10,563)Cancelled – (4,175) $0.298 – – (712) $0.271 – – – – (4,887)At 31 December 2017 10,000 20,609 $0.470 – – 9,359 $0.434 50 $0.022 37 $0.203 30,235
1 WAEP – weighted average exercise price
Financials
Boku Inc Annual Report and Accounts for the year ended 31 December 2017 www.boku.com72
26004 Boku AR2017.indd 72 09/04/2018 17:56:26
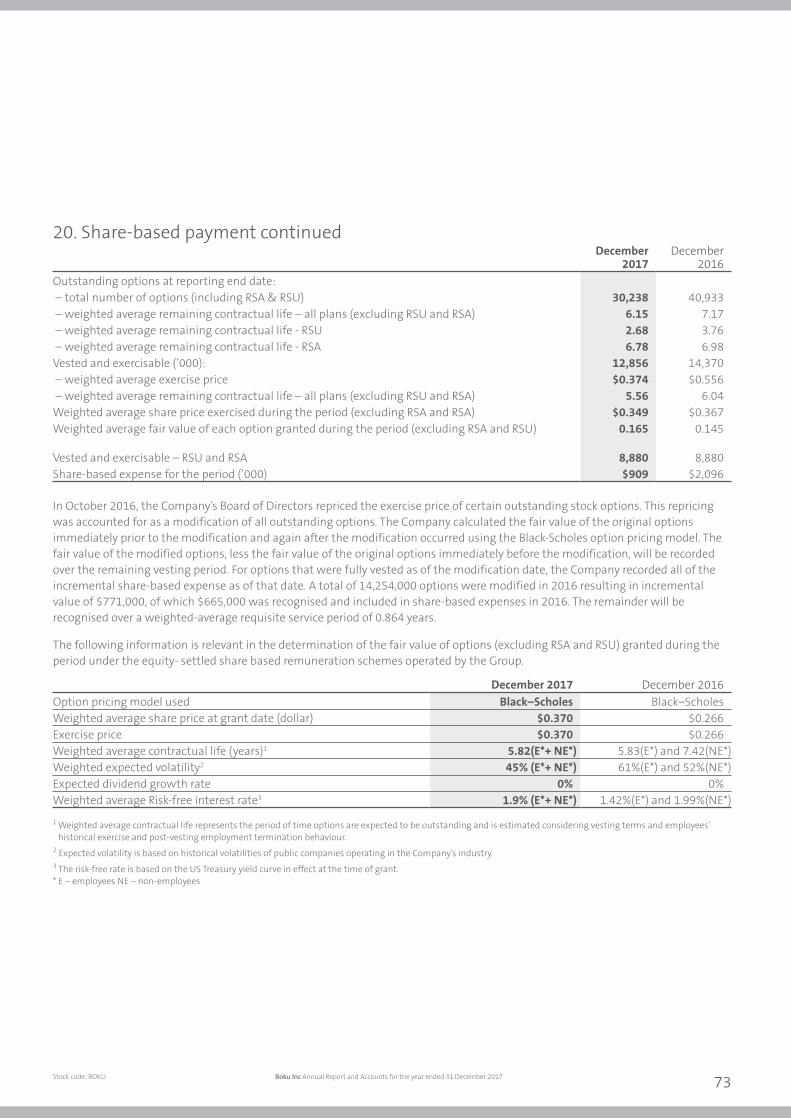
26004 9 April 2018 5:55 PM Proof 6 26004 9 April 2018 5:55 PM Proof 6
20. Share-based payment continuedDecember
2017December
2016Outstanding options at reporting end date: – total number of options (including RSA & RSU) 30,238 40,933 – weighted average remaining contractual life – all plans (excluding RSU and RSA) 6.15 7.17 – weighted average remaining contractual life - RSU 2.68 3.76 – weighted average remaining contractual life - RSA 6.78 6.98Vested and exercisable (’000): 12,856 14,370 – weighted average exercise price $0.374 $0.556 – weighted average remaining contractual life – all plans (excluding RSU and RSA) 5.56 6.04Weighted average share price exercised during the period (excluding RSA and RSA) $0.349 $0.367Weighted average fair value of each option granted during the period (excluding RSA and RSU) 0.165 0.145
Vested and exercisable – RSU and RSA 8,880 8,880Share-based expense for the period (’000) $909 $2,096
In October 2016, the Company’s Board of Directors repriced the exercise price of certain outstanding stock options. This repricing was accounted for as a modification of all outstanding options. The Company calculated the fair value of the original options immediately prior to the modification and again after the modification occurred using the Black-Scholes option pricing model. The fair value of the modified options, less the fair value of the original options immediately before the modification, will be recorded over the remaining vesting period. For options that were fully vested as of the modification date, the Company recorded all of the incremental share-based expense as of that date. A total of 14,254,000 options were modified in 2016 resulting in incremental value of $771,000, of which $665,000 was recognised and included in share-based expenses in 2016. The remainder will be recognised over a weighted-average requisite service period of 0.864 years.
The following information is relevant in the determination of the fair value of options (excluding RSA and RSU) granted during the period under the equity- settled share based remuneration schemes operated by the Group.
December 2017 December 2016Option pricing model used Black–Scholes Black–ScholesWeighted average share price at grant date (dollar) $0.370 $0.266Exercise price $0.370 $0.266Weighted average contractual life (years)1 5.82(E*+ NE*) 5.83(E*) and 7.42(NE*)Weighted expected volatility2 45% (E*+ NE*) 61%(E*) and 52%(NE*)Expected dividend growth rate 0% 0%Weighted average Risk-free interest rate3 1.9% (E*+ NE*) 1.42%(E*) and 1.99%(NE*)
1 Weighted average contractual life represents the period of time options are expected to be outstanding and is estimated considering vesting terms and employees’ historical exercise and post-vesting employment termination behaviour.
2 Expected volatility is based on historical volatilities of public companies operating in the Company’s industry. 3 The risk-free rate is based on the US Treasury yield curve in effect at the time of grant.* E – employees NE – non-employees
Stock code: BOKU Boku Inc Annual Report and Accounts for the year ended 31 December 2017 73
26004 Boku AR2017.indd 73 09/04/2018 17:56:26
26004 9 April 2018 5:55 PM Proof 6
Notes to the Consolidated Financial Information
20. Share-based payment continuedThe fair value of each RSU has been estimated on the date of grant using the Black-Scholes option pricing model with the following assumptions: expected terms ranging from 5.04 to 6.11 years; risk-free interest rates ranging from 1.87% to 1.92%; expected volatility of 45%; and no dividends during the expected term (2016: expected terms ranging from 5.75 to 6.08 years; risk-free interest rates ranging from 1.43% to 1.49%; volatility of 76%; and no dividends during the expected term). The weighted average values for the assumptions used were: expected term of 5.55 years; risk-free interest rate of 1.92%; expected volatility of 45%; and no dividends during the expected term (2016: expected term of 6.05 years; risk-free interest rate of 1.48%; expected volatility of 76%; and no dividends).
The fair value of each RSA granted in December 2013 has been estimated on the date of grant using the Black-Scholes option pricing model with the following assumptions: expected term of 10 years; risk-free interest rates 2.99%; expected volatility of 60%; and no dividends during the expected term.
Warrants for ordinary sharesFebruary 2013 WarrantIn February 2013, in connection with a financing arrangement with SVB bank, the Company issued a warrant to purchase 872,093 common shares at an exercise price of $0.86 per share. The warrant was immediately exercisable and expires in February 2023. As the fair value of the warrant cannot be estimated reliably relating to the financing arrangement, the Company determined the fair value of the warrant to be $392,000 using the Black-Scholes option pricing model, assuming a contractual life of 10 years, risk free rate of 1.88%, volatility of 60% and no dividends. The fair value of the warrant was recorded within other receivables and the corresponding amount in share premium. The fair value is being amortized to interest expense over 2 years by 2015, which was the term of the agreement. The warrants remained outstanding at December 2017 was 872,093 (2016:872,093).
September 2009 WarrantIn September 2009, the Company issued warrants to purchase 1,950,000 of common shares at $0.20 per share to certain holders of convertible preferred shares. The warrants were immediately exercisable. 1,150,000 warrants were expired and unexercised and remaining 800,000 (2016: 800,000) were exercised pre IPO date of 20th November 2017 and converted to 594,149 common shares.
Financials
Boku Inc Annual Report and Accounts for the year ended 31 December 2017 www.boku.com74
26004 Boku AR2017.indd 74 09/04/2018 17:56:26
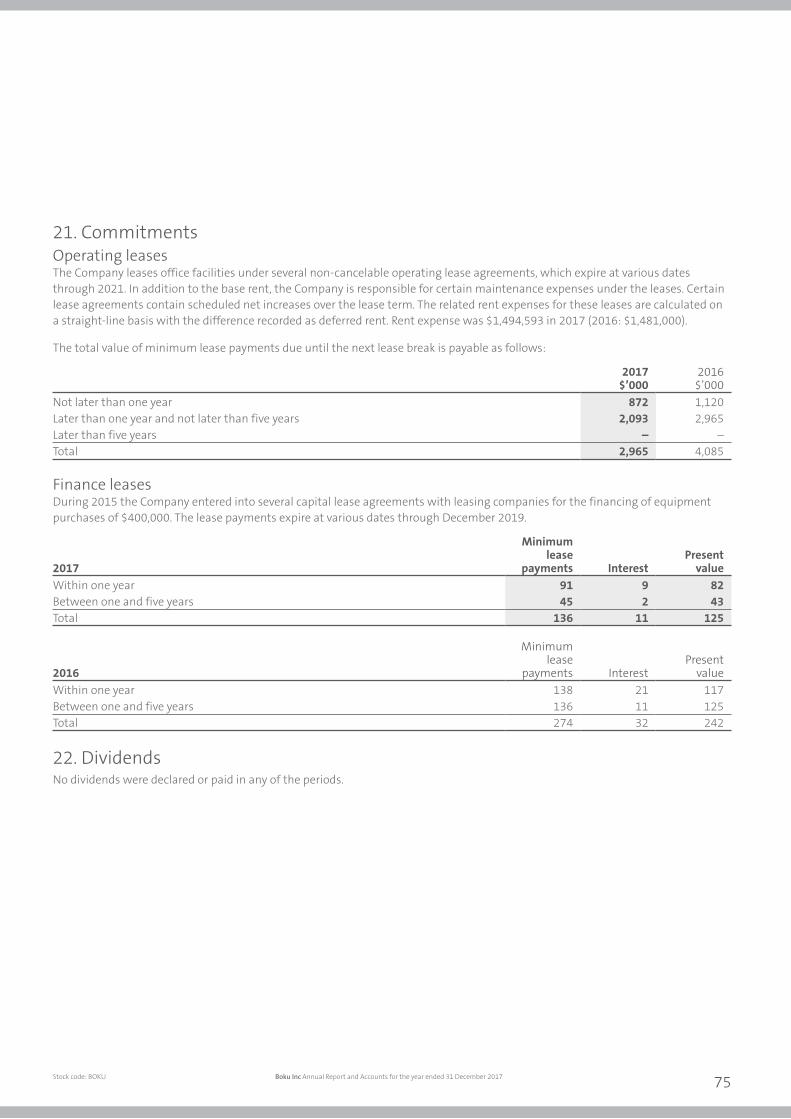
26004 9 April 2018 5:55 PM Proof 6 26004 9 April 2018 5:55 PM Proof 6
21. CommitmentsOperating leasesThe Company leases office facilities under several non-cancelable operating lease agreements, which expire at various dates through 2021. In addition to the base rent, the Company is responsible for certain maintenance expenses under the leases. Certain lease agreements contain scheduled net increases over the lease term. The related rent expenses for these leases are calculated on a straight-line basis with the difference recorded as deferred rent. Rent expense was $1,494,593 in 2017 (2016: $1,481,000).
The total value of minimum lease payments due until the next lease break is payable as follows:
2017$’000
2016$’000
Not later than one year 872 1,120Later than one year and not later than five years 2,093 2,965Later than five years – –Total 2,965 4,085
Finance leasesDuring 2015 the Company entered into several capital lease agreements with leasing companies for the financing of equipment purchases of $400,000. The lease payments expire at various dates through December 2019.
2017
Minimum lease
payments InterestPresent
valueWithin one year 91 9 82Between one and five years 45 2 43Total 136 11 125
2016
Minimum lease
payments InterestPresent
valueWithin one year 138 21 117 Between one and five years 136 11 125 Total 274 32 242
22. DividendsNo dividends were declared or paid in any of the periods.
Stock code: BOKU Boku Inc Annual Report and Accounts for the year ended 31 December 2017 75
26004 Boku AR2017.indd 75 09/04/2018 17:56:26
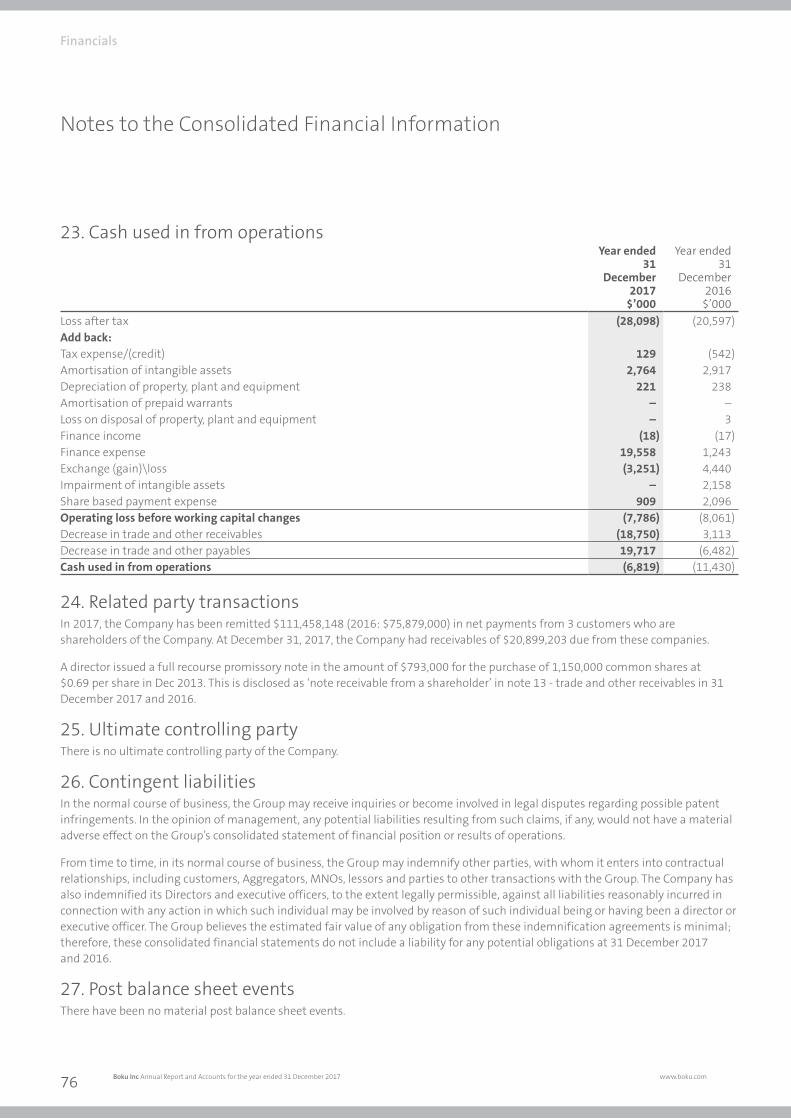
26004 9 April 2018 5:55 PM Proof 6
Notes to the Consolidated Financial Information
23. Cash used in from operations
Year ended31
December2017
$’000
Year ended31
December2016
$’000Loss after tax (28,098) (20,597)Add back:Tax expense/(credit) 129 (542)Amortisation of intangible assets 2,764 2,917Depreciation of property, plant and equipment 221 238Amortisation of prepaid warrants – –Loss on disposal of property, plant and equipment – 3Finance income (18) (17)Finance expense 19,558 1,243Exchange (gain)\loss (3,251) 4,440Impairment of intangible assets – 2,158Share based payment expense 909 2,096Operating loss before working capital changes (7,786) (8,061)Decrease in trade and other receivables (18,750) 3,113Decrease in trade and other payables 19,717 (6,482)Cash used in from operations (6,819) (11,430)
24. Related party transactionsIn 2017, the Company has been remitted $111,458,148 (2016: $75,879,000) in net payments from 3 customers who are shareholders of the Company. At December 31, 2017, the Company had receivables of $20,899,203 due from these companies.
A director issued a full recourse promissory note in the amount of $793,000 for the purchase of 1,150,000 common shares at $0.69 per share in Dec 2013. This is disclosed as ‘note receivable from a shareholder’ in note 13 - trade and other receivables in 31 December 2017 and 2016.
25. Ultimate controlling partyThere is no ultimate controlling party of the Company.
26. Contingent liabilitiesIn the normal course of business, the Group may receive inquiries or become involved in legal disputes regarding possible patent infringements. In the opinion of management, any potential liabilities resulting from such claims, if any, would not have a material adverse effect on the Group’s consolidated statement of financial position or results of operations.
From time to time, in its normal course of business, the Group may indemnify other parties, with whom it enters into contractual relationships, including customers, Aggregators, MNOs, lessors and parties to other transactions with the Group. The Company has also indemnified its Directors and executive officers, to the extent legally permissible, against all liabilities reasonably incurred in connection with any action in which such individual may be involved by reason of such individual being or having been a director or executive officer. The Group believes the estimated fair value of any obligation from these indemnification agreements is minimal; therefore, these consolidated financial statements do not include a liability for any potential obligations at 31 December 2017 and 2016.
27. Post balance sheet eventsThere have been no material post balance sheet events.
Financials
Boku Inc Annual Report and Accounts for the year ended 31 December 2017 www.boku.com76
26004 Boku AR2017.indd 76 09/04/2018 17:56:26

26004 9 April 2018 5:55 PM Proof 626004 9 April 2018 5:55 PM Proof 6 26004 9 April 2018 5:55 PM Proof 6
Stock code: BOKU Boku Inc Annual Report and Accounts for the year ended 31 December 2017
26004 Boku AR2017.indd 6 09/04/2018 17:56:07

26004 9 April 2018 5:55 PM Proof 626004 9 April 2018 5:55 PM Proof 6 26004 9 April 2018 5:55 PM Proof 6
Boku, Inc.2-6 Boundary Row, London
SE1 8HP, UK
Boku, Inc. Annual Report and Accounts for the year ended 31 Decem
ber 2017
26004 Boku AR2017.indd 1 09/04/2018 17:56:04