Embed Size (px)
Citation preview
2012-13 School Accountability Report Card for Bonsall Elementary School Page 1 of 12
Bonsall Elementary School
School Accountability Report Card
Reported Using Data from the 2012-13 School Year
Published During 2013-14
Every school in California is required by state law to publish a School Accountability Report Card (SARC), by February 1 of each year. The SARC contains information about the condition and performance of each California public school. • For more information about SARC requirements, see the California Department of Education (CDE) SARC webpage at
http://www.cde.ca.gov/ta/ac/sa/. • For additional information about the school, parents and community members should contact the school principal or the district
office.
I. Data and Access
DataQuest DataQuest is an online data tool located on the CDE DataQuest Web page at http://dq.cde.ca.gov/dataquest/ that contains additional information about this school and comparisons of the school to the district, the county, and the state. Specifically, DataQuest is a dynamic system that provides reports for accountability (e.g., state Academic Performance Index [API], federal Adequate Yearly Progress [AYP]), test data, enrollment, high school graduates, dropouts, course enrollments, staffing, and data regarding English learners. Internet Access Internet access is available at public libraries and other locations that are publicly accessible (e.g., the California State Library). Access to the Internet at libraries and public locations is generally provided on a first-come, first-served basis. Other use restrictions may include the hours of operation, the length of time that a workstation may be used (depending on availability), the types of software programs available on a workstation, and the ability to print documents. Additional Information For further information regarding the data elements and terms used in the SARC see the 2012–13 Academic Performance Index Reports Information Guide located on the CDE API Web page at http://www.cde.ca.gov/ta/ac/ap/.
II. About This School Contact Information (School Year 2013-14)
School Contact Information
School Name------- Bonsall Elementary School
Street------- 31555 Old River Rd.
City, State, Zip------- Bonsall, CA 92003-5112
Phone Number------- 760.631.5205
Principal------- Lori Cummins
E-mail Address------- [email protected]
CDS Code 37679756037543

2012-13 School Accountability Report Card for Bonsall Elementary School Page 2 of 12
District Contact Information
District Name------- Bonsall Union Elementary School District
Phone Number------- 760.631.5200 x1001
Web Site------- www.bonsallusd.com
Superintendent------- Justin Cunningham, Ed.D.
E-mail Address------- [email protected]
School Description and Mission Statement (School Year 2012-13) This section provides information about the school, its programs and its goals.
Message from the Principal Welcome to Bonsall Elementary School. Bonsall Elementary School is located in the rural community of Bonsall and is the largest of four schools in the district. The facility opened in August of 2008 and sits atop a hill overlooking a golf course and the San Luis Rey River Valley. Bonsall Elementary School was constructed as a state of the art facility while conserving the feel of the community. A tradition of excellence is at the core of all instructional programs. Educational programs have been designed to provide academic excellence and support for all students. The dedication of our staff, parents and community to our students has continually resulted in high API scores. We are proud of our implementation of an integrated learning environment via virtual desktops. This is an exciting new learning environment that has taken us to the forefront of educational advancements in technology. Through the use of virtual desktops, learning can be extended to the home. Our mission is provide a program dedicated to our students that enables them to acquire skills to meet present needs and the future challenges in a complex and changing world. Students at Bonsall Elementary are exposed to instructional programs that reflect a student centered learning environment that is both rigorous and positive in nature. The focus is on student achievement, success and character development. All stakeholders work collaboratively to assure student success. Every classroom at Bonsall Elementary School is equipped with 7 student computers, an Elmo, LCD projector and teacher laptop. Ten classrooms on campus are also equipped with Promethean Boards. The computer lab is also state of the art, equipped with forty terminals for student use. There is also two mobile laptop carts containing an additional 25 computers each for classroom use. A mobile lab of I-Pads is also available for student use. Differentiation is core to instruction. Through the use of MAP (Measures of Academic Performance) assessments, teachers are able to develop targeted plans for student success. Students also have access to Compass Odyssey and ST Math (Spatial Temporal Mathematics) to further assist their individualized learning through our district portal. Collaboration between General Education and Special Education is ongoing with the use of the inclusion model on a daily basis. Opportunities for Parental Involvement (School Year 2012-13) This section provides information on how parents can become involved in school activities, including contact information pertaining to organized opportunities for parent involvement.
Parent involvement at Bonsall Elementary School is strongly encouraged. Parents volunteer in the classroom working with students, assisting the teacher, teaching an “Arts Attack” lesson or organizing events. Our parents also help chaperone field trips, help in the office and run the student store. We have a very strong and active PTA. The PTA assists with the organization of parent volunteers and room parents. They also raise funds that go directly to the classroom, plan family centered events and support our Character Education programs. School Site Council is another way in which parents can get involved. Through participation in the SSC, parents are able to work the teachers and administration to provide, advise and counsel in evaluating state, school district and school performance goals. They are able to help determine the methods used at school to meet goals and objectives. SSC positions are elected positions. The Bonsall Educational Foundation (BEF) is a maturing organization. It is a non-profit and independent foundation that assists in the achievement and maintenance of a superior public education system within the Bonsall Union School District. All projects designed by the Foundation benefit the educational experience for all students in the district. The ELAC parent group is another strong organization. The committee advises (reviews and comments) the principal and School Site Council on the development of the components of Bonsall’s Single Plan for Student Achievement, which impacts the education services for the English Learners.
2012-13 School Accountability Report Card for Bonsall Elementary School Page 3 of 12
Parents are continually encouraged to volunteer and take an active role in the educational process of their students. Parent involvement coordinators: Heike Caldwell- PTA president; Desiree Burkhart- BEF president (760-631-5205)
III. Student Performance
The Standardized Testing and Reporting (STAR) Program consists of several key components, including: • California Standards Tests (CSTs), which include English-language arts (ELA) and mathematics in grades two through eleven;
science in grades five, eight, and nine through eleven; and history-social science in grades eight, and nine through eleven. • California Modified Assessment (CMA), an alternate assessment that is based on modified achievement standards in ELA for
grades three through eleven; mathematics for grades three through seven, Algebra I, and Geometry; and science in grades five and eight, and Life Science in grade ten. The CMA is designed to assess those students whose disabilities preclude them from achieving grade-level proficiency on an assessment of the California content standards with or without accommodations.
• California Alternate Performance Assessment (CAPA), includes ELA and mathematics in grades two through eleven, and science
for grades five, eight, and ten. The CAPA is given to those students with significant cognitive disabilities whose disabilities prevent them from taking either the CSTs with accommodations or modifications or the CMA with accommodations.
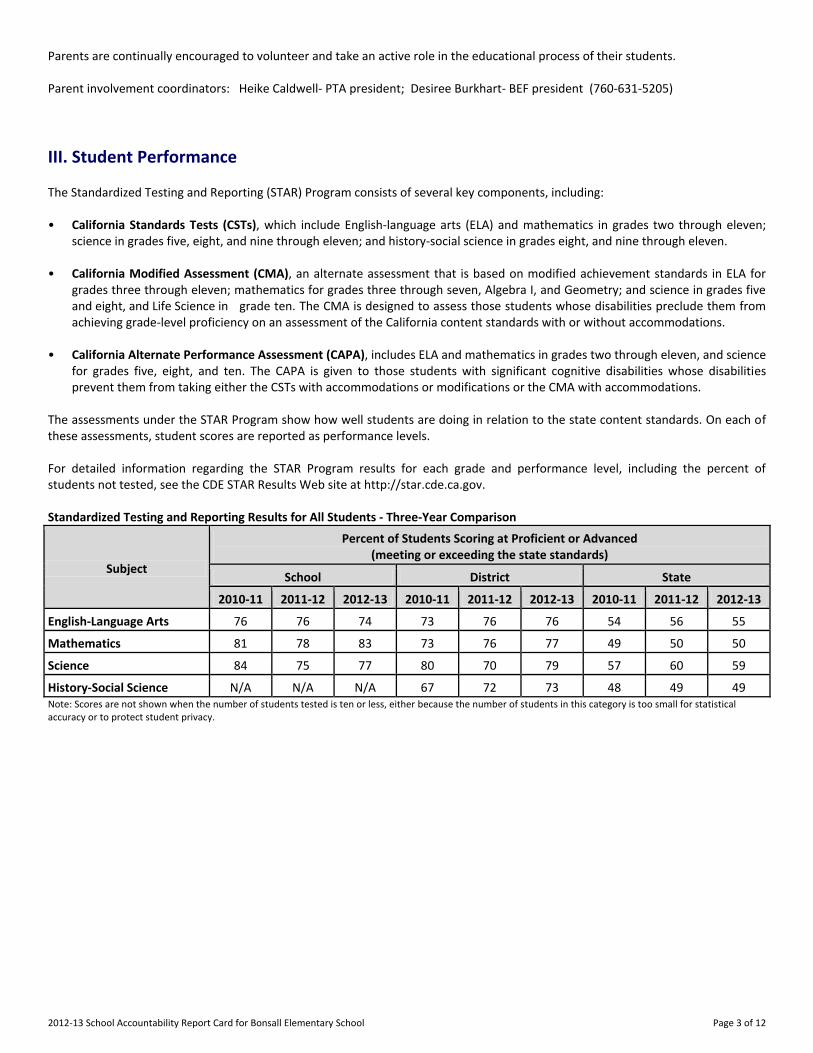
The assessments under the STAR Program show how well students are doing in relation to the state content standards. On each of these assessments, student scores are reported as performance levels. For detailed information regarding the STAR Program results for each grade and performance level, including the percent of students not tested, see the CDE STAR Results Web site at http://star.cde.ca.gov. Standardized Testing and Reporting Results for All Students - Three-Year Comparison
Subject
Percent of Students Scoring at Proficient or Advanced (meeting or exceeding the state standards)
School District State
2010-11 2011-12 2012-13 2010-11 2011-12 2012-13 2010-11 2011-12 2012-13
English-Language Arts 76 76 74 73 76 76 54 56 55
Mathematics------- 81 78 83 73 76 77 49 50 50
Science------- 84 75 77 80 70 79 57 60 59
History-Social Science N/A N/A N/A 67 72 73 48 49 49 Note: Scores are not shown when the number of students tested is ten or less, either because the number of students in this category is too small for statistical accuracy or to protect student privacy.
2012-13 School Accountability Report Card for Bonsall Elementary School Page 4 of 12
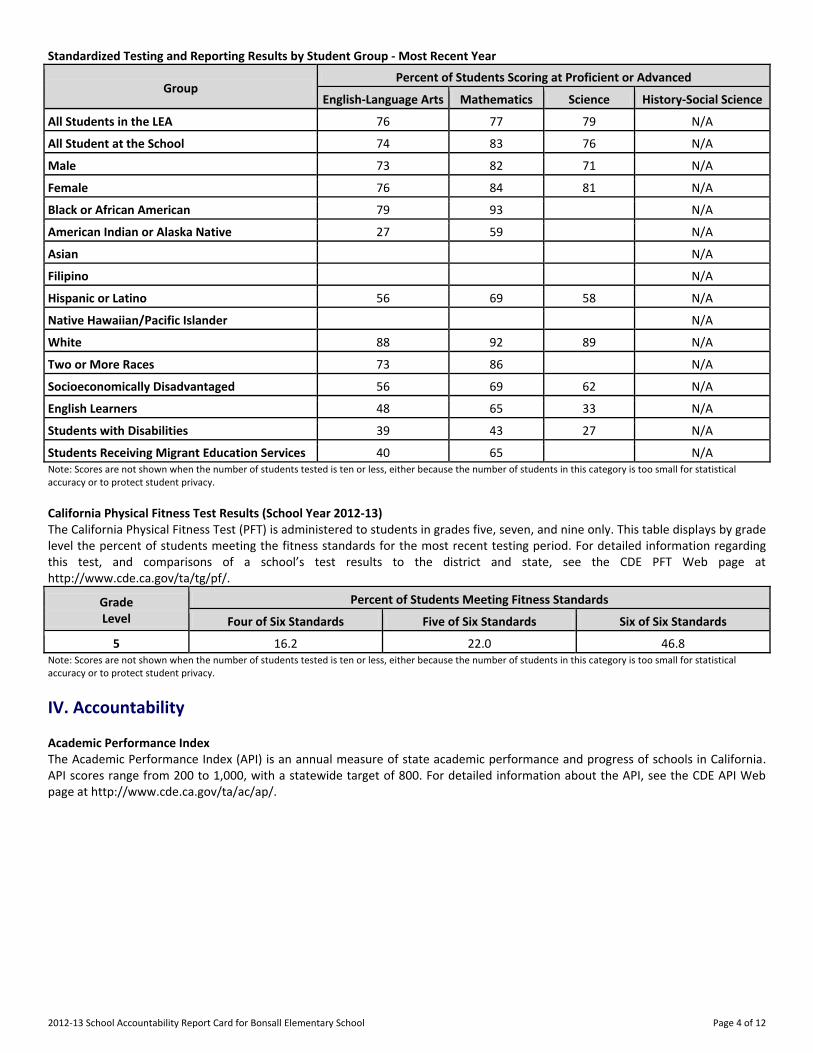
Standardized Testing and Reporting Results by Student Group - Most Recent Year
Group Percent of Students Scoring at Proficient or Advanced
English-Language Arts Mathematics Science History-Social Science
All Students in the LEA 76 77 79 N/A
All Student at the School 74 83 76 N/A
Male------- 73 82 71 N/A
Female------- 76 84 81 N/A
Black or African American 79 93 N/A
American Indian or Alaska Native 27 59 N/A
Asian------- N/A
Filipino------- N/A
Hispanic or Latino 56 69 58 N/A
Native Hawaiian/Pacific Islander N/A
White------- 88 92 89 N/A
Two or More Races------- 73 86 N/A
Socioeconomically Disadvantaged 56 69 62 N/A
English Learners------- 48 65 33 N/A
Students with Disabilities 39 43 27 N/A
Students Receiving Migrant Education Services 40 65 N/A Note: Scores are not shown when the number of students tested is ten or less, either because the number of students in this category is too small for statistical accuracy or to protect student privacy. California Physical Fitness Test Results (School Year 2012-13) The California Physical Fitness Test (PFT) is administered to students in grades five, seven, and nine only. This table displays by grade level the percent of students meeting the fitness standards for the most recent testing period. For detailed information regarding this test, and comparisons of a school’s test results to the district and state, see the CDE PFT Web page at http://www.cde.ca.gov/ta/tg/pf/.
Grade Level
Percent of Students Meeting Fitness Standards
Four of Six Standards Five of Six Standards Six of Six Standards
-------5------- 16.2 22.0 46.8 Note: Scores are not shown when the number of students tested is ten or less, either because the number of students in this category is too small for statistical accuracy or to protect student privacy.
IV. Accountability
Academic Performance Index The Academic Performance Index (API) is an annual measure of state academic performance and progress of schools in California. API scores range from 200 to 1,000, with a statewide target of 800. For detailed information about the API, see the CDE API Web page at http://www.cde.ca.gov/ta/ac/ap/.
2012-13 School Accountability Report Card for Bonsall Elementary School Page 5 of 12
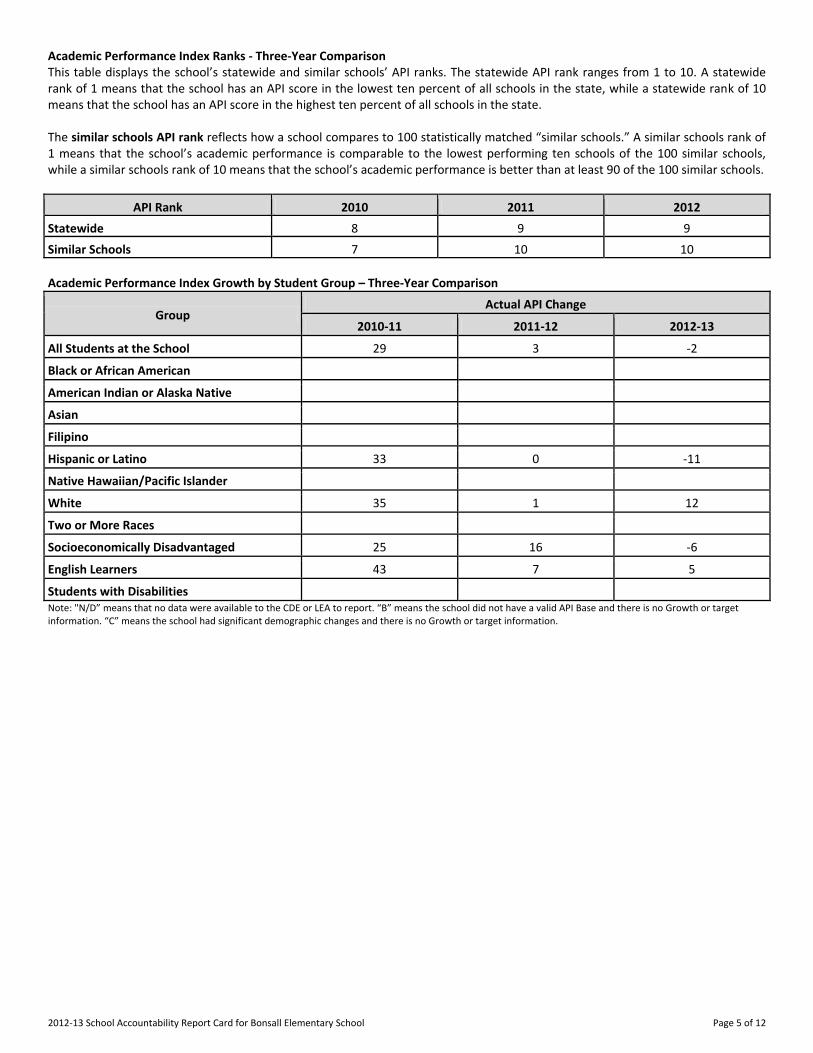
Academic Performance Index Ranks - Three-Year Comparison This table displays the school’s statewide and similar schools’ API ranks. The statewide API rank ranges from 1 to 10. A statewide rank of 1 means that the school has an API score in the lowest ten percent of all schools in the state, while a statewide rank of 10 means that the school has an API score in the highest ten percent of all schools in the state. The similar schools API rank reflects how a school compares to 100 statistically matched “similar schools.” A similar schools rank of 1 means that the school’s academic performance is comparable to the lowest performing ten schools of the 100 similar schools, while a similar schools rank of 10 means that the school’s academic performance is better than at least 90 of the 100 similar schools.
API Rank 2010 2011 2012
Statewide------- 8 9 9
Similar Schools------- 7 10 10
Academic Performance Index Growth by Student Group – Three-Year Comparison
Group Actual API Change
2010-11 2011-12 2012-13
All Students at the School 29 3 -2
Black or African American
American Indian or Alaska Native
Asian-------
Filipino-------
Hispanic or Latino 33 0 -11
Native Hawaiian/Pacific Islander
White------- 35 1 12
Two or More Races
Socioeconomically Disadvantaged 25 16 -6
English Learners 43 7 5
Students with Disabilities Note: "N/D” means that no data were available to the CDE or LEA to report. “B” means the school did not have a valid API Base and there is no Growth or target information. “C” means the school had significant demographic changes and there is no Growth or target information.

2012-13 School Accountability Report Card for Bonsall Elementary School Page 6 of 12
Academic Performance Index Growth by Student Group - 2013 Growth API Comparison This table displays, by student group, the number of students included in the API and the 2013 Growth API at the school, LEA, and state level.
Group
2013 Growth API
School District State
# of Students Growth API # of Students Growth API # of Students Growth API
All Students at the School 587 897 1,464 891 4,655,989 790
Black or African American 14 890 44 863 296,463 708
American Indian or Alaska Native 27 706 74 730 30,394 743
Asian------- 8 37 966 406,527 906
Filipino------- 8 38 951 121,054 867
Hispanic or Latino 181 818 480 831 2,438,951 744
Native Hawaiian/Pacific Islander 0 7 25,351 774
White------- 331 953 728 941 1,200,127 853
Two or More Races 18 915 55 903 125,025 824
Socioeconomically Disadvantaged 207 828 543 827 2,774,640 743
English Learners 103 817 271 796 1,482,316 721
Students with Disabilities 74 690 192 710 527,476 615
Adequate Yearly Progress The federal ESEA requires that all schools and districts meet the following Adequate Yearly Progress (AYP) criteria: • Participation rate on the state’s standards-based assessments in ELA and mathematics • Percent proficient on the state’s standards-based assessments in ELA and mathematics • API as an additional indicator • Graduation rate (for secondary schools) For detailed information about AYP, including participation rates and percent proficient results by student group, see the CDE AYP Web page at http://www.cde.ca.gov/ta/ac/ay/. Adequate Yearly Progress Overall and by Criteria (School Year 2012-13)
AYP Criteria School District
Made AYP Overall No No
Met Participation Rate: English-Language Arts Yes Yes
Met Participation Rate: Mathematics Yes Yes
Met Percent Proficient: English-Language Arts No No
Met Percent Proficient: Mathematics Yes No
Met API Criteria Yes Yes
Met Graduation Rate (if applicable) N/A N/A
2012-13 School Accountability Report Card for Bonsall Elementary School Page 7 of 12
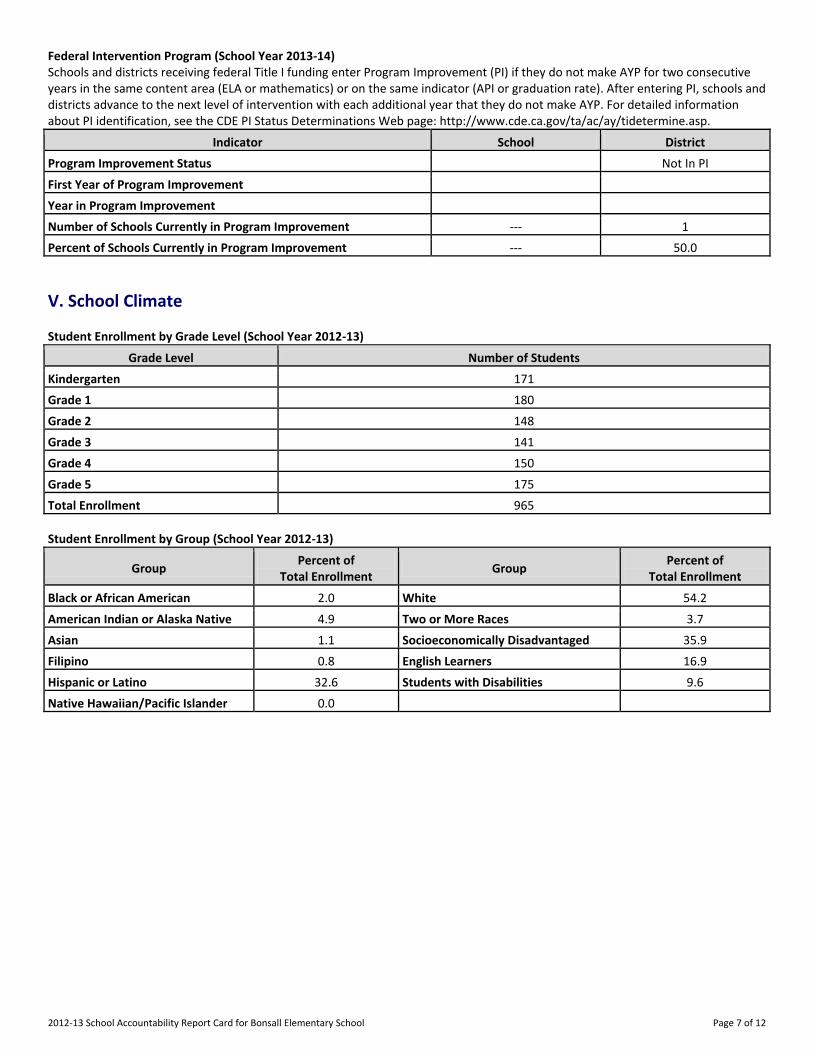
Federal Intervention Program (School Year 2013-14) Schools and districts receiving federal Title I funding enter Program Improvement (PI) if they do not make AYP for two consecutive years in the same content area (ELA or mathematics) or on the same indicator (API or graduation rate). After entering PI, schools and districts advance to the next level of intervention with each additional year that they do not make AYP. For detailed information about PI identification, see the CDE PI Status Determinations Web page: http://www.cde.ca.gov/ta/ac/ay/tidetermine.asp.
Indicator School District
Program Improvement Status Not In PI
First Year of Program Improvement
Year in Program Improvement
Number of Schools Currently in Program Improvement --- 1
Percent of Schools Currently in Program Improvement --- 50.0
V. School Climate
Student Enrollment by Grade Level (School Year 2012-13)
Grade Level Number of Students
Kindergarten------- 171
Grade 1------- 180
Grade 2------- 148
Grade 3------- 141
Grade 4------- 150
Grade 5------- 175
Total Enrollment------- 965
Student Enrollment by Group (School Year 2012-13)
Group Percent of
Total Enrollment Group
Percent of Total Enrollment
Black or African American------- 2.0 White 54.2
American Indian or Alaska Native-------
4.9 Two or More Races 3.7
Asian------- 1.1 Socioeconomically Disadvantaged 35.9
Filipino------- 0.8 English Learners 16.9
Hispanic or Latino------- 32.6 Students with Disabilities 9.6
Native Hawaiian/Pacific Islander 0.0
2012-13 School Accountability Report Card for Bonsall Elementary School Page 8 of 12
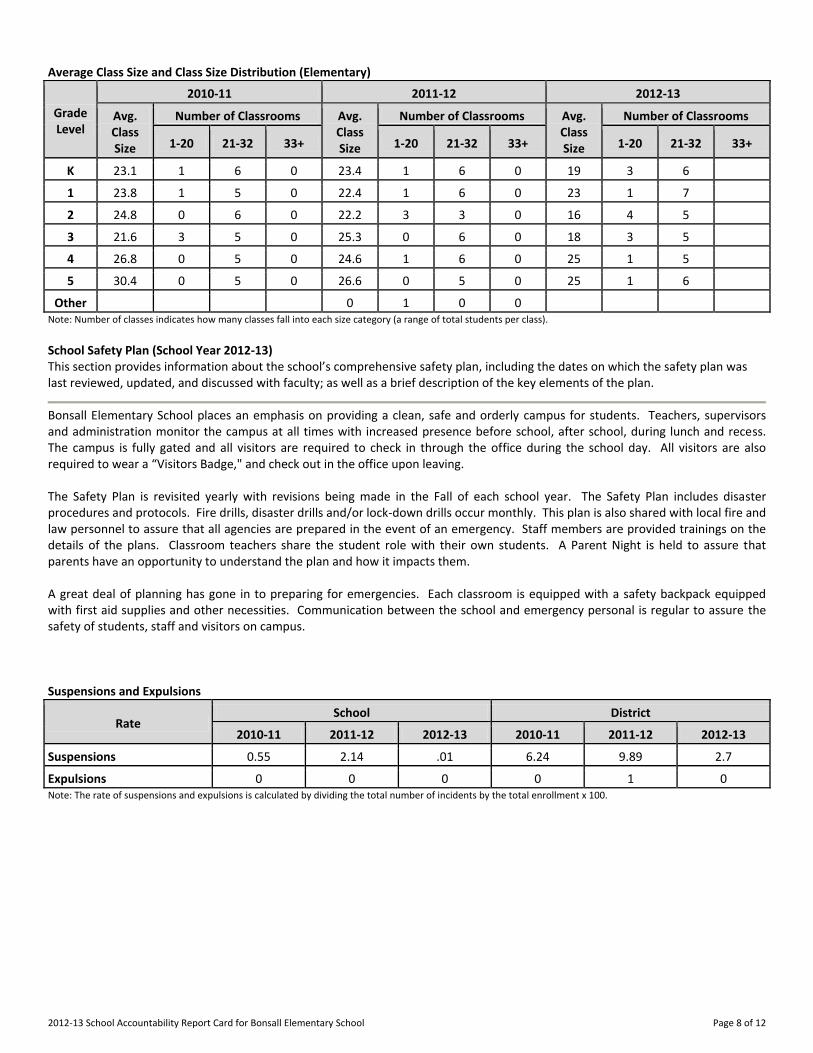
Average Class Size and Class Size Distribution (Elementary)
Grade Level
2010-11 2011-12 2012-13
Avg. Class Size
Number of Classrooms Avg. Class Size
Number of Classrooms Avg. Class Size
Number of Classrooms
1-20 21-32 33+ 1-20 21-32 33+ 1-20 21-32 33+
K ----------
23.1 1 6 0 23.4 1 6 0 19 3 6
1 ----------
23.8 1 5 0 22.4 1 6 0 23 1 7
2 ----------
24.8 0 6 0 22.2 3 3 0 16 4 5
3 ----------
21.6 3 5 0 25.3 0 6 0 18 3 5
4 ----------
26.8 0 5 0 24.6 1 6 0 25 1 5
5 ----------
30.4 0 5 0 26.6 0 5 0 25 1 6
Other ----------
0 1 0 0 Note: Number of classes indicates how many classes fall into each size category (a range of total students per class).
School Safety Plan (School Year 2012-13) This section provides information about the school’s comprehensive safety plan, including the dates on which the safety plan was last reviewed, updated, and discussed with faculty; as well as a brief description of the key elements of the plan.
Bonsall Elementary School places an emphasis on providing a clean, safe and orderly campus for students. Teachers, supervisors and administration monitor the campus at all times with increased presence before school, after school, during lunch and recess. The campus is fully gated and all visitors are required to check in through the office during the school day. All visitors are also required to wear a “Visitors Badge," and check out in the office upon leaving. The Safety Plan is revisited yearly with revisions being made in the Fall of each school year. The Safety Plan includes disaster procedures and protocols. Fire drills, disaster drills and/or lock-down drills occur monthly. This plan is also shared with local fire and law personnel to assure that all agencies are prepared in the event of an emergency. Staff members are provided trainings on the details of the plans. Classroom teachers share the student role with their own students. A Parent Night is held to assure that parents have an opportunity to understand the plan and how it impacts them. A great deal of planning has gone in to preparing for emergencies. Each classroom is equipped with a safety backpack equipped with first aid supplies and other necessities. Communication between the school and emergency personal is regular to assure the safety of students, staff and visitors on campus. Suspensions and Expulsions
Rate School District
2010-11 2011-12 2012-13 2010-11 2011-12 2012-13
Suspensions------- 0.55 2.14 .01 6.24 9.89 2.7
Expulsions------- 0 0 0 0 1 0 Note: The rate of suspensions and expulsions is calculated by dividing the total number of incidents by the total enrollment x 100.
2012-13 School Accountability Report Card for Bonsall Elementary School Page 9 of 12
VI. School Facilities
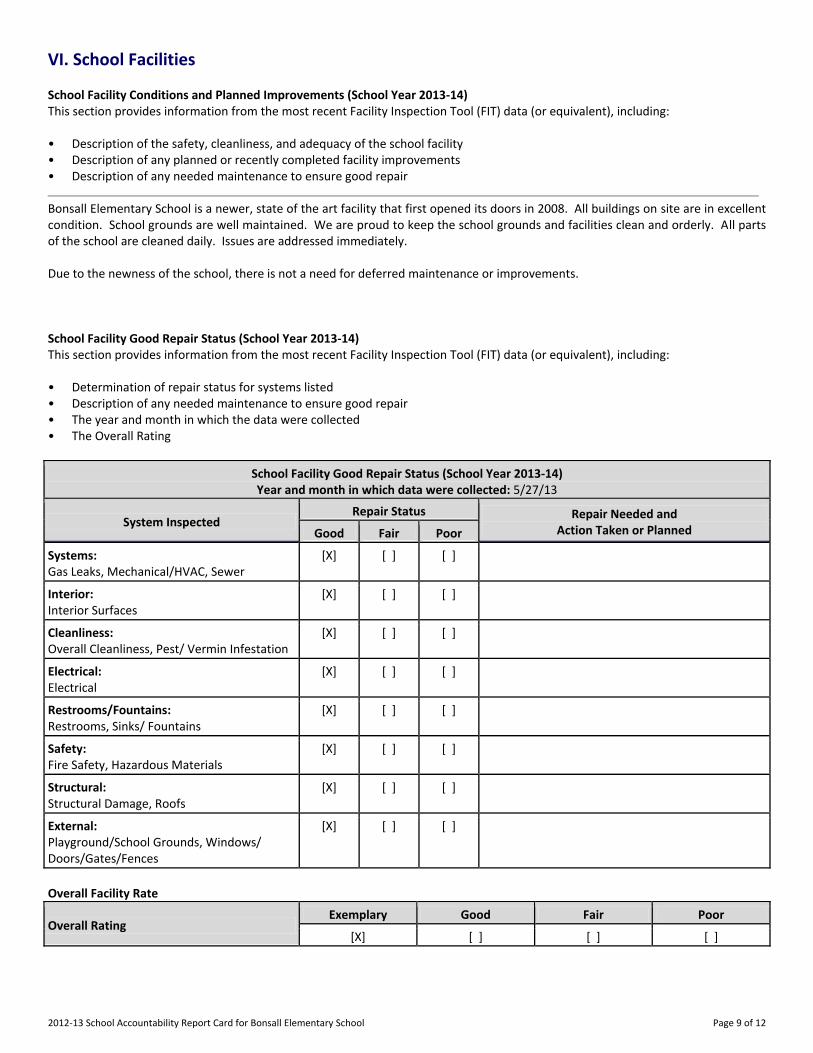
School Facility Conditions and Planned Improvements (School Year 2013-14) This section provides information from the most recent Facility Inspection Tool (FIT) data (or equivalent), including: • Description of the safety, cleanliness, and adequacy of the school facility • Description of any planned or recently completed facility improvements • Description of any needed maintenance to ensure good repair
Bonsall Elementary School is a newer, state of the art facility that first opened its doors in 2008. All buildings on site are in excellent condition. School grounds are well maintained. We are proud to keep the school grounds and facilities clean and orderly. All parts of the school are cleaned daily. Issues are addressed immediately. Due to the newness of the school, there is not a need for deferred maintenance or improvements. School Facility Good Repair Status (School Year 2013-14) This section provides information from the most recent Facility Inspection Tool (FIT) data (or equivalent), including: • Determination of repair status for systems listed • Description of any needed maintenance to ensure good repair • The year and month in which the data were collected • The Overall Rating
School Facility Good Repair Status (School Year 2013-14) Year and month in which data were collected: 5/27/13
System Inspected Repair Status Repair Needed and
Action Taken or Planned Good Fair Poor
Systems: Gas Leaks, Mechanical/HVAC, Sewer
[X] [ ] [ ]
Interior: Interior Surfaces
[X] [ ] [ ]
Cleanliness: Overall Cleanliness, Pest/ Vermin Infestation
[X] [ ] [ ]
Electrical: Electrical
[X] [ ] [ ]
Restrooms/Fountains: Restrooms, Sinks/ Fountains
[X] [ ] [ ]
Safety: Fire Safety, Hazardous Materials
[X] [ ] [ ]
Structural: Structural Damage, Roofs
[X] [ ] [ ]
External: Playground/School Grounds, Windows/ Doors/Gates/Fences
[X] [ ] [ ]
Overall Facility Rate
Overall Rating Exemplary Good Fair Poor
[X] [ ] [ ] [ ]
2012-13 School Accountability Report Card for Bonsall Elementary School Page 10 of 12
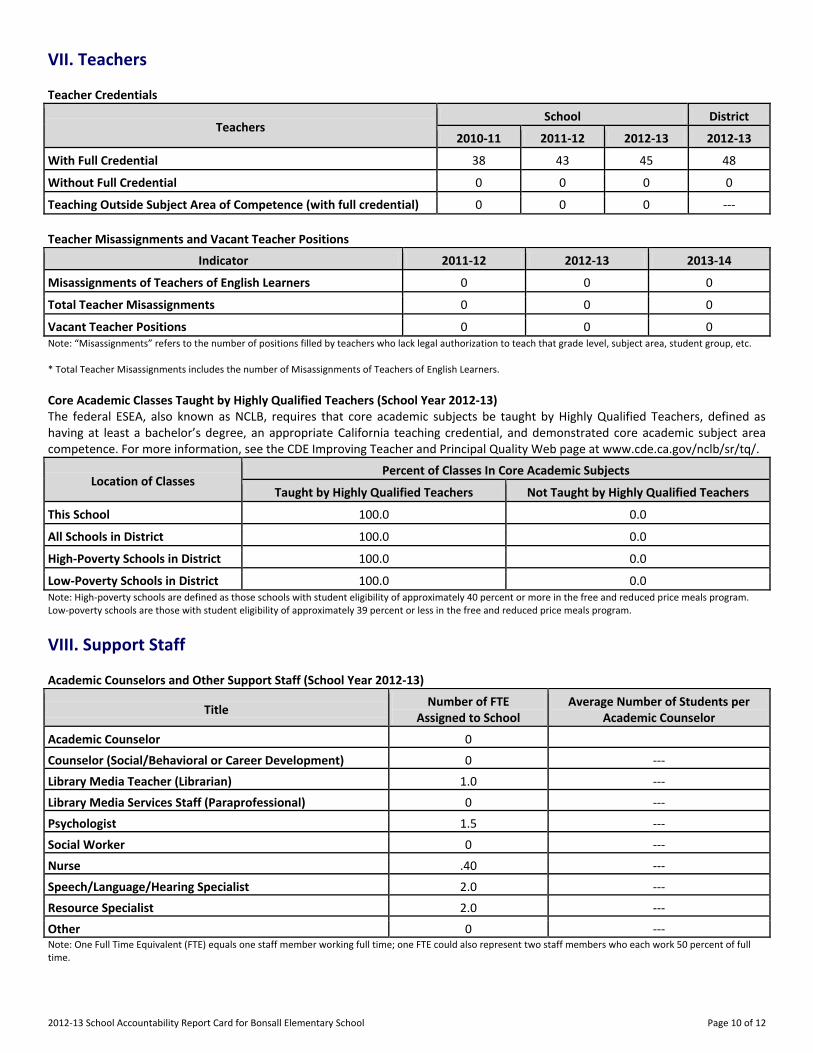
VII. Teachers
Teacher Credentials
Teachers School District
2010-11 2011-12 2012-13 2012-13
With Full Credential 38 43 45 48
Without Full Credential 0 0 0 0
Teaching Outside Subject Area of Competence (with full credential) 0 0 0 ---
Teacher Misassignments and Vacant Teacher Positions
Indicator 2011-12 2012-13 2013-14
Misassignments of Teachers of English Learners 0 0 0
Total Teacher Misassignments 0 0 0
Vacant Teacher Positions 0 0 0 Note: “Misassignments” refers to the number of positions filled by teachers who lack legal authorization to teach that grade level, subject area, student group, etc. * Total Teacher Misassignments includes the number of Misassignments of Teachers of English Learners. Core Academic Classes Taught by Highly Qualified Teachers (School Year 2012-13) The federal ESEA, also known as NCLB, requires that core academic subjects be taught by Highly Qualified Teachers, defined as having at least a bachelor’s degree, an appropriate California teaching credential, and demonstrated core academic subject area competence. For more information, see the CDE Improving Teacher and Principal Quality Web page at www.cde.ca.gov/nclb/sr/tq/.
Location of Classes Percent of Classes In Core Academic Subjects
Taught by Highly Qualified Teachers Not Taught by Highly Qualified Teachers
This School 100.0 0.0
All Schools in District 100.0 0.0
High-Poverty Schools in District 100.0 0.0
Low-Poverty Schools in District 100.0 0.0 Note: High-poverty schools are defined as those schools with student eligibility of approximately 40 percent or more in the free and reduced price meals program. Low-poverty schools are those with student eligibility of approximately 39 percent or less in the free and reduced price meals program.
VIII. Support Staff
Academic Counselors and Other Support Staff (School Year 2012-13)
Title Number of FTE
Assigned to School Average Number of Students per
Academic Counselor
Academic Counselor------- 0
Counselor (Social/Behavioral or Career Development) 0 ---
Library Media Teacher (Librarian) 1.0 ---
Library Media Services Staff (Paraprofessional) 0 ---
Psychologist------- 1.5 ---
Social Worker------- 0 ---
Nurse------- .40 ---
Speech/Language/Hearing Specialist 2.0 ---
Resource Specialist------- 2.0 ---
Other------- 0 --- Note: One Full Time Equivalent (FTE) equals one staff member working full time; one FTE could also represent two staff members who each work 50 percent of full time.
2012-13 School Accountability Report Card for Bonsall Elementary School Page 11 of 12
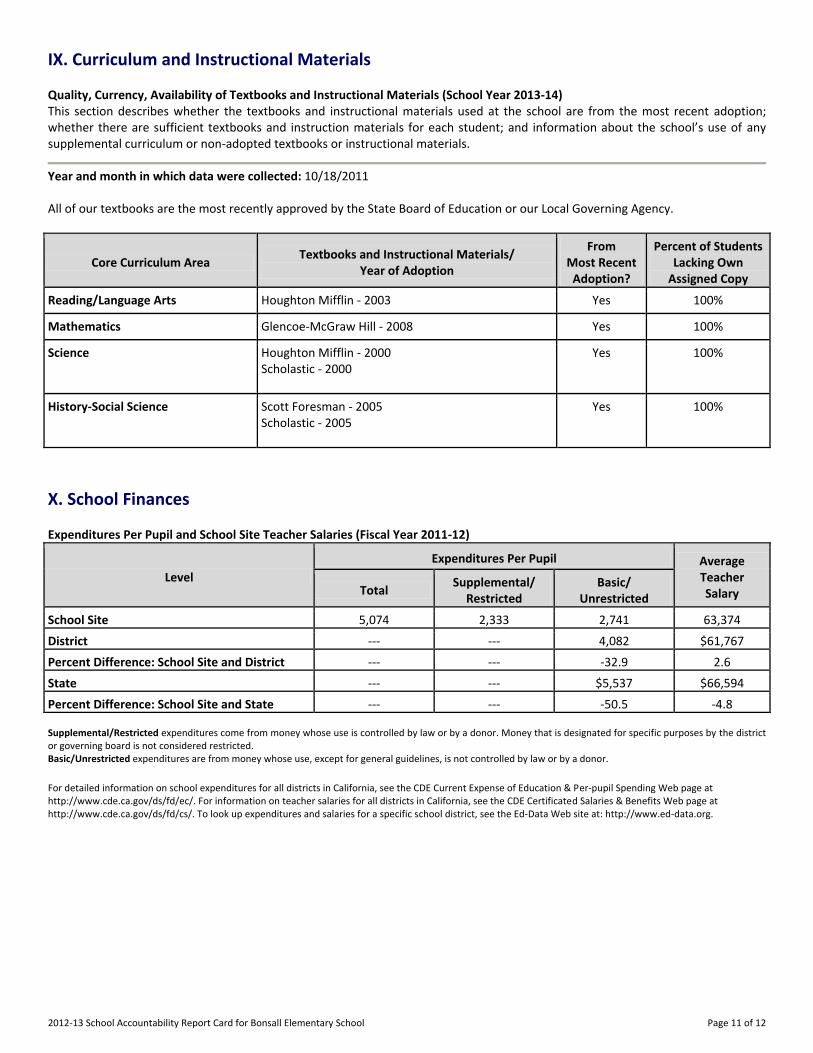
IX. Curriculum and Instructional Materials
Quality, Currency, Availability of Textbooks and Instructional Materials (School Year 2013-14) This section describes whether the textbooks and instructional materials used at the school are from the most recent adoption; whether there are sufficient textbooks and instruction materials for each student; and information about the school’s use of any supplemental curriculum or non-adopted textbooks or instructional materials.
Year and month in which data were collected: 10/18/2011 All of our textbooks are the most recently approved by the State Board of Education or our Local Governing Agency.
Core Curriculum Area Textbooks and Instructional Materials/
Year of Adoption
From Most Recent
Adoption?
Percent of Students Lacking Own
Assigned Copy
Reading/Language Arts Houghton Mifflin - 2003 Yes 100%
Mathematics Glencoe-McGraw Hill - 2008 Yes 100%
Science------- Houghton Mifflin - 2000
Scholastic - 2000
Yes 100%
History-Social Science Scott Foresman - 2005
Scholastic - 2005
Yes 100%
X. School Finances
Expenditures Per Pupil and School Site Teacher Salaries (Fiscal Year 2011-12)
Level
Expenditures Per Pupil Average Teacher Salary Total
Supplemental/ Restricted
Basic/ Unrestricted
School Site------- 5,074 2,333 2,741 63,374
District------- --- --- 4,082 $61,767
Percent Difference: School Site and District --- --- -32.9 2.6
State------- --- --- $5,537 $66,594
Percent Difference: School Site and State --- --- -50.5 -4.8 Supplemental/Restricted expenditures come from money whose use is controlled by law or by a donor. Money that is designated for specific purposes by the district or governing board is not considered restricted. Basic/Unrestricted expenditures are from money whose use, except for general guidelines, is not controlled by law or by a donor. For detailed information on school expenditures for all districts in California, see the CDE Current Expense of Education & Per-pupil Spending Web page at http://www.cde.ca.gov/ds/fd/ec/. For information on teacher salaries for all districts in California, see the CDE Certificated Salaries & Benefits Web page at http://www.cde.ca.gov/ds/fd/cs/. To look up expenditures and salaries for a specific school district, see the Ed-Data Web site at: http://www.ed-data.org.
2012-13 School Accountability Report Card for Bonsall Elementary School Page 12 of 12
Types of Services Funded (Fiscal Year 2012-13) This section provides specific information about the types of programs and services available at the school that support and assist students. For example, this narrative may include information about supplemental educational services related to the school’s federal Program Improvement (PI) status.
Bonsall Elementary School is very proud of the programs available through categorical funding. All students have access to Compass Odyssey, ST Mind Math and High Stakes Math online, as standards based learning tools. We also have an English Language Development teacher that provides support to students acquiring the English language. Programs and supplemental services paid for using state and federal monies or other funds include the following:
Special education (programs offering appropriate individualized education to students with special needs
Gifted and Talented Education (specialized learning assistance for students with high ability, achievement or potential)
Special projects – monies from agencies (e.g. state or federal) earmarked for specific services
General operations (services, materials, and support to general education)
Transportation
Maintenance and Operations
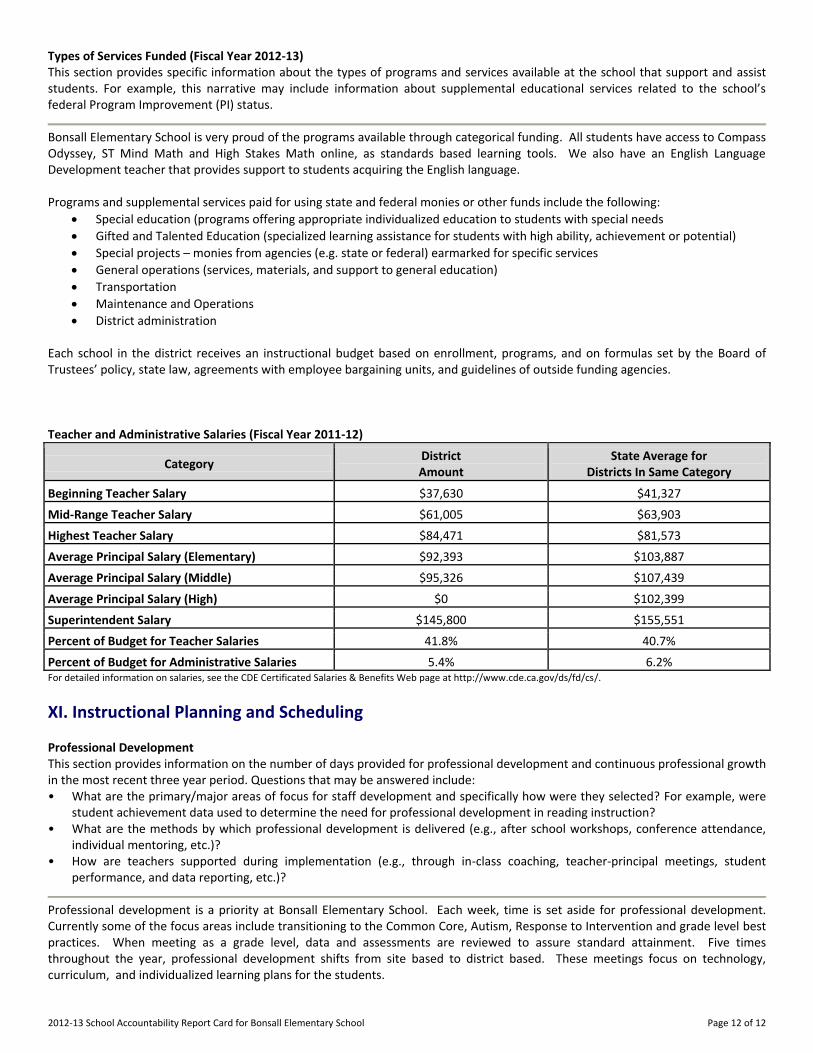
District administration Each school in the district receives an instructional budget based on enrollment, programs, and on formulas set by the Board of Trustees’ policy, state law, agreements with employee bargaining units, and guidelines of outside funding agencies. Teacher and Administrative Salaries (Fiscal Year 2011-12)
Category District Amount
State Average for Districts In Same Category
Beginning Teacher Salary $37,630 $41,327
Mid-Range Teacher Salary $61,005 $63,903
Highest Teacher Salary $84,471 $81,573
Average Principal Salary (Elementary) $92,393 $103,887
Average Principal Salary (Middle) $95,326 $107,439
Average Principal Salary (High) $0 $102,399
Superintendent Salary $145,800 $155,551
Percent of Budget for Teacher Salaries 41.8% 40.7%
Percent of Budget for Administrative Salaries 5.4% 6.2% For detailed information on salaries, see the CDE Certificated Salaries & Benefits Web page at http://www.cde.ca.gov/ds/fd/cs/.
XI. Instructional Planning and Scheduling
Professional Development This section provides information on the number of days provided for professional development and continuous professional growth in the most recent three year period. Questions that may be answered include: • What are the primary/major areas of focus for staff development and specifically how were they selected? For example, were
student achievement data used to determine the need for professional development in reading instruction? • What are the methods by which professional development is delivered (e.g., after school workshops, conference attendance,
individual mentoring, etc.)? • How are teachers supported during implementation (e.g., through in-class coaching, teacher-principal meetings, student
performance, and data reporting, etc.)?
Professional development is a priority at Bonsall Elementary School. Each week, time is set aside for professional development. Currently some of the focus areas include transitioning to the Common Core, Autism, Response to Intervention and grade level best practices. When meeting as a grade level, data and assessments are reviewed to assure standard attainment. Five times throughout the year, professional development shifts from site based to district based. These meetings focus on technology, curriculum, and individualized learning plans for the students.