Embed Size (px)
DESCRIPTION
Bootstrapping up your Analytics. Vernon C. Smith, Ph.D. Vice President, Academic Affairs Rio Salado College October 3, 2011. Objectives. Review of Rio Salado as “ The Outlier ” Examine RioPace as predictive model Identify the steps in bootstrapping predictive modeling. - PowerPoint PPT Presentation
Citation preview
BOOTSTRAPPING UP YOUR ANALYTICS
Vernon C. Smith, Ph.D.
Vice President, Academic Affairs
Rio Salado College
October 3, 2011
OBJECTIVES
Review of Rio Salado as “The Outlier” Examine RioPace as predictive model Identify the steps in bootstrapping predictive
modeling

THE OUTLIER
“You really shouldn’t exist.”

Located in Tempe, AZ. Part of the Maricopa County Community College District. Largest Public, Non-Profit Online 2-year college.
FY10-11 Total Unduplicated Headcount: 69,619* 43,093 distance students.**
Unique attributes One course, many sections 48 Weekly start dates 23 Faculty – 1,300 + Adjunct Faculty RioLearn, highly scalable LMS
* Includes credit, non-credit, & ABE/GED.** Includes students who took online, print-based, or mixed media courses.

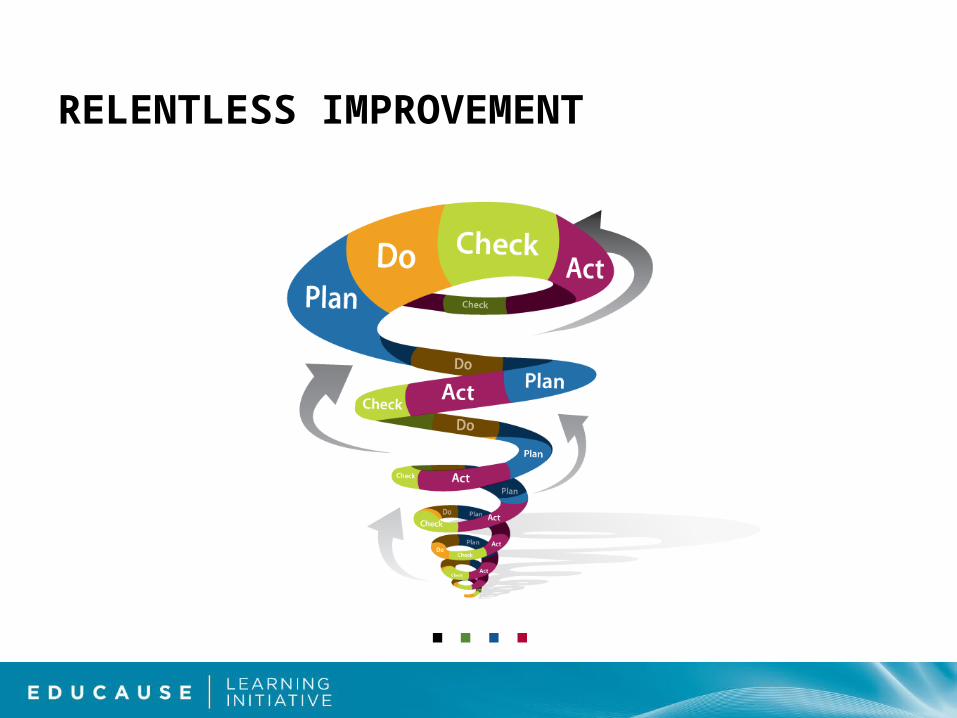
RELENTLESS IMPROVEMENT
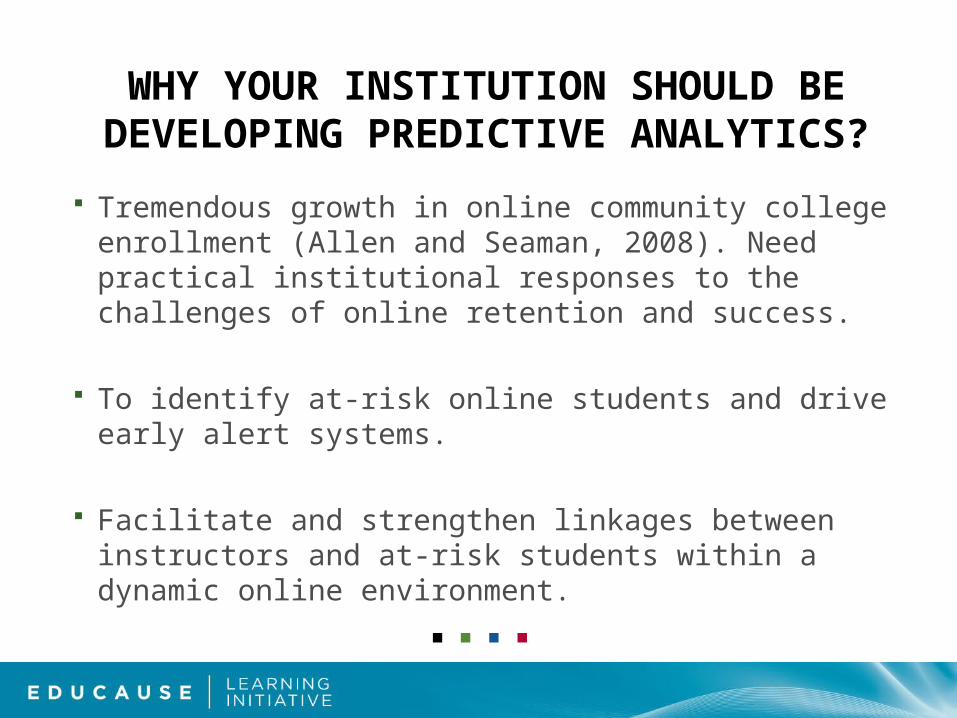
WHY YOUR INSTITUTION SHOULD BE DEVELOPING PREDICTIVE ANALYTICS?
Tremendous growth in online community college enrollment (Allen and Seaman, 2008). Need practical institutional responses to the challenges of online retention and success.
To identify at-risk online students and drive early alert systems.
Facilitate and strengthen linkages between instructors and at-risk students within a dynamic online environment.

THE MODELS
“What if you could use this for good?”
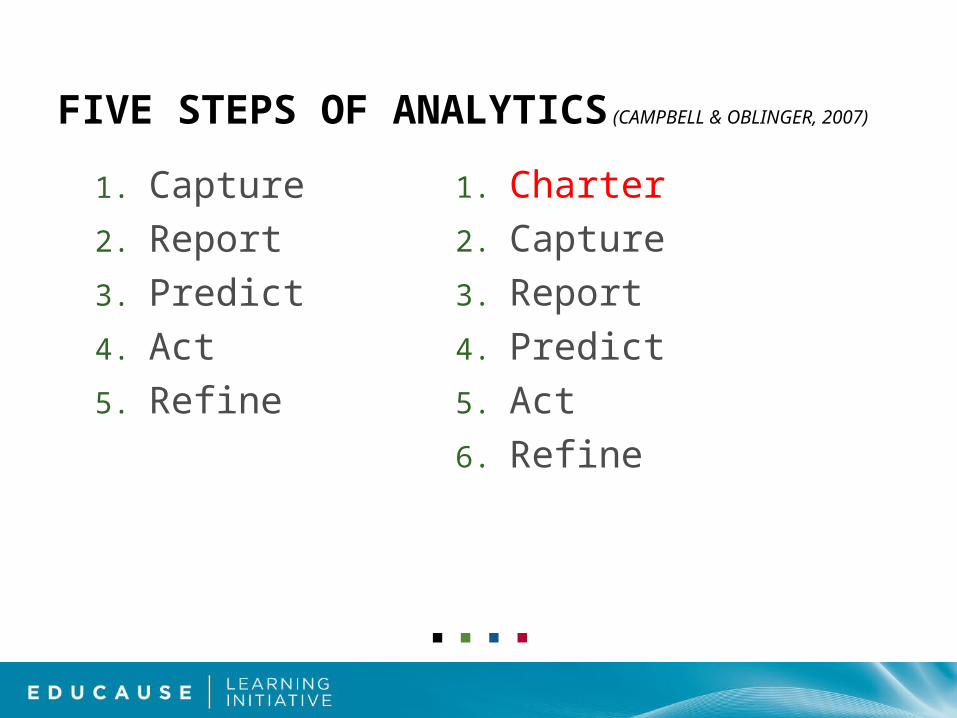
FIVE STEPS OF ANALYTICS (CAMPBELL & OBLINGER, 2007)
1. Capture
2. Report
3. Predict
4. Act
5. Refine
1. Charter
2. Capture
3. Report
4. Predict
5. Act
6. Refine

CHARTER
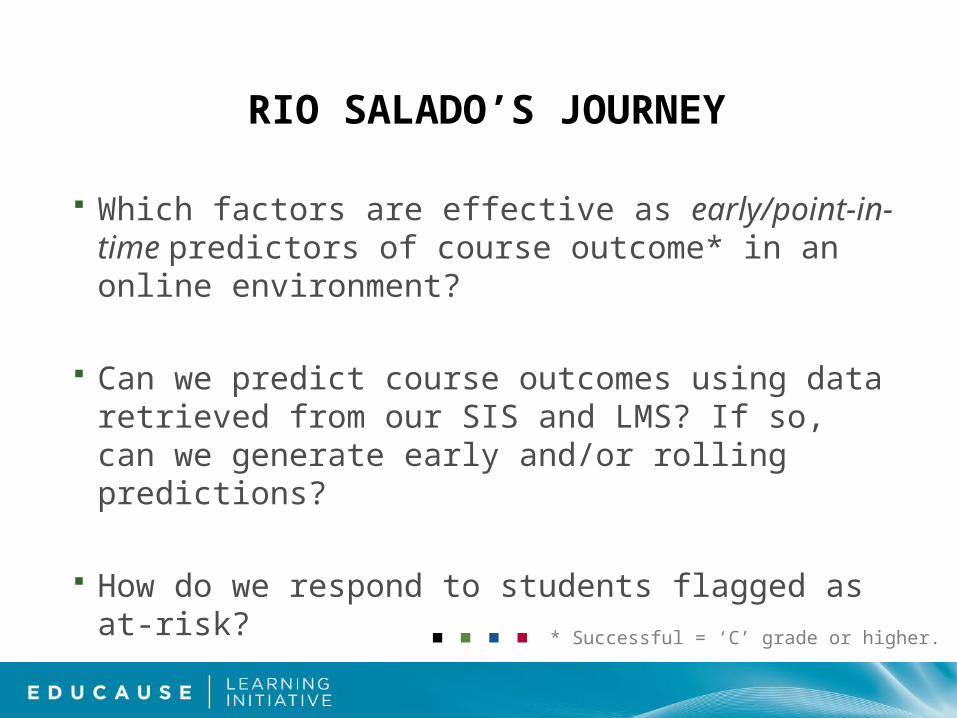
RIO SALADO’S JOURNEY
Which factors are effective as early/point-in-time predictors of course outcome* in an online environment?
Can we predict course outcomes using data retrieved from our SIS and LMS? If so, can we generate early and/or rolling predictions?
How do we respond to students flagged as at-risk?
* Successful = ‘C’ grade or higher.
CAPTURE
Five Steps of Analytics (Campbell & Oblinger, 2007)

WHAT IS THE MATRIX?

10101000101
10101000101
1010
1010
10101000101
10101000101
1010
1010
10101000101
10101000101
1010
1010
1010100010110101101010001011010110011001
1010100010110101 10101000101101011001 1001
1010100010110101101010001011010110011001
1010100010110101101010001011010110011001
10101000101
10101000101
1010
1010
1010100010110101 10101000101101011001 1001
Course Schedule
ESF FIS IVR Teacher Prep
Test Tracker
CALS
WebDial
Data Import
CPS
3rd Party Billing
COTA
Proctor Student Login
AUAO
CRM Integration
RioLearn Admin
Course Definition
Ottawa Registration
Faculty Roster
FAemail
Helpdesk RS Reports
IVR Callbacks
Self Service
Tech Check
Rio AD Matrix
RioLearn
CRM
Localized AD
District PeopleSoft
Partnership
RDS Nightly
CDSHourly
Add blue and reporting server
SQL Reporting
Blue /Explorance
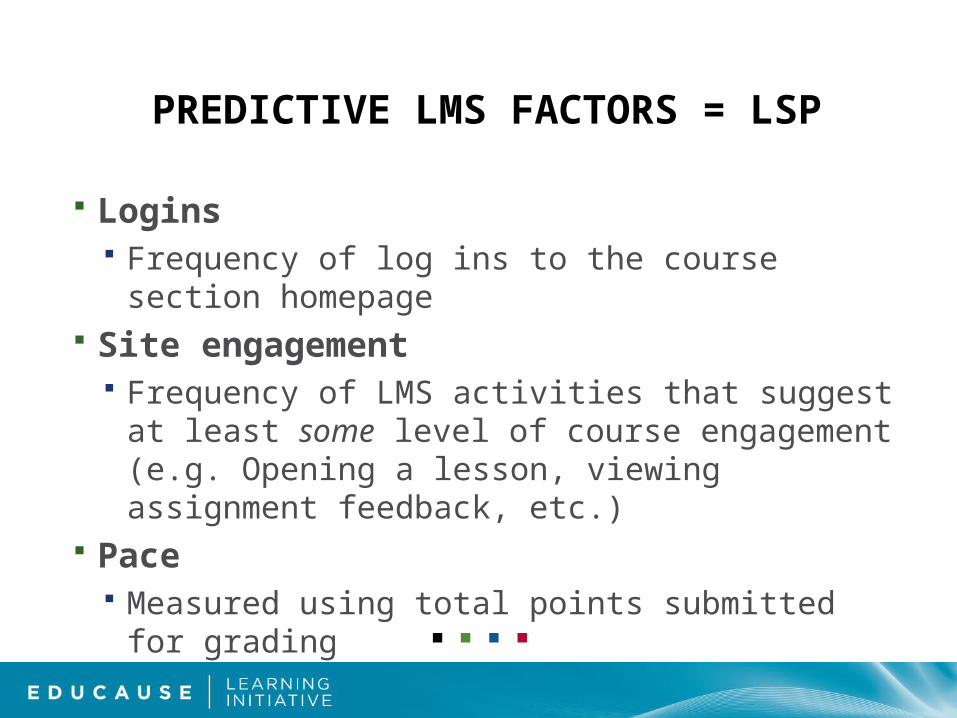
PREDICTIVE LMS FACTORS = LSP
Logins Frequency of log ins to the course section homepage
Site engagement Frequency of LMS activities that suggest at least
some level of course engagement (e.g. Opening a lesson, viewing assignment feedback, etc.)
Pace Measured using total points submitted for grading
REPORT
Five Steps of Analytics (Campbell & Oblinger, 2007)
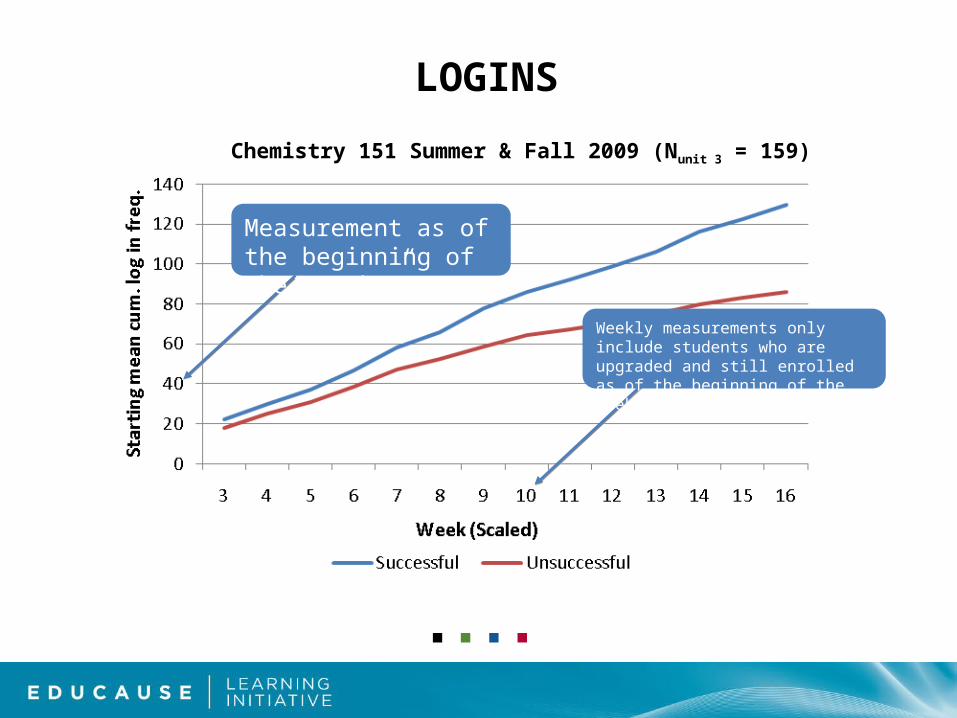
LOGINS
Chemistry 151 Summer & Fall 2009 (Nunit 3 = 159)
Measurement as of the beginning of the “week.”
Weekly measurements only include students who are upgraded and still enrolled as of the beginning of the week.
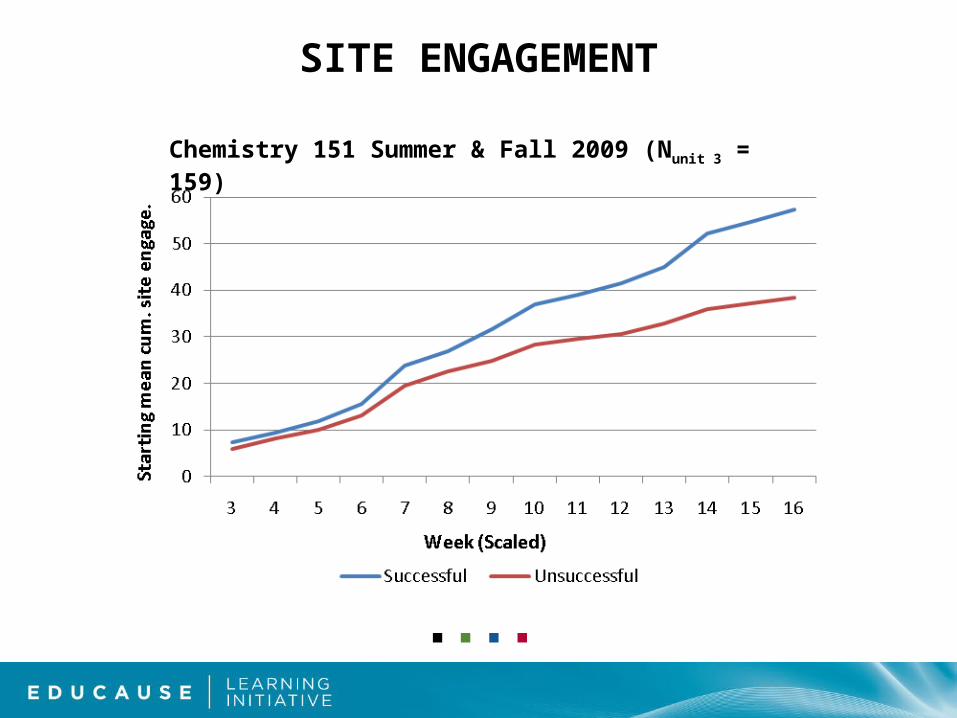
SITE ENGAGEMENT
Chemistry 151 Summer & Fall 2009 (Nunit 3 = 159)
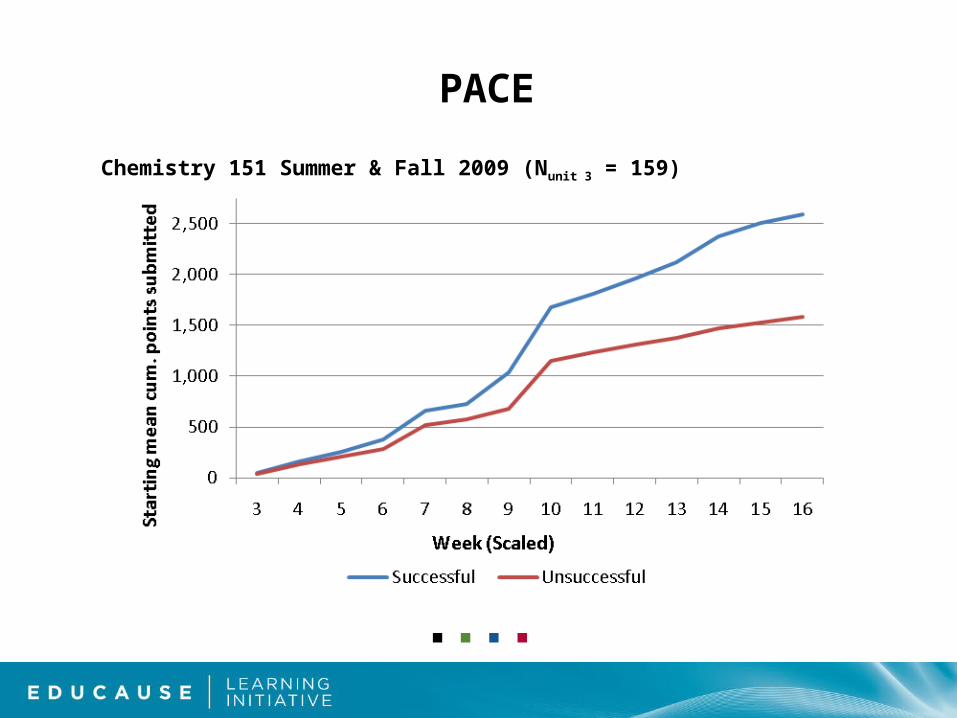
PACE
Chemistry 151 Summer & Fall 2009 (Nunit 3 = 159)
ACTIVITY WEIGHTING
In a practical application, recent behavior is most relevant.
Log in and site engagement factors weighted based on when the event occurred relative to the course start and end dates.
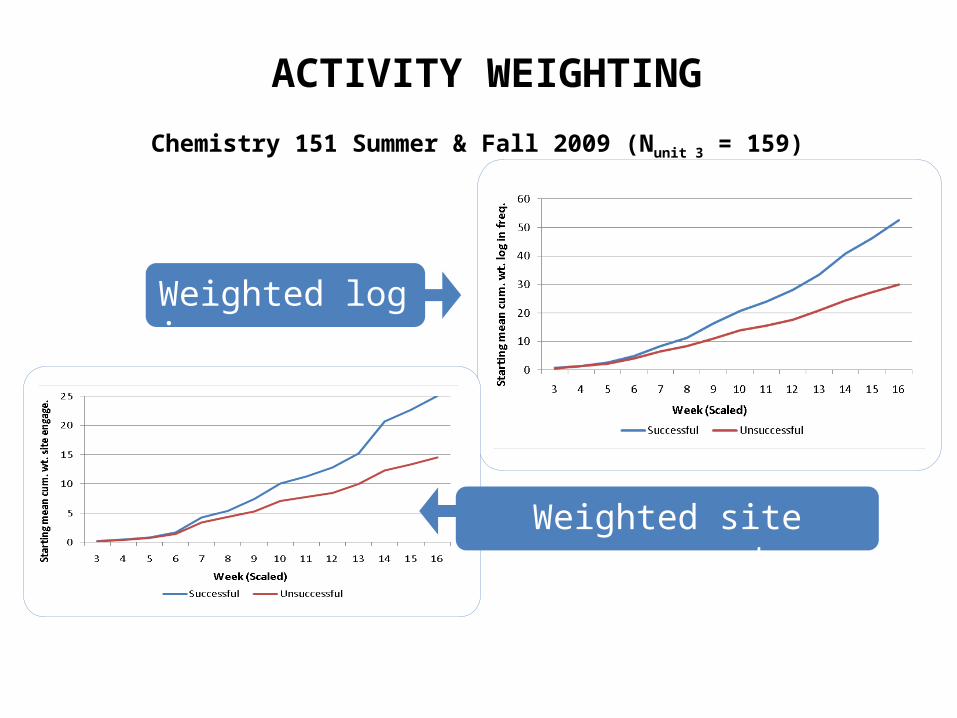
ACTIVITY WEIGHTING
Chemistry 151 Summer & Fall 2009 (Nunit 3 = 159)
Weighted log ins
Weighted site engagement
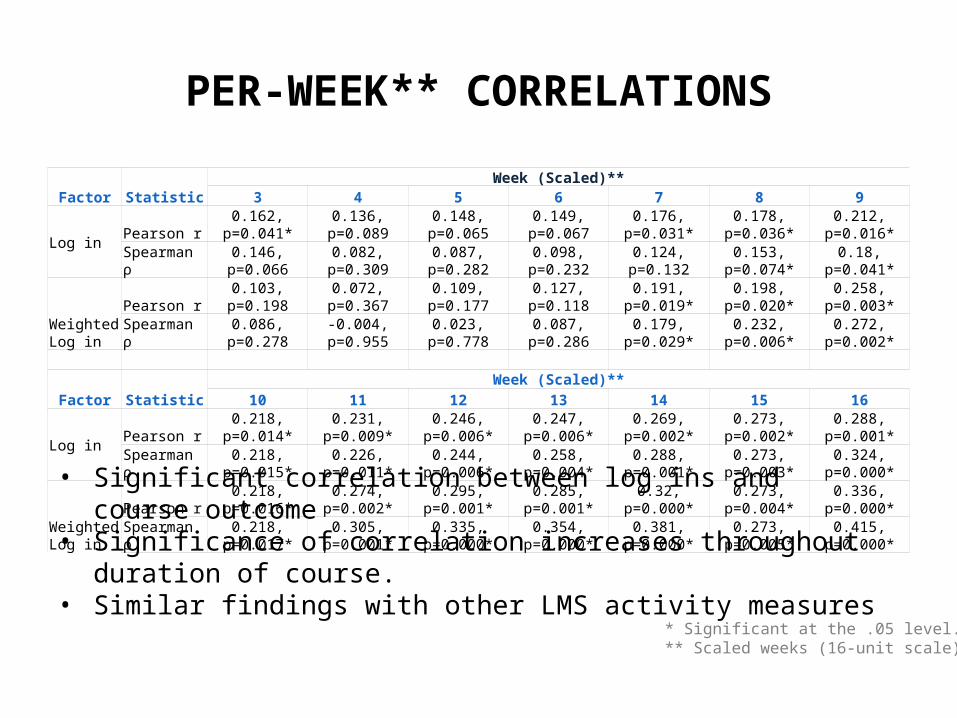
PER-WEEK** CORRELATIONS
Factor StatisticWeek (Scaled)**
3 4 5 6 7 8 9
Log inPearson r 0.162, p=0.041* 0.136, p=0.089 0.148, p=0.065 0.149, p=0.067 0.176, p=0.031* 0.178, p=0.036* 0.212, p=0.016*Spearman ρ 0.146, p=0.066 0.082, p=0.309 0.087, p=0.282 0.098, p=0.232 0.124, p=0.132 0.153, p=0.074* 0.18, p=0.041*
Weighted Log in
Pearson r 0.103, p=0.198 0.072, p=0.367 0.109, p=0.177 0.127, p=0.118 0.191, p=0.019* 0.198, p=0.020* 0.258, p=0.003*Spearman ρ 0.086, p=0.278 -0.004, p=0.955 0.023, p=0.778 0.087, p=0.286 0.179, p=0.029* 0.232, p=0.006* 0.272, p=0.002*
Factor Statistic
Week (Scaled)**
10 11 12 13 14 15 16
Log inPearson r 0.218, p=0.014* 0.231, p=0.009* 0.246, p=0.006* 0.247, p=0.006* 0.269, p=0.002* 0.273, p=0.002* 0.288, p=0.001*Spearman ρ 0.218, p=0.015* 0.226, p=0.011* 0.244, p=0.006* 0.258, p=0.004* 0.288, p=0.001* 0.273, p=0.003* 0.324, p=0.000*
Weighted Log in
Pearson r 0.218, p=0.016* 0.274, p=0.002* 0.295, p=0.001* 0.285, p=0.001* 0.32, p=0.000* 0.273, p=0.004* 0.336, p=0.000*
Spearman ρ 0.218, p=0.017* 0.305, p=0.001* 0.335, p=0.000* 0.354, p=0.000* 0.381, p=0.000* 0.273, p=0.005* 0.415, p=0.000*
* Significant at the .05 level.** Scaled weeks (16-unit scale)
• Significant correlation between log ins and course outcome• Significance of correlation increases throughout duration of
course. • Similar findings with other LMS activity measures
PREDICT
Five Steps of Analytics (Campbell & Oblinger, 2007)
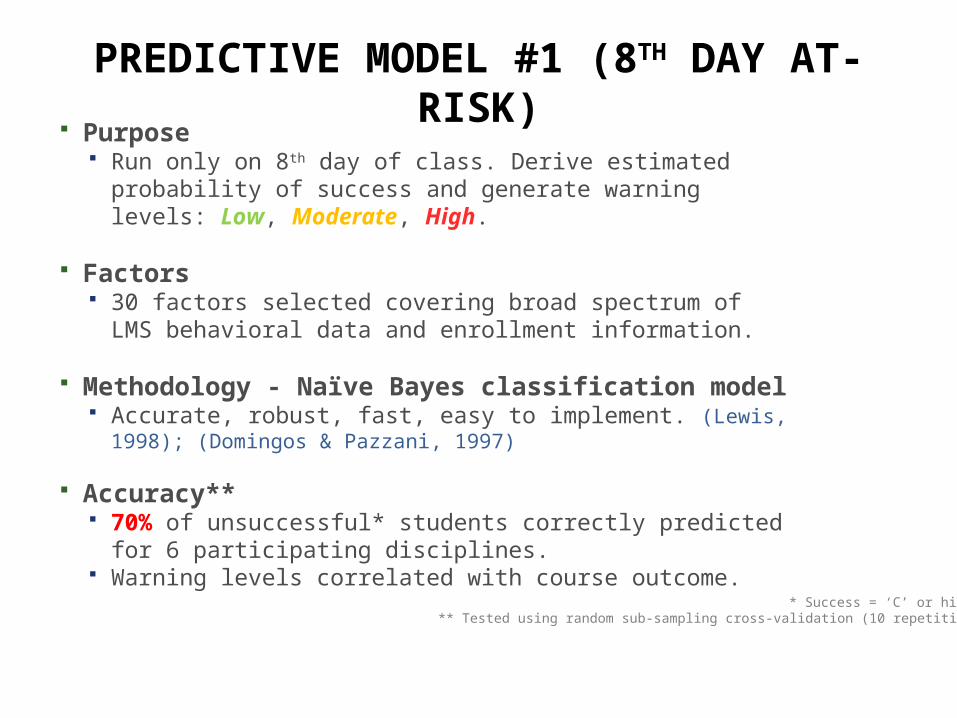
PREDICTIVE MODEL #1 (8TH DAY AT-RISK) Purpose
Run only on 8th day of class. Derive estimated probability of success and generate warning levels: Low, Moderate, High.
Factors 30 factors selected covering broad spectrum of LMS behavioral
data and enrollment information.
Methodology - Naïve Bayes classification model Accurate, robust, fast, easy to implement. (Lewis, 1998);
(Domingos & Pazzani, 1997)
Accuracy** 70% of unsuccessful* students correctly predicted for 6
participating disciplines. Warning levels correlated with course outcome.
* Success = ‘C’ or higher** Tested using random sub-sampling cross-validation (10 repetitions)
REFINE
Five Steps of Analytics (Campbell & Oblinger, 2007)
PREDICTIVE MODEL #2 (RIO PACE)
Rio Progress And-Course Engagement Institutionalization of predictive modeling
into LMS at Rio Salado Piloted April 2010 Automatically updates weekly (every
Monday) Integrated within RioLearn course rosters
PREDICTIVE MODEL #2 (RIO PACE)
Warning levels Generated using naïve Bayes model with 5 input
factors Weighted log-in frequency Weighted site engagement Points earned Points submitted Current credit load
‘High’ warning = Student has low probability of success if his/her current trajectory does not change.
PREDICTIVE MODEL #2 (RIO PACE)
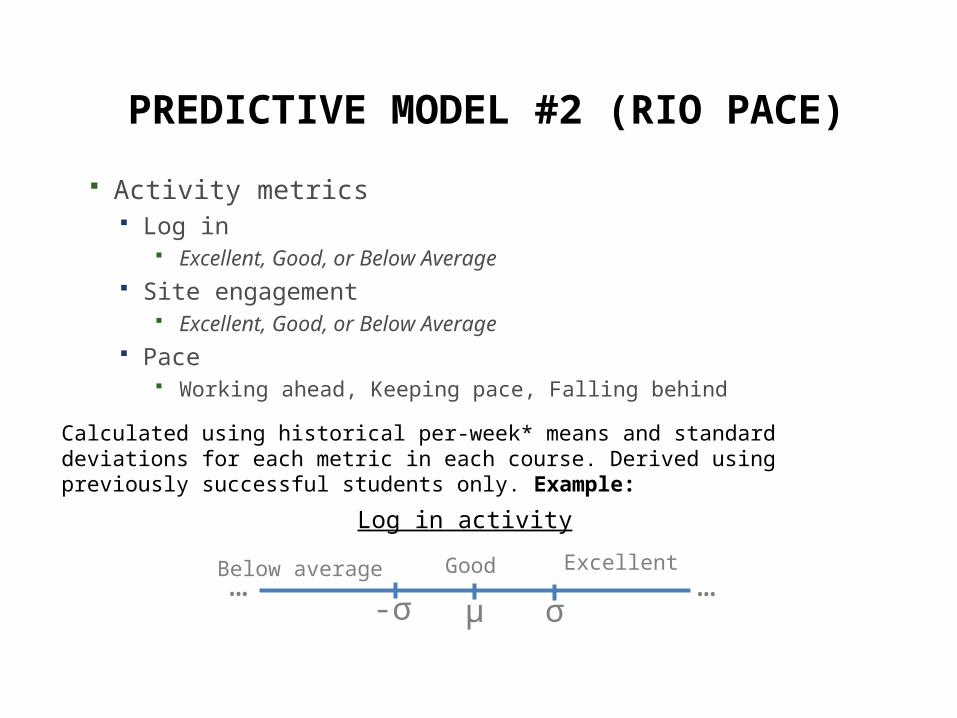
Activity metrics Log in
Excellent, Good, or Below Average Site engagement
Excellent, Good, or Below Average Pace
Working ahead, Keeping pace, Falling behind
μ-σ σ
Good ExcellentBelow average……
Log in activity:
Calculated using historical per-week* means and standard deviations for each metric in each course. Derived using previously successful students only. Example:
PREDICTIVE MODEL #2 (RIO PACE)
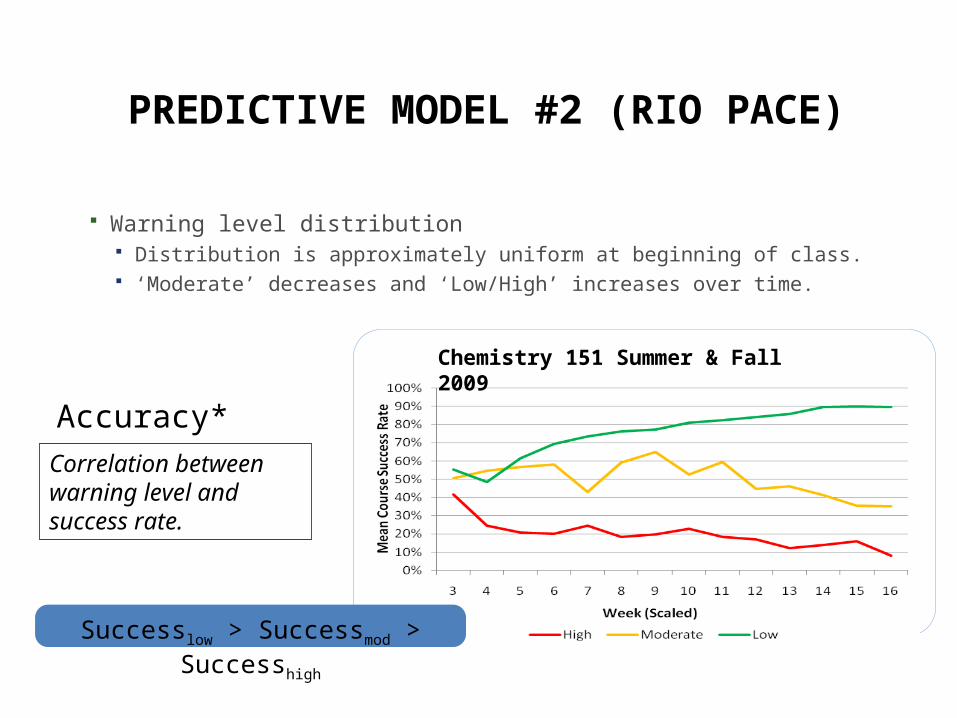
Warning level distribution Distribution is approximately uniform at beginning of class. ‘Moderate’ decreases and ‘Low/High’ increases over time.
Chemistry 151 Summer & Fall 2009
Accuracy*Correlation between warning level and success rate.
Successlow > Successmod > Successhigh
.
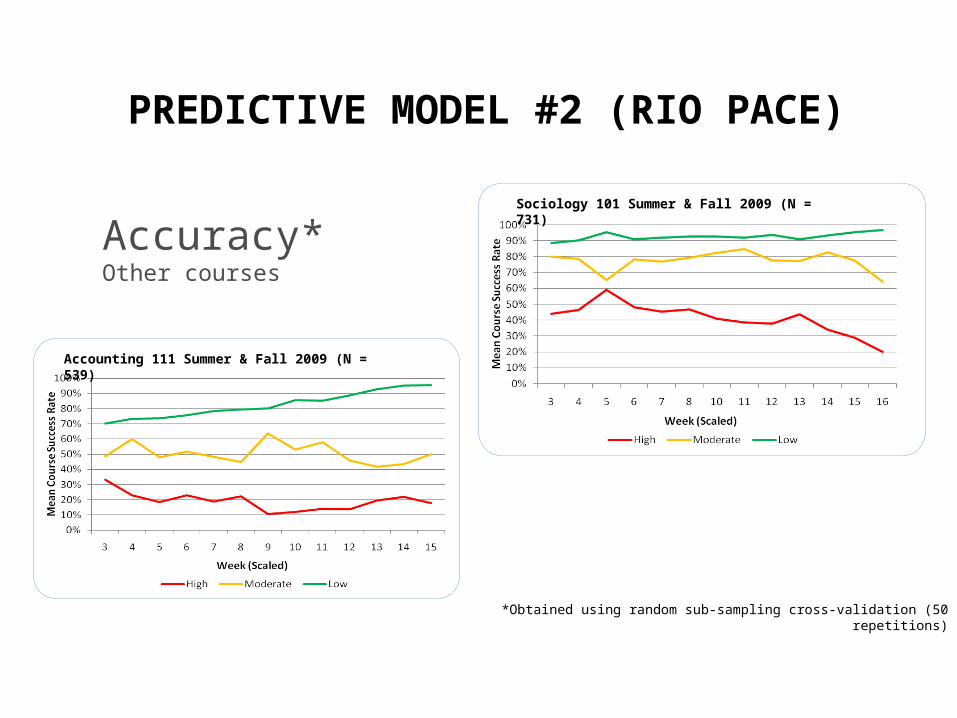
Accounting 111 Summer & Fall 2009 (N = 539)
Sociology 101 Summer & Fall 2009 (N = 731)
PREDICTIVE MODEL #2 (RIO PACE)
Accuracy*Other courses
*Obtained using random sub-sampling cross-validation (50 repetitions)
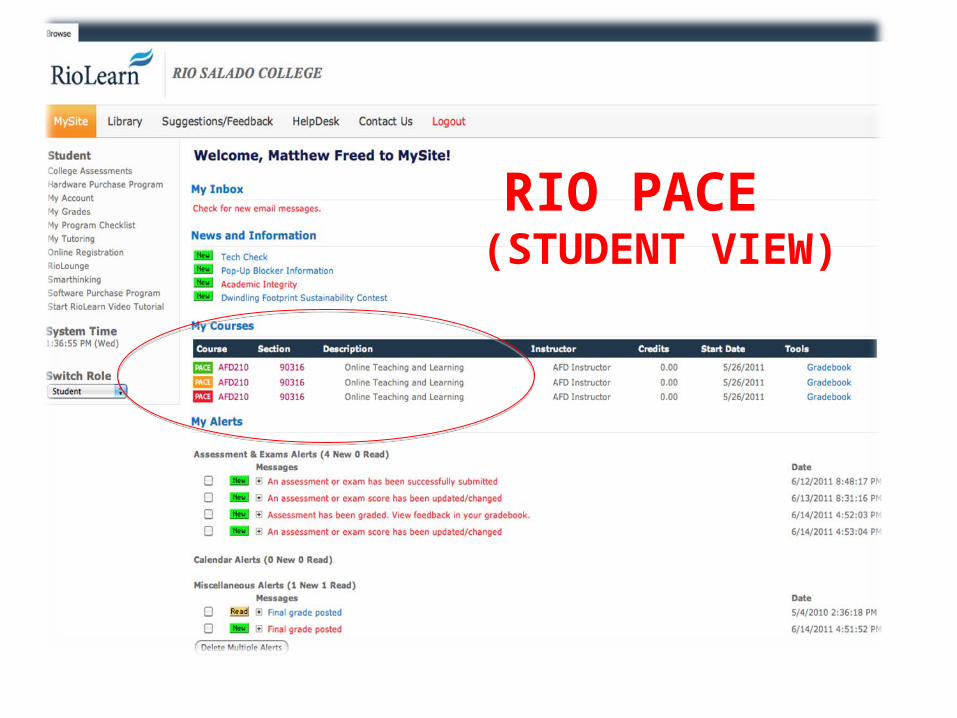
RIO PACE (STUDENT VIEW)
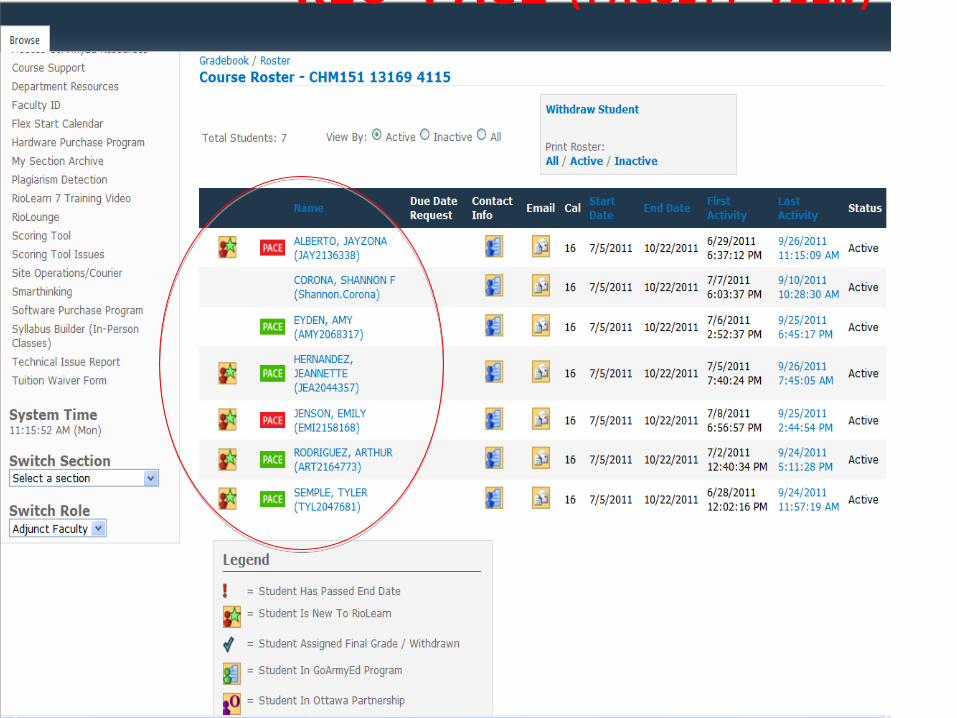
RIO PACE (FACULTY VIEW)
ACT
Five Steps of Analytics (Campbell & Oblinger, 2007)
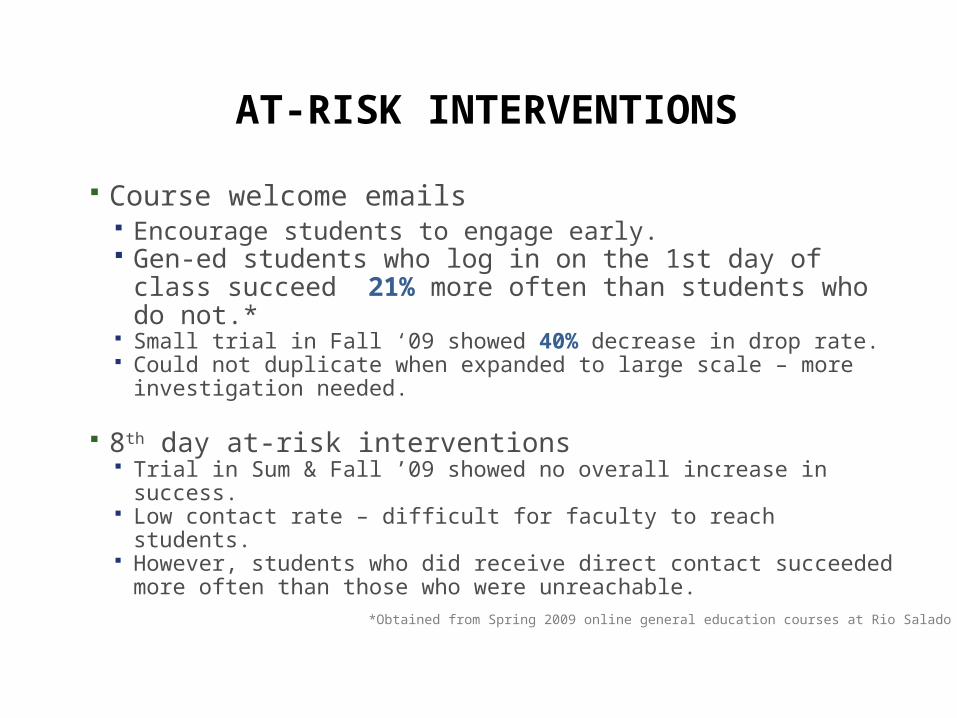
AT-RISK INTERVENTIONS
Course welcome emails Encourage students to engage early. Gen-ed students who log in on the 1st day of class
succeed 21% more often than students who do not.* Small trial in Fall ‘09 showed 40% decrease in drop rate. Could not duplicate when expanded to large scale – more
investigation needed.
8th day at-risk interventions Trial in Sum & Fall ’09 showed no overall increase in success. Low contact rate – difficult for faculty to reach students. However, students who did receive direct contact succeeded
more often than those who were unreachable.*Obtained from Spring 2009 online general education courses at Rio Salado College.
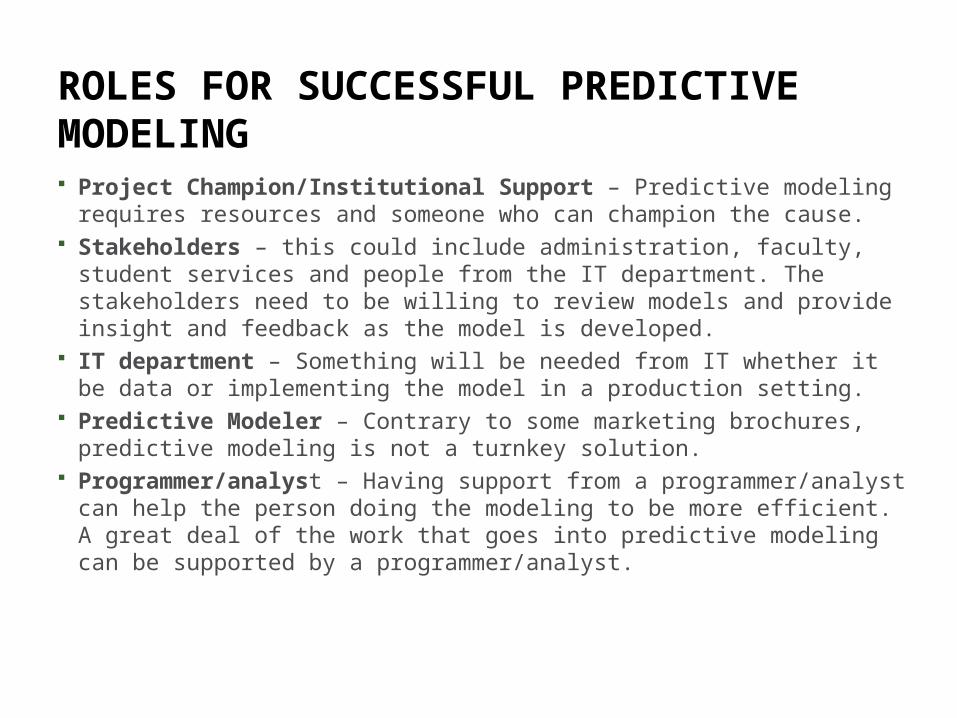
ROLES FOR SUCCESSFUL PREDICTIVE MODELING Project Champion/Institutional Support – Predictive modeling
requires resources and someone who can champion the cause. Stakeholders – this could include administration, faculty, student
services and people from the IT department. The stakeholders need to be willing to review models and provide insight and feedback as the model is developed.
IT department – Something will be needed from IT whether it be data or implementing the model in a production setting.
Predictive Modeler – Contrary to some marketing brochures, predictive modeling is not a turnkey solution.
Programmer/analyst – Having support from a programmer/analyst can help the person doing the modeling to be more efficient. A great deal of the work that goes into predictive modeling can be supported by a programmer/analyst.
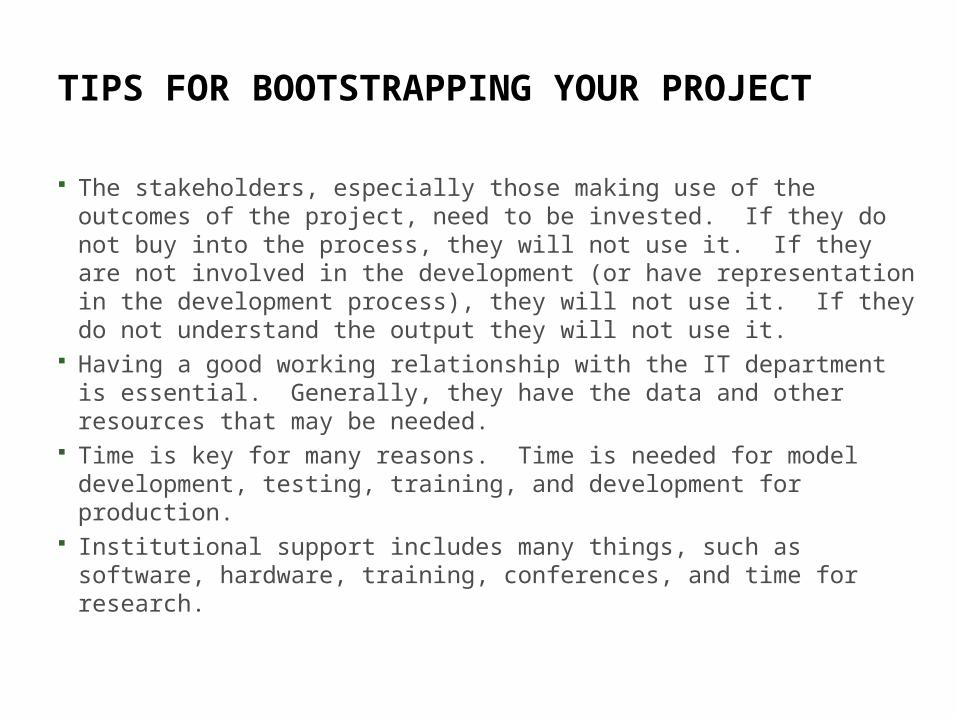
TIPS FOR BOOTSTRAPPING YOUR PROJECT
The stakeholders, especially those making use of the outcomes of the project, need to be invested. If they do not buy into the process, they will not use it. If they are not involved in the development (or have representation in the development process), they will not use it. If they do not understand the output they will not use it.
Having a good working relationship with the IT department is essential. Generally, they have the data and other resources that may be needed.
Time is key for many reasons. Time is needed for model development, testing, training, and development for production.
Institutional support includes many things, such as software, hardware, training, conferences, and time for research.
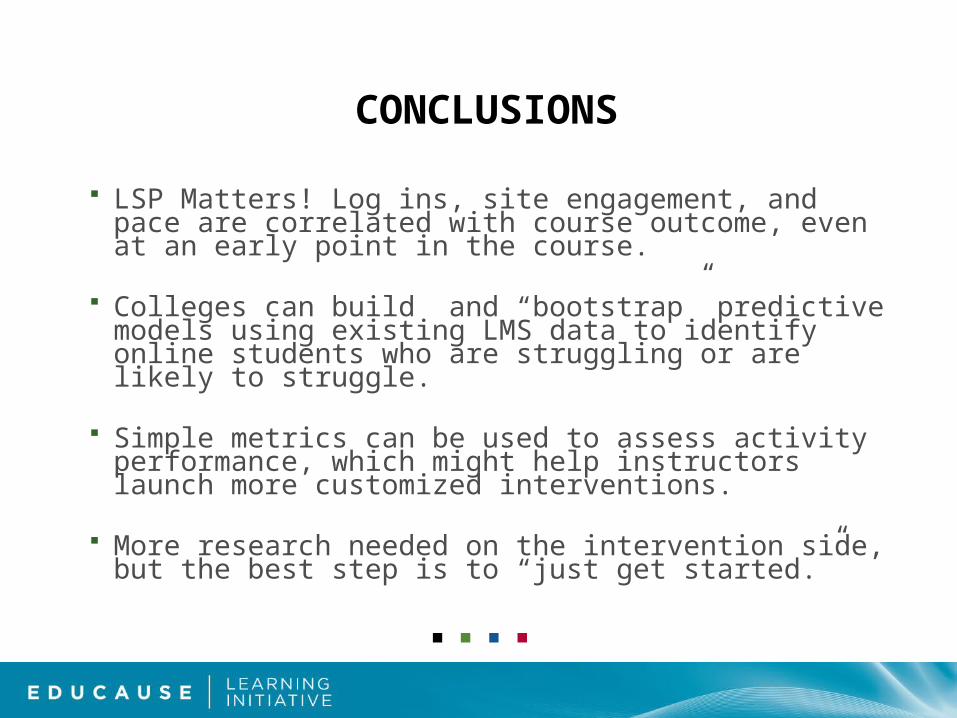
CONCLUSIONS
LSP Matters! Log ins, site engagement, and pace are correlated with course outcome, even at an early point in the course.
Colleges can build and “bootstrap” predictive models using existing LMS data to identify online students who are struggling or are likely to struggle.
Simple metrics can be used to assess activity performance, which might help instructors launch more customized interventions.
More research needed on the intervention side, but the best step is to “just get started.”
REFERENCESAllen, I. E., & Seaman, J. (2008). Staying the Course: Online Education in the United States. The Sloan
Consortium.Campbell, J., & Oblinger, D. (2007). Academic Analytics. EDUCAUSE White Paper.
http://www.educause.edu/ir/library/pdf/PUB6101.pdf Green, K. (2009, November 4). LMS 3.0. Inside Higher Ed. Retrieved from
http://www.insidehighered.com/views/2009/11/04/green.Iten, L., Arnold, K., Pistilli, M. (2008, March 4). Mining real-time data to improve student success in a gateway
course. 11th Annual TLT Conference. Purdue University.Johnson, N., Oliff, P., Williams, E. (2009, December 18). An update on state budget cuts. Center on Budget
Policy and Priorities. Retrieved from http://www.cbpp.org/files/3-13-08sfp.pdf.Kolowich, S. (2009, October 30). The new diagnostics. Inside Higher Ed. Retrieved from
http://www.insidehighered.com/news/2009/10/30/predict.Lewis, D. (1998). Naive (Bayes) at forty: The independence assumption in information retrieval. Lecture Notes in
Computer Science, 1398, 4-15. by the president on the American Graduation Initiative." Macomb Community College. Warren, MI.Ross, E. (2009, November 7). College connection. Oklahoma City, OK: Oklahoma State Regents for Higher
Education.Terence, C. (2010, January 14). Colleges cap enrollment amid budget cuts. Associated Press. Retrieved from
http://www.pbs.org/nbr/headlines/US_Competing_for_Admission/index.html.Hernández, R. (2009). Development and Validation of an Instrument to Predict Community College Student
Success in Online Courses Using Faculty Perceptions. Annual Conference of the Council for the Study of Community Colleges.
Macfadyen, L., Dawson, S. (2010). Mining LMS data to develop an ‘‘early warning system” for educators: A proof of concept. Computers & Education, 54, 588-599.
Domingos, P., Pazzani, M. (1997). On the Optimality of the Simple Bayesian Classifier under Zero-One Loss. Machine Learning, 29, 103-130.