Embed Size (px)
Citation preview

1
Boston Globe Release Poll of Likely Voters in Massachusetts | June 8-10, 15-17, 2014
Total Sample
Designed and Directed by: SocialSphere Inc.
(A) (B) (C) (D) (E) (F) (G) (H) (I) (J) (K) (L) (M) (N) (O) (P)Table Q1
Boston Globe Release 3 (Casinos), June 8-10, 15-17
Are you registered to vote in Massachusetts, at this address?
----- ------ ------- ----- ----- ----- ------- ----- --------- ------- ---- ----- ----- ----- ----- -----
(A) (B) (C) (D) (E) (F) (G) (H) (I) (J) (K) (L) (M) (N) (O) (P)
Percentage Base 630 501 129 208 81 341 269 189 41 3 128 200 252 178 300 233100% 100% 100% 100% 100% 100% 100% 100% 100% 100% 100% 100% 100% 100% 100% 100%
Unweighted Total 630 502 128 209 104 317 265 200 38 3 124 199 242 189 291 243
Yes 630 501 129 208 81 341 269 189 41 3 128 200 252 178 300 233100% 100% 100% 100% 100% 100% 100% 100% 100% 100% 100% 100% 100% 100% 100% 100%
Ideology Massachusetts
Definitely Probably Democrat Republican Falchuk Don't Know
Likelihood to Vote in General Election Party ID Candidate Vote
Liberal Moderate ConservativeRight
Directedion
Comparison Groups: BC/DEF/GHIJK/LMN/OP, Independent T-Test for Means (based on test for equal variances), Independent Z-Test for Percentages (unpooled proportions), Uppercase letters indicate significance at the 95% level.
Independent Coakley Baker McCormick Wrong Track

2
Boston Globe Release Poll of Likely Voters in Massachusetts | June 8-10, 15-17, 2014
Total Sample
Designed and Directed by: SocialSphere Inc.
(A) (B) (C) (D) (E) (F) (G) (H) (I) (J) (K) (L) (M) (N) (O) (P)Table Q1
Boston Globe Release 3 (Casinos), June 8-10, 15-17
Are you registered to vote in Massachusetts, at this address?
----- ----- ----- ----- ----- ----- ----- -------- ------ ----- ----- ------ ------- ------- ------ ------
(A) (B) (C) (D) (E) (F) (G) (H) (I) (J) (K) (L) (M) (N) (O) (P)
Percentage Base 630 89 91 132 151 166 97 146 249 214 414 110 37 451 288 342100% 100% 100% 100% 100% 100% 100% 100% 100% 100% 100% 100% 100% 100% 100% 100%
Unweighted Total 630 85 92 142 149 162 95 144 254 213 416 110 37 454 289 341
Yes 630 89 91 132 151 166 97 146 249 214 414 110 37 451 288 342100% 100% 100% 100% 100% 100% 100% 100% 100% 100% 100% 100% 100% 100% 100% 100%
Union Household Gender
18-34 35-44 45-54 55-64 Less than College College +
Age Income Education
Comparison Groups: BCDEF/GHI/JK/LMN/OP, Independent T-Test for Means (based on test for equal variances), Independent Z-Test for Percentages (unpooled proportions), Uppercase letters indicate significance at the 95% level.
65+ Less than $50K $50-$100K More than
$100K Public Private Neither Male Female
3
Boston Globe Release Poll of Likely Voters in Massachusetts | June 8-10, 15-17, 2014
Total Sample
Designed and Directed by: SocialSphere Inc.
(A) (B) (C) (D) (E) (F) (G) (H) (I) (J) (K)Table Q1
Boston Globe Release 3 (Casinos), June 8-10, 15-17
Are you registered to vote in Massachusetts, at this address?
----- -------- -------- ------- --------- ------- -------- ------- --------- ------- ---------
(A) (B) (C) (D) (E) (F) (G) (H) (I) (J) (K)
Percentage Base 630 84 89 45 61 53 51 41 38 70 66100% 100% 100% 100% 100% 100% 100% 100% 100% 100% 100%
Unweighted Total 630 84 94 45 63 57 49 38 31 82 61
Yes 630 84 89 45 61 53 51 41 38 70 66100% 100% 100% 100% 100% 100% 100% 100% 100% 100% 100%
CentralMA
WesternMA
Comparison Groups: BCDEFGHIJK, Independent T-Test for Means (based on test for equal variances), Independent Z-Test for Percentages (unpooled proportions), Uppercase letters indicate significance at the 95% level.
Region
Metro-Boston
Inside128
NorthShore
MerrimackValley
Metro-West
South ofBoston
SouthShore
Cape &Islands and
SouthCoast
4
Boston Globe Release Poll of Likely Voters in Massachusetts | June 8-10, 15-17, 2014
Total Sample
Designed and Directed by: SocialSphere Inc.
(A) (B) (C) (D) (E) (F) (G) (H) (I) (J) (K) (L) (M) (N) (O) (P)
Ideology Massachusetts
Definitely Probably Democrat Republican Falchuk Don't Know
Likelihood to Vote in General Election Party ID Candidate Vote
Liberal Moderate ConservativeRight
Directedion
Comparison Groups: BC/DEF/GHIJK/LMN/OP, Independent T-Test for Means (based on test for equal variances), Independent Z-Test for Percentages (unpooled proportions), Uppercase letters indicate significance at the 95% level.
Independent Coakley Baker McCormick Wrong Track
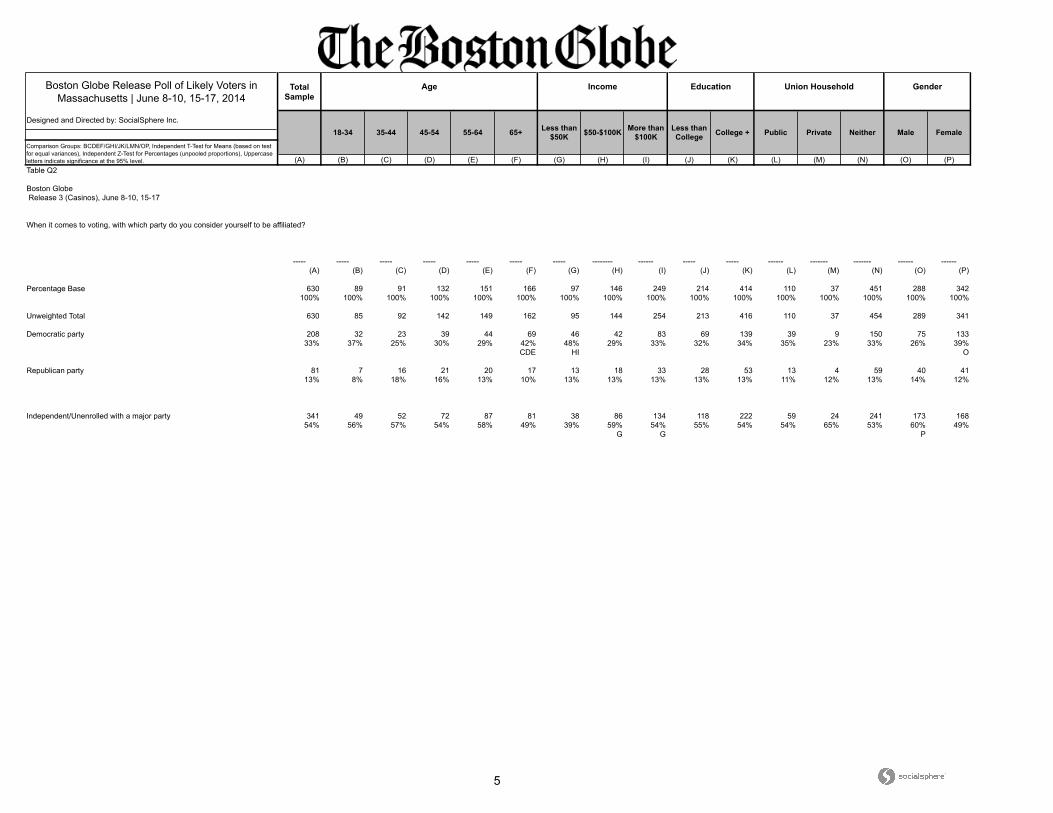
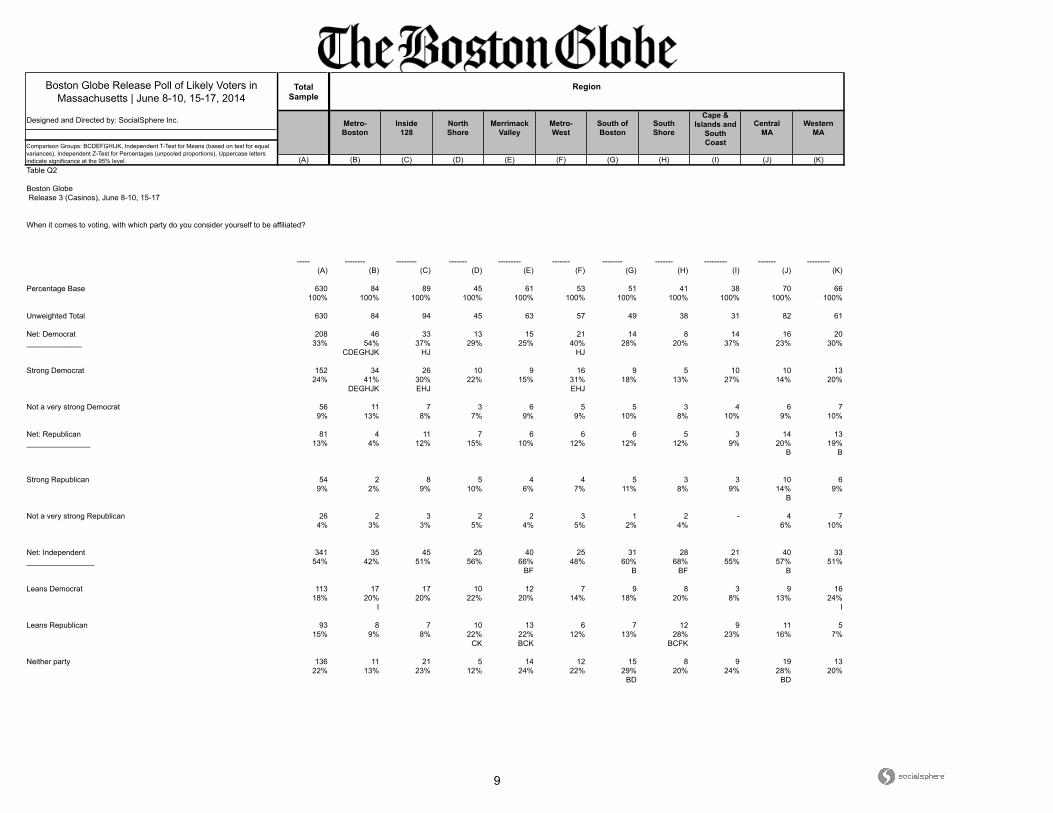
Table Q2
Boston Globe Release 3 (Casinos), June 8-10, 15-17
When it comes to voting, with which party do you consider yourself to be affiliated?
----- ------ ------- ----- ----- ----- ------- ----- --------- ------- ---- ----- ----- ----- ----- -----
(A) (B) (C) (D) (E) (F) (G) (H) (I) (J) (K) (L) (M) (N) (O) (P)
Percentage Base 630 501 129 208 81 341 269 189 41 3 128 200 252 178 300 233100% 100% 100% 100% 100% 100% 100% 100% 100% 100% 100% 100% 100% 100% 100% 100%
Unweighted Total 630 502 128 209 104 317 265 200 38 3 124 199 242 189 291 243
Democratic party 208 177 31 208 - - 154 19 7 2 27 122 68 18 139 3833% 35% 24% 100% 57% 10% 17% 68% 21% 61% 27% 10% 47% 16%
C HIK H H MN N P
Republican party 81 66 15 - 81 - 6 60 3 - 12 2 20 58 13 5713% 13% 11% 100% 2% 32% 8% 9% 1% 8% 32% 4% 24%
GIK G L LM O
Independent/Unenrolled with a major party 341 257 84 - - 341 110 110 31 1 90 76 163 102 147 13954% 51% 65% 100% 41% 58% 75% 32% 70% 38% 65% 57% 49% 59%
B G GH GH L L O
5
Boston Globe Release Poll of Likely Voters in Massachusetts | June 8-10, 15-17, 2014
Total Sample
Designed and Directed by: SocialSphere Inc.
(A) (B) (C) (D) (E) (F) (G) (H) (I) (J) (K) (L) (M) (N) (O) (P)
Union Household Gender
18-34 35-44 45-54 55-64 Less than College College +
Age Income Education
Comparison Groups: BCDEF/GHI/JK/LMN/OP, Independent T-Test for Means (based on test for equal variances), Independent Z-Test for Percentages (unpooled proportions), Uppercase letters indicate significance at the 95% level.
65+ Less than $50K $50-$100K More than
$100K Public Private Neither Male Female
Table Q2
Boston Globe Release 3 (Casinos), June 8-10, 15-17
When it comes to voting, with which party do you consider yourself to be affiliated?
----- ----- ----- ----- ----- ----- ----- -------- ------ ----- ----- ------ ------- ------- ------ ------
(A) (B) (C) (D) (E) (F) (G) (H) (I) (J) (K) (L) (M) (N) (O) (P)
Percentage Base 630 89 91 132 151 166 97 146 249 214 414 110 37 451 288 342100% 100% 100% 100% 100% 100% 100% 100% 100% 100% 100% 100% 100% 100% 100% 100%
Unweighted Total 630 85 92 142 149 162 95 144 254 213 416 110 37 454 289 341
Democratic party 208 32 23 39 44 69 46 42 83 69 139 39 9 150 75 13333% 37% 25% 30% 29% 42% 48% 29% 33% 32% 34% 35% 23% 33% 26% 39%
CDE HI O
Republican party 81 7 16 21 20 17 13 18 33 28 53 13 4 59 40 4113% 8% 18% 16% 13% 10% 13% 13% 13% 13% 13% 11% 12% 13% 14% 12%
Independent/Unenrolled with a major party 341 49 52 72 87 81 38 86 134 118 222 59 24 241 173 16854% 56% 57% 54% 58% 49% 39% 59% 54% 55% 54% 54% 65% 53% 60% 49%
G G P
6
Boston Globe Release Poll of Likely Voters in Massachusetts | June 8-10, 15-17, 2014
Total Sample
Designed and Directed by: SocialSphere Inc.
(A) (B) (C) (D) (E) (F) (G) (H) (I) (J) (K)
CentralMA
WesternMA
Comparison Groups: BCDEFGHIJK, Independent T-Test for Means (based on test for equal variances), Independent Z-Test for Percentages (unpooled proportions), Uppercase letters indicate significance at the 95% level.
Region
Metro-Boston
Inside128
NorthShore
MerrimackValley
Metro-West
South ofBoston
SouthShore
Cape &Islands and
SouthCoast
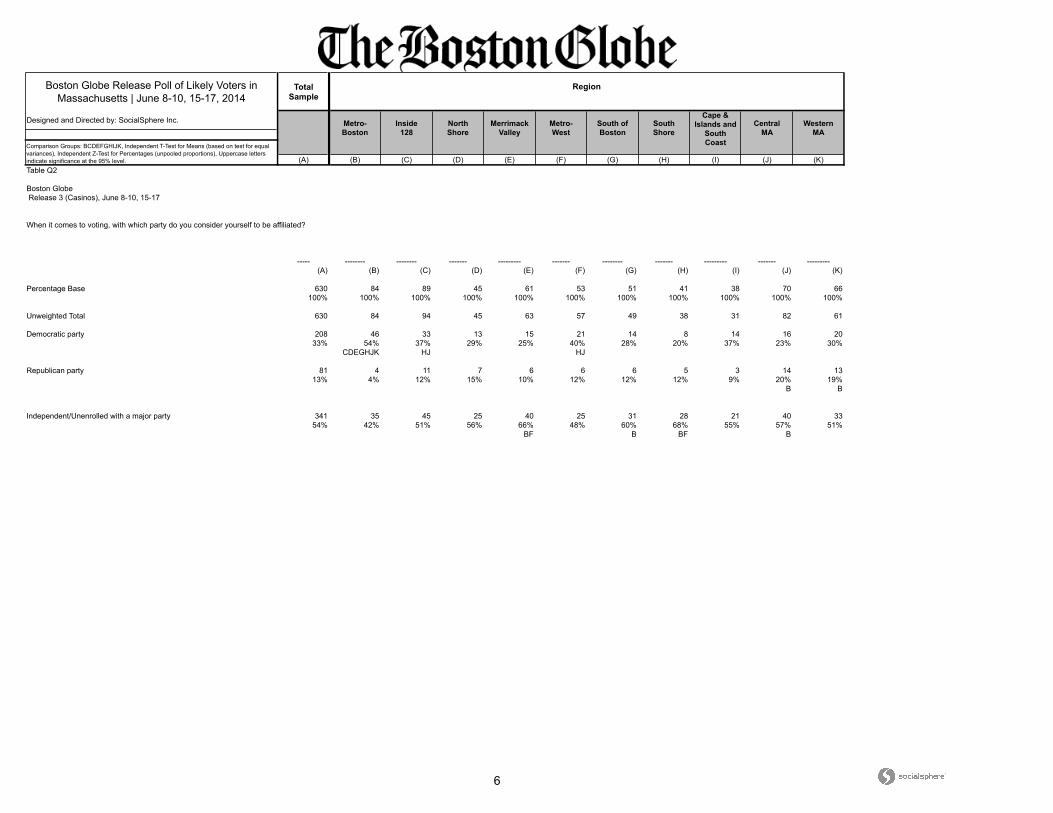
Table Q2
Boston Globe Release 3 (Casinos), June 8-10, 15-17
When it comes to voting, with which party do you consider yourself to be affiliated?
----- -------- -------- ------- --------- ------- -------- ------- --------- ------- ---------
(A) (B) (C) (D) (E) (F) (G) (H) (I) (J) (K)
Percentage Base 630 84 89 45 61 53 51 41 38 70 66100% 100% 100% 100% 100% 100% 100% 100% 100% 100% 100%
Unweighted Total 630 84 94 45 63 57 49 38 31 82 61
Democratic party 208 46 33 13 15 21 14 8 14 16 2033% 54% 37% 29% 25% 40% 28% 20% 37% 23% 30%
CDEGHJK HJ HJ
Republican party 81 4 11 7 6 6 6 5 3 14 1313% 4% 12% 15% 10% 12% 12% 12% 9% 20% 19%
B B
Independent/Unenrolled with a major party 341 35 45 25 40 25 31 28 21 40 3354% 42% 51% 56% 66% 48% 60% 68% 55% 57% 51%
BF B BF B
7
Boston Globe Release Poll of Likely Voters in Massachusetts | June 8-10, 15-17, 2014
Total Sample
Designed and Directed by: SocialSphere Inc.
(A) (B) (C) (D) (E) (F) (G) (H) (I) (J) (K) (L) (M) (N) (O) (P)
Ideology Massachusetts
Definitely Probably Democrat Republican Falchuk Don't Know
Likelihood to Vote in General Election Party ID Candidate Vote
Liberal Moderate ConservativeRight
Directedion
Comparison Groups: BC/DEF/GHIJK/LMN/OP, Independent T-Test for Means (based on test for equal variances), Independent Z-Test for Percentages (unpooled proportions), Uppercase letters indicate significance at the 95% level.
Independent Coakley Baker McCormick Wrong Track
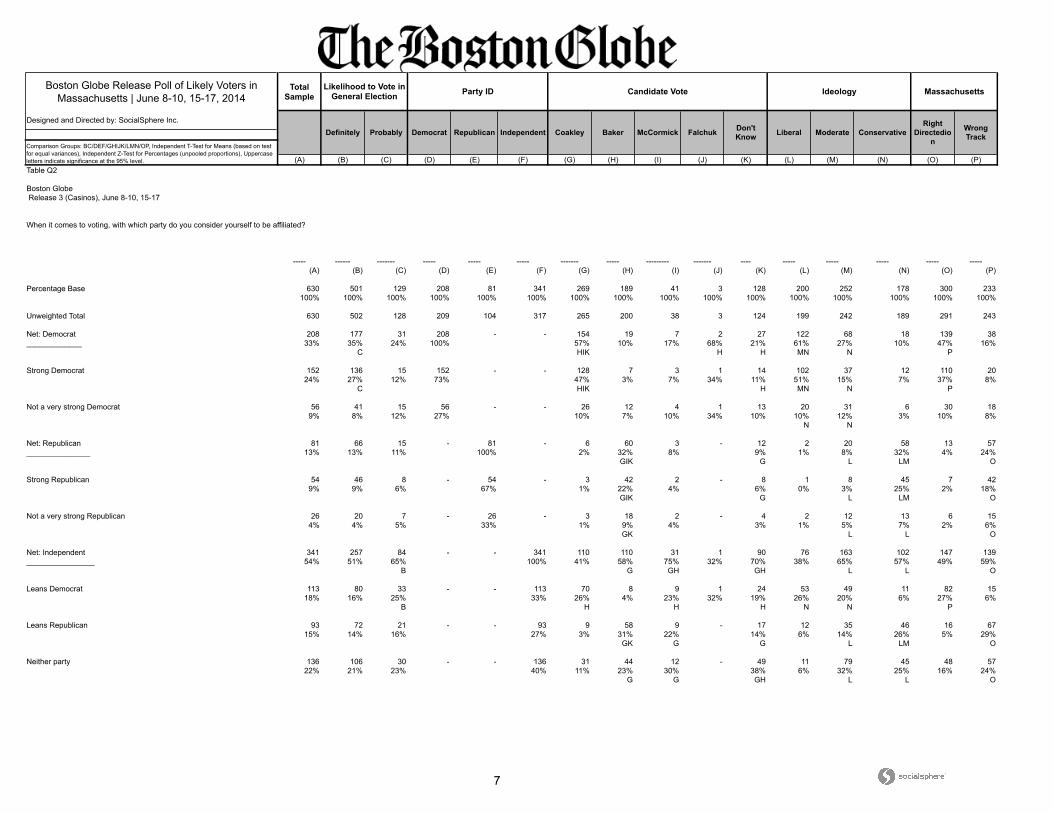
Table Q2
Boston Globe Release 3 (Casinos), June 8-10, 15-17
When it comes to voting, with which party do you consider yourself to be affiliated?
----- ------ ------- ----- ----- ----- ------- ----- --------- ------- ---- ----- ----- ----- ----- -----
(A) (B) (C) (D) (E) (F) (G) (H) (I) (J) (K) (L) (M) (N) (O) (P)
Percentage Base 630 501 129 208 81 341 269 189 41 3 128 200 252 178 300 233100% 100% 100% 100% 100% 100% 100% 100% 100% 100% 100% 100% 100% 100% 100% 100%
Unweighted Total 630 502 128 209 104 317 265 200 38 3 124 199 242 189 291 243
Net: Democrat 208 177 31 208 - - 154 19 7 2 27 122 68 18 139 38_____________ 33% 35% 24% 100% 57% 10% 17% 68% 21% 61% 27% 10% 47% 16%
C HIK H H MN N P
Strong Democrat 152 136 15 152 - - 128 7 3 1 14 102 37 12 110 2024% 27% 12% 73% 47% 3% 7% 34% 11% 51% 15% 7% 37% 8%
C HIK H MN N P
Not a very strong Democrat 56 41 15 56 - - 26 12 4 1 13 20 31 6 30 189% 8% 12% 27% 10% 7% 10% 34% 10% 10% 12% 3% 10% 8%
N N
Net: Republican 81 66 15 - 81 - 6 60 3 - 12 2 20 58 13 57_______________ 13% 13% 11% 100% 2% 32% 8% 9% 1% 8% 32% 4% 24%
GIK G L LM O
Strong Republican 54 46 8 - 54 - 3 42 2 - 8 1 8 45 7 429% 9% 6% 67% 1% 22% 4% 6% 0% 3% 25% 2% 18%
GIK G L LM O
Not a very strong Republican 26 20 7 - 26 - 3 18 2 - 4 2 12 13 6 154% 4% 5% 33% 1% 9% 4% 3% 1% 5% 7% 2% 6%
GK L L O
Net: Independent 341 257 84 - - 341 110 110 31 1 90 76 163 102 147 139________________ 54% 51% 65% 100% 41% 58% 75% 32% 70% 38% 65% 57% 49% 59%
B G GH GH L L O
Leans Democrat 113 80 33 - - 113 70 8 9 1 24 53 49 11 82 1518% 16% 25% 33% 26% 4% 23% 32% 19% 26% 20% 6% 27% 6%
B H H H N N P
Leans Republican 93 72 21 - - 93 9 58 9 - 17 12 35 46 16 6715% 14% 16% 27% 3% 31% 22% 14% 6% 14% 26% 5% 29%
GK G G L LM O
Neither party 136 106 30 - - 136 31 44 12 - 49 11 79 45 48 5722% 21% 23% 40% 11% 23% 30% 38% 6% 32% 25% 16% 24%
G G GH L L O
8
Boston Globe Release Poll of Likely Voters in Massachusetts | June 8-10, 15-17, 2014
Total Sample
Designed and Directed by: SocialSphere Inc.
(A) (B) (C) (D) (E) (F) (G) (H) (I) (J) (K) (L) (M) (N) (O) (P)
Union Household Gender
18-34 35-44 45-54 55-64 Less than College College +
Age Income Education
Comparison Groups: BCDEF/GHI/JK/LMN/OP, Independent T-Test for Means (based on test for equal variances), Independent Z-Test for Percentages (unpooled proportions), Uppercase letters indicate significance at the 95% level.
65+ Less than $50K $50-$100K More than
$100K Public Private Neither Male Female
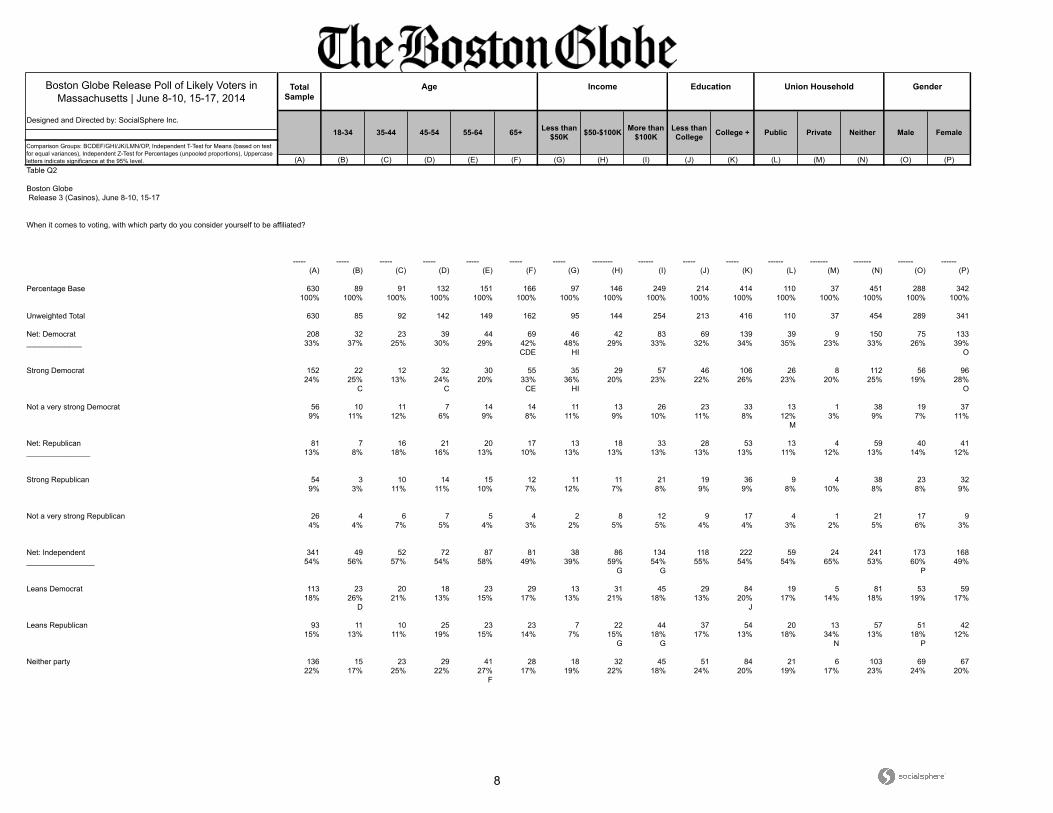
Table Q2
Boston Globe Release 3 (Casinos), June 8-10, 15-17
When it comes to voting, with which party do you consider yourself to be affiliated?
----- ----- ----- ----- ----- ----- ----- -------- ------ ----- ----- ------ ------- ------- ------ ------
(A) (B) (C) (D) (E) (F) (G) (H) (I) (J) (K) (L) (M) (N) (O) (P)
Percentage Base 630 89 91 132 151 166 97 146 249 214 414 110 37 451 288 342100% 100% 100% 100% 100% 100% 100% 100% 100% 100% 100% 100% 100% 100% 100% 100%
Unweighted Total 630 85 92 142 149 162 95 144 254 213 416 110 37 454 289 341
Net: Democrat 208 32 23 39 44 69 46 42 83 69 139 39 9 150 75 133_____________ 33% 37% 25% 30% 29% 42% 48% 29% 33% 32% 34% 35% 23% 33% 26% 39%
CDE HI O
Strong Democrat 152 22 12 32 30 55 35 29 57 46 106 26 8 112 56 9624% 25% 13% 24% 20% 33% 36% 20% 23% 22% 26% 23% 20% 25% 19% 28%
C C CE HI O
Not a very strong Democrat 56 10 11 7 14 14 11 13 26 23 33 13 1 38 19 379% 11% 12% 6% 9% 8% 11% 9% 10% 11% 8% 12% 3% 9% 7% 11%
M
Net: Republican 81 7 16 21 20 17 13 18 33 28 53 13 4 59 40 41_______________ 13% 8% 18% 16% 13% 10% 13% 13% 13% 13% 13% 11% 12% 13% 14% 12%
Strong Republican 54 3 10 14 15 12 11 11 21 19 36 9 4 38 23 329% 3% 11% 11% 10% 7% 12% 7% 8% 9% 9% 8% 10% 8% 8% 9%
Not a very strong Republican 26 4 6 7 5 4 2 8 12 9 17 4 1 21 17 94% 4% 7% 5% 4% 3% 2% 5% 5% 4% 4% 3% 2% 5% 6% 3%
Net: Independent 341 49 52 72 87 81 38 86 134 118 222 59 24 241 173 168________________ 54% 56% 57% 54% 58% 49% 39% 59% 54% 55% 54% 54% 65% 53% 60% 49%
G G P
Leans Democrat 113 23 20 18 23 29 13 31 45 29 84 19 5 81 53 5918% 26% 21% 13% 15% 17% 13% 21% 18% 13% 20% 17% 14% 18% 19% 17%
D J
Leans Republican 93 11 10 25 23 23 7 22 44 37 54 20 13 57 51 4215% 13% 11% 19% 15% 14% 7% 15% 18% 17% 13% 18% 34% 13% 18% 12%
G G N P
Neither party 136 15 23 29 41 28 18 32 45 51 84 21 6 103 69 6722% 17% 25% 22% 27% 17% 19% 22% 18% 24% 20% 19% 17% 23% 24% 20%
F
9
Boston Globe Release Poll of Likely Voters in Massachusetts | June 8-10, 15-17, 2014
Total Sample
Designed and Directed by: SocialSphere Inc.
(A) (B) (C) (D) (E) (F) (G) (H) (I) (J) (K)
CentralMA
WesternMA
Comparison Groups: BCDEFGHIJK, Independent T-Test for Means (based on test for equal variances), Independent Z-Test for Percentages (unpooled proportions), Uppercase letters indicate significance at the 95% level.
Region
Metro-Boston
Inside128
NorthShore
MerrimackValley
Metro-West
South ofBoston
SouthShore
Cape &Islands and
SouthCoast
Table Q2
Boston Globe Release 3 (Casinos), June 8-10, 15-17
When it comes to voting, with which party do you consider yourself to be affiliated?
----- -------- -------- ------- --------- ------- -------- ------- --------- ------- ---------
(A) (B) (C) (D) (E) (F) (G) (H) (I) (J) (K)
Percentage Base 630 84 89 45 61 53 51 41 38 70 66100% 100% 100% 100% 100% 100% 100% 100% 100% 100% 100%
Unweighted Total 630 84 94 45 63 57 49 38 31 82 61
Net: Democrat 208 46 33 13 15 21 14 8 14 16 20_____________ 33% 54% 37% 29% 25% 40% 28% 20% 37% 23% 30%
CDEGHJK HJ HJ
Strong Democrat 152 34 26 10 9 16 9 5 10 10 1324% 41% 30% 22% 15% 31% 18% 13% 27% 14% 20%
DEGHJK EHJ EHJ
Not a very strong Democrat 56 11 7 3 6 5 5 3 4 6 79% 13% 8% 7% 9% 9% 10% 8% 10% 9% 10%
Net: Republican 81 4 11 7 6 6 6 5 3 14 13_______________ 13% 4% 12% 15% 10% 12% 12% 12% 9% 20% 19%
B B
Strong Republican 54 2 8 5 4 4 5 3 3 10 69% 2% 9% 10% 6% 7% 11% 8% 9% 14% 9%
B
Not a very strong Republican 26 2 3 2 2 3 1 2 - 4 74% 3% 3% 5% 4% 5% 2% 4% 6% 10%
Net: Independent 341 35 45 25 40 25 31 28 21 40 33________________ 54% 42% 51% 56% 66% 48% 60% 68% 55% 57% 51%
BF B BF B
Leans Democrat 113 17 17 10 12 7 9 8 3 9 1618% 20% 20% 22% 20% 14% 18% 20% 8% 13% 24%
I I
Leans Republican 93 8 7 10 13 6 7 12 9 11 515% 9% 8% 22% 22% 12% 13% 28% 23% 16% 7%
CK BCK BCFK
Neither party 136 11 21 5 14 12 15 8 9 19 1322% 13% 23% 12% 24% 22% 29% 20% 24% 28% 20%
BD BD

10
Boston Globe Release Poll of Likely Voters in Massachusetts | June 8-10, 15-17, 2014
Total Sample
Designed and Directed by: SocialSphere Inc.
(A) (B) (C) (D) (E) (F) (G) (H) (I) (J) (K) (L) (M) (N) (O) (P)
Ideology Massachusetts
Definitely Probably Democrat Republican Falchuk Don't Know
Likelihood to Vote in General Election Party ID Candidate Vote
Liberal Moderate ConservativeRight
Directedion
Comparison Groups: BC/DEF/GHIJK/LMN/OP, Independent T-Test for Means (based on test for equal variances), Independent Z-Test for Percentages (unpooled proportions), Uppercase letters indicate significance at the 95% level.
Independent Coakley Baker McCormick Wrong Track
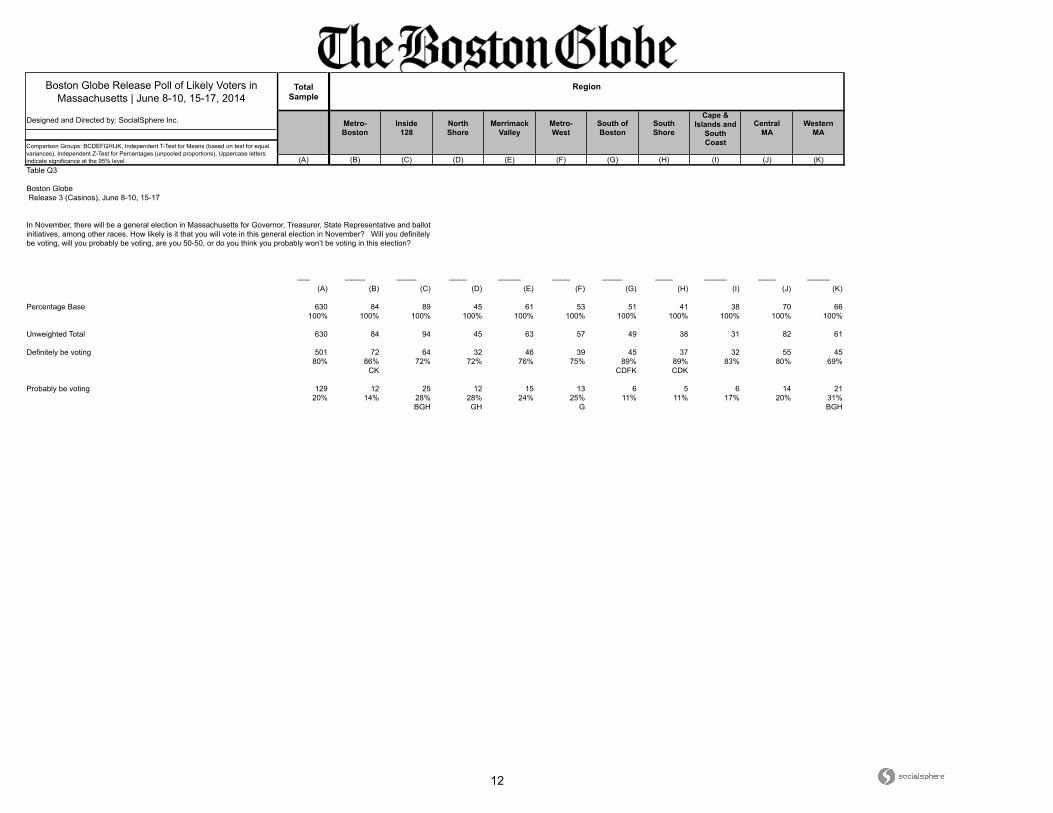
Table Q3
Boston Globe Release 3 (Casinos), June 8-10, 15-17
In November, there will be a general election in Massachusetts for Governor, Treasurer, State Representative and ballot initiatives, among other races. How likely is it that you will vote in this general election in November? Will you definitely be voting, will you probably be voting, are you 50-50, or do you think you probably won’t be voting in this election?
----- ------ ------- ----- ----- ----- ------- ----- --------- ------- ---- ----- ----- ----- ----- -----
(A) (B) (C) (D) (E) (F) (G) (H) (I) (J) (K) (L) (M) (N) (O) (P)
Percentage Base 630 501 129 208 81 341 269 189 41 3 128 200 252 178 300 233100% 100% 100% 100% 100% 100% 100% 100% 100% 100% 100% 100% 100% 100% 100% 100%
Unweighted Total 630 502 128 209 104 317 265 200 38 3 124 199 242 189 291 243
Definitely be voting 501 501 - 177 66 257 219 163 25 2 92 161 197 143 229 19880% 100% 85% 82% 75% 81% 87% 62% 66% 72% 80% 78% 80% 76% 85%
F IK IK O
Probably be voting 129 - 129 31 15 84 51 25 15 1 36 40 54 35 70 3620% 100% 15% 18% 25% 19% 13% 38% 34% 28% 20% 22% 20% 24% 15%
D GH GH P

11
Boston Globe Release Poll of Likely Voters in Massachusetts | June 8-10, 15-17, 2014
Total Sample
Designed and Directed by: SocialSphere Inc.
(A) (B) (C) (D) (E) (F) (G) (H) (I) (J) (K) (L) (M) (N) (O) (P)
Union Household Gender
18-34 35-44 45-54 55-64 Less than College College +
Age Income Education
Comparison Groups: BCDEF/GHI/JK/LMN/OP, Independent T-Test for Means (based on test for equal variances), Independent Z-Test for Percentages (unpooled proportions), Uppercase letters indicate significance at the 95% level.
65+ Less than $50K $50-$100K More than
$100K Public Private Neither Male Female
Table Q3
Boston Globe Release 3 (Casinos), June 8-10, 15-17
In November, there will be a general election in Massachusetts for Governor, Treasurer, State Representative and ballot initiatives, among other races. How likely is it that you will vote in this general election in November? Will you definitely be voting, will you probably be voting, are you 50-50, or do you think you probably won’t be voting in this election?
----- ----- ----- ----- ----- ----- ----- -------- ------ ----- ----- ------ ------- ------- ------ ------
(A) (B) (C) (D) (E) (F) (G) (H) (I) (J) (K) (L) (M) (N) (O) (P)
Percentage Base 630 89 91 132 151 166 97 146 249 214 414 110 37 451 288 342100% 100% 100% 100% 100% 100% 100% 100% 100% 100% 100% 100% 100% 100% 100% 100%
Unweighted Total 630 85 92 142 149 162 95 144 254 213 416 110 37 454 289 341
Definitely be voting 501 51 72 108 130 140 75 115 201 155 344 90 34 352 231 27080% 57% 78% 82% 86% 84% 77% 79% 80% 72% 83% 82% 92% 78% 80% 79%
B B B B J N
Probably be voting 129 38 20 24 20 26 22 31 49 59 70 20 3 99 57 7220% 43% 22% 18% 14% 16% 23% 21% 20% 28% 17% 18% 8% 22% 20% 21%
CDEF K M
12
Boston Globe Release Poll of Likely Voters in Massachusetts | June 8-10, 15-17, 2014
Total Sample
Designed and Directed by: SocialSphere Inc.
(A) (B) (C) (D) (E) (F) (G) (H) (I) (J) (K)
CentralMA
WesternMA
Comparison Groups: BCDEFGHIJK, Independent T-Test for Means (based on test for equal variances), Independent Z-Test for Percentages (unpooled proportions), Uppercase letters indicate significance at the 95% level.
Region
Metro-Boston
Inside128
NorthShore
MerrimackValley
Metro-West
South ofBoston
SouthShore
Cape &Islands and
SouthCoast
Table Q3
Boston Globe Release 3 (Casinos), June 8-10, 15-17
In November, there will be a general election in Massachusetts for Governor, Treasurer, State Representative and ballot initiatives, among other races. How likely is it that you will vote in this general election in November? Will you definitely be voting, will you probably be voting, are you 50-50, or do you think you probably won’t be voting in this election?
----- -------- -------- ------- --------- ------- -------- ------- --------- ------- ---------
(A) (B) (C) (D) (E) (F) (G) (H) (I) (J) (K)
Percentage Base 630 84 89 45 61 53 51 41 38 70 66100% 100% 100% 100% 100% 100% 100% 100% 100% 100% 100%
Unweighted Total 630 84 94 45 63 57 49 38 31 82 61
Definitely be voting 501 72 64 32 46 39 45 37 32 55 4580% 86% 72% 72% 76% 75% 89% 89% 83% 80% 69%
CK CDFK CDK
Probably be voting 129 12 25 12 15 13 6 5 6 14 2120% 14% 28% 28% 24% 25% 11% 11% 17% 20% 31%
BGH GH G BGH
13
Boston Globe Release Poll of Likely Voters in Massachusetts | June 8-10, 15-17, 2014
Total Sample
Designed and Directed by: SocialSphere Inc.
(A) (B) (C) (D) (E) (F) (G) (H) (I) (J) (K) (L) (M) (N) (O) (P)
Ideology Massachusetts
Definitely Probably Democrat Republican Falchuk Don't Know
Likelihood to Vote in General Election Party ID Candidate Vote
Liberal Moderate ConservativeRight
Directedion
Comparison Groups: BC/DEF/GHIJK/LMN/OP, Independent T-Test for Means (based on test for equal variances), Independent Z-Test for Percentages (unpooled proportions), Uppercase letters indicate significance at the 95% level.
Independent Coakley Baker McCormick Wrong Track
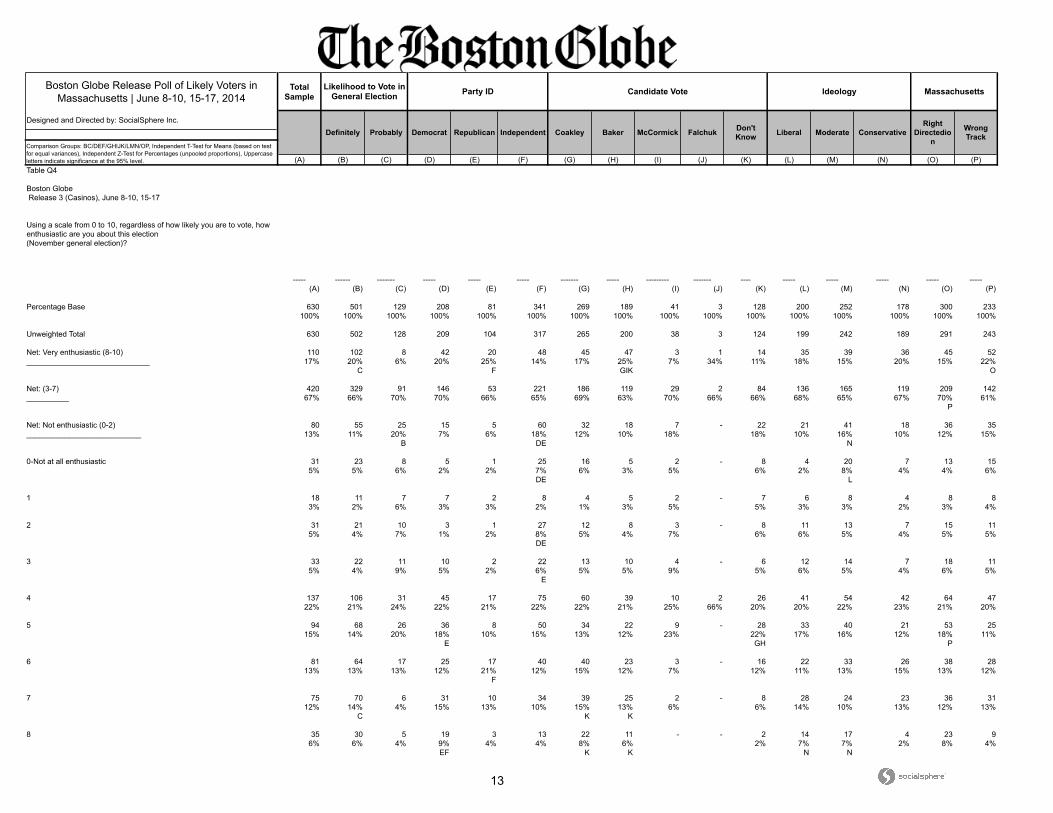
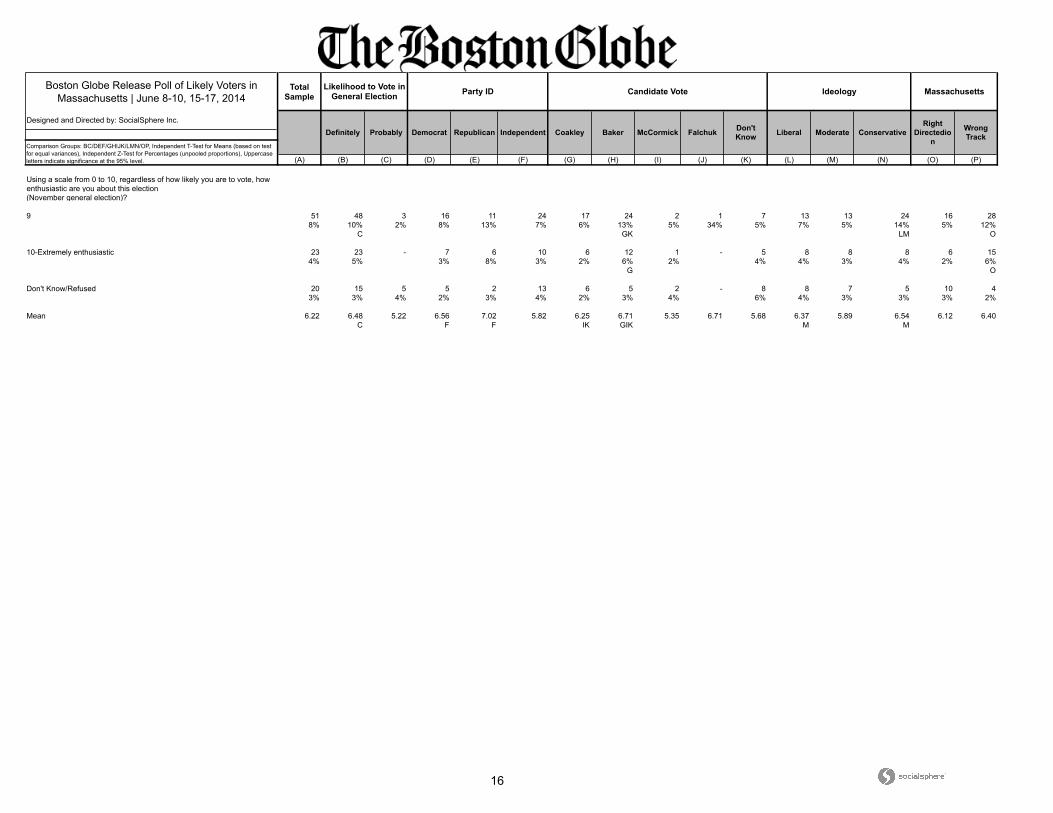
Table Q4
Boston Globe Release 3 (Casinos), June 8-10, 15-17
Using a scale from 0 to 10, regardless of how likely you are to vote, how enthusiastic are you about this election(November general election)?
----- ------ ------- ----- ----- ----- ------- ----- --------- ------- ---- ----- ----- ----- ----- -----
(A) (B) (C) (D) (E) (F) (G) (H) (I) (J) (K) (L) (M) (N) (O) (P)
Percentage Base 630 501 129 208 81 341 269 189 41 3 128 200 252 178 300 233100% 100% 100% 100% 100% 100% 100% 100% 100% 100% 100% 100% 100% 100% 100% 100%
Unweighted Total 630 502 128 209 104 317 265 200 38 3 124 199 242 189 291 243
Net: Very enthusiastic (8-10) 110 102 8 42 20 48 45 47 3 1 14 35 39 36 45 52_____________________________ 17% 20% 6% 20% 25% 14% 17% 25% 7% 34% 11% 18% 15% 20% 15% 22%
C F GIK O
Net: (3-7) 420 329 91 146 53 221 186 119 29 2 84 136 165 119 209 142__________ 67% 66% 70% 70% 66% 65% 69% 63% 70% 66% 66% 68% 65% 67% 70% 61%
P
Net: Not enthusiastic (0-2) 80 55 25 15 5 60 32 18 7 - 22 21 41 18 36 35___________________________ 13% 11% 20% 7% 6% 18% 12% 10% 18% 18% 10% 16% 10% 12% 15%
B DE N
0-Not at all enthusiastic 31 23 8 5 1 25 16 5 2 - 8 4 20 7 13 155% 5% 6% 2% 2% 7% 6% 3% 5% 6% 2% 8% 4% 4% 6%
DE L
1 18 11 7 7 2 8 4 5 2 - 7 6 8 4 8 83% 2% 6% 3% 3% 2% 1% 3% 5% 5% 3% 3% 2% 3% 4%
2 31 21 10 3 1 27 12 8 3 - 8 11 13 7 15 115% 4% 7% 1% 2% 8% 5% 4% 7% 6% 6% 5% 4% 5% 5%
DE
3 33 22 11 10 2 22 13 10 4 - 6 12 14 7 18 115% 4% 9% 5% 2% 6% 5% 5% 9% 5% 6% 5% 4% 6% 5%
E
4 137 106 31 45 17 75 60 39 10 2 26 41 54 42 64 4722% 21% 24% 22% 21% 22% 22% 21% 25% 66% 20% 20% 22% 23% 21% 20%
5 94 68 26 36 8 50 34 22 9 - 28 33 40 21 53 2515% 14% 20% 18% 10% 15% 13% 12% 23% 22% 17% 16% 12% 18% 11%
E GH P
6 81 64 17 25 17 40 40 23 3 - 16 22 33 26 38 2813% 13% 13% 12% 21% 12% 15% 12% 7% 12% 11% 13% 15% 13% 12%
F
7 75 70 6 31 10 34 39 25 2 - 8 28 24 23 36 3112% 14% 4% 15% 13% 10% 15% 13% 6% 6% 14% 10% 13% 12% 13%
C K K
8 35 30 5 19 3 13 22 11 - - 2 14 17 4 23 96% 6% 4% 9% 4% 4% 8% 6% 2% 7% 7% 2% 8% 4%
EF K K N N
14
Boston Globe Release Poll of Likely Voters in Massachusetts | June 8-10, 15-17, 2014
Total Sample
Designed and Directed by: SocialSphere Inc.
(A) (B) (C) (D) (E) (F) (G) (H) (I) (J) (K) (L) (M) (N) (O) (P)
Union Household Gender
18-34 35-44 45-54 55-64 Less than College College +
Age Income Education
Comparison Groups: BCDEF/GHI/JK/LMN/OP, Independent T-Test for Means (based on test for equal variances), Independent Z-Test for Percentages (unpooled proportions), Uppercase letters indicate significance at the 95% level.
65+ Less than $50K $50-$100K More than
$100K Public Private Neither Male Female
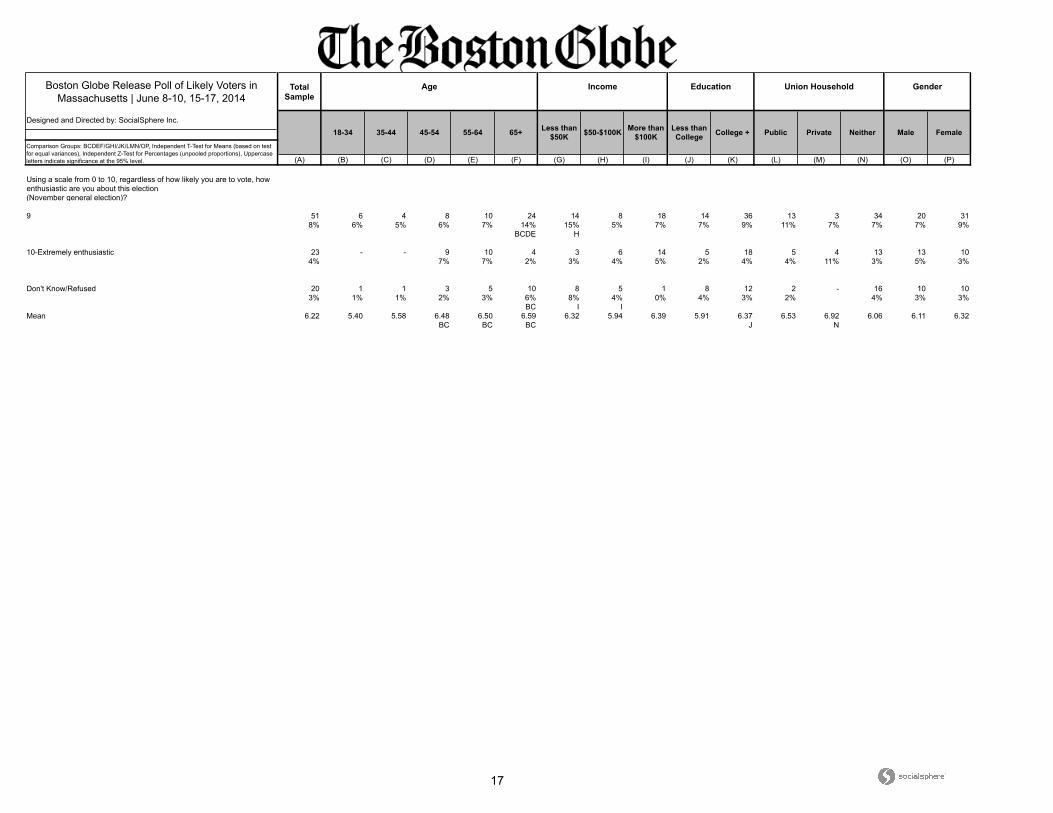
Table Q4
Boston Globe Release 3 (Casinos), June 8-10, 15-17
Using a scale from 0 to 10, regardless of how likely you are to vote, how enthusiastic are you about this election(November general election)?
----- ----- ----- ----- ----- ----- ----- -------- ------ ----- ----- ------ ------- ------- ------ ------
(A) (B) (C) (D) (E) (F) (G) (H) (I) (J) (K) (L) (M) (N) (O) (P)
Percentage Base 630 89 91 132 151 166 97 146 249 214 414 110 37 451 288 342100% 100% 100% 100% 100% 100% 100% 100% 100% 100% 100% 100% 100% 100% 100% 100%
Unweighted Total 630 85 92 142 149 162 95 144 254 213 416 110 37 454 289 341
Net: Very enthusiastic (8-10) 110 12 6 22 32 37 22 18 47 30 79 26 8 70 45 64_____________________________ 17% 14% 7% 17% 21% 22% 22% 13% 19% 14% 19% 24% 21% 16% 16% 19%
C C C
Net: (3-7) 420 56 69 88 102 105 55 99 177 148 272 73 27 300 198 222__________ 67% 63% 76% 66% 68% 63% 57% 68% 71% 69% 66% 66% 72% 66% 69% 65%
F G
Net: Not enthusiastic (0-2) 80 20 15 19 11 14 13 23 25 28 52 9 3 65 35 45___________________________ 13% 22% 17% 15% 8% 9% 13% 16% 10% 13% 12% 8% 7% 14% 12% 13%
EF E L
0-Not at all enthusiastic 31 7 10 3 7 4 9 6 8 14 17 3 1 27 14 175% 8% 11% 2% 5% 2% 9% 4% 3% 7% 4% 3% 3% 6% 5% 5%
DF
1 18 4 3 4 2 5 3 2 10 4 14 5 - 13 8 103% 5% 3% 3% 1% 3% 3% 1% 4% 2% 3% 4% 3% 3% 3%
2 31 9 2 13 2 5 1 15 7 10 21 1 2 25 12 195% 10% 2% 9% 1% 3% 1% 10% 3% 5% 5% 1% 5% 6% 4% 5%
CE CEF GI L
3 33 7 2 6 8 10 5 10 12 14 19 11 1 19 21 125% 8% 2% 4% 5% 6% 5% 7% 5% 6% 5% 10% 3% 4% 7% 4%
P
4 137 19 20 23 36 39 20 32 57 57 80 18 8 106 62 7422% 21% 22% 17% 24% 24% 21% 22% 23% 27% 19% 16% 20% 23% 22% 22%
K5 94 20 22 13 23 16 9 22 44 31 63 20 4 64 50 44
15% 23% 24% 10% 15% 9% 9% 15% 18% 15% 15% 18% 11% 14% 17% 13%DF DF G
6 81 6 18 22 21 14 9 16 38 21 60 13 8 58 36 4513% 7% 19% 17% 14% 9% 10% 11% 15% 10% 14% 12% 20% 13% 13% 13%
BF BF
7 75 5 7 24 14 25 11 19 27 24 51 10 6 53 28 4712% 5% 8% 18% 9% 15% 11% 13% 11% 11% 12% 9% 17% 12% 10% 14%
BCE B
8 35 6 2 6 12 9 4 5 15 10 25 9 1 23 12 236% 7% 2% 4% 8% 5% 4% 3% 6% 5% 6% 8% 3% 5% 4% 7%
C

15
Boston Globe Release Poll of Likely Voters in Massachusetts | June 8-10, 15-17, 2014
Total Sample
Designed and Directed by: SocialSphere Inc.
(A) (B) (C) (D) (E) (F) (G) (H) (I) (J) (K)
CentralMA
WesternMA
Comparison Groups: BCDEFGHIJK, Independent T-Test for Means (based on test for equal variances), Independent Z-Test for Percentages (unpooled proportions), Uppercase letters indicate significance at the 95% level.
Region
Metro-Boston
Inside128
NorthShore
MerrimackValley
Metro-West
South ofBoston
SouthShore
Cape &Islands and
SouthCoast
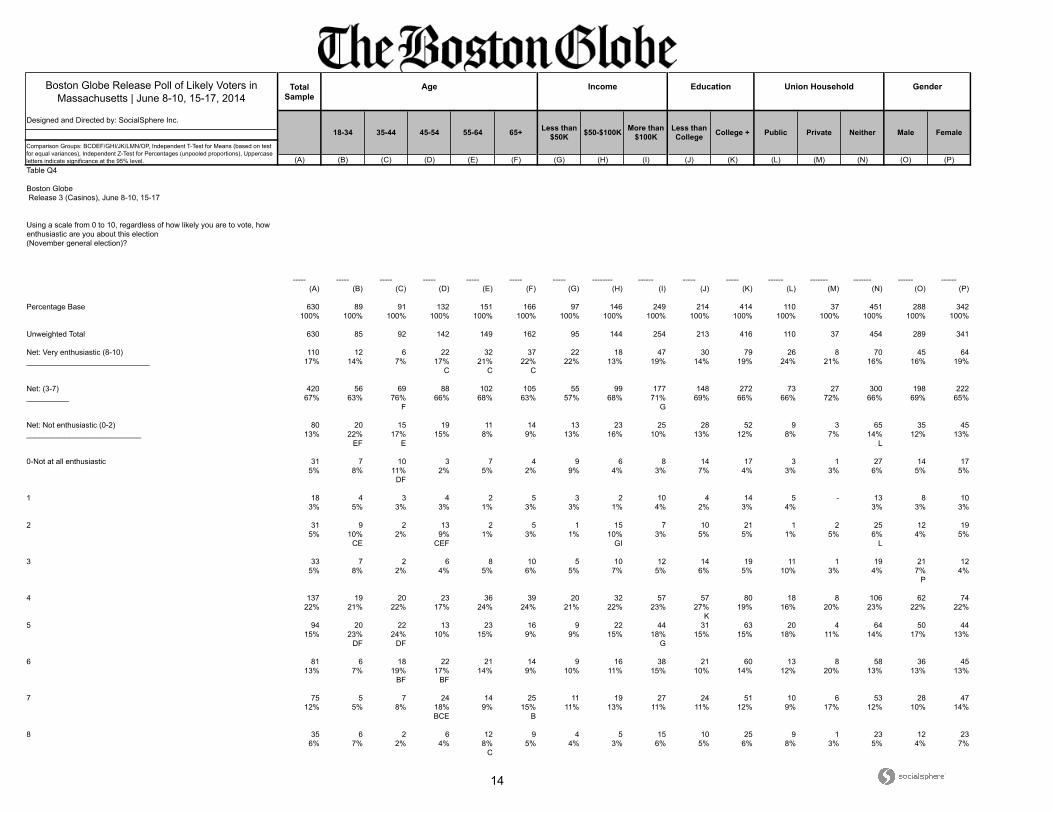
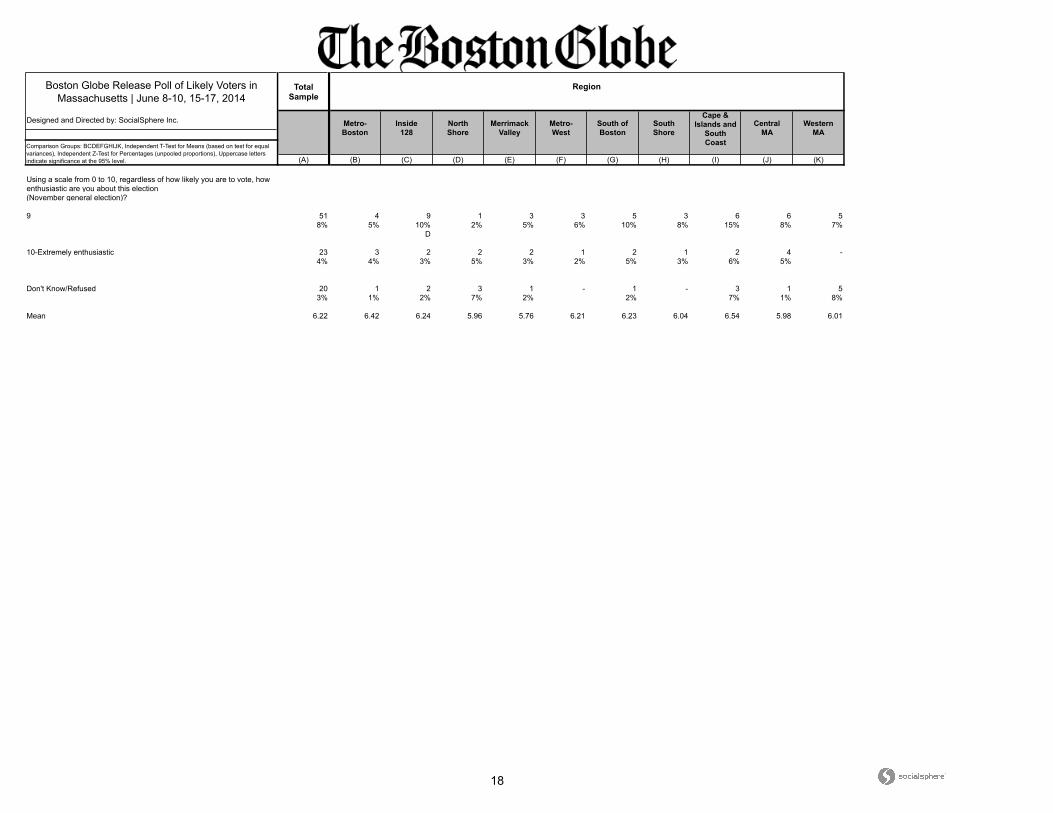
Table Q4
Boston Globe Release 3 (Casinos), June 8-10, 15-17
Using a scale from 0 to 10, regardless of how likely you are to vote, how enthusiastic are you about this election(November general election)?
----- -------- -------- ------- --------- ------- -------- ------- --------- ------- ---------
(A) (B) (C) (D) (E) (F) (G) (H) (I) (J) (K)
Percentage Base 630 84 89 45 61 53 51 41 38 70 66100% 100% 100% 100% 100% 100% 100% 100% 100% 100% 100%
Unweighted Total 630 84 94 45 63 57 49 38 31 82 61
Net: Very enthusiastic (8-10) 110 13 16 4 7 9 9 7 10 13 7_____________________________ 17% 16% 18% 9% 11% 17% 18% 17% 26% 19% 10%
Net: (3-7) 420 63 60 31 42 40 34 29 20 44 45__________ 67% 75% 68% 70% 69% 76% 67% 69% 51% 63% 69%
I I
Net: Not enthusiastic (0-2) 80 7 11 6 11 4 6 6 6 12 9___________________________ 13% 8% 12% 14% 18% 7% 12% 14% 15% 17% 13%
0-Not at all enthusiastic 31 4 3 3 4 2 2 3 - 5 45% 5% 3% 7% 7% 4% 4% 8% 6% 5%
1 18 2 3 1 1 1 2 1 2 3 23% 2% 3% 2% 2% 2% 4% 3% 4% 5% 3%
2 31 1 5 2 6 1 2 1 4 4 45% 1% 6% 4% 10% 2% 4% 3% 11% 6% 5%
BF
3 33 5 8 1 2 3 - 3 2 6 25% 6% 9% 2% 3% 6% 8% 4% 9% 3%
4 137 17 17 10 16 14 16 8 8 15 1622% 20% 19% 22% 26% 26% 31% 18% 20% 21% 24%
5 94 15 9 7 11 13 9 6 5 8 615% 17% 10% 16% 18% 25% 17% 16% 13% 12% 10%
CJK
6 81 10 18 7 7 4 5 7 2 7 1113% 12% 21% 16% 11% 7% 11% 18% 4% 11% 17%
FI I
7 75 17 8 6 7 6 4 4 3 7 1012% 20% 10% 13% 12% 12% 8% 9% 9% 10% 15%
8 35 6 5 1 2 5 2 2 2 4 26% 7% 5% 2% 3% 9% 4% 6% 6% 6% 3%
16
Boston Globe Release Poll of Likely Voters in Massachusetts | June 8-10, 15-17, 2014
Total Sample
Designed and Directed by: SocialSphere Inc.
(A) (B) (C) (D) (E) (F) (G) (H) (I) (J) (K) (L) (M) (N) (O) (P)
Ideology Massachusetts
Definitely Probably Democrat Republican Falchuk Don't Know
Likelihood to Vote in General Election Party ID Candidate Vote
Liberal Moderate ConservativeRight
Directedion
Comparison Groups: BC/DEF/GHIJK/LMN/OP, Independent T-Test for Means (based on test for equal variances), Independent Z-Test for Percentages (unpooled proportions), Uppercase letters indicate significance at the 95% level.
Independent Coakley Baker McCormick Wrong Track
Using a scale from 0 to 10, regardless of how likely you are to vote, how enthusiastic are you about this election(November general election)?
9 51 48 3 16 11 24 17 24 2 1 7 13 13 24 16 288% 10% 2% 8% 13% 7% 6% 13% 5% 34% 5% 7% 5% 14% 5% 12%
C GK LM O
10-Extremely enthusiastic 23 23 - 7 6 10 6 12 1 - 5 8 8 8 6 154% 5% 3% 8% 3% 2% 6% 2% 4% 4% 3% 4% 2% 6%
G O
Don't Know/Refused 20 15 5 5 2 13 6 5 2 - 8 8 7 5 10 43% 3% 4% 2% 3% 4% 2% 3% 4% 6% 4% 3% 3% 3% 2%
Mean 6.22 6.48 5.22 6.56 7.02 5.82 6.25 6.71 5.35 6.71 5.68 6.37 5.89 6.54 6.12 6.40C F F IK GIK M M
17
Boston Globe Release Poll of Likely Voters in Massachusetts | June 8-10, 15-17, 2014
Total Sample
Designed and Directed by: SocialSphere Inc.
(A) (B) (C) (D) (E) (F) (G) (H) (I) (J) (K) (L) (M) (N) (O) (P)
Union Household Gender
18-34 35-44 45-54 55-64 Less than College College +
Age Income Education
Comparison Groups: BCDEF/GHI/JK/LMN/OP, Independent T-Test for Means (based on test for equal variances), Independent Z-Test for Percentages (unpooled proportions), Uppercase letters indicate significance at the 95% level.
65+ Less than $50K $50-$100K More than
$100K Public Private Neither Male Female
Using a scale from 0 to 10, regardless of how likely you are to vote, how enthusiastic are you about this election(November general election)?
9 51 6 4 8 10 24 14 8 18 14 36 13 3 34 20 318% 6% 5% 6% 7% 14% 15% 5% 7% 7% 9% 11% 7% 7% 7% 9%
BCDE H
10-Extremely enthusiastic 23 - - 9 10 4 3 6 14 5 18 5 4 13 13 104% 7% 7% 2% 3% 4% 5% 2% 4% 4% 11% 3% 5% 3%
Don't Know/Refused 20 1 1 3 5 10 8 5 1 8 12 2 - 16 10 103% 1% 1% 2% 3% 6% 8% 4% 0% 4% 3% 2% 4% 3% 3%
BC I IMean 6.22 5.40 5.58 6.48 6.50 6.59 6.32 5.94 6.39 5.91 6.37 6.53 6.92 6.06 6.11 6.32
BC BC BC J N
18
Boston Globe Release Poll of Likely Voters in Massachusetts | June 8-10, 15-17, 2014
Total Sample
Designed and Directed by: SocialSphere Inc.
(A) (B) (C) (D) (E) (F) (G) (H) (I) (J) (K)
CentralMA
WesternMA
Comparison Groups: BCDEFGHIJK, Independent T-Test for Means (based on test for equal variances), Independent Z-Test for Percentages (unpooled proportions), Uppercase letters indicate significance at the 95% level.
Region
Metro-Boston
Inside128
NorthShore
MerrimackValley
Metro-West
South ofBoston
SouthShore
Cape &Islands and
SouthCoast
Using a scale from 0 to 10, regardless of how likely you are to vote, how enthusiastic are you about this election(November general election)?
9 51 4 9 1 3 3 5 3 6 6 58% 5% 10% 2% 5% 6% 10% 8% 15% 8% 7%
D
10-Extremely enthusiastic 23 3 2 2 2 1 2 1 2 4 -4% 4% 3% 5% 3% 2% 5% 3% 6% 5%
Don't Know/Refused 20 1 2 3 1 - 1 - 3 1 53% 1% 2% 7% 2% 2% 7% 1% 8%
Mean 6.22 6.42 6.24 5.96 5.76 6.21 6.23 6.04 6.54 5.98 6.01
19
Boston Globe Release Poll of Likely Voters in Massachusetts | June 8-10, 15-17, 2014
Total Sample
Designed and Directed by: SocialSphere Inc.
(A) (B) (C) (D) (E) (F) (G) (H) (I) (J) (K) (L) (M) (N) (O) (P)
Ideology Massachusetts
Definitely Probably Democrat Republican Falchuk Don't Know
Likelihood to Vote in General Election Party ID Candidate Vote
Liberal Moderate ConservativeRight
Directedion
Comparison Groups: BC/DEF/GHIJK/LMN/OP, Independent T-Test for Means (based on test for equal variances), Independent Z-Test for Percentages (unpooled proportions), Uppercase letters indicate significance at the 95% level.
Independent Coakley Baker McCormick Wrong Track
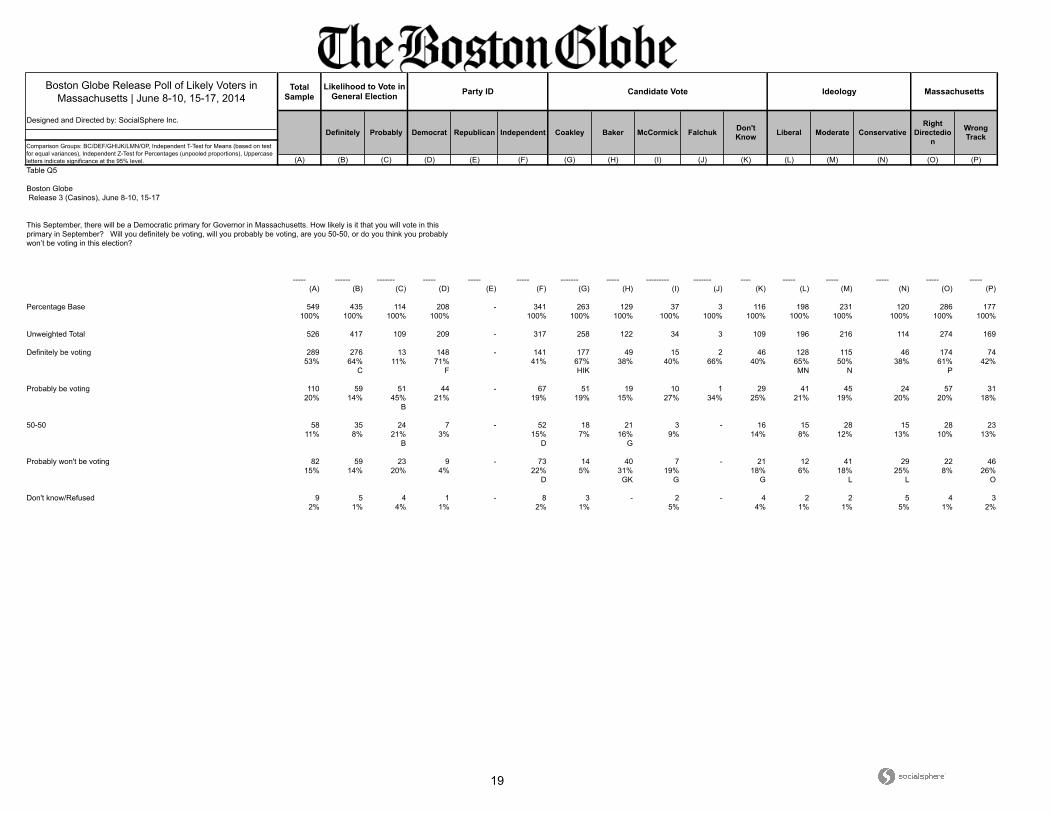
Table Q5
Boston Globe Release 3 (Casinos), June 8-10, 15-17
This September, there will be a Democratic primary for Governor in Massachusetts. How likely is it that you will vote in this primary in September? Will you definitely be voting, will you probably be voting, are you 50-50, or do you think you probably won’t be voting in this election?
----- ------ ------- ----- ----- ----- ------- ----- --------- ------- ---- ----- ----- ----- ----- -----
(A) (B) (C) (D) (E) (F) (G) (H) (I) (J) (K) (L) (M) (N) (O) (P)
Percentage Base 549 435 114 208 - 341 263 129 37 3 116 198 231 120 286 177100% 100% 100% 100% 100% 100% 100% 100% 100% 100% 100% 100% 100% 100% 100%
Unweighted Total 526 417 109 209 - 317 258 122 34 3 109 196 216 114 274 169
Definitely be voting 289 276 13 148 - 141 177 49 15 2 46 128 115 46 174 7453% 64% 11% 71% 41% 67% 38% 40% 66% 40% 65% 50% 38% 61% 42%
C F HIK MN N P
Probably be voting 110 59 51 44 - 67 51 19 10 1 29 41 45 24 57 3120% 14% 45% 21% 19% 19% 15% 27% 34% 25% 21% 19% 20% 20% 18%
B
50-50 58 35 24 7 - 52 18 21 3 - 16 15 28 15 28 2311% 8% 21% 3% 15% 7% 16% 9% 14% 8% 12% 13% 10% 13%
B D G
Probably won't be voting 82 59 23 9 - 73 14 40 7 - 21 12 41 29 22 4615% 14% 20% 4% 22% 5% 31% 19% 18% 6% 18% 25% 8% 26%
D GK G G L L O
Don't know/Refused 9 5 4 1 - 8 3 - 2 - 4 2 2 5 4 32% 1% 4% 1% 2% 1% 5% 4% 1% 1% 5% 1% 2%

20
Boston Globe Release Poll of Likely Voters in Massachusetts | June 8-10, 15-17, 2014
Total Sample
Designed and Directed by: SocialSphere Inc.
(A) (B) (C) (D) (E) (F) (G) (H) (I) (J) (K) (L) (M) (N) (O) (P)
Union Household Gender
18-34 35-44 45-54 55-64 Less than College College +
Age Income Education
Comparison Groups: BCDEF/GHI/JK/LMN/OP, Independent T-Test for Means (based on test for equal variances), Independent Z-Test for Percentages (unpooled proportions), Uppercase letters indicate significance at the 95% level.
65+ Less than $50K $50-$100K More than
$100K Public Private Neither Male Female
Table Q5
Boston Globe Release 3 (Casinos), June 8-10, 15-17
This September, there will be a Democratic primary for Governor in Massachusetts. How likely is it that you will vote in this primary in September? Will you definitely be voting, will you probably be voting, are you 50-50, or do you think you probably won’t be voting in this election?
----- ----- ----- ----- ----- ----- ----- -------- ------ ----- ----- ------ ------- ------- ------ ------
(A) (B) (C) (D) (E) (F) (G) (H) (I) (J) (K) (L) (M) (N) (O) (P)
Percentage Base 549 82 75 111 131 150 84 128 216 187 361 98 33 392 248 301100% 100% 100% 100% 100% 100% 100% 100% 100% 100% 100% 100% 100% 100% 100% 100%
Unweighted Total 526 76 71 114 124 141 80 121 210 176 349 94 31 377 236 290
Definitely be voting 289 41 33 52 70 93 52 67 111 94 195 55 22 196 121 16853% 50% 44% 47% 54% 62% 63% 53% 51% 50% 54% 57% 68% 50% 49% 56%
CD N
Probably be voting 110 23 19 23 20 26 17 34 38 41 69 19 4 82 49 6120% 28% 25% 20% 15% 17% 20% 27% 18% 22% 19% 19% 13% 21% 20% 20%
E
50-50 58 11 12 10 14 11 6 9 26 22 37 6 2 48 28 3011% 13% 16% 9% 11% 8% 8% 7% 12% 12% 10% 6% 6% 12% 11% 10%
Probably won't be voting 82 7 11 24 24 17 6 15 40 26 55 16 4 60 47 3515% 8% 15% 21% 18% 11% 7% 12% 19% 14% 15% 16% 13% 15% 19% 12%
BF B G P
Don't know/Refused 9 - - 3 3 3 2 2 1 4 6 2 - 6 2 72% 3% 3% 2% 3% 1% 1% 2% 2% 2% 2% 1% 2%

21
Boston Globe Release Poll of Likely Voters in Massachusetts | June 8-10, 15-17, 2014
Total Sample
Designed and Directed by: SocialSphere Inc.
(A) (B) (C) (D) (E) (F) (G) (H) (I) (J) (K)
CentralMA
WesternMA
Comparison Groups: BCDEFGHIJK, Independent T-Test for Means (based on test for equal variances), Independent Z-Test for Percentages (unpooled proportions), Uppercase letters indicate significance at the 95% level.
Region
Metro-Boston
Inside128
NorthShore
MerrimackValley
Metro-West
South ofBoston
SouthShore
Cape &Islands and
SouthCoast
Table Q5
Boston Globe Release 3 (Casinos), June 8-10, 15-17
This September, there will be a Democratic primary for Governor in Massachusetts. How likely is it that you will vote in this primary in September? Will you definitely be voting, will you probably be voting, are you 50-50, or do you think you probably won’t be voting in this election?
----- -------- -------- ------- --------- ------- -------- ------- --------- ------- ---------
(A) (B) (C) (D) (E) (F) (G) (H) (I) (J) (K)
Percentage Base 549 81 78 38 55 46 45 36 35 56 53100% 100% 100% 100% 100% 100% 100% 100% 100% 100% 100%
Unweighted Total 526 79 79 36 55 48 41 32 28 61 46
Definitely be voting 289 58 38 19 29 19 23 15 13 27 3053% 72% 48% 49% 52% 41% 50% 43% 37% 49% 56%
CDEFGHIJ
Probably be voting 110 13 16 6 9 11 10 4 11 13 1220% 16% 20% 17% 17% 25% 22% 10% 32% 23% 22%
H
50-50 58 6 13 4 7 5 2 5 3 6 411% 8% 17% 12% 13% 10% 5% 13% 10% 11% 7%
G
Probably won't be voting 82 1 9 9 10 11 10 13 7 7 515% 1% 12% 23% 18% 24% 23% 35% 21% 13% 9%
B B B BK B BCJK B B
Don't know/Refused 9 2 2 - - - - - - 2 32% 3% 3% 3% 6%
22
Boston Globe Release Poll of Likely Voters in Massachusetts | June 8-10, 15-17, 2014
Total Sample
Designed and Directed by: SocialSphere Inc.
(A) (B) (C) (D) (E) (F) (G) (H) (I) (J) (K) (L) (M) (N) (O) (P)
Ideology Massachusetts
Definitely Probably Democrat Republican Falchuk Don't Know
Likelihood to Vote in General Election Party ID Candidate Vote
Liberal Moderate ConservativeRight
Directedion
Comparison Groups: BC/DEF/GHIJK/LMN/OP, Independent T-Test for Means (based on test for equal variances), Independent Z-Test for Percentages (unpooled proportions), Uppercase letters indicate significance at the 95% level.
Independent Coakley Baker McCormick Wrong Track
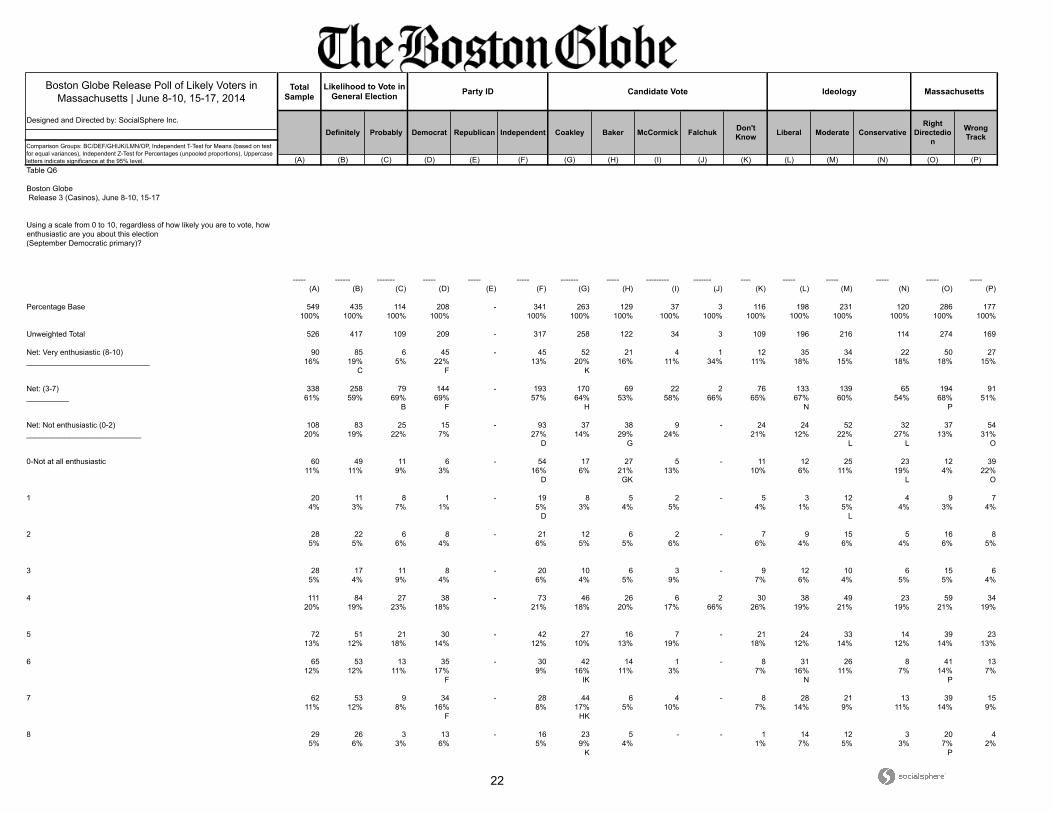
Table Q6
Boston Globe Release 3 (Casinos), June 8-10, 15-17
Using a scale from 0 to 10, regardless of how likely you are to vote, how enthusiastic are you about this election(September Democratic primary)?
----- ------ ------- ----- ----- ----- ------- ----- --------- ------- ---- ----- ----- ----- ----- -----
(A) (B) (C) (D) (E) (F) (G) (H) (I) (J) (K) (L) (M) (N) (O) (P)
Percentage Base 549 435 114 208 - 341 263 129 37 3 116 198 231 120 286 177100% 100% 100% 100% 100% 100% 100% 100% 100% 100% 100% 100% 100% 100% 100%
Unweighted Total 526 417 109 209 - 317 258 122 34 3 109 196 216 114 274 169
Net: Very enthusiastic (8-10) 90 85 6 45 - 45 52 21 4 1 12 35 34 22 50 27_____________________________ 16% 19% 5% 22% 13% 20% 16% 11% 34% 11% 18% 15% 18% 18% 15%
C F K
Net: (3-7) 338 258 79 144 - 193 170 69 22 2 76 133 139 65 194 91__________ 61% 59% 69% 69% 57% 64% 53% 58% 66% 65% 67% 60% 54% 68% 51%
B F H N P
Net: Not enthusiastic (0-2) 108 83 25 15 - 93 37 38 9 - 24 24 52 32 37 54___________________________ 20% 19% 22% 7% 27% 14% 29% 24% 21% 12% 22% 27% 13% 31%
D G L L O
0-Not at all enthusiastic 60 49 11 6 - 54 17 27 5 - 11 12 25 23 12 3911% 11% 9% 3% 16% 6% 21% 13% 10% 6% 11% 19% 4% 22%
D GK L O
1 20 11 8 1 - 19 8 5 2 - 5 3 12 4 9 74% 3% 7% 1% 5% 3% 4% 5% 4% 1% 5% 4% 3% 4%
D L
2 28 22 6 8 - 21 12 6 2 - 7 9 15 5 16 85% 5% 6% 4% 6% 5% 5% 6% 6% 4% 6% 4% 6% 5%
3 28 17 11 8 - 20 10 6 3 - 9 12 10 6 15 65% 4% 9% 4% 6% 4% 5% 9% 7% 6% 4% 5% 5% 4%
4 111 84 27 38 - 73 46 26 6 2 30 38 49 23 59 3420% 19% 23% 18% 21% 18% 20% 17% 66% 26% 19% 21% 19% 21% 19%
5 72 51 21 30 - 42 27 16 7 - 21 24 33 14 39 2313% 12% 18% 14% 12% 10% 13% 19% 18% 12% 14% 12% 14% 13%
6 65 53 13 35 - 30 42 14 1 - 8 31 26 8 41 1312% 12% 11% 17% 9% 16% 11% 3% 7% 16% 11% 7% 14% 7%
F IK N P
7 62 53 9 34 - 28 44 6 4 - 8 28 21 13 39 1511% 12% 8% 16% 8% 17% 5% 10% 7% 14% 9% 11% 14% 9%
F HK
8 29 26 3 13 - 16 23 5 - - 1 14 12 3 20 45% 6% 3% 6% 5% 9% 4% 1% 7% 5% 3% 7% 2%
K P
23
Boston Globe Release Poll of Likely Voters in Massachusetts | June 8-10, 15-17, 2014
Total Sample
Designed and Directed by: SocialSphere Inc.
(A) (B) (C) (D) (E) (F) (G) (H) (I) (J) (K) (L) (M) (N) (O) (P)
Union Household Gender
18-34 35-44 45-54 55-64 Less than College College +
Age Income Education
Comparison Groups: BCDEF/GHI/JK/LMN/OP, Independent T-Test for Means (based on test for equal variances), Independent Z-Test for Percentages (unpooled proportions), Uppercase letters indicate significance at the 95% level.
65+ Less than $50K $50-$100K More than
$100K Public Private Neither Male Female
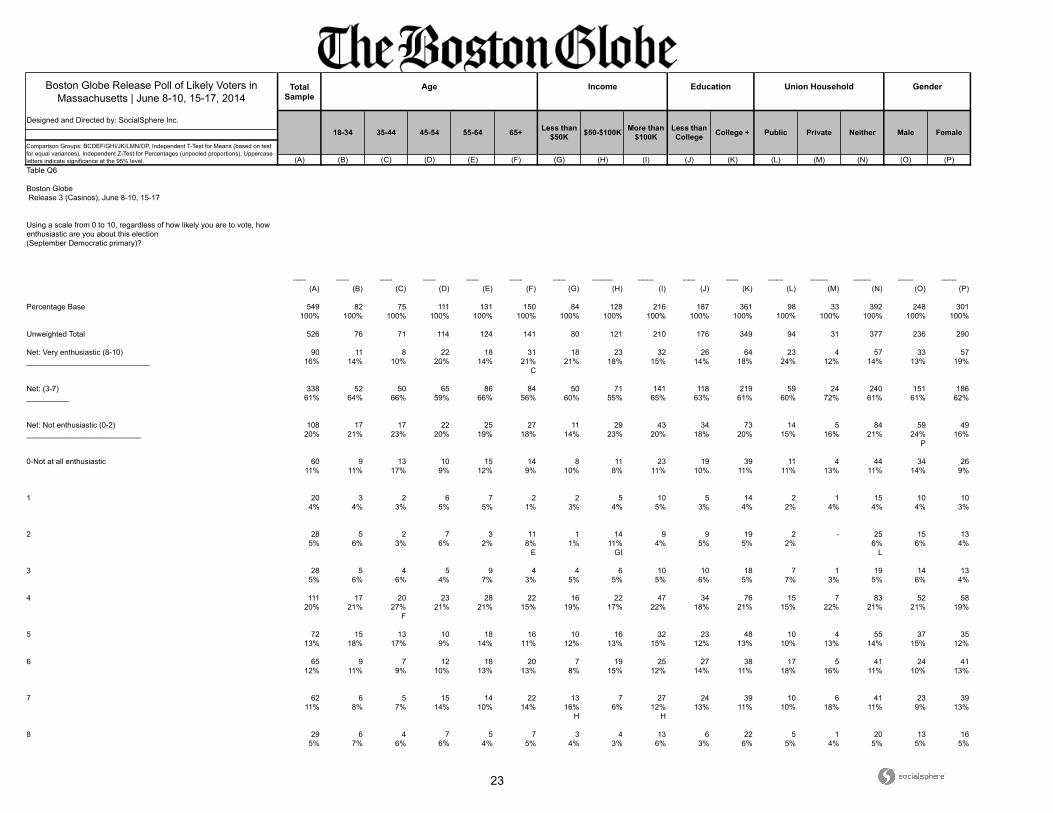
Table Q6
Boston Globe Release 3 (Casinos), June 8-10, 15-17
Using a scale from 0 to 10, regardless of how likely you are to vote, how enthusiastic are you about this election(September Democratic primary)?
----- ----- ----- ----- ----- ----- ----- -------- ------ ----- ----- ------ ------- ------- ------ ------
(A) (B) (C) (D) (E) (F) (G) (H) (I) (J) (K) (L) (M) (N) (O) (P)
Percentage Base 549 82 75 111 131 150 84 128 216 187 361 98 33 392 248 301100% 100% 100% 100% 100% 100% 100% 100% 100% 100% 100% 100% 100% 100% 100% 100%
Unweighted Total 526 76 71 114 124 141 80 121 210 176 349 94 31 377 236 290
Net: Very enthusiastic (8-10) 90 11 8 22 18 31 18 23 32 26 64 23 4 57 33 57_____________________________ 16% 14% 10% 20% 14% 21% 21% 18% 15% 14% 18% 24% 12% 14% 13% 19%
C
Net: (3-7) 338 52 50 65 86 84 50 71 141 118 219 59 24 240 151 186__________ 61% 64% 66% 59% 66% 56% 60% 55% 65% 63% 61% 60% 72% 61% 61% 62%
Net: Not enthusiastic (0-2) 108 17 17 22 25 27 11 29 43 34 73 14 5 84 59 49___________________________ 20% 21% 23% 20% 19% 18% 14% 23% 20% 18% 20% 15% 16% 21% 24% 16%
P
0-Not at all enthusiastic 60 9 13 10 15 14 8 11 23 19 39 11 4 44 34 2611% 11% 17% 9% 12% 9% 10% 8% 11% 10% 11% 11% 13% 11% 14% 9%
1 20 3 2 6 7 2 2 5 10 5 14 2 1 15 10 104% 4% 3% 5% 5% 1% 3% 4% 5% 3% 4% 2% 4% 4% 4% 3%
2 28 5 2 7 3 11 1 14 9 9 19 2 - 25 15 135% 6% 3% 6% 2% 8% 1% 11% 4% 5% 5% 2% 6% 6% 4%
E GI L
3 28 5 4 5 9 4 4 6 10 10 18 7 1 19 14 135% 6% 6% 4% 7% 3% 5% 5% 5% 6% 5% 7% 3% 5% 6% 4%
4 111 17 20 23 28 22 16 22 47 34 76 15 7 83 52 5820% 21% 27% 21% 21% 15% 19% 17% 22% 18% 21% 15% 22% 21% 21% 19%
F
5 72 15 13 10 18 16 10 16 32 23 48 10 4 55 37 3513% 18% 17% 9% 14% 11% 12% 13% 15% 12% 13% 10% 13% 14% 15% 12%
6 65 9 7 12 18 20 7 19 25 27 38 17 5 41 24 4112% 11% 9% 10% 13% 13% 8% 15% 12% 14% 11% 18% 16% 11% 10% 13%
7 62 6 5 15 14 22 13 7 27 24 39 10 6 41 23 3911% 8% 7% 14% 10% 14% 16% 6% 12% 13% 11% 10% 18% 11% 9% 13%
H H
8 29 6 4 7 5 7 3 4 13 6 22 5 1 20 13 165% 7% 6% 6% 4% 5% 4% 3% 6% 3% 6% 5% 4% 5% 5% 5%
24
Boston Globe Release Poll of Likely Voters in Massachusetts | June 8-10, 15-17, 2014
Total Sample
Designed and Directed by: SocialSphere Inc.
(A) (B) (C) (D) (E) (F) (G) (H) (I) (J) (K)
CentralMA
WesternMA
Comparison Groups: BCDEFGHIJK, Independent T-Test for Means (based on test for equal variances), Independent Z-Test for Percentages (unpooled proportions), Uppercase letters indicate significance at the 95% level.
Region
Metro-Boston
Inside128
NorthShore
MerrimackValley
Metro-West
South ofBoston
SouthShore
Cape &Islands and
SouthCoast
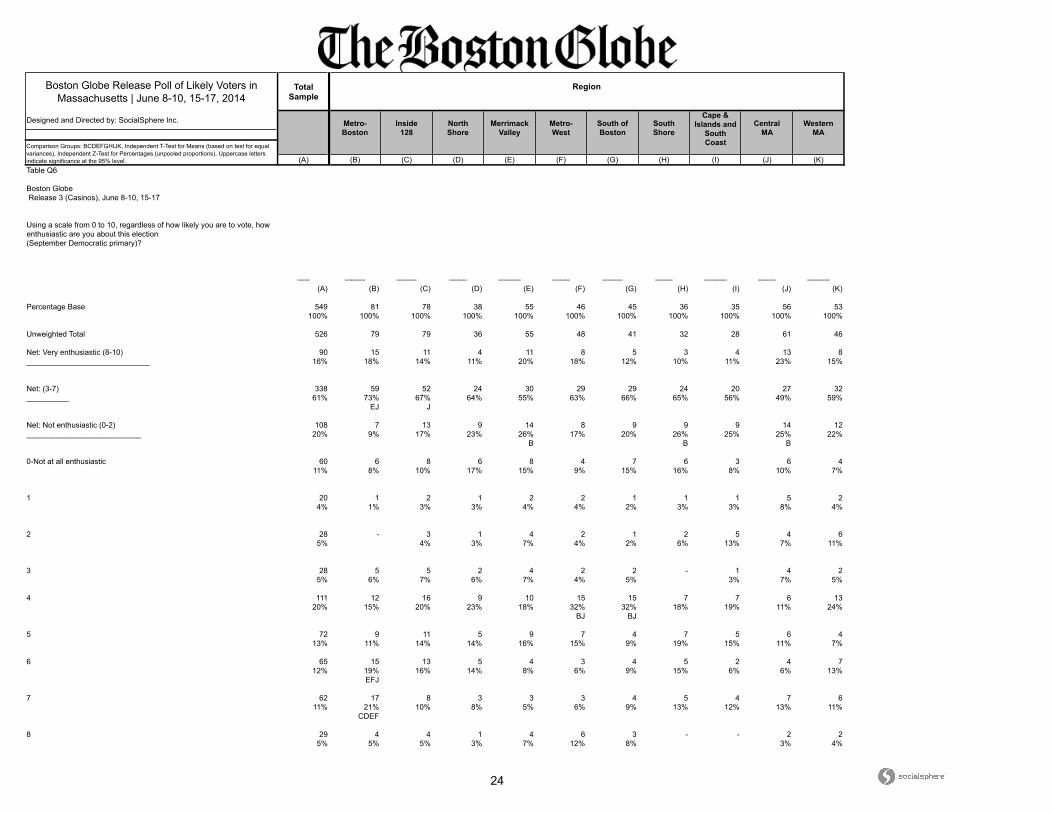
Table Q6
Boston Globe Release 3 (Casinos), June 8-10, 15-17
Using a scale from 0 to 10, regardless of how likely you are to vote, how enthusiastic are you about this election(September Democratic primary)?
----- -------- -------- ------- --------- ------- -------- ------- --------- ------- ---------
(A) (B) (C) (D) (E) (F) (G) (H) (I) (J) (K)
Percentage Base 549 81 78 38 55 46 45 36 35 56 53100% 100% 100% 100% 100% 100% 100% 100% 100% 100% 100%
Unweighted Total 526 79 79 36 55 48 41 32 28 61 46
Net: Very enthusiastic (8-10) 90 15 11 4 11 8 5 3 4 13 8_____________________________ 16% 18% 14% 11% 20% 18% 12% 10% 11% 23% 15%
Net: (3-7) 338 59 52 24 30 29 29 24 20 27 32__________ 61% 73% 67% 64% 55% 63% 66% 65% 56% 49% 59%
EJ J
Net: Not enthusiastic (0-2) 108 7 13 9 14 8 9 9 9 14 12___________________________ 20% 9% 17% 23% 26% 17% 20% 26% 25% 25% 22%
B B B
0-Not at all enthusiastic 60 6 8 6 8 4 7 6 3 6 411% 8% 10% 17% 15% 9% 15% 16% 8% 10% 7%
1 20 1 2 1 2 2 1 1 1 5 24% 1% 3% 3% 4% 4% 2% 3% 3% 8% 4%
2 28 - 3 1 4 2 1 2 5 4 65% 4% 3% 7% 4% 2% 6% 13% 7% 11%
3 28 5 5 2 4 2 2 - 1 4 25% 6% 7% 6% 7% 4% 5% 3% 7% 5%
4 111 12 16 9 10 15 15 7 7 6 1320% 15% 20% 23% 18% 32% 32% 18% 19% 11% 24%
BJ BJ
5 72 9 11 5 9 7 4 7 5 6 413% 11% 14% 14% 16% 15% 9% 19% 15% 11% 7%
6 65 15 13 5 4 3 4 5 2 4 712% 19% 16% 14% 8% 6% 9% 15% 6% 6% 13%
EFJ
7 62 17 8 3 3 3 4 5 4 7 611% 21% 10% 8% 5% 6% 9% 13% 12% 13% 11%
CDEF
8 29 4 4 1 4 6 3 - - 2 25% 5% 5% 3% 7% 12% 8% 3% 4%

25
Boston Globe Release Poll of Likely Voters in Massachusetts | June 8-10, 15-17, 2014
Total Sample
Designed and Directed by: SocialSphere Inc.
(A) (B) (C) (D) (E) (F) (G) (H) (I) (J) (K) (L) (M) (N) (O) (P)
Ideology Massachusetts
Definitely Probably Democrat Republican Falchuk Don't Know
Likelihood to Vote in General Election Party ID Candidate Vote
Liberal Moderate ConservativeRight
Directedion
Comparison Groups: BC/DEF/GHIJK/LMN/OP, Independent T-Test for Means (based on test for equal variances), Independent Z-Test for Percentages (unpooled proportions), Uppercase letters indicate significance at the 95% level.
Independent Coakley Baker McCormick Wrong Track
Using a scale from 0 to 10, regardless of how likely you are to vote, how enthusiastic are you about this election(September Democratic primary)?
9 44 42 2 22 - 22 21 11 2 1 9 13 15 15 21 148% 10% 2% 10% 6% 8% 8% 6% 34% 8% 6% 7% 13% 7% 8%
C
10-Extremely enthusiastic 18 17 1 10 - 8 9 5 2 - 2 8 7 3 9 93% 4% 1% 5% 2% 3% 4% 5% 2% 4% 3% 2% 3% 5%
C
Don't Know/Refused 13 9 4 4 - 9 4 2 3 - 4 6 6 1 5 52% 2% 4% 2% 3% 2% 2% 7% 4% 3% 3% 1% 2% 3%
Mean 5.83 6.03 5.08 6.83 - 5.22 6.41 5.21 5.28 6.71 5.36 6.32 5.61 5.47 6.27 5.19C F HIK MN P
26
Boston Globe Release Poll of Likely Voters in Massachusetts | June 8-10, 15-17, 2014
Total Sample
Designed and Directed by: SocialSphere Inc.
(A) (B) (C) (D) (E) (F) (G) (H) (I) (J) (K) (L) (M) (N) (O) (P)
Union Household Gender
18-34 35-44 45-54 55-64 Less than College College +
Age Income Education
Comparison Groups: BCDEF/GHI/JK/LMN/OP, Independent T-Test for Means (based on test for equal variances), Independent Z-Test for Percentages (unpooled proportions), Uppercase letters indicate significance at the 95% level.
65+ Less than $50K $50-$100K More than
$100K Public Private Neither Male Female
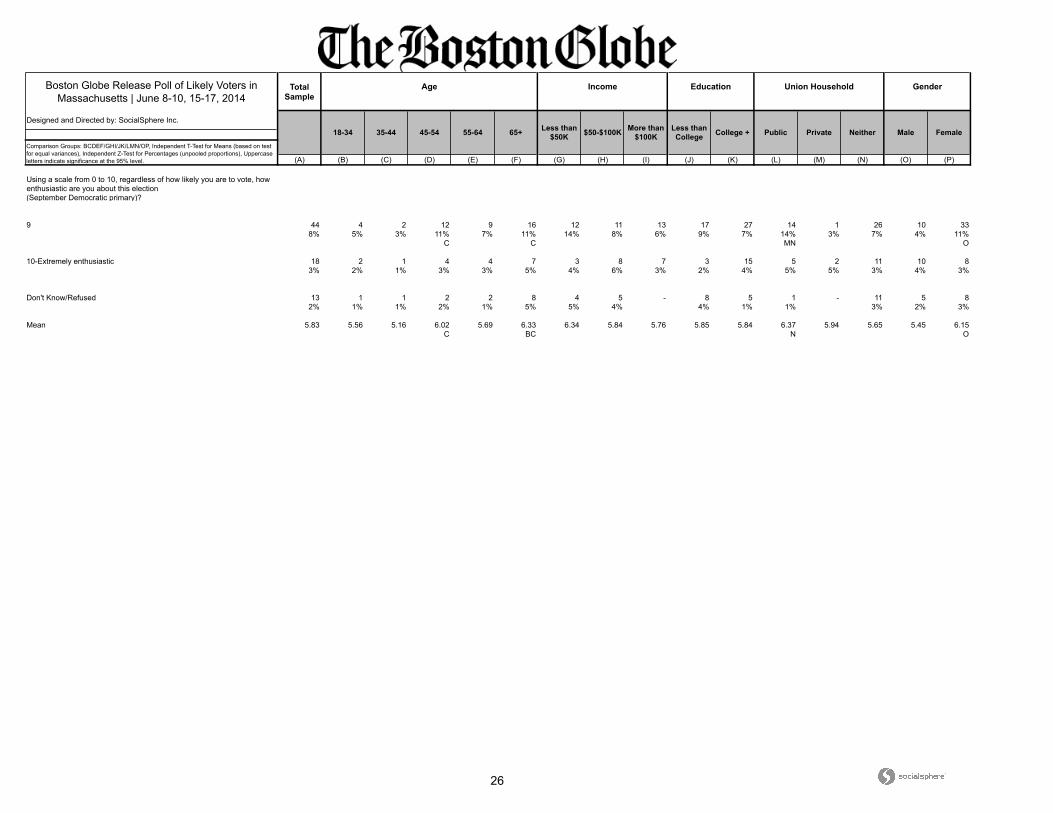
Using a scale from 0 to 10, regardless of how likely you are to vote, how enthusiastic are you about this election(September Democratic primary)?
9 44 4 2 12 9 16 12 11 13 17 27 14 1 26 10 338% 5% 3% 11% 7% 11% 14% 8% 6% 9% 7% 14% 3% 7% 4% 11%
C C MN O
10-Extremely enthusiastic 18 2 1 4 4 7 3 8 7 3 15 5 2 11 10 83% 2% 1% 3% 3% 5% 4% 6% 3% 2% 4% 5% 5% 3% 4% 3%
Don't Know/Refused 13 1 1 2 2 8 4 5 - 8 5 1 - 11 5 82% 1% 1% 2% 1% 5% 5% 4% 4% 1% 1% 3% 2% 3%
Mean 5.83 5.56 5.16 6.02 5.69 6.33 6.34 5.84 5.76 5.85 5.84 6.37 5.94 5.65 5.45 6.15C BC N O

27
Boston Globe Release Poll of Likely Voters in Massachusetts | June 8-10, 15-17, 2014
Total Sample
Designed and Directed by: SocialSphere Inc.
(A) (B) (C) (D) (E) (F) (G) (H) (I) (J) (K)
CentralMA
WesternMA
Comparison Groups: BCDEFGHIJK, Independent T-Test for Means (based on test for equal variances), Independent Z-Test for Percentages (unpooled proportions), Uppercase letters indicate significance at the 95% level.
Region
Metro-Boston
Inside128
NorthShore
MerrimackValley
Metro-West
South ofBoston
SouthShore
Cape &Islands and
SouthCoast
Using a scale from 0 to 10, regardless of how likely you are to vote, how enthusiastic are you about this election(September Democratic primary)?
9 44 7 6 1 5 2 2 3 3 7 38% 9% 8% 3% 9% 4% 4% 10% 8% 13% 6%
D
10-Extremely enthusiastic 18 3 1 2 2 1 - - 1 4 23% 4% 1% 5% 4% 2% 3% 7% 4%
Don't Know/Refused 13 - 2 1 - 1 1 - 3 2 22% 3% 3% 2% 2% 8% 4% 4%
Mean 5.83 6.60 5.80 5.34 5.50 5.67 5.32 5.48 5.55 6.01 5.77CDEFGH
28
Boston Globe Release Poll of Likely Voters in Massachusetts | June 8-10, 15-17, 2014
Total Sample
Designed and Directed by: SocialSphere Inc.
(A) (B) (C) (D) (E) (F) (G) (H) (I) (J) (K) (L) (M) (N) (O) (P)
Ideology Massachusetts
Definitely Probably Democrat Republican Falchuk Don't Know
Likelihood to Vote in General Election Party ID Candidate Vote
Liberal Moderate ConservativeRight
Directedion
Comparison Groups: BC/DEF/GHIJK/LMN/OP, Independent T-Test for Means (based on test for equal variances), Independent Z-Test for Percentages (unpooled proportions), Uppercase letters indicate significance at the 95% level.
Independent Coakley Baker McCormick Wrong Track
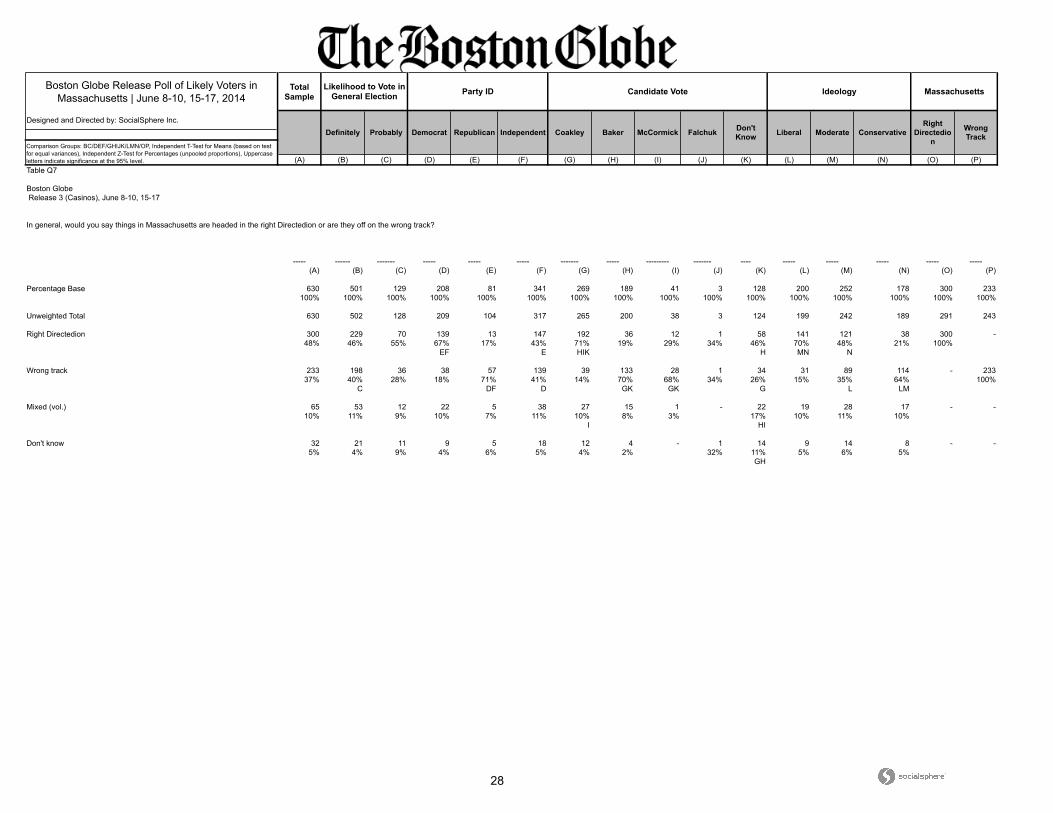
Table Q7
Boston Globe Release 3 (Casinos), June 8-10, 15-17
In general, would you say things in Massachusetts are headed in the right Directedion or are they off on the wrong track?
----- ------ ------- ----- ----- ----- ------- ----- --------- ------- ---- ----- ----- ----- ----- -----
(A) (B) (C) (D) (E) (F) (G) (H) (I) (J) (K) (L) (M) (N) (O) (P)
Percentage Base 630 501 129 208 81 341 269 189 41 3 128 200 252 178 300 233100% 100% 100% 100% 100% 100% 100% 100% 100% 100% 100% 100% 100% 100% 100% 100%
Unweighted Total 630 502 128 209 104 317 265 200 38 3 124 199 242 189 291 243
Right Directedion 300 229 70 139 13 147 192 36 12 1 58 141 121 38 300 -48% 46% 55% 67% 17% 43% 71% 19% 29% 34% 46% 70% 48% 21% 100%
EF E HIK H MN N
Wrong track 233 198 36 38 57 139 39 133 28 1 34 31 89 114 - 23337% 40% 28% 18% 71% 41% 14% 70% 68% 34% 26% 15% 35% 64% 100%
C DF D GK GK G L LM
Mixed (vol.) 65 53 12 22 5 38 27 15 1 - 22 19 28 17 - -10% 11% 9% 10% 7% 11% 10% 8% 3% 17% 10% 11% 10%
I HI
Don't know 32 21 11 9 5 18 12 4 - 1 14 9 14 8 - -5% 4% 9% 4% 6% 5% 4% 2% 32% 11% 5% 6% 5%
GH
29
Boston Globe Release Poll of Likely Voters in Massachusetts | June 8-10, 15-17, 2014
Total Sample
Designed and Directed by: SocialSphere Inc.
(A) (B) (C) (D) (E) (F) (G) (H) (I) (J) (K) (L) (M) (N) (O) (P)
Union Household Gender
18-34 35-44 45-54 55-64 Less than College College +
Age Income Education
Comparison Groups: BCDEF/GHI/JK/LMN/OP, Independent T-Test for Means (based on test for equal variances), Independent Z-Test for Percentages (unpooled proportions), Uppercase letters indicate significance at the 95% level.
65+ Less than $50K $50-$100K More than
$100K Public Private Neither Male Female
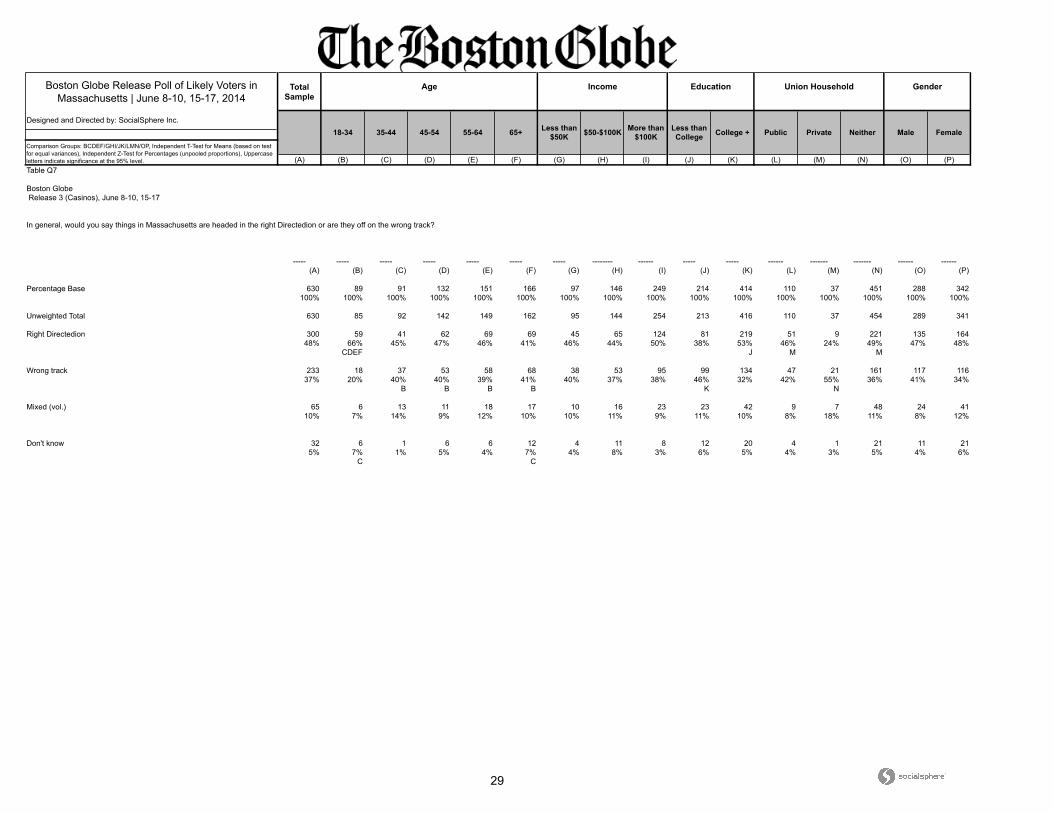
Table Q7
Boston Globe Release 3 (Casinos), June 8-10, 15-17
In general, would you say things in Massachusetts are headed in the right Directedion or are they off on the wrong track?
----- ----- ----- ----- ----- ----- ----- -------- ------ ----- ----- ------ ------- ------- ------ ------
(A) (B) (C) (D) (E) (F) (G) (H) (I) (J) (K) (L) (M) (N) (O) (P)
Percentage Base 630 89 91 132 151 166 97 146 249 214 414 110 37 451 288 342100% 100% 100% 100% 100% 100% 100% 100% 100% 100% 100% 100% 100% 100% 100% 100%
Unweighted Total 630 85 92 142 149 162 95 144 254 213 416 110 37 454 289 341
Right Directedion 300 59 41 62 69 69 45 65 124 81 219 51 9 221 135 16448% 66% 45% 47% 46% 41% 46% 44% 50% 38% 53% 46% 24% 49% 47% 48%
CDEF J M M
Wrong track 233 18 37 53 58 68 38 53 95 99 134 47 21 161 117 11637% 20% 40% 40% 39% 41% 40% 37% 38% 46% 32% 42% 55% 36% 41% 34%
B B B B K N
Mixed (vol.) 65 6 13 11 18 17 10 16 23 23 42 9 7 48 24 4110% 7% 14% 9% 12% 10% 10% 11% 9% 11% 10% 8% 18% 11% 8% 12%
Don't know 32 6 1 6 6 12 4 11 8 12 20 4 1 21 11 215% 7% 1% 5% 4% 7% 4% 8% 3% 6% 5% 4% 3% 5% 4% 6%
C C
30
Boston Globe Release Poll of Likely Voters in Massachusetts | June 8-10, 15-17, 2014
Total Sample
Designed and Directed by: SocialSphere Inc.
(A) (B) (C) (D) (E) (F) (G) (H) (I) (J) (K)
CentralMA
WesternMA
Comparison Groups: BCDEFGHIJK, Independent T-Test for Means (based on test for equal variances), Independent Z-Test for Percentages (unpooled proportions), Uppercase letters indicate significance at the 95% level.
Region
Metro-Boston
Inside128
NorthShore
MerrimackValley
Metro-West
South ofBoston
SouthShore
Cape &Islands and
SouthCoast
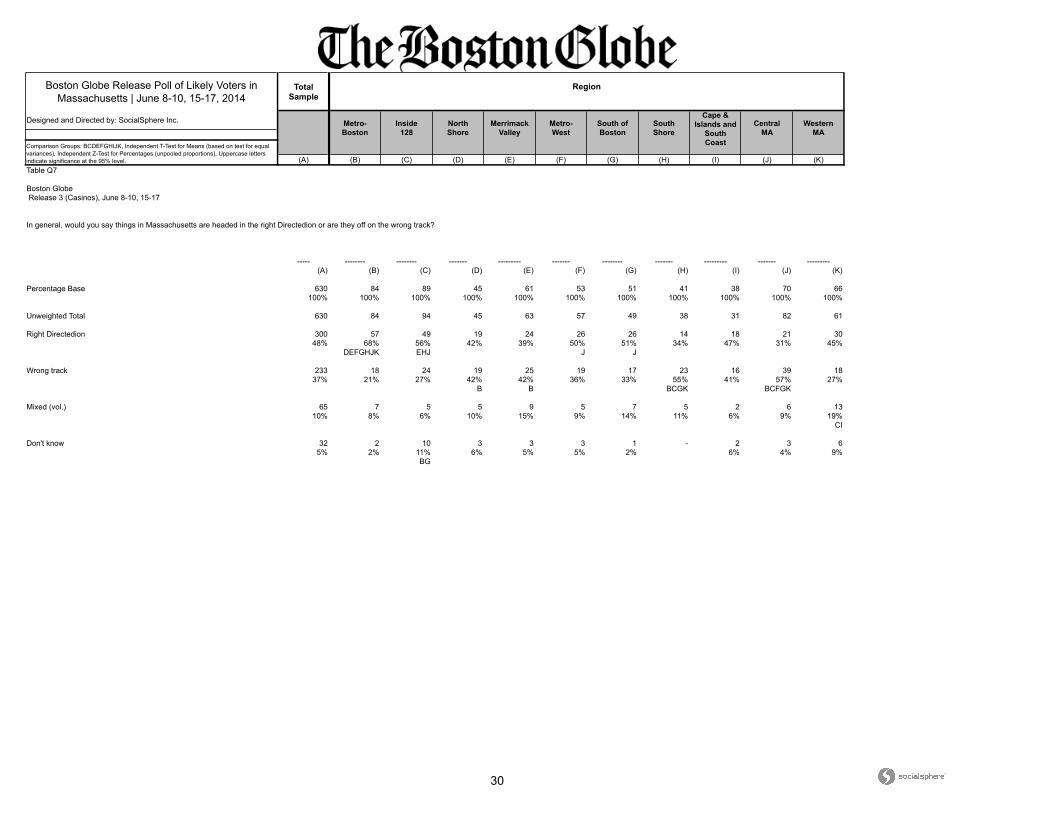
Table Q7
Boston Globe Release 3 (Casinos), June 8-10, 15-17
In general, would you say things in Massachusetts are headed in the right Directedion or are they off on the wrong track?
----- -------- -------- ------- --------- ------- -------- ------- --------- ------- ---------
(A) (B) (C) (D) (E) (F) (G) (H) (I) (J) (K)
Percentage Base 630 84 89 45 61 53 51 41 38 70 66100% 100% 100% 100% 100% 100% 100% 100% 100% 100% 100%
Unweighted Total 630 84 94 45 63 57 49 38 31 82 61
Right Directedion 300 57 49 19 24 26 26 14 18 21 3048% 68% 56% 42% 39% 50% 51% 34% 47% 31% 45%
DEFGHJK EHJ J J
Wrong track 233 18 24 19 25 19 17 23 16 39 1837% 21% 27% 42% 42% 36% 33% 55% 41% 57% 27%
B B BCGK BCFGK
Mixed (vol.) 65 7 5 5 9 5 7 5 2 6 1310% 8% 6% 10% 15% 9% 14% 11% 6% 9% 19%
CI
Don't know 32 2 10 3 3 3 1 - 2 3 65% 2% 11% 6% 5% 5% 2% 6% 4% 9%
BG

31
Boston Globe Release Poll of Likely Voters in Massachusetts | June 8-10, 15-17, 2014
Total Sample
Designed and Directed by: SocialSphere Inc.
(A) (B) (C) (D) (E) (F) (G) (H) (I) (J) (K) (L) (M) (N) (O) (P)
Ideology Massachusetts
Definitely Probably Democrat Republican Falchuk Don't Know
Likelihood to Vote in General Election Party ID Candidate Vote
Liberal Moderate ConservativeRight
Directedion
Comparison Groups: BC/DEF/GHIJK/LMN/OP, Independent T-Test for Means (based on test for equal variances), Independent Z-Test for Percentages (unpooled proportions), Uppercase letters indicate significance at the 95% level.
Independent Coakley Baker McCormick Wrong Track
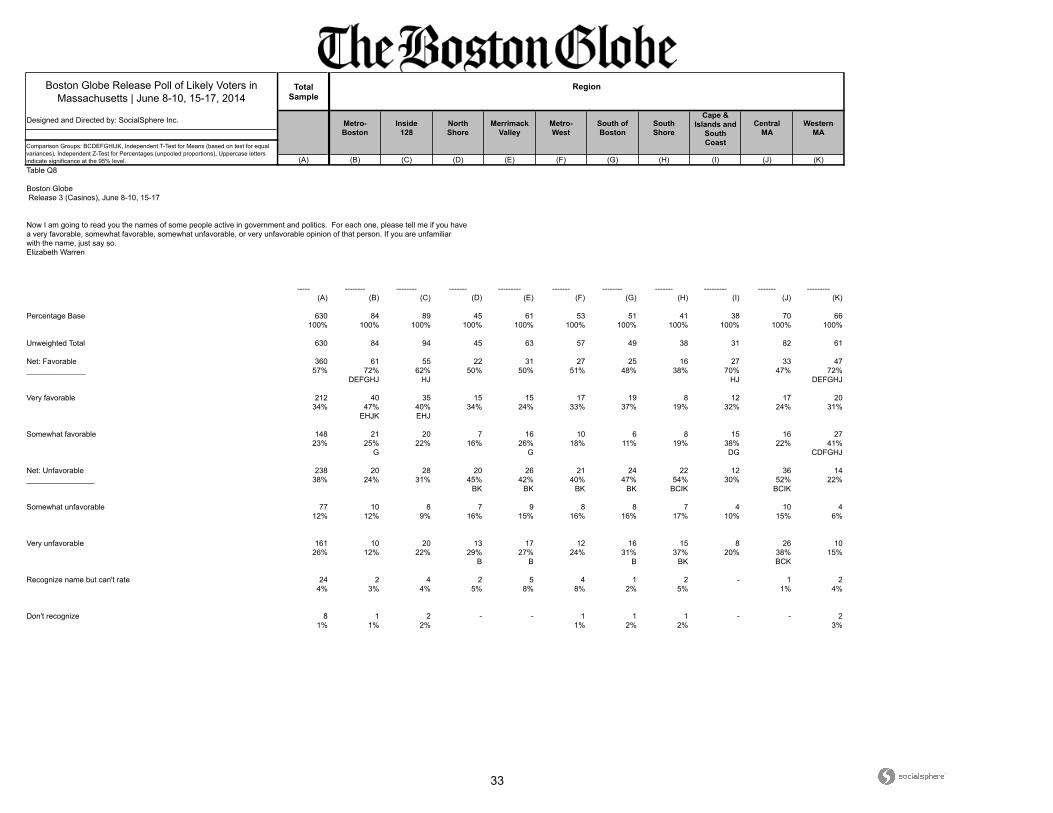
Table Q8
Boston Globe Release 3 (Casinos), June 8-10, 15-17
Now I am going to read you the names of some people active in government and politics. For each one, please tell me if you have a very favorable, somewhat favorable, somewhat unfavorable, or very unfavorable opinion of that person. If you are unfamiliar with the name, just say so.Elizabeth Warren
----- ------ ------- ----- ----- ----- ------- ----- --------- ------- ---- ----- ----- ----- ----- -----
(A) (B) (C) (D) (E) (F) (G) (H) (I) (J) (K) (L) (M) (N) (O) (P)
Percentage Base 630 501 129 208 81 341 269 189 41 3 128 200 252 178 300 233100% 100% 100% 100% 100% 100% 100% 100% 100% 100% 100% 100% 100% 100% 100% 100%
Unweighted Total 630 502 128 209 104 317 265 200 38 3 124 199 242 189 291 243
Net: Favorable 360 290 70 181 11 169 241 36 11 1 71 170 143 47 241 57______________ 57% 58% 54% 87% 13% 50% 89% 19% 28% 32% 55% 85% 57% 27% 80% 24%
EF E HIJK HI MN N P
Very favorable 212 183 29 132 3 77 170 12 5 1 24 133 62 17 160 2434% 37% 23% 64% 4% 23% 63% 6% 12% 32% 19% 66% 25% 10% 53% 10%
C EF E HIK H MN N P
Somewhat favorable 148 107 41 48 8 92 70 24 7 - 46 37 81 30 81 3323% 21% 32% 23% 10% 27% 26% 13% 16% 36% 19% 32% 17% 27% 14%
B E E H HI LN P
Net: Unfavorable 238 193 45 22 67 149 24 148 25 2 39 27 90 121 44 171________________ 38% 38% 35% 11% 83% 44% 9% 78% 61% 68% 30% 14% 36% 68% 15% 73%
DF D GIK GK G G L LM O
Somewhat unfavorable 77 55 22 18 12 48 13 32 8 2 21 16 40 20 24 4312% 11% 17% 8% 15% 14% 5% 17% 20% 68% 16% 8% 16% 12% 8% 18%
D G G G G L O
Very unfavorable 161 138 23 5 55 101 11 115 17 - 18 11 49 101 20 12826% 28% 18% 2% 69% 30% 4% 61% 41% 14% 5% 20% 57% 7% 55%
C DF D GIK GK G L LM O
Recognize name but can't rate 24 14 9 2 1 20 3 4 2 - 14 1 16 6 12 34% 3% 7% 1% 2% 6% 1% 2% 6% 11% 1% 6% 3% 4% 1%
DE GH L L
Don't recognize 8 4 4 3 2 3 1 1 2 - 4 2 3 3 3 31% 1% 3% 2% 2% 1% 0% 0% 5% 3% 1% 1% 2% 1% 1%

32
Boston Globe Release Poll of Likely Voters in Massachusetts | June 8-10, 15-17, 2014
Total Sample
Designed and Directed by: SocialSphere Inc.
(A) (B) (C) (D) (E) (F) (G) (H) (I) (J) (K) (L) (M) (N) (O) (P)
Union Household Gender
18-34 35-44 45-54 55-64 Less than College College +
Age Income Education
Comparison Groups: BCDEF/GHI/JK/LMN/OP, Independent T-Test for Means (based on test for equal variances), Independent Z-Test for Percentages (unpooled proportions), Uppercase letters indicate significance at the 95% level.
65+ Less than $50K $50-$100K More than
$100K Public Private Neither Male Female
Table Q8
Boston Globe Release 3 (Casinos), June 8-10, 15-17
Now I am going to read you the names of some people active in government and politics. For each one, please tell me if you have a very favorable, somewhat favorable, somewhat unfavorable, or very unfavorable opinion of that person. If you are unfamiliar with the name, just say so.Elizabeth Warren
----- ----- ----- ----- ----- ----- ----- -------- ------ ----- ----- ------ ------- ------- ------ ------
(A) (B) (C) (D) (E) (F) (G) (H) (I) (J) (K) (L) (M) (N) (O) (P)
Percentage Base 630 89 91 132 151 166 97 146 249 214 414 110 37 451 288 342100% 100% 100% 100% 100% 100% 100% 100% 100% 100% 100% 100% 100% 100% 100% 100%
Unweighted Total 630 85 92 142 149 162 95 144 254 213 416 110 37 454 289 341
Net: Favorable 360 53 50 72 85 100 63 87 133 115 245 57 16 268 131 229______________ 57% 60% 54% 54% 56% 60% 65% 60% 53% 54% 59% 51% 43% 59% 46% 67%
I O
Very favorable 212 29 18 43 53 69 40 51 80 56 156 35 8 159 80 13234% 33% 19% 33% 35% 42% 42% 35% 32% 26% 38% 31% 21% 35% 28% 39%
C C C C J M O
Somewhat favorable 148 24 32 29 32 31 23 36 53 59 89 22 8 109 51 9723% 27% 35% 22% 21% 19% 24% 25% 21% 28% 21% 20% 22% 24% 18% 28%
DEF O
Net: Unfavorable 238 28 36 51 63 59 26 55 104 90 146 48 19 163 140 98________________ 38% 32% 40% 39% 42% 36% 27% 37% 42% 42% 35% 44% 52% 36% 49% 29%
G P
Somewhat unfavorable 77 13 14 13 17 21 9 14 36 28 49 15 4 56 41 3512% 14% 15% 10% 11% 12% 10% 10% 14% 13% 12% 13% 11% 13% 14% 10%
Very unfavorable 161 16 22 38 46 39 17 40 68 62 98 34 15 107 99 6226% 18% 24% 29% 30% 23% 18% 27% 27% 29% 24% 30% 40% 24% 34% 18%
B B N P
Recognize name but can't rate 24 5 4 7 3 4 3 4 11 6 18 4 1 15 12 114% 6% 5% 5% 2% 2% 3% 3% 4% 3% 4% 4% 3% 3% 4% 3%
Don't recognize 8 2 1 2 - 3 4 - 1 3 5 1 1 5 4 41% 3% 1% 1% 2% 4% 0% 1% 1% 1% 3% 1% 1% 1%
33
Boston Globe Release Poll of Likely Voters in Massachusetts | June 8-10, 15-17, 2014
Total Sample
Designed and Directed by: SocialSphere Inc.
(A) (B) (C) (D) (E) (F) (G) (H) (I) (J) (K)
CentralMA
WesternMA
Comparison Groups: BCDEFGHIJK, Independent T-Test for Means (based on test for equal variances), Independent Z-Test for Percentages (unpooled proportions), Uppercase letters indicate significance at the 95% level.
Region
Metro-Boston
Inside128
NorthShore
MerrimackValley
Metro-West
South ofBoston
SouthShore
Cape &Islands and
SouthCoast
Table Q8
Boston Globe Release 3 (Casinos), June 8-10, 15-17
Now I am going to read you the names of some people active in government and politics. For each one, please tell me if you have a very favorable, somewhat favorable, somewhat unfavorable, or very unfavorable opinion of that person. If you are unfamiliar with the name, just say so.Elizabeth Warren
----- -------- -------- ------- --------- ------- -------- ------- --------- ------- ---------
(A) (B) (C) (D) (E) (F) (G) (H) (I) (J) (K)
Percentage Base 630 84 89 45 61 53 51 41 38 70 66100% 100% 100% 100% 100% 100% 100% 100% 100% 100% 100%
Unweighted Total 630 84 94 45 63 57 49 38 31 82 61
Net: Favorable 360 61 55 22 31 27 25 16 27 33 47______________ 57% 72% 62% 50% 50% 51% 48% 38% 70% 47% 72%
DEFGHJ HJ HJ DEFGHJ
Very favorable 212 40 35 15 15 17 19 8 12 17 2034% 47% 40% 34% 24% 33% 37% 19% 32% 24% 31%
EHJK EHJ
Somewhat favorable 148 21 20 7 16 10 6 8 15 16 2723% 25% 22% 16% 26% 18% 11% 19% 38% 22% 41%
G G DG CDFGHJ
Net: Unfavorable 238 20 28 20 26 21 24 22 12 36 14________________ 38% 24% 31% 45% 42% 40% 47% 54% 30% 52% 22%
BK BK BK BK BCIK BCIK
Somewhat unfavorable 77 10 8 7 9 8 8 7 4 10 412% 12% 9% 16% 15% 16% 16% 17% 10% 15% 6%
Very unfavorable 161 10 20 13 17 12 16 15 8 26 1026% 12% 22% 29% 27% 24% 31% 37% 20% 38% 15%
B B B BK BCK
Recognize name but can't rate 24 2 4 2 5 4 1 2 - 1 24% 3% 4% 5% 8% 8% 2% 5% 1% 4%
Don't recognize 8 1 2 - - 1 1 1 - - 21% 1% 2% 1% 2% 2% 3%

34
Boston Globe Release Poll of Likely Voters in Massachusetts | June 8-10, 15-17, 2014
Total Sample
Designed and Directed by: SocialSphere Inc.
(A) (B) (C) (D) (E) (F) (G) (H) (I) (J) (K) (L) (M) (N) (O) (P)
Ideology Massachusetts
Definitely Probably Democrat Republican Falchuk Don't Know
Likelihood to Vote in General Election Party ID Candidate Vote
Liberal Moderate ConservativeRight
Directedion
Comparison Groups: BC/DEF/GHIJK/LMN/OP, Independent T-Test for Means (based on test for equal variances), Independent Z-Test for Percentages (unpooled proportions), Uppercase letters indicate significance at the 95% level.
Independent Coakley Baker McCormick Wrong Track
Table Q9
Boston Globe Release 3 (Casinos), June 8-10, 15-17
Now I am going to read you the names of some people active in government and politics. For each one, please tell me if you have a very favorable, somewhat favorable, somewhat unfavorable, or very unfavorable opinion of that person. If you are unfamiliar with the name, just say so.Charlie Baker
----- ------ ------- ----- ----- ----- ------- ----- --------- ------- ---- ----- ----- ----- ----- -----
(A) (B) (C) (D) (E) (F) (G) (H) (I) (J) (K) (L) (M) (N) (O) (P)
Percentage Base 630 501 129 208 81 341 269 189 41 3 128 200 252 178 300 233100% 100% 100% 100% 100% 100% 100% 100% 100% 100% 100% 100% 100% 100% 100% 100%
Unweighted Total 630 502 128 209 104 317 265 200 38 3 124 199 242 189 291 243
Net: Favorable 266 224 43 61 48 157 75 145 11 1 35 58 109 100 94 137______________ 42% 45% 33% 29% 60% 46% 28% 77% 28% 34% 27% 29% 43% 56% 31% 59%
C DF D GIK L LM O
Very favorable 68 63 5 9 19 39 6 56 1 - 5 11 25 32 13 4911% 13% 4% 5% 24% 12% 2% 30% 3% 4% 6% 10% 18% 4% 21%
C DF D GIK LM O
Somewhat favorable 199 161 38 52 29 117 69 89 10 1 29 47 84 68 81 8832% 32% 29% 25% 37% 34% 26% 47% 25% 34% 23% 23% 33% 38% 27% 38%
D D GIK L L O
Net: Unfavorable 132 113 19 68 7 57 88 20 9 - 16 67 42 23 86 33________________ 21% 23% 15% 33% 8% 17% 33% 11% 21% 12% 33% 17% 13% 29% 14%
C EF E HK MN P
Somewhat unfavorable 94 81 14 43 7 44 59 17 5 - 13 42 35 17 61 2515% 16% 11% 21% 8% 13% 22% 9% 13% 10% 21% 14% 10% 20% 11%
EF HK N P
Very unfavorable 38 33 5 25 - 13 29 3 3 - 3 25 7 6 25 86% 7% 4% 12% 4% 11% 1% 8% 3% 12% 3% 3% 8% 3%
F HK MN P
Recognize name but can't rate 92 66 26 27 10 54 39 14 9 - 30 31 38 22 44 3115% 13% 20% 13% 13% 16% 14% 7% 22% 24% 15% 15% 13% 15% 13%
H H GH
Don't recognize 140 98 42 52 15 73 69 10 12 2 47 45 62 33 76 3322% 19% 33% 25% 19% 21% 25% 5% 29% 66% 37% 22% 25% 18% 25% 14%
B H H H GH P

35
Boston Globe Release Poll of Likely Voters in Massachusetts | June 8-10, 15-17, 2014
Total Sample
Designed and Directed by: SocialSphere Inc.
(A) (B) (C) (D) (E) (F) (G) (H) (I) (J) (K) (L) (M) (N) (O) (P)
Union Household Gender
18-34 35-44 45-54 55-64 Less than College College +
Age Income Education
Comparison Groups: BCDEF/GHI/JK/LMN/OP, Independent T-Test for Means (based on test for equal variances), Independent Z-Test for Percentages (unpooled proportions), Uppercase letters indicate significance at the 95% level.
65+ Less than $50K $50-$100K More than
$100K Public Private Neither Male Female
Table Q9
Boston Globe Release 3 (Casinos), June 8-10, 15-17
Now I am going to read you the names of some people active in government and politics. For each one, please tell me if you have a very favorable, somewhat favorable, somewhat unfavorable, or very unfavorable opinion of that person. If you are unfamiliar with the name, just say so.Charlie Baker
----- ----- ----- ----- ----- ----- ----- -------- ------ ----- ----- ------ ------- ------- ------ ------
(A) (B) (C) (D) (E) (F) (G) (H) (I) (J) (K) (L) (M) (N) (O) (P)
Percentage Base 630 89 91 132 151 166 97 146 249 214 414 110 37 451 288 342100% 100% 100% 100% 100% 100% 100% 100% 100% 100% 100% 100% 100% 100% 100% 100%
Unweighted Total 630 85 92 142 149 162 95 144 254 213 416 110 37 454 289 341
Net: Favorable 266 27 36 58 79 66 27 68 119 91 175 46 17 192 133 133______________ 42% 30% 40% 44% 52% 40% 28% 46% 48% 43% 42% 41% 46% 43% 46% 39%
B BF G G
Very favorable 68 4 6 19 20 19 7 13 33 25 42 11 3 51 31 3711% 4% 7% 14% 13% 12% 8% 9% 13% 12% 10% 10% 8% 11% 11% 11%
B B B
Somewhat favorable 199 23 30 39 59 47 20 54 86 66 133 34 14 142 102 9732% 26% 33% 30% 39% 28% 20% 37% 35% 31% 32% 31% 38% 31% 36% 28%
BF G G
Net: Unfavorable 132 18 18 24 31 41 11 28 62 23 109 25 10 95 71 61________________ 21% 20% 20% 18% 21% 25% 12% 19% 25% 11% 26% 23% 27% 21% 25% 18%
G J P
Somewhat unfavorable 94 10 15 20 22 27 5 22 45 16 78 16 5 72 52 4215% 12% 17% 15% 15% 16% 5% 15% 18% 8% 19% 14% 14% 16% 18% 12%
G G J P
Very unfavorable 38 7 3 5 9 14 6 6 17 7 31 10 5 22 19 196% 8% 3% 4% 6% 8% 6% 4% 7% 3% 7% 9% 13% 5% 7% 5%
J
Recognize name but can't rate 92 11 18 24 16 23 16 22 33 32 59 23 5 59 31 6015% 12% 19% 18% 11% 14% 17% 15% 13% 15% 14% 21% 12% 13% 11% 18%
O
Don't recognize 140 34 19 26 25 36 42 28 36 68 71 17 6 105 52 8822% 38% 21% 19% 16% 22% 44% 19% 14% 32% 17% 15% 15% 23% 18% 26%
CDEF HI K L O

36
Boston Globe Release Poll of Likely Voters in Massachusetts | June 8-10, 15-17, 2014
Total Sample
Designed and Directed by: SocialSphere Inc.
(A) (B) (C) (D) (E) (F) (G) (H) (I) (J) (K)
CentralMA
WesternMA
Comparison Groups: BCDEFGHIJK, Independent T-Test for Means (based on test for equal variances), Independent Z-Test for Percentages (unpooled proportions), Uppercase letters indicate significance at the 95% level.
Region
Metro-Boston
Inside128
NorthShore
MerrimackValley
Metro-West
South ofBoston
SouthShore
Cape &Islands and
SouthCoast
Table Q9
Boston Globe Release 3 (Casinos), June 8-10, 15-17
Now I am going to read you the names of some people active in government and politics. For each one, please tell me if you have a very favorable, somewhat favorable, somewhat unfavorable, or very unfavorable opinion of that person. If you are unfamiliar with the name, just say so.Charlie Baker
----- -------- -------- ------- --------- ------- -------- ------- --------- ------- ---------
(A) (B) (C) (D) (E) (F) (G) (H) (I) (J) (K)
Percentage Base 630 84 89 45 61 53 51 41 38 70 66100% 100% 100% 100% 100% 100% 100% 100% 100% 100% 100%
Unweighted Total 630 84 94 45 63 57 49 38 31 82 61
Net: Favorable 266 35 45 26 28 22 19 23 12 32 13______________ 42% 41% 51% 58% 46% 41% 38% 56% 32% 47% 20%
K K GIK K K K IK K
Very favorable 68 10 10 8 4 6 4 8 2 10 411% 12% 11% 17% 6% 12% 8% 19% 6% 14% 7%
Somewhat favorable 199 24 35 18 25 16 15 15 10 23 932% 29% 40% 41% 40% 30% 30% 37% 26% 33% 13%
K K K K K K K K
Net: Unfavorable 132 25 14 12 13 13 18 2 4 14 5________________ 21% 30% 16% 26% 21% 25% 35% 5% 10% 20% 8%
CHIK H HK HK HK CHIK HK
Somewhat unfavorable 94 18 11 8 11 9 9 1 3 9 315% 22% 13% 19% 18% 18% 18% 3% 7% 14% 4%
HIK H HK HK HK HK HK
Very unfavorable 38 7 3 3 2 4 9 1 1 4 26% 8% 3% 7% 3% 7% 17% 3% 3% 6% 4%
CEHIK
Recognize name but can't rate 92 10 10 3 11 9 3 8 9 9 1315% 12% 12% 6% 18% 17% 6% 20% 23% 14% 20%
G G DG
Don't recognize 140 15 19 4 9 9 11 8 13 14 3422% 17% 21% 10% 14% 17% 22% 19% 35% 20% 52%
D DE BCDEFGHJ

37
Boston Globe Release Poll of Likely Voters in Massachusetts | June 8-10, 15-17, 2014
Total Sample
Designed and Directed by: SocialSphere Inc.
(A) (B) (C) (D) (E) (F) (G) (H) (I) (J) (K) (L) (M) (N) (O) (P)
Ideology Massachusetts
Definitely Probably Democrat Republican Falchuk Don't Know
Likelihood to Vote in General Election Party ID Candidate Vote
Liberal Moderate ConservativeRight
Directedion
Comparison Groups: BC/DEF/GHIJK/LMN/OP, Independent T-Test for Means (based on test for equal variances), Independent Z-Test for Percentages (unpooled proportions), Uppercase letters indicate significance at the 95% level.
Independent Coakley Baker McCormick Wrong Track
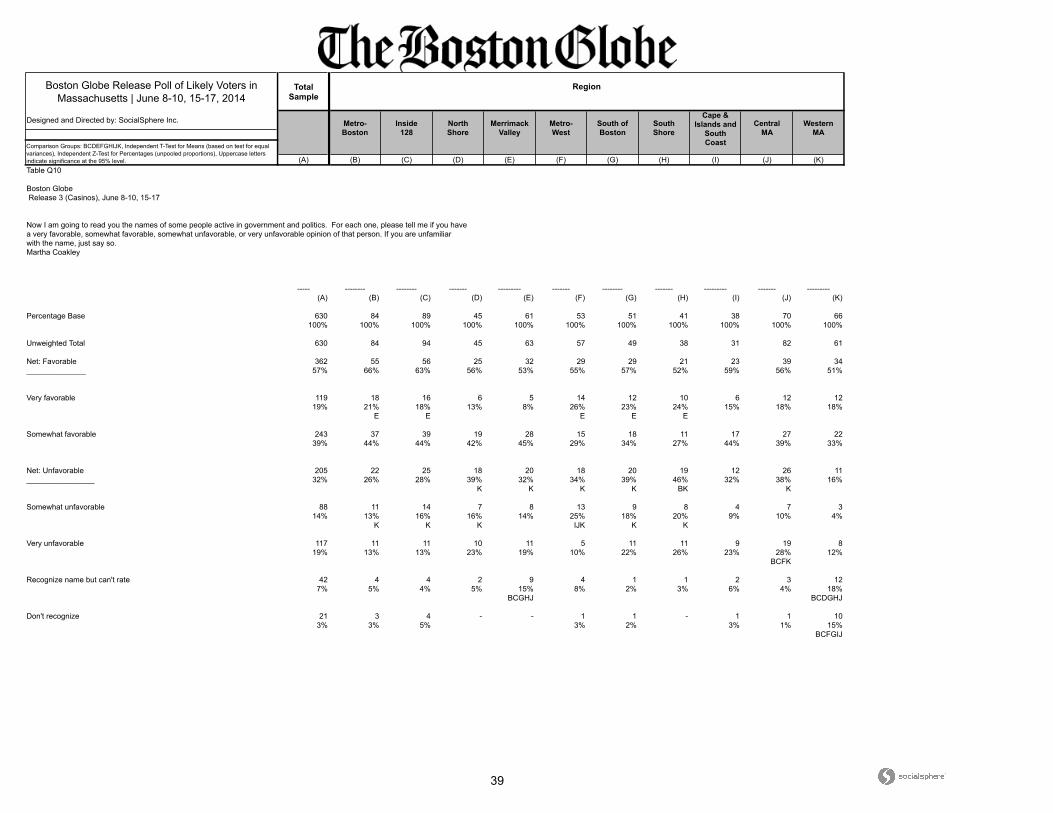
Table Q10
Boston Globe Release 3 (Casinos), June 8-10, 15-17
Now I am going to read you the names of some people active in government and politics. For each one, please tell me if you have a very favorable, somewhat favorable, somewhat unfavorable, or very unfavorable opinion of that person. If you are unfamiliar with the name, just say so.Martha Coakley
----- ------ ------- ----- ----- ----- ------- ----- --------- ------- ---- ----- ----- ----- ----- -----
(A) (B) (C) (D) (E) (F) (G) (H) (I) (J) (K) (L) (M) (N) (O) (P)
Percentage Base 630 501 129 208 81 341 269 189 41 3 128 200 252 178 300 233100% 100% 100% 100% 100% 100% 100% 100% 100% 100% 100% 100% 100% 100% 100% 100%
Unweighted Total 630 502 128 209 104 317 265 200 38 3 124 199 242 189 291 243
Net: Favorable 362 293 69 168 16 178 246 44 9 2 61 156 144 62 227 77______________ 57% 59% 54% 81% 19% 52% 91% 23% 22% 66% 48% 78% 57% 35% 76% 33%
EF E HIK HI MN N P
Very favorable 119 99 20 73 4 43 101 4 2 1 11 62 42 15 89 1619% 20% 15% 35% 5% 13% 38% 2% 4% 34% 9% 31% 17% 8% 30% 7%
EF E HIK H MN N P
Somewhat favorable 243 194 49 96 12 135 145 40 7 1 50 94 102 47 138 6239% 39% 38% 46% 15% 40% 54% 21% 18% 32% 39% 47% 41% 27% 46% 26%
E E HIK HI N N P
Net: Unfavorable 205 171 34 27 54 123 9 135 28 1 32 30 76 98 40 148________________ 32% 34% 26% 13% 67% 36% 3% 72% 68% 34% 25% 15% 30% 55% 13% 63%
DF D GK GK G L LM O
Somewhat unfavorable 88 68 19 18 15 55 7 54 12 1 14 18 44 26 28 5214% 14% 15% 9% 19% 16% 3% 29% 29% 34% 11% 9% 17% 15% 9% 22%
D D GK GK G L O
Very unfavorable 117 102 14 9 39 69 2 81 16 - 18 12 32 72 13 9619% 20% 11% 4% 49% 20% 1% 43% 39% 14% 6% 13% 41% 4% 41%
C DF D GK GK G L LM O
Recognize name but can't rate 42 29 13 7 6 28 12 7 1 - 22 8 25 9 22 57% 6% 10% 4% 7% 8% 4% 4% 2% 17% 4% 10% 5% 7% 2%
D GHI L P
Don't recognize 21 8 14 5 5 11 2 3 3 - 13 7 6 8 10 43% 2% 11% 3% 6% 3% 1% 1% 8% 10% 3% 3% 5% 3% 2%
B GH

38
Boston Globe Release Poll of Likely Voters in Massachusetts | June 8-10, 15-17, 2014
Total Sample
Designed and Directed by: SocialSphere Inc.
(A) (B) (C) (D) (E) (F) (G) (H) (I) (J) (K) (L) (M) (N) (O) (P)
Union Household Gender
18-34 35-44 45-54 55-64 Less than College College +
Age Income Education
Comparison Groups: BCDEF/GHI/JK/LMN/OP, Independent T-Test for Means (based on test for equal variances), Independent Z-Test for Percentages (unpooled proportions), Uppercase letters indicate significance at the 95% level.
65+ Less than $50K $50-$100K More than
$100K Public Private Neither Male Female
Table Q10
Boston Globe Release 3 (Casinos), June 8-10, 15-17
Now I am going to read you the names of some people active in government and politics. For each one, please tell me if you have a very favorable, somewhat favorable, somewhat unfavorable, or very unfavorable opinion of that person. If you are unfamiliar with the name, just say so.Martha Coakley
----- ----- ----- ----- ----- ----- ----- -------- ------ ----- ----- ------ ------- ------- ------ ------
(A) (B) (C) (D) (E) (F) (G) (H) (I) (J) (K) (L) (M) (N) (O) (P)
Percentage Base 630 89 91 132 151 166 97 146 249 214 414 110 37 451 288 342100% 100% 100% 100% 100% 100% 100% 100% 100% 100% 100% 100% 100% 100% 100% 100%
Unweighted Total 630 85 92 142 149 162 95 144 254 213 416 110 37 454 289 341
Net: Favorable 362 46 52 72 87 106 64 83 138 116 246 64 19 262 130 232______________ 57% 51% 57% 54% 57% 64% 66% 57% 55% 54% 59% 58% 52% 58% 45% 68%
O
Very favorable 119 13 17 23 27 39 23 24 46 36 83 28 5 80 42 7719% 15% 18% 17% 18% 23% 24% 17% 19% 17% 20% 25% 13% 18% 15% 23%
O
Somewhat favorable 243 32 35 48 59 68 42 59 91 80 163 36 15 183 88 15539% 36% 39% 37% 39% 41% 43% 40% 37% 37% 39% 33% 39% 40% 31% 45%
O
Net: Unfavorable 205 24 31 47 57 47 20 47 93 69 134 39 15 145 136 68________________ 32% 26% 33% 35% 38% 28% 20% 33% 37% 32% 32% 36% 39% 32% 47% 20%
G G P
Somewhat unfavorable 88 14 13 18 22 21 9 20 39 26 61 12 4 70 59 2914% 16% 15% 13% 15% 12% 9% 14% 16% 12% 15% 11% 12% 15% 21% 8%
P
Very unfavorable 117 9 17 29 35 26 11 27 54 43 73 27 10 75 77 4019% 10% 19% 22% 23% 16% 11% 19% 22% 20% 18% 25% 28% 17% 27% 12%
B B G P
Recognize name but can't rate 42 8 7 12 6 9 3 9 17 18 23 6 2 26 13 297% 8% 8% 9% 4% 6% 3% 6% 7% 9% 6% 6% 5% 6% 5% 8%
O
Don't recognize 21 12 2 2 1 4 9 6 1 11 10 1 1 18 9 123% 14% 2% 2% 1% 2% 10% 4% 0% 5% 3% 1% 3% 4% 3% 4%
CDEF I I L
39
Boston Globe Release Poll of Likely Voters in Massachusetts | June 8-10, 15-17, 2014
Total Sample
Designed and Directed by: SocialSphere Inc.
(A) (B) (C) (D) (E) (F) (G) (H) (I) (J) (K)
CentralMA
WesternMA
Comparison Groups: BCDEFGHIJK, Independent T-Test for Means (based on test for equal variances), Independent Z-Test for Percentages (unpooled proportions), Uppercase letters indicate significance at the 95% level.
Region
Metro-Boston
Inside128
NorthShore
MerrimackValley
Metro-West
South ofBoston
SouthShore
Cape &Islands and
SouthCoast
Table Q10
Boston Globe Release 3 (Casinos), June 8-10, 15-17
Now I am going to read you the names of some people active in government and politics. For each one, please tell me if you have a very favorable, somewhat favorable, somewhat unfavorable, or very unfavorable opinion of that person. If you are unfamiliar with the name, just say so.Martha Coakley
----- -------- -------- ------- --------- ------- -------- ------- --------- ------- ---------
(A) (B) (C) (D) (E) (F) (G) (H) (I) (J) (K)
Percentage Base 630 84 89 45 61 53 51 41 38 70 66100% 100% 100% 100% 100% 100% 100% 100% 100% 100% 100%
Unweighted Total 630 84 94 45 63 57 49 38 31 82 61
Net: Favorable 362 55 56 25 32 29 29 21 23 39 34______________ 57% 66% 63% 56% 53% 55% 57% 52% 59% 56% 51%
Very favorable 119 18 16 6 5 14 12 10 6 12 1219% 21% 18% 13% 8% 26% 23% 24% 15% 18% 18%
E E E E E
Somewhat favorable 243 37 39 19 28 15 18 11 17 27 2239% 44% 44% 42% 45% 29% 34% 27% 44% 39% 33%
Net: Unfavorable 205 22 25 18 20 18 20 19 12 26 11________________ 32% 26% 28% 39% 32% 34% 39% 46% 32% 38% 16%
K K K K BK K
Somewhat unfavorable 88 11 14 7 8 13 9 8 4 7 314% 13% 16% 16% 14% 25% 18% 20% 9% 10% 4%
K K K IJK K K
Very unfavorable 117 11 11 10 11 5 11 11 9 19 819% 13% 13% 23% 19% 10% 22% 26% 23% 28% 12%
BCFK
Recognize name but can't rate 42 4 4 2 9 4 1 1 2 3 127% 5% 4% 5% 15% 8% 2% 3% 6% 4% 18%
BCGHJ BCDGHJ
Don't recognize 21 3 4 - - 1 1 - 1 1 103% 3% 5% 3% 2% 3% 1% 15%
BCFGIJ

40
Boston Globe Release Poll of Likely Voters in Massachusetts | June 8-10, 15-17, 2014
Total Sample
Designed and Directed by: SocialSphere Inc.
(A) (B) (C) (D) (E) (F) (G) (H) (I) (J) (K) (L) (M) (N) (O) (P)
Ideology Massachusetts
Definitely Probably Democrat Republican Falchuk Don't Know
Likelihood to Vote in General Election Party ID Candidate Vote
Liberal Moderate ConservativeRight
Directedion
Comparison Groups: BC/DEF/GHIJK/LMN/OP, Independent T-Test for Means (based on test for equal variances), Independent Z-Test for Percentages (unpooled proportions), Uppercase letters indicate significance at the 95% level.
Independent Coakley Baker McCormick Wrong Track
Table Q11
Boston Globe Release 3 (Casinos), June 8-10, 15-17
Now I am going to read you the names of some people active in government and politics. For each one, please tell me if you have a very favorable, somewhat favorable, somewhat unfavorable, or very unfavorable opinion of that person. If you are unfamiliar with the name, just say so.Steve Grossman
----- ------ ------- ----- ----- ----- ------- ----- --------- ------- ---- ----- ----- ----- ----- -----
(A) (B) (C) (D) (E) (F) (G) (H) (I) (J) (K) (L) (M) (N) (O) (P)
Percentage Base 630 501 129 208 81 341 269 189 41 3 128 200 252 178 300 233100% 100% 100% 100% 100% 100% 100% 100% 100% 100% 100% 100% 100% 100% 100% 100%
Unweighted Total 630 502 128 209 104 317 265 200 38 3 124 199 242 189 291 243
Net: Favorable 185 166 19 91 14 81 101 46 14 - 25 82 74 30 104 55______________ 29% 33% 15% 44% 17% 24% 37% 24% 34% 20% 41% 29% 17% 35% 24%
C EF HK MN N P
Very favorable 31 31 1 21 1 9 19 7 2 - 3 19 8 5 21 85% 6% 1% 10% 1% 3% 7% 4% 4% 2% 9% 3% 3% 7% 3%
C EF K MN
Somewhat favorable 154 135 18 69 13 71 81 38 12 - 22 63 66 25 84 4724% 27% 14% 33% 16% 21% 30% 20% 30% 17% 32% 26% 14% 28% 20%
C EF HK N N P
Net: Unfavorable 84 70 14 21 16 47 20 45 8 - 11 22 28 34 26 48________________ 13% 14% 11% 10% 20% 14% 7% 24% 20% 8% 11% 11% 19% 9% 21%
D GK LM O
Somewhat unfavorable 63 50 13 18 13 31 15 31 8 - 8 21 19 23 20 3610% 10% 10% 9% 17% 9% 6% 17% 20% 6% 10% 7% 13% 7% 15%
GK G O
Very unfavorable 21 20 1 3 3 15 4 14 - - 3 1 9 11 6 123% 4% 1% 1% 4% 4% 2% 7% 2% 1% 4% 6% 2% 5%
C D GK L L
Recognize name but can't rate 143 112 31 35 18 90 58 43 7 - 35 42 62 39 69 5123% 22% 24% 17% 23% 26% 22% 23% 17% 27% 21% 25% 22% 23% 22%
D
Don't recognize 217 153 65 61 32 124 91 54 12 3 57 55 88 75 100 7934% 30% 50% 30% 40% 36% 34% 29% 29% 100% 45% 27% 35% 42% 33% 34%
B GHIK GH L
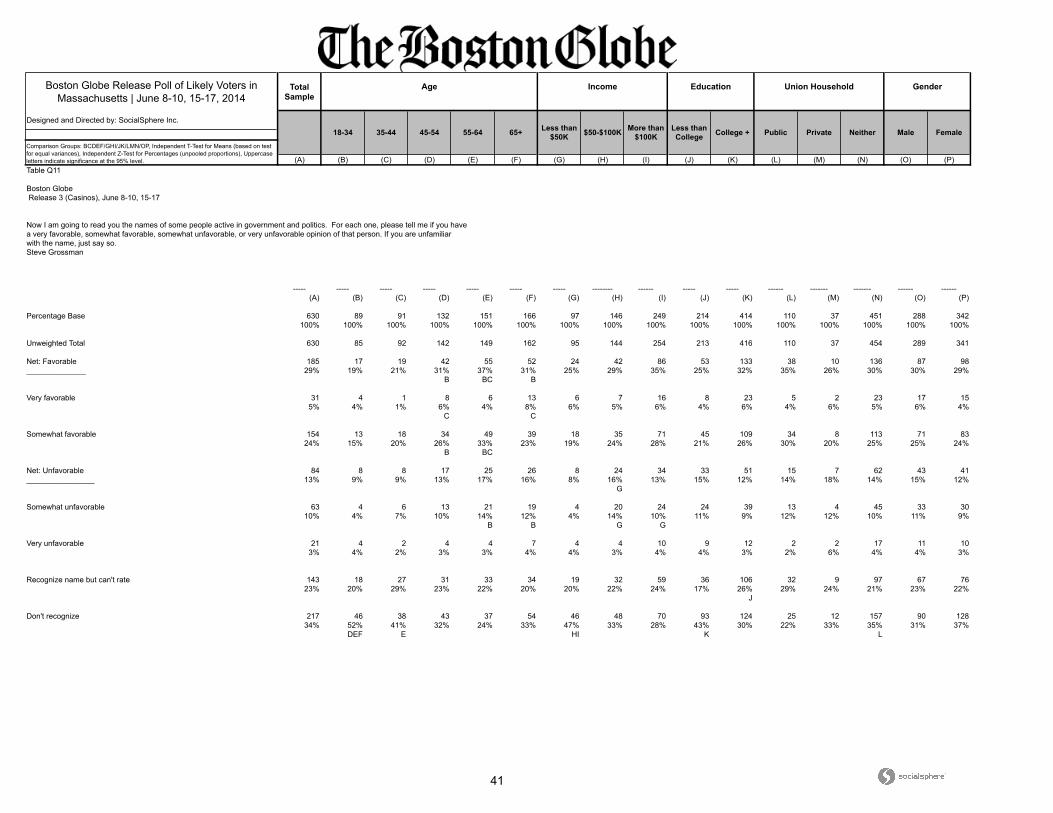
41
Boston Globe Release Poll of Likely Voters in Massachusetts | June 8-10, 15-17, 2014
Total Sample
Designed and Directed by: SocialSphere Inc.
(A) (B) (C) (D) (E) (F) (G) (H) (I) (J) (K) (L) (M) (N) (O) (P)
Union Household Gender
18-34 35-44 45-54 55-64 Less than College College +
Age Income Education
Comparison Groups: BCDEF/GHI/JK/LMN/OP, Independent T-Test for Means (based on test for equal variances), Independent Z-Test for Percentages (unpooled proportions), Uppercase letters indicate significance at the 95% level.
65+ Less than $50K $50-$100K More than
$100K Public Private Neither Male Female
Table Q11
Boston Globe Release 3 (Casinos), June 8-10, 15-17
Now I am going to read you the names of some people active in government and politics. For each one, please tell me if you have a very favorable, somewhat favorable, somewhat unfavorable, or very unfavorable opinion of that person. If you are unfamiliar with the name, just say so.Steve Grossman
----- ----- ----- ----- ----- ----- ----- -------- ------ ----- ----- ------ ------- ------- ------ ------
(A) (B) (C) (D) (E) (F) (G) (H) (I) (J) (K) (L) (M) (N) (O) (P)
Percentage Base 630 89 91 132 151 166 97 146 249 214 414 110 37 451 288 342100% 100% 100% 100% 100% 100% 100% 100% 100% 100% 100% 100% 100% 100% 100% 100%
Unweighted Total 630 85 92 142 149 162 95 144 254 213 416 110 37 454 289 341
Net: Favorable 185 17 19 42 55 52 24 42 86 53 133 38 10 136 87 98______________ 29% 19% 21% 31% 37% 31% 25% 29% 35% 25% 32% 35% 26% 30% 30% 29%
B BC B
Very favorable 31 4 1 8 6 13 6 7 16 8 23 5 2 23 17 155% 4% 1% 6% 4% 8% 6% 5% 6% 4% 6% 4% 6% 5% 6% 4%
C C
Somewhat favorable 154 13 18 34 49 39 18 35 71 45 109 34 8 113 71 8324% 15% 20% 26% 33% 23% 19% 24% 28% 21% 26% 30% 20% 25% 25% 24%
B BC
Net: Unfavorable 84 8 8 17 25 26 8 24 34 33 51 15 7 62 43 41________________ 13% 9% 9% 13% 17% 16% 8% 16% 13% 15% 12% 14% 18% 14% 15% 12%
G
Somewhat unfavorable 63 4 6 13 21 19 4 20 24 24 39 13 4 45 33 3010% 4% 7% 10% 14% 12% 4% 14% 10% 11% 9% 12% 12% 10% 11% 9%
B B G G
Very unfavorable 21 4 2 4 4 7 4 4 10 9 12 2 2 17 11 103% 4% 2% 3% 3% 4% 4% 3% 4% 4% 3% 2% 6% 4% 4% 3%
Recognize name but can't rate 143 18 27 31 33 34 19 32 59 36 106 32 9 97 67 7623% 20% 29% 23% 22% 20% 20% 22% 24% 17% 26% 29% 24% 21% 23% 22%
J
Don't recognize 217 46 38 43 37 54 46 48 70 93 124 25 12 157 90 12834% 52% 41% 32% 24% 33% 47% 33% 28% 43% 30% 22% 33% 35% 31% 37%
DEF E HI K L
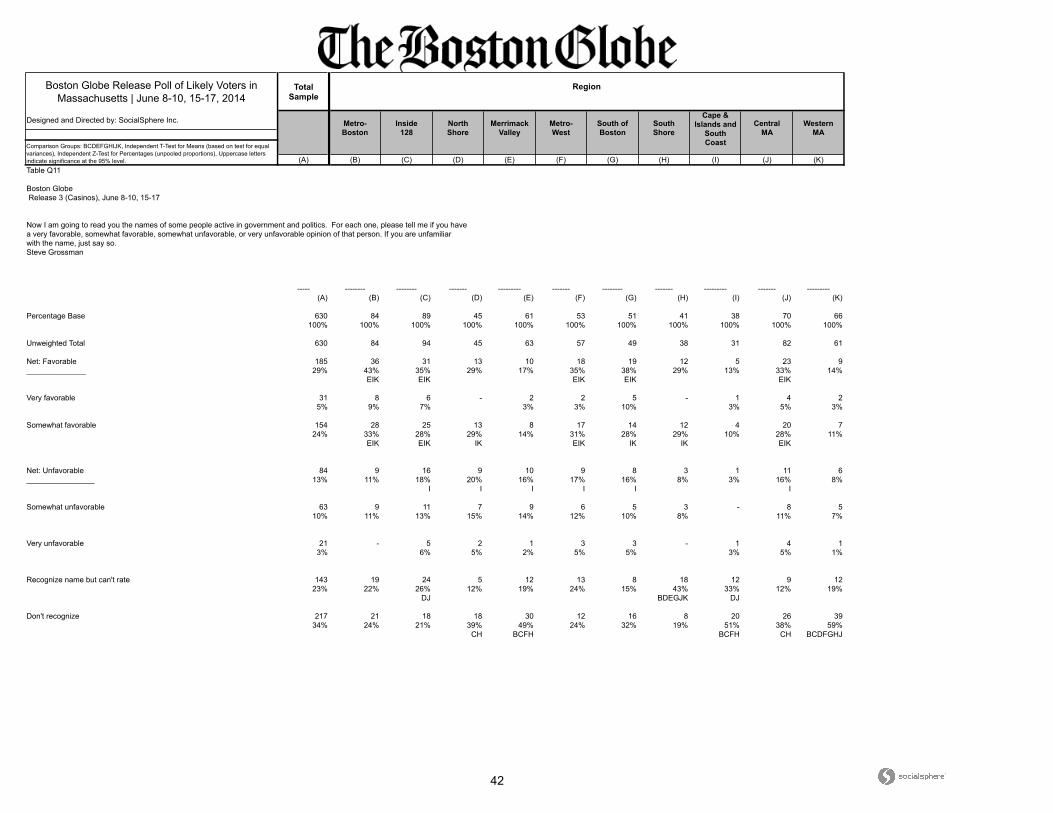
42
Boston Globe Release Poll of Likely Voters in Massachusetts | June 8-10, 15-17, 2014
Total Sample
Designed and Directed by: SocialSphere Inc.
(A) (B) (C) (D) (E) (F) (G) (H) (I) (J) (K)
CentralMA
WesternMA
Comparison Groups: BCDEFGHIJK, Independent T-Test for Means (based on test for equal variances), Independent Z-Test for Percentages (unpooled proportions), Uppercase letters indicate significance at the 95% level.
Region
Metro-Boston
Inside128
NorthShore
MerrimackValley
Metro-West
South ofBoston
SouthShore
Cape &Islands and
SouthCoast
Table Q11
Boston Globe Release 3 (Casinos), June 8-10, 15-17
Now I am going to read you the names of some people active in government and politics. For each one, please tell me if you have a very favorable, somewhat favorable, somewhat unfavorable, or very unfavorable opinion of that person. If you are unfamiliar with the name, just say so.Steve Grossman
----- -------- -------- ------- --------- ------- -------- ------- --------- ------- ---------
(A) (B) (C) (D) (E) (F) (G) (H) (I) (J) (K)
Percentage Base 630 84 89 45 61 53 51 41 38 70 66100% 100% 100% 100% 100% 100% 100% 100% 100% 100% 100%
Unweighted Total 630 84 94 45 63 57 49 38 31 82 61
Net: Favorable 185 36 31 13 10 18 19 12 5 23 9______________ 29% 43% 35% 29% 17% 35% 38% 29% 13% 33% 14%
EIK EIK EIK EIK EIK
Very favorable 31 8 6 - 2 2 5 - 1 4 25% 9% 7% 3% 3% 10% 3% 5% 3%
Somewhat favorable 154 28 25 13 8 17 14 12 4 20 724% 33% 28% 29% 14% 31% 28% 29% 10% 28% 11%
EIK EIK IK EIK IK IK EIK
Net: Unfavorable 84 9 16 9 10 9 8 3 1 11 6________________ 13% 11% 18% 20% 16% 17% 16% 8% 3% 16% 8%
I I I I I I
Somewhat unfavorable 63 9 11 7 9 6 5 3 - 8 510% 11% 13% 15% 14% 12% 10% 8% 11% 7%
Very unfavorable 21 - 5 2 1 3 3 - 1 4 13% 6% 5% 2% 5% 5% 3% 5% 1%
Recognize name but can't rate 143 19 24 5 12 13 8 18 12 9 1223% 22% 26% 12% 19% 24% 15% 43% 33% 12% 19%
DJ BDEGJK DJ
Don't recognize 217 21 18 18 30 12 16 8 20 26 3934% 24% 21% 39% 49% 24% 32% 19% 51% 38% 59%
CH BCFH BCFH CH BCDFGHJ
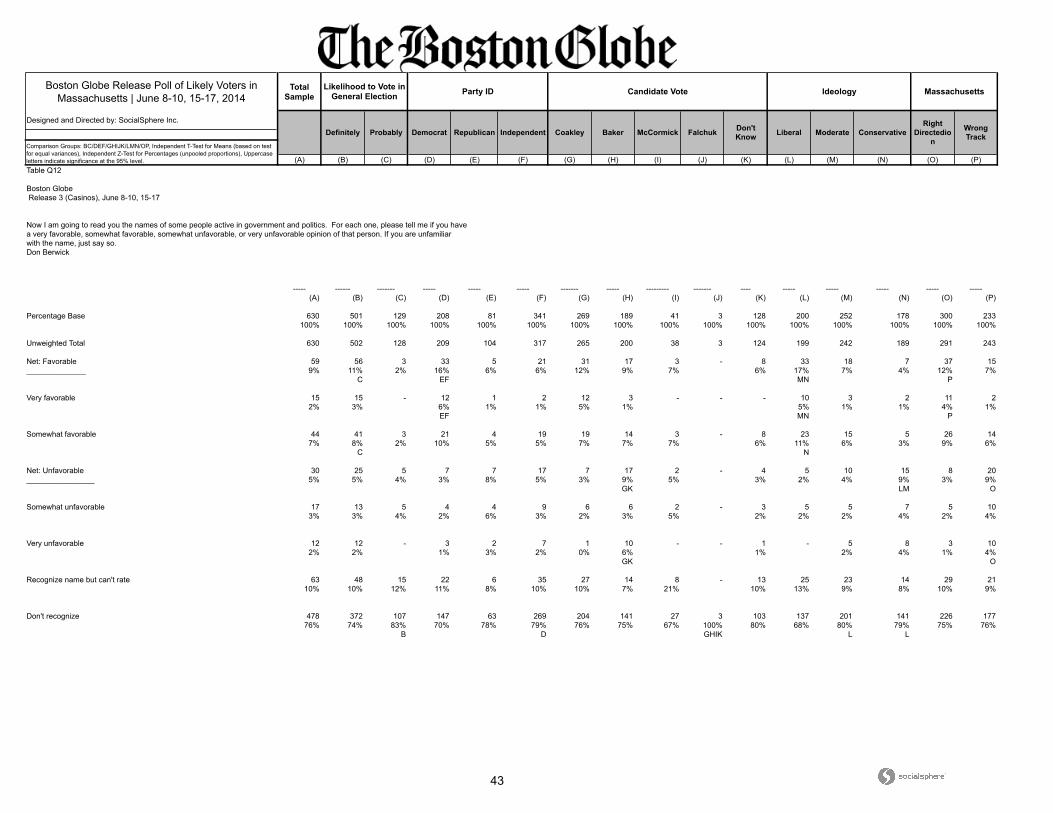
43
Boston Globe Release Poll of Likely Voters in Massachusetts | June 8-10, 15-17, 2014
Total Sample
Designed and Directed by: SocialSphere Inc.
(A) (B) (C) (D) (E) (F) (G) (H) (I) (J) (K) (L) (M) (N) (O) (P)
Ideology Massachusetts
Definitely Probably Democrat Republican Falchuk Don't Know
Likelihood to Vote in General Election Party ID Candidate Vote
Liberal Moderate ConservativeRight
Directedion
Comparison Groups: BC/DEF/GHIJK/LMN/OP, Independent T-Test for Means (based on test for equal variances), Independent Z-Test for Percentages (unpooled proportions), Uppercase letters indicate significance at the 95% level.
Independent Coakley Baker McCormick Wrong Track
Table Q12
Boston Globe Release 3 (Casinos), June 8-10, 15-17
Now I am going to read you the names of some people active in government and politics. For each one, please tell me if you have a very favorable, somewhat favorable, somewhat unfavorable, or very unfavorable opinion of that person. If you are unfamiliar with the name, just say so.Don Berwick
----- ------ ------- ----- ----- ----- ------- ----- --------- ------- ---- ----- ----- ----- ----- -----
(A) (B) (C) (D) (E) (F) (G) (H) (I) (J) (K) (L) (M) (N) (O) (P)
Percentage Base 630 501 129 208 81 341 269 189 41 3 128 200 252 178 300 233100% 100% 100% 100% 100% 100% 100% 100% 100% 100% 100% 100% 100% 100% 100% 100%
Unweighted Total 630 502 128 209 104 317 265 200 38 3 124 199 242 189 291 243
Net: Favorable 59 56 3 33 5 21 31 17 3 - 8 33 18 7 37 15______________ 9% 11% 2% 16% 6% 6% 12% 9% 7% 6% 17% 7% 4% 12% 7%
C EF MN P
Very favorable 15 15 - 12 1 2 12 3 - - - 10 3 2 11 22% 3% 6% 1% 1% 5% 1% 5% 1% 1% 4% 1%
EF MN P
Somewhat favorable 44 41 3 21 4 19 19 14 3 - 8 23 15 5 26 147% 8% 2% 10% 5% 5% 7% 7% 7% 6% 11% 6% 3% 9% 6%
C N
Net: Unfavorable 30 25 5 7 7 17 7 17 2 - 4 5 10 15 8 20________________ 5% 5% 4% 3% 8% 5% 3% 9% 5% 3% 2% 4% 9% 3% 9%
GK LM O
Somewhat unfavorable 17 13 5 4 4 9 6 6 2 - 3 5 5 7 5 103% 3% 4% 2% 6% 3% 2% 3% 5% 2% 2% 2% 4% 2% 4%
Very unfavorable 12 12 - 3 2 7 1 10 - - 1 - 5 8 3 102% 2% 1% 3% 2% 0% 6% 1% 2% 4% 1% 4%
GK O
Recognize name but can't rate 63 48 15 22 6 35 27 14 8 - 13 25 23 14 29 2110% 10% 12% 11% 8% 10% 10% 7% 21% 10% 13% 9% 8% 10% 9%
Don't recognize 478 372 107 147 63 269 204 141 27 3 103 137 201 141 226 17776% 74% 83% 70% 78% 79% 76% 75% 67% 100% 80% 68% 80% 79% 75% 76%
B D GHIK L L
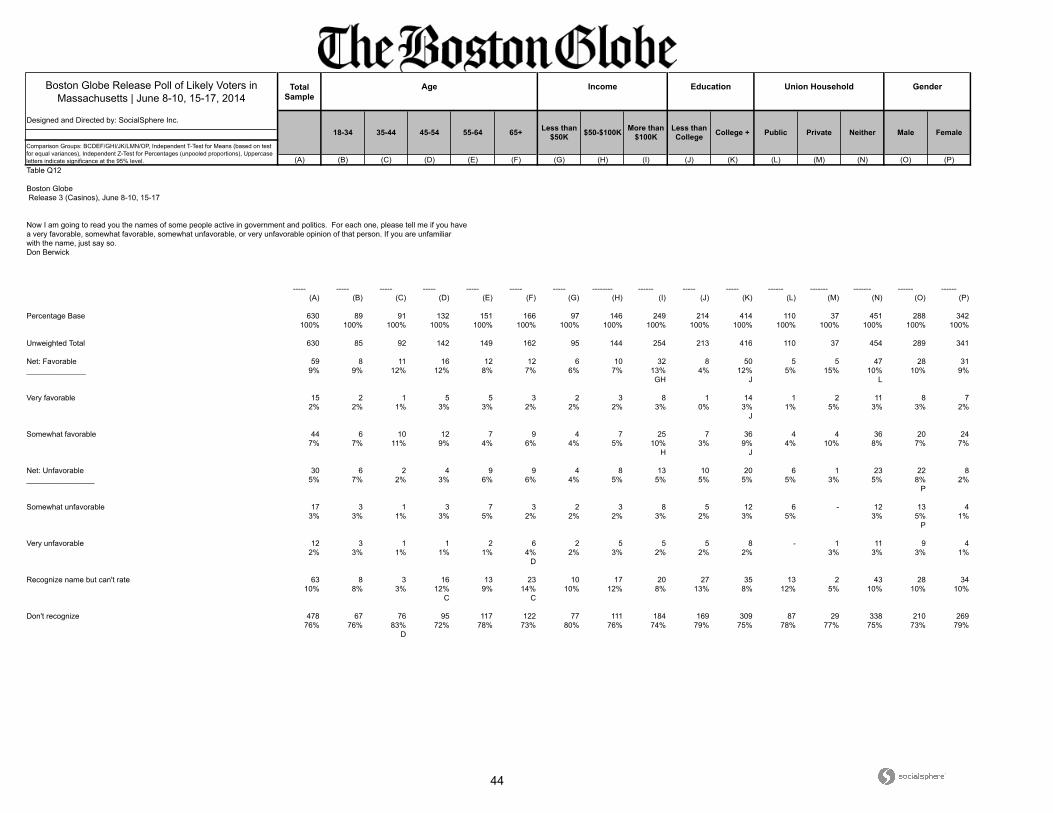
44
Boston Globe Release Poll of Likely Voters in Massachusetts | June 8-10, 15-17, 2014
Total Sample
Designed and Directed by: SocialSphere Inc.
(A) (B) (C) (D) (E) (F) (G) (H) (I) (J) (K) (L) (M) (N) (O) (P)
Union Household Gender
18-34 35-44 45-54 55-64 Less than College College +
Age Income Education
Comparison Groups: BCDEF/GHI/JK/LMN/OP, Independent T-Test for Means (based on test for equal variances), Independent Z-Test for Percentages (unpooled proportions), Uppercase letters indicate significance at the 95% level.
65+ Less than $50K $50-$100K More than
$100K Public Private Neither Male Female
Table Q12
Boston Globe Release 3 (Casinos), June 8-10, 15-17
Now I am going to read you the names of some people active in government and politics. For each one, please tell me if you have a very favorable, somewhat favorable, somewhat unfavorable, or very unfavorable opinion of that person. If you are unfamiliar with the name, just say so.Don Berwick
----- ----- ----- ----- ----- ----- ----- -------- ------ ----- ----- ------ ------- ------- ------ ------
(A) (B) (C) (D) (E) (F) (G) (H) (I) (J) (K) (L) (M) (N) (O) (P)
Percentage Base 630 89 91 132 151 166 97 146 249 214 414 110 37 451 288 342100% 100% 100% 100% 100% 100% 100% 100% 100% 100% 100% 100% 100% 100% 100% 100%
Unweighted Total 630 85 92 142 149 162 95 144 254 213 416 110 37 454 289 341
Net: Favorable 59 8 11 16 12 12 6 10 32 8 50 5 5 47 28 31______________ 9% 9% 12% 12% 8% 7% 6% 7% 13% 4% 12% 5% 15% 10% 10% 9%
GH J L
Very favorable 15 2 1 5 5 3 2 3 8 1 14 1 2 11 8 72% 2% 1% 3% 3% 2% 2% 2% 3% 0% 3% 1% 5% 3% 3% 2%
J
Somewhat favorable 44 6 10 12 7 9 4 7 25 7 36 4 4 36 20 247% 7% 11% 9% 4% 6% 4% 5% 10% 3% 9% 4% 10% 8% 7% 7%
H J
Net: Unfavorable 30 6 2 4 9 9 4 8 13 10 20 6 1 23 22 8________________ 5% 7% 2% 3% 6% 6% 4% 5% 5% 5% 5% 5% 3% 5% 8% 2%
P
Somewhat unfavorable 17 3 1 3 7 3 2 3 8 5 12 6 - 12 13 43% 3% 1% 3% 5% 2% 2% 2% 3% 2% 3% 5% 3% 5% 1%
P
Very unfavorable 12 3 1 1 2 6 2 5 5 5 8 - 1 11 9 42% 3% 1% 1% 1% 4% 2% 3% 2% 2% 2% 3% 3% 3% 1%
D
Recognize name but can't rate 63 8 3 16 13 23 10 17 20 27 35 13 2 43 28 3410% 8% 3% 12% 9% 14% 10% 12% 8% 13% 8% 12% 5% 10% 10% 10%
C C
Don't recognize 478 67 76 95 117 122 77 111 184 169 309 87 29 338 210 26976% 76% 83% 72% 78% 73% 80% 76% 74% 79% 75% 78% 77% 75% 73% 79%
D

45
Boston Globe Release Poll of Likely Voters in Massachusetts | June 8-10, 15-17, 2014
Total Sample
Designed and Directed by: SocialSphere Inc.
(A) (B) (C) (D) (E) (F) (G) (H) (I) (J) (K)
CentralMA
WesternMA
Comparison Groups: BCDEFGHIJK, Independent T-Test for Means (based on test for equal variances), Independent Z-Test for Percentages (unpooled proportions), Uppercase letters indicate significance at the 95% level.
Region
Metro-Boston
Inside128
NorthShore
MerrimackValley
Metro-West
South ofBoston
SouthShore
Cape &Islands and
SouthCoast
Table Q12
Boston Globe Release 3 (Casinos), June 8-10, 15-17
Now I am going to read you the names of some people active in government and politics. For each one, please tell me if you have a very favorable, somewhat favorable, somewhat unfavorable, or very unfavorable opinion of that person. If you are unfamiliar with the name, just say so.Don Berwick
----- -------- -------- ------- --------- ------- -------- ------- --------- ------- ---------
(A) (B) (C) (D) (E) (F) (G) (H) (I) (J) (K)
Percentage Base 630 84 89 45 61 53 51 41 38 70 66100% 100% 100% 100% 100% 100% 100% 100% 100% 100% 100%
Unweighted Total 630 84 94 45 63 57 49 38 31 82 61
Net: Favorable 59 13 19 1 2 6 5 3 2 4 1______________ 9% 15% 21% 2% 3% 10% 10% 7% 6% 6% 1%
DEK DEHIJK K K
Very favorable 15 3 4 - 1 3 3 - - 1 -2% 4% 5% 1% 5% 6% 1%
Somewhat favorable 44 10 14 1 1 3 2 3 2 4 17% 12% 16% 2% 1% 5% 4% 7% 6% 5% 1%
DEK DEFGJK
Net: Unfavorable 30 3 6 3 4 2 3 1 1 4 2________________ 5% 4% 7% 6% 7% 3% 6% 3% 3% 5% 2%
Somewhat unfavorable 17 2 3 2 3 1 3 - - 3 13% 2% 4% 5% 5% 1% 6% 4% 1%
Very unfavorable 12 1 3 1 1 1 - 1 1 1 12% 1% 3% 2% 2% 2% 3% 3% 1% 1%
Recognize name but can't rate 63 5 7 5 6 6 9 6 3 6 610% 6% 8% 12% 10% 11% 17% 15% 7% 9% 9%
Don't recognize 478 63 57 35 49 39 34 31 32 55 5876% 75% 64% 79% 80% 75% 67% 75% 84% 79% 87%
C C C C CG
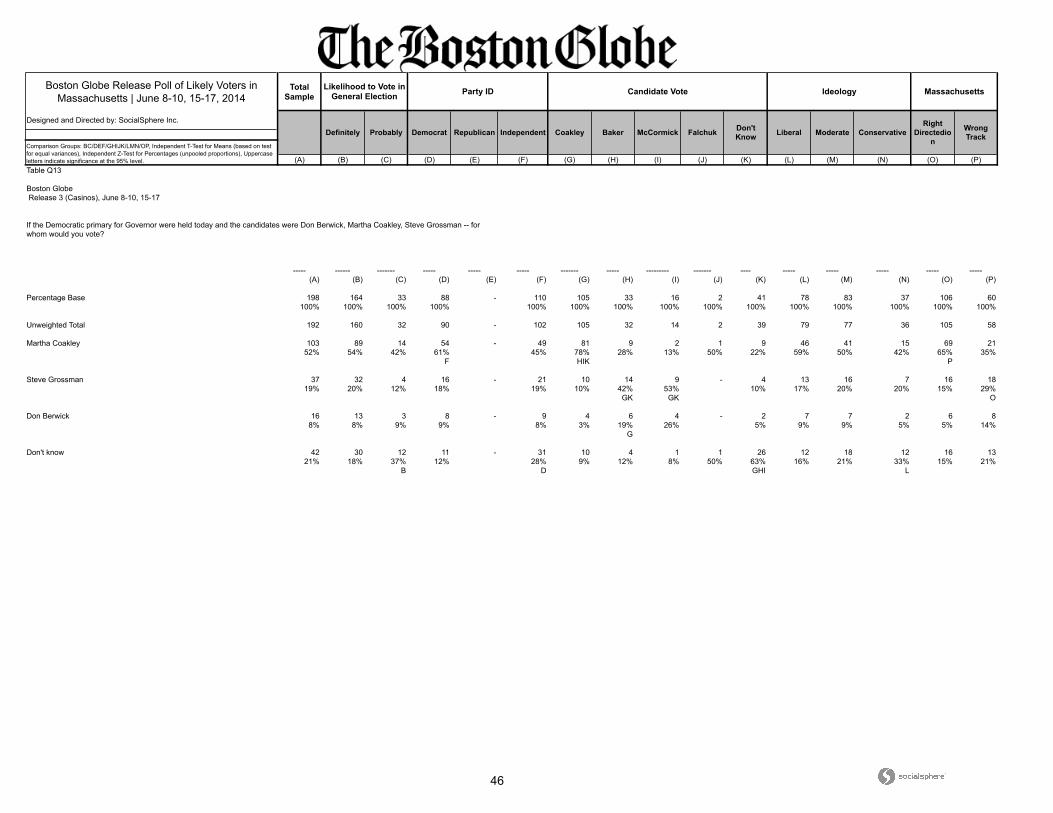
46
Boston Globe Release Poll of Likely Voters in Massachusetts | June 8-10, 15-17, 2014
Total Sample
Designed and Directed by: SocialSphere Inc.
(A) (B) (C) (D) (E) (F) (G) (H) (I) (J) (K) (L) (M) (N) (O) (P)
Ideology Massachusetts
Definitely Probably Democrat Republican Falchuk Don't Know
Likelihood to Vote in General Election Party ID Candidate Vote
Liberal Moderate ConservativeRight
Directedion
Comparison Groups: BC/DEF/GHIJK/LMN/OP, Independent T-Test for Means (based on test for equal variances), Independent Z-Test for Percentages (unpooled proportions), Uppercase letters indicate significance at the 95% level.
Independent Coakley Baker McCormick Wrong Track
Table Q13
Boston Globe Release 3 (Casinos), June 8-10, 15-17
If the Democratic primary for Governor were held today and the candidates were Don Berwick, Martha Coakley, Steve Grossman -- for whom would you vote?
----- ------ ------- ----- ----- ----- ------- ----- --------- ------- ---- ----- ----- ----- ----- -----
(A) (B) (C) (D) (E) (F) (G) (H) (I) (J) (K) (L) (M) (N) (O) (P)
Percentage Base 198 164 33 88 - 110 105 33 16 2 41 78 83 37 106 60100% 100% 100% 100% 100% 100% 100% 100% 100% 100% 100% 100% 100% 100% 100%
Unweighted Total 192 160 32 90 - 102 105 32 14 2 39 79 77 36 105 58
Martha Coakley 103 89 14 54 - 49 81 9 2 1 9 46 41 15 69 2152% 54% 42% 61% 45% 78% 28% 13% 50% 22% 59% 50% 42% 65% 35%
F HIK P
Steve Grossman 37 32 4 16 - 21 10 14 9 - 4 13 16 7 16 1819% 20% 12% 18% 19% 10% 42% 53% 10% 17% 20% 20% 15% 29%
GK GK O
Don Berwick 16 13 3 8 - 9 4 6 4 - 2 7 7 2 6 88% 8% 9% 9% 8% 3% 19% 26% 5% 9% 9% 5% 5% 14%
G
Don't know 42 30 12 11 - 31 10 4 1 1 26 12 18 12 16 1321% 18% 37% 12% 28% 9% 12% 8% 50% 63% 16% 21% 33% 15% 21%
B D GHI L
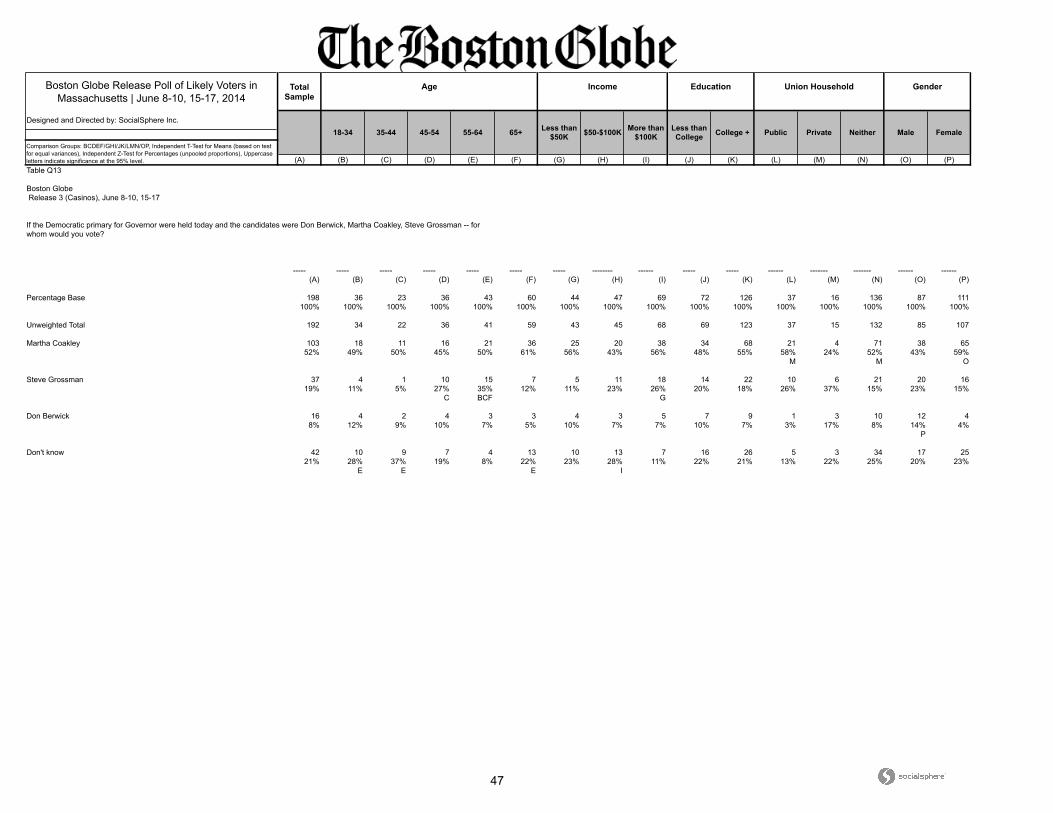
47
Boston Globe Release Poll of Likely Voters in Massachusetts | June 8-10, 15-17, 2014
Total Sample
Designed and Directed by: SocialSphere Inc.
(A) (B) (C) (D) (E) (F) (G) (H) (I) (J) (K) (L) (M) (N) (O) (P)
Union Household Gender
18-34 35-44 45-54 55-64 Less than College College +
Age Income Education
Comparison Groups: BCDEF/GHI/JK/LMN/OP, Independent T-Test for Means (based on test for equal variances), Independent Z-Test for Percentages (unpooled proportions), Uppercase letters indicate significance at the 95% level.
65+ Less than $50K $50-$100K More than
$100K Public Private Neither Male Female
Table Q13
Boston Globe Release 3 (Casinos), June 8-10, 15-17
If the Democratic primary for Governor were held today and the candidates were Don Berwick, Martha Coakley, Steve Grossman -- for whom would you vote?
----- ----- ----- ----- ----- ----- ----- -------- ------ ----- ----- ------ ------- ------- ------ ------
(A) (B) (C) (D) (E) (F) (G) (H) (I) (J) (K) (L) (M) (N) (O) (P)
Percentage Base 198 36 23 36 43 60 44 47 69 72 126 37 16 136 87 111100% 100% 100% 100% 100% 100% 100% 100% 100% 100% 100% 100% 100% 100% 100% 100%
Unweighted Total 192 34 22 36 41 59 43 45 68 69 123 37 15 132 85 107
Martha Coakley 103 18 11 16 21 36 25 20 38 34 68 21 4 71 38 6552% 49% 50% 45% 50% 61% 56% 43% 56% 48% 55% 58% 24% 52% 43% 59%
M M O
Steve Grossman 37 4 1 10 15 7 5 11 18 14 22 10 6 21 20 1619% 11% 5% 27% 35% 12% 11% 23% 26% 20% 18% 26% 37% 15% 23% 15%
C BCF G
Don Berwick 16 4 2 4 3 3 4 3 5 7 9 1 3 10 12 48% 12% 9% 10% 7% 5% 10% 7% 7% 10% 7% 3% 17% 8% 14% 4%
P
Don't know 42 10 9 7 4 13 10 13 7 16 26 5 3 34 17 2521% 28% 37% 19% 8% 22% 23% 28% 11% 22% 21% 13% 22% 25% 20% 23%
E E E I
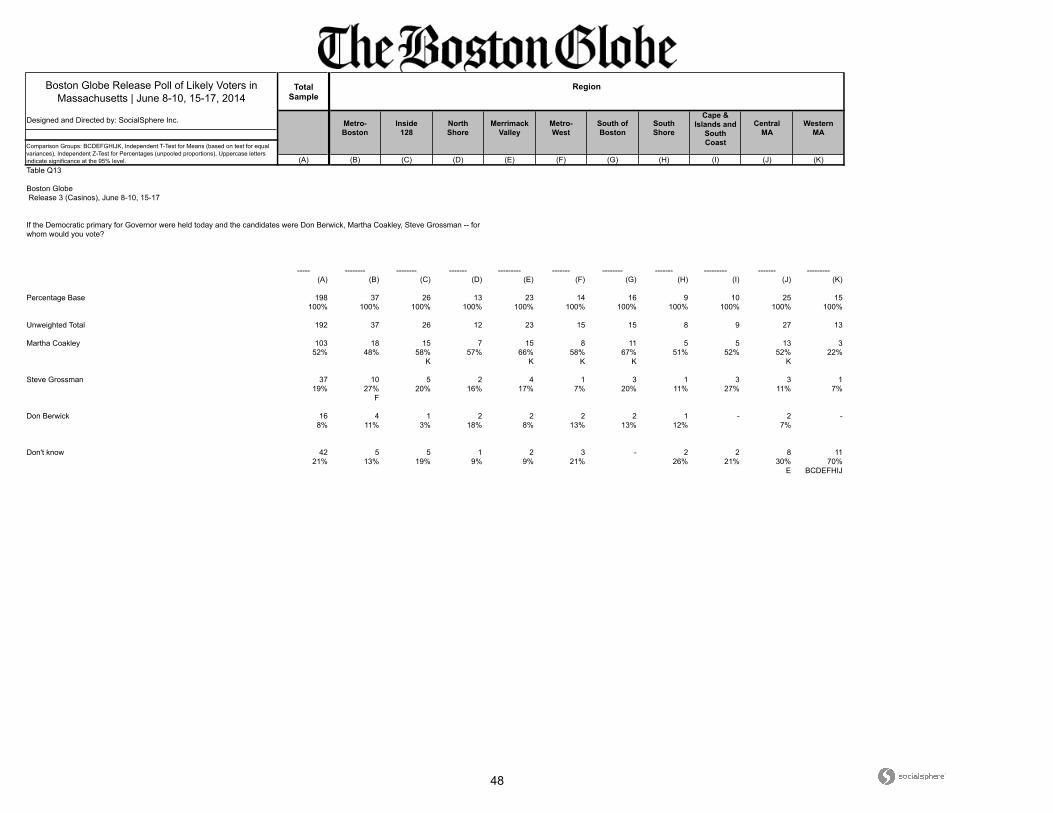
48
Boston Globe Release Poll of Likely Voters in Massachusetts | June 8-10, 15-17, 2014
Total Sample
Designed and Directed by: SocialSphere Inc.
(A) (B) (C) (D) (E) (F) (G) (H) (I) (J) (K)
CentralMA
WesternMA
Comparison Groups: BCDEFGHIJK, Independent T-Test for Means (based on test for equal variances), Independent Z-Test for Percentages (unpooled proportions), Uppercase letters indicate significance at the 95% level.
Region
Metro-Boston
Inside128
NorthShore
MerrimackValley
Metro-West
South ofBoston
SouthShore
Cape &Islands and
SouthCoast
Table Q13
Boston Globe Release 3 (Casinos), June 8-10, 15-17
If the Democratic primary for Governor were held today and the candidates were Don Berwick, Martha Coakley, Steve Grossman -- for whom would you vote?
----- -------- -------- ------- --------- ------- -------- ------- --------- ------- ---------
(A) (B) (C) (D) (E) (F) (G) (H) (I) (J) (K)
Percentage Base 198 37 26 13 23 14 16 9 10 25 15100% 100% 100% 100% 100% 100% 100% 100% 100% 100% 100%
Unweighted Total 192 37 26 12 23 15 15 8 9 27 13
Martha Coakley 103 18 15 7 15 8 11 5 5 13 352% 48% 58% 57% 66% 58% 67% 51% 52% 52% 22%
K K K K K
Steve Grossman 37 10 5 2 4 1 3 1 3 3 119% 27% 20% 16% 17% 7% 20% 11% 27% 11% 7%
F
Don Berwick 16 4 1 2 2 2 2 1 - 2 -8% 11% 3% 18% 8% 13% 13% 12% 7%
Don't know 42 5 5 1 2 3 - 2 2 8 1121% 13% 19% 9% 9% 21% 26% 21% 30% 70%
E BCDEFHIJ
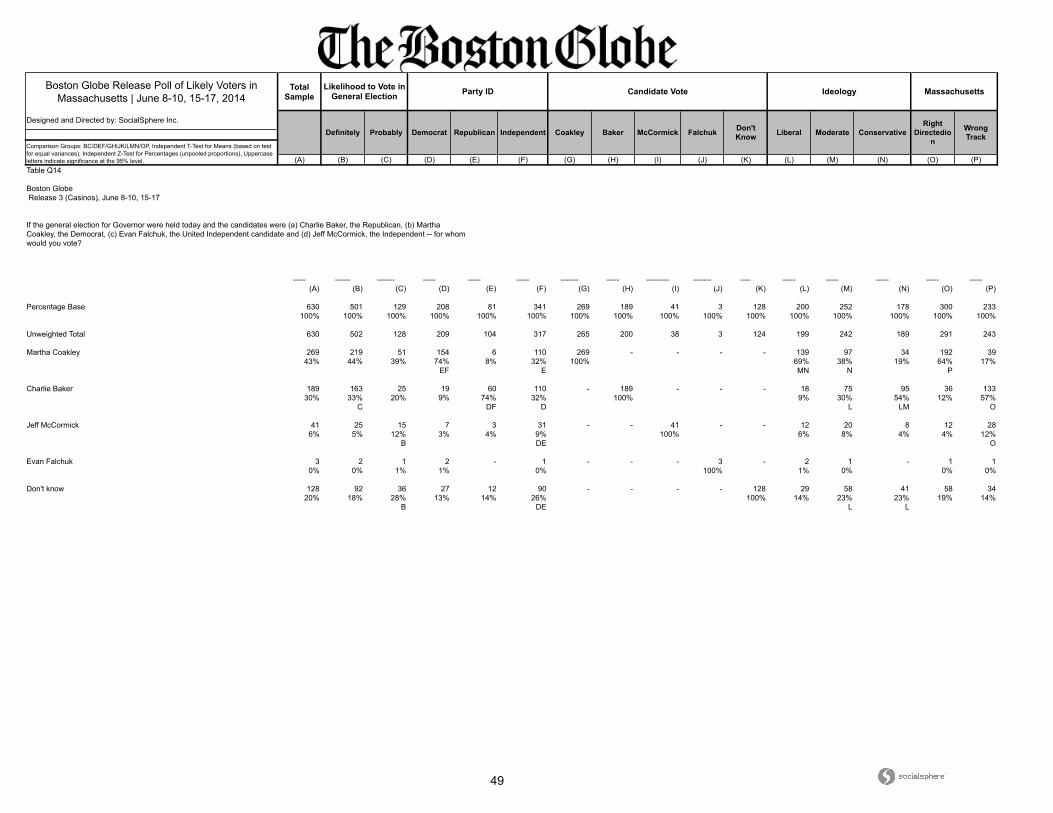
49
Boston Globe Release Poll of Likely Voters in Massachusetts | June 8-10, 15-17, 2014
Total Sample
Designed and Directed by: SocialSphere Inc.
(A) (B) (C) (D) (E) (F) (G) (H) (I) (J) (K) (L) (M) (N) (O) (P)
Ideology Massachusetts
Definitely Probably Democrat Republican Falchuk Don't Know
Likelihood to Vote in General Election Party ID Candidate Vote
Liberal Moderate ConservativeRight
Directedion
Comparison Groups: BC/DEF/GHIJK/LMN/OP, Independent T-Test for Means (based on test for equal variances), Independent Z-Test for Percentages (unpooled proportions), Uppercase letters indicate significance at the 95% level.
Independent Coakley Baker McCormick Wrong Track
Table Q14
Boston Globe Release 3 (Casinos), June 8-10, 15-17
If the general election for Governor were held today and the candidates were (a) Charlie Baker, the Republican, (b) Martha Coakley, the Democrat, (c) Evan Falchuk, the United Independent candidate and (d) Jeff McCormick, the Independent -- for whom would you vote?
----- ------ ------- ----- ----- ----- ------- ----- --------- ------- ---- ----- ----- ----- ----- -----
(A) (B) (C) (D) (E) (F) (G) (H) (I) (J) (K) (L) (M) (N) (O) (P)
Percentage Base 630 501 129 208 81 341 269 189 41 3 128 200 252 178 300 233100% 100% 100% 100% 100% 100% 100% 100% 100% 100% 100% 100% 100% 100% 100% 100%
Unweighted Total 630 502 128 209 104 317 265 200 38 3 124 199 242 189 291 243
Martha Coakley 269 219 51 154 6 110 269 - - - - 139 97 34 192 3943% 44% 39% 74% 8% 32% 100% 69% 38% 19% 64% 17%
EF E MN N P
Charlie Baker 189 163 25 19 60 110 - 189 - - - 18 75 95 36 13330% 33% 20% 9% 74% 32% 100% 9% 30% 54% 12% 57%
C DF D L LM O
Jeff McCormick 41 25 15 7 3 31 - - 41 - - 12 20 8 12 286% 5% 12% 3% 4% 9% 100% 6% 8% 4% 4% 12%
B DE O
Evan Falchuk 3 2 1 2 - 1 - - - 3 - 2 1 - 1 10% 0% 1% 1% 0% 100% 1% 0% 0% 0%
Don't know 128 92 36 27 12 90 - - - - 128 29 58 41 58 3420% 18% 28% 13% 14% 26% 100% 14% 23% 23% 19% 14%
B DE L L

50
Boston Globe Release Poll of Likely Voters in Massachusetts | June 8-10, 15-17, 2014
Total Sample
Designed and Directed by: SocialSphere Inc.
(A) (B) (C) (D) (E) (F) (G) (H) (I) (J) (K) (L) (M) (N) (O) (P)
Union Household Gender
18-34 35-44 45-54 55-64 Less than College College +
Age Income Education
Comparison Groups: BCDEF/GHI/JK/LMN/OP, Independent T-Test for Means (based on test for equal variances), Independent Z-Test for Percentages (unpooled proportions), Uppercase letters indicate significance at the 95% level.
65+ Less than $50K $50-$100K More than
$100K Public Private Neither Male Female
Table Q14
Boston Globe Release 3 (Casinos), June 8-10, 15-17
If the general election for Governor were held today and the candidates were (a) Charlie Baker, the Republican, (b) Martha Coakley, the Democrat, (c) Evan Falchuk, the United Independent candidate and (d) Jeff McCormick, the Independent -- for whom would you vote?
----- ----- ----- ----- ----- ----- ----- -------- ------ ----- ----- ------ ------- ------- ------ ------
(A) (B) (C) (D) (E) (F) (G) (H) (I) (J) (K) (L) (M) (N) (O) (P)
Percentage Base 630 89 91 132 151 166 97 146 249 214 414 110 37 451 288 342100% 100% 100% 100% 100% 100% 100% 100% 100% 100% 100% 100% 100% 100% 100% 100%
Unweighted Total 630 85 92 142 149 162 95 144 254 213 416 110 37 454 289 341
Martha Coakley 269 46 41 52 57 74 53 53 109 80 189 49 12 195 98 17143% 51% 44% 39% 38% 45% 55% 36% 44% 38% 46% 44% 32% 43% 34% 50%
E H O
Charlie Baker 189 18 25 43 50 52 18 45 92 64 125 32 18 130 115 7430% 20% 28% 32% 33% 31% 19% 31% 37% 30% 30% 29% 48% 29% 40% 22%
B G G LN P
Jeff McCormick 41 8 1 9 12 12 6 13 14 26 15 10 1 28 21 206% 8% 1% 7% 8% 7% 6% 9% 5% 12% 4% 9% 3% 6% 7% 6%
C C C C K
Evan Falchuk 3 - 2 1 - - 1 1 1 1 2 1 - 2 - 30% 2% 1% 1% 1% 0% 0% 0% 1% 0% 1%
Don't know 128 17 23 28 31 28 19 34 34 43 84 19 6 95 54 7420% 20% 25% 21% 21% 17% 19% 24% 14% 20% 20% 17% 17% 21% 19% 22%
I

51
Boston Globe Release Poll of Likely Voters in Massachusetts | June 8-10, 15-17, 2014
Total Sample
Designed and Directed by: SocialSphere Inc.
(A) (B) (C) (D) (E) (F) (G) (H) (I) (J) (K)
CentralMA
WesternMA
Comparison Groups: BCDEFGHIJK, Independent T-Test for Means (based on test for equal variances), Independent Z-Test for Percentages (unpooled proportions), Uppercase letters indicate significance at the 95% level.
Region
Metro-Boston
Inside128
NorthShore
MerrimackValley
Metro-West
South ofBoston
SouthShore
Cape &Islands and
SouthCoast
Table Q14
Boston Globe Release 3 (Casinos), June 8-10, 15-17
If the general election for Governor were held today and the candidates were (a) Charlie Baker, the Republican, (b) Martha Coakley, the Democrat, (c) Evan Falchuk, the United Independent candidate and (d) Jeff McCormick, the Independent -- for whom would you vote?
----- -------- -------- ------- --------- ------- -------- ------- --------- ------- ---------
(A) (B) (C) (D) (E) (F) (G) (H) (I) (J) (K)
Percentage Base 630 84 89 45 61 53 51 41 38 70 66100% 100% 100% 100% 100% 100% 100% 100% 100% 100% 100%
Unweighted Total 630 84 94 45 63 57 49 38 31 82 61
Martha Coakley 269 45 45 16 23 22 23 14 14 24 3043% 53% 50% 36% 38% 42% 46% 35% 36% 35% 45%
J J
Charlie Baker 189 20 27 17 21 16 14 14 8 28 1130% 23% 30% 38% 34% 31% 28% 35% 22% 40% 17%
K K BK
Jeff McCormick 41 5 4 3 5 2 6 2 4 4 36% 6% 5% 7% 8% 4% 13% 5% 9% 6% 4%
Evan Falchuk 3 1 1 - - 1 - - - - -0% 1% 1% 2%
Don't know 128 14 12 8 12 11 7 10 12 13 2220% 17% 14% 18% 20% 21% 13% 24% 33% 18% 33%
C BCGJ

52
Boston Globe Release Poll of Likely Voters in Massachusetts | June 8-10, 15-17, 2014
Total Sample
Designed and Directed by: SocialSphere Inc.
(A) (B) (C) (D) (E) (F) (G) (H) (I) (J) (K) (L) (M) (N) (O) (P)
Ideology Massachusetts
Definitely Probably Democrat Republican Falchuk Don't Know
Likelihood to Vote in General Election Party ID Candidate Vote
Liberal Moderate ConservativeRight
Directedion
Comparison Groups: BC/DEF/GHIJK/LMN/OP, Independent T-Test for Means (based on test for equal variances), Independent Z-Test for Percentages (unpooled proportions), Uppercase letters indicate significance at the 95% level.
Independent Coakley Baker McCormick Wrong Track
Table Q15
Boston Globe Release 3 (Casinos), June 8-10, 15-17
If the general election for Governor were held today and the candidates were, (a) Charlie Baker, the Republican, (b) Steve Grossman, the Democrat, (c) Evan Falchuk, the United Independent candidate and (d) Jeff McCormick, the Independent -- for whom would you vote?
----- ------ ------- ----- ----- ----- ------- ----- --------- ------- ---- ----- ----- ----- ----- -----
(A) (B) (C) (D) (E) (F) (G) (H) (I) (J) (K) (L) (M) (N) (O) (P)
Percentage Base 630 501 129 208 81 341 269 189 41 3 128 200 252 178 300 233100% 100% 100% 100% 100% 100% 100% 100% 100% 100% 100% 100% 100% 100% 100% 100%
Unweighted Total 630 502 128 209 104 317 265 200 38 3 124 199 242 189 291 243
Charlie Baker 192 165 27 17 57 117 31 151 3 - 7 20 76 96 45 12830% 33% 21% 8% 71% 34% 11% 80% 7% 5% 10% 30% 54% 15% 55%
C DF D K GIK L LM O
Steve Grossman 173 144 28 126 3 44 146 14 6 - 6 107 54 11 126 2527% 29% 22% 61% 4% 13% 54% 8% 14% 5% 54% 21% 6% 42% 11%
EF E HIK MN N P
Jeff McCormick 43 28 15 4 5 34 7 4 28 - 4 10 19 14 15 257% 6% 12% 2% 6% 10% 3% 2% 68% 3% 5% 7% 8% 5% 11%
B D GHK O
Evan Falchuk 5 3 2 2 - 3 - 1 1 3 - 3 2 - 2 11% 1% 2% 1% 1% 1% 3% 100% 2% 1% 1% 0%
HI
Don't know 217 161 57 59 15 143 85 18 3 - 111 59 101 57 111 5535% 32% 44% 29% 19% 42% 32% 9% 8% 87% 30% 40% 32% 37% 24%
B DE HI GHI L P
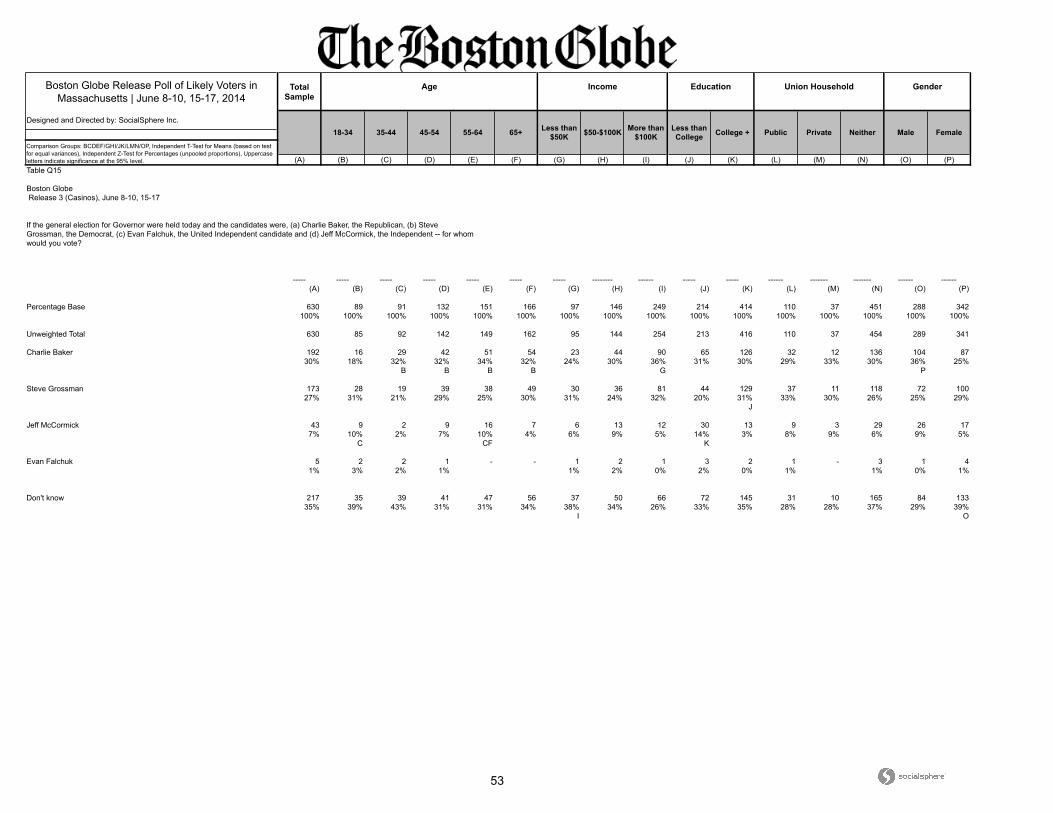
53
Boston Globe Release Poll of Likely Voters in Massachusetts | June 8-10, 15-17, 2014
Total Sample
Designed and Directed by: SocialSphere Inc.
(A) (B) (C) (D) (E) (F) (G) (H) (I) (J) (K) (L) (M) (N) (O) (P)
Union Household Gender
18-34 35-44 45-54 55-64 Less than College College +
Age Income Education
Comparison Groups: BCDEF/GHI/JK/LMN/OP, Independent T-Test for Means (based on test for equal variances), Independent Z-Test for Percentages (unpooled proportions), Uppercase letters indicate significance at the 95% level.
65+ Less than $50K $50-$100K More than
$100K Public Private Neither Male Female
Table Q15
Boston Globe Release 3 (Casinos), June 8-10, 15-17
If the general election for Governor were held today and the candidates were, (a) Charlie Baker, the Republican, (b) Steve Grossman, the Democrat, (c) Evan Falchuk, the United Independent candidate and (d) Jeff McCormick, the Independent -- for whom would you vote?
----- ----- ----- ----- ----- ----- ----- -------- ------ ----- ----- ------ ------- ------- ------ ------
(A) (B) (C) (D) (E) (F) (G) (H) (I) (J) (K) (L) (M) (N) (O) (P)
Percentage Base 630 89 91 132 151 166 97 146 249 214 414 110 37 451 288 342100% 100% 100% 100% 100% 100% 100% 100% 100% 100% 100% 100% 100% 100% 100% 100%
Unweighted Total 630 85 92 142 149 162 95 144 254 213 416 110 37 454 289 341
Charlie Baker 192 16 29 42 51 54 23 44 90 65 126 32 12 136 104 8730% 18% 32% 32% 34% 32% 24% 30% 36% 31% 30% 29% 33% 30% 36% 25%
B B B B G P
Steve Grossman 173 28 19 39 38 49 30 36 81 44 129 37 11 118 72 10027% 31% 21% 29% 25% 30% 31% 24% 32% 20% 31% 33% 30% 26% 25% 29%
J
Jeff McCormick 43 9 2 9 16 7 6 13 12 30 13 9 3 29 26 177% 10% 2% 7% 10% 4% 6% 9% 5% 14% 3% 8% 9% 6% 9% 5%
C CF K
Evan Falchuk 5 2 2 1 - - 1 2 1 3 2 1 - 3 1 41% 3% 2% 1% 1% 2% 0% 2% 0% 1% 1% 0% 1%
Don't know 217 35 39 41 47 56 37 50 66 72 145 31 10 165 84 13335% 39% 43% 31% 31% 34% 38% 34% 26% 33% 35% 28% 28% 37% 29% 39%
I O
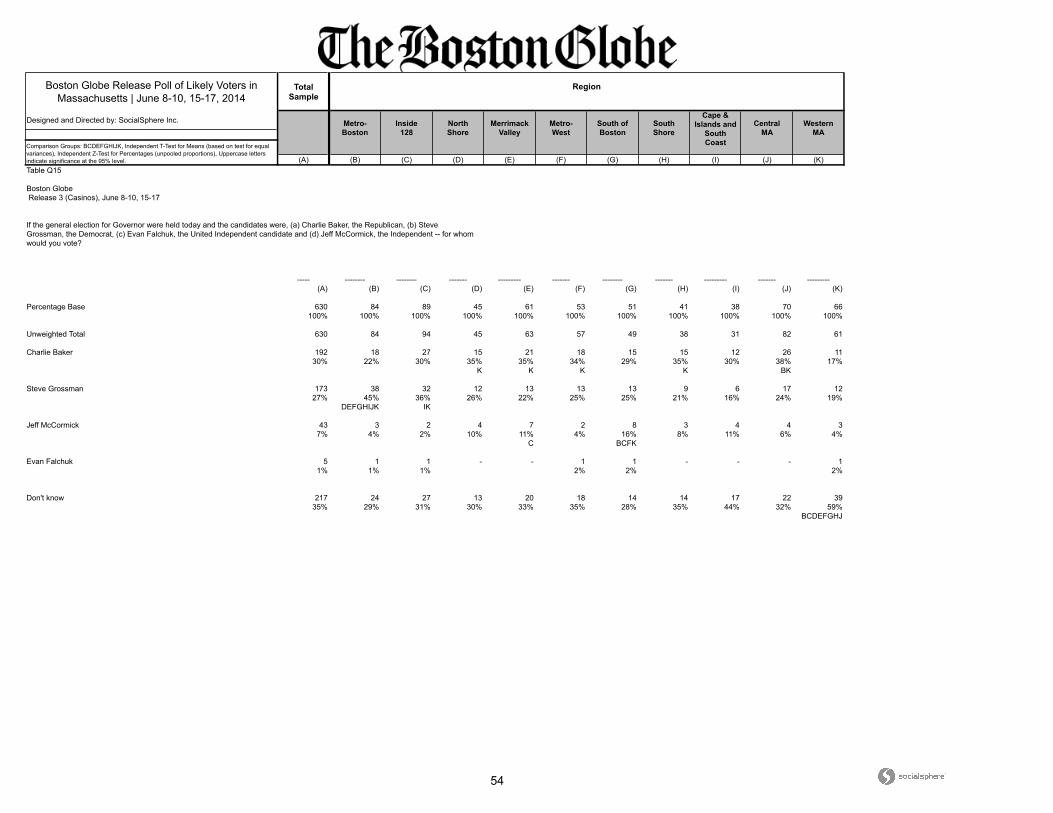
54
Boston Globe Release Poll of Likely Voters in Massachusetts | June 8-10, 15-17, 2014
Total Sample
Designed and Directed by: SocialSphere Inc.
(A) (B) (C) (D) (E) (F) (G) (H) (I) (J) (K)
CentralMA
WesternMA
Comparison Groups: BCDEFGHIJK, Independent T-Test for Means (based on test for equal variances), Independent Z-Test for Percentages (unpooled proportions), Uppercase letters indicate significance at the 95% level.
Region
Metro-Boston
Inside128
NorthShore
MerrimackValley
Metro-West
South ofBoston
SouthShore
Cape &Islands and
SouthCoast
Table Q15
Boston Globe Release 3 (Casinos), June 8-10, 15-17
If the general election for Governor were held today and the candidates were, (a) Charlie Baker, the Republican, (b) Steve Grossman, the Democrat, (c) Evan Falchuk, the United Independent candidate and (d) Jeff McCormick, the Independent -- for whom would you vote?
----- -------- -------- ------- --------- ------- -------- ------- --------- ------- ---------
(A) (B) (C) (D) (E) (F) (G) (H) (I) (J) (K)
Percentage Base 630 84 89 45 61 53 51 41 38 70 66100% 100% 100% 100% 100% 100% 100% 100% 100% 100% 100%
Unweighted Total 630 84 94 45 63 57 49 38 31 82 61
Charlie Baker 192 18 27 15 21 18 15 15 12 26 1130% 22% 30% 35% 35% 34% 29% 35% 30% 38% 17%
K K K K BK
Steve Grossman 173 38 32 12 13 13 13 9 6 17 1227% 45% 36% 26% 22% 25% 25% 21% 16% 24% 19%
DEFGHIJK IK
Jeff McCormick 43 3 2 4 7 2 8 3 4 4 37% 4% 2% 10% 11% 4% 16% 8% 11% 6% 4%
C BCFK
Evan Falchuk 5 1 1 - - 1 1 - - - 11% 1% 1% 2% 2% 2%
Don't know 217 24 27 13 20 18 14 14 17 22 3935% 29% 31% 30% 33% 35% 28% 35% 44% 32% 59%
BCDEFGHJ
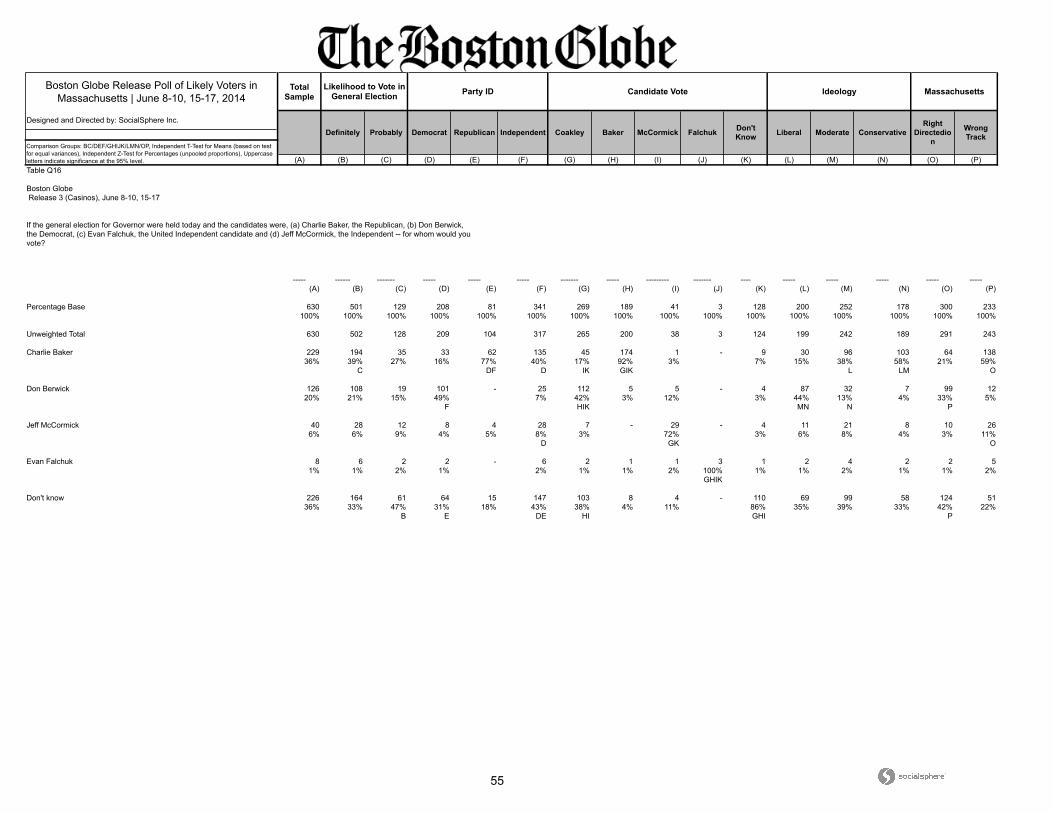
55
Boston Globe Release Poll of Likely Voters in Massachusetts | June 8-10, 15-17, 2014
Total Sample
Designed and Directed by: SocialSphere Inc.
(A) (B) (C) (D) (E) (F) (G) (H) (I) (J) (K) (L) (M) (N) (O) (P)
Ideology Massachusetts
Definitely Probably Democrat Republican Falchuk Don't Know
Likelihood to Vote in General Election Party ID Candidate Vote
Liberal Moderate ConservativeRight
Directedion
Comparison Groups: BC/DEF/GHIJK/LMN/OP, Independent T-Test for Means (based on test for equal variances), Independent Z-Test for Percentages (unpooled proportions), Uppercase letters indicate significance at the 95% level.
Independent Coakley Baker McCormick Wrong Track
Table Q16
Boston Globe Release 3 (Casinos), June 8-10, 15-17
If the general election for Governor were held today and the candidates were, (a) Charlie Baker, the Republican, (b) Don Berwick, the Democrat, (c) Evan Falchuk, the United Independent candidate and (d) Jeff McCormick, the Independent -- for whom would you vote?
----- ------ ------- ----- ----- ----- ------- ----- --------- ------- ---- ----- ----- ----- ----- -----
(A) (B) (C) (D) (E) (F) (G) (H) (I) (J) (K) (L) (M) (N) (O) (P)
Percentage Base 630 501 129 208 81 341 269 189 41 3 128 200 252 178 300 233100% 100% 100% 100% 100% 100% 100% 100% 100% 100% 100% 100% 100% 100% 100% 100%
Unweighted Total 630 502 128 209 104 317 265 200 38 3 124 199 242 189 291 243
Charlie Baker 229 194 35 33 62 135 45 174 1 - 9 30 96 103 64 13836% 39% 27% 16% 77% 40% 17% 92% 3% 7% 15% 38% 58% 21% 59%
C DF D IK GIK L LM O
Don Berwick 126 108 19 101 - 25 112 5 5 - 4 87 32 7 99 1220% 21% 15% 49% 7% 42% 3% 12% 3% 44% 13% 4% 33% 5%
F HIK MN N P
Jeff McCormick 40 28 12 8 4 28 7 - 29 - 4 11 21 8 10 266% 6% 9% 4% 5% 8% 3% 72% 3% 6% 8% 4% 3% 11%
D GK O
Evan Falchuk 8 6 2 2 - 6 2 1 1 3 1 2 4 2 2 51% 1% 2% 1% 2% 1% 1% 2% 100% 1% 1% 2% 1% 1% 2%
GHIK
Don't know 226 164 61 64 15 147 103 8 4 - 110 69 99 58 124 5136% 33% 47% 31% 18% 43% 38% 4% 11% 86% 35% 39% 33% 42% 22%
B E DE HI GHI P

56
Boston Globe Release Poll of Likely Voters in Massachusetts | June 8-10, 15-17, 2014
Total Sample
Designed and Directed by: SocialSphere Inc.
(A) (B) (C) (D) (E) (F) (G) (H) (I) (J) (K) (L) (M) (N) (O) (P)
Union Household Gender
18-34 35-44 45-54 55-64 Less than College College +
Age Income Education
Comparison Groups: BCDEF/GHI/JK/LMN/OP, Independent T-Test for Means (based on test for equal variances), Independent Z-Test for Percentages (unpooled proportions), Uppercase letters indicate significance at the 95% level.
65+ Less than $50K $50-$100K More than
$100K Public Private Neither Male Female
Table Q16
Boston Globe Release 3 (Casinos), June 8-10, 15-17
If the general election for Governor were held today and the candidates were, (a) Charlie Baker, the Republican, (b) Don Berwick, the Democrat, (c) Evan Falchuk, the United Independent candidate and (d) Jeff McCormick, the Independent -- for whom would you vote?
----- ----- ----- ----- ----- ----- ----- -------- ------ ----- ----- ------ ------- ------- ------ ------
(A) (B) (C) (D) (E) (F) (G) (H) (I) (J) (K) (L) (M) (N) (O) (P)
Percentage Base 630 89 91 132 151 166 97 146 249 214 414 110 37 451 288 342100% 100% 100% 100% 100% 100% 100% 100% 100% 100% 100% 100% 100% 100% 100% 100%
Unweighted Total 630 85 92 142 149 162 95 144 254 213 416 110 37 454 289 341
Charlie Baker 229 28 28 51 67 56 27 50 113 80 150 40 18 156 121 10836% 31% 30% 39% 44% 34% 28% 34% 45% 37% 36% 37% 48% 35% 42% 32%
C GH P
Don Berwick 126 24 16 23 24 40 23 28 55 33 93 24 8 88 51 7620% 26% 18% 17% 16% 24% 23% 19% 22% 16% 22% 22% 21% 20% 18% 22%
J
Jeff McCormick 40 6 3 8 12 12 8 12 12 26 14 8 - 32 21 196% 6% 3% 6% 8% 7% 8% 8% 5% 12% 3% 7% 7% 7% 5%
K
Evan Falchuk 8 2 3 1 2 - 2 2 1 5 3 1 - 7 3 51% 2% 3% 1% 1% 2% 1% 0% 2% 1% 1% 2% 1% 1%
Don't know 226 30 41 49 47 58 37 53 69 70 154 37 11 167 92 13436% 34% 45% 37% 31% 35% 38% 37% 28% 33% 37% 34% 31% 37% 32% 39%
E

57
Boston Globe Release Poll of Likely Voters in Massachusetts | June 8-10, 15-17, 2014
Total Sample
Designed and Directed by: SocialSphere Inc.
(A) (B) (C) (D) (E) (F) (G) (H) (I) (J) (K)
CentralMA
WesternMA
Comparison Groups: BCDEFGHIJK, Independent T-Test for Means (based on test for equal variances), Independent Z-Test for Percentages (unpooled proportions), Uppercase letters indicate significance at the 95% level.
Region
Metro-Boston
Inside128
NorthShore
MerrimackValley
Metro-West
South ofBoston
SouthShore
Cape &Islands and
SouthCoast
Table Q16
Boston Globe Release 3 (Casinos), June 8-10, 15-17
If the general election for Governor were held today and the candidates were, (a) Charlie Baker, the Republican, (b) Don Berwick, the Democrat, (c) Evan Falchuk, the United Independent candidate and (d) Jeff McCormick, the Independent -- for whom would you vote?
----- -------- -------- ------- --------- ------- -------- ------- --------- ------- ---------
(A) (B) (C) (D) (E) (F) (G) (H) (I) (J) (K)
Percentage Base 630 84 89 45 61 53 51 41 38 70 66100% 100% 100% 100% 100% 100% 100% 100% 100% 100% 100%
Unweighted Total 630 84 94 45 63 57 49 38 31 82 61
Charlie Baker 229 23 31 20 29 18 21 18 12 30 1336% 27% 35% 45% 47% 35% 41% 43% 31% 43% 20%
K BK BK K K BK
Don Berwick 126 27 27 7 8 13 12 6 6 9 1020% 32% 30% 16% 13% 25% 24% 14% 16% 13% 15%
DEHJK DEHJK
Jeff McCormick 40 4 2 3 3 2 4 5 6 5 46% 5% 2% 7% 4% 4% 8% 11% 16% 8% 6%
C
Evan Falchuk 8 2 2 - 1 2 - - - 1 -1% 2% 2% 2% 4% 1%
Don't know 226 29 27 15 21 17 13 13 14 25 3936% 34% 30% 32% 34% 33% 26% 32% 37% 35% 59%
BCDEFGHIJ
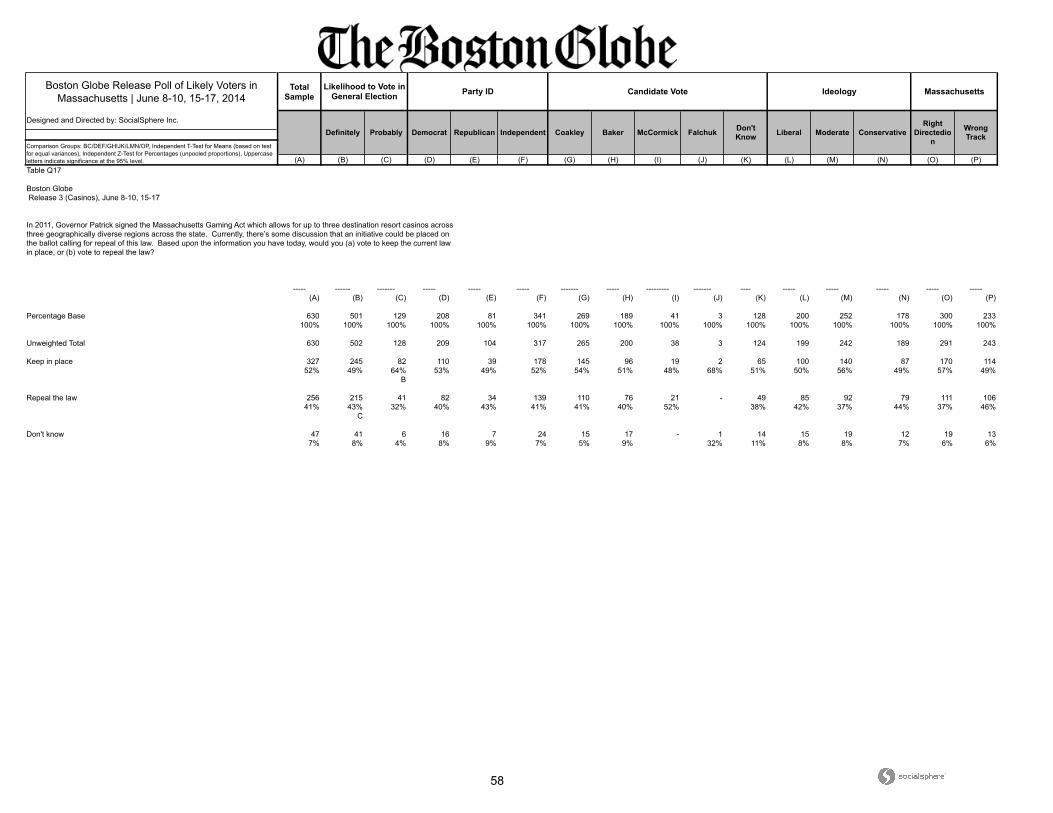
58
Boston Globe Release Poll of Likely Voters in Massachusetts | June 8-10, 15-17, 2014
Total Sample
Designed and Directed by: SocialSphere Inc.
(A) (B) (C) (D) (E) (F) (G) (H) (I) (J) (K) (L) (M) (N) (O) (P)
Ideology Massachusetts
Definitely Probably Democrat Republican Falchuk Don't Know
Likelihood to Vote in General Election Party ID Candidate Vote
Liberal Moderate ConservativeRight
Directedion
Comparison Groups: BC/DEF/GHIJK/LMN/OP, Independent T-Test for Means (based on test for equal variances), Independent Z-Test for Percentages (unpooled proportions), Uppercase letters indicate significance at the 95% level.
Independent Coakley Baker McCormick Wrong Track
Table Q17
Boston Globe Release 3 (Casinos), June 8-10, 15-17
In 2011, Governor Patrick signed the Massachusetts Gaming Act which allows for up to three destination resort casinos across three geographically diverse regions across the state. Currently, there’s some discussion that an initiative could be placed on the ballot calling for repeal of this law. Based upon the information you have today, would you (a) vote to keep the current law in place, or (b) vote to repeal the law?
----- ------ ------- ----- ----- ----- ------- ----- --------- ------- ---- ----- ----- ----- ----- -----
(A) (B) (C) (D) (E) (F) (G) (H) (I) (J) (K) (L) (M) (N) (O) (P)
Percentage Base 630 501 129 208 81 341 269 189 41 3 128 200 252 178 300 233100% 100% 100% 100% 100% 100% 100% 100% 100% 100% 100% 100% 100% 100% 100% 100%
Unweighted Total 630 502 128 209 104 317 265 200 38 3 124 199 242 189 291 243
Keep in place 327 245 82 110 39 178 145 96 19 2 65 100 140 87 170 11452% 49% 64% 53% 49% 52% 54% 51% 48% 68% 51% 50% 56% 49% 57% 49%
B
Repeal the law 256 215 41 82 34 139 110 76 21 - 49 85 92 79 111 10641% 43% 32% 40% 43% 41% 41% 40% 52% 38% 42% 37% 44% 37% 46%
C
Don't know 47 41 6 16 7 24 15 17 - 1 14 15 19 12 19 137% 8% 4% 8% 9% 7% 5% 9% 32% 11% 8% 8% 7% 6% 6%

59
Boston Globe Release Poll of Likely Voters in Massachusetts | June 8-10, 15-17, 2014
Total Sample
Designed and Directed by: SocialSphere Inc.
(A) (B) (C) (D) (E) (F) (G) (H) (I) (J) (K) (L) (M) (N) (O) (P)
Union Household Gender
18-34 35-44 45-54 55-64 Less than College College +
Age Income Education
Comparison Groups: BCDEF/GHI/JK/LMN/OP, Independent T-Test for Means (based on test for equal variances), Independent Z-Test for Percentages (unpooled proportions), Uppercase letters indicate significance at the 95% level.
65+ Less than $50K $50-$100K More than
$100K Public Private Neither Male Female
Table Q17
Boston Globe Release 3 (Casinos), June 8-10, 15-17
In 2011, Governor Patrick signed the Massachusetts Gaming Act which allows for up to three destination resort casinos across three geographically diverse regions across the state. Currently, there’s some discussion that an initiative could be placed on the ballot calling for repeal of this law. Based upon the information you have today, would you (a) vote to keep the current law in place, or (b) vote to repeal the law?
----- ----- ----- ----- ----- ----- ----- -------- ------ ----- ----- ------ ------- ------- ------ ------
(A) (B) (C) (D) (E) (F) (G) (H) (I) (J) (K) (L) (M) (N) (O) (P)
Percentage Base 630 89 91 132 151 166 97 146 249 214 414 110 37 451 288 342100% 100% 100% 100% 100% 100% 100% 100% 100% 100% 100% 100% 100% 100% 100% 100%
Unweighted Total 630 85 92 142 149 162 95 144 254 213 416 110 37 454 289 341
Keep in place 327 57 45 67 74 84 52 78 135 131 196 60 18 236 162 16552% 64% 50% 50% 49% 50% 54% 53% 54% 61% 47% 54% 47% 52% 56% 48%
DEF K P
Repeal the law 256 24 40 56 65 70 37 62 101 70 185 46 18 183 107 14941% 27% 44% 42% 43% 42% 38% 42% 41% 32% 45% 41% 47% 41% 37% 44%
B B B B J
Don't know 47 8 6 10 11 12 7 6 14 13 33 5 2 32 18 287% 9% 7% 7% 7% 7% 8% 4% 5% 6% 8% 5% 6% 7% 6% 8%

60
Boston Globe Release Poll of Likely Voters in Massachusetts | June 8-10, 15-17, 2014
Total Sample
Designed and Directed by: SocialSphere Inc.
(A) (B) (C) (D) (E) (F) (G) (H) (I) (J) (K)
CentralMA
WesternMA
Comparison Groups: BCDEFGHIJK, Independent T-Test for Means (based on test for equal variances), Independent Z-Test for Percentages (unpooled proportions), Uppercase letters indicate significance at the 95% level.
Region
Metro-Boston
Inside128
NorthShore
MerrimackValley
Metro-West
South ofBoston
SouthShore
Cape &Islands and
SouthCoast
Table Q17
Boston Globe Release 3 (Casinos), June 8-10, 15-17
In 2011, Governor Patrick signed the Massachusetts Gaming Act which allows for up to three destination resort casinos across three geographically diverse regions across the state. Currently, there’s some discussion that an initiative could be placed on the ballot calling for repeal of this law. Based upon the information you have today, would you (a) vote to keep the current law in place, or (b) vote to repeal the law?
----- -------- -------- ------- --------- ------- -------- ------- --------- ------- ---------
(A) (B) (C) (D) (E) (F) (G) (H) (I) (J) (K)
Percentage Base 630 84 89 45 61 53 51 41 38 70 66100% 100% 100% 100% 100% 100% 100% 100% 100% 100% 100%
Unweighted Total 630 84 94 45 63 57 49 38 31 82 61
Keep in place 327 47 37 25 32 28 24 26 23 44 3052% 55% 42% 56% 53% 53% 46% 62% 59% 64% 46%
C CGK
Repeal the law 256 32 42 18 24 21 26 13 12 21 3041% 38% 48% 39% 40% 40% 50% 32% 30% 30% 46%
J J
Don't know 47 6 9 2 4 4 2 2 4 4 67% 7% 10% 5% 7% 8% 4% 6% 11% 6% 9%
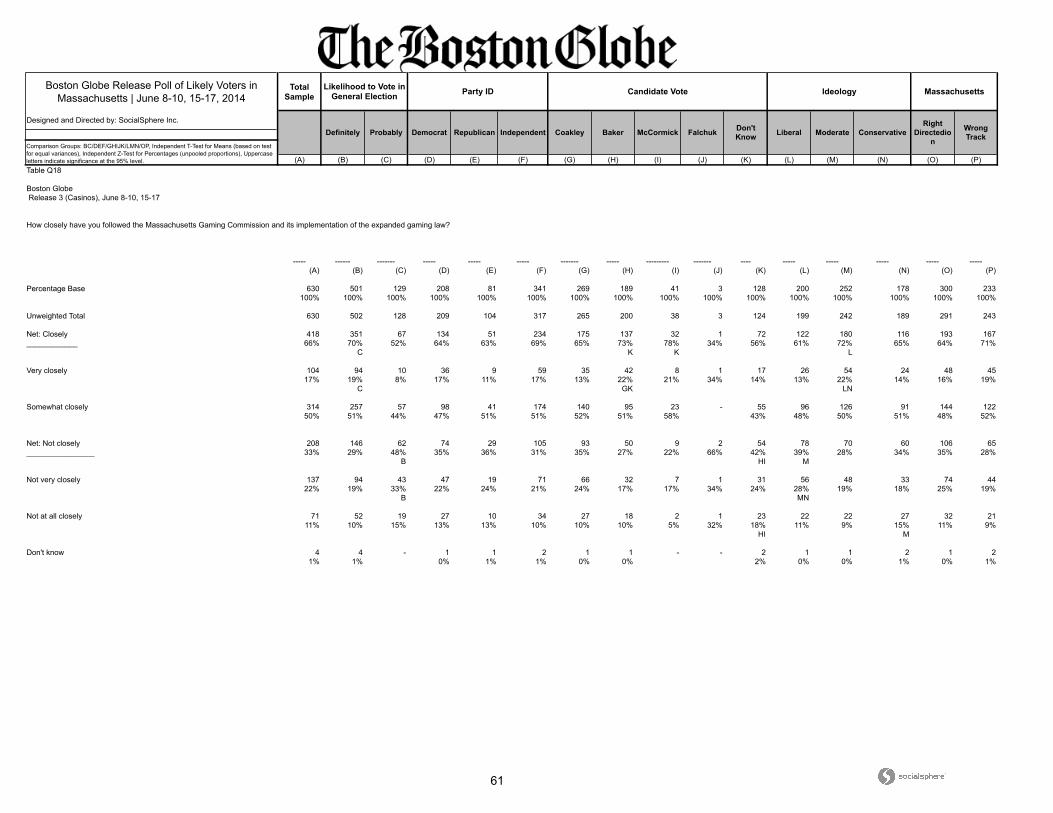
61
Boston Globe Release Poll of Likely Voters in Massachusetts | June 8-10, 15-17, 2014
Total Sample
Designed and Directed by: SocialSphere Inc.
(A) (B) (C) (D) (E) (F) (G) (H) (I) (J) (K) (L) (M) (N) (O) (P)
Ideology Massachusetts
Definitely Probably Democrat Republican Falchuk Don't Know
Likelihood to Vote in General Election Party ID Candidate Vote
Liberal Moderate ConservativeRight
Directedion
Comparison Groups: BC/DEF/GHIJK/LMN/OP, Independent T-Test for Means (based on test for equal variances), Independent Z-Test for Percentages (unpooled proportions), Uppercase letters indicate significance at the 95% level.
Independent Coakley Baker McCormick Wrong Track
Table Q18
Boston Globe Release 3 (Casinos), June 8-10, 15-17
How closely have you followed the Massachusetts Gaming Commission and its implementation of the expanded gaming law?
----- ------ ------- ----- ----- ----- ------- ----- --------- ------- ---- ----- ----- ----- ----- -----
(A) (B) (C) (D) (E) (F) (G) (H) (I) (J) (K) (L) (M) (N) (O) (P)
Percentage Base 630 501 129 208 81 341 269 189 41 3 128 200 252 178 300 233100% 100% 100% 100% 100% 100% 100% 100% 100% 100% 100% 100% 100% 100% 100% 100%
Unweighted Total 630 502 128 209 104 317 265 200 38 3 124 199 242 189 291 243
Net: Closely 418 351 67 134 51 234 175 137 32 1 72 122 180 116 193 167____________ 66% 70% 52% 64% 63% 69% 65% 73% 78% 34% 56% 61% 72% 65% 64% 71%
C K K L
Very closely 104 94 10 36 9 59 35 42 8 1 17 26 54 24 48 4517% 19% 8% 17% 11% 17% 13% 22% 21% 34% 14% 13% 22% 14% 16% 19%
C GK LN
Somewhat closely 314 257 57 98 41 174 140 95 23 - 55 96 126 91 144 12250% 51% 44% 47% 51% 51% 52% 51% 58% 43% 48% 50% 51% 48% 52%
Net: Not closely 208 146 62 74 29 105 93 50 9 2 54 78 70 60 106 65________________ 33% 29% 48% 35% 36% 31% 35% 27% 22% 66% 42% 39% 28% 34% 35% 28%
B HI M
Not very closely 137 94 43 47 19 71 66 32 7 1 31 56 48 33 74 4422% 19% 33% 22% 24% 21% 24% 17% 17% 34% 24% 28% 19% 18% 25% 19%
B MN
Not at all closely 71 52 19 27 10 34 27 18 2 1 23 22 22 27 32 2111% 10% 15% 13% 13% 10% 10% 10% 5% 32% 18% 11% 9% 15% 11% 9%
HI M
Don't know 4 4 - 1 1 2 1 1 - - 2 1 1 2 1 21% 1% 0% 1% 1% 0% 0% 2% 0% 0% 1% 0% 1%

62
Boston Globe Release Poll of Likely Voters in Massachusetts | June 8-10, 15-17, 2014
Total Sample
Designed and Directed by: SocialSphere Inc.
(A) (B) (C) (D) (E) (F) (G) (H) (I) (J) (K) (L) (M) (N) (O) (P)
Union Household Gender
18-34 35-44 45-54 55-64 Less than College College +
Age Income Education
Comparison Groups: BCDEF/GHI/JK/LMN/OP, Independent T-Test for Means (based on test for equal variances), Independent Z-Test for Percentages (unpooled proportions), Uppercase letters indicate significance at the 95% level.
65+ Less than $50K $50-$100K More than
$100K Public Private Neither Male Female
Table Q18
Boston Globe Release 3 (Casinos), June 8-10, 15-17
How closely have you followed the Massachusetts Gaming Commission and its implementation of the expanded gaming law?
----- ----- ----- ----- ----- ----- ----- -------- ------ ----- ----- ------ ------- ------- ------ ------
(A) (B) (C) (D) (E) (F) (G) (H) (I) (J) (K) (L) (M) (N) (O) (P)
Percentage Base 630 89 91 132 151 166 97 146 249 214 414 110 37 451 288 342100% 100% 100% 100% 100% 100% 100% 100% 100% 100% 100% 100% 100% 100% 100% 100%
Unweighted Total 630 85 92 142 149 162 95 144 254 213 416 110 37 454 289 341
Net: Closely 418 54 59 85 105 115 57 107 169 148 269 79 29 293 210 208____________ 66% 60% 64% 64% 70% 69% 59% 74% 68% 69% 65% 71% 79% 65% 73% 61%
G P
Very closely 104 9 10 21 31 33 10 27 47 33 71 15 9 74 62 4217% 10% 11% 16% 21% 20% 11% 18% 19% 16% 17% 13% 25% 16% 21% 12%
BC B G P
Somewhat closely 314 45 49 64 74 83 46 81 122 115 198 64 20 219 149 16550% 51% 53% 48% 49% 50% 48% 55% 49% 53% 48% 58% 54% 48% 52% 48%
Net: Not closely 208 35 30 47 45 50 39 39 80 65 143 32 8 155 75 133________________ 33% 40% 33% 36% 30% 30% 40% 26% 32% 30% 35% 29% 21% 34% 26% 39%
H O
Not very closely 137 18 17 40 30 32 22 24 55 37 100 18 6 110 51 8622% 20% 19% 30% 20% 20% 23% 17% 22% 17% 24% 16% 15% 24% 18% 25%
F J L O
Not at all closely 71 18 13 8 15 18 17 14 25 28 43 14 2 45 24 4711% 20% 14% 6% 10% 11% 18% 10% 10% 13% 10% 13% 6% 10% 8% 14%
DE D O
Don't know 4 - 2 - 1 1 1 - 1 2 2 - - 3 2 21% 2% 0% 1% 1% 0% 1% 1% 1% 1% 0%
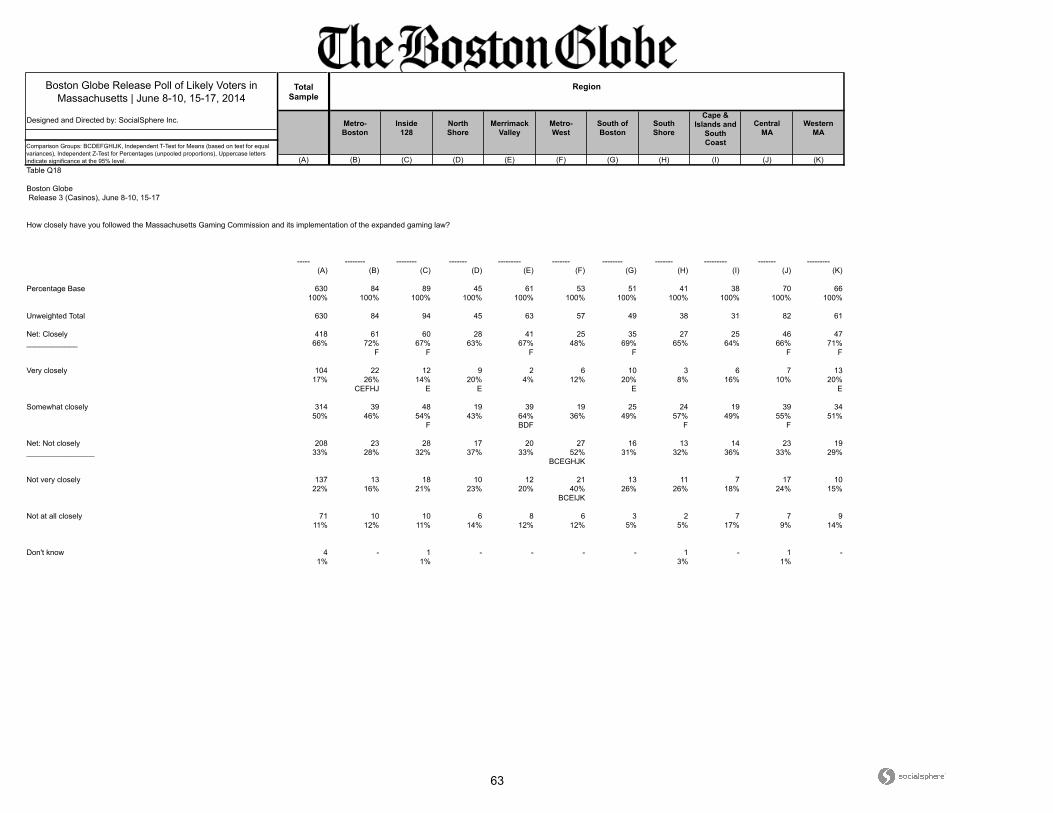
63
Boston Globe Release Poll of Likely Voters in Massachusetts | June 8-10, 15-17, 2014
Total Sample
Designed and Directed by: SocialSphere Inc.
(A) (B) (C) (D) (E) (F) (G) (H) (I) (J) (K)
CentralMA
WesternMA
Comparison Groups: BCDEFGHIJK, Independent T-Test for Means (based on test for equal variances), Independent Z-Test for Percentages (unpooled proportions), Uppercase letters indicate significance at the 95% level.
Region
Metro-Boston
Inside128
NorthShore
MerrimackValley
Metro-West
South ofBoston
SouthShore
Cape &Islands and
SouthCoast
Table Q18
Boston Globe Release 3 (Casinos), June 8-10, 15-17
How closely have you followed the Massachusetts Gaming Commission and its implementation of the expanded gaming law?
----- -------- -------- ------- --------- ------- -------- ------- --------- ------- ---------
(A) (B) (C) (D) (E) (F) (G) (H) (I) (J) (K)
Percentage Base 630 84 89 45 61 53 51 41 38 70 66100% 100% 100% 100% 100% 100% 100% 100% 100% 100% 100%
Unweighted Total 630 84 94 45 63 57 49 38 31 82 61
Net: Closely 418 61 60 28 41 25 35 27 25 46 47____________ 66% 72% 67% 63% 67% 48% 69% 65% 64% 66% 71%
F F F F F F
Very closely 104 22 12 9 2 6 10 3 6 7 1317% 26% 14% 20% 4% 12% 20% 8% 16% 10% 20%
CEFHJ E E E E
Somewhat closely 314 39 48 19 39 19 25 24 19 39 3450% 46% 54% 43% 64% 36% 49% 57% 49% 55% 51%
F BDF F F
Net: Not closely 208 23 28 17 20 27 16 13 14 23 19________________ 33% 28% 32% 37% 33% 52% 31% 32% 36% 33% 29%
BCEGHJK
Not very closely 137 13 18 10 12 21 13 11 7 17 1022% 16% 21% 23% 20% 40% 26% 26% 18% 24% 15%
BCEIJK
Not at all closely 71 10 10 6 8 6 3 2 7 7 911% 12% 11% 14% 12% 12% 5% 5% 17% 9% 14%
Don't know 4 - 1 - - - - 1 - 1 -1% 1% 3% 1%
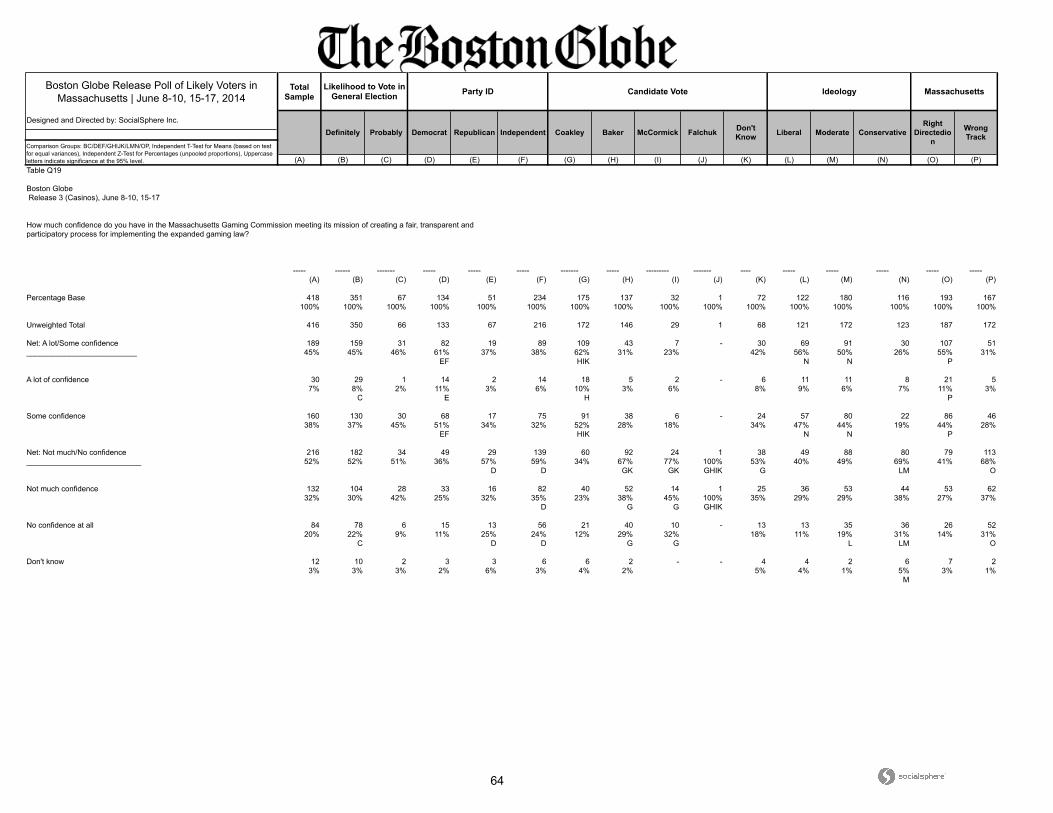
64
Boston Globe Release Poll of Likely Voters in Massachusetts | June 8-10, 15-17, 2014
Total Sample
Designed and Directed by: SocialSphere Inc.
(A) (B) (C) (D) (E) (F) (G) (H) (I) (J) (K) (L) (M) (N) (O) (P)
Ideology Massachusetts
Definitely Probably Democrat Republican Falchuk Don't Know
Likelihood to Vote in General Election Party ID Candidate Vote
Liberal Moderate ConservativeRight
Directedion
Comparison Groups: BC/DEF/GHIJK/LMN/OP, Independent T-Test for Means (based on test for equal variances), Independent Z-Test for Percentages (unpooled proportions), Uppercase letters indicate significance at the 95% level.
Independent Coakley Baker McCormick Wrong Track
Table Q19
Boston Globe Release 3 (Casinos), June 8-10, 15-17
How much confidence do you have in the Massachusetts Gaming Commission meeting its mission of creating a fair, transparent and participatory process for implementing the expanded gaming law?
----- ------ ------- ----- ----- ----- ------- ----- --------- ------- ---- ----- ----- ----- ----- -----
(A) (B) (C) (D) (E) (F) (G) (H) (I) (J) (K) (L) (M) (N) (O) (P)
Percentage Base 418 351 67 134 51 234 175 137 32 1 72 122 180 116 193 167100% 100% 100% 100% 100% 100% 100% 100% 100% 100% 100% 100% 100% 100% 100% 100%
Unweighted Total 416 350 66 133 67 216 172 146 29 1 68 121 172 123 187 172
Net: A lot/Some confidence 189 159 31 82 19 89 109 43 7 - 30 69 91 30 107 51__________________________ 45% 45% 46% 61% 37% 38% 62% 31% 23% 42% 56% 50% 26% 55% 31%
EF HIK N N P
A lot of confidence 30 29 1 14 2 14 18 5 2 - 6 11 11 8 21 57% 8% 2% 11% 3% 6% 10% 3% 6% 8% 9% 6% 7% 11% 3%
C E H P
Some confidence 160 130 30 68 17 75 91 38 6 - 24 57 80 22 86 4638% 37% 45% 51% 34% 32% 52% 28% 18% 34% 47% 44% 19% 44% 28%
EF HIK N N P
Net: Not much/No confidence 216 182 34 49 29 139 60 92 24 1 38 49 88 80 79 113___________________________ 52% 52% 51% 36% 57% 59% 34% 67% 77% 100% 53% 40% 49% 69% 41% 68%
D D GK GK GHIK G LM O
Not much confidence 132 104 28 33 16 82 40 52 14 1 25 36 53 44 53 6232% 30% 42% 25% 32% 35% 23% 38% 45% 100% 35% 29% 29% 38% 27% 37%
D G G GHIK
No confidence at all 84 78 6 15 13 56 21 40 10 - 13 13 35 36 26 5220% 22% 9% 11% 25% 24% 12% 29% 32% 18% 11% 19% 31% 14% 31%
C D D G G L LM O
Don't know 12 10 2 3 3 6 6 2 - - 4 4 2 6 7 23% 3% 3% 2% 6% 3% 4% 2% 5% 4% 1% 5% 3% 1%
M
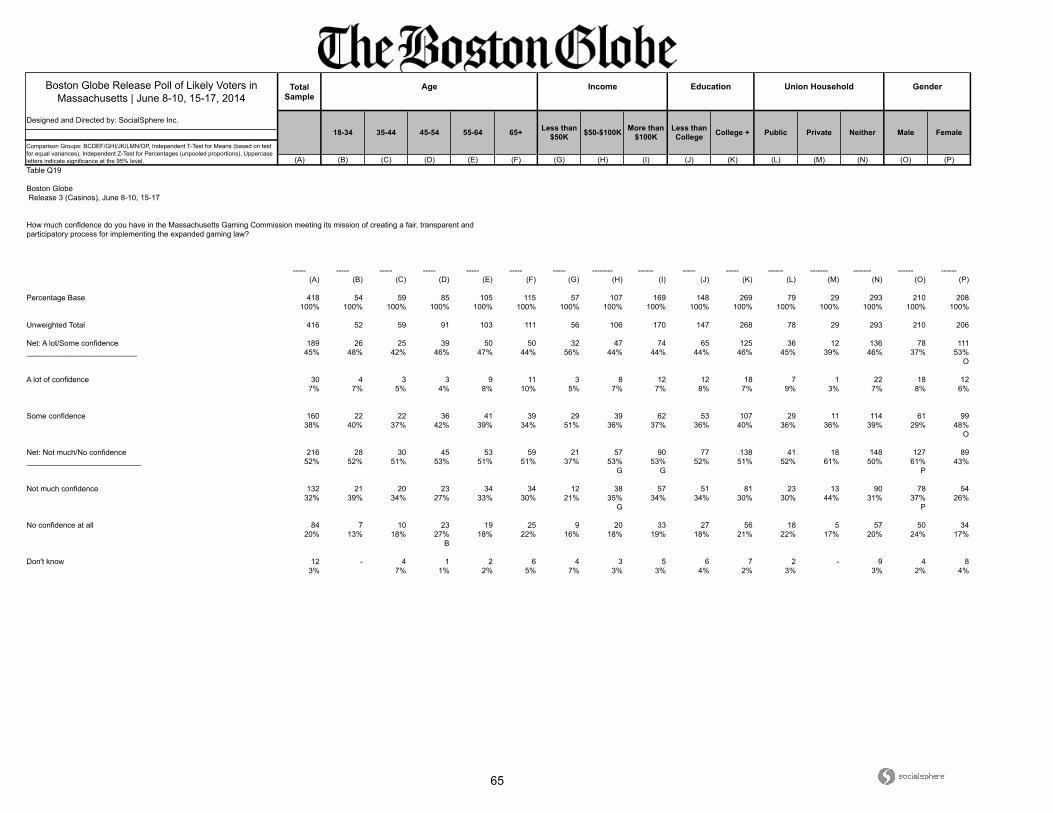
65
Boston Globe Release Poll of Likely Voters in Massachusetts | June 8-10, 15-17, 2014
Total Sample
Designed and Directed by: SocialSphere Inc.
(A) (B) (C) (D) (E) (F) (G) (H) (I) (J) (K) (L) (M) (N) (O) (P)
Union Household Gender
18-34 35-44 45-54 55-64 Less than College College +
Age Income Education
Comparison Groups: BCDEF/GHI/JK/LMN/OP, Independent T-Test for Means (based on test for equal variances), Independent Z-Test for Percentages (unpooled proportions), Uppercase letters indicate significance at the 95% level.
65+ Less than $50K $50-$100K More than
$100K Public Private Neither Male Female
Table Q19
Boston Globe Release 3 (Casinos), June 8-10, 15-17
How much confidence do you have in the Massachusetts Gaming Commission meeting its mission of creating a fair, transparent and participatory process for implementing the expanded gaming law?
----- ----- ----- ----- ----- ----- ----- -------- ------ ----- ----- ------ ------- ------- ------ ------
(A) (B) (C) (D) (E) (F) (G) (H) (I) (J) (K) (L) (M) (N) (O) (P)
Percentage Base 418 54 59 85 105 115 57 107 169 148 269 79 29 293 210 208100% 100% 100% 100% 100% 100% 100% 100% 100% 100% 100% 100% 100% 100% 100% 100%
Unweighted Total 416 52 59 91 103 111 56 106 170 147 268 78 29 293 210 206
Net: A lot/Some confidence 189 26 25 39 50 50 32 47 74 65 125 36 12 136 78 111__________________________ 45% 48% 42% 46% 47% 44% 56% 44% 44% 44% 46% 45% 39% 46% 37% 53%
O
A lot of confidence 30 4 3 3 9 11 3 8 12 12 18 7 1 22 18 127% 7% 5% 4% 8% 10% 5% 7% 7% 8% 7% 9% 3% 7% 8% 6%
Some confidence 160 22 22 36 41 39 29 39 62 53 107 29 11 114 61 9938% 40% 37% 42% 39% 34% 51% 36% 37% 36% 40% 36% 36% 39% 29% 48%
O
Net: Not much/No confidence 216 28 30 45 53 59 21 57 90 77 138 41 18 148 127 89___________________________ 52% 52% 51% 53% 51% 51% 37% 53% 53% 52% 51% 52% 61% 50% 61% 43%
G G P
Not much confidence 132 21 20 23 34 34 12 38 57 51 81 23 13 90 78 5432% 39% 34% 27% 33% 30% 21% 35% 34% 34% 30% 30% 44% 31% 37% 26%
G P
No confidence at all 84 7 10 23 19 25 9 20 33 27 56 18 5 57 50 3420% 13% 18% 27% 18% 22% 16% 18% 19% 18% 21% 22% 17% 20% 24% 17%
B
Don't know 12 - 4 1 2 6 4 3 5 6 7 2 - 9 4 83% 7% 1% 2% 5% 7% 3% 3% 4% 2% 3% 3% 2% 4%
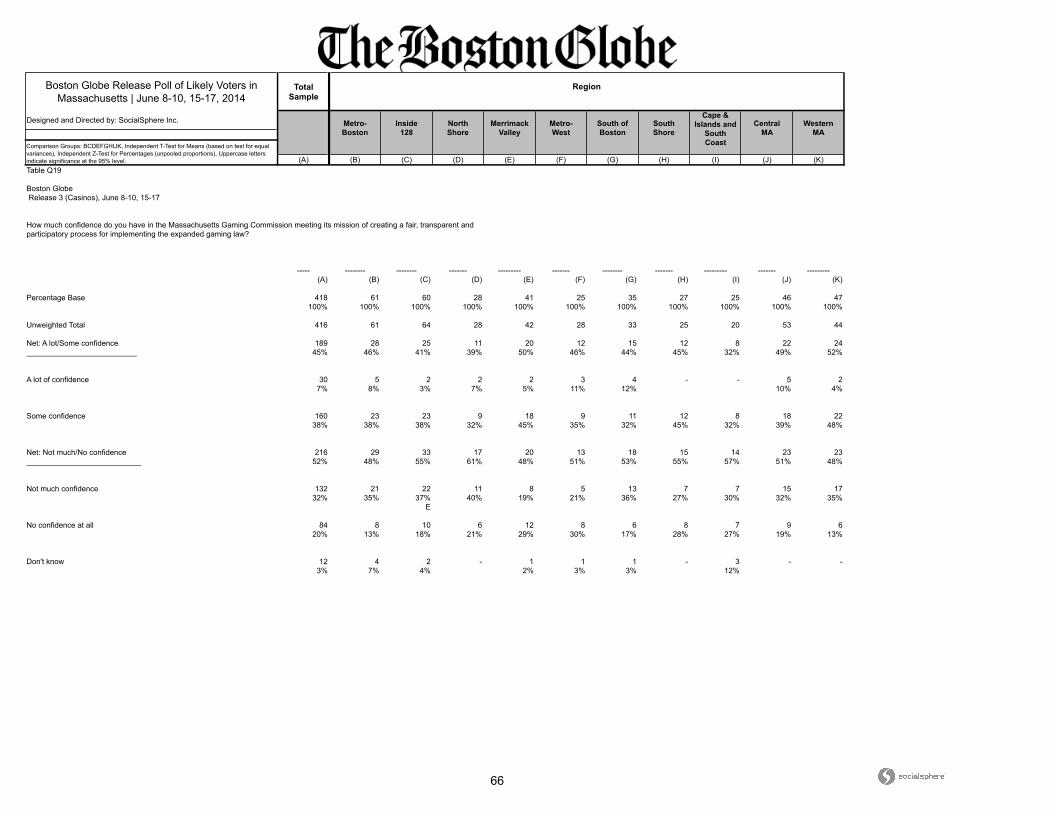
66
Boston Globe Release Poll of Likely Voters in Massachusetts | June 8-10, 15-17, 2014
Total Sample
Designed and Directed by: SocialSphere Inc.
(A) (B) (C) (D) (E) (F) (G) (H) (I) (J) (K)
CentralMA
WesternMA
Comparison Groups: BCDEFGHIJK, Independent T-Test for Means (based on test for equal variances), Independent Z-Test for Percentages (unpooled proportions), Uppercase letters indicate significance at the 95% level.
Region
Metro-Boston
Inside128
NorthShore
MerrimackValley
Metro-West
South ofBoston
SouthShore
Cape &Islands and
SouthCoast
Table Q19
Boston Globe Release 3 (Casinos), June 8-10, 15-17
How much confidence do you have in the Massachusetts Gaming Commission meeting its mission of creating a fair, transparent and participatory process for implementing the expanded gaming law?
----- -------- -------- ------- --------- ------- -------- ------- --------- ------- ---------
(A) (B) (C) (D) (E) (F) (G) (H) (I) (J) (K)
Percentage Base 418 61 60 28 41 25 35 27 25 46 47100% 100% 100% 100% 100% 100% 100% 100% 100% 100% 100%
Unweighted Total 416 61 64 28 42 28 33 25 20 53 44
Net: A lot/Some confidence 189 28 25 11 20 12 15 12 8 22 24__________________________ 45% 46% 41% 39% 50% 46% 44% 45% 32% 49% 52%
A lot of confidence 30 5 2 2 2 3 4 - - 5 27% 8% 3% 7% 5% 11% 12% 10% 4%
Some confidence 160 23 23 9 18 9 11 12 8 18 2238% 38% 38% 32% 45% 35% 32% 45% 32% 39% 48%
Net: Not much/No confidence 216 29 33 17 20 13 18 15 14 23 23___________________________ 52% 48% 55% 61% 48% 51% 53% 55% 57% 51% 48%
Not much confidence 132 21 22 11 8 5 13 7 7 15 1732% 35% 37% 40% 19% 21% 36% 27% 30% 32% 35%
E
No confidence at all 84 8 10 6 12 8 6 8 7 9 620% 13% 18% 21% 29% 30% 17% 28% 27% 19% 13%
Don't know 12 4 2 - 1 1 1 - 3 - -3% 7% 4% 2% 3% 3% 12%
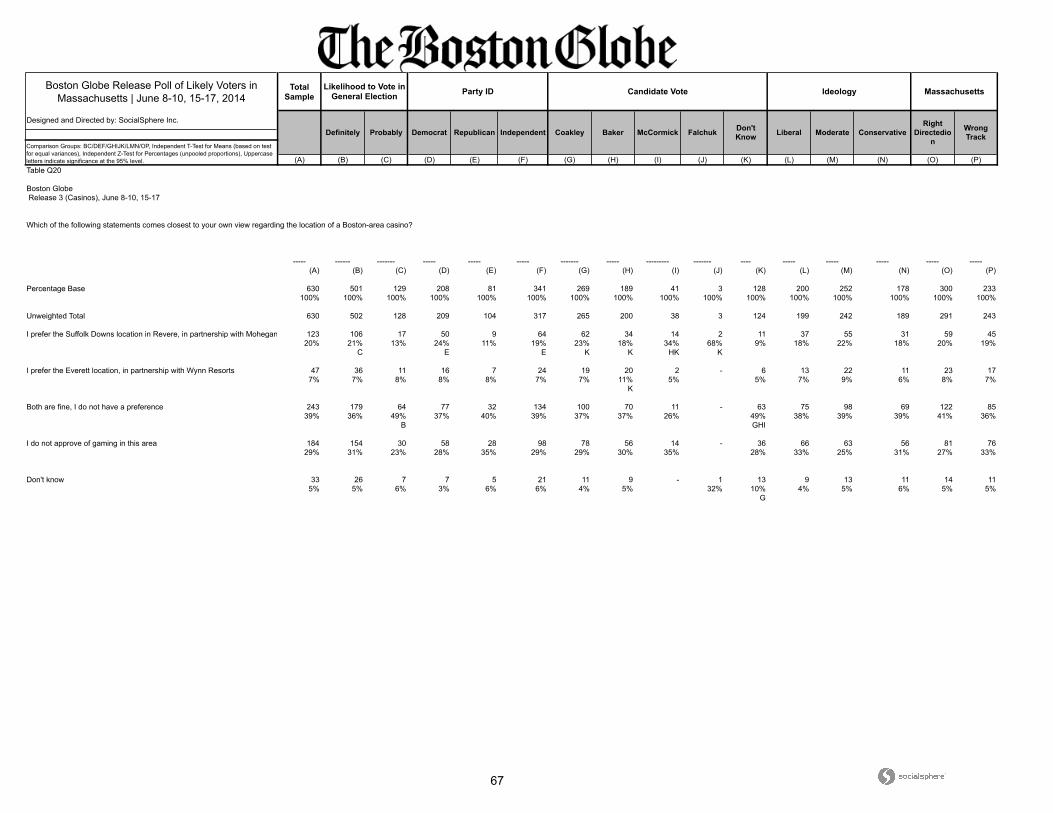
67
Boston Globe Release Poll of Likely Voters in Massachusetts | June 8-10, 15-17, 2014
Total Sample
Designed and Directed by: SocialSphere Inc.
(A) (B) (C) (D) (E) (F) (G) (H) (I) (J) (K) (L) (M) (N) (O) (P)
Ideology Massachusetts
Definitely Probably Democrat Republican Falchuk Don't Know
Likelihood to Vote in General Election Party ID Candidate Vote
Liberal Moderate ConservativeRight
Directedion
Comparison Groups: BC/DEF/GHIJK/LMN/OP, Independent T-Test for Means (based on test for equal variances), Independent Z-Test for Percentages (unpooled proportions), Uppercase letters indicate significance at the 95% level.
Independent Coakley Baker McCormick Wrong Track
Table Q20
Boston Globe Release 3 (Casinos), June 8-10, 15-17
Which of the following statements comes closest to your own view regarding the location of a Boston-area casino?
----- ------ ------- ----- ----- ----- ------- ----- --------- ------- ---- ----- ----- ----- ----- -----
(A) (B) (C) (D) (E) (F) (G) (H) (I) (J) (K) (L) (M) (N) (O) (P)
Percentage Base 630 501 129 208 81 341 269 189 41 3 128 200 252 178 300 233100% 100% 100% 100% 100% 100% 100% 100% 100% 100% 100% 100% 100% 100% 100% 100%
Unweighted Total 630 502 128 209 104 317 265 200 38 3 124 199 242 189 291 243
I prefer the Suffolk Downs location in Revere, in partnership with Mohegan Sun 123 106 17 50 9 64 62 34 14 2 11 37 55 31 59 4520% 21% 13% 24% 11% 19% 23% 18% 34% 68% 9% 18% 22% 18% 20% 19%
C E E K K HK K
I prefer the Everett location, in partnership with Wynn Resorts 47 36 11 16 7 24 19 20 2 - 6 13 22 11 23 177% 7% 8% 8% 8% 7% 7% 11% 5% 5% 7% 9% 6% 8% 7%
K
Both are fine, I do not have a preference 243 179 64 77 32 134 100 70 11 - 63 75 98 69 122 8539% 36% 49% 37% 40% 39% 37% 37% 26% 49% 38% 39% 39% 41% 36%
B GHI
I do not approve of gaming in this area 184 154 30 58 28 98 78 56 14 - 36 66 63 56 81 7629% 31% 23% 28% 35% 29% 29% 30% 35% 28% 33% 25% 31% 27% 33%
Don't know 33 26 7 7 5 21 11 9 - 1 13 9 13 11 14 115% 5% 6% 3% 6% 6% 4% 5% 32% 10% 4% 5% 6% 5% 5%
G
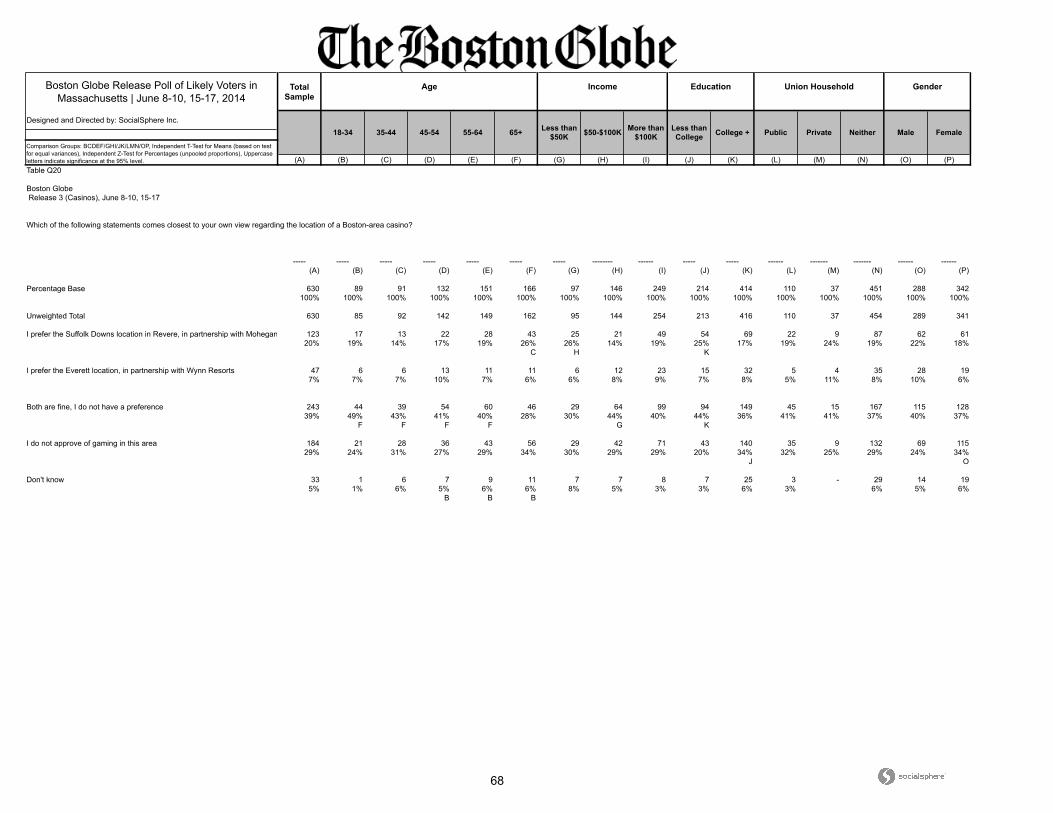
68
Boston Globe Release Poll of Likely Voters in Massachusetts | June 8-10, 15-17, 2014
Total Sample
Designed and Directed by: SocialSphere Inc.
(A) (B) (C) (D) (E) (F) (G) (H) (I) (J) (K) (L) (M) (N) (O) (P)
Union Household Gender
18-34 35-44 45-54 55-64 Less than College College +
Age Income Education
Comparison Groups: BCDEF/GHI/JK/LMN/OP, Independent T-Test for Means (based on test for equal variances), Independent Z-Test for Percentages (unpooled proportions), Uppercase letters indicate significance at the 95% level.
65+ Less than $50K $50-$100K More than
$100K Public Private Neither Male Female
Table Q20
Boston Globe Release 3 (Casinos), June 8-10, 15-17
Which of the following statements comes closest to your own view regarding the location of a Boston-area casino?
----- ----- ----- ----- ----- ----- ----- -------- ------ ----- ----- ------ ------- ------- ------ ------
(A) (B) (C) (D) (E) (F) (G) (H) (I) (J) (K) (L) (M) (N) (O) (P)
Percentage Base 630 89 91 132 151 166 97 146 249 214 414 110 37 451 288 342100% 100% 100% 100% 100% 100% 100% 100% 100% 100% 100% 100% 100% 100% 100% 100%
Unweighted Total 630 85 92 142 149 162 95 144 254 213 416 110 37 454 289 341
I prefer the Suffolk Downs location in Revere, in partnership with Mohegan Sun 123 17 13 22 28 43 25 21 49 54 69 22 9 87 62 6120% 19% 14% 17% 19% 26% 26% 14% 19% 25% 17% 19% 24% 19% 22% 18%
C H K
I prefer the Everett location, in partnership with Wynn Resorts 47 6 6 13 11 11 6 12 23 15 32 5 4 35 28 197% 7% 7% 10% 7% 6% 6% 8% 9% 7% 8% 5% 11% 8% 10% 6%
Both are fine, I do not have a preference 243 44 39 54 60 46 29 64 99 94 149 45 15 167 115 12839% 49% 43% 41% 40% 28% 30% 44% 40% 44% 36% 41% 41% 37% 40% 37%
F F F F G K
I do not approve of gaming in this area 184 21 28 36 43 56 29 42 71 43 140 35 9 132 69 11529% 24% 31% 27% 29% 34% 30% 29% 29% 20% 34% 32% 25% 29% 24% 34%
J O
Don't know 33 1 6 7 9 11 7 7 8 7 25 3 - 29 14 195% 1% 6% 5% 6% 6% 8% 5% 3% 3% 6% 3% 6% 5% 6%
B B B
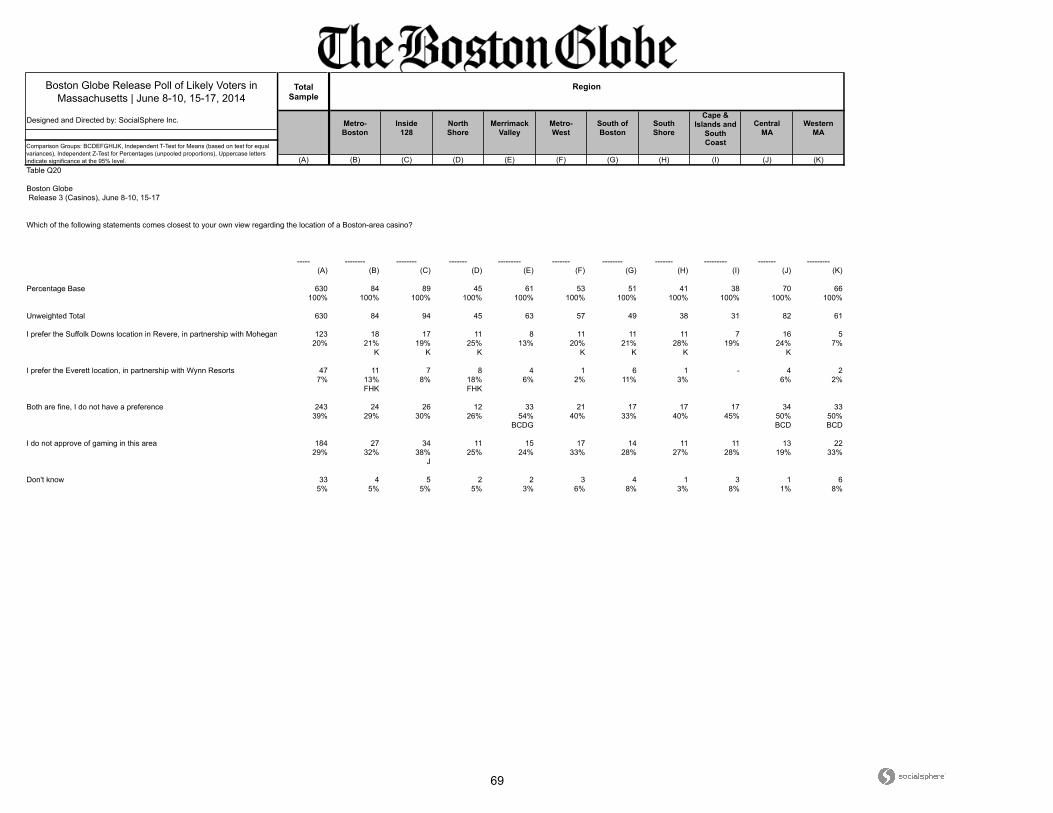
69
Boston Globe Release Poll of Likely Voters in Massachusetts | June 8-10, 15-17, 2014
Total Sample
Designed and Directed by: SocialSphere Inc.
(A) (B) (C) (D) (E) (F) (G) (H) (I) (J) (K)
CentralMA
WesternMA
Comparison Groups: BCDEFGHIJK, Independent T-Test for Means (based on test for equal variances), Independent Z-Test for Percentages (unpooled proportions), Uppercase letters indicate significance at the 95% level.
Region
Metro-Boston
Inside128
NorthShore
MerrimackValley
Metro-West
South ofBoston
SouthShore
Cape &Islands and
SouthCoast
Table Q20
Boston Globe Release 3 (Casinos), June 8-10, 15-17
Which of the following statements comes closest to your own view regarding the location of a Boston-area casino?
----- -------- -------- ------- --------- ------- -------- ------- --------- ------- ---------
(A) (B) (C) (D) (E) (F) (G) (H) (I) (J) (K)
Percentage Base 630 84 89 45 61 53 51 41 38 70 66100% 100% 100% 100% 100% 100% 100% 100% 100% 100% 100%
Unweighted Total 630 84 94 45 63 57 49 38 31 82 61
I prefer the Suffolk Downs location in Revere, in partnership with Mohegan Sun 123 18 17 11 8 11 11 11 7 16 520% 21% 19% 25% 13% 20% 21% 28% 19% 24% 7%
K K K K K K K
I prefer the Everett location, in partnership with Wynn Resorts 47 11 7 8 4 1 6 1 - 4 27% 13% 8% 18% 6% 2% 11% 3% 6% 2%
FHK FHK
Both are fine, I do not have a preference 243 24 26 12 33 21 17 17 17 34 3339% 29% 30% 26% 54% 40% 33% 40% 45% 50% 50%
BCDG BCD BCD
I do not approve of gaming in this area 184 27 34 11 15 17 14 11 11 13 2229% 32% 38% 25% 24% 33% 28% 27% 28% 19% 33%
J
Don't know 33 4 5 2 2 3 4 1 3 1 65% 5% 5% 5% 3% 6% 8% 3% 8% 1% 8%
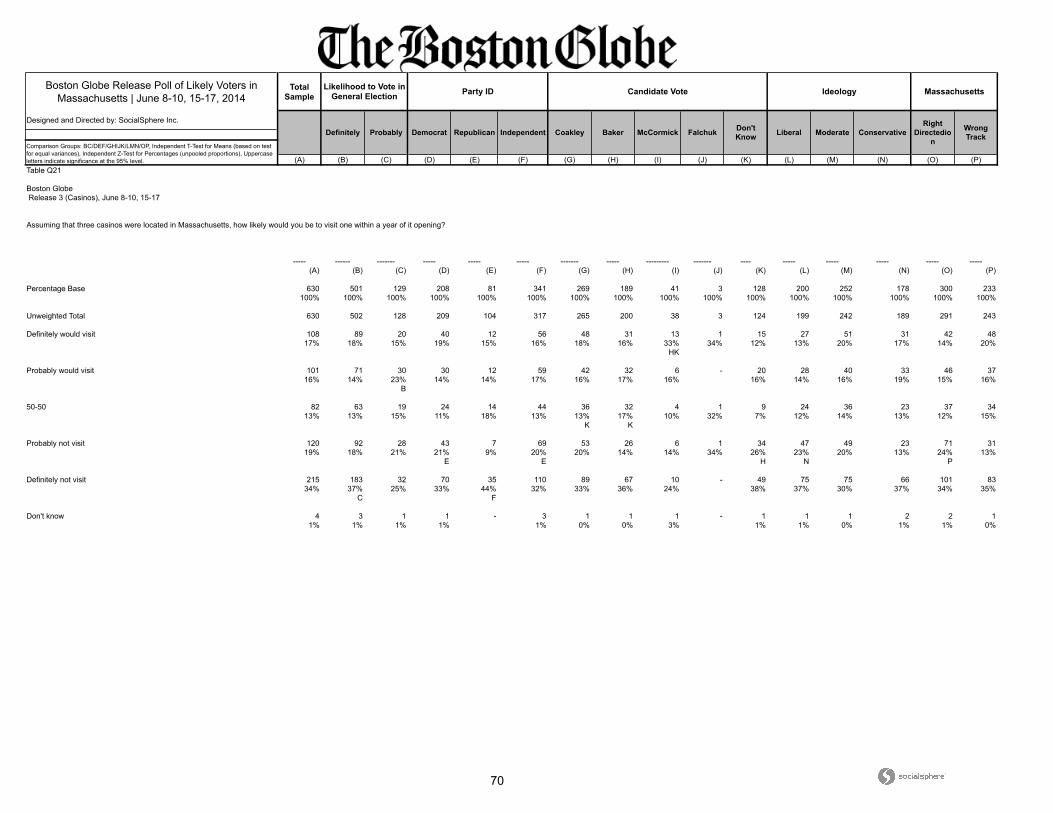
70
Boston Globe Release Poll of Likely Voters in Massachusetts | June 8-10, 15-17, 2014
Total Sample
Designed and Directed by: SocialSphere Inc.
(A) (B) (C) (D) (E) (F) (G) (H) (I) (J) (K) (L) (M) (N) (O) (P)
Ideology Massachusetts
Definitely Probably Democrat Republican Falchuk Don't Know
Likelihood to Vote in General Election Party ID Candidate Vote
Liberal Moderate ConservativeRight
Directedion
Comparison Groups: BC/DEF/GHIJK/LMN/OP, Independent T-Test for Means (based on test for equal variances), Independent Z-Test for Percentages (unpooled proportions), Uppercase letters indicate significance at the 95% level.
Independent Coakley Baker McCormick Wrong Track
Table Q21
Boston Globe Release 3 (Casinos), June 8-10, 15-17
Assuming that three casinos were located in Massachusetts, how likely would you be to visit one within a year of it opening?
----- ------ ------- ----- ----- ----- ------- ----- --------- ------- ---- ----- ----- ----- ----- -----
(A) (B) (C) (D) (E) (F) (G) (H) (I) (J) (K) (L) (M) (N) (O) (P)
Percentage Base 630 501 129 208 81 341 269 189 41 3 128 200 252 178 300 233100% 100% 100% 100% 100% 100% 100% 100% 100% 100% 100% 100% 100% 100% 100% 100%
Unweighted Total 630 502 128 209 104 317 265 200 38 3 124 199 242 189 291 243
Definitely would visit 108 89 20 40 12 56 48 31 13 1 15 27 51 31 42 4817% 18% 15% 19% 15% 16% 18% 16% 33% 34% 12% 13% 20% 17% 14% 20%
HK
Probably would visit 101 71 30 30 12 59 42 32 6 - 20 28 40 33 46 3716% 14% 23% 14% 14% 17% 16% 17% 16% 16% 14% 16% 19% 15% 16%
B
50-50 82 63 19 24 14 44 36 32 4 1 9 24 36 23 37 3413% 13% 15% 11% 18% 13% 13% 17% 10% 32% 7% 12% 14% 13% 12% 15%
K K
Probably not visit 120 92 28 43 7 69 53 26 6 1 34 47 49 23 71 3119% 18% 21% 21% 9% 20% 20% 14% 14% 34% 26% 23% 20% 13% 24% 13%
E E H N P
Definitely not visit 215 183 32 70 35 110 89 67 10 - 49 75 75 66 101 8334% 37% 25% 33% 44% 32% 33% 36% 24% 38% 37% 30% 37% 34% 35%
C F
Don't know 4 3 1 1 - 3 1 1 1 - 1 1 1 2 2 11% 1% 1% 1% 1% 0% 0% 3% 1% 1% 0% 1% 1% 0%
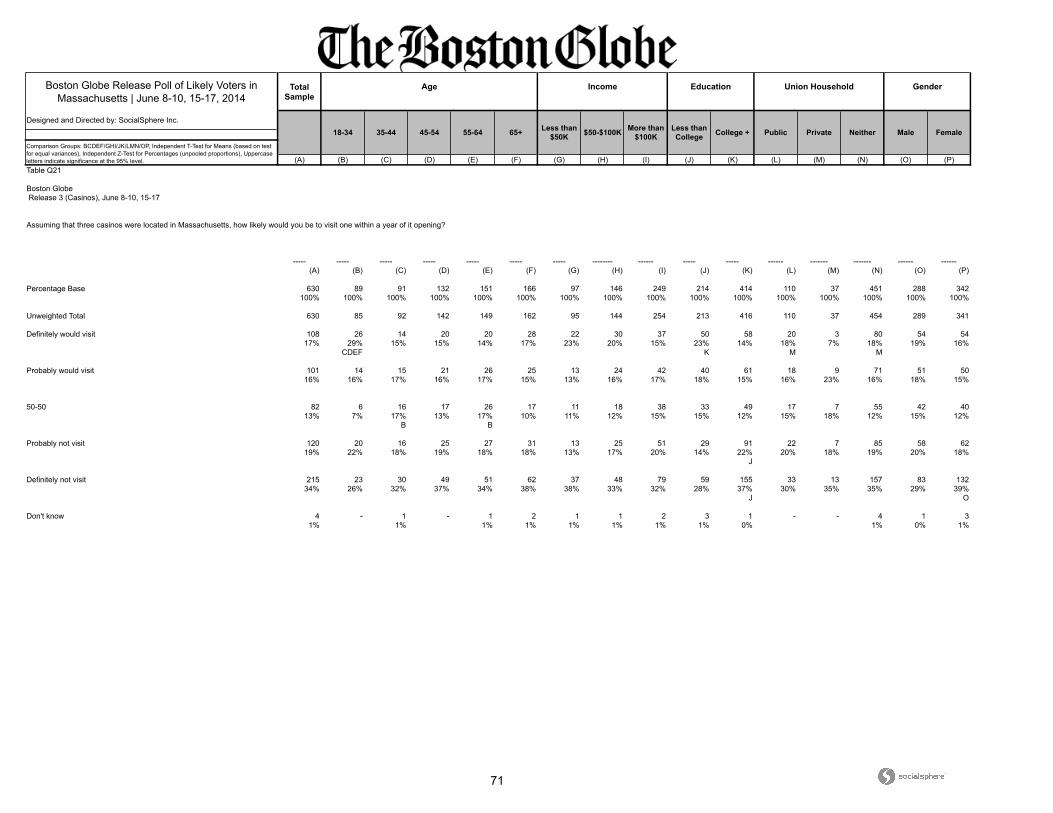
71
Boston Globe Release Poll of Likely Voters in Massachusetts | June 8-10, 15-17, 2014
Total Sample
Designed and Directed by: SocialSphere Inc.
(A) (B) (C) (D) (E) (F) (G) (H) (I) (J) (K) (L) (M) (N) (O) (P)
Union Household Gender
18-34 35-44 45-54 55-64 Less than College College +
Age Income Education
Comparison Groups: BCDEF/GHI/JK/LMN/OP, Independent T-Test for Means (based on test for equal variances), Independent Z-Test for Percentages (unpooled proportions), Uppercase letters indicate significance at the 95% level.
65+ Less than $50K $50-$100K More than
$100K Public Private Neither Male Female
Table Q21
Boston Globe Release 3 (Casinos), June 8-10, 15-17
Assuming that three casinos were located in Massachusetts, how likely would you be to visit one within a year of it opening?
----- ----- ----- ----- ----- ----- ----- -------- ------ ----- ----- ------ ------- ------- ------ ------
(A) (B) (C) (D) (E) (F) (G) (H) (I) (J) (K) (L) (M) (N) (O) (P)
Percentage Base 630 89 91 132 151 166 97 146 249 214 414 110 37 451 288 342100% 100% 100% 100% 100% 100% 100% 100% 100% 100% 100% 100% 100% 100% 100% 100%
Unweighted Total 630 85 92 142 149 162 95 144 254 213 416 110 37 454 289 341
Definitely would visit 108 26 14 20 20 28 22 30 37 50 58 20 3 80 54 5417% 29% 15% 15% 14% 17% 23% 20% 15% 23% 14% 18% 7% 18% 19% 16%
CDEF K M M
Probably would visit 101 14 15 21 26 25 13 24 42 40 61 18 9 71 51 5016% 16% 17% 16% 17% 15% 13% 16% 17% 18% 15% 16% 23% 16% 18% 15%
50-50 82 6 16 17 26 17 11 18 38 33 49 17 7 55 42 4013% 7% 17% 13% 17% 10% 11% 12% 15% 15% 12% 15% 18% 12% 15% 12%
B B
Probably not visit 120 20 16 25 27 31 13 25 51 29 91 22 7 85 58 6219% 22% 18% 19% 18% 18% 13% 17% 20% 14% 22% 20% 18% 19% 20% 18%
J
Definitely not visit 215 23 30 49 51 62 37 48 79 59 155 33 13 157 83 13234% 26% 32% 37% 34% 38% 38% 33% 32% 28% 37% 30% 35% 35% 29% 39%
J O
Don't know 4 - 1 - 1 2 1 1 2 3 1 - - 4 1 31% 1% 1% 1% 1% 1% 1% 1% 0% 1% 0% 1%

72
Boston Globe Release Poll of Likely Voters in Massachusetts | June 8-10, 15-17, 2014
Total Sample
Designed and Directed by: SocialSphere Inc.
(A) (B) (C) (D) (E) (F) (G) (H) (I) (J) (K)
CentralMA
WesternMA
Comparison Groups: BCDEFGHIJK, Independent T-Test for Means (based on test for equal variances), Independent Z-Test for Percentages (unpooled proportions), Uppercase letters indicate significance at the 95% level.
Region
Metro-Boston
Inside128
NorthShore
MerrimackValley
Metro-West
South ofBoston
SouthShore
Cape &Islands and
SouthCoast
Table Q21
Boston Globe Release 3 (Casinos), June 8-10, 15-17
Assuming that three casinos were located in Massachusetts, how likely would you be to visit one within a year of it opening?
----- -------- -------- ------- --------- ------- -------- ------- --------- ------- ---------
(A) (B) (C) (D) (E) (F) (G) (H) (I) (J) (K)
Percentage Base 630 84 89 45 61 53 51 41 38 70 66100% 100% 100% 100% 100% 100% 100% 100% 100% 100% 100%
Unweighted Total 630 84 94 45 63 57 49 38 31 82 61
Definitely would visit 108 21 9 9 11 8 12 4 7 13 1017% 25% 10% 20% 17% 16% 24% 11% 19% 18% 15%
CH C
Probably would visit 101 14 14 6 9 5 8 9 3 12 1216% 17% 16% 14% 14% 10% 16% 21% 8% 18% 18%
50-50 82 6 12 5 10 9 3 12 6 9 613% 7% 13% 12% 16% 16% 6% 29% 15% 13% 10%
BGK
Probably not visit 120 16 21 9 14 7 11 2 4 14 1619% 20% 24% 20% 22% 13% 21% 6% 12% 20% 24%
H H H H H H H
Definitely not visit 215 27 31 15 18 24 16 14 18 21 2134% 32% 34% 33% 30% 45% 32% 34% 46% 30% 31%
Don't know 4 - 2 - - - - - - 1 11% 2% 1% 2%

73
Boston Globe Release Poll of Likely Voters in Massachusetts | June 8-10, 15-17, 2014
Total Sample
Designed and Directed by: SocialSphere Inc.
(A) (B) (C) (D) (E) (F) (G) (H) (I) (J) (K) (L) (M) (N) (O) (P)
Ideology Massachusetts
Definitely Probably Democrat Republican Falchuk Don't Know
Likelihood to Vote in General Election Party ID Candidate Vote
Liberal Moderate ConservativeRight
Directedion
Comparison Groups: BC/DEF/GHIJK/LMN/OP, Independent T-Test for Means (based on test for equal variances), Independent Z-Test for Percentages (unpooled proportions), Uppercase letters indicate significance at the 95% level.
Independent Coakley Baker McCormick Wrong Track
Table Q22
Boston Globe Release 3 (Casinos), June 8-10, 15-17
In the last two years, have you placed a bet at a casino?
----- ------ ------- ----- ----- ----- ------- ----- --------- ------- ---- ----- ----- ----- ----- -----
(A) (B) (C) (D) (E) (F) (G) (H) (I) (J) (K) (L) (M) (N) (O) (P)
Percentage Base 630 501 129 208 81 341 269 189 41 3 128 200 252 178 300 233100% 100% 100% 100% 100% 100% 100% 100% 100% 100% 100% 100% 100% 100% 100% 100%
Unweighted Total 630 502 128 209 104 317 265 200 38 3 124 199 242 189 291 243
Yes 181 139 43 56 24 101 75 61 16 - 29 51 76 54 81 7429% 28% 33% 27% 30% 30% 28% 32% 39% 23% 26% 30% 30% 27% 32%
No 447 361 86 152 56 239 193 128 25 3 99 149 174 124 217 15971% 72% 67% 73% 70% 70% 72% 68% 61% 100% 77% 74% 69% 70% 72% 68%
GHIK
Don't know 1 1 - - - 1 1 - - - - - 1 - 1 -0% 0% 0% 0% 0% 0%

74
Boston Globe Release Poll of Likely Voters in Massachusetts | June 8-10, 15-17, 2014
Total Sample
Designed and Directed by: SocialSphere Inc.
(A) (B) (C) (D) (E) (F) (G) (H) (I) (J) (K) (L) (M) (N) (O) (P)
Union Household Gender
18-34 35-44 45-54 55-64 Less than College College +
Age Income Education
Comparison Groups: BCDEF/GHI/JK/LMN/OP, Independent T-Test for Means (based on test for equal variances), Independent Z-Test for Percentages (unpooled proportions), Uppercase letters indicate significance at the 95% level.
65+ Less than $50K $50-$100K More than
$100K Public Private Neither Male Female
Table Q22
Boston Globe Release 3 (Casinos), June 8-10, 15-17
In the last two years, have you placed a bet at a casino?
----- ----- ----- ----- ----- ----- ----- -------- ------ ----- ----- ------ ------- ------- ------ ------
(A) (B) (C) (D) (E) (F) (G) (H) (I) (J) (K) (L) (M) (N) (O) (P)
Percentage Base 630 89 91 132 151 166 97 146 249 214 414 110 37 451 288 342100% 100% 100% 100% 100% 100% 100% 100% 100% 100% 100% 100% 100% 100% 100% 100%
Unweighted Total 630 85 92 142 149 162 95 144 254 213 416 110 37 454 289 341
Yes 181 28 23 42 49 38 25 39 83 67 114 42 13 123 95 8729% 32% 25% 32% 33% 23% 26% 27% 33% 31% 28% 38% 34% 27% 33% 25%
N P
No 447 61 67 90 101 128 72 107 165 147 299 68 25 327 193 25471% 68% 73% 68% 67% 77% 74% 73% 66% 69% 72% 62% 66% 73% 67% 74%
L
Don't know 1 - 1 - - - - - 1 - 1 - - 1 - 10% 1% 0% 0% 0% 0%

75
Boston Globe Release Poll of Likely Voters in Massachusetts | June 8-10, 15-17, 2014
Total Sample
Designed and Directed by: SocialSphere Inc.
(A) (B) (C) (D) (E) (F) (G) (H) (I) (J) (K)
CentralMA
WesternMA
Comparison Groups: BCDEFGHIJK, Independent T-Test for Means (based on test for equal variances), Independent Z-Test for Percentages (unpooled proportions), Uppercase letters indicate significance at the 95% level.
Region
Metro-Boston
Inside128
NorthShore
MerrimackValley
Metro-West
South ofBoston
SouthShore
Cape &Islands and
SouthCoast
Table Q22
Boston Globe Release 3 (Casinos), June 8-10, 15-17
In the last two years, have you placed a bet at a casino?
----- -------- -------- ------- --------- ------- -------- ------- --------- ------- ---------
(A) (B) (C) (D) (E) (F) (G) (H) (I) (J) (K)
Percentage Base 630 84 89 45 61 53 51 41 38 70 66100% 100% 100% 100% 100% 100% 100% 100% 100% 100% 100%
Unweighted Total 630 84 94 45 63 57 49 38 31 82 61
Yes 181 30 23 16 16 11 15 9 8 24 2129% 35% 26% 35% 27% 20% 30% 22% 21% 34% 32%
F
No 447 55 66 29 45 42 36 32 30 46 4471% 65% 74% 65% 73% 80% 70% 78% 79% 66% 66%
B
Don't know 1 - - - - - - - - - 10% 2%

76
Boston Globe Release Poll of Likely Voters in Massachusetts | June 8-10, 15-17, 2014
Total Sample
Designed and Directed by: SocialSphere Inc.
(A) (B) (C) (D) (E) (F) (G) (H) (I) (J) (K) (L) (M) (N) (O) (P)
Ideology Massachusetts
Definitely Probably Democrat Republican Falchuk Don't Know
Likelihood to Vote in General Election Party ID Candidate Vote
Liberal Moderate ConservativeRight
Directedion
Comparison Groups: BC/DEF/GHIJK/LMN/OP, Independent T-Test for Means (based on test for equal variances), Independent Z-Test for Percentages (unpooled proportions), Uppercase letters indicate significance at the 95% level.
Independent Coakley Baker McCormick Wrong Track
Table Q23
Boston Globe Release 3 (Casinos), June 8-10, 15-17
Which of the following casino games do you most prefer?
----- ------ ------- ----- ----- ----- ------- ----- --------- ------- ---- ----- ----- ----- ----- -----
(A) (B) (C) (D) (E) (F) (G) (H) (I) (J) (K) (L) (M) (N) (O) (P)
Percentage Base 181 139 43 56 24 101 75 61 16 - 29 51 76 54 81 74100% 100% 100% 100% 100% 100% 100% 100% 100% 100% 100% 100% 100% 100% 100%
Unweighted Total 182 139 43 57 32 93 74 66 14 - 28 51 74 57 79 78
Slot machines 87 70 17 33 12 43 36 26 9 - 16 19 39 29 38 3648% 50% 40% 59% 47% 42% 48% 43% 56% 53% 36% 52% 54% 47% 49%
Table games like Blackjack, Craps or Roulette 73 51 22 20 7 46 31 25 7 - 10 26 29 18 35 2940% 37% 51% 36% 29% 45% 40% 42% 44% 35% 51% 38% 33% 43% 39%
Poker 9 8 2 1 3 5 5 3 - - 1 4 2 3 3 45% 5% 4% 2% 13% 5% 7% 6% 4% 8% 2% 6% 4% 6%
Video poker 7 6 1 2 1 4 3 3 - - 1 2 4 1 3 24% 5% 2% 3% 6% 4% 4% 6% 4% 4% 5% 3% 4% 3%
Other 3 2 1 - 1 2 1 2 - - - - 2 1 1 22% 2% 2% 5% 2% 1% 4% 3% 2% 1% 3%
Don't know 1 1 - - - 1 - - - - 1 - - 1 1 -1% 1% 1% 4% 2% 1%
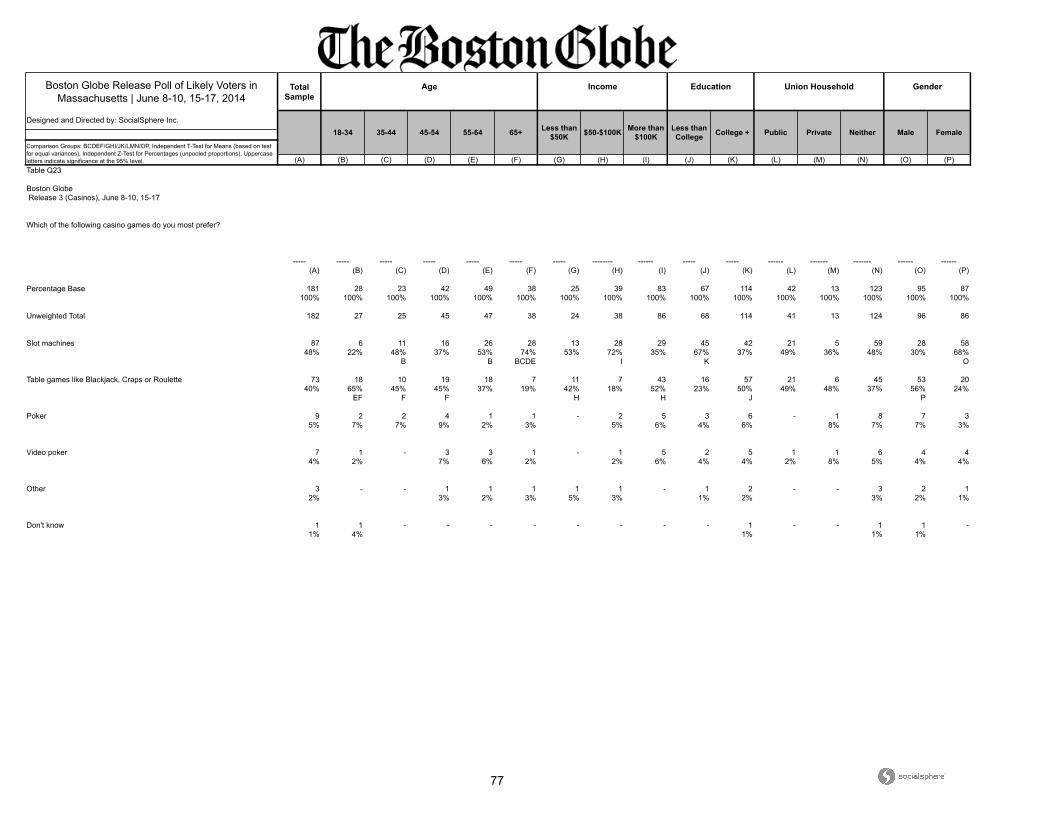
77
Boston Globe Release Poll of Likely Voters in Massachusetts | June 8-10, 15-17, 2014
Total Sample
Designed and Directed by: SocialSphere Inc.
(A) (B) (C) (D) (E) (F) (G) (H) (I) (J) (K) (L) (M) (N) (O) (P)
Union Household Gender
18-34 35-44 45-54 55-64 Less than College College +
Age Income Education
Comparison Groups: BCDEF/GHI/JK/LMN/OP, Independent T-Test for Means (based on test for equal variances), Independent Z-Test for Percentages (unpooled proportions), Uppercase letters indicate significance at the 95% level.
65+ Less than $50K $50-$100K More than
$100K Public Private Neither Male Female
Table Q23
Boston Globe Release 3 (Casinos), June 8-10, 15-17
Which of the following casino games do you most prefer?
----- ----- ----- ----- ----- ----- ----- -------- ------ ----- ----- ------ ------- ------- ------ ------
(A) (B) (C) (D) (E) (F) (G) (H) (I) (J) (K) (L) (M) (N) (O) (P)
Percentage Base 181 28 23 42 49 38 25 39 83 67 114 42 13 123 95 87100% 100% 100% 100% 100% 100% 100% 100% 100% 100% 100% 100% 100% 100% 100% 100%
Unweighted Total 182 27 25 45 47 38 24 38 86 68 114 41 13 124 96 86
Slot machines 87 6 11 16 26 28 13 28 29 45 42 21 5 59 28 5848% 22% 48% 37% 53% 74% 53% 72% 35% 67% 37% 49% 36% 48% 30% 68%
B B BCDE I K O
Table games like Blackjack, Craps or Roulette 73 18 10 19 18 7 11 7 43 16 57 21 6 45 53 2040% 65% 45% 45% 37% 19% 42% 18% 52% 23% 50% 49% 48% 37% 56% 24%
EF F F H H J P
Poker 9 2 2 4 1 1 - 2 5 3 6 - 1 8 7 35% 7% 7% 9% 2% 3% 5% 6% 4% 6% 8% 7% 7% 3%
Video poker 7 1 - 3 3 1 - 1 5 2 5 1 1 6 4 44% 2% 7% 6% 2% 2% 6% 4% 4% 2% 8% 5% 4% 4%
Other 3 - - 1 1 1 1 1 - 1 2 - - 3 2 12% 3% 2% 3% 5% 3% 1% 2% 3% 2% 1%
Don't know 1 1 - - - - - - - - 1 - - 1 1 -1% 4% 1% 1% 1%

78
Boston Globe Release Poll of Likely Voters in Massachusetts | June 8-10, 15-17, 2014
Total Sample
Designed and Directed by: SocialSphere Inc.
(A) (B) (C) (D) (E) (F) (G) (H) (I) (J) (K)
CentralMA
WesternMA
Comparison Groups: BCDEFGHIJK, Independent T-Test for Means (based on test for equal variances), Independent Z-Test for Percentages (unpooled proportions), Uppercase letters indicate significance at the 95% level.
Region
Metro-Boston
Inside128
NorthShore
MerrimackValley
Metro-West
South ofBoston
SouthShore
Cape &Islands and
SouthCoast
Table Q23
Boston Globe Release 3 (Casinos), June 8-10, 15-17
Which of the following casino games do you most prefer?
----- -------- -------- ------- --------- ------- -------- ------- --------- ------- ---------
(A) (B) (C) (D) (E) (F) (G) (H) (I) (J) (K)
Percentage Base 181 30 23 16 16 11 15 9 8 24 21100% 100% 100% 100% 100% 100% 100% 100% 100% 100% 100%
Unweighted Total 182 30 25 16 17 12 14 8 7 28 19
Slot machines 87 14 5 3 9 5 9 7 5 14 1148% 45% 23% 17% 53% 51% 58% 75% 66% 57% 52%
D D CD CD CD CD CD
Table games like Blackjack, Craps or Roulette 73 14 15 9 5 4 3 2 3 8 940% 48% 66% 58% 30% 40% 19% 25% 34% 32% 41%
G EGHJ G
Poker 9 - 1 3 1 1 1 - - 1 25% 3% 18% 6% 10% 8% 4% 8%
Video poker 7 1 1 - 2 - 2 - - 2 -4% 3% 3% 11% 15% 7%
Other 3 - 1 1 - - - - - - -2% 4% 7%
Don't know 1 1 - - - - - - - - -1% 4%

79
Boston Globe Release Poll of Likely Voters in Massachusetts | June 8-10, 15-17, 2014
Total Sample
Designed and Directed by: SocialSphere Inc.
(A) (B) (C) (D) (E) (F) (G) (H) (I) (J) (K) (L) (M) (N) (O) (P)
Ideology Massachusetts
Definitely Probably Democrat Republican Falchuk Don't Know
Likelihood to Vote in General Election Party ID Candidate Vote
Liberal Moderate ConservativeRight
Directedion
Comparison Groups: BC/DEF/GHIJK/LMN/OP, Independent T-Test for Means (based on test for equal variances), Independent Z-Test for Percentages (unpooled proportions), Uppercase letters indicate significance at the 95% level.
Independent Coakley Baker McCormick Wrong Track
Table Q24
Boston Globe Release 3 (Casinos), June 8-10, 15-17
When you go to a casino, what is the maximum you are willing to spend?
----- ------ ------- ----- ----- ----- ------- ----- --------- ------- ---- ----- ----- ----- ----- -----
(A) (B) (C) (D) (E) (F) (G) (H) (I) (J) (K) (L) (M) (N) (O) (P)
Percentage Base 181 139 43 56 24 101 75 61 16 - 29 51 76 54 81 74100% 100% 100% 100% 100% 100% 100% 100% 100% 100% 100% 100% 100% 100% 100%
Unweighted Total 182 139 43 57 32 93 74 66 14 - 28 51 74 57 79 78
$20 or less 12 9 4 5 2 6 6 1 - - 5 6 3 4 7 47% 6% 9% 9% 8% 6% 8% 2% 18% 12% 3% 7% 8% 5%
H
$21 - $99 28 23 5 8 4 16 8 12 2 - 6 8 14 6 9 1215% 17% 11% 14% 16% 16% 10% 20% 12% 21% 15% 18% 12% 11% 17%
$100 - $199 49 35 14 15 8 26 24 15 2 - 8 12 21 15 27 1927% 25% 34% 27% 32% 26% 32% 25% 11% 27% 24% 28% 29% 33% 26%
$200 - $499 57 41 16 16 7 33 22 20 8 - 7 18 22 17 27 2231% 29% 37% 28% 29% 33% 29% 33% 51% 23% 34% 29% 32% 33% 29%
$500 or more 35 31 4 12 4 20 16 12 4 - 3 8 16 11 12 1820% 23% 10% 22% 14% 19% 21% 20% 26% 11% 15% 21% 21% 15% 24%
C
Mean 245.42 258.18 203.93 267.92 193.45 245.48 272.99 249.27 259.35 - 158.85 219.93 263.32 244.24 227.46 253.35K
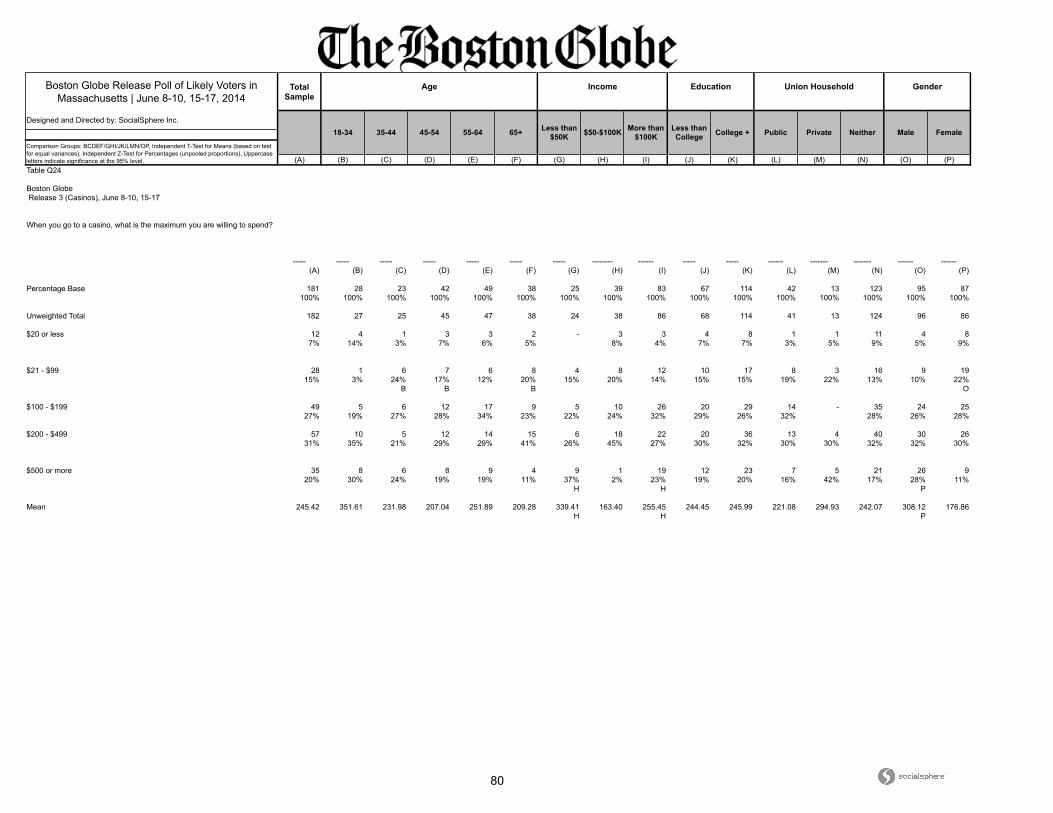
80
Boston Globe Release Poll of Likely Voters in Massachusetts | June 8-10, 15-17, 2014
Total Sample
Designed and Directed by: SocialSphere Inc.
(A) (B) (C) (D) (E) (F) (G) (H) (I) (J) (K) (L) (M) (N) (O) (P)
Union Household Gender
18-34 35-44 45-54 55-64 Less than College College +
Age Income Education
Comparison Groups: BCDEF/GHI/JK/LMN/OP, Independent T-Test for Means (based on test for equal variances), Independent Z-Test for Percentages (unpooled proportions), Uppercase letters indicate significance at the 95% level.
65+ Less than $50K $50-$100K More than
$100K Public Private Neither Male Female
Table Q24
Boston Globe Release 3 (Casinos), June 8-10, 15-17
When you go to a casino, what is the maximum you are willing to spend?
----- ----- ----- ----- ----- ----- ----- -------- ------ ----- ----- ------ ------- ------- ------ ------
(A) (B) (C) (D) (E) (F) (G) (H) (I) (J) (K) (L) (M) (N) (O) (P)
Percentage Base 181 28 23 42 49 38 25 39 83 67 114 42 13 123 95 87100% 100% 100% 100% 100% 100% 100% 100% 100% 100% 100% 100% 100% 100% 100% 100%
Unweighted Total 182 27 25 45 47 38 24 38 86 68 114 41 13 124 96 86
$20 or less 12 4 1 3 3 2 - 3 3 4 8 1 1 11 4 87% 14% 3% 7% 6% 5% 8% 4% 7% 7% 3% 5% 9% 5% 9%
$21 - $99 28 1 6 7 6 8 4 8 12 10 17 8 3 16 9 1915% 3% 24% 17% 12% 20% 15% 20% 14% 15% 15% 19% 22% 13% 10% 22%
B B B O
$100 - $199 49 5 6 12 17 9 5 10 26 20 29 14 - 35 24 2527% 19% 27% 28% 34% 23% 22% 24% 32% 29% 26% 32% 28% 26% 28%
$200 - $499 57 10 5 12 14 15 6 18 22 20 36 13 4 40 30 2631% 35% 21% 29% 29% 41% 26% 45% 27% 30% 32% 30% 30% 32% 32% 30%
$500 or more 35 8 6 8 9 4 9 1 19 12 23 7 5 21 26 920% 30% 24% 19% 19% 11% 37% 2% 23% 19% 20% 16% 42% 17% 28% 11%
H H P
Mean 245.42 351.61 231.98 207.04 251.89 209.28 339.41 163.40 255.45 244.45 245.99 221.08 294.93 242.07 308.12 176.86H H P

81
Boston Globe Release Poll of Likely Voters in Massachusetts | June 8-10, 15-17, 2014
Total Sample
Designed and Directed by: SocialSphere Inc.
(A) (B) (C) (D) (E) (F) (G) (H) (I) (J) (K)
CentralMA
WesternMA
Comparison Groups: BCDEFGHIJK, Independent T-Test for Means (based on test for equal variances), Independent Z-Test for Percentages (unpooled proportions), Uppercase letters indicate significance at the 95% level.
Region
Metro-Boston
Inside128
NorthShore
MerrimackValley
Metro-West
South ofBoston
SouthShore
Cape &Islands and
SouthCoast
Table Q24
Boston Globe Release 3 (Casinos), June 8-10, 15-17
When you go to a casino, what is the maximum you are willing to spend?
----- -------- -------- ------- --------- ------- -------- ------- --------- ------- ---------
(A) (B) (C) (D) (E) (F) (G) (H) (I) (J) (K)
Percentage Base 181 30 23 16 16 11 15 9 8 24 21100% 100% 100% 100% 100% 100% 100% 100% 100% 100% 100%
Unweighted Total 182 30 25 16 17 12 14 8 7 28 19
$20 or less 12 2 3 - 1 - - - - 2 47% 6% 12% 6% 9% 17%
$21 - $99 28 4 2 4 2 5 2 3 1 6 -15% 12% 8% 25% 12% 43% 13% 36% 13% 23%
BC
$100 - $199 49 6 7 5 4 2 3 1 3 6 827% 20% 32% 33% 27% 17% 22% 13% 39% 25% 36%
$200 - $499 57 12 7 3 5 1 6 3 3 6 731% 40% 29% 16% 31% 9% 37% 39% 34% 23% 36%
F
$500 or more 35 6 4 4 4 3 4 1 1 4 220% 21% 19% 26% 25% 31% 27% 13% 14% 19% 12%
Mean 245.42 264.89 211.71 343.72 282.16 316.53 264.80 236.68 195.31 226.88 187.41
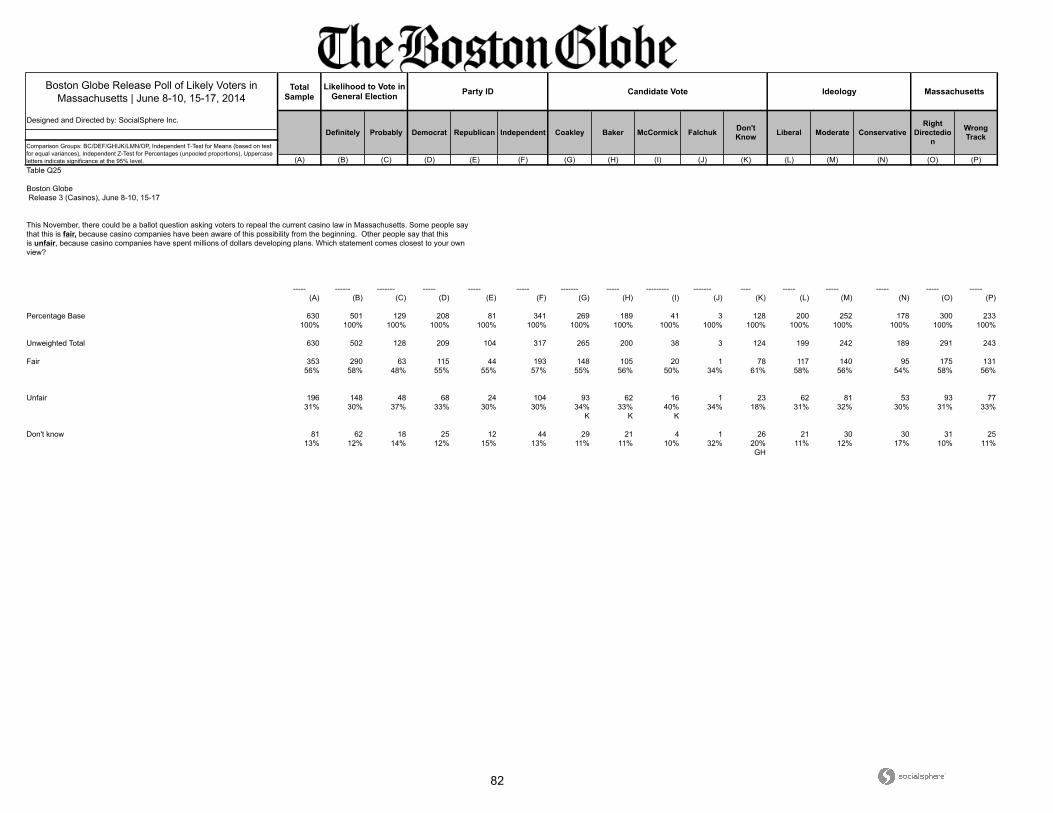
82
Boston Globe Release Poll of Likely Voters in Massachusetts | June 8-10, 15-17, 2014
Total Sample
Designed and Directed by: SocialSphere Inc.
(A) (B) (C) (D) (E) (F) (G) (H) (I) (J) (K) (L) (M) (N) (O) (P)
Ideology Massachusetts
Definitely Probably Democrat Republican Falchuk Don't Know
Likelihood to Vote in General Election Party ID Candidate Vote
Liberal Moderate ConservativeRight
Directedion
Comparison Groups: BC/DEF/GHIJK/LMN/OP, Independent T-Test for Means (based on test for equal variances), Independent Z-Test for Percentages (unpooled proportions), Uppercase letters indicate significance at the 95% level.
Independent Coakley Baker McCormick Wrong Track
Table Q25
Boston Globe Release 3 (Casinos), June 8-10, 15-17
This November, there could be a ballot question asking voters to repeal the current casino law in Massachusetts. Some people say that this is fair, because casino companies have been aware of this possibility from the beginning. Other people say that this is unfair, because casino companies have spent millions of dollars developing plans. Which statement comes closest to your own view?
----- ------ ------- ----- ----- ----- ------- ----- --------- ------- ---- ----- ----- ----- ----- -----
(A) (B) (C) (D) (E) (F) (G) (H) (I) (J) (K) (L) (M) (N) (O) (P)
Percentage Base 630 501 129 208 81 341 269 189 41 3 128 200 252 178 300 233100% 100% 100% 100% 100% 100% 100% 100% 100% 100% 100% 100% 100% 100% 100% 100%
Unweighted Total 630 502 128 209 104 317 265 200 38 3 124 199 242 189 291 243
Fair 353 290 63 115 44 193 148 105 20 1 78 117 140 95 175 13156% 58% 48% 55% 55% 57% 55% 56% 50% 34% 61% 58% 56% 54% 58% 56%
Unfair 196 148 48 68 24 104 93 62 16 1 23 62 81 53 93 7731% 30% 37% 33% 30% 30% 34% 33% 40% 34% 18% 31% 32% 30% 31% 33%
K K K
Don't know 81 62 18 25 12 44 29 21 4 1 26 21 30 30 31 2513% 12% 14% 12% 15% 13% 11% 11% 10% 32% 20% 11% 12% 17% 10% 11%
GH
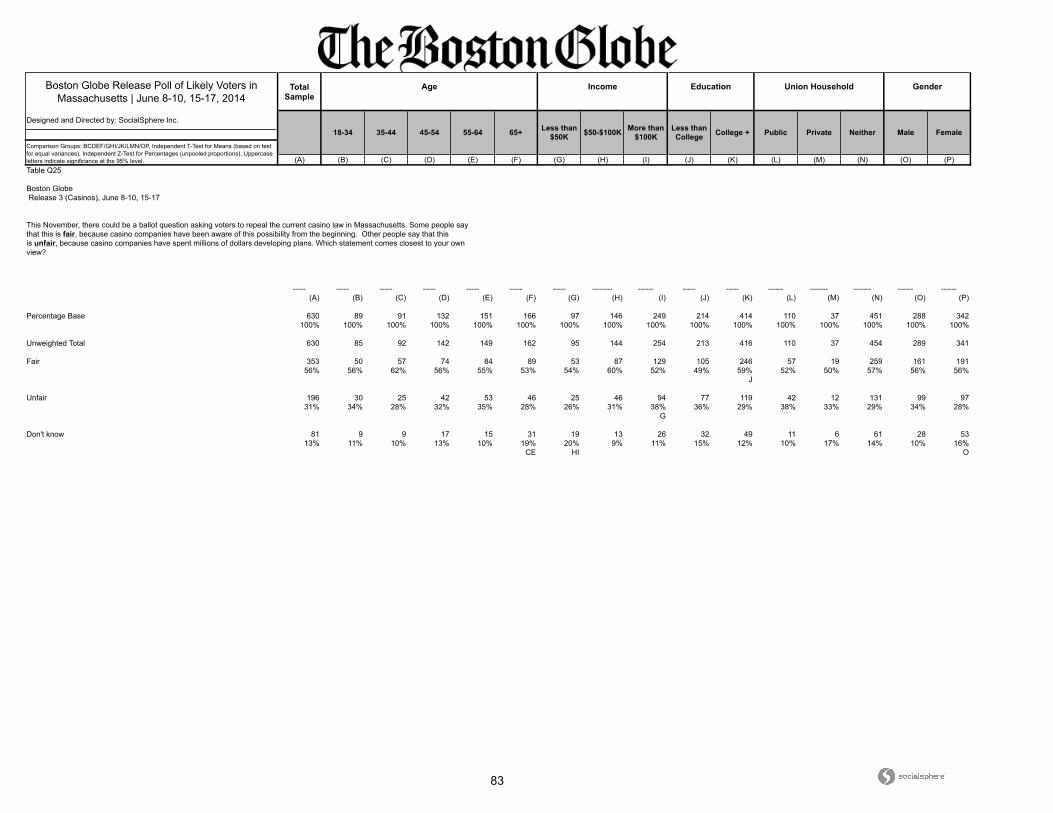
83
Boston Globe Release Poll of Likely Voters in Massachusetts | June 8-10, 15-17, 2014
Total Sample
Designed and Directed by: SocialSphere Inc.
(A) (B) (C) (D) (E) (F) (G) (H) (I) (J) (K) (L) (M) (N) (O) (P)
Union Household Gender
18-34 35-44 45-54 55-64 Less than College College +
Age Income Education
Comparison Groups: BCDEF/GHI/JK/LMN/OP, Independent T-Test for Means (based on test for equal variances), Independent Z-Test for Percentages (unpooled proportions), Uppercase letters indicate significance at the 95% level.
65+ Less than $50K $50-$100K More than
$100K Public Private Neither Male Female
Table Q25
Boston Globe Release 3 (Casinos), June 8-10, 15-17
This November, there could be a ballot question asking voters to repeal the current casino law in Massachusetts. Some people say that this is fair, because casino companies have been aware of this possibility from the beginning. Other people say that this is unfair, because casino companies have spent millions of dollars developing plans. Which statement comes closest to your own view?
----- ----- ----- ----- ----- ----- ----- -------- ------ ----- ----- ------ ------- ------- ------ ------
(A) (B) (C) (D) (E) (F) (G) (H) (I) (J) (K) (L) (M) (N) (O) (P)
Percentage Base 630 89 91 132 151 166 97 146 249 214 414 110 37 451 288 342100% 100% 100% 100% 100% 100% 100% 100% 100% 100% 100% 100% 100% 100% 100% 100%
Unweighted Total 630 85 92 142 149 162 95 144 254 213 416 110 37 454 289 341
Fair 353 50 57 74 84 89 53 87 129 105 246 57 19 259 161 19156% 56% 62% 56% 55% 53% 54% 60% 52% 49% 59% 52% 50% 57% 56% 56%
J
Unfair 196 30 25 42 53 46 25 46 94 77 119 42 12 131 99 9731% 34% 28% 32% 35% 28% 26% 31% 38% 36% 29% 38% 33% 29% 34% 28%
G
Don't know 81 9 9 17 15 31 19 13 26 32 49 11 6 61 28 5313% 11% 10% 13% 10% 19% 20% 9% 11% 15% 12% 10% 17% 14% 10% 16%
CE HI O

84
Boston Globe Release Poll of Likely Voters in Massachusetts | June 8-10, 15-17, 2014
Total Sample
Designed and Directed by: SocialSphere Inc.
(A) (B) (C) (D) (E) (F) (G) (H) (I) (J) (K)
CentralMA
WesternMA
Comparison Groups: BCDEFGHIJK, Independent T-Test for Means (based on test for equal variances), Independent Z-Test for Percentages (unpooled proportions), Uppercase letters indicate significance at the 95% level.
Region
Metro-Boston
Inside128
NorthShore
MerrimackValley
Metro-West
South ofBoston
SouthShore
Cape &Islands and
SouthCoast
Table Q25
Boston Globe Release 3 (Casinos), June 8-10, 15-17
This November, there could be a ballot question asking voters to repeal the current casino law in Massachusetts. Some people say that this is fair, because casino companies have been aware of this possibility from the beginning. Other people say that this is unfair, because casino companies have spent millions of dollars developing plans. Which statement comes closest to your own view?
----- -------- -------- ------- --------- ------- -------- ------- --------- ------- ---------
(A) (B) (C) (D) (E) (F) (G) (H) (I) (J) (K)
Percentage Base 630 84 89 45 61 53 51 41 38 70 66100% 100% 100% 100% 100% 100% 100% 100% 100% 100% 100%
Unweighted Total 630 84 94 45 63 57 49 38 31 82 61
Fair 353 48 51 24 31 28 27 22 28 38 3556% 57% 58% 55% 51% 53% 54% 53% 73% 54% 53%
E
Unfair 196 28 24 16 24 15 15 13 4 26 2231% 33% 27% 35% 40% 29% 29% 31% 12% 37% 34%
I I I I I I I I
Don't know 81 8 14 5 5 9 9 6 6 6 913% 10% 16% 11% 9% 17% 18% 16% 15% 9% 13%
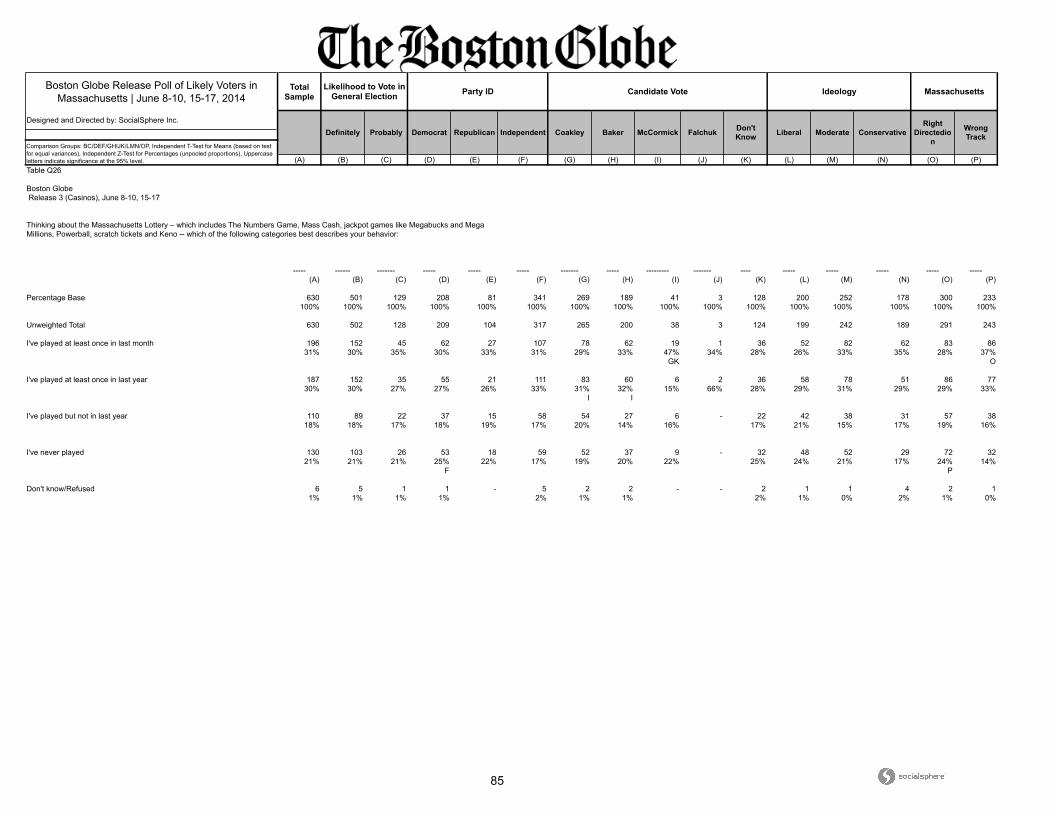
85
Boston Globe Release Poll of Likely Voters in Massachusetts | June 8-10, 15-17, 2014
Total Sample
Designed and Directed by: SocialSphere Inc.
(A) (B) (C) (D) (E) (F) (G) (H) (I) (J) (K) (L) (M) (N) (O) (P)
Ideology Massachusetts
Definitely Probably Democrat Republican Falchuk Don't Know
Likelihood to Vote in General Election Party ID Candidate Vote
Liberal Moderate ConservativeRight
Directedion
Comparison Groups: BC/DEF/GHIJK/LMN/OP, Independent T-Test for Means (based on test for equal variances), Independent Z-Test for Percentages (unpooled proportions), Uppercase letters indicate significance at the 95% level.
Independent Coakley Baker McCormick Wrong Track
Table Q26
Boston Globe Release 3 (Casinos), June 8-10, 15-17
Thinking about the Massachusetts Lottery – which includes The Numbers Game, Mass Cash, jackpot games like Megabucks and Mega Millions, Powerball, scratch tickets and Keno -- which of the following categories best describes your behavior:
----- ------ ------- ----- ----- ----- ------- ----- --------- ------- ---- ----- ----- ----- ----- -----
(A) (B) (C) (D) (E) (F) (G) (H) (I) (J) (K) (L) (M) (N) (O) (P)
Percentage Base 630 501 129 208 81 341 269 189 41 3 128 200 252 178 300 233100% 100% 100% 100% 100% 100% 100% 100% 100% 100% 100% 100% 100% 100% 100% 100%
Unweighted Total 630 502 128 209 104 317 265 200 38 3 124 199 242 189 291 243
I've played at least once in last month 196 152 45 62 27 107 78 62 19 1 36 52 82 62 83 8631% 30% 35% 30% 33% 31% 29% 33% 47% 34% 28% 26% 33% 35% 28% 37%
GK O
I've played at least once in last year 187 152 35 55 21 111 83 60 6 2 36 58 78 51 86 7730% 30% 27% 27% 26% 33% 31% 32% 15% 66% 28% 29% 31% 29% 29% 33%
I I
I've played but not in last year 110 89 22 37 15 58 54 27 6 - 22 42 38 31 57 3818% 18% 17% 18% 19% 17% 20% 14% 16% 17% 21% 15% 17% 19% 16%
I've never played 130 103 26 53 18 59 52 37 9 - 32 48 52 29 72 3221% 21% 21% 25% 22% 17% 19% 20% 22% 25% 24% 21% 17% 24% 14%
F P
Don't know/Refused 6 5 1 1 - 5 2 2 - - 2 1 1 4 2 11% 1% 1% 1% 2% 1% 1% 2% 1% 0% 2% 1% 0%

86
Boston Globe Release Poll of Likely Voters in Massachusetts | June 8-10, 15-17, 2014
Total Sample
Designed and Directed by: SocialSphere Inc.
(A) (B) (C) (D) (E) (F) (G) (H) (I) (J) (K) (L) (M) (N) (O) (P)
Union Household Gender
18-34 35-44 45-54 55-64 Less than College College +
Age Income Education
Comparison Groups: BCDEF/GHI/JK/LMN/OP, Independent T-Test for Means (based on test for equal variances), Independent Z-Test for Percentages (unpooled proportions), Uppercase letters indicate significance at the 95% level.
65+ Less than $50K $50-$100K More than
$100K Public Private Neither Male Female
Table Q26
Boston Globe Release 3 (Casinos), June 8-10, 15-17
Thinking about the Massachusetts Lottery – which includes The Numbers Game, Mass Cash, jackpot games like Megabucks and Mega Millions, Powerball, scratch tickets and Keno -- which of the following categories best describes your behavior:
----- ----- ----- ----- ----- ----- ----- -------- ------ ----- ----- ------ ------- ------- ------ ------
(A) (B) (C) (D) (E) (F) (G) (H) (I) (J) (K) (L) (M) (N) (O) (P)
Percentage Base 630 89 91 132 151 166 97 146 249 214 414 110 37 451 288 342100% 100% 100% 100% 100% 100% 100% 100% 100% 100% 100% 100% 100% 100% 100% 100%
Unweighted Total 630 85 92 142 149 162 95 144 254 213 416 110 37 454 289 341
I've played at least once in last month 196 19 24 45 54 54 34 53 71 87 109 45 10 136 105 9131% 22% 26% 34% 36% 32% 35% 36% 29% 41% 26% 41% 27% 30% 36% 27%
B B K N P
I've played at least once in last year 187 28 31 41 45 42 24 42 90 60 127 32 11 140 88 10030% 32% 34% 31% 30% 25% 25% 29% 36% 28% 31% 29% 29% 31% 31% 29%
G
I've played but not in last year 110 13 15 30 27 25 13 26 46 28 82 17 5 78 41 7018% 15% 16% 23% 18% 15% 13% 17% 18% 13% 20% 16% 14% 17% 14% 20%
J O
I've never played 130 28 22 14 23 43 25 25 41 37 92 16 11 94 53 7621% 31% 24% 11% 15% 26% 25% 17% 17% 17% 22% 15% 30% 21% 19% 22%
DE D DE
Don't know/Refused 6 - - 2 2 2 1 1 1 2 4 - - 3 1 51% 2% 1% 1% 1% 1% 0% 1% 1% 1% 0% 2%
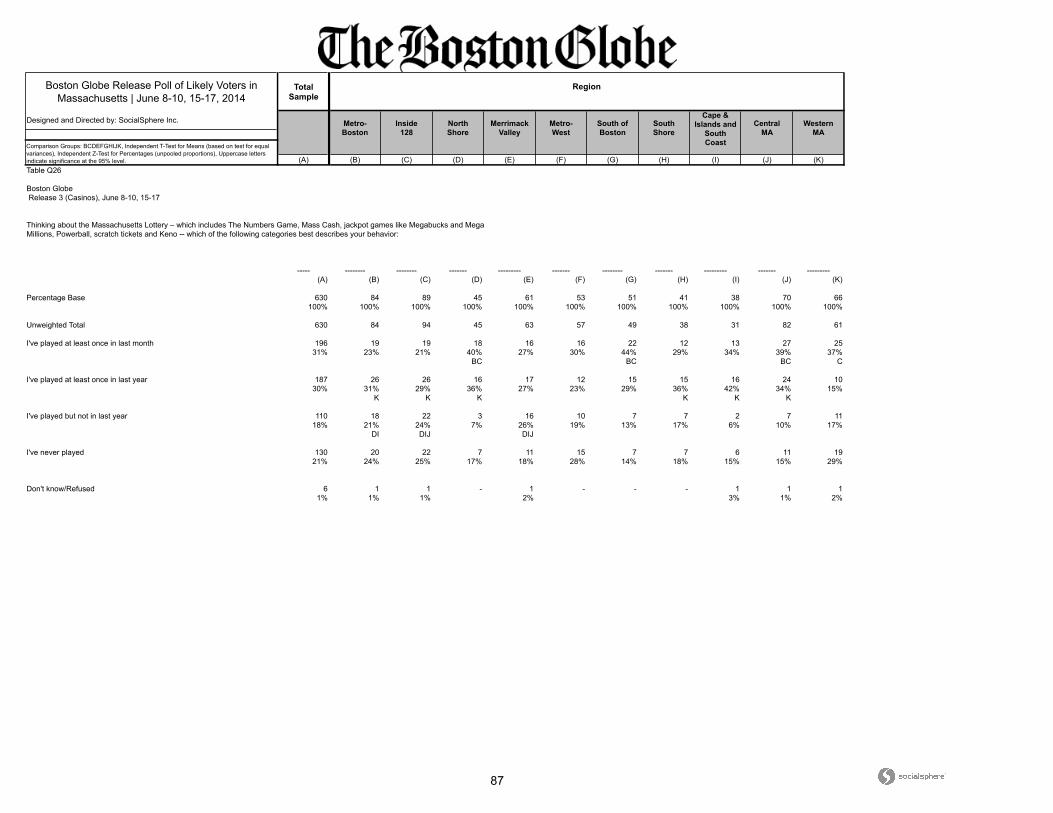
87
Boston Globe Release Poll of Likely Voters in Massachusetts | June 8-10, 15-17, 2014
Total Sample
Designed and Directed by: SocialSphere Inc.
(A) (B) (C) (D) (E) (F) (G) (H) (I) (J) (K)
CentralMA
WesternMA
Comparison Groups: BCDEFGHIJK, Independent T-Test for Means (based on test for equal variances), Independent Z-Test for Percentages (unpooled proportions), Uppercase letters indicate significance at the 95% level.
Region
Metro-Boston
Inside128
NorthShore
MerrimackValley
Metro-West
South ofBoston
SouthShore
Cape &Islands and
SouthCoast
Table Q26
Boston Globe Release 3 (Casinos), June 8-10, 15-17
Thinking about the Massachusetts Lottery – which includes The Numbers Game, Mass Cash, jackpot games like Megabucks and Mega Millions, Powerball, scratch tickets and Keno -- which of the following categories best describes your behavior:
----- -------- -------- ------- --------- ------- -------- ------- --------- ------- ---------
(A) (B) (C) (D) (E) (F) (G) (H) (I) (J) (K)
Percentage Base 630 84 89 45 61 53 51 41 38 70 66100% 100% 100% 100% 100% 100% 100% 100% 100% 100% 100%
Unweighted Total 630 84 94 45 63 57 49 38 31 82 61
I've played at least once in last month 196 19 19 18 16 16 22 12 13 27 2531% 23% 21% 40% 27% 30% 44% 29% 34% 39% 37%
BC BC BC C
I've played at least once in last year 187 26 26 16 17 12 15 15 16 24 1030% 31% 29% 36% 27% 23% 29% 36% 42% 34% 15%
K K K K K K
I've played but not in last year 110 18 22 3 16 10 7 7 2 7 1118% 21% 24% 7% 26% 19% 13% 17% 6% 10% 17%
DI DIJ DIJ
I've never played 130 20 22 7 11 15 7 7 6 11 1921% 24% 25% 17% 18% 28% 14% 18% 15% 15% 29%
Don't know/Refused 6 1 1 - 1 - - - 1 1 11% 1% 1% 2% 3% 1% 2%
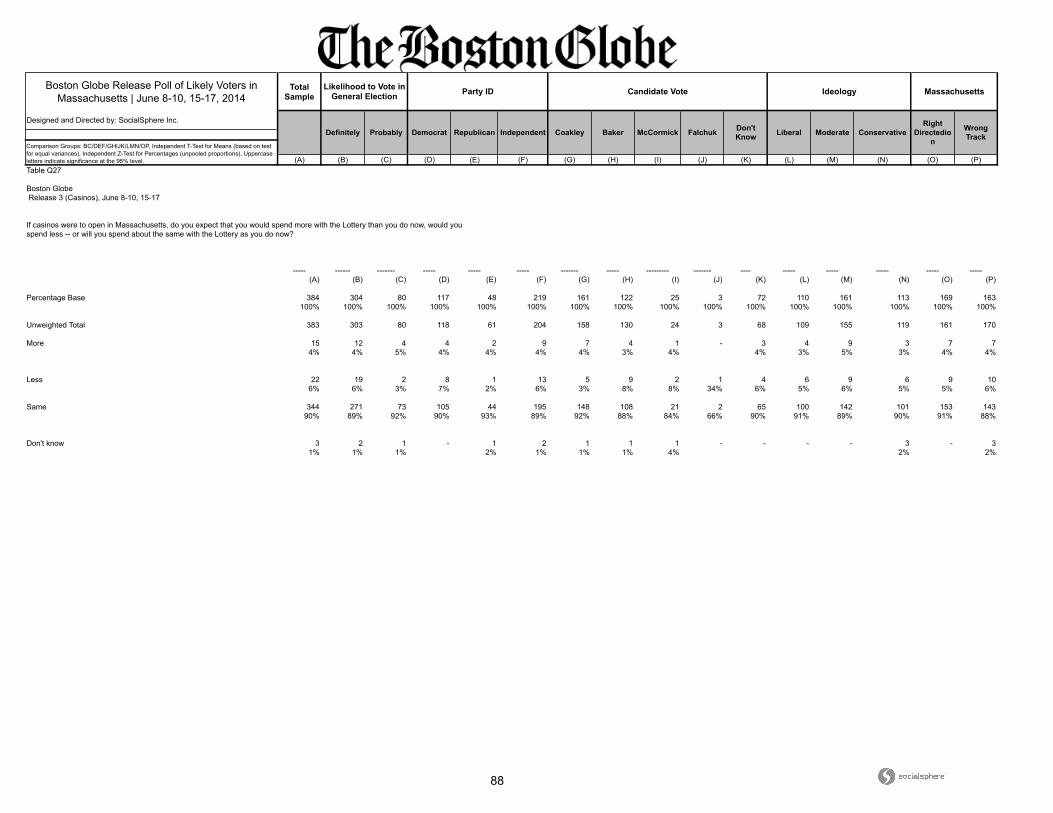
88
Boston Globe Release Poll of Likely Voters in Massachusetts | June 8-10, 15-17, 2014
Total Sample
Designed and Directed by: SocialSphere Inc.
(A) (B) (C) (D) (E) (F) (G) (H) (I) (J) (K) (L) (M) (N) (O) (P)
Ideology Massachusetts
Definitely Probably Democrat Republican Falchuk Don't Know
Likelihood to Vote in General Election Party ID Candidate Vote
Liberal Moderate ConservativeRight
Directedion
Comparison Groups: BC/DEF/GHIJK/LMN/OP, Independent T-Test for Means (based on test for equal variances), Independent Z-Test for Percentages (unpooled proportions), Uppercase letters indicate significance at the 95% level.
Independent Coakley Baker McCormick Wrong Track
Table Q27
Boston Globe Release 3 (Casinos), June 8-10, 15-17
If casinos were to open in Massachusetts, do you expect that you would spend more with the Lottery than you do now, would you spend less -- or will you spend about the same with the Lottery as you do now?
----- ------ ------- ----- ----- ----- ------- ----- --------- ------- ---- ----- ----- ----- ----- -----
(A) (B) (C) (D) (E) (F) (G) (H) (I) (J) (K) (L) (M) (N) (O) (P)
Percentage Base 384 304 80 117 48 219 161 122 25 3 72 110 161 113 169 163100% 100% 100% 100% 100% 100% 100% 100% 100% 100% 100% 100% 100% 100% 100% 100%
Unweighted Total 383 303 80 118 61 204 158 130 24 3 68 109 155 119 161 170
More 15 12 4 4 2 9 7 4 1 - 3 4 9 3 7 74% 4% 5% 4% 4% 4% 4% 3% 4% 4% 3% 5% 3% 4% 4%
Less 22 19 2 8 1 13 5 9 2 1 4 6 9 6 9 106% 6% 3% 7% 2% 6% 3% 8% 8% 34% 6% 5% 6% 5% 5% 6%
Same 344 271 73 105 44 195 148 108 21 2 65 100 142 101 153 14390% 89% 92% 90% 93% 89% 92% 88% 84% 66% 90% 91% 89% 90% 91% 88%
Don't know 3 2 1 - 1 2 1 1 1 - - - - 3 - 31% 1% 1% 2% 1% 1% 1% 4% 2% 2%

89
Boston Globe Release Poll of Likely Voters in Massachusetts | June 8-10, 15-17, 2014
Total Sample
Designed and Directed by: SocialSphere Inc.
(A) (B) (C) (D) (E) (F) (G) (H) (I) (J) (K) (L) (M) (N) (O) (P)
Union Household Gender
18-34 35-44 45-54 55-64 Less than College College +
Age Income Education
Comparison Groups: BCDEF/GHI/JK/LMN/OP, Independent T-Test for Means (based on test for equal variances), Independent Z-Test for Percentages (unpooled proportions), Uppercase letters indicate significance at the 95% level.
65+ Less than $50K $50-$100K More than
$100K Public Private Neither Male Female
Table Q27
Boston Globe Release 3 (Casinos), June 8-10, 15-17
If casinos were to open in Massachusetts, do you expect that you would spend more with the Lottery than you do now, would you spend less -- or will you spend about the same with the Lottery as you do now?
----- ----- ----- ----- ----- ----- ----- -------- ------ ----- ----- ------ ------- ------- ------ ------
(A) (B) (C) (D) (E) (F) (G) (H) (I) (J) (K) (L) (M) (N) (O) (P)
Percentage Base 384 48 55 86 99 96 58 94 161 148 236 77 21 276 193 191100% 100% 100% 100% 100% 100% 100% 100% 100% 100% 100% 100% 100% 100% 100% 100%
Unweighted Total 383 45 55 92 98 93 58 93 164 147 236 76 21 276 193 190
More 15 4 1 4 2 5 3 7 2 11 5 2 1 12 6 104% 8% 2% 4% 2% 5% 5% 8% 1% 7% 2% 3% 5% 4% 3% 5%
I K
Less 22 2 4 2 7 6 5 4 10 7 14 2 - 19 13 86% 4% 7% 2% 7% 7% 9% 5% 6% 5% 6% 3% 7% 7% 4%
Same 344 41 50 81 89 83 50 81 150 129 215 73 20 242 173 17190% 86% 91% 94% 90% 87% 85% 86% 93% 87% 91% 95% 95% 88% 90% 90%
N
Don't know 3 1 - - - 2 1 2 - 1 2 - - 3 1 21% 2% 2% 2% 2% 1% 1% 1% 0% 1%
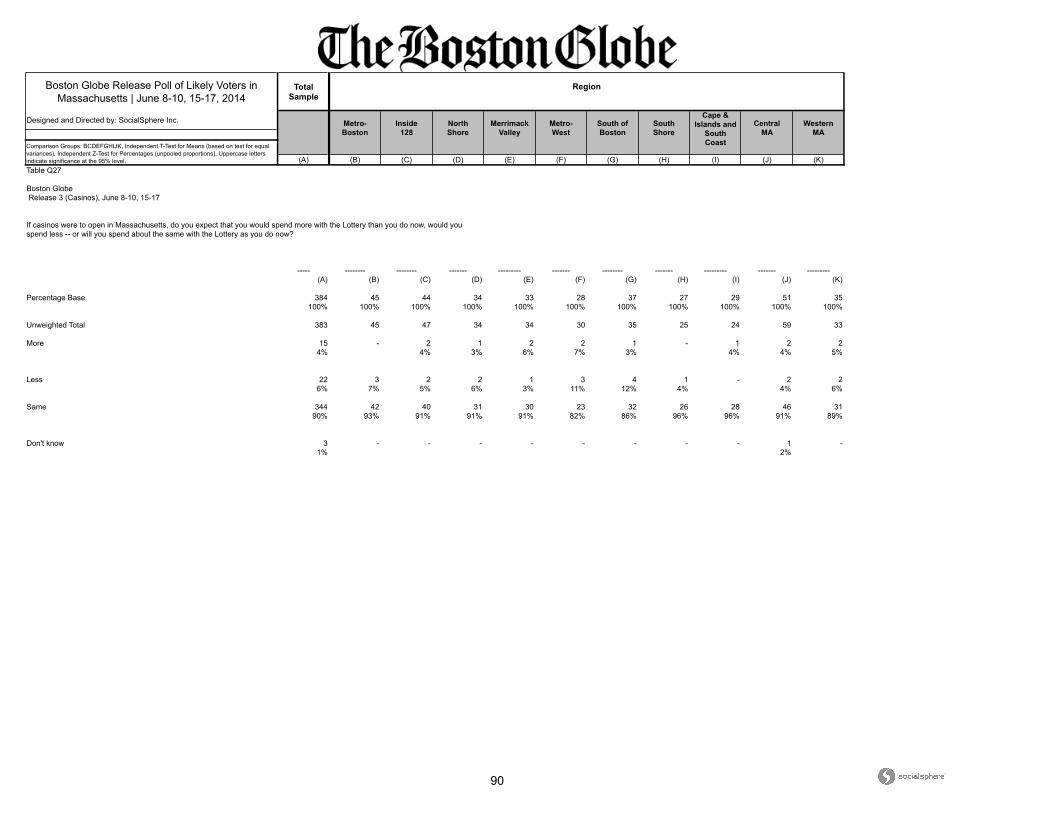
90
Boston Globe Release Poll of Likely Voters in Massachusetts | June 8-10, 15-17, 2014
Total Sample
Designed and Directed by: SocialSphere Inc.
(A) (B) (C) (D) (E) (F) (G) (H) (I) (J) (K)
CentralMA
WesternMA
Comparison Groups: BCDEFGHIJK, Independent T-Test for Means (based on test for equal variances), Independent Z-Test for Percentages (unpooled proportions), Uppercase letters indicate significance at the 95% level.
Region
Metro-Boston
Inside128
NorthShore
MerrimackValley
Metro-West
South ofBoston
SouthShore
Cape &Islands and
SouthCoast
Table Q27
Boston Globe Release 3 (Casinos), June 8-10, 15-17
If casinos were to open in Massachusetts, do you expect that you would spend more with the Lottery than you do now, would you spend less -- or will you spend about the same with the Lottery as you do now?
----- -------- -------- ------- --------- ------- -------- ------- --------- ------- ---------
(A) (B) (C) (D) (E) (F) (G) (H) (I) (J) (K)
Percentage Base 384 45 44 34 33 28 37 27 29 51 35100% 100% 100% 100% 100% 100% 100% 100% 100% 100% 100%
Unweighted Total 383 45 47 34 34 30 35 25 24 59 33
More 15 - 2 1 2 2 1 - 1 2 24% 4% 3% 6% 7% 3% 4% 4% 5%
Less 22 3 2 2 1 3 4 1 - 2 26% 7% 5% 6% 3% 11% 12% 4% 4% 6%
Same 344 42 40 31 30 23 32 26 28 46 3190% 93% 91% 91% 91% 82% 86% 96% 96% 91% 89%
Don't know 3 - - - - - - - - 1 -1% 2%
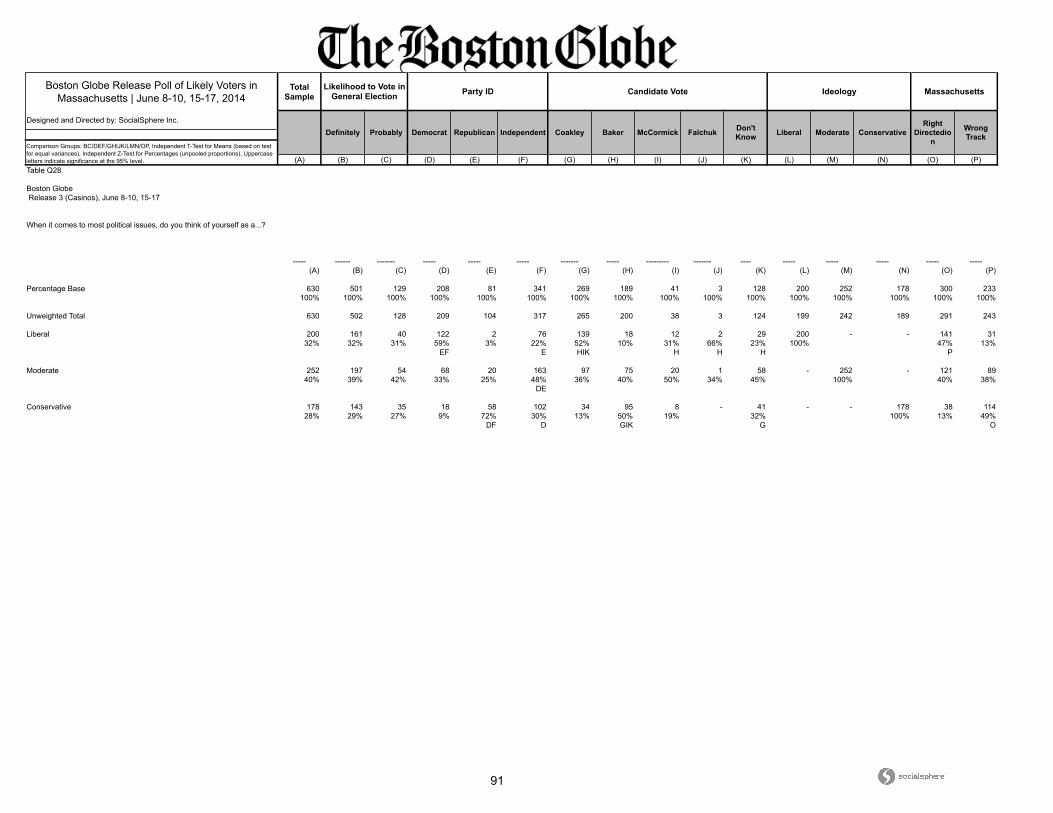
91
Boston Globe Release Poll of Likely Voters in Massachusetts | June 8-10, 15-17, 2014
Total Sample
Designed and Directed by: SocialSphere Inc.
(A) (B) (C) (D) (E) (F) (G) (H) (I) (J) (K) (L) (M) (N) (O) (P)
Ideology Massachusetts
Definitely Probably Democrat Republican Falchuk Don't Know
Likelihood to Vote in General Election Party ID Candidate Vote
Liberal Moderate ConservativeRight
Directedion
Comparison Groups: BC/DEF/GHIJK/LMN/OP, Independent T-Test for Means (based on test for equal variances), Independent Z-Test for Percentages (unpooled proportions), Uppercase letters indicate significance at the 95% level.
Independent Coakley Baker McCormick Wrong Track
Table Q28
Boston Globe Release 3 (Casinos), June 8-10, 15-17
When it comes to most political issues, do you think of yourself as a...?
----- ------ ------- ----- ----- ----- ------- ----- --------- ------- ---- ----- ----- ----- ----- -----
(A) (B) (C) (D) (E) (F) (G) (H) (I) (J) (K) (L) (M) (N) (O) (P)
Percentage Base 630 501 129 208 81 341 269 189 41 3 128 200 252 178 300 233100% 100% 100% 100% 100% 100% 100% 100% 100% 100% 100% 100% 100% 100% 100% 100%
Unweighted Total 630 502 128 209 104 317 265 200 38 3 124 199 242 189 291 243
Liberal 200 161 40 122 2 76 139 18 12 2 29 200 - - 141 3132% 32% 31% 59% 3% 22% 52% 10% 31% 66% 23% 100% 47% 13%
EF E HIK H H H P
Moderate 252 197 54 68 20 163 97 75 20 1 58 - 252 - 121 8940% 39% 42% 33% 25% 48% 36% 40% 50% 34% 45% 100% 40% 38%
DE
Conservative 178 143 35 18 58 102 34 95 8 - 41 - - 178 38 11428% 29% 27% 9% 72% 30% 13% 50% 19% 32% 100% 13% 49%
DF D GIK G O

92
Boston Globe Release Poll of Likely Voters in Massachusetts | June 8-10, 15-17, 2014
Total Sample
Designed and Directed by: SocialSphere Inc.
(A) (B) (C) (D) (E) (F) (G) (H) (I) (J) (K) (L) (M) (N) (O) (P)
Union Household Gender
18-34 35-44 45-54 55-64 Less than College College +
Age Income Education
Comparison Groups: BCDEF/GHI/JK/LMN/OP, Independent T-Test for Means (based on test for equal variances), Independent Z-Test for Percentages (unpooled proportions), Uppercase letters indicate significance at the 95% level.
65+ Less than $50K $50-$100K More than
$100K Public Private Neither Male Female
Table Q28
Boston Globe Release 3 (Casinos), June 8-10, 15-17
When it comes to most political issues, do you think of yourself as a...?
----- ----- ----- ----- ----- ----- ----- -------- ------ ----- ----- ------ ------- ------- ------ ------
(A) (B) (C) (D) (E) (F) (G) (H) (I) (J) (K) (L) (M) (N) (O) (P)
Percentage Base 630 89 91 132 151 166 97 146 249 214 414 110 37 451 288 342100% 100% 100% 100% 100% 100% 100% 100% 100% 100% 100% 100% 100% 100% 100% 100%
Unweighted Total 630 85 92 142 149 162 95 144 254 213 416 110 37 454 289 341
Liberal 200 37 21 42 43 58 32 51 85 53 147 37 7 144 80 12032% 41% 23% 32% 29% 35% 33% 35% 34% 25% 36% 33% 18% 32% 28% 35%
C C J M O
Moderate 252 31 49 55 62 54 34 56 106 80 172 40 15 188 115 13640% 35% 54% 42% 41% 32% 35% 38% 42% 37% 41% 37% 41% 42% 40% 40%
BF
Conservative 178 21 21 35 45 55 31 40 59 81 96 33 15 120 92 8528% 24% 23% 26% 30% 33% 32% 27% 24% 38% 23% 30% 41% 27% 32% 25%
K
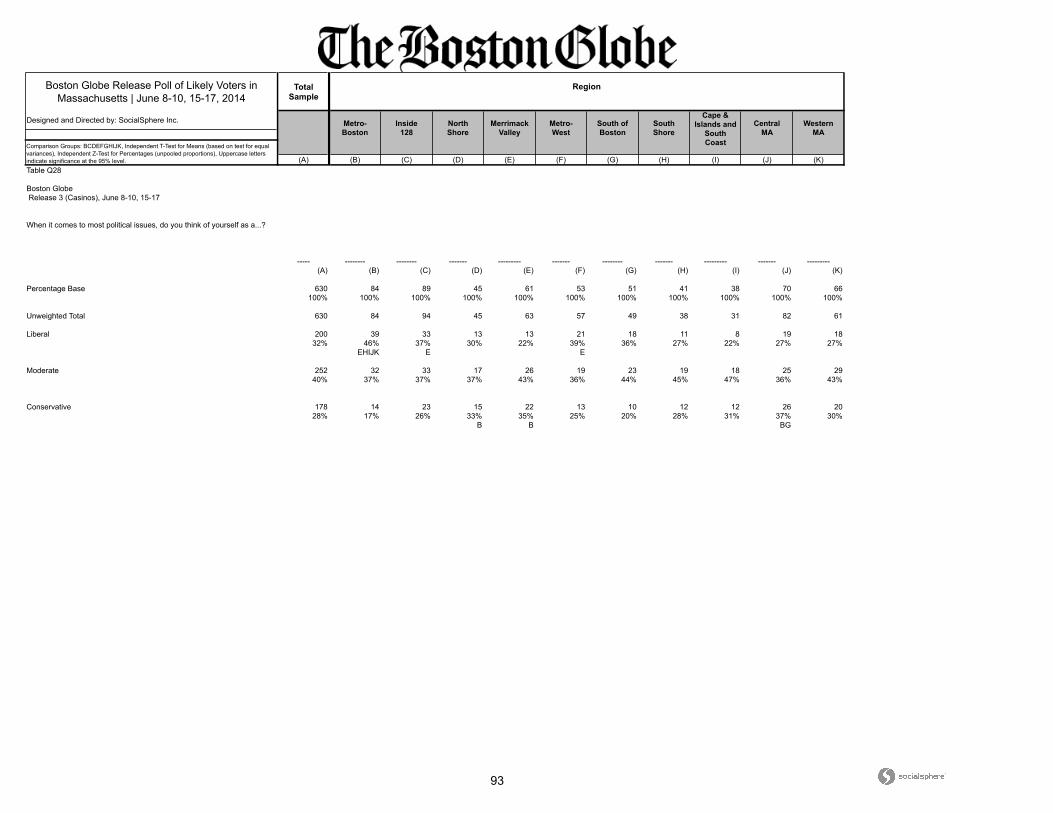
93
Boston Globe Release Poll of Likely Voters in Massachusetts | June 8-10, 15-17, 2014
Total Sample
Designed and Directed by: SocialSphere Inc.
(A) (B) (C) (D) (E) (F) (G) (H) (I) (J) (K)
CentralMA
WesternMA
Comparison Groups: BCDEFGHIJK, Independent T-Test for Means (based on test for equal variances), Independent Z-Test for Percentages (unpooled proportions), Uppercase letters indicate significance at the 95% level.
Region
Metro-Boston
Inside128
NorthShore
MerrimackValley
Metro-West
South ofBoston
SouthShore
Cape &Islands and
SouthCoast
Table Q28
Boston Globe Release 3 (Casinos), June 8-10, 15-17
When it comes to most political issues, do you think of yourself as a...?
----- -------- -------- ------- --------- ------- -------- ------- --------- ------- ---------
(A) (B) (C) (D) (E) (F) (G) (H) (I) (J) (K)
Percentage Base 630 84 89 45 61 53 51 41 38 70 66100% 100% 100% 100% 100% 100% 100% 100% 100% 100% 100%
Unweighted Total 630 84 94 45 63 57 49 38 31 82 61
Liberal 200 39 33 13 13 21 18 11 8 19 1832% 46% 37% 30% 22% 39% 36% 27% 22% 27% 27%
EHIJK E E
Moderate 252 32 33 17 26 19 23 19 18 25 2940% 37% 37% 37% 43% 36% 44% 45% 47% 36% 43%
Conservative 178 14 23 15 22 13 10 12 12 26 2028% 17% 26% 33% 35% 25% 20% 28% 31% 37% 30%
B B BG
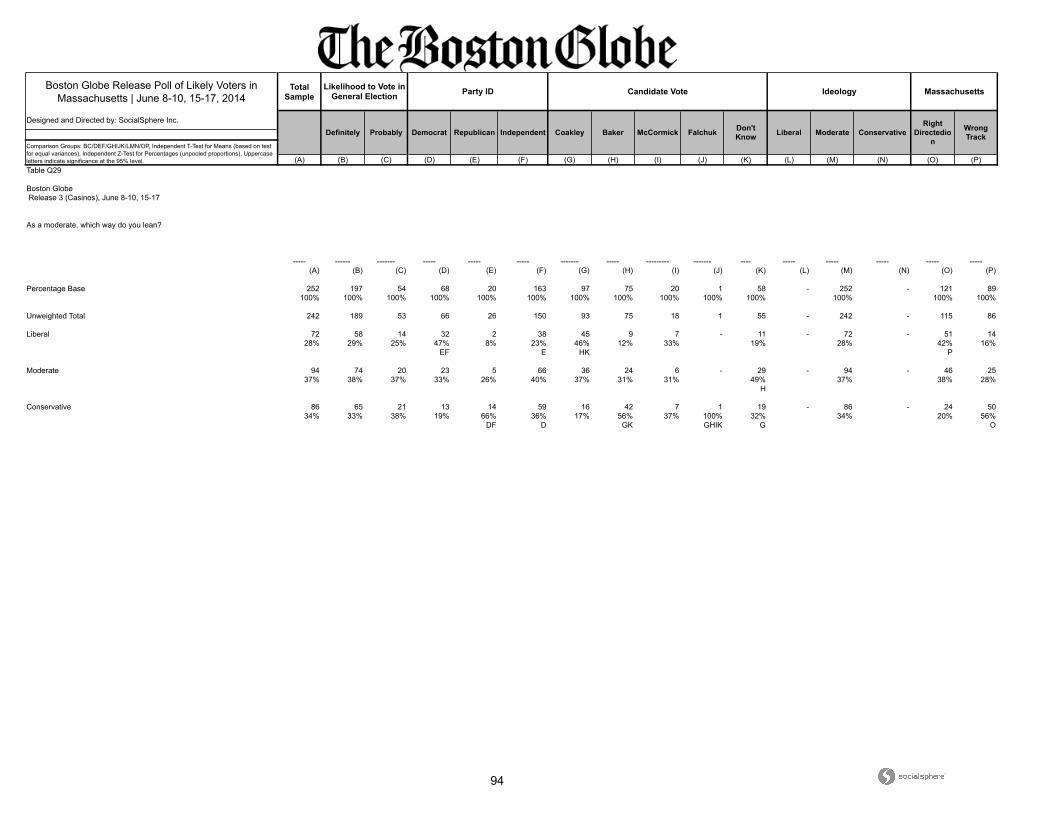
94
Boston Globe Release Poll of Likely Voters in Massachusetts | June 8-10, 15-17, 2014
Total Sample
Designed and Directed by: SocialSphere Inc.
(A) (B) (C) (D) (E) (F) (G) (H) (I) (J) (K) (L) (M) (N) (O) (P)
Ideology Massachusetts
Definitely Probably Democrat Republican Falchuk Don't Know
Likelihood to Vote in General Election Party ID Candidate Vote
Liberal Moderate ConservativeRight
Directedion
Comparison Groups: BC/DEF/GHIJK/LMN/OP, Independent T-Test for Means (based on test for equal variances), Independent Z-Test for Percentages (unpooled proportions), Uppercase letters indicate significance at the 95% level.
Independent Coakley Baker McCormick Wrong Track
Table Q29
Boston Globe Release 3 (Casinos), June 8-10, 15-17
As a moderate, which way do you lean?
----- ------ ------- ----- ----- ----- ------- ----- --------- ------- ---- ----- ----- ----- ----- -----
(A) (B) (C) (D) (E) (F) (G) (H) (I) (J) (K) (L) (M) (N) (O) (P)
Percentage Base 252 197 54 68 20 163 97 75 20 1 58 - 252 - 121 89100% 100% 100% 100% 100% 100% 100% 100% 100% 100% 100% 100% 100% 100%
Unweighted Total 242 189 53 66 26 150 93 75 18 1 55 - 242 - 115 86
Liberal 72 58 14 32 2 38 45 9 7 - 11 - 72 - 51 1428% 29% 25% 47% 8% 23% 46% 12% 33% 19% 28% 42% 16%
EF E HK P
Moderate 94 74 20 23 5 66 36 24 6 - 29 - 94 - 46 2537% 38% 37% 33% 26% 40% 37% 31% 31% 49% 37% 38% 28%
H
Conservative 86 65 21 13 14 59 16 42 7 1 19 - 86 - 24 5034% 33% 38% 19% 66% 36% 17% 56% 37% 100% 32% 34% 20% 56%
DF D GK GHIK G O
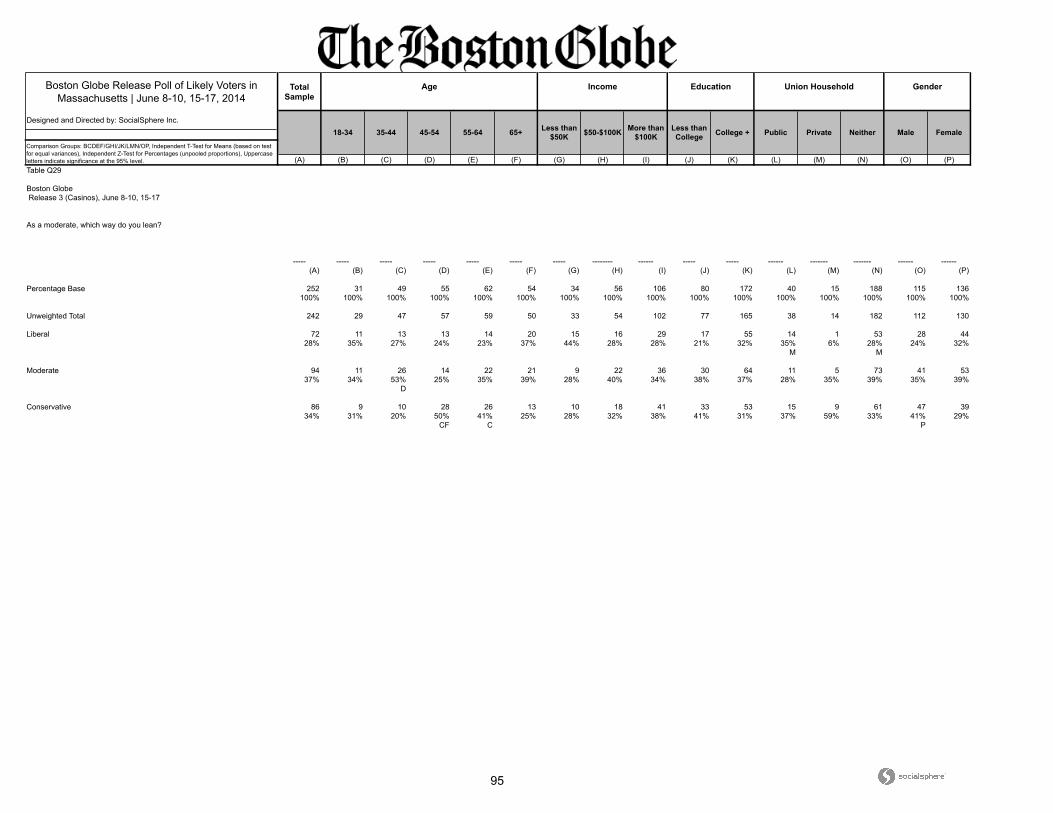
95
Boston Globe Release Poll of Likely Voters in Massachusetts | June 8-10, 15-17, 2014
Total Sample
Designed and Directed by: SocialSphere Inc.
(A) (B) (C) (D) (E) (F) (G) (H) (I) (J) (K) (L) (M) (N) (O) (P)
Union Household Gender
18-34 35-44 45-54 55-64 Less than College College +
Age Income Education
Comparison Groups: BCDEF/GHI/JK/LMN/OP, Independent T-Test for Means (based on test for equal variances), Independent Z-Test for Percentages (unpooled proportions), Uppercase letters indicate significance at the 95% level.
65+ Less than $50K $50-$100K More than
$100K Public Private Neither Male Female
Table Q29
Boston Globe Release 3 (Casinos), June 8-10, 15-17
As a moderate, which way do you lean?
----- ----- ----- ----- ----- ----- ----- -------- ------ ----- ----- ------ ------- ------- ------ ------
(A) (B) (C) (D) (E) (F) (G) (H) (I) (J) (K) (L) (M) (N) (O) (P)
Percentage Base 252 31 49 55 62 54 34 56 106 80 172 40 15 188 115 136100% 100% 100% 100% 100% 100% 100% 100% 100% 100% 100% 100% 100% 100% 100% 100%
Unweighted Total 242 29 47 57 59 50 33 54 102 77 165 38 14 182 112 130
Liberal 72 11 13 13 14 20 15 16 29 17 55 14 1 53 28 4428% 35% 27% 24% 23% 37% 44% 28% 28% 21% 32% 35% 6% 28% 24% 32%
M M
Moderate 94 11 26 14 22 21 9 22 36 30 64 11 5 73 41 5337% 34% 53% 25% 35% 39% 28% 40% 34% 38% 37% 28% 35% 39% 35% 39%
D
Conservative 86 9 10 28 26 13 10 18 41 33 53 15 9 61 47 3934% 31% 20% 50% 41% 25% 28% 32% 38% 41% 31% 37% 59% 33% 41% 29%
CF C P

96
Boston Globe Release Poll of Likely Voters in Massachusetts | June 8-10, 15-17, 2014
Total Sample
Designed and Directed by: SocialSphere Inc.
(A) (B) (C) (D) (E) (F) (G) (H) (I) (J) (K)
CentralMA
WesternMA
Comparison Groups: BCDEFGHIJK, Independent T-Test for Means (based on test for equal variances), Independent Z-Test for Percentages (unpooled proportions), Uppercase letters indicate significance at the 95% level.
Region
Metro-Boston
Inside128
NorthShore
MerrimackValley
Metro-West
South ofBoston
SouthShore
Cape &Islands and
SouthCoast
Table Q29
Boston Globe Release 3 (Casinos), June 8-10, 15-17
As a moderate, which way do you lean?
----- -------- -------- ------- --------- ------- -------- ------- --------- ------- ---------
(A) (B) (C) (D) (E) (F) (G) (H) (I) (J) (K)
Percentage Base 252 32 33 17 26 19 23 19 18 25 29100% 100% 100% 100% 100% 100% 100% 100% 100% 100% 100%
Unweighted Total 242 31 34 16 26 20 21 17 14 29 26
Liberal 72 8 9 4 8 8 5 3 5 5 728% 26% 26% 25% 31% 42% 23% 18% 30% 21% 26%
Moderate 94 15 12 6 11 6 8 8 3 11 1137% 48% 37% 38% 43% 32% 36% 44% 19% 44% 39%
I
Conservative 86 8 12 6 7 5 9 7 9 9 1034% 26% 37% 37% 26% 26% 41% 38% 51% 35% 35%

97
Boston Globe Release Poll of Likely Voters in Massachusetts | June 8-10, 15-17, 2014
Total Sample
Designed and Directed by: SocialSphere Inc.
(A) (B) (C) (D) (E) (F) (G) (H) (I) (J) (K) (L) (M) (N) (O) (P)
Ideology Massachusetts
Definitely Probably Democrat Republican Falchuk Don't Know
Likelihood to Vote in General Election Party ID Candidate Vote
Liberal Moderate ConservativeRight
Directedion
Comparison Groups: BC/DEF/GHIJK/LMN/OP, Independent T-Test for Means (based on test for equal variances), Independent Z-Test for Percentages (unpooled proportions), Uppercase letters indicate significance at the 95% level.
Independent Coakley Baker McCormick Wrong Track
Table Q29
Boston Globe Release 3 (Casinos), June 8-10, 15-17
When it comes to most political issues, do you think of yourself as a...?
----- ------ ------- ----- ----- ----- ------- ----- --------- ------- ---- ----- ----- ----- ----- -----
(A) (B) (C) (D) (E) (F) (G) (H) (I) (J) (K) (L) (M) (N) (O) (P)
Percentage Base 630 501 129 208 81 341 269 189 41 3 128 200 252 178 300 233100% 100% 100% 100% 100% 100% 100% 100% 100% 100% 100% 100% 100% 100% 100% 100%
Unweighted Total 630 502 128 209 104 317 265 200 38 3 124 199 242 189 291 243
Net: Liberal 272 219 53 154 4 114 183 27 19 2 40 200 72 - 192 44____________ 43% 44% 41% 74% 5% 33% 68% 15% 47% 66% 31% 100% 28% 64% 19%
EF E HIK H H M P
Liberal 200 161 40 122 2 76 139 18 12 2 29 200 - - 141 3132% 32% 31% 59% 3% 22% 52% 10% 31% 66% 23% 100% 47% 13%
EF E HIK H H H P
Leans Liberal 72 58 14 32 2 38 45 9 7 - 11 - 72 - 51 1411% 12% 11% 16% 2% 11% 17% 5% 16% 9% 28% 17% 6%
E E HK P
Net: Moderate 252 197 54 68 20 163 97 75 20 1 58 - 252 - 121 89_____________ 40% 39% 42% 33% 25% 48% 36% 40% 50% 34% 45% 100% 40% 38%
DE
Moderate 252 197 54 68 20 163 97 75 20 1 58 - 252 - 121 8940% 39% 42% 33% 25% 48% 36% 40% 50% 34% 45% 100% 40% 38%
DE
Leans Moderate 94 74 20 23 5 66 36 24 6 - 29 - 94 - 46 2515% 15% 15% 11% 6% 19% 13% 13% 15% 22% 37% 15% 11%
DE GH
Net: Conservative 264 208 56 31 71 162 50 138 15 1 59 - 86 178 61 164_________________ 42% 42% 43% 15% 88% 47% 19% 73% 38% 34% 46% 34% 100% 20% 70%
DF D GIK G G M O
Conservative 178 143 35 18 58 102 34 95 8 - 41 - - 178 38 11428% 29% 27% 9% 72% 30% 13% 50% 19% 32% 100% 13% 49%
DF D GIK G O
Leans Conservative 86 65 21 13 14 59 16 42 7 1 19 - 86 - 24 5014% 13% 16% 6% 17% 17% 6% 23% 18% 34% 15% 34% 8% 21%
D D G G G O
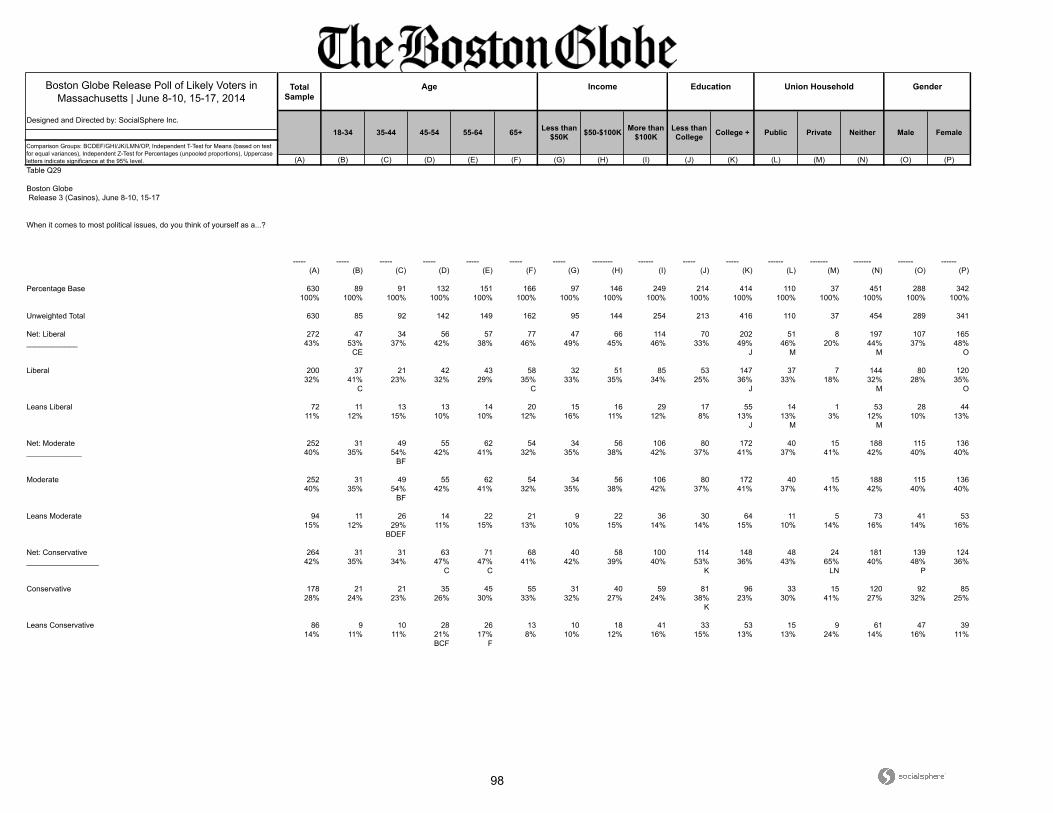
98
Boston Globe Release Poll of Likely Voters in Massachusetts | June 8-10, 15-17, 2014
Total Sample
Designed and Directed by: SocialSphere Inc.
(A) (B) (C) (D) (E) (F) (G) (H) (I) (J) (K) (L) (M) (N) (O) (P)
Union Household Gender
18-34 35-44 45-54 55-64 Less than College College +
Age Income Education
Comparison Groups: BCDEF/GHI/JK/LMN/OP, Independent T-Test for Means (based on test for equal variances), Independent Z-Test for Percentages (unpooled proportions), Uppercase letters indicate significance at the 95% level.
65+ Less than $50K $50-$100K More than
$100K Public Private Neither Male Female
Table Q29
Boston Globe Release 3 (Casinos), June 8-10, 15-17
When it comes to most political issues, do you think of yourself as a...?
----- ----- ----- ----- ----- ----- ----- -------- ------ ----- ----- ------ ------- ------- ------ ------
(A) (B) (C) (D) (E) (F) (G) (H) (I) (J) (K) (L) (M) (N) (O) (P)
Percentage Base 630 89 91 132 151 166 97 146 249 214 414 110 37 451 288 342100% 100% 100% 100% 100% 100% 100% 100% 100% 100% 100% 100% 100% 100% 100% 100%
Unweighted Total 630 85 92 142 149 162 95 144 254 213 416 110 37 454 289 341
Net: Liberal 272 47 34 56 57 77 47 66 114 70 202 51 8 197 107 165____________ 43% 53% 37% 42% 38% 46% 49% 45% 46% 33% 49% 46% 20% 44% 37% 48%
CE J M M O
Liberal 200 37 21 42 43 58 32 51 85 53 147 37 7 144 80 12032% 41% 23% 32% 29% 35% 33% 35% 34% 25% 36% 33% 18% 32% 28% 35%
C C J M O
Leans Liberal 72 11 13 13 14 20 15 16 29 17 55 14 1 53 28 4411% 12% 15% 10% 10% 12% 16% 11% 12% 8% 13% 13% 3% 12% 10% 13%
J M M
Net: Moderate 252 31 49 55 62 54 34 56 106 80 172 40 15 188 115 136_____________ 40% 35% 54% 42% 41% 32% 35% 38% 42% 37% 41% 37% 41% 42% 40% 40%
BF
Moderate 252 31 49 55 62 54 34 56 106 80 172 40 15 188 115 13640% 35% 54% 42% 41% 32% 35% 38% 42% 37% 41% 37% 41% 42% 40% 40%
BF
Leans Moderate 94 11 26 14 22 21 9 22 36 30 64 11 5 73 41 5315% 12% 29% 11% 15% 13% 10% 15% 14% 14% 15% 10% 14% 16% 14% 16%
BDEF
Net: Conservative 264 31 31 63 71 68 40 58 100 114 148 48 24 181 139 124_________________ 42% 35% 34% 47% 47% 41% 42% 39% 40% 53% 36% 43% 65% 40% 48% 36%
C C K LN P
Conservative 178 21 21 35 45 55 31 40 59 81 96 33 15 120 92 8528% 24% 23% 26% 30% 33% 32% 27% 24% 38% 23% 30% 41% 27% 32% 25%
K
Leans Conservative 86 9 10 28 26 13 10 18 41 33 53 15 9 61 47 3914% 11% 11% 21% 17% 8% 10% 12% 16% 15% 13% 13% 24% 14% 16% 11%
BCF F
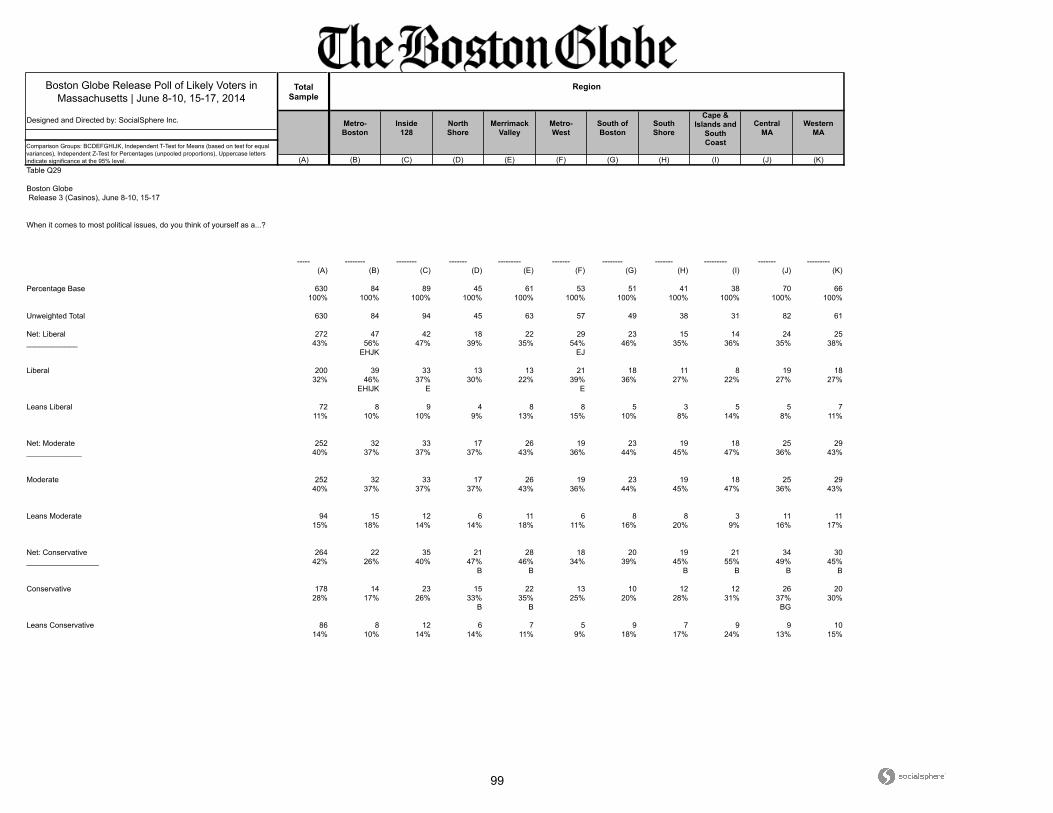
99
Boston Globe Release Poll of Likely Voters in Massachusetts | June 8-10, 15-17, 2014
Total Sample
Designed and Directed by: SocialSphere Inc.
(A) (B) (C) (D) (E) (F) (G) (H) (I) (J) (K)
CentralMA
WesternMA
Comparison Groups: BCDEFGHIJK, Independent T-Test for Means (based on test for equal variances), Independent Z-Test for Percentages (unpooled proportions), Uppercase letters indicate significance at the 95% level.
Region
Metro-Boston
Inside128
NorthShore
MerrimackValley
Metro-West
South ofBoston
SouthShore
Cape &Islands and
SouthCoast
Table Q29
Boston Globe Release 3 (Casinos), June 8-10, 15-17
When it comes to most political issues, do you think of yourself as a...?
----- -------- -------- ------- --------- ------- -------- ------- --------- ------- ---------
(A) (B) (C) (D) (E) (F) (G) (H) (I) (J) (K)
Percentage Base 630 84 89 45 61 53 51 41 38 70 66100% 100% 100% 100% 100% 100% 100% 100% 100% 100% 100%
Unweighted Total 630 84 94 45 63 57 49 38 31 82 61
Net: Liberal 272 47 42 18 22 29 23 15 14 24 25____________ 43% 56% 47% 39% 35% 54% 46% 35% 36% 35% 38%
EHJK EJ
Liberal 200 39 33 13 13 21 18 11 8 19 1832% 46% 37% 30% 22% 39% 36% 27% 22% 27% 27%
EHIJK E E
Leans Liberal 72 8 9 4 8 8 5 3 5 5 711% 10% 10% 9% 13% 15% 10% 8% 14% 8% 11%
Net: Moderate 252 32 33 17 26 19 23 19 18 25 29_____________ 40% 37% 37% 37% 43% 36% 44% 45% 47% 36% 43%
Moderate 252 32 33 17 26 19 23 19 18 25 2940% 37% 37% 37% 43% 36% 44% 45% 47% 36% 43%
Leans Moderate 94 15 12 6 11 6 8 8 3 11 1115% 18% 14% 14% 18% 11% 16% 20% 9% 16% 17%
Net: Conservative 264 22 35 21 28 18 20 19 21 34 30_________________ 42% 26% 40% 47% 46% 34% 39% 45% 55% 49% 45%
B B B B B B
Conservative 178 14 23 15 22 13 10 12 12 26 2028% 17% 26% 33% 35% 25% 20% 28% 31% 37% 30%
B B BG
Leans Conservative 86 8 12 6 7 5 9 7 9 9 1014% 10% 14% 14% 11% 9% 18% 17% 24% 13% 15%
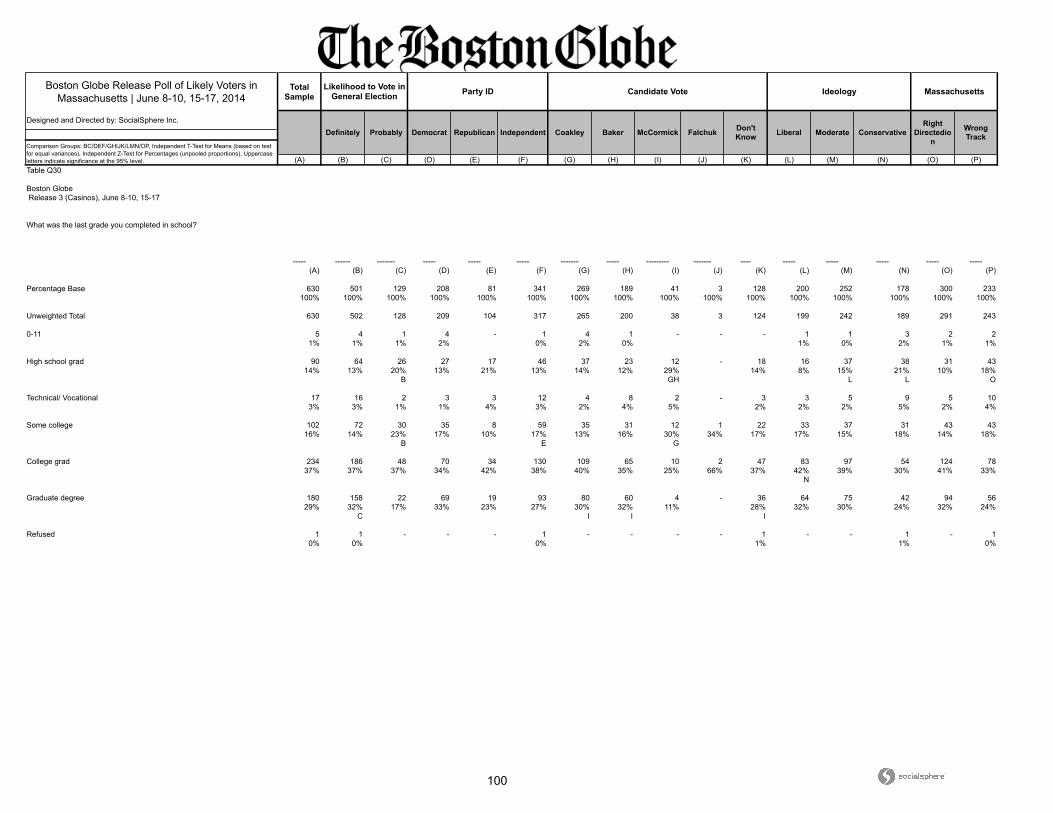
100
Boston Globe Release Poll of Likely Voters in Massachusetts | June 8-10, 15-17, 2014
Total Sample
Designed and Directed by: SocialSphere Inc.
(A) (B) (C) (D) (E) (F) (G) (H) (I) (J) (K) (L) (M) (N) (O) (P)
Ideology Massachusetts
Definitely Probably Democrat Republican Falchuk Don't Know
Likelihood to Vote in General Election Party ID Candidate Vote
Liberal Moderate ConservativeRight
Directedion
Comparison Groups: BC/DEF/GHIJK/LMN/OP, Independent T-Test for Means (based on test for equal variances), Independent Z-Test for Percentages (unpooled proportions), Uppercase letters indicate significance at the 95% level.
Independent Coakley Baker McCormick Wrong Track
Table Q30
Boston Globe Release 3 (Casinos), June 8-10, 15-17
What was the last grade you completed in school?
----- ------ ------- ----- ----- ----- ------- ----- --------- ------- ---- ----- ----- ----- ----- -----
(A) (B) (C) (D) (E) (F) (G) (H) (I) (J) (K) (L) (M) (N) (O) (P)
Percentage Base 630 501 129 208 81 341 269 189 41 3 128 200 252 178 300 233100% 100% 100% 100% 100% 100% 100% 100% 100% 100% 100% 100% 100% 100% 100% 100%
Unweighted Total 630 502 128 209 104 317 265 200 38 3 124 199 242 189 291 243
0-11 5 4 1 4 - 1 4 1 - - - 1 1 3 2 21% 1% 1% 2% 0% 2% 0% 1% 0% 2% 1% 1%
High school grad 90 64 26 27 17 46 37 23 12 - 18 16 37 38 31 4314% 13% 20% 13% 21% 13% 14% 12% 29% 14% 8% 15% 21% 10% 18%
B GH L L O
Technical/ Vocational 17 16 2 3 3 12 4 8 2 - 3 3 5 9 5 103% 3% 1% 1% 4% 3% 2% 4% 5% 2% 2% 2% 5% 2% 4%
Some college 102 72 30 35 8 59 35 31 12 1 22 33 37 31 43 4316% 14% 23% 17% 10% 17% 13% 16% 30% 34% 17% 17% 15% 18% 14% 18%
B E G
College grad 234 186 48 70 34 130 109 65 10 2 47 83 97 54 124 7837% 37% 37% 34% 42% 38% 40% 35% 25% 66% 37% 42% 39% 30% 41% 33%
N
Graduate degree 180 158 22 69 19 93 80 60 4 - 36 64 75 42 94 5629% 32% 17% 33% 23% 27% 30% 32% 11% 28% 32% 30% 24% 32% 24%
C I I I
Refused 1 1 - - - 1 - - - - 1 - - 1 - 10% 0% 0% 1% 1% 0%
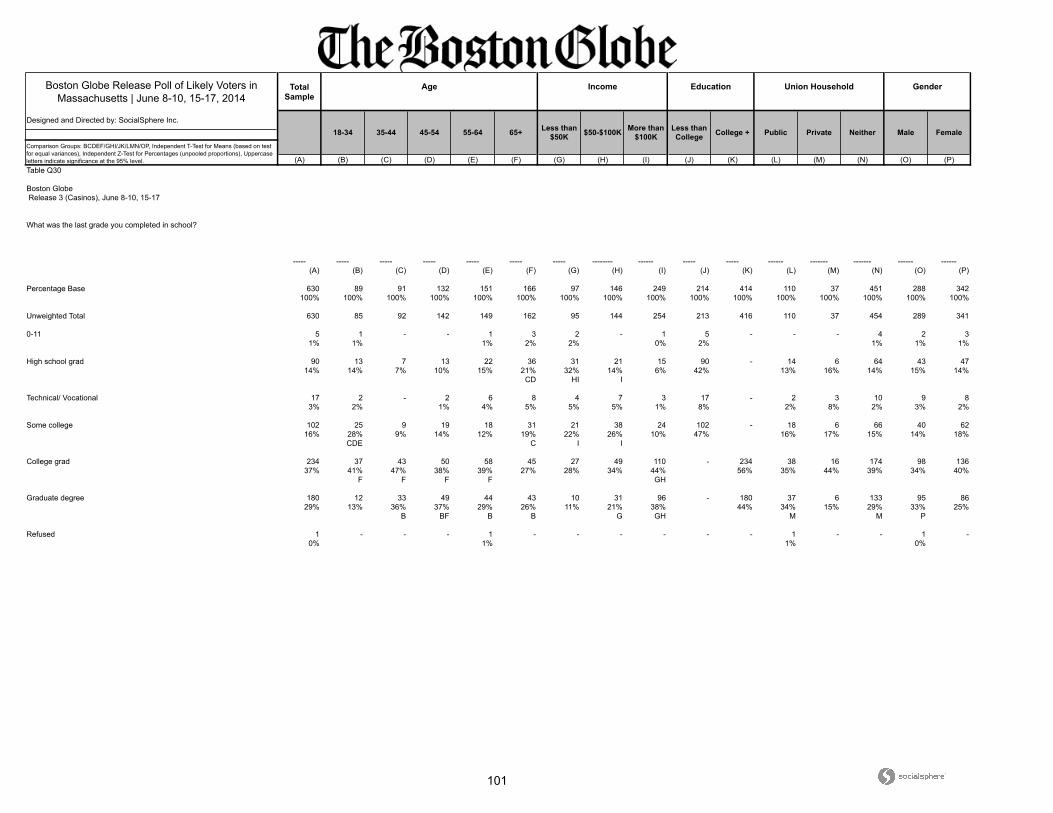
101
Boston Globe Release Poll of Likely Voters in Massachusetts | June 8-10, 15-17, 2014
Total Sample
Designed and Directed by: SocialSphere Inc.
(A) (B) (C) (D) (E) (F) (G) (H) (I) (J) (K) (L) (M) (N) (O) (P)
Union Household Gender
18-34 35-44 45-54 55-64 Less than College College +
Age Income Education
Comparison Groups: BCDEF/GHI/JK/LMN/OP, Independent T-Test for Means (based on test for equal variances), Independent Z-Test for Percentages (unpooled proportions), Uppercase letters indicate significance at the 95% level.
65+ Less than $50K $50-$100K More than
$100K Public Private Neither Male Female
Table Q30
Boston Globe Release 3 (Casinos), June 8-10, 15-17
What was the last grade you completed in school?
----- ----- ----- ----- ----- ----- ----- -------- ------ ----- ----- ------ ------- ------- ------ ------
(A) (B) (C) (D) (E) (F) (G) (H) (I) (J) (K) (L) (M) (N) (O) (P)
Percentage Base 630 89 91 132 151 166 97 146 249 214 414 110 37 451 288 342100% 100% 100% 100% 100% 100% 100% 100% 100% 100% 100% 100% 100% 100% 100% 100%
Unweighted Total 630 85 92 142 149 162 95 144 254 213 416 110 37 454 289 341
0-11 5 1 - - 1 3 2 - 1 5 - - - 4 2 31% 1% 1% 2% 2% 0% 2% 1% 1% 1%
High school grad 90 13 7 13 22 36 31 21 15 90 - 14 6 64 43 4714% 14% 7% 10% 15% 21% 32% 14% 6% 42% 13% 16% 14% 15% 14%
CD HI I
Technical/ Vocational 17 2 - 2 6 8 4 7 3 17 - 2 3 10 9 83% 2% 1% 4% 5% 5% 5% 1% 8% 2% 8% 2% 3% 2%
Some college 102 25 9 19 18 31 21 38 24 102 - 18 6 66 40 6216% 28% 9% 14% 12% 19% 22% 26% 10% 47% 16% 17% 15% 14% 18%
CDE C I I
College grad 234 37 43 50 58 45 27 49 110 - 234 38 16 174 98 13637% 41% 47% 38% 39% 27% 28% 34% 44% 56% 35% 44% 39% 34% 40%
F F F F GH
Graduate degree 180 12 33 49 44 43 10 31 96 - 180 37 6 133 95 8629% 13% 36% 37% 29% 26% 11% 21% 38% 44% 34% 15% 29% 33% 25%
B BF B B G GH M M P
Refused 1 - - - 1 - - - - - - 1 - - 1 -0% 1% 1% 0%

102
Boston Globe Release Poll of Likely Voters in Massachusetts | June 8-10, 15-17, 2014
Total Sample
Designed and Directed by: SocialSphere Inc.
(A) (B) (C) (D) (E) (F) (G) (H) (I) (J) (K)
CentralMA
WesternMA
Comparison Groups: BCDEFGHIJK, Independent T-Test for Means (based on test for equal variances), Independent Z-Test for Percentages (unpooled proportions), Uppercase letters indicate significance at the 95% level.
Region
Metro-Boston
Inside128
NorthShore
MerrimackValley
Metro-West
South ofBoston
SouthShore
Cape &Islands and
SouthCoast
Table Q30
Boston Globe Release 3 (Casinos), June 8-10, 15-17
What was the last grade you completed in school?
----- -------- -------- ------- --------- ------- -------- ------- --------- ------- ---------
(A) (B) (C) (D) (E) (F) (G) (H) (I) (J) (K)
Percentage Base 630 84 89 45 61 53 51 41 38 70 66100% 100% 100% 100% 100% 100% 100% 100% 100% 100% 100%
Unweighted Total 630 84 94 45 63 57 49 38 31 82 61
0-11 5 - - - 1 - - - 2 1 11% 2% 6% 1% 2%
High school grad 90 12 10 5 6 6 6 8 7 14 1214% 14% 11% 11% 10% 11% 12% 18% 19% 20% 18%
Technical/ Vocational 17 3 2 4 3 - 1 1 - 2 -3% 3% 2% 9% 4% 2% 3% 2%
Some college 102 13 10 7 14 6 7 7 14 13 916% 16% 11% 15% 23% 11% 14% 16% 38% 19% 14%
BCDFGHK
College grad 234 30 40 16 17 20 21 17 7 26 2837% 36% 45% 35% 27% 38% 40% 40% 19% 38% 42%
EI I I
Graduate degree 180 26 28 13 21 21 16 9 6 14 1629% 31% 31% 29% 34% 41% 31% 23% 15% 20% 25%
I I I IJ
Refused 1 - - - - - - - 1 - -0% 3%
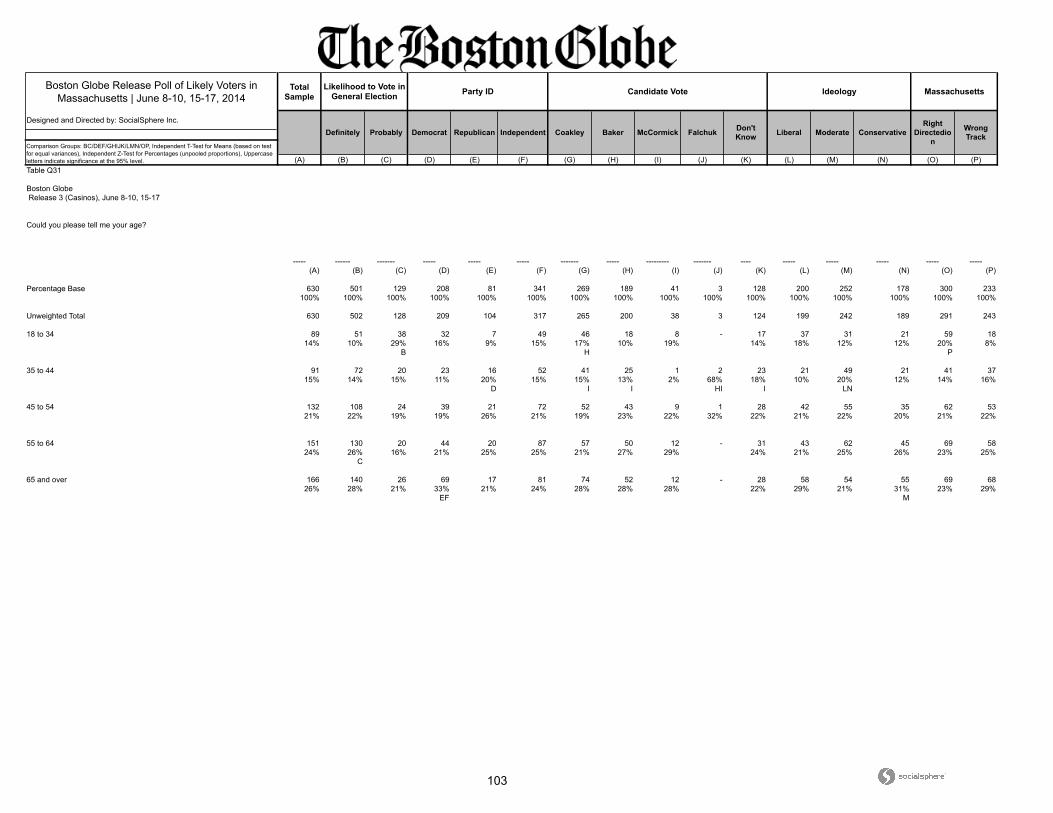
103
Boston Globe Release Poll of Likely Voters in Massachusetts | June 8-10, 15-17, 2014
Total Sample
Designed and Directed by: SocialSphere Inc.
(A) (B) (C) (D) (E) (F) (G) (H) (I) (J) (K) (L) (M) (N) (O) (P)
Ideology Massachusetts
Definitely Probably Democrat Republican Falchuk Don't Know
Likelihood to Vote in General Election Party ID Candidate Vote
Liberal Moderate ConservativeRight
Directedion
Comparison Groups: BC/DEF/GHIJK/LMN/OP, Independent T-Test for Means (based on test for equal variances), Independent Z-Test for Percentages (unpooled proportions), Uppercase letters indicate significance at the 95% level.
Independent Coakley Baker McCormick Wrong Track
Table Q31
Boston Globe Release 3 (Casinos), June 8-10, 15-17
Could you please tell me your age?
----- ------ ------- ----- ----- ----- ------- ----- --------- ------- ---- ----- ----- ----- ----- -----
(A) (B) (C) (D) (E) (F) (G) (H) (I) (J) (K) (L) (M) (N) (O) (P)
Percentage Base 630 501 129 208 81 341 269 189 41 3 128 200 252 178 300 233100% 100% 100% 100% 100% 100% 100% 100% 100% 100% 100% 100% 100% 100% 100% 100%
Unweighted Total 630 502 128 209 104 317 265 200 38 3 124 199 242 189 291 243
18 to 34 89 51 38 32 7 49 46 18 8 - 17 37 31 21 59 1814% 10% 29% 16% 9% 15% 17% 10% 19% 14% 18% 12% 12% 20% 8%
B H P
35 to 44 91 72 20 23 16 52 41 25 1 2 23 21 49 21 41 3715% 14% 15% 11% 20% 15% 15% 13% 2% 68% 18% 10% 20% 12% 14% 16%
D I I HI I LN
45 to 54 132 108 24 39 21 72 52 43 9 1 28 42 55 35 62 5321% 22% 19% 19% 26% 21% 19% 23% 22% 32% 22% 21% 22% 20% 21% 22%
55 to 64 151 130 20 44 20 87 57 50 12 - 31 43 62 45 69 5824% 26% 16% 21% 25% 25% 21% 27% 29% 24% 21% 25% 26% 23% 25%
C
65 and over 166 140 26 69 17 81 74 52 12 - 28 58 54 55 69 6826% 28% 21% 33% 21% 24% 28% 28% 28% 22% 29% 21% 31% 23% 29%
EF M

104
Boston Globe Release Poll of Likely Voters in Massachusetts | June 8-10, 15-17, 2014
Total Sample
Designed and Directed by: SocialSphere Inc.
(A) (B) (C) (D) (E) (F) (G) (H) (I) (J) (K) (L) (M) (N) (O) (P)
Union Household Gender
18-34 35-44 45-54 55-64 Less than College College +
Age Income Education
Comparison Groups: BCDEF/GHI/JK/LMN/OP, Independent T-Test for Means (based on test for equal variances), Independent Z-Test for Percentages (unpooled proportions), Uppercase letters indicate significance at the 95% level.
65+ Less than $50K $50-$100K More than
$100K Public Private Neither Male Female
Table Q31
Boston Globe Release 3 (Casinos), June 8-10, 15-17
Could you please tell me your age?
----- ----- ----- ----- ----- ----- ----- -------- ------ ----- ----- ------ ------- ------- ------ ------
(A) (B) (C) (D) (E) (F) (G) (H) (I) (J) (K) (L) (M) (N) (O) (P)
Percentage Base 630 89 91 132 151 166 97 146 249 214 414 110 37 451 288 342100% 100% 100% 100% 100% 100% 100% 100% 100% 100% 100% 100% 100% 100% 100% 100%
Unweighted Total 630 85 92 142 149 162 95 144 254 213 416 110 37 454 289 341
18 to 34 89 89 - - - - 19 27 24 40 49 10 3 60 43 4514% 100% 20% 19% 10% 19% 12% 9% 8% 13% 15% 13%
I I K
35 to 44 91 - 91 - - - 10 16 45 15 76 15 3 73 38 5315% 100% 11% 11% 18% 7% 18% 14% 7% 16% 13% 16%
H J
45 to 54 132 - - 132 - - 7 25 69 33 99 32 13 82 64 6921% 100% 8% 17% 28% 16% 24% 29% 35% 18% 22% 20%
G GH J N N
55 to 64 151 - - - 151 - 9 38 75 47 103 33 11 103 71 8024% 100% 9% 26% 30% 22% 25% 30% 28% 23% 25% 23%
G G
65 and over 166 - - - - 166 51 39 36 78 88 21 8 133 71 9526% 100% 53% 27% 14% 37% 21% 19% 21% 30% 25% 28%
HI I K L
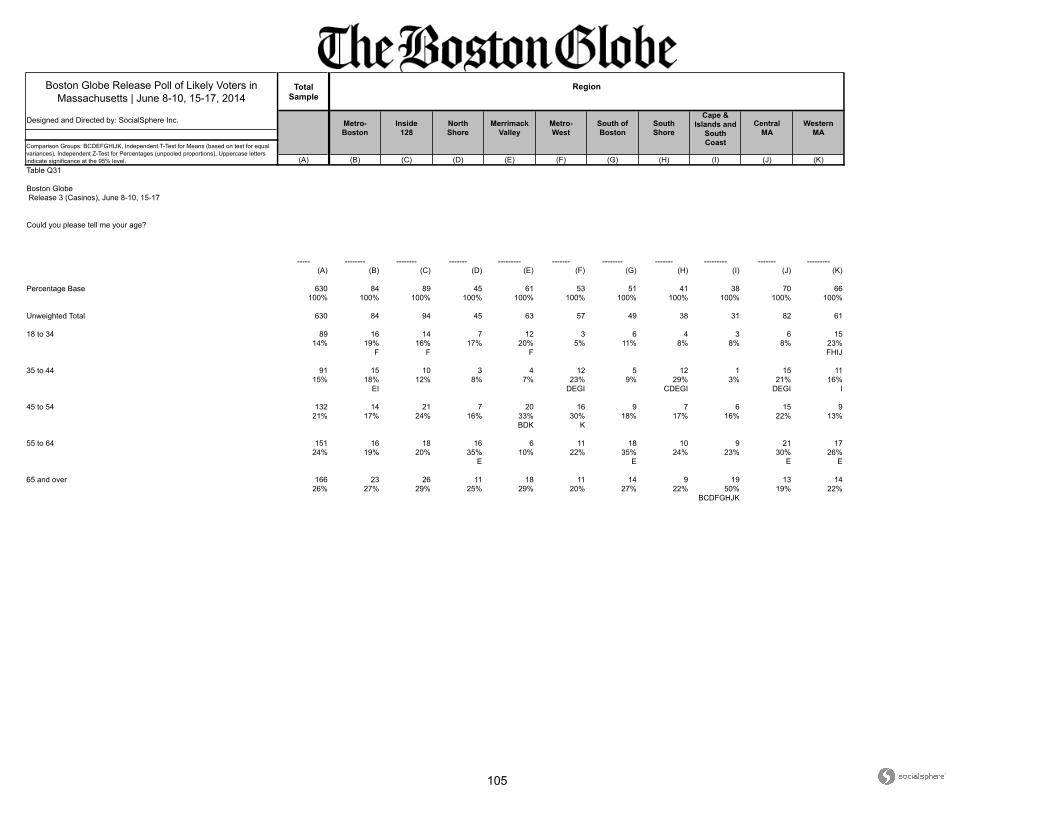
105
Boston Globe Release Poll of Likely Voters in Massachusetts | June 8-10, 15-17, 2014
Total Sample
Designed and Directed by: SocialSphere Inc.
(A) (B) (C) (D) (E) (F) (G) (H) (I) (J) (K)
CentralMA
WesternMA
Comparison Groups: BCDEFGHIJK, Independent T-Test for Means (based on test for equal variances), Independent Z-Test for Percentages (unpooled proportions), Uppercase letters indicate significance at the 95% level.
Region
Metro-Boston
Inside128
NorthShore
MerrimackValley
Metro-West
South ofBoston
SouthShore
Cape &Islands and
SouthCoast
Table Q31
Boston Globe Release 3 (Casinos), June 8-10, 15-17
Could you please tell me your age?
----- -------- -------- ------- --------- ------- -------- ------- --------- ------- ---------
(A) (B) (C) (D) (E) (F) (G) (H) (I) (J) (K)
Percentage Base 630 84 89 45 61 53 51 41 38 70 66100% 100% 100% 100% 100% 100% 100% 100% 100% 100% 100%
Unweighted Total 630 84 94 45 63 57 49 38 31 82 61
18 to 34 89 16 14 7 12 3 6 4 3 6 1514% 19% 16% 17% 20% 5% 11% 8% 8% 8% 23%
F F F FHIJ
35 to 44 91 15 10 3 4 12 5 12 1 15 1115% 18% 12% 8% 7% 23% 9% 29% 3% 21% 16%
EI DEGI CDEGI DEGI I
45 to 54 132 14 21 7 20 16 9 7 6 15 921% 17% 24% 16% 33% 30% 18% 17% 16% 22% 13%
BDK K
55 to 64 151 16 18 16 6 11 18 10 9 21 1724% 19% 20% 35% 10% 22% 35% 24% 23% 30% 26%
E E E E
65 and over 166 23 26 11 18 11 14 9 19 13 1426% 27% 29% 25% 29% 20% 27% 22% 50% 19% 22%
BCDFGHJK
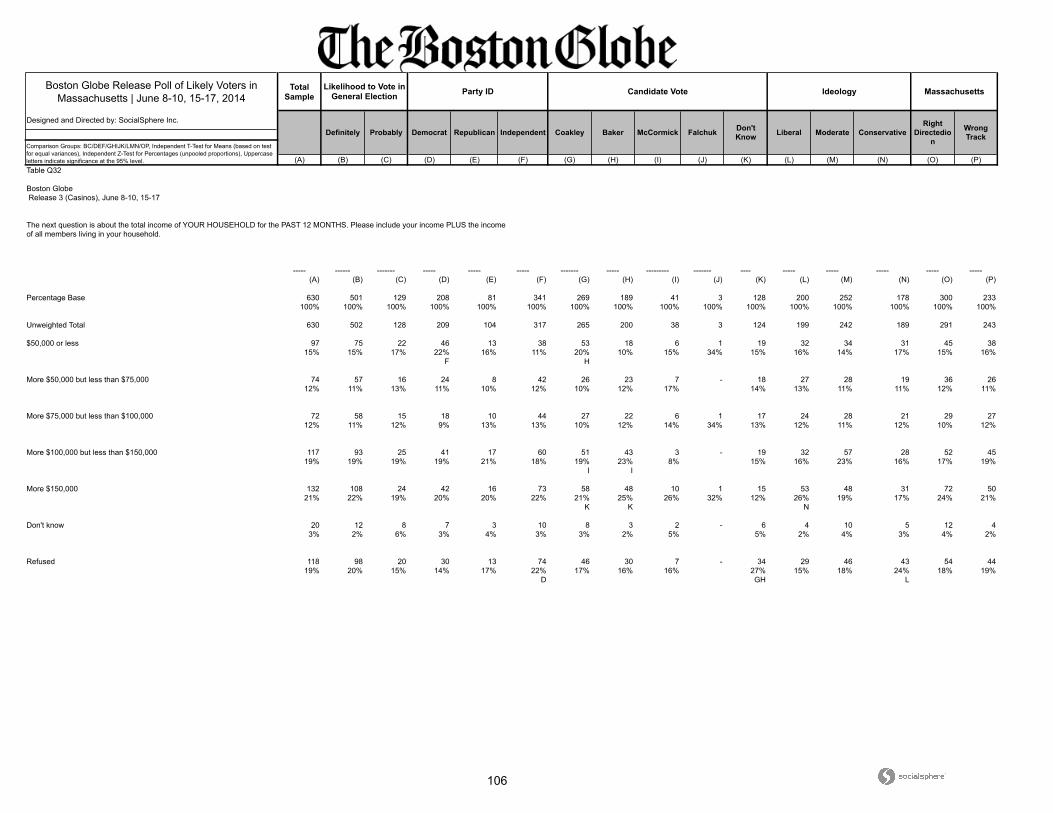
106
Boston Globe Release Poll of Likely Voters in Massachusetts | June 8-10, 15-17, 2014
Total Sample
Designed and Directed by: SocialSphere Inc.
(A) (B) (C) (D) (E) (F) (G) (H) (I) (J) (K) (L) (M) (N) (O) (P)
Ideology Massachusetts
Definitely Probably Democrat Republican Falchuk Don't Know
Likelihood to Vote in General Election Party ID Candidate Vote
Liberal Moderate ConservativeRight
Directedion
Comparison Groups: BC/DEF/GHIJK/LMN/OP, Independent T-Test for Means (based on test for equal variances), Independent Z-Test for Percentages (unpooled proportions), Uppercase letters indicate significance at the 95% level.
Independent Coakley Baker McCormick Wrong Track
Table Q32
Boston Globe Release 3 (Casinos), June 8-10, 15-17
The next question is about the total income of YOUR HOUSEHOLD for the PAST 12 MONTHS. Please include your income PLUS the income of all members living in your household.
----- ------ ------- ----- ----- ----- ------- ----- --------- ------- ---- ----- ----- ----- ----- -----
(A) (B) (C) (D) (E) (F) (G) (H) (I) (J) (K) (L) (M) (N) (O) (P)
Percentage Base 630 501 129 208 81 341 269 189 41 3 128 200 252 178 300 233100% 100% 100% 100% 100% 100% 100% 100% 100% 100% 100% 100% 100% 100% 100% 100%
Unweighted Total 630 502 128 209 104 317 265 200 38 3 124 199 242 189 291 243
$50,000 or less 97 75 22 46 13 38 53 18 6 1 19 32 34 31 45 3815% 15% 17% 22% 16% 11% 20% 10% 15% 34% 15% 16% 14% 17% 15% 16%
F H
More $50,000 but less than $75,000 74 57 16 24 8 42 26 23 7 - 18 27 28 19 36 2612% 11% 13% 11% 10% 12% 10% 12% 17% 14% 13% 11% 11% 12% 11%
More $75,000 but less than $100,000 72 58 15 18 10 44 27 22 6 1 17 24 28 21 29 2712% 11% 12% 9% 13% 13% 10% 12% 14% 34% 13% 12% 11% 12% 10% 12%
More $100,000 but less than $150,000 117 93 25 41 17 60 51 43 3 - 19 32 57 28 52 4519% 19% 19% 19% 21% 18% 19% 23% 8% 15% 16% 23% 16% 17% 19%
I I
More $150,000 132 108 24 42 16 73 58 48 10 1 15 53 48 31 72 5021% 22% 19% 20% 20% 22% 21% 25% 26% 32% 12% 26% 19% 17% 24% 21%
K K N
Don't know 20 12 8 7 3 10 8 3 2 - 6 4 10 5 12 43% 2% 6% 3% 4% 3% 3% 2% 5% 5% 2% 4% 3% 4% 2%
Refused 118 98 20 30 13 74 46 30 7 - 34 29 46 43 54 4419% 20% 15% 14% 17% 22% 17% 16% 16% 27% 15% 18% 24% 18% 19%
D GH L
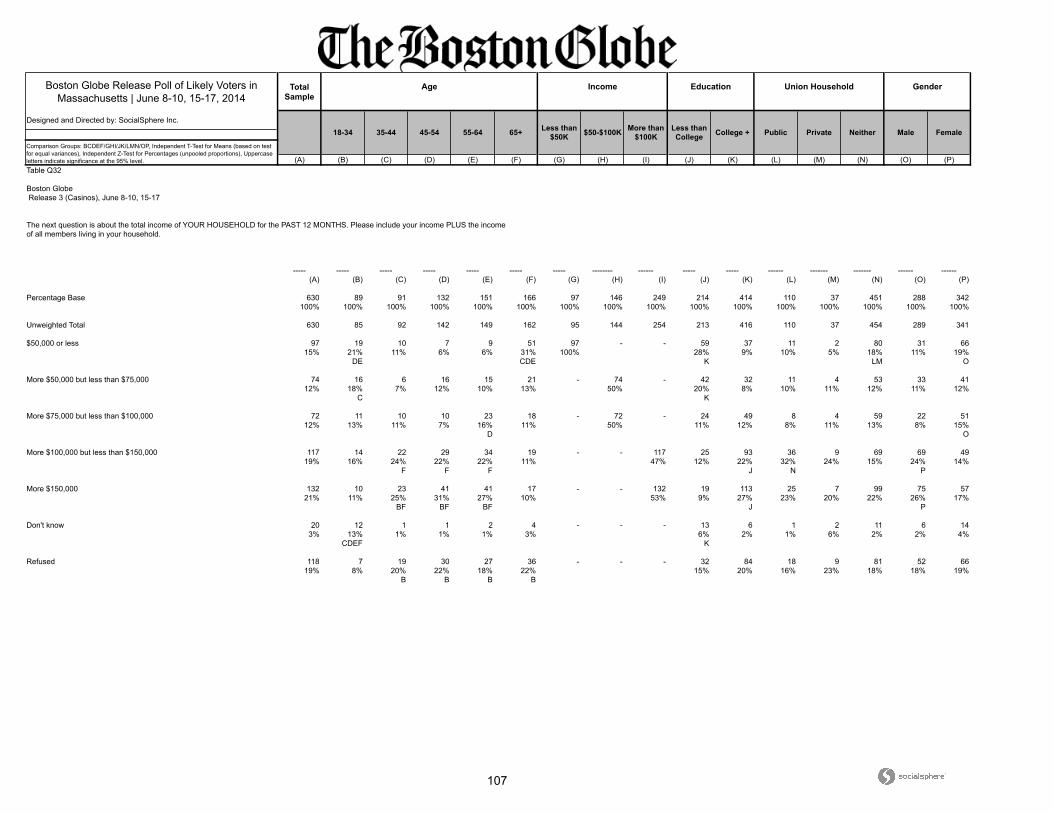
107
Boston Globe Release Poll of Likely Voters in Massachusetts | June 8-10, 15-17, 2014
Total Sample
Designed and Directed by: SocialSphere Inc.
(A) (B) (C) (D) (E) (F) (G) (H) (I) (J) (K) (L) (M) (N) (O) (P)
Union Household Gender
18-34 35-44 45-54 55-64 Less than College College +
Age Income Education
Comparison Groups: BCDEF/GHI/JK/LMN/OP, Independent T-Test for Means (based on test for equal variances), Independent Z-Test for Percentages (unpooled proportions), Uppercase letters indicate significance at the 95% level.
65+ Less than $50K $50-$100K More than
$100K Public Private Neither Male Female
Table Q32
Boston Globe Release 3 (Casinos), June 8-10, 15-17
The next question is about the total income of YOUR HOUSEHOLD for the PAST 12 MONTHS. Please include your income PLUS the income of all members living in your household.
----- ----- ----- ----- ----- ----- ----- -------- ------ ----- ----- ------ ------- ------- ------ ------
(A) (B) (C) (D) (E) (F) (G) (H) (I) (J) (K) (L) (M) (N) (O) (P)
Percentage Base 630 89 91 132 151 166 97 146 249 214 414 110 37 451 288 342100% 100% 100% 100% 100% 100% 100% 100% 100% 100% 100% 100% 100% 100% 100% 100%
Unweighted Total 630 85 92 142 149 162 95 144 254 213 416 110 37 454 289 341
$50,000 or less 97 19 10 7 9 51 97 - - 59 37 11 2 80 31 6615% 21% 11% 6% 6% 31% 100% 28% 9% 10% 5% 18% 11% 19%
DE CDE K LM O
More $50,000 but less than $75,000 74 16 6 16 15 21 - 74 - 42 32 11 4 53 33 4112% 18% 7% 12% 10% 13% 50% 20% 8% 10% 11% 12% 11% 12%
C K
More $75,000 but less than $100,000 72 11 10 10 23 18 - 72 - 24 49 8 4 59 22 5112% 13% 11% 7% 16% 11% 50% 11% 12% 8% 11% 13% 8% 15%
D O
More $100,000 but less than $150,000 117 14 22 29 34 19 - - 117 25 93 36 9 69 69 4919% 16% 24% 22% 22% 11% 47% 12% 22% 32% 24% 15% 24% 14%
F F F J N P
More $150,000 132 10 23 41 41 17 - - 132 19 113 25 7 99 75 5721% 11% 25% 31% 27% 10% 53% 9% 27% 23% 20% 22% 26% 17%
BF BF BF J P
Don't know 20 12 1 1 2 4 - - - 13 6 1 2 11 6 143% 13% 1% 1% 1% 3% 6% 2% 1% 6% 2% 2% 4%
CDEF K
Refused 118 7 19 30 27 36 - - - 32 84 18 9 81 52 6619% 8% 20% 22% 18% 22% 15% 20% 16% 23% 18% 18% 19%
B B B B
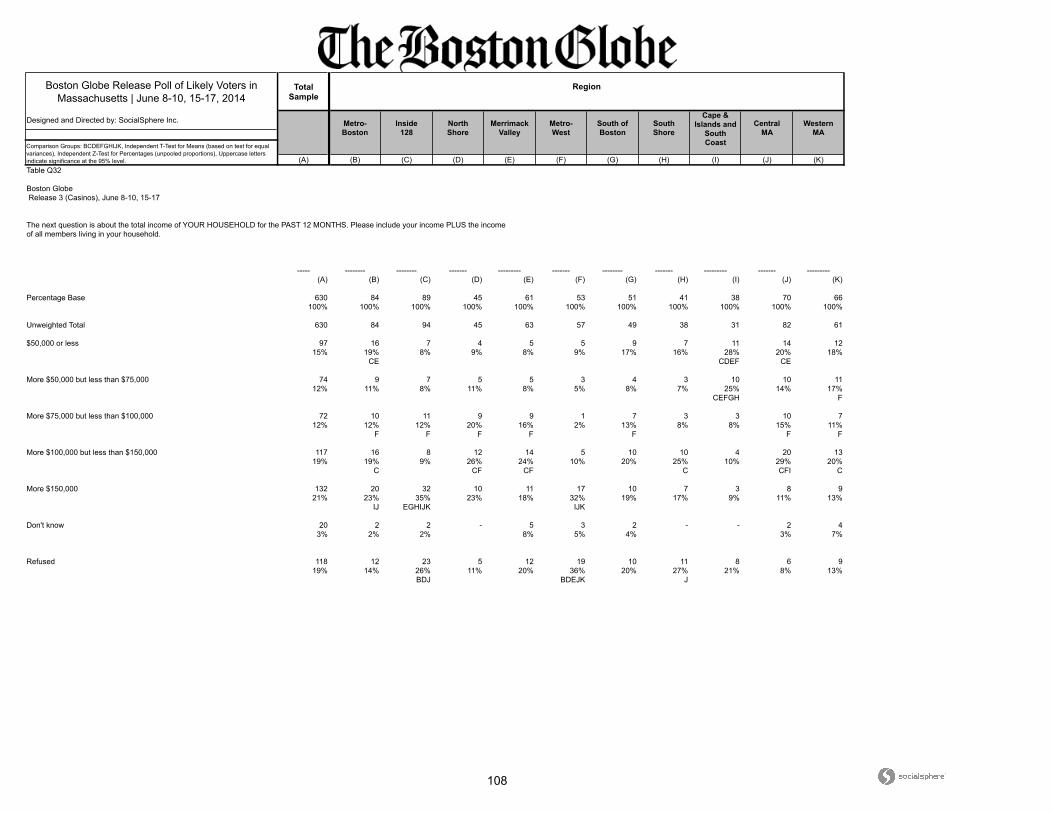
108
Boston Globe Release Poll of Likely Voters in Massachusetts | June 8-10, 15-17, 2014
Total Sample
Designed and Directed by: SocialSphere Inc.
(A) (B) (C) (D) (E) (F) (G) (H) (I) (J) (K)
CentralMA
WesternMA
Comparison Groups: BCDEFGHIJK, Independent T-Test for Means (based on test for equal variances), Independent Z-Test for Percentages (unpooled proportions), Uppercase letters indicate significance at the 95% level.
Region
Metro-Boston
Inside128
NorthShore
MerrimackValley
Metro-West
South ofBoston
SouthShore
Cape &Islands and
SouthCoast
Table Q32
Boston Globe Release 3 (Casinos), June 8-10, 15-17
The next question is about the total income of YOUR HOUSEHOLD for the PAST 12 MONTHS. Please include your income PLUS the income of all members living in your household.
----- -------- -------- ------- --------- ------- -------- ------- --------- ------- ---------
(A) (B) (C) (D) (E) (F) (G) (H) (I) (J) (K)
Percentage Base 630 84 89 45 61 53 51 41 38 70 66100% 100% 100% 100% 100% 100% 100% 100% 100% 100% 100%
Unweighted Total 630 84 94 45 63 57 49 38 31 82 61
$50,000 or less 97 16 7 4 5 5 9 7 11 14 1215% 19% 8% 9% 8% 9% 17% 16% 28% 20% 18%
CE CDEF CE
More $50,000 but less than $75,000 74 9 7 5 5 3 4 3 10 10 1112% 11% 8% 11% 8% 5% 8% 7% 25% 14% 17%
CEFGH F
More $75,000 but less than $100,000 72 10 11 9 9 1 7 3 3 10 712% 12% 12% 20% 16% 2% 13% 8% 8% 15% 11%
F F F F F F F
More $100,000 but less than $150,000 117 16 8 12 14 5 10 10 4 20 1319% 19% 9% 26% 24% 10% 20% 25% 10% 29% 20%
C CF CF C CFI C
More $150,000 132 20 32 10 11 17 10 7 3 8 921% 23% 35% 23% 18% 32% 19% 17% 9% 11% 13%
IJ EGHIJK IJK
Don't know 20 2 2 - 5 3 2 - - 2 43% 2% 2% 8% 5% 4% 3% 7%
Refused 118 12 23 5 12 19 10 11 8 6 919% 14% 26% 11% 20% 36% 20% 27% 21% 8% 13%
BDJ BDEJK J
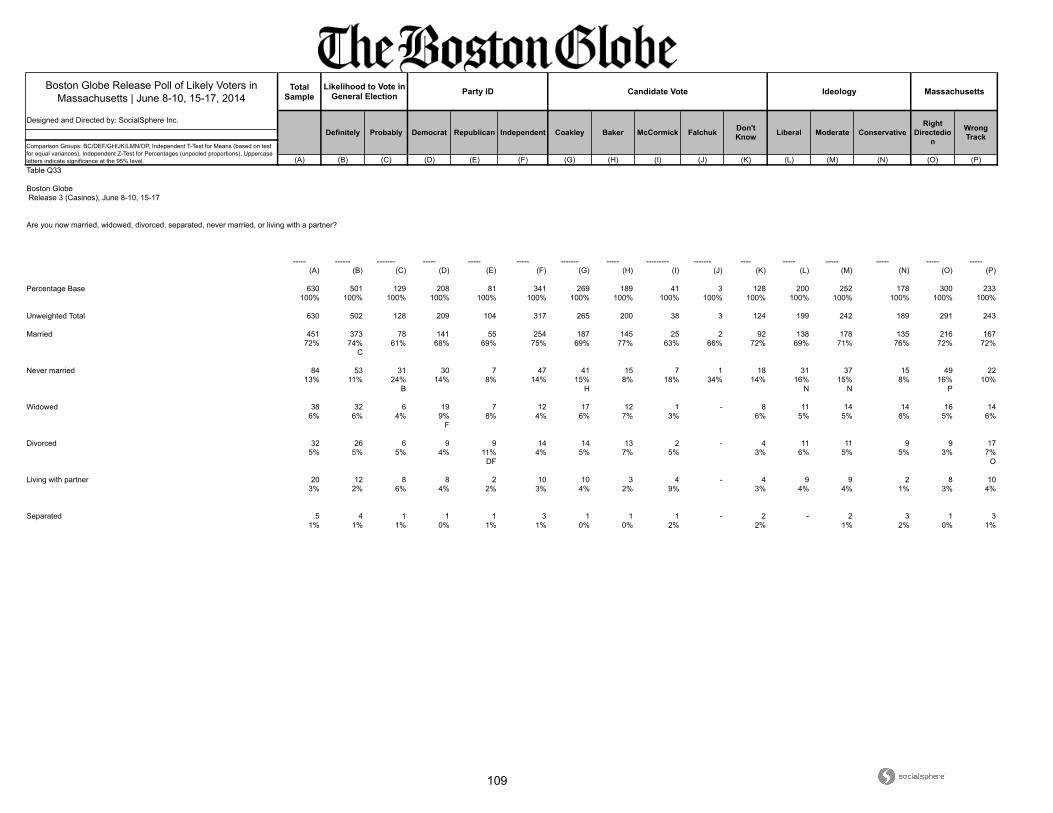
109
Boston Globe Release Poll of Likely Voters in Massachusetts | June 8-10, 15-17, 2014
Total Sample
Designed and Directed by: SocialSphere Inc.
(A) (B) (C) (D) (E) (F) (G) (H) (I) (J) (K) (L) (M) (N) (O) (P)
Ideology Massachusetts
Definitely Probably Democrat Republican Falchuk Don't Know
Likelihood to Vote in General Election Party ID Candidate Vote
Liberal Moderate ConservativeRight
Directedion
Comparison Groups: BC/DEF/GHIJK/LMN/OP, Independent T-Test for Means (based on test for equal variances), Independent Z-Test for Percentages (unpooled proportions), Uppercase letters indicate significance at the 95% level.
Independent Coakley Baker McCormick Wrong Track
Table Q33
Boston Globe Release 3 (Casinos), June 8-10, 15-17
Are you now married, widowed, divorced, separated, never married, or living with a partner?
----- ------ ------- ----- ----- ----- ------- ----- --------- ------- ---- ----- ----- ----- ----- -----
(A) (B) (C) (D) (E) (F) (G) (H) (I) (J) (K) (L) (M) (N) (O) (P)
Percentage Base 630 501 129 208 81 341 269 189 41 3 128 200 252 178 300 233100% 100% 100% 100% 100% 100% 100% 100% 100% 100% 100% 100% 100% 100% 100% 100%
Unweighted Total 630 502 128 209 104 317 265 200 38 3 124 199 242 189 291 243
Married 451 373 78 141 55 254 187 145 25 2 92 138 178 135 216 16772% 74% 61% 68% 69% 75% 69% 77% 63% 66% 72% 69% 71% 76% 72% 72%
C
Never married 84 53 31 30 7 47 41 15 7 1 18 31 37 15 49 2213% 11% 24% 14% 8% 14% 15% 8% 18% 34% 14% 16% 15% 8% 16% 10%
B H N N P
Widowed 38 32 6 19 7 12 17 12 1 - 8 11 14 14 16 146% 6% 4% 9% 8% 4% 6% 7% 3% 6% 5% 5% 8% 5% 6%
F
Divorced 32 26 6 9 9 14 14 13 2 - 4 11 11 9 9 175% 5% 5% 4% 11% 4% 5% 7% 5% 3% 6% 5% 5% 3% 7%
DF O
Living with partner 20 12 8 8 2 10 10 3 4 - 4 9 9 2 8 103% 2% 6% 4% 2% 3% 4% 2% 9% 3% 4% 4% 1% 3% 4%
Separated 5 4 1 1 1 3 1 1 1 - 2 - 2 3 1 31% 1% 1% 0% 1% 1% 0% 0% 2% 2% 1% 2% 0% 1%
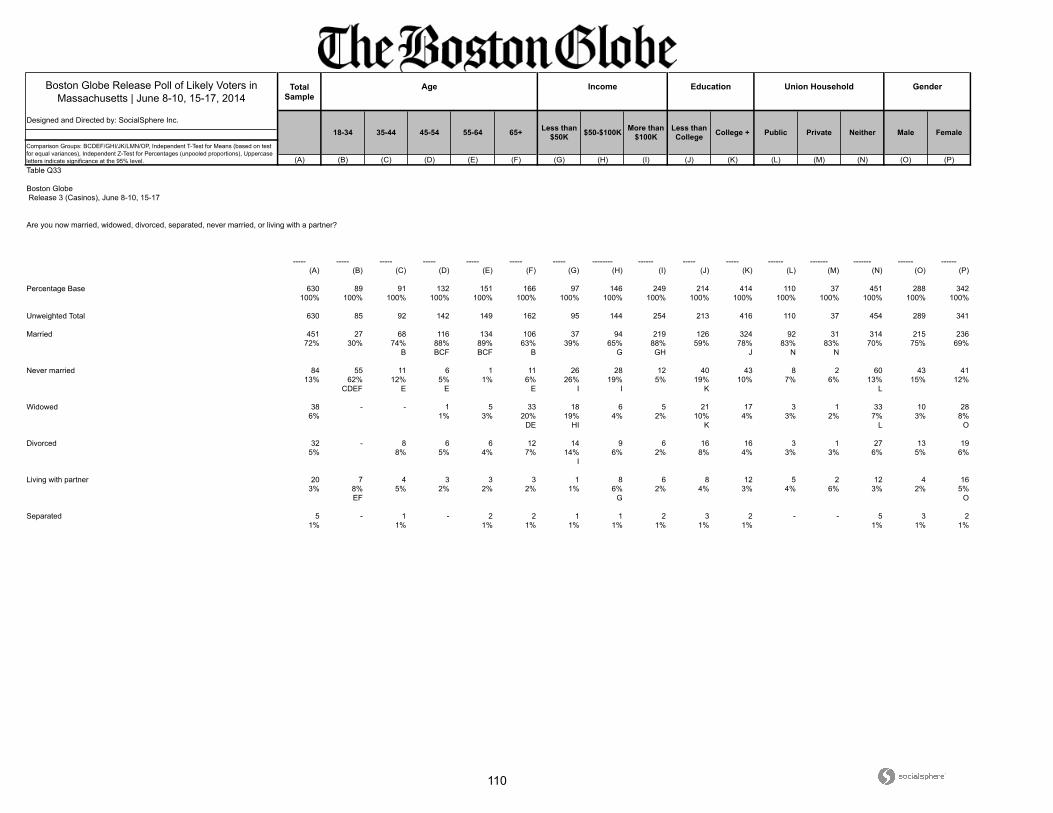
110
Boston Globe Release Poll of Likely Voters in Massachusetts | June 8-10, 15-17, 2014
Total Sample
Designed and Directed by: SocialSphere Inc.
(A) (B) (C) (D) (E) (F) (G) (H) (I) (J) (K) (L) (M) (N) (O) (P)
Union Household Gender
18-34 35-44 45-54 55-64 Less than College College +
Age Income Education
Comparison Groups: BCDEF/GHI/JK/LMN/OP, Independent T-Test for Means (based on test for equal variances), Independent Z-Test for Percentages (unpooled proportions), Uppercase letters indicate significance at the 95% level.
65+ Less than $50K $50-$100K More than
$100K Public Private Neither Male Female
Table Q33
Boston Globe Release 3 (Casinos), June 8-10, 15-17
Are you now married, widowed, divorced, separated, never married, or living with a partner?
----- ----- ----- ----- ----- ----- ----- -------- ------ ----- ----- ------ ------- ------- ------ ------
(A) (B) (C) (D) (E) (F) (G) (H) (I) (J) (K) (L) (M) (N) (O) (P)
Percentage Base 630 89 91 132 151 166 97 146 249 214 414 110 37 451 288 342100% 100% 100% 100% 100% 100% 100% 100% 100% 100% 100% 100% 100% 100% 100% 100%
Unweighted Total 630 85 92 142 149 162 95 144 254 213 416 110 37 454 289 341
Married 451 27 68 116 134 106 37 94 219 126 324 92 31 314 215 23672% 30% 74% 88% 89% 63% 39% 65% 88% 59% 78% 83% 83% 70% 75% 69%
B BCF BCF B G GH J N N
Never married 84 55 11 6 1 11 26 28 12 40 43 8 2 60 43 4113% 62% 12% 5% 1% 6% 26% 19% 5% 19% 10% 7% 6% 13% 15% 12%
CDEF E E E I I K L
Widowed 38 - - 1 5 33 18 6 5 21 17 3 1 33 10 286% 1% 3% 20% 19% 4% 2% 10% 4% 3% 2% 7% 3% 8%
DE HI K L O
Divorced 32 - 8 6 6 12 14 9 6 16 16 3 1 27 13 195% 8% 5% 4% 7% 14% 6% 2% 8% 4% 3% 3% 6% 5% 6%
I
Living with partner 20 7 4 3 3 3 1 8 6 8 12 5 2 12 4 163% 8% 5% 2% 2% 2% 1% 6% 2% 4% 3% 4% 6% 3% 2% 5%
EF G O
Separated 5 - 1 - 2 2 1 1 2 3 2 - - 5 3 21% 1% 1% 1% 1% 1% 1% 1% 1% 1% 1% 1%
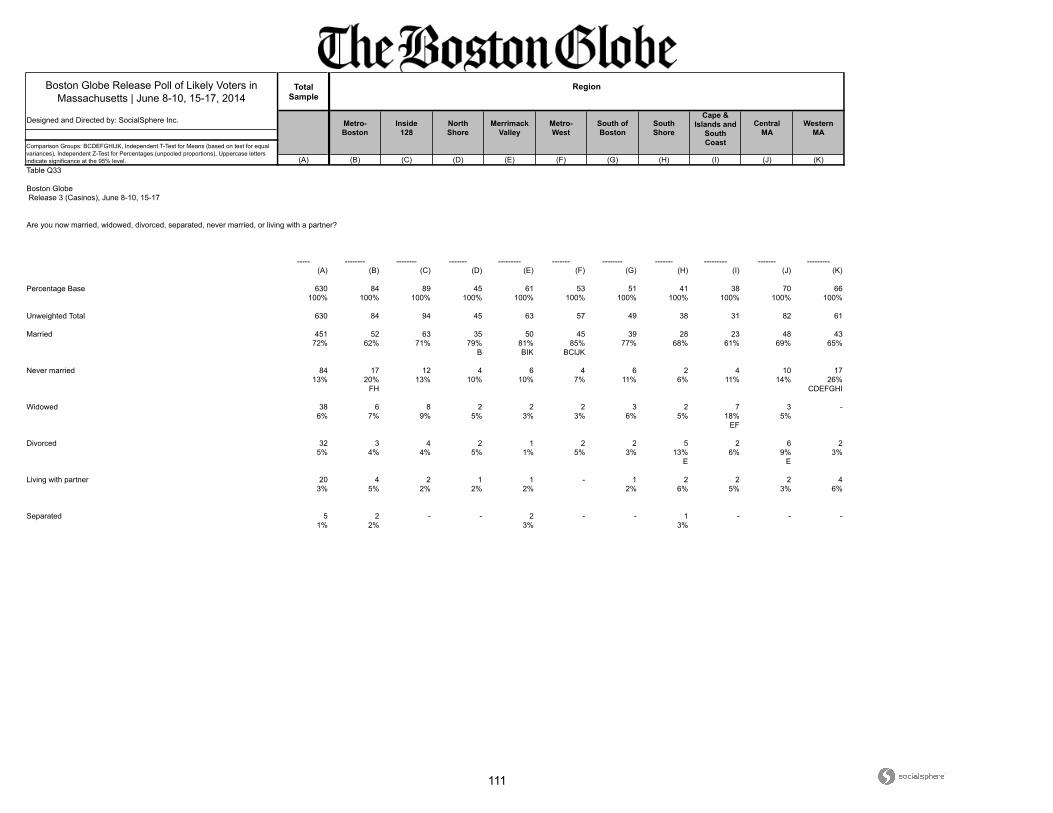
111
Boston Globe Release Poll of Likely Voters in Massachusetts | June 8-10, 15-17, 2014
Total Sample
Designed and Directed by: SocialSphere Inc.
(A) (B) (C) (D) (E) (F) (G) (H) (I) (J) (K)
CentralMA
WesternMA
Comparison Groups: BCDEFGHIJK, Independent T-Test for Means (based on test for equal variances), Independent Z-Test for Percentages (unpooled proportions), Uppercase letters indicate significance at the 95% level.
Region
Metro-Boston
Inside128
NorthShore
MerrimackValley
Metro-West
South ofBoston
SouthShore
Cape &Islands and
SouthCoast
Table Q33
Boston Globe Release 3 (Casinos), June 8-10, 15-17
Are you now married, widowed, divorced, separated, never married, or living with a partner?
----- -------- -------- ------- --------- ------- -------- ------- --------- ------- ---------
(A) (B) (C) (D) (E) (F) (G) (H) (I) (J) (K)
Percentage Base 630 84 89 45 61 53 51 41 38 70 66100% 100% 100% 100% 100% 100% 100% 100% 100% 100% 100%
Unweighted Total 630 84 94 45 63 57 49 38 31 82 61
Married 451 52 63 35 50 45 39 28 23 48 4372% 62% 71% 79% 81% 85% 77% 68% 61% 69% 65%
B BIK BCIJK
Never married 84 17 12 4 6 4 6 2 4 10 1713% 20% 13% 10% 10% 7% 11% 6% 11% 14% 26%
FH CDEFGHI
Widowed 38 6 8 2 2 2 3 2 7 3 -6% 7% 9% 5% 3% 3% 6% 5% 18% 5%
EF
Divorced 32 3 4 2 1 2 2 5 2 6 25% 4% 4% 5% 1% 5% 3% 13% 6% 9% 3%
E E
Living with partner 20 4 2 1 1 - 1 2 2 2 43% 5% 2% 2% 2% 2% 6% 5% 3% 6%
Separated 5 2 - - 2 - - 1 - - -1% 2% 3% 3%

112
Boston Globe Release Poll of Likely Voters in Massachusetts | June 8-10, 15-17, 2014
Total Sample
Designed and Directed by: SocialSphere Inc.
(A) (B) (C) (D) (E) (F) (G) (H) (I) (J) (K) (L) (M) (N) (O) (P)
Ideology Massachusetts
Definitely Probably Democrat Republican Falchuk Don't Know
Likelihood to Vote in General Election Party ID Candidate Vote
Liberal Moderate ConservativeRight
Directedion
Comparison Groups: BC/DEF/GHIJK/LMN/OP, Independent T-Test for Means (based on test for equal variances), Independent Z-Test for Percentages (unpooled proportions), Uppercase letters indicate significance at the 95% level.
Independent Coakley Baker McCormick Wrong Track
Table Q34
Boston Globe Release 3 (Casinos), June 8-10, 15-17
Which of the following is your race or origin?
----- ------ ------- ----- ----- ----- ------- ----- --------- ------- ---- ----- ----- ----- ----- -----
(A) (B) (C) (D) (E) (F) (G) (H) (I) (J) (K) (L) (M) (N) (O) (P)
Percentage Base 630 501 129 208 81 341 269 189 41 3 128 200 252 178 300 233100% 100% 100% 100% 100% 100% 100% 100% 100% 100% 100% 100% 100% 100% 100% 100%
Unweighted Total 630 502 128 209 104 317 265 200 38 3 124 199 242 189 291 243
White 534 424 110 171 74 289 222 164 36 3 110 167 218 149 243 20685% 85% 85% 82% 92% 85% 82% 87% 88% 100% 86% 84% 86% 84% 81% 88%
DF GHIK O
Black or African American 25 21 4 17 - 8 21 - 1 - 3 13 8 3 19 44% 4% 3% 8% 2% 8% 2% 3% 7% 3% 2% 6% 2%
F K N P
Hispanic, Latino or Spanish origin 14 10 4 8 2 4 11 2 - - 2 6 5 3 12 22% 2% 3% 4% 2% 1% 4% 1% 2% 3% 2% 2% 4% 1%
H P
American Indian or Alaska Native 5 2 3 1 - 4 - 3 - - 2 - 2 3 - 41% 0% 2% 1% 1% 2% 2% 1% 2% 2%
Asian 11 7 4 6 1 4 5 1 1 - 4 6 4 1 6 22% 1% 3% 3% 1% 1% 2% 0% 3% 3% 3% 2% - 2% 1%
N
Native Hawaiian or other Pacific Islander 1 1 - - - 1 1 - - - - - - 1 1 -- - - - 1% -
Some other race 12 11 1 1 1 11 3 6 1 - 2 2 4 6 6 42% 2% 1% 1% 1% 3% 1% 3% 2% 2% 1% 2% 4% 2% 2%
D
Refused 26 24 2 4 3 20 7 13 2 - 4 5 11 11 12 124% 5% 2% 2% 4% 6% 3% 7% 5% 3% 3% 4% 6% 4% 5%
C D G
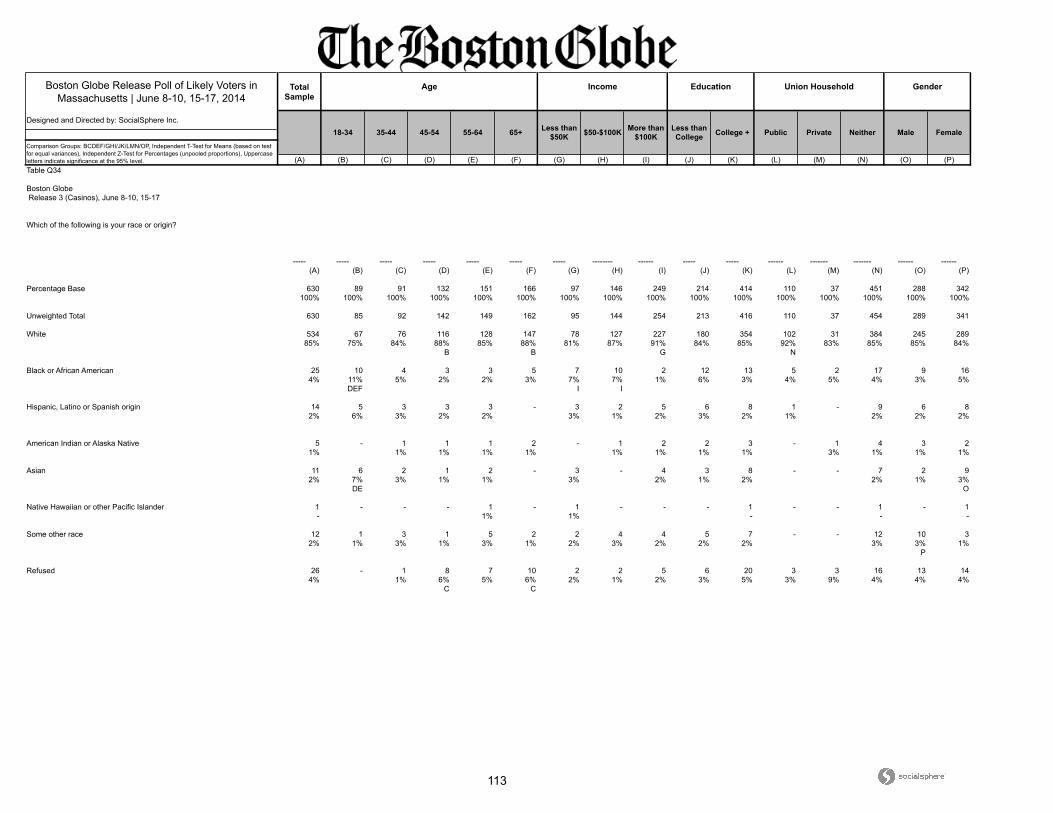
113
Boston Globe Release Poll of Likely Voters in Massachusetts | June 8-10, 15-17, 2014
Total Sample
Designed and Directed by: SocialSphere Inc.
(A) (B) (C) (D) (E) (F) (G) (H) (I) (J) (K) (L) (M) (N) (O) (P)
Union Household Gender
18-34 35-44 45-54 55-64 Less than College College +
Age Income Education
Comparison Groups: BCDEF/GHI/JK/LMN/OP, Independent T-Test for Means (based on test for equal variances), Independent Z-Test for Percentages (unpooled proportions), Uppercase letters indicate significance at the 95% level.
65+ Less than $50K $50-$100K More than
$100K Public Private Neither Male Female
Table Q34
Boston Globe Release 3 (Casinos), June 8-10, 15-17
Which of the following is your race or origin?
----- ----- ----- ----- ----- ----- ----- -------- ------ ----- ----- ------ ------- ------- ------ ------
(A) (B) (C) (D) (E) (F) (G) (H) (I) (J) (K) (L) (M) (N) (O) (P)
Percentage Base 630 89 91 132 151 166 97 146 249 214 414 110 37 451 288 342100% 100% 100% 100% 100% 100% 100% 100% 100% 100% 100% 100% 100% 100% 100% 100%
Unweighted Total 630 85 92 142 149 162 95 144 254 213 416 110 37 454 289 341
White 534 67 76 116 128 147 78 127 227 180 354 102 31 384 245 28985% 75% 84% 88% 85% 88% 81% 87% 91% 84% 85% 92% 83% 85% 85% 84%
B B G N
Black or African American 25 10 4 3 3 5 7 10 2 12 13 5 2 17 9 164% 11% 5% 2% 2% 3% 7% 7% 1% 6% 3% 4% 5% 4% 3% 5%
DEF I I
Hispanic, Latino or Spanish origin 14 5 3 3 3 - 3 2 5 6 8 1 - 9 6 82% 6% 3% 2% 2% 3% 1% 2% 3% 2% 1% 2% 2% 2%
American Indian or Alaska Native 5 - 1 1 1 2 - 1 2 2 3 - 1 4 3 21% 1% 1% 1% 1% 1% 1% 1% 1% 3% 1% 1% 1%
Asian 11 6 2 1 2 - 3 - 4 3 8 - - 7 2 92% 7% 3% 1% 1% 3% 2% 1% 2% 2% 1% 3%
DE O
Native Hawaiian or other Pacific Islander 1 - - - 1 - 1 - - - 1 - - 1 - 1- 1% 1% - - -
Some other race 12 1 3 1 5 2 2 4 4 5 7 - - 12 10 32% 1% 3% 1% 3% 1% 2% 3% 2% 2% 2% 3% 3% 1%
P
Refused 26 - 1 8 7 10 2 2 5 6 20 3 3 16 13 144% 1% 6% 5% 6% 2% 1% 2% 3% 5% 3% 9% 4% 4% 4%
C C
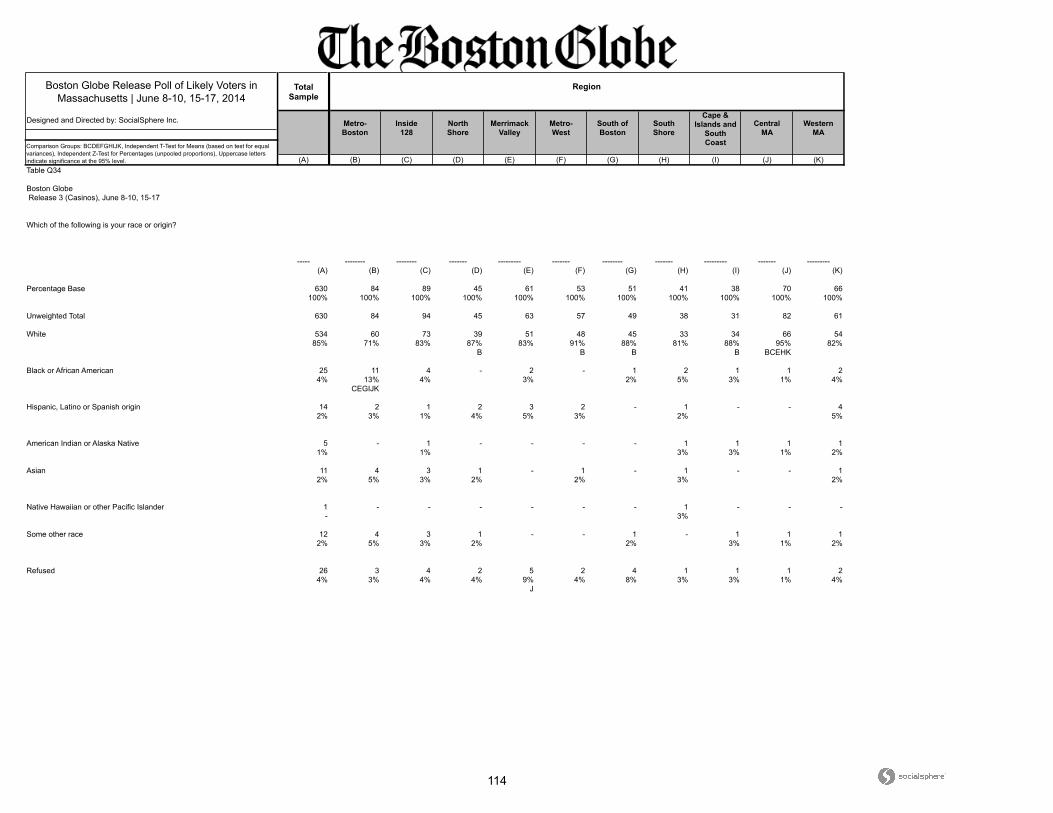
114
Boston Globe Release Poll of Likely Voters in Massachusetts | June 8-10, 15-17, 2014
Total Sample
Designed and Directed by: SocialSphere Inc.
(A) (B) (C) (D) (E) (F) (G) (H) (I) (J) (K)
CentralMA
WesternMA
Comparison Groups: BCDEFGHIJK, Independent T-Test for Means (based on test for equal variances), Independent Z-Test for Percentages (unpooled proportions), Uppercase letters indicate significance at the 95% level.
Region
Metro-Boston
Inside128
NorthShore
MerrimackValley
Metro-West
South ofBoston
SouthShore
Cape &Islands and
SouthCoast
Table Q34
Boston Globe Release 3 (Casinos), June 8-10, 15-17
Which of the following is your race or origin?
----- -------- -------- ------- --------- ------- -------- ------- --------- ------- ---------
(A) (B) (C) (D) (E) (F) (G) (H) (I) (J) (K)
Percentage Base 630 84 89 45 61 53 51 41 38 70 66100% 100% 100% 100% 100% 100% 100% 100% 100% 100% 100%
Unweighted Total 630 84 94 45 63 57 49 38 31 82 61
White 534 60 73 39 51 48 45 33 34 66 5485% 71% 83% 87% 83% 91% 88% 81% 88% 95% 82%
B B B B BCEHK
Black or African American 25 11 4 - 2 - 1 2 1 1 24% 13% 4% 3% 2% 5% 3% 1% 4%
CEGIJK
Hispanic, Latino or Spanish origin 14 2 1 2 3 2 - 1 - - 42% 3% 1% 4% 5% 3% 2% 5%
American Indian or Alaska Native 5 - 1 - - - - 1 1 1 11% 1% 3% 3% 1% 2%
Asian 11 4 3 1 - 1 - 1 - - 12% 5% 3% 2% 2% 3% 2%
Native Hawaiian or other Pacific Islander 1 - - - - - - 1 - - -- 3%
Some other race 12 4 3 1 - - 1 - 1 1 12% 5% 3% 2% 2% 3% 1% 2%
Refused 26 3 4 2 5 2 4 1 1 1 24% 3% 4% 4% 9% 4% 8% 3% 3% 1% 4%
J
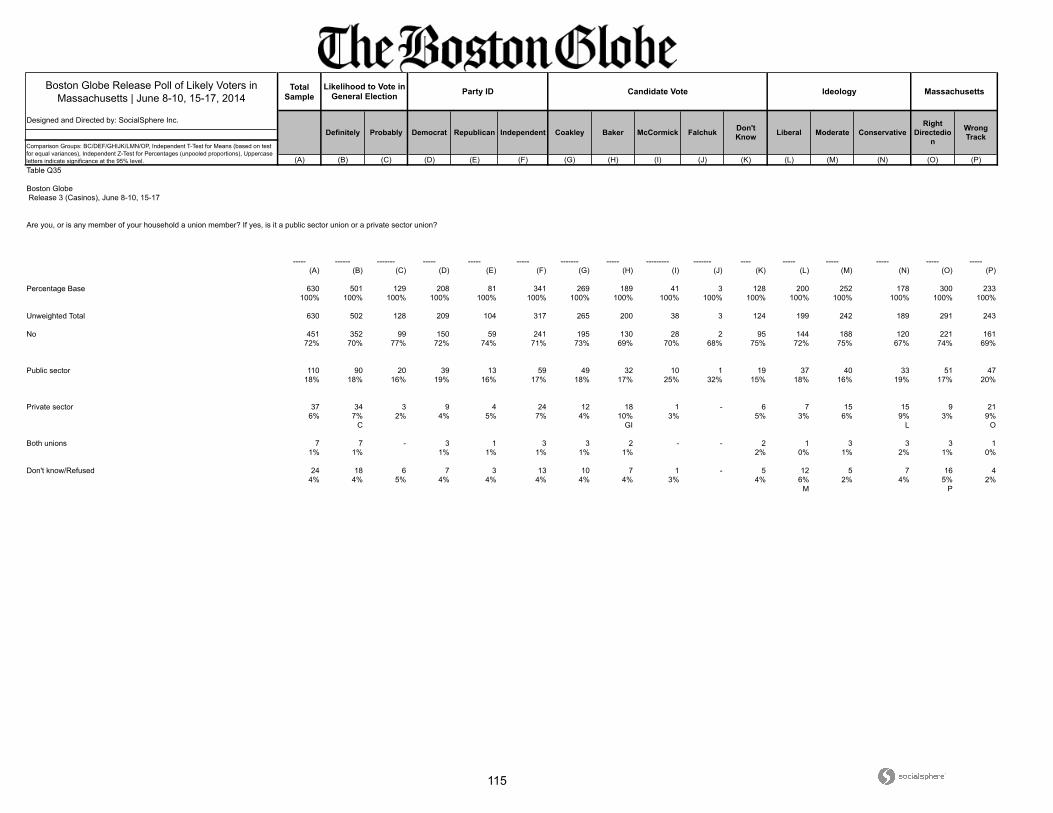
115
Boston Globe Release Poll of Likely Voters in Massachusetts | June 8-10, 15-17, 2014
Total Sample
Designed and Directed by: SocialSphere Inc.
(A) (B) (C) (D) (E) (F) (G) (H) (I) (J) (K) (L) (M) (N) (O) (P)
Ideology Massachusetts
Definitely Probably Democrat Republican Falchuk Don't Know
Likelihood to Vote in General Election Party ID Candidate Vote
Liberal Moderate ConservativeRight
Directedion
Comparison Groups: BC/DEF/GHIJK/LMN/OP, Independent T-Test for Means (based on test for equal variances), Independent Z-Test for Percentages (unpooled proportions), Uppercase letters indicate significance at the 95% level.
Independent Coakley Baker McCormick Wrong Track
Table Q35
Boston Globe Release 3 (Casinos), June 8-10, 15-17
Are you, or is any member of your household a union member? If yes, is it a public sector union or a private sector union?
----- ------ ------- ----- ----- ----- ------- ----- --------- ------- ---- ----- ----- ----- ----- -----
(A) (B) (C) (D) (E) (F) (G) (H) (I) (J) (K) (L) (M) (N) (O) (P)
Percentage Base 630 501 129 208 81 341 269 189 41 3 128 200 252 178 300 233100% 100% 100% 100% 100% 100% 100% 100% 100% 100% 100% 100% 100% 100% 100% 100%
Unweighted Total 630 502 128 209 104 317 265 200 38 3 124 199 242 189 291 243
No 451 352 99 150 59 241 195 130 28 2 95 144 188 120 221 16172% 70% 77% 72% 74% 71% 73% 69% 70% 68% 75% 72% 75% 67% 74% 69%
Public sector 110 90 20 39 13 59 49 32 10 1 19 37 40 33 51 4718% 18% 16% 19% 16% 17% 18% 17% 25% 32% 15% 18% 16% 19% 17% 20%
Private sector 37 34 3 9 4 24 12 18 1 - 6 7 15 15 9 216% 7% 2% 4% 5% 7% 4% 10% 3% 5% 3% 6% 9% 3% 9%
C GI L O
Both unions 7 7 - 3 1 3 3 2 - - 2 1 3 3 3 11% 1% 1% 1% 1% 1% 1% 2% 0% 1% 2% 1% 0%
Don't know/Refused 24 18 6 7 3 13 10 7 1 - 5 12 5 7 16 44% 4% 5% 4% 4% 4% 4% 4% 3% 4% 6% 2% 4% 5% 2%
M P
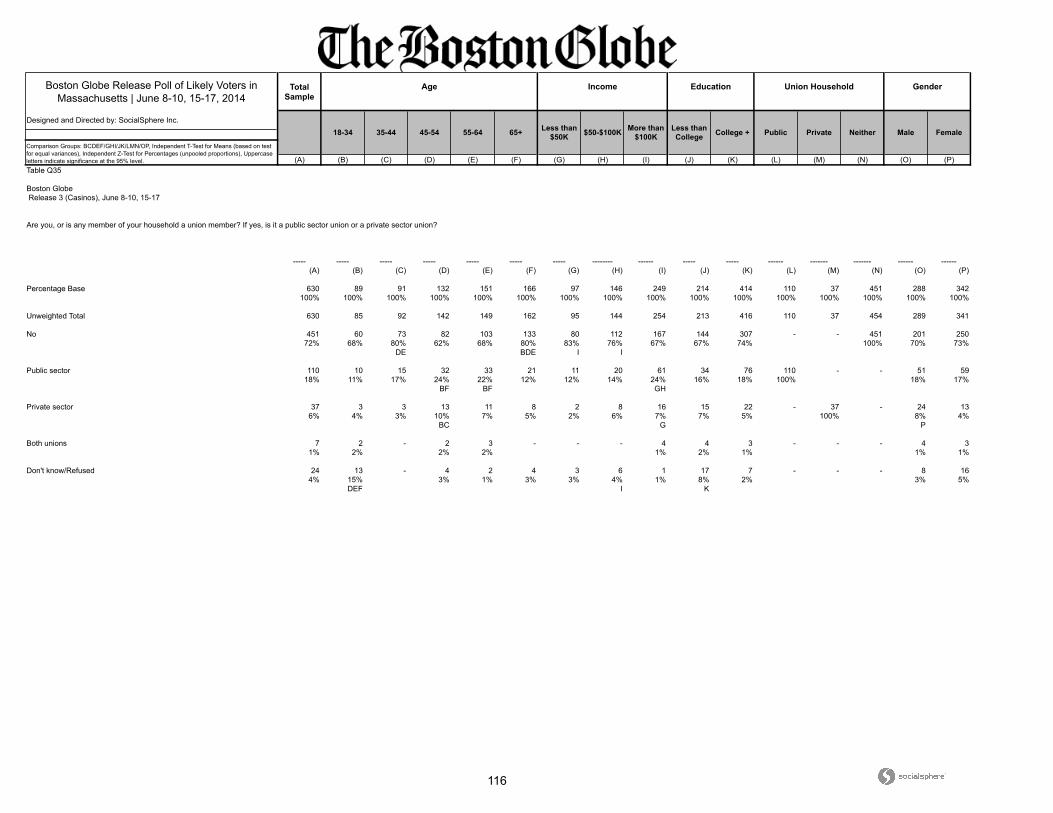
116
Boston Globe Release Poll of Likely Voters in Massachusetts | June 8-10, 15-17, 2014
Total Sample
Designed and Directed by: SocialSphere Inc.
(A) (B) (C) (D) (E) (F) (G) (H) (I) (J) (K) (L) (M) (N) (O) (P)
Union Household Gender
18-34 35-44 45-54 55-64 Less than College College +
Age Income Education
Comparison Groups: BCDEF/GHI/JK/LMN/OP, Independent T-Test for Means (based on test for equal variances), Independent Z-Test for Percentages (unpooled proportions), Uppercase letters indicate significance at the 95% level.
65+ Less than $50K $50-$100K More than
$100K Public Private Neither Male Female
Table Q35
Boston Globe Release 3 (Casinos), June 8-10, 15-17
Are you, or is any member of your household a union member? If yes, is it a public sector union or a private sector union?
----- ----- ----- ----- ----- ----- ----- -------- ------ ----- ----- ------ ------- ------- ------ ------
(A) (B) (C) (D) (E) (F) (G) (H) (I) (J) (K) (L) (M) (N) (O) (P)
Percentage Base 630 89 91 132 151 166 97 146 249 214 414 110 37 451 288 342100% 100% 100% 100% 100% 100% 100% 100% 100% 100% 100% 100% 100% 100% 100% 100%
Unweighted Total 630 85 92 142 149 162 95 144 254 213 416 110 37 454 289 341
No 451 60 73 82 103 133 80 112 167 144 307 - - 451 201 25072% 68% 80% 62% 68% 80% 83% 76% 67% 67% 74% 100% 70% 73%
DE BDE I I
Public sector 110 10 15 32 33 21 11 20 61 34 76 110 - - 51 5918% 11% 17% 24% 22% 12% 12% 14% 24% 16% 18% 100% 18% 17%
BF BF GH
Private sector 37 3 3 13 11 8 2 8 16 15 22 - 37 - 24 136% 4% 3% 10% 7% 5% 2% 6% 7% 7% 5% 100% 8% 4%
BC G P
Both unions 7 2 - 2 3 - - - 4 4 3 - - - 4 31% 2% 2% 2% 1% 2% 1% 1% 1%
Don't know/Refused 24 13 - 4 2 4 3 6 1 17 7 - - - 8 164% 15% 3% 1% 3% 3% 4% 1% 8% 2% 3% 5%
DEF I K

117
Boston Globe Release Poll of Likely Voters in Massachusetts | June 8-10, 15-17, 2014
Total Sample
Designed and Directed by: SocialSphere Inc.
(A) (B) (C) (D) (E) (F) (G) (H) (I) (J) (K)
CentralMA
WesternMA
Comparison Groups: BCDEFGHIJK, Independent T-Test for Means (based on test for equal variances), Independent Z-Test for Percentages (unpooled proportions), Uppercase letters indicate significance at the 95% level.
Region
Metro-Boston
Inside128
NorthShore
MerrimackValley
Metro-West
South ofBoston
SouthShore
Cape &Islands and
SouthCoast
Table Q35
Boston Globe Release 3 (Casinos), June 8-10, 15-17
Are you, or is any member of your household a union member? If yes, is it a public sector union or a private sector union?
----- -------- -------- ------- --------- ------- -------- ------- --------- ------- ---------
(A) (B) (C) (D) (E) (F) (G) (H) (I) (J) (K)
Percentage Base 630 84 89 45 61 53 51 41 38 70 66100% 100% 100% 100% 100% 100% 100% 100% 100% 100% 100%
Unweighted Total 630 84 94 45 63 57 49 38 31 82 61
No 451 58 71 34 41 42 35 32 24 48 4772% 69% 79% 76% 67% 80% 68% 76% 62% 69% 70%
Public sector 110 18 11 6 11 9 10 6 7 16 1018% 21% 12% 14% 18% 18% 20% 15% 19% 23% 16%
Private sector 37 4 6 4 3 1 3 - 4 3 56% 5% 7% 10% 5% 2% 7% 11% 4% 7%
Both unions 7 1 1 - 2 - - 1 - 2 -1% 1% 1% 3% 3% 2%
Don't know/Refused 24 4 1 - 4 - 3 2 3 1 54% 5% 1% 7% 6% 6% 8% 1% 7%
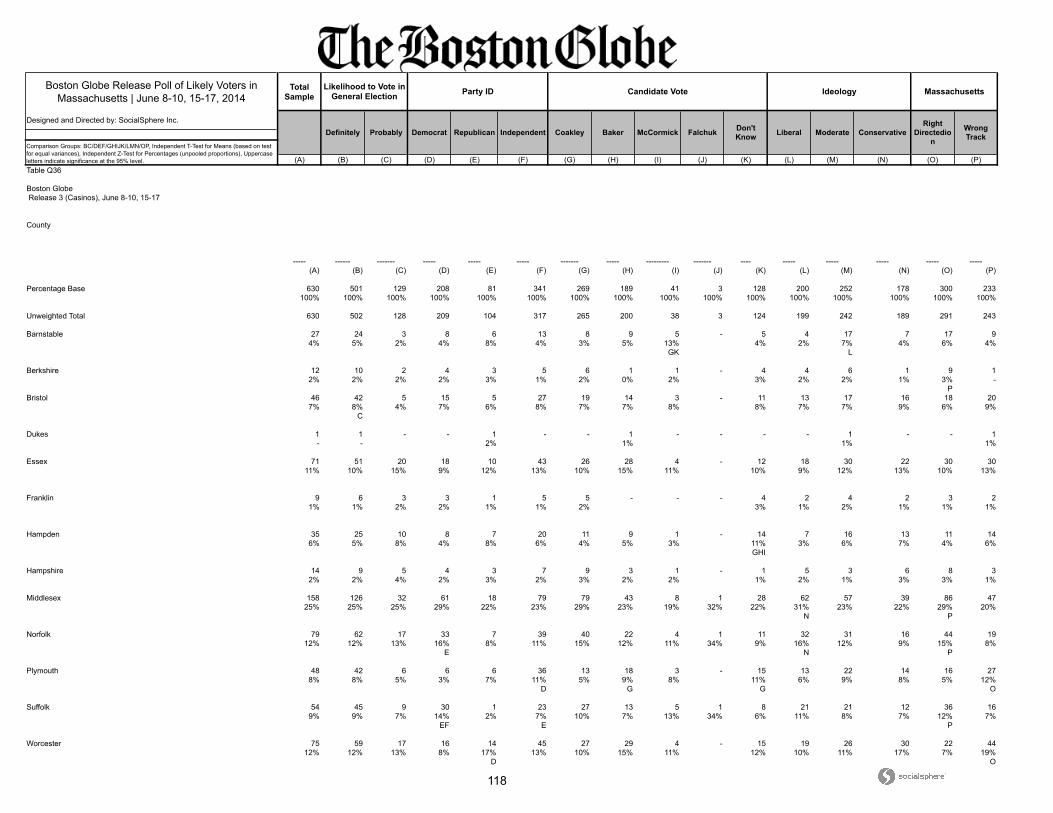
118
Boston Globe Release Poll of Likely Voters in Massachusetts | June 8-10, 15-17, 2014
Total Sample
Designed and Directed by: SocialSphere Inc.
(A) (B) (C) (D) (E) (F) (G) (H) (I) (J) (K) (L) (M) (N) (O) (P)
Ideology Massachusetts
Definitely Probably Democrat Republican Falchuk Don't Know
Likelihood to Vote in General Election Party ID Candidate Vote
Liberal Moderate ConservativeRight
Directedion
Comparison Groups: BC/DEF/GHIJK/LMN/OP, Independent T-Test for Means (based on test for equal variances), Independent Z-Test for Percentages (unpooled proportions), Uppercase letters indicate significance at the 95% level.
Independent Coakley Baker McCormick Wrong Track
Table Q36
Boston Globe Release 3 (Casinos), June 8-10, 15-17
County
----- ------ ------- ----- ----- ----- ------- ----- --------- ------- ---- ----- ----- ----- ----- -----
(A) (B) (C) (D) (E) (F) (G) (H) (I) (J) (K) (L) (M) (N) (O) (P)
Percentage Base 630 501 129 208 81 341 269 189 41 3 128 200 252 178 300 233100% 100% 100% 100% 100% 100% 100% 100% 100% 100% 100% 100% 100% 100% 100% 100%
Unweighted Total 630 502 128 209 104 317 265 200 38 3 124 199 242 189 291 243
Barnstable 27 24 3 8 6 13 8 9 5 - 5 4 17 7 17 94% 5% 2% 4% 8% 4% 3% 5% 13% 4% 2% 7% 4% 6% 4%
GK L
Berkshire 12 10 2 4 3 5 6 1 1 - 4 4 6 1 9 12% 2% 2% 2% 3% 1% 2% 0% 2% 3% 2% 2% 1% 3% -
PBristol 46 42 5 15 5 27 19 14 3 - 11 13 17 16 18 20
7% 8% 4% 7% 6% 8% 7% 7% 8% 8% 7% 7% 9% 6% 9%C
Dukes 1 1 - - 1 - - 1 - - - - 1 - - 1- - 2% 1% 1% 1%
Essex 71 51 20 18 10 43 26 28 4 - 12 18 30 22 30 3011% 10% 15% 9% 12% 13% 10% 15% 11% 10% 9% 12% 13% 10% 13%
Franklin 9 6 3 3 1 5 5 - - - 4 2 4 2 3 21% 1% 2% 2% 1% 1% 2% 3% 1% 2% 1% 1% 1%
Hampden 35 25 10 8 7 20 11 9 1 - 14 7 16 13 11 146% 5% 8% 4% 8% 6% 4% 5% 3% 11% 3% 6% 7% 4% 6%
GHI
Hampshire 14 9 5 4 3 7 9 3 1 - 1 5 3 6 8 32% 2% 4% 2% 3% 2% 3% 2% 2% 1% 2% 1% 3% 3% 1%
Middlesex 158 126 32 61 18 79 79 43 8 1 28 62 57 39 86 4725% 25% 25% 29% 22% 23% 29% 23% 19% 32% 22% 31% 23% 22% 29% 20%
N P
Norfolk 79 62 17 33 7 39 40 22 4 1 11 32 31 16 44 1912% 12% 13% 16% 8% 11% 15% 12% 11% 34% 9% 16% 12% 9% 15% 8%
E N P
Plymouth 48 42 6 6 6 36 13 18 3 - 15 13 22 14 16 278% 8% 5% 3% 7% 11% 5% 9% 8% 11% 6% 9% 8% 5% 12%
D G G O
Suffolk 54 45 9 30 1 23 27 13 5 1 8 21 21 12 36 169% 9% 7% 14% 2% 7% 10% 7% 13% 34% 6% 11% 8% 7% 12% 7%
EF E P
Worcester 75 59 17 16 14 45 27 29 4 - 15 19 26 30 22 4412% 12% 13% 8% 17% 13% 10% 15% 11% 12% 10% 11% 17% 7% 19%
D O
119
Boston Globe Release Poll of Likely Voters in Massachusetts | June 8-10, 15-17, 2014
Total Sample
Designed and Directed by: SocialSphere Inc.
(A) (B) (C) (D) (E) (F) (G) (H) (I) (J) (K) (L) (M) (N) (O) (P)
Union Household Gender
18-34 35-44 45-54 55-64 Less than College College +
Age Income Education
Comparison Groups: BCDEF/GHI/JK/LMN/OP, Independent T-Test for Means (based on test for equal variances), Independent Z-Test for Percentages (unpooled proportions), Uppercase letters indicate significance at the 95% level.
65+ Less than $50K $50-$100K More than
$100K Public Private Neither Male Female
Table Q36
Boston Globe Release 3 (Casinos), June 8-10, 15-17
County
----- ----- ----- ----- ----- ----- ----- -------- ------ ----- ----- ------ ------- ------- ------ ------
(A) (B) (C) (D) (E) (F) (G) (H) (I) (J) (K) (L) (M) (N) (O) (P)
Percentage Base 630 89 91 132 151 166 97 146 249 214 414 110 37 451 288 342100% 100% 100% 100% 100% 100% 100% 100% 100% 100% 100% 100% 100% 100% 100% 100%
Unweighted Total 630 85 92 142 149 162 95 144 254 213 416 110 37 454 289 341
Barnstable 27 2 - 5 9 11 6 10 6 12 15 6 2 16 12 154% 2% 4% 6% 7% 6% 7% 3% 6% 4% 6% 5% 4% 4% 5%
B B I
Berkshire 12 - 3 3 1 4 2 3 4 3 8 3 - 7 6 52% 3% 2% 1% 3% 2% 2% 2% 2% 2% 3% 2% 2% 2%
Bristol 46 4 2 8 16 16 11 10 17 20 25 10 5 30 24 237% 4% 3% 6% 11% 10% 11% 7% 7% 9% 6% 9% 15% 7% 8% 7%
BC C
Dukes 1 - - - - 1 1 - - - 1 - - 1 - 1- 1% 1% - 0% 0%
Essex 71 15 7 17 17 15 6 20 35 25 46 11 5 49 37 3411% 16% 7% 13% 12% 9% 6% 14% 14% 12% 11% 10% 14% 11% 13% 10%
G G
Franklin 9 - 1 1 3 3 1 1 4 1 8 - 2 7 2 71% 1% 1% 2% 2% 1% 1% 2% 1% 2% 6% 1% 1% 2%
Hampden 35 13 5 4 10 3 8 11 8 16 19 5 2 25 21 146% 15% 6% 3% 6% 2% 8% 8% 3% 8% 5% 4% 6% 6% 7% 4%
CDF F
Hampshire 14 3 1 2 4 3 2 3 7 2 12 3 1 8 3 112% 4% 1% 2% 3% 2% 2% 2% 3% 1% 3% 3% 3% 2% 1% 3%
OMiddlesex 158 23 23 38 33 40 15 30 66 43 114 21 8 125 76 82
25% 26% 25% 29% 22% 24% 16% 20% 26% 20% 28% 19% 20% 28% 26% 24%G J
Norfolk 79 7 13 19 16 23 10 14 32 23 56 18 5 54 29 5012% 8% 14% 14% 11% 14% 11% 10% 13% 11% 13% 16% 14% 12% 10% 15%
Plymouth 48 4 12 7 11 14 9 11 18 19 29 6 1 36 17 328% 4% 13% 5% 7% 9% 9% 7% 7% 9% 7% 6% 3% 8% 6% 9%
BD
Suffolk 54 10 7 10 9 17 10 11 22 19 35 11 1 39 28 269% 11% 8% 8% 6% 10% 11% 8% 9% 9% 8% 10% 3% 9% 10% 8%
Worcester 75 9 17 18 20 12 15 22 31 30 45 15 4 54 34 4112% 10% 18% 14% 13% 7% 15% 15% 12% 14% 11% 14% 11% 12% 12% 12%
F
120
Boston Globe Release Poll of Likely Voters in Massachusetts | June 8-10, 15-17, 2014
Total Sample
Designed and Directed by: SocialSphere Inc.
(A) (B) (C) (D) (E) (F) (G) (H) (I) (J) (K)
CentralMA
WesternMA
Comparison Groups: BCDEFGHIJK, Independent T-Test for Means (based on test for equal variances), Independent Z-Test for Percentages (unpooled proportions), Uppercase letters indicate significance at the 95% level.
Region
Metro-Boston
Inside128
NorthShore
MerrimackValley
Metro-West
South ofBoston
SouthShore
Cape &Islands and
SouthCoast
Table Q36
Boston Globe Release 3 (Casinos), June 8-10, 15-17
County
----- -------- -------- ------- --------- ------- -------- ------- --------- ------- ---------
(A) (B) (C) (D) (E) (F) (G) (H) (I) (J) (K)
Percentage Base 630 84 89 45 61 53 51 41 38 70 66100% 100% 100% 100% 100% 100% 100% 100% 100% 100% 100%
Unweighted Total 630 84 94 45 63 57 49 38 31 82 61
Barnstable 27 - - - - - - - 12 - -4% 31%
Berkshire 12 - - - - - - - - - 122% 18%
Bristol 46 - - - - - 24 - 21 - -7% 48% 54%
Dukes 1 - - - - - - - 1 - -- 3%
Essex 71 - - 45 26 - - - - - -11% 100% 43%
E
Franklin 9 - - - - - - - - - 91% 13%
Hampden 35 - - - - - - - - - 326% 48%
Hampshire 14 - - - - - - - - - 142% 21%
Middlesex 158 17 62 - 35 43 - - - - -25% 20% 70% 57% 82%
B B BE
Norfolk 79 13 26 - - 6 24 2 - 4 -12% 15% 30% 12% 47% 5% 6%
HJ BFHJ BCFHJ
Plymouth 48 - - - - - 2 39 5 - -8% 5% 95% 12%
GI
Suffolk 54 54 - - - - - - - - -9% 64%
Worcester 75 - - - - 3 - - - 66 -12% 6% 94%
F
121
Boston Globe Release Poll of Likely Voters in Massachusetts | June 8-10, 15-17, 2014
Total Sample
Designed and Directed by: SocialSphere Inc.
(A) (B) (C) (D) (E) (F) (G) (H) (I) (J) (K) (L) (M) (N) (O) (P)
Ideology Massachusetts
Definitely Probably Democrat Republican Falchuk Don't Know
Likelihood to Vote in General Election Party ID Candidate Vote
Liberal Moderate ConservativeRight
Directedion
Comparison Groups: BC/DEF/GHIJK/LMN/OP, Independent T-Test for Means (based on test for equal variances), Independent Z-Test for Percentages (unpooled proportions), Uppercase letters indicate significance at the 95% level.
Independent Coakley Baker McCormick Wrong Track
Table Q37
Boston Globe Release 3 (Casinos), June 8-10, 15-17
Gender
----- ------ ------- ----- ----- ----- ------- ----- --------- ------- ---- ----- ----- ----- ----- -----
(A) (B) (C) (D) (E) (F) (G) (H) (I) (J) (K) (L) (M) (N) (O) (P)
Percentage Base 630 501 129 208 81 341 269 189 41 3 128 200 252 178 300 233100% 100% 100% 100% 100% 100% 100% 100% 100% 100% 100% 100% 100% 100% 100% 100%
Unweighted Total 630 502 128 209 104 317 265 200 38 3 124 199 242 189 291 243
Male 288 231 57 75 40 173 98 115 21 - 54 80 115 92 135 11746% 46% 44% 36% 50% 51% 36% 61% 51% 42% 40% 46% 52% 45% 50%
D D GK L
Female 342 270 72 133 41 168 171 74 20 3 74 120 136 85 164 11654% 54% 56% 64% 50% 49% 64% 39% 49% 100% 58% 60% 54% 48% 55% 50%
EF H GHIK H N
122
Boston Globe Release Poll of Likely Voters in Massachusetts | June 8-10, 15-17, 2014
Total Sample
Designed and Directed by: SocialSphere Inc.
(A) (B) (C) (D) (E) (F) (G) (H) (I) (J) (K) (L) (M) (N) (O) (P)
Union Household Gender
18-34 35-44 45-54 55-64 Less than College College +
Age Income Education
Comparison Groups: BCDEF/GHI/JK/LMN/OP, Independent T-Test for Means (based on test for equal variances), Independent Z-Test for Percentages (unpooled proportions), Uppercase letters indicate significance at the 95% level.
65+ Less than $50K $50-$100K More than
$100K Public Private Neither Male Female
Table Q37
Boston Globe Release 3 (Casinos), June 8-10, 15-17
Gender
----- ----- ----- ----- ----- ----- ----- -------- ------ ----- ----- ------ ------- ------- ------ ------
(A) (B) (C) (D) (E) (F) (G) (H) (I) (J) (K) (L) (M) (N) (O) (P)
Percentage Base 630 89 91 132 151 166 97 146 249 214 414 110 37 451 288 342100% 100% 100% 100% 100% 100% 100% 100% 100% 100% 100% 100% 100% 100% 100% 100%
Unweighted Total 630 85 92 142 149 162 95 144 254 213 416 110 37 454 289 341
Male 288 43 38 64 71 71 31 55 144 94 192 51 24 201 288 -46% 49% 42% 48% 47% 43% 32% 38% 58% 44% 46% 46% 64% 45% 100%
GH N
Female 342 45 53 69 80 95 66 91 105 120 222 59 13 250 - 34254% 51% 58% 52% 53% 57% 68% 62% 42% 56% 54% 54% 36% 55% 100%
I I M
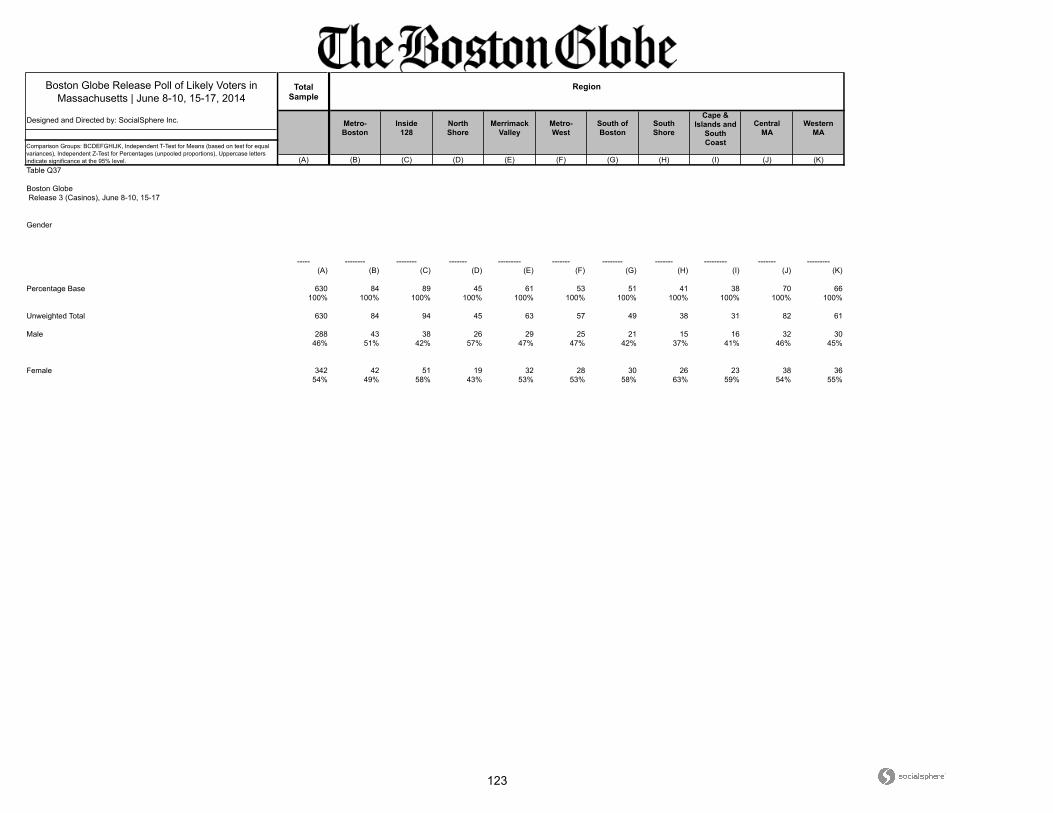
123
Boston Globe Release Poll of Likely Voters in Massachusetts | June 8-10, 15-17, 2014
Total Sample
Designed and Directed by: SocialSphere Inc.
(A) (B) (C) (D) (E) (F) (G) (H) (I) (J) (K)
CentralMA
WesternMA
Comparison Groups: BCDEFGHIJK, Independent T-Test for Means (based on test for equal variances), Independent Z-Test for Percentages (unpooled proportions), Uppercase letters indicate significance at the 95% level.
Region
Metro-Boston
Inside128
NorthShore
MerrimackValley
Metro-West
South ofBoston
SouthShore
Cape &Islands and
SouthCoast
Table Q37
Boston Globe Release 3 (Casinos), June 8-10, 15-17
Gender
----- -------- -------- ------- --------- ------- -------- ------- --------- ------- ---------
(A) (B) (C) (D) (E) (F) (G) (H) (I) (J) (K)
Percentage Base 630 84 89 45 61 53 51 41 38 70 66100% 100% 100% 100% 100% 100% 100% 100% 100% 100% 100%
Unweighted Total 630 84 94 45 63 57 49 38 31 82 61
Male 288 43 38 26 29 25 21 15 16 32 3046% 51% 42% 57% 47% 47% 42% 37% 41% 46% 45%
Female 342 42 51 19 32 28 30 26 23 38 3654% 49% 58% 43% 53% 53% 58% 63% 59% 54% 55%

124
Boston Globe Release Poll of Likely Voters in Massachusetts | June 8-10, 15-17, 2014
Total Sample
Designed and Directed by: SocialSphere Inc.
(A) (B) (C) (D) (E) (F) (G) (H) (I) (J) (K) (L) (M) (N) (O) (P)
Ideology Massachusetts
Definitely Probably Democrat Republican Falchuk Don't Know
Likelihood to Vote in General Election Party ID Candidate Vote
Liberal Moderate ConservativeRight
Directedion
Comparison Groups: BC/DEF/GHIJK/LMN/OP, Independent T-Test for Means (based on test for equal variances), Independent Z-Test for Percentages (unpooled proportions), Uppercase letters indicate significance at the 95% level.
Independent Coakley Baker McCormick Wrong Track
Table Q38
Boston Globe Release 3 (Casinos), June 8-10, 15-17
Region
----- ------ ------- ----- ----- ----- ------- ----- --------- ------- ---- ----- ----- ----- ----- -----
(A) (B) (C) (D) (E) (F) (G) (H) (I) (J) (K) (L) (M) (N) (O) (P)
Percentage Base 598 469 129 200 75 323 257 177 39 3 122 194 239 165 285 218100% 100% 100% 100% 100% 100% 100% 100% 100% 100% 100% 100% 100% 100% 100% 100%
Unweighted Total 604 476 128 203 99 302 255 191 37 3 118 193 234 177 280 229
South of Boston 51 45 6 14 6 31 23 14 6 - 7 18 23 10 26 179% 10% 4% 7% 8% 9% 9% 8% 17% 6% 9% 9% 6% 9% 8%
C
Cape & Islands and South Coast 38 32 6 14 3 21 14 8 4 - 12 8 18 12 18 166% 7% 5% 7% 5% 6% 5% 5% 9% 10% 4% 8% 7% 6% 7%
Central MA 70 55 14 16 14 40 24 28 4 - 13 19 25 26 21 3912% 12% 11% 8% 19% 12% 9% 16% 11% 10% 10% 11% 16% 7% 18%
D O
Inside 128 89 64 25 33 11 45 45 27 4 1 12 33 33 23 49 2415% 14% 19% 16% 14% 14% 17% 15% 10% 32% 10% 17% 14% 14% 17% 11%
Merrimack Valley 61 46 15 15 6 40 23 21 5 - 12 13 26 22 24 2510% 10% 11% 7% 8% 12% 9% 12% 12% 10% 7% 11% 13% 8% 12%
Metro Boston 84 72 12 46 4 35 45 20 5 1 14 39 32 14 57 1814% 15% 9% 23% 5% 11% 17% 11% 13% 34% 12% 20% 13% 8% 20% 8%
EF E N P
Metro-West 53 39 13 21 6 25 22 16 2 1 11 21 19 13 26 199% 8% 10% 11% 9% 8% 9% 9% 5% 34% 9% 11% 8% 8% 9% 9%
North Shore 45 32 12 13 7 25 16 17 3 - 8 13 17 15 19 197% 7% 10% 6% 9% 8% 6% 10% 8% 7% 7% 7% 9% 7% 9%
South Shore 41 37 5 8 5 28 14 14 2 - 10 11 19 12 14 237% 8% 4% 4% 7% 9% 6% 8% 6% 8% 6% 8% 7% 5% 10%
C D O
Western MA 66 45 21 20 13 33 30 11 3 - 22 18 29 20 30 1811% 10% 16% 10% 17% 10% 12% 6% 8% 18% 9% 12% 12% 10% 8%
H H
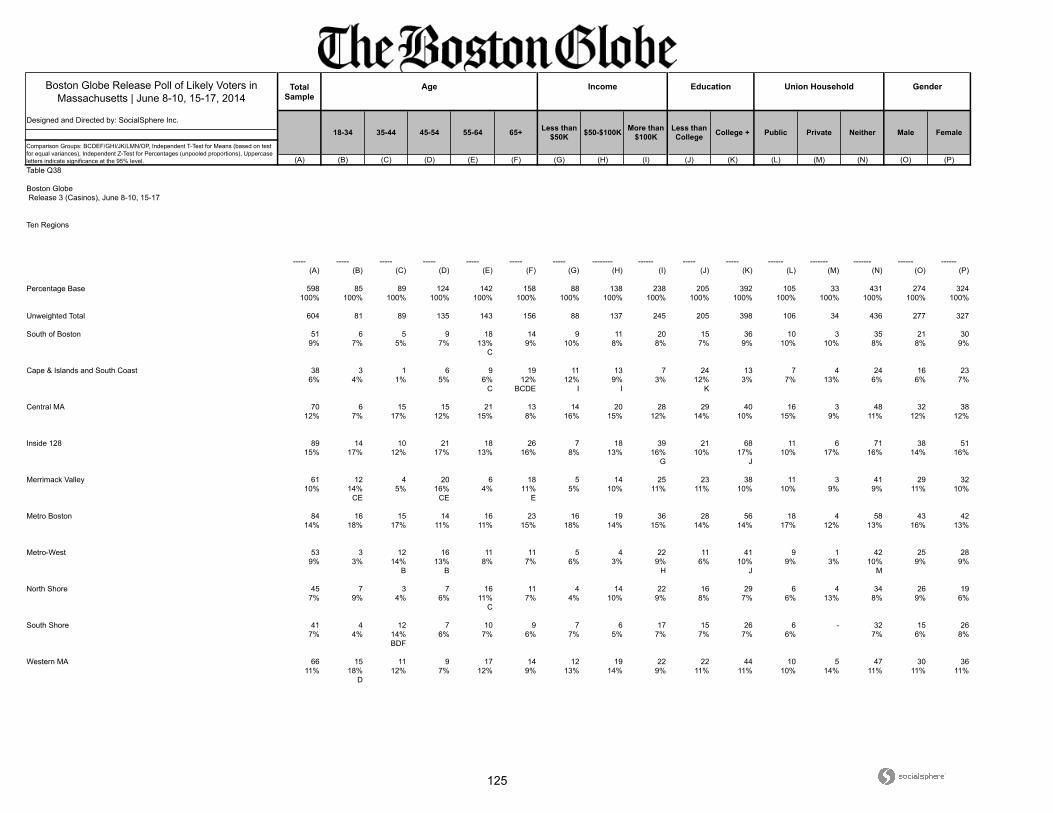
125
Boston Globe Release Poll of Likely Voters in Massachusetts | June 8-10, 15-17, 2014
Total Sample
Designed and Directed by: SocialSphere Inc.
(A) (B) (C) (D) (E) (F) (G) (H) (I) (J) (K) (L) (M) (N) (O) (P)
Union Household Gender
18-34 35-44 45-54 55-64 Less than College College +
Age Income Education
Comparison Groups: BCDEF/GHI/JK/LMN/OP, Independent T-Test for Means (based on test for equal variances), Independent Z-Test for Percentages (unpooled proportions), Uppercase letters indicate significance at the 95% level.
65+ Less than $50K $50-$100K More than
$100K Public Private Neither Male Female
Table Q38
Boston Globe Release 3 (Casinos), June 8-10, 15-17
Ten Regions
----- ----- ----- ----- ----- ----- ----- -------- ------ ----- ----- ------ ------- ------- ------ ------
(A) (B) (C) (D) (E) (F) (G) (H) (I) (J) (K) (L) (M) (N) (O) (P)
Percentage Base 598 85 89 124 142 158 88 138 238 205 392 105 33 431 274 324100% 100% 100% 100% 100% 100% 100% 100% 100% 100% 100% 100% 100% 100% 100% 100%
Unweighted Total 604 81 89 135 143 156 88 137 245 205 398 106 34 436 277 327
South of Boston 51 6 5 9 18 14 9 11 20 15 36 10 3 35 21 309% 7% 5% 7% 13% 9% 10% 8% 8% 7% 9% 10% 10% 8% 8% 9%
C
Cape & Islands and South Coast 38 3 1 6 9 19 11 13 7 24 13 7 4 24 16 236% 4% 1% 5% 6% 12% 12% 9% 3% 12% 3% 7% 13% 6% 6% 7%
C BCDE I I K
Central MA 70 6 15 15 21 13 14 20 28 29 40 16 3 48 32 3812% 7% 17% 12% 15% 8% 16% 15% 12% 14% 10% 15% 9% 11% 12% 12%
Inside 128 89 14 10 21 18 26 7 18 39 21 68 11 6 71 38 5115% 17% 12% 17% 13% 16% 8% 13% 16% 10% 17% 10% 17% 16% 14% 16%
G J
Merrimack Valley 61 12 4 20 6 18 5 14 25 23 38 11 3 41 29 3210% 14% 5% 16% 4% 11% 5% 10% 11% 11% 10% 10% 9% 9% 11% 10%
CE CE E
Metro Boston 84 16 15 14 16 23 16 19 36 28 56 18 4 58 43 4214% 18% 17% 11% 11% 15% 18% 14% 15% 14% 14% 17% 12% 13% 16% 13%
Metro-West 53 3 12 16 11 11 5 4 22 11 41 9 1 42 25 289% 3% 14% 13% 8% 7% 6% 3% 9% 6% 10% 9% 3% 10% 9% 9%
B B H J M
North Shore 45 7 3 7 16 11 4 14 22 16 29 6 4 34 26 197% 9% 4% 6% 11% 7% 4% 10% 9% 8% 7% 6% 13% 8% 9% 6%
C
South Shore 41 4 12 7 10 9 7 6 17 15 26 6 - 32 15 267% 4% 14% 6% 7% 6% 7% 5% 7% 7% 7% 6% 7% 6% 8%
BDF
Western MA 66 15 11 9 17 14 12 19 22 22 44 10 5 47 30 3611% 18% 12% 7% 12% 9% 13% 14% 9% 11% 11% 10% 14% 11% 11% 11%
D
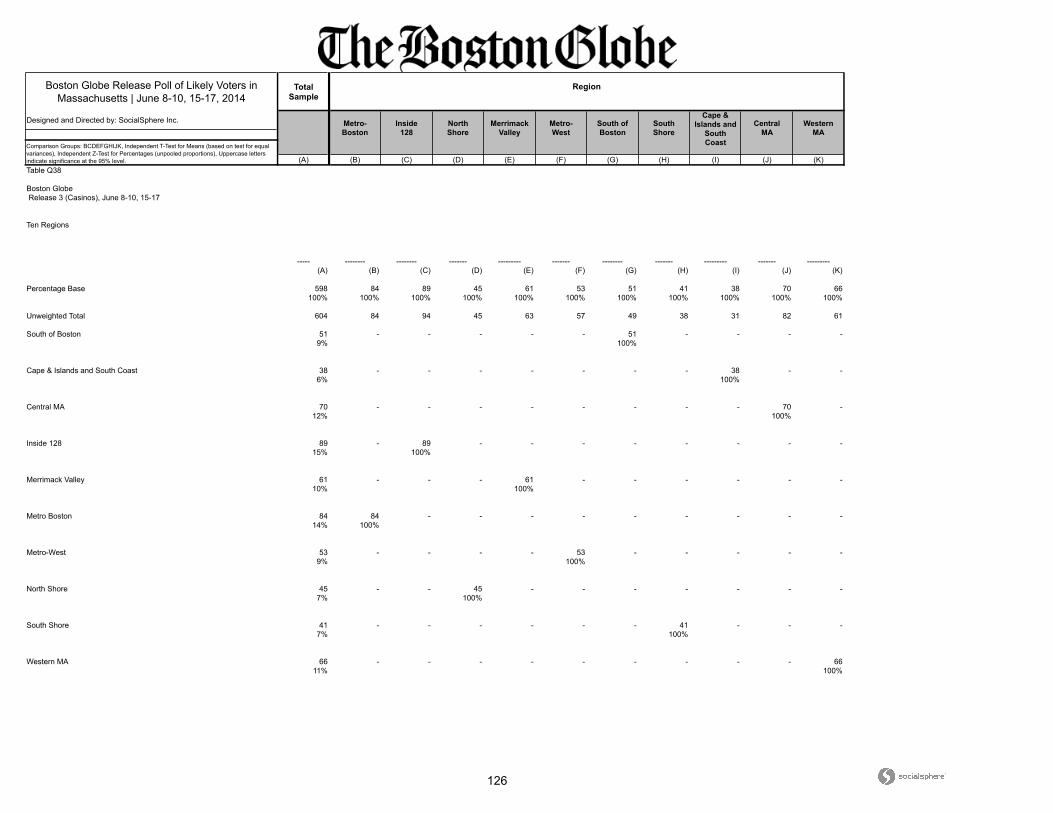
126
Boston Globe Release Poll of Likely Voters in Massachusetts | June 8-10, 15-17, 2014
Total Sample
Designed and Directed by: SocialSphere Inc.
(A) (B) (C) (D) (E) (F) (G) (H) (I) (J) (K)
CentralMA
WesternMA
Comparison Groups: BCDEFGHIJK, Independent T-Test for Means (based on test for equal variances), Independent Z-Test for Percentages (unpooled proportions), Uppercase letters indicate significance at the 95% level.
Region
Metro-Boston
Inside128
NorthShore
MerrimackValley
Metro-West
South ofBoston
SouthShore
Cape &Islands and
SouthCoast
Table Q38
Boston Globe Release 3 (Casinos), June 8-10, 15-17
Ten Regions
----- -------- -------- ------- --------- ------- -------- ------- --------- ------- ---------
(A) (B) (C) (D) (E) (F) (G) (H) (I) (J) (K)
Percentage Base 598 84 89 45 61 53 51 41 38 70 66100% 100% 100% 100% 100% 100% 100% 100% 100% 100% 100%
Unweighted Total 604 84 94 45 63 57 49 38 31 82 61
South of Boston 51 - - - - - 51 - - - -9% 100%
Cape & Islands and South Coast 38 - - - - - - - 38 - -6% 100%
Central MA 70 - - - - - - - - 70 -12% 100%
Inside 128 89 - 89 - - - - - - - -15% 100%
Merrimack Valley 61 - - - 61 - - - - - -10% 100%
Metro Boston 84 84 - - - - - - - - -14% 100%
Metro-West 53 - - - - 53 - - - - -9% 100%
North Shore 45 - - 45 - - - - - - -7% 100%
South Shore 41 - - - - - - 41 - - -7% 100%
Western MA 66 - - - - - - - - - 6611% 100%