Embed Size (px)
Citation preview
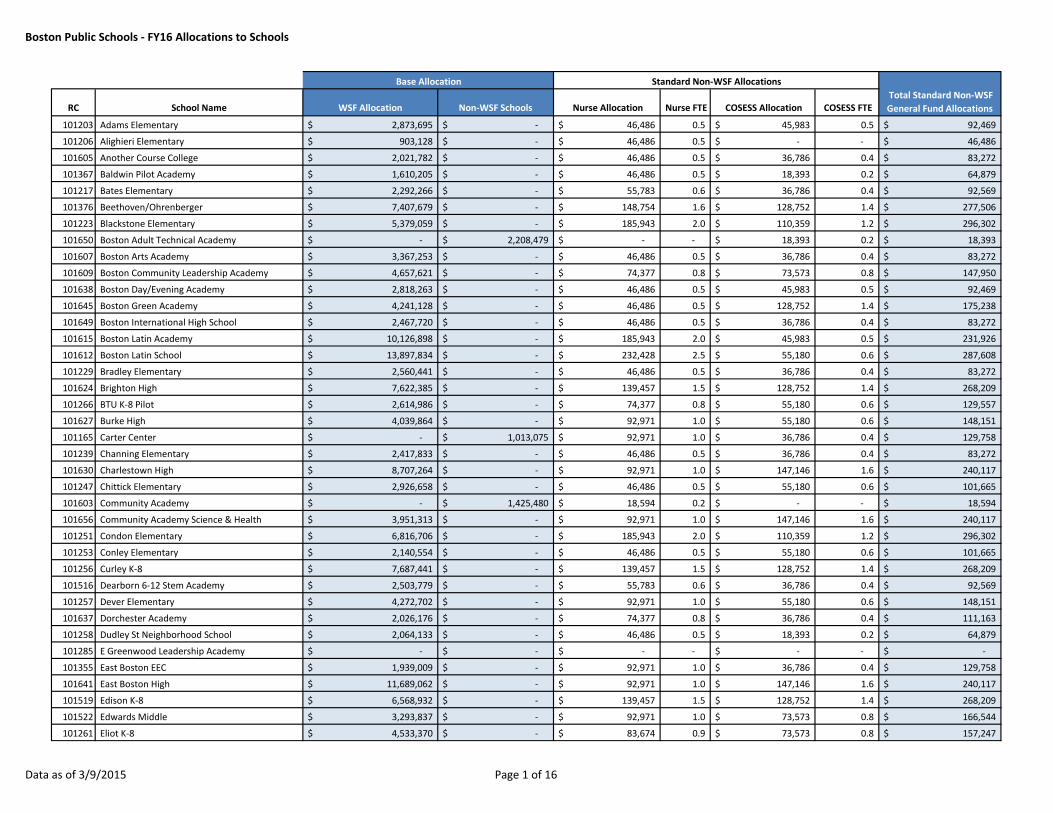
Boston Public Schools - FY16 Allocations to Schools
RC School Name WSF Allocation Non-WSF Schools Nurse Allocation Nurse FTE COSESS Allocation COSESS FTE
101203 Adams Elementary 2,873,695$ -$ 46,486$ 0.5 45,983$ 0.5 92,469$
101206 Alighieri Elementary 903,128$ -$ 46,486$ 0.5 -$ - 46,486$
101605 Another Course College 2,021,782$ -$ 46,486$ 0.5 36,786$ 0.4 83,272$
101367 Baldwin Pilot Academy 1,610,205$ -$ 46,486$ 0.5 18,393$ 0.2 64,879$
101217 Bates Elementary 2,292,266$ -$ 55,783$ 0.6 36,786$ 0.4 92,569$
101376 Beethoven/Ohrenberger 7,407,679$ -$ 148,754$ 1.6 128,752$ 1.4 277,506$
101223 Blackstone Elementary 5,379,059$ -$ 185,943$ 2.0 110,359$ 1.2 296,302$
101650 Boston Adult Technical Academy -$ 2,208,479$ -$ - 18,393$ 0.2 18,393$
101607 Boston Arts Academy 3,367,253$ -$ 46,486$ 0.5 36,786$ 0.4 83,272$
101609 Boston Community Leadership Academy 4,657,621$ -$ 74,377$ 0.8 73,573$ 0.8 147,950$
101638 Boston Day/Evening Academy 2,818,263$ -$ 46,486$ 0.5 45,983$ 0.5 92,469$
101645 Boston Green Academy 4,241,128$ -$ 46,486$ 0.5 128,752$ 1.4 175,238$
101649 Boston International High School 2,467,720$ -$ 46,486$ 0.5 36,786$ 0.4 83,272$
101615 Boston Latin Academy 10,126,898$ -$ 185,943$ 2.0 45,983$ 0.5 231,926$
101612 Boston Latin School 13,897,834$ -$ 232,428$ 2.5 55,180$ 0.6 287,608$
101229 Bradley Elementary 2,560,441$ -$ 46,486$ 0.5 36,786$ 0.4 83,272$
101624 Brighton High 7,622,385$ -$ 139,457$ 1.5 128,752$ 1.4 268,209$
101266 BTU K-8 Pilot 2,614,986$ -$ 74,377$ 0.8 55,180$ 0.6 129,557$
101627 Burke High 4,039,864$ -$ 92,971$ 1.0 55,180$ 0.6 148,151$
101165 Carter Center -$ 1,013,075$ 92,971$ 1.0 36,786$ 0.4 129,758$
101239 Channing Elementary 2,417,833$ -$ 46,486$ 0.5 36,786$ 0.4 83,272$
101630 Charlestown High 8,707,264$ -$ 92,971$ 1.0 147,146$ 1.6 240,117$
101247 Chittick Elementary 2,926,658$ -$ 46,486$ 0.5 55,180$ 0.6 101,665$
101603 Community Academy -$ 1,425,480$ 18,594$ 0.2 -$ - 18,594$
101656 Community Academy Science & Health 3,951,313$ -$ 92,971$ 1.0 147,146$ 1.6 240,117$
101251 Condon Elementary 6,816,706$ -$ 185,943$ 2.0 110,359$ 1.2 296,302$
101253 Conley Elementary 2,140,554$ -$ 46,486$ 0.5 55,180$ 0.6 101,665$
101256 Curley K-8 7,687,441$ -$ 139,457$ 1.5 128,752$ 1.4 268,209$
101516 Dearborn 6-12 Stem Academy 2,503,779$ -$ 55,783$ 0.6 36,786$ 0.4 92,569$
101257 Dever Elementary 4,272,702$ -$ 92,971$ 1.0 55,180$ 0.6 148,151$
101637 Dorchester Academy 2,026,176$ -$ 74,377$ 0.8 36,786$ 0.4 111,163$
101258 Dudley St Neighborhood School 2,064,133$ -$ 46,486$ 0.5 18,393$ 0.2 64,879$
101285 E Greenwood Leadership Academy -$ -$ -$ - -$ - -$
101355 East Boston EEC 1,939,009$ -$ 92,971$ 1.0 36,786$ 0.4 129,758$
101641 East Boston High 11,689,062$ -$ 92,971$ 1.0 147,146$ 1.6 240,117$
101519 Edison K-8 6,568,932$ -$ 139,457$ 1.5 128,752$ 1.4 268,209$
101522 Edwards Middle 3,293,837$ -$ 92,971$ 1.0 73,573$ 0.8 166,544$
101261 Eliot K-8 4,533,370$ -$ 83,674$ 0.9 73,573$ 0.8 157,247$
Total Standard Non-WSF
General Fund Allocations
Standard Non-WSF AllocationsBase Allocation
Data as of 3/9/2015 Page 1 of 16
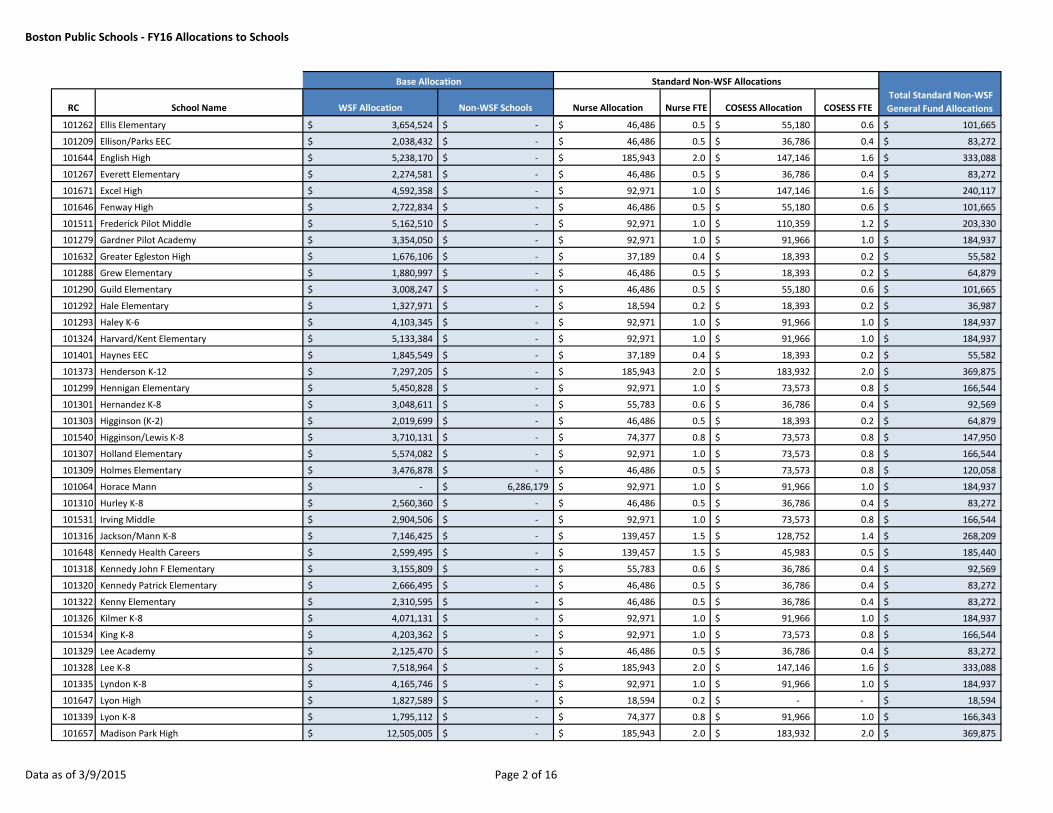
Boston Public Schools - FY16 Allocations to Schools
RC School Name WSF Allocation Non-WSF Schools Nurse Allocation Nurse FTE COSESS Allocation COSESS FTE Total Standard Non-WSF
General Fund Allocations
Standard Non-WSF AllocationsBase Allocation
101262 Ellis Elementary 3,654,524$ -$ 46,486$ 0.5 55,180$ 0.6 101,665$
101209 Ellison/Parks EEC 2,038,432$ -$ 46,486$ 0.5 36,786$ 0.4 83,272$
101644 English High 5,238,170$ -$ 185,943$ 2.0 147,146$ 1.6 333,088$
101267 Everett Elementary 2,274,581$ -$ 46,486$ 0.5 36,786$ 0.4 83,272$
101671 Excel High 4,592,358$ -$ 92,971$ 1.0 147,146$ 1.6 240,117$
101646 Fenway High 2,722,834$ -$ 46,486$ 0.5 55,180$ 0.6 101,665$
101511 Frederick Pilot Middle 5,162,510$ -$ 92,971$ 1.0 110,359$ 1.2 203,330$
101279 Gardner Pilot Academy 3,354,050$ -$ 92,971$ 1.0 91,966$ 1.0 184,937$
101632 Greater Egleston High 1,676,106$ -$ 37,189$ 0.4 18,393$ 0.2 55,582$
101288 Grew Elementary 1,880,997$ -$ 46,486$ 0.5 18,393$ 0.2 64,879$
101290 Guild Elementary 3,008,247$ -$ 46,486$ 0.5 55,180$ 0.6 101,665$
101292 Hale Elementary 1,327,971$ -$ 18,594$ 0.2 18,393$ 0.2 36,987$
101293 Haley K-6 4,103,345$ -$ 92,971$ 1.0 91,966$ 1.0 184,937$
101324 Harvard/Kent Elementary 5,133,384$ -$ 92,971$ 1.0 91,966$ 1.0 184,937$
101401 Haynes EEC 1,845,549$ -$ 37,189$ 0.4 18,393$ 0.2 55,582$
101373 Henderson K-12 7,297,205$ -$ 185,943$ 2.0 183,932$ 2.0 369,875$
101299 Hennigan Elementary 5,450,828$ -$ 92,971$ 1.0 73,573$ 0.8 166,544$
101301 Hernandez K-8 3,048,611$ -$ 55,783$ 0.6 36,786$ 0.4 92,569$
101303 Higginson (K-2) 2,019,699$ -$ 46,486$ 0.5 18,393$ 0.2 64,879$
101540 Higginson/Lewis K-8 3,710,131$ -$ 74,377$ 0.8 73,573$ 0.8 147,950$
101307 Holland Elementary 5,574,082$ -$ 92,971$ 1.0 73,573$ 0.8 166,544$
101309 Holmes Elementary 3,476,878$ -$ 46,486$ 0.5 73,573$ 0.8 120,058$
101064 Horace Mann -$ 6,286,179$ 92,971$ 1.0 91,966$ 1.0 184,937$
101310 Hurley K-8 2,560,360$ -$ 46,486$ 0.5 36,786$ 0.4 83,272$
101531 Irving Middle 2,904,506$ -$ 92,971$ 1.0 73,573$ 0.8 166,544$
101316 Jackson/Mann K-8 7,146,425$ -$ 139,457$ 1.5 128,752$ 1.4 268,209$
101648 Kennedy Health Careers 2,599,495$ -$ 139,457$ 1.5 45,983$ 0.5 185,440$
101318 Kennedy John F Elementary 3,155,809$ -$ 55,783$ 0.6 36,786$ 0.4 92,569$
101320 Kennedy Patrick Elementary 2,666,495$ -$ 46,486$ 0.5 36,786$ 0.4 83,272$
101322 Kenny Elementary 2,310,595$ -$ 46,486$ 0.5 36,786$ 0.4 83,272$
101326 Kilmer K-8 4,071,131$ -$ 92,971$ 1.0 91,966$ 1.0 184,937$
101534 King K-8 4,203,362$ -$ 92,971$ 1.0 73,573$ 0.8 166,544$
101329 Lee Academy 2,125,470$ -$ 46,486$ 0.5 36,786$ 0.4 83,272$
101328 Lee K-8 7,518,964$ -$ 185,943$ 2.0 147,146$ 1.6 333,088$
101335 Lyndon K-8 4,165,746$ -$ 92,971$ 1.0 91,966$ 1.0 184,937$
101647 Lyon High 1,827,589$ -$ 18,594$ 0.2 -$ - 18,594$
101339 Lyon K-8 1,795,112$ -$ 74,377$ 0.8 91,966$ 1.0 166,343$
101657 Madison Park High 12,505,005$ -$ 185,943$ 2.0 183,932$ 2.0 369,875$
Data as of 3/9/2015 Page 2 of 16
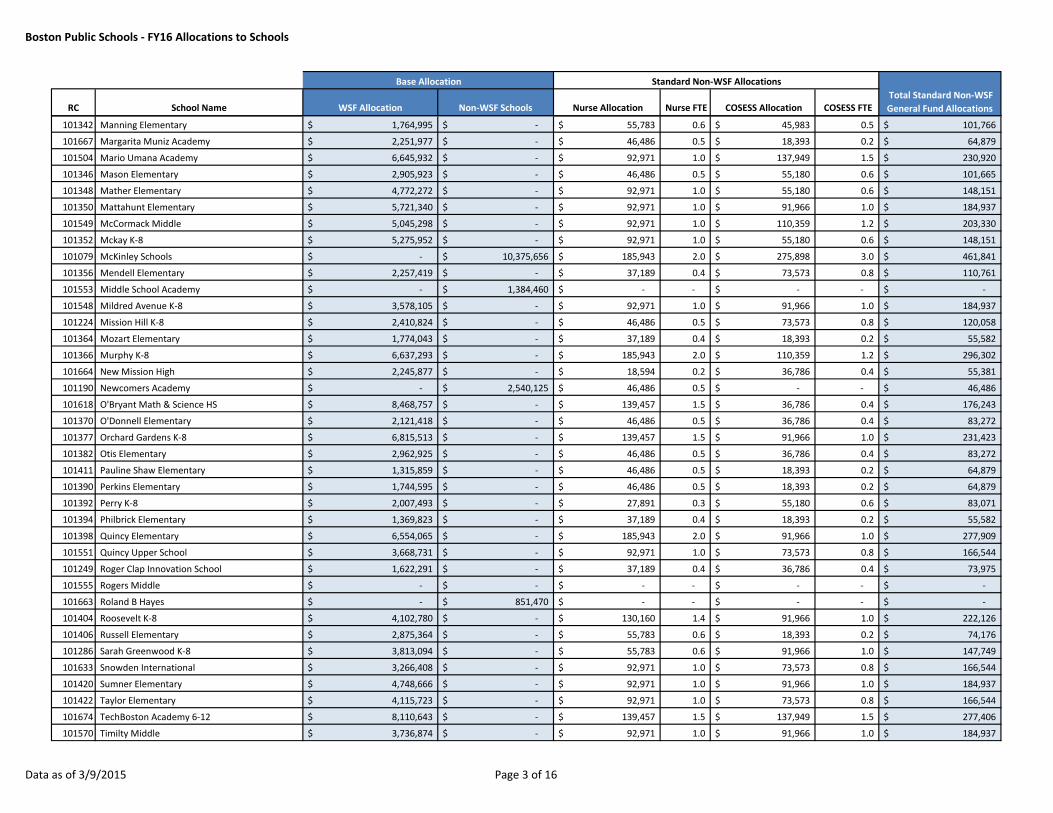
Boston Public Schools - FY16 Allocations to Schools
RC School Name WSF Allocation Non-WSF Schools Nurse Allocation Nurse FTE COSESS Allocation COSESS FTE Total Standard Non-WSF
General Fund Allocations
Standard Non-WSF AllocationsBase Allocation
101342 Manning Elementary 1,764,995$ -$ 55,783$ 0.6 45,983$ 0.5 101,766$
101667 Margarita Muniz Academy 2,251,977$ -$ 46,486$ 0.5 18,393$ 0.2 64,879$
101504 Mario Umana Academy 6,645,932$ -$ 92,971$ 1.0 137,949$ 1.5 230,920$
101346 Mason Elementary 2,905,923$ -$ 46,486$ 0.5 55,180$ 0.6 101,665$
101348 Mather Elementary 4,772,272$ -$ 92,971$ 1.0 55,180$ 0.6 148,151$
101350 Mattahunt Elementary 5,721,340$ -$ 92,971$ 1.0 91,966$ 1.0 184,937$
101549 McCormack Middle 5,045,298$ -$ 92,971$ 1.0 110,359$ 1.2 203,330$
101352 Mckay K-8 5,275,952$ -$ 92,971$ 1.0 55,180$ 0.6 148,151$
101079 McKinley Schools -$ 10,375,656$ 185,943$ 2.0 275,898$ 3.0 461,841$
101356 Mendell Elementary 2,257,419$ -$ 37,189$ 0.4 73,573$ 0.8 110,761$
101553 Middle School Academy -$ 1,384,460$ -$ - -$ - -$
101548 Mildred Avenue K-8 3,578,105$ -$ 92,971$ 1.0 91,966$ 1.0 184,937$
101224 Mission Hill K-8 2,410,824$ -$ 46,486$ 0.5 73,573$ 0.8 120,058$
101364 Mozart Elementary 1,774,043$ -$ 37,189$ 0.4 18,393$ 0.2 55,582$
101366 Murphy K-8 6,637,293$ -$ 185,943$ 2.0 110,359$ 1.2 296,302$
101664 New Mission High 2,245,877$ -$ 18,594$ 0.2 36,786$ 0.4 55,381$
101190 Newcomers Academy -$ 2,540,125$ 46,486$ 0.5 -$ - 46,486$
101618 O'Bryant Math & Science HS 8,468,757$ -$ 139,457$ 1.5 36,786$ 0.4 176,243$
101370 O'Donnell Elementary 2,121,418$ -$ 46,486$ 0.5 36,786$ 0.4 83,272$
101377 Orchard Gardens K-8 6,815,513$ -$ 139,457$ 1.5 91,966$ 1.0 231,423$
101382 Otis Elementary 2,962,925$ -$ 46,486$ 0.5 36,786$ 0.4 83,272$
101411 Pauline Shaw Elementary 1,315,859$ -$ 46,486$ 0.5 18,393$ 0.2 64,879$
101390 Perkins Elementary 1,744,595$ -$ 46,486$ 0.5 18,393$ 0.2 64,879$
101392 Perry K-8 2,007,493$ -$ 27,891$ 0.3 55,180$ 0.6 83,071$
101394 Philbrick Elementary 1,369,823$ -$ 37,189$ 0.4 18,393$ 0.2 55,582$
101398 Quincy Elementary 6,554,065$ -$ 185,943$ 2.0 91,966$ 1.0 277,909$
101551 Quincy Upper School 3,668,731$ -$ 92,971$ 1.0 73,573$ 0.8 166,544$
101249 Roger Clap Innovation School 1,622,291$ -$ 37,189$ 0.4 36,786$ 0.4 73,975$
101555 Rogers Middle -$ -$ -$ - -$ - -$
101663 Roland B Hayes -$ 851,470$ -$ - -$ - -$
101404 Roosevelt K-8 4,102,780$ -$ 130,160$ 1.4 91,966$ 1.0 222,126$
101406 Russell Elementary 2,875,364$ -$ 55,783$ 0.6 18,393$ 0.2 74,176$
101286 Sarah Greenwood K-8 3,813,094$ -$ 55,783$ 0.6 91,966$ 1.0 147,749$
101633 Snowden International 3,266,408$ -$ 92,971$ 1.0 73,573$ 0.8 166,544$
101420 Sumner Elementary 4,748,666$ -$ 92,971$ 1.0 91,966$ 1.0 184,937$
101422 Taylor Elementary 4,115,723$ -$ 92,971$ 1.0 73,573$ 0.8 166,544$
101674 TechBoston Academy 6-12 8,110,643$ -$ 139,457$ 1.5 137,949$ 1.5 277,406$
101570 Timilty Middle 3,736,874$ -$ 92,971$ 1.0 91,966$ 1.0 184,937$
Data as of 3/9/2015 Page 3 of 16
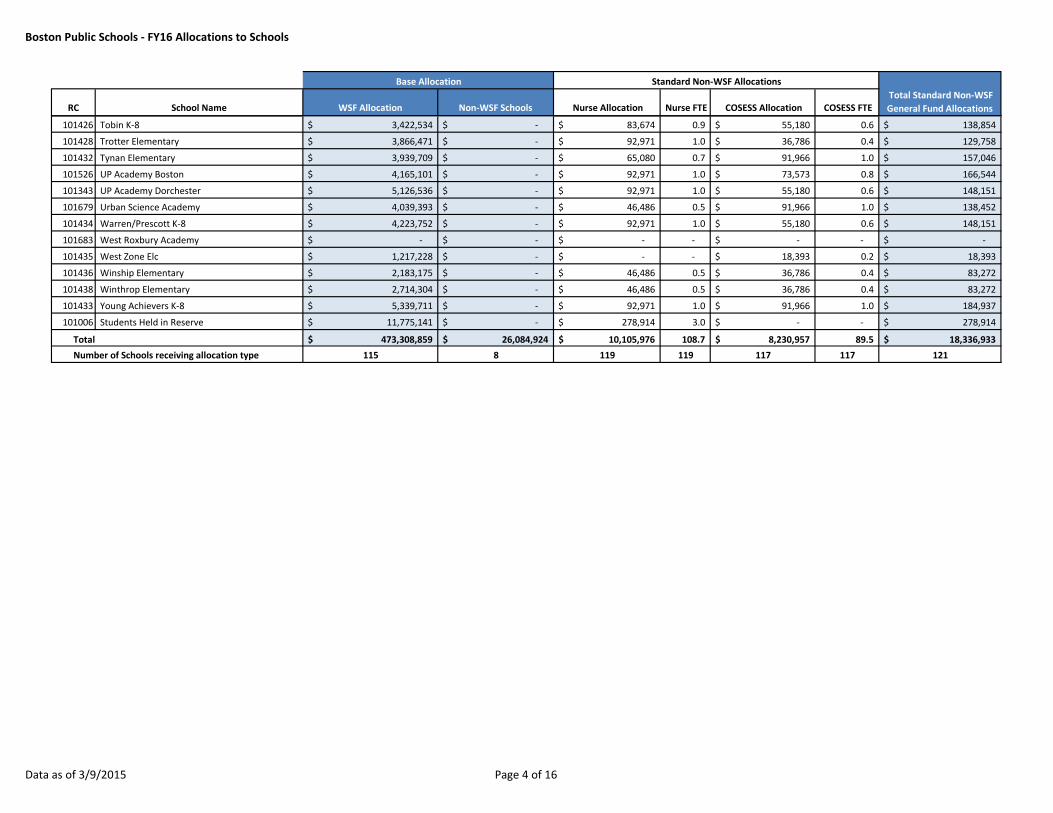
Boston Public Schools - FY16 Allocations to Schools
RC School Name WSF Allocation Non-WSF Schools Nurse Allocation Nurse FTE COSESS Allocation COSESS FTE Total Standard Non-WSF
General Fund Allocations
Standard Non-WSF AllocationsBase Allocation
101426 Tobin K-8 3,422,534$ -$ 83,674$ 0.9 55,180$ 0.6 138,854$
101428 Trotter Elementary 3,866,471$ -$ 92,971$ 1.0 36,786$ 0.4 129,758$
101432 Tynan Elementary 3,939,709$ -$ 65,080$ 0.7 91,966$ 1.0 157,046$
101526 UP Academy Boston 4,165,101$ -$ 92,971$ 1.0 73,573$ 0.8 166,544$
101343 UP Academy Dorchester 5,126,536$ -$ 92,971$ 1.0 55,180$ 0.6 148,151$
101679 Urban Science Academy 4,039,393$ -$ 46,486$ 0.5 91,966$ 1.0 138,452$
101434 Warren/Prescott K-8 4,223,752$ -$ 92,971$ 1.0 55,180$ 0.6 148,151$
101683 West Roxbury Academy -$ -$ -$ - -$ - -$
101435 West Zone Elc 1,217,228$ -$ -$ - 18,393$ 0.2 18,393$
101436 Winship Elementary 2,183,175$ -$ 46,486$ 0.5 36,786$ 0.4 83,272$
101438 Winthrop Elementary 2,714,304$ -$ 46,486$ 0.5 36,786$ 0.4 83,272$
101433 Young Achievers K-8 5,339,711$ -$ 92,971$ 1.0 91,966$ 1.0 184,937$
101006 Students Held in Reserve 11,775,141$ -$ 278,914$ 3.0 -$ - 278,914$
Total 473,308,859$ 26,084,924$ 10,105,976$ 108.7 8,230,957$ 89.5 18,336,933$
Number of Schools receiving allocation type 115 8 119 119 117 117 121
Data as of 3/9/2015 Page 4 of 16
Boston Public Schools - FY16 Allocations to Schools
RC School Name
101203 Adams Elementary
101206 Alighieri Elementary
101605 Another Course College
101367 Baldwin Pilot Academy
101217 Bates Elementary
101376 Beethoven/Ohrenberger
101223 Blackstone Elementary
101650 Boston Adult Technical Academy
101607 Boston Arts Academy
101609 Boston Community Leadership Academy
101638 Boston Day/Evening Academy
101645 Boston Green Academy
101649 Boston International High School
101615 Boston Latin Academy
101612 Boston Latin School
101229 Bradley Elementary
101624 Brighton High
101266 BTU K-8 Pilot
101627 Burke High
101165 Carter Center
101239 Channing Elementary
101630 Charlestown High
101247 Chittick Elementary
101603 Community Academy
101656 Community Academy Science & Health
101251 Condon Elementary
101253 Conley Elementary
101256 Curley K-8
101516 Dearborn 6-12 Stem Academy
101257 Dever Elementary
101637 Dorchester Academy
101258 Dudley St Neighborhood School
101285 E Greenwood Leadership Academy
101355 East Boston EEC
101641 East Boston High
101519 Edison K-8
101522 Edwards Middle
101261 Eliot K-8
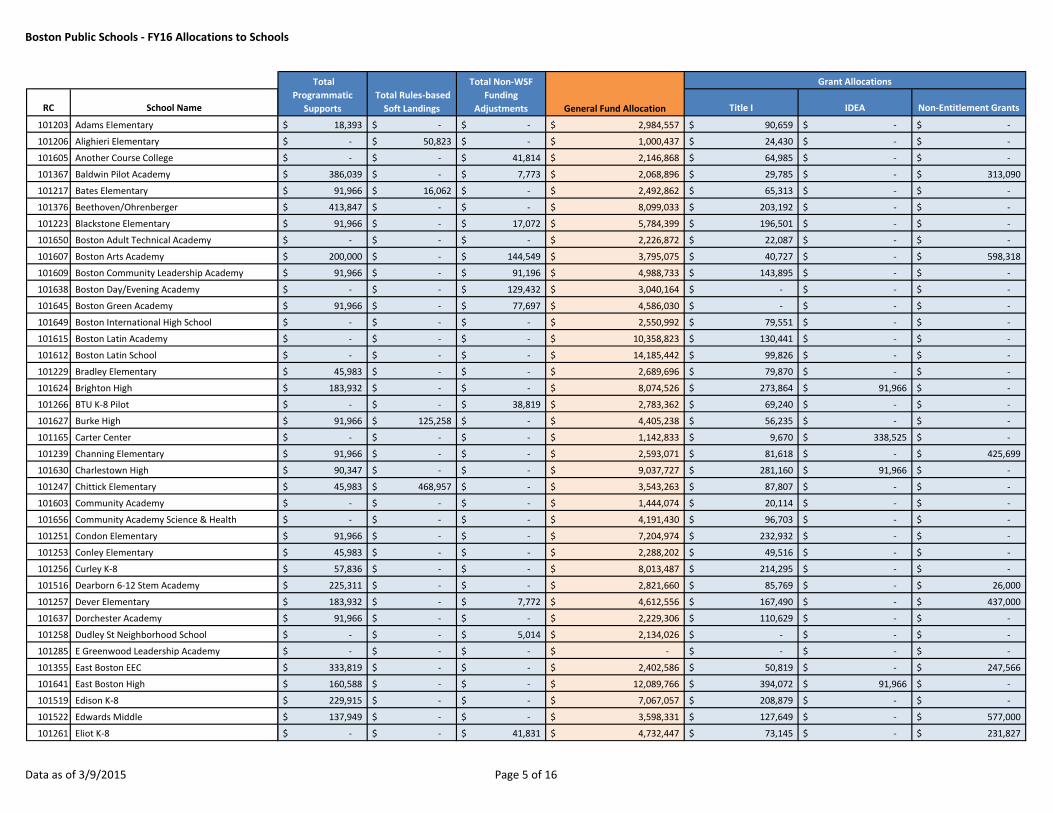
Title I IDEA Non-Entitlement Grants
18,393$ -$ -$ 2,984,557$ 90,659$ -$ -$
-$ 50,823$ -$ 1,000,437$ 24,430$ -$ -$
-$ -$ 41,814$ 2,146,868$ 64,985$ -$ -$
386,039$ -$ 7,773$ 2,068,896$ 29,785$ -$ 313,090$
91,966$ 16,062$ -$ 2,492,862$ 65,313$ -$ -$
413,847$ -$ -$ 8,099,033$ 203,192$ -$ -$
91,966$ -$ 17,072$ 5,784,399$ 196,501$ -$ -$
-$ -$ -$ 2,226,872$ 22,087$ -$ -$
200,000$ -$ 144,549$ 3,795,075$ 40,727$ -$ 598,318$
91,966$ -$ 91,196$ 4,988,733$ 143,895$ -$ -$
-$ -$ 129,432$ 3,040,164$ -$ -$ -$
91,966$ -$ 77,697$ 4,586,030$ -$ -$ -$
-$ -$ -$ 2,550,992$ 79,551$ -$ -$
-$ -$ -$ 10,358,823$ 130,441$ -$ -$
-$ -$ -$ 14,185,442$ 99,826$ -$ -$
45,983$ -$ -$ 2,689,696$ 79,870$ -$ -$
183,932$ -$ -$ 8,074,526$ 273,864$ 91,966$ -$
-$ -$ 38,819$ 2,783,362$ 69,240$ -$ -$
91,966$ 125,258$ -$ 4,405,238$ 56,235$ -$ -$
-$ -$ -$ 1,142,833$ 9,670$ 338,525$ -$
91,966$ -$ -$ 2,593,071$ 81,618$ -$ 425,699$
90,347$ -$ -$ 9,037,727$ 281,160$ 91,966$ -$
45,983$ 468,957$ -$ 3,543,263$ 87,807$ -$ -$
-$ -$ -$ 1,444,074$ 20,114$ -$ -$
-$ -$ -$ 4,191,430$ 96,703$ -$ -$
91,966$ -$ -$ 7,204,974$ 232,932$ -$ -$
45,983$ -$ -$ 2,288,202$ 49,516$ -$ -$
57,836$ -$ -$ 8,013,487$ 214,295$ -$ -$
225,311$ -$ -$ 2,821,660$ 85,769$ -$ 26,000$
183,932$ -$ 7,772$ 4,612,556$ 167,490$ -$ 437,000$
91,966$ -$ -$ 2,229,306$ 110,629$ -$ -$
-$ -$ 5,014$ 2,134,026$ -$ -$ -$
-$ -$ -$ -$ -$ -$ -$
333,819$ -$ -$ 2,402,586$ 50,819$ -$ 247,566$
160,588$ -$ -$ 12,089,766$ 394,072$ 91,966$ -$
229,915$ -$ -$ 7,067,057$ 208,879$ -$ -$
137,949$ -$ -$ 3,598,331$ 127,649$ -$ 577,000$
-$ -$ 41,831$ 4,732,447$ 73,145$ -$ 231,827$
General Fund Allocation
Grant Allocations
Total Rules-based
Soft Landings
Total Non-WSF
Funding
Adjustments
Total
Programmatic
Supports
Data as of 3/9/2015 Page 5 of 16
Boston Public Schools - FY16 Allocations to Schools
RC School Name
101262 Ellis Elementary
101209 Ellison/Parks EEC
101644 English High
101267 Everett Elementary
101671 Excel High
101646 Fenway High
101511 Frederick Pilot Middle
101279 Gardner Pilot Academy
101632 Greater Egleston High
101288 Grew Elementary
101290 Guild Elementary
101292 Hale Elementary
101293 Haley K-6
101324 Harvard/Kent Elementary
101401 Haynes EEC
101373 Henderson K-12
101299 Hennigan Elementary
101301 Hernandez K-8
101303 Higginson (K-2)
101540 Higginson/Lewis K-8
101307 Holland Elementary
101309 Holmes Elementary
101064 Horace Mann
101310 Hurley K-8
101531 Irving Middle
101316 Jackson/Mann K-8
101648 Kennedy Health Careers
101318 Kennedy John F Elementary
101320 Kennedy Patrick Elementary
101322 Kenny Elementary
101326 Kilmer K-8
101534 King K-8
101329 Lee Academy
101328 Lee K-8
101335 Lyndon K-8
101647 Lyon High
101339 Lyon K-8
101657 Madison Park High
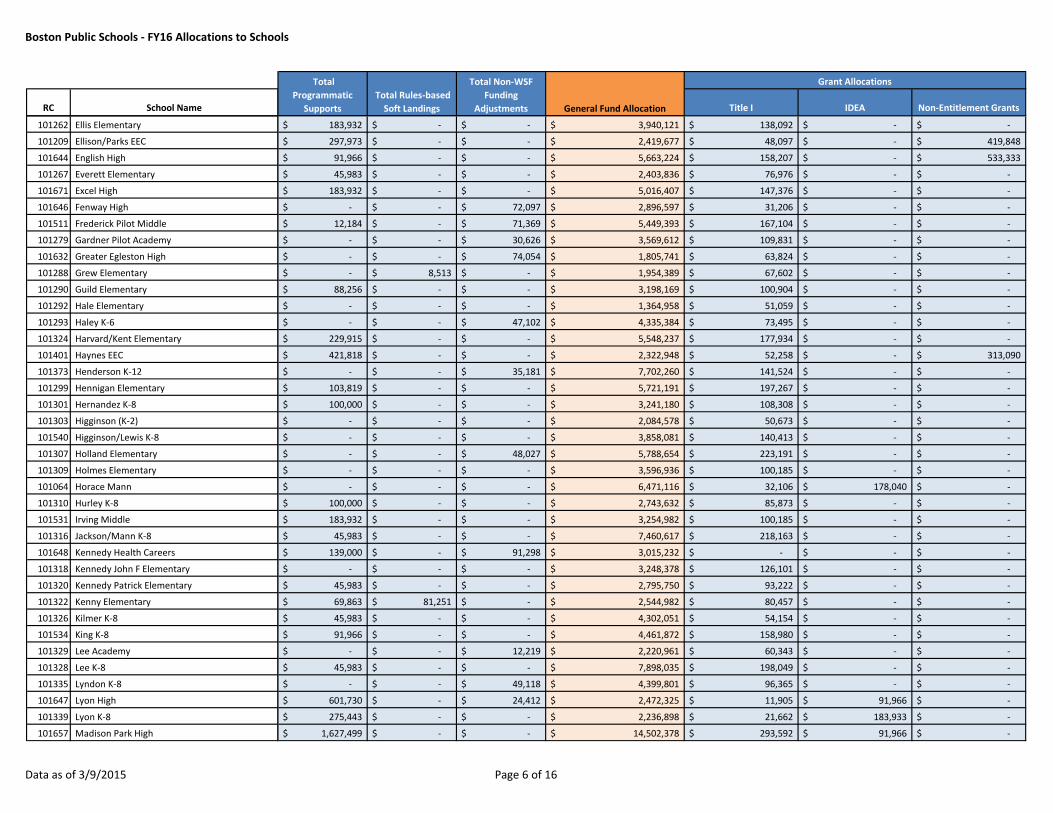
Title I IDEA Non-Entitlement GrantsGeneral Fund Allocation
Grant Allocations
Total Rules-based
Soft Landings
Total Non-WSF
Funding
Adjustments
Total
Programmatic
Supports
183,932$ -$ -$ 3,940,121$ 138,092$ -$ -$
297,973$ -$ -$ 2,419,677$ 48,097$ -$ 419,848$
91,966$ -$ -$ 5,663,224$ 158,207$ -$ 533,333$
45,983$ -$ -$ 2,403,836$ 76,976$ -$ -$
183,932$ -$ -$ 5,016,407$ 147,376$ -$ -$
-$ -$ 72,097$ 2,896,597$ 31,206$ -$ -$
12,184$ -$ 71,369$ 5,449,393$ 167,104$ -$ -$
-$ -$ 30,626$ 3,569,612$ 109,831$ -$ -$
-$ -$ 74,054$ 1,805,741$ 63,824$ -$ -$
-$ 8,513$ -$ 1,954,389$ 67,602$ -$ -$
88,256$ -$ -$ 3,198,169$ 100,904$ -$ -$
-$ -$ -$ 1,364,958$ 51,059$ -$ -$
-$ -$ 47,102$ 4,335,384$ 73,495$ -$ -$
229,915$ -$ -$ 5,548,237$ 177,934$ -$ -$
421,818$ -$ -$ 2,322,948$ 52,258$ -$ 313,090$
-$ -$ 35,181$ 7,702,260$ 141,524$ -$ -$
103,819$ -$ -$ 5,721,191$ 197,267$ -$ -$
100,000$ -$ -$ 3,241,180$ 108,308$ -$ -$
-$ -$ -$ 2,084,578$ 50,673$ -$ -$
-$ -$ -$ 3,858,081$ 140,413$ -$ -$
-$ -$ 48,027$ 5,788,654$ 223,191$ -$ -$
-$ -$ -$ 3,596,936$ 100,185$ -$ -$
-$ -$ -$ 6,471,116$ 32,106$ 178,040$ -$
100,000$ -$ -$ 2,743,632$ 85,873$ -$ -$
183,932$ -$ -$ 3,254,982$ 100,185$ -$ -$
45,983$ -$ -$ 7,460,617$ 218,163$ -$ -$
139,000$ -$ 91,298$ 3,015,232$ -$ -$ -$
-$ -$ -$ 3,248,378$ 126,101$ -$ -$
45,983$ -$ -$ 2,795,750$ 93,222$ -$ -$
69,863$ 81,251$ -$ 2,544,982$ 80,457$ -$ -$
45,983$ -$ -$ 4,302,051$ 54,154$ -$ -$
91,966$ -$ -$ 4,461,872$ 158,980$ -$ -$
-$ -$ 12,219$ 2,220,961$ 60,343$ -$ -$
45,983$ -$ -$ 7,898,035$ 198,049$ -$ -$
-$ -$ 49,118$ 4,399,801$ 96,365$ -$ -$
601,730$ -$ 24,412$ 2,472,325$ 11,905$ 91,966$ -$
275,443$ -$ -$ 2,236,898$ 21,662$ 183,933$ -$
1,627,499$ -$ -$ 14,502,378$ 293,592$ 91,966$ -$
Data as of 3/9/2015 Page 6 of 16
Boston Public Schools - FY16 Allocations to Schools
RC School Name
101342 Manning Elementary
101667 Margarita Muniz Academy
101504 Mario Umana Academy
101346 Mason Elementary
101348 Mather Elementary
101350 Mattahunt Elementary
101549 McCormack Middle
101352 Mckay K-8
101079 McKinley Schools
101356 Mendell Elementary
101553 Middle School Academy
101548 Mildred Avenue K-8
101224 Mission Hill K-8
101364 Mozart Elementary
101366 Murphy K-8
101664 New Mission High
101190 Newcomers Academy
101618 O'Bryant Math & Science HS
101370 O'Donnell Elementary
101377 Orchard Gardens K-8
101382 Otis Elementary
101411 Pauline Shaw Elementary
101390 Perkins Elementary
101392 Perry K-8
101394 Philbrick Elementary
101398 Quincy Elementary
101551 Quincy Upper School
101249 Roger Clap Innovation School
101555 Rogers Middle
101663 Roland B Hayes
101404 Roosevelt K-8
101406 Russell Elementary
101286 Sarah Greenwood K-8
101633 Snowden International
101420 Sumner Elementary
101422 Taylor Elementary
101674 TechBoston Academy 6-12
101570 Timilty Middle
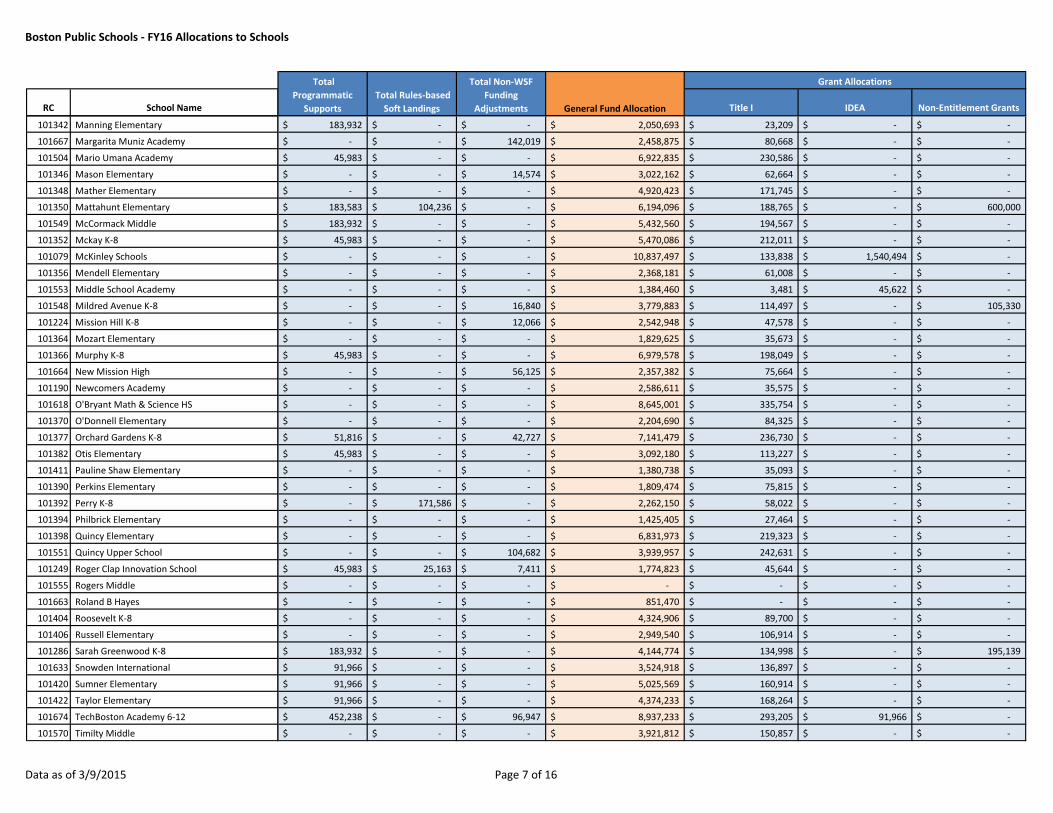
Title I IDEA Non-Entitlement GrantsGeneral Fund Allocation
Grant Allocations
Total Rules-based
Soft Landings
Total Non-WSF
Funding
Adjustments
Total
Programmatic
Supports
183,932$ -$ -$ 2,050,693$ 23,209$ -$ -$
-$ -$ 142,019$ 2,458,875$ 80,668$ -$ -$
45,983$ -$ -$ 6,922,835$ 230,586$ -$ -$
-$ -$ 14,574$ 3,022,162$ 62,664$ -$ -$
-$ -$ -$ 4,920,423$ 171,745$ -$ -$
183,583$ 104,236$ -$ 6,194,096$ 188,765$ -$ 600,000$
183,932$ -$ -$ 5,432,560$ 194,567$ -$ -$
45,983$ -$ -$ 5,470,086$ 212,011$ -$ -$
-$ -$ -$ 10,837,497$ 133,838$ 1,540,494$ -$
-$ -$ -$ 2,368,181$ 61,008$ -$ -$
-$ -$ -$ 1,384,460$ 3,481$ 45,622$ -$
-$ -$ 16,840$ 3,779,883$ 114,497$ -$ 105,330$
-$ -$ 12,066$ 2,542,948$ 47,578$ -$ -$
-$ -$ -$ 1,829,625$ 35,673$ -$ -$
45,983$ -$ -$ 6,979,578$ 198,049$ -$ -$
-$ -$ 56,125$ 2,357,382$ 75,664$ -$ -$
-$ -$ -$ 2,586,611$ 35,575$ -$ -$
-$ -$ -$ 8,645,001$ 335,754$ -$ -$
-$ -$ -$ 2,204,690$ 84,325$ -$ -$
51,816$ -$ 42,727$ 7,141,479$ 236,730$ -$ -$
45,983$ -$ -$ 3,092,180$ 113,227$ -$ -$
-$ -$ -$ 1,380,738$ 35,093$ -$ -$
-$ -$ -$ 1,809,474$ 75,815$ -$ -$
-$ 171,586$ -$ 2,262,150$ 58,022$ -$ -$
-$ -$ -$ 1,425,405$ 27,464$ -$ -$
-$ -$ -$ 6,831,973$ 219,323$ -$ -$
-$ -$ 104,682$ 3,939,957$ 242,631$ -$ -$
45,983$ 25,163$ 7,411$ 1,774,823$ 45,644$ -$ -$
-$ -$ -$ -$ -$ -$ -$
-$ -$ -$ 851,470$ -$ -$ -$
-$ -$ -$ 4,324,906$ 89,700$ -$ -$
-$ -$ -$ 2,949,540$ 106,914$ -$ -$
183,932$ -$ -$ 4,144,774$ 134,998$ -$ 195,139$
91,966$ -$ -$ 3,524,918$ 136,897$ -$ -$
91,966$ -$ -$ 5,025,569$ 160,914$ -$ -$
91,966$ -$ -$ 4,374,233$ 168,264$ -$ -$
452,238$ -$ 96,947$ 8,937,233$ 293,205$ 91,966$ -$
-$ -$ -$ 3,921,812$ 150,857$ -$ -$
Data as of 3/9/2015 Page 7 of 16
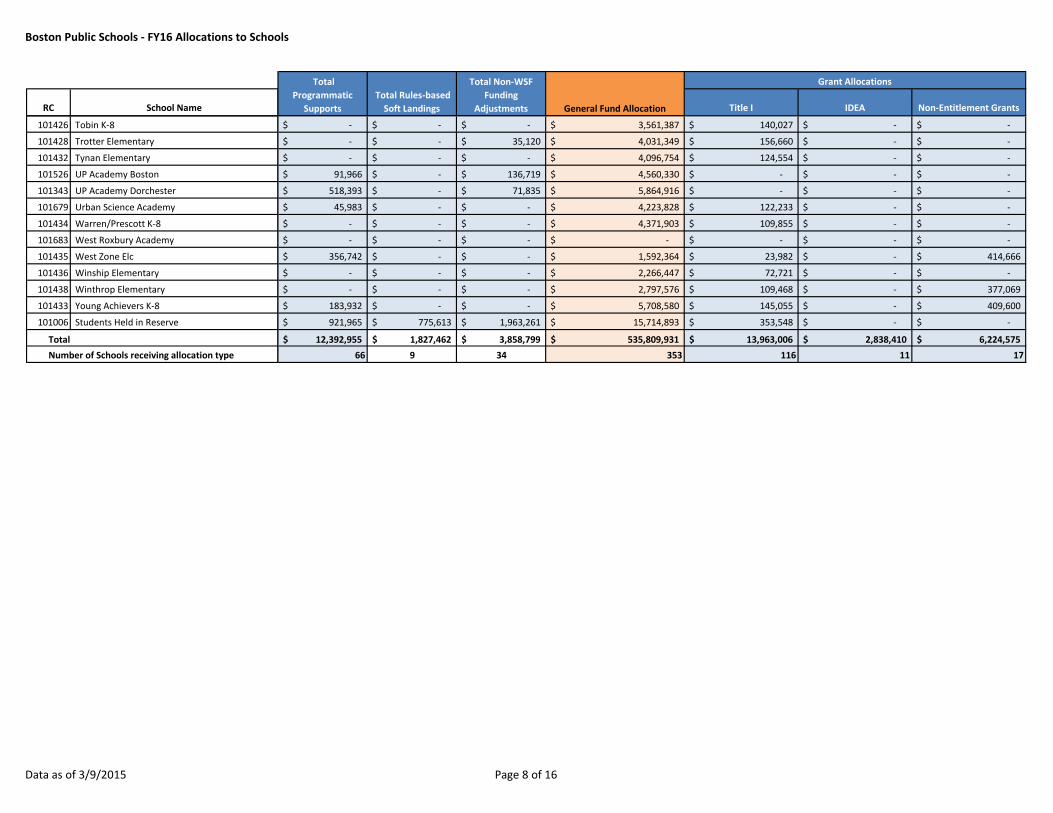
Boston Public Schools - FY16 Allocations to Schools
RC School Name
101426 Tobin K-8
101428 Trotter Elementary
101432 Tynan Elementary
101526 UP Academy Boston
101343 UP Academy Dorchester
101679 Urban Science Academy
101434 Warren/Prescott K-8
101683 West Roxbury Academy
101435 West Zone Elc
101436 Winship Elementary
101438 Winthrop Elementary
101433 Young Achievers K-8
101006 Students Held in Reserve
Total
Number of Schools receiving allocation type
Title I IDEA Non-Entitlement GrantsGeneral Fund Allocation
Grant Allocations
Total Rules-based
Soft Landings
Total Non-WSF
Funding
Adjustments
Total
Programmatic
Supports
-$ -$ -$ 3,561,387$ 140,027$ -$ -$
-$ -$ 35,120$ 4,031,349$ 156,660$ -$ -$
-$ -$ -$ 4,096,754$ 124,554$ -$ -$
91,966$ -$ 136,719$ 4,560,330$ -$ -$ -$
518,393$ -$ 71,835$ 5,864,916$ -$ -$ -$
45,983$ -$ -$ 4,223,828$ 122,233$ -$ -$
-$ -$ -$ 4,371,903$ 109,855$ -$ -$
-$ -$ -$ -$ -$ -$ -$
356,742$ -$ -$ 1,592,364$ 23,982$ -$ 414,666$
-$ -$ -$ 2,266,447$ 72,721$ -$ -$
-$ -$ -$ 2,797,576$ 109,468$ -$ 377,069$
183,932$ -$ -$ 5,708,580$ 145,055$ -$ 409,600$
921,965$ 775,613$ 1,963,261$ 15,714,893$ 353,548$ -$ -$
12,392,955$ 1,827,462$ 3,858,799$ 535,809,931$ 13,963,006$ 2,838,410$ 6,224,575$
66 9 34 353 116 11 17
Data as of 3/9/2015 Page 8 of 16
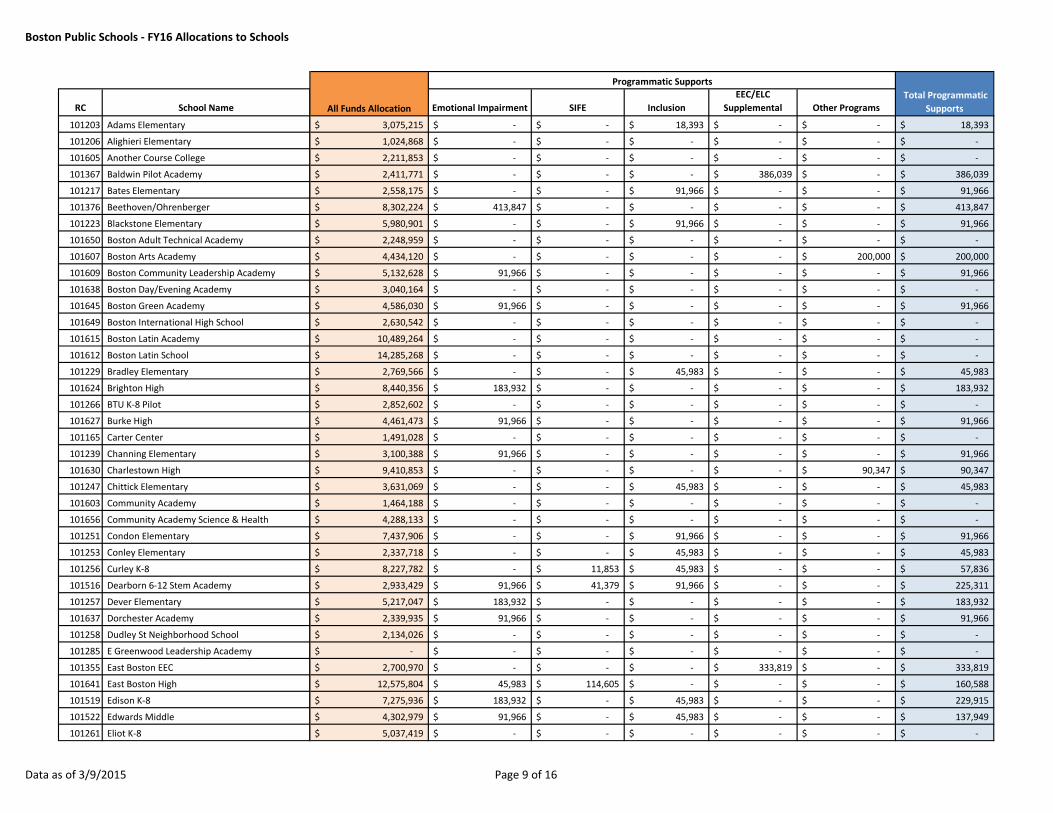
Boston Public Schools - FY16 Allocations to Schools
RC School Name
101203 Adams Elementary
101206 Alighieri Elementary
101605 Another Course College
101367 Baldwin Pilot Academy
101217 Bates Elementary
101376 Beethoven/Ohrenberger
101223 Blackstone Elementary
101650 Boston Adult Technical Academy
101607 Boston Arts Academy
101609 Boston Community Leadership Academy
101638 Boston Day/Evening Academy
101645 Boston Green Academy
101649 Boston International High School
101615 Boston Latin Academy
101612 Boston Latin School
101229 Bradley Elementary
101624 Brighton High
101266 BTU K-8 Pilot
101627 Burke High
101165 Carter Center
101239 Channing Elementary
101630 Charlestown High
101247 Chittick Elementary
101603 Community Academy
101656 Community Academy Science & Health
101251 Condon Elementary
101253 Conley Elementary
101256 Curley K-8
101516 Dearborn 6-12 Stem Academy
101257 Dever Elementary
101637 Dorchester Academy
101258 Dudley St Neighborhood School
101285 E Greenwood Leadership Academy
101355 East Boston EEC
101641 East Boston High
101519 Edison K-8
101522 Edwards Middle
101261 Eliot K-8
Emotional Impairment SIFE Inclusion
EEC/ELC
Supplemental Other Programs
3,075,215$ -$ -$ 18,393$ -$ -$ 18,393$
1,024,868$ -$ -$ -$ -$ -$ -$
2,211,853$ -$ -$ -$ -$ -$ -$
2,411,771$ -$ -$ -$ 386,039$ -$ 386,039$
2,558,175$ -$ -$ 91,966$ -$ -$ 91,966$
8,302,224$ 413,847$ -$ -$ -$ -$ 413,847$
5,980,901$ -$ -$ 91,966$ -$ -$ 91,966$
2,248,959$ -$ -$ -$ -$ -$ -$
4,434,120$ -$ -$ -$ -$ 200,000$ 200,000$
5,132,628$ 91,966$ -$ -$ -$ -$ 91,966$
3,040,164$ -$ -$ -$ -$ -$ -$
4,586,030$ 91,966$ -$ -$ -$ -$ 91,966$
2,630,542$ -$ -$ -$ -$ -$ -$
10,489,264$ -$ -$ -$ -$ -$ -$
14,285,268$ -$ -$ -$ -$ -$ -$
2,769,566$ -$ -$ 45,983$ -$ -$ 45,983$
8,440,356$ 183,932$ -$ -$ -$ -$ 183,932$
2,852,602$ -$ -$ -$ -$ -$ -$
4,461,473$ 91,966$ -$ -$ -$ -$ 91,966$
1,491,028$ -$ -$ -$ -$ -$ -$
3,100,388$ 91,966$ -$ -$ -$ -$ 91,966$
9,410,853$ -$ -$ -$ -$ 90,347$ 90,347$
3,631,069$ -$ -$ 45,983$ -$ -$ 45,983$
1,464,188$ -$ -$ -$ -$ -$ -$
4,288,133$ -$ -$ -$ -$ -$ -$
7,437,906$ -$ -$ 91,966$ -$ -$ 91,966$
2,337,718$ -$ -$ 45,983$ -$ -$ 45,983$
8,227,782$ -$ 11,853$ 45,983$ -$ -$ 57,836$
2,933,429$ 91,966$ 41,379$ 91,966$ -$ -$ 225,311$
5,217,047$ 183,932$ -$ -$ -$ -$ 183,932$
2,339,935$ 91,966$ -$ -$ -$ -$ 91,966$
2,134,026$ -$ -$ -$ -$ -$ -$
-$ -$ -$ -$ -$ -$ -$
2,700,970$ -$ -$ -$ 333,819$ -$ 333,819$
12,575,804$ 45,983$ 114,605$ -$ -$ -$ 160,588$
7,275,936$ 183,932$ -$ 45,983$ -$ -$ 229,915$
4,302,979$ 91,966$ -$ 45,983$ -$ -$ 137,949$
5,037,419$ -$ -$ -$ -$ -$ -$
All Funds Allocation
Programmatic Supports
Total Programmatic
Supports
Data as of 3/9/2015 Page 9 of 16
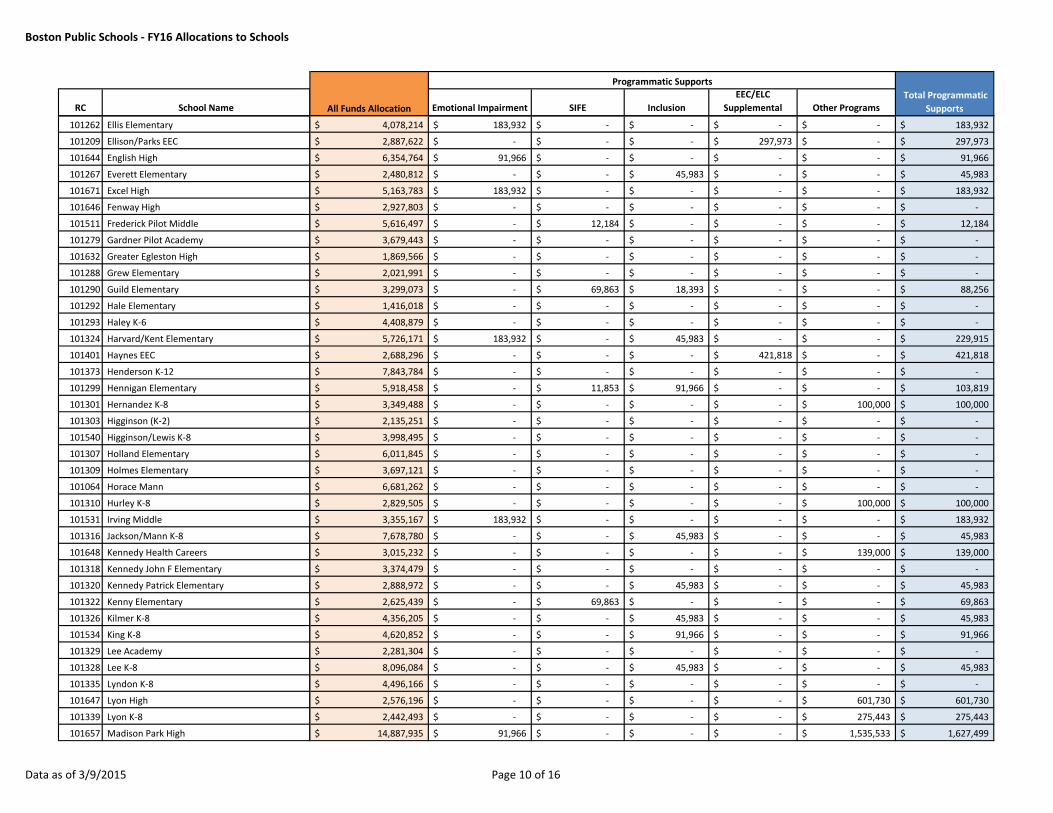
Boston Public Schools - FY16 Allocations to Schools
RC School Name
101262 Ellis Elementary
101209 Ellison/Parks EEC
101644 English High
101267 Everett Elementary
101671 Excel High
101646 Fenway High
101511 Frederick Pilot Middle
101279 Gardner Pilot Academy
101632 Greater Egleston High
101288 Grew Elementary
101290 Guild Elementary
101292 Hale Elementary
101293 Haley K-6
101324 Harvard/Kent Elementary
101401 Haynes EEC
101373 Henderson K-12
101299 Hennigan Elementary
101301 Hernandez K-8
101303 Higginson (K-2)
101540 Higginson/Lewis K-8
101307 Holland Elementary
101309 Holmes Elementary
101064 Horace Mann
101310 Hurley K-8
101531 Irving Middle
101316 Jackson/Mann K-8
101648 Kennedy Health Careers
101318 Kennedy John F Elementary
101320 Kennedy Patrick Elementary
101322 Kenny Elementary
101326 Kilmer K-8
101534 King K-8
101329 Lee Academy
101328 Lee K-8
101335 Lyndon K-8
101647 Lyon High
101339 Lyon K-8
101657 Madison Park High
Emotional Impairment SIFE Inclusion
EEC/ELC
Supplemental Other ProgramsAll Funds Allocation
Programmatic Supports
Total Programmatic
Supports
4,078,214$ 183,932$ -$ -$ -$ -$ 183,932$
2,887,622$ -$ -$ -$ 297,973$ -$ 297,973$
6,354,764$ 91,966$ -$ -$ -$ -$ 91,966$
2,480,812$ -$ -$ 45,983$ -$ -$ 45,983$
5,163,783$ 183,932$ -$ -$ -$ -$ 183,932$
2,927,803$ -$ -$ -$ -$ -$ -$
5,616,497$ -$ 12,184$ -$ -$ -$ 12,184$
3,679,443$ -$ -$ -$ -$ -$ -$
1,869,566$ -$ -$ -$ -$ -$ -$
2,021,991$ -$ -$ -$ -$ -$ -$
3,299,073$ -$ 69,863$ 18,393$ -$ -$ 88,256$
1,416,018$ -$ -$ -$ -$ -$ -$
4,408,879$ -$ -$ -$ -$ -$ -$
5,726,171$ 183,932$ -$ 45,983$ -$ -$ 229,915$
2,688,296$ -$ -$ -$ 421,818$ -$ 421,818$
7,843,784$ -$ -$ -$ -$ -$ -$
5,918,458$ -$ 11,853$ 91,966$ -$ -$ 103,819$
3,349,488$ -$ -$ -$ -$ 100,000$ 100,000$
2,135,251$ -$ -$ -$ -$ -$ -$
3,998,495$ -$ -$ -$ -$ -$ -$
6,011,845$ -$ -$ -$ -$ -$ -$
3,697,121$ -$ -$ -$ -$ -$ -$
6,681,262$ -$ -$ -$ -$ -$ -$
2,829,505$ -$ -$ -$ -$ 100,000$ 100,000$
3,355,167$ 183,932$ -$ -$ -$ -$ 183,932$
7,678,780$ -$ -$ 45,983$ -$ -$ 45,983$
3,015,232$ -$ -$ -$ -$ 139,000$ 139,000$
3,374,479$ -$ -$ -$ -$ -$ -$
2,888,972$ -$ -$ 45,983$ -$ -$ 45,983$
2,625,439$ -$ 69,863$ -$ -$ -$ 69,863$
4,356,205$ -$ -$ 45,983$ -$ -$ 45,983$
4,620,852$ -$ -$ 91,966$ -$ -$ 91,966$
2,281,304$ -$ -$ -$ -$ -$ -$
8,096,084$ -$ -$ 45,983$ -$ -$ 45,983$
4,496,166$ -$ -$ -$ -$ -$ -$
2,576,196$ -$ -$ -$ -$ 601,730$ 601,730$
2,442,493$ -$ -$ -$ -$ 275,443$ 275,443$
14,887,935$ 91,966$ -$ -$ -$ 1,535,533$ 1,627,499$
Data as of 3/9/2015 Page 10 of 16
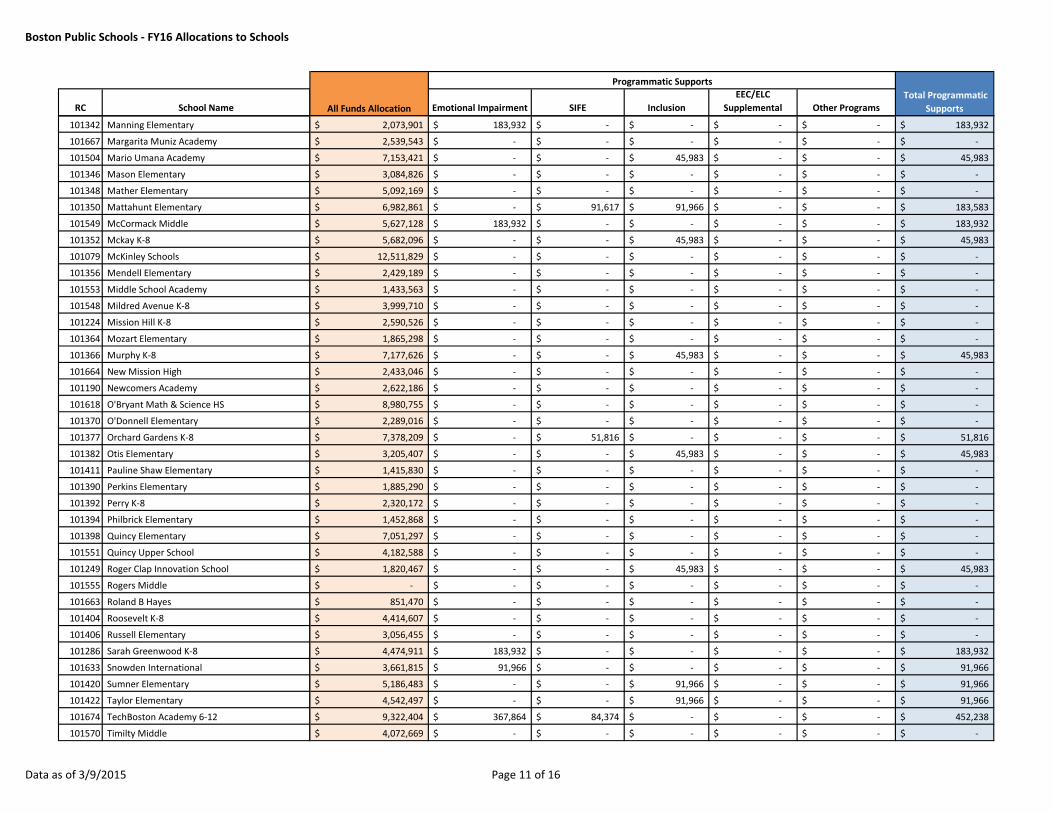
Boston Public Schools - FY16 Allocations to Schools
RC School Name
101342 Manning Elementary
101667 Margarita Muniz Academy
101504 Mario Umana Academy
101346 Mason Elementary
101348 Mather Elementary
101350 Mattahunt Elementary
101549 McCormack Middle
101352 Mckay K-8
101079 McKinley Schools
101356 Mendell Elementary
101553 Middle School Academy
101548 Mildred Avenue K-8
101224 Mission Hill K-8
101364 Mozart Elementary
101366 Murphy K-8
101664 New Mission High
101190 Newcomers Academy
101618 O'Bryant Math & Science HS
101370 O'Donnell Elementary
101377 Orchard Gardens K-8
101382 Otis Elementary
101411 Pauline Shaw Elementary
101390 Perkins Elementary
101392 Perry K-8
101394 Philbrick Elementary
101398 Quincy Elementary
101551 Quincy Upper School
101249 Roger Clap Innovation School
101555 Rogers Middle
101663 Roland B Hayes
101404 Roosevelt K-8
101406 Russell Elementary
101286 Sarah Greenwood K-8
101633 Snowden International
101420 Sumner Elementary
101422 Taylor Elementary
101674 TechBoston Academy 6-12
101570 Timilty Middle
Emotional Impairment SIFE Inclusion
EEC/ELC
Supplemental Other ProgramsAll Funds Allocation
Programmatic Supports
Total Programmatic
Supports
2,073,901$ 183,932$ -$ -$ -$ -$ 183,932$
2,539,543$ -$ -$ -$ -$ -$ -$
7,153,421$ -$ -$ 45,983$ -$ -$ 45,983$
3,084,826$ -$ -$ -$ -$ -$ -$
5,092,169$ -$ -$ -$ -$ -$ -$
6,982,861$ -$ 91,617$ 91,966$ -$ -$ 183,583$
5,627,128$ 183,932$ -$ -$ -$ -$ 183,932$
5,682,096$ -$ -$ 45,983$ -$ -$ 45,983$
12,511,829$ -$ -$ -$ -$ -$ -$
2,429,189$ -$ -$ -$ -$ -$ -$
1,433,563$ -$ -$ -$ -$ -$ -$
3,999,710$ -$ -$ -$ -$ -$ -$
2,590,526$ -$ -$ -$ -$ -$ -$
1,865,298$ -$ -$ -$ -$ -$ -$
7,177,626$ -$ -$ 45,983$ -$ -$ 45,983$
2,433,046$ -$ -$ -$ -$ -$ -$
2,622,186$ -$ -$ -$ -$ -$ -$
8,980,755$ -$ -$ -$ -$ -$ -$
2,289,016$ -$ -$ -$ -$ -$ -$
7,378,209$ -$ 51,816$ -$ -$ -$ 51,816$
3,205,407$ -$ -$ 45,983$ -$ -$ 45,983$
1,415,830$ -$ -$ -$ -$ -$ -$
1,885,290$ -$ -$ -$ -$ -$ -$
2,320,172$ -$ -$ -$ -$ -$ -$
1,452,868$ -$ -$ -$ -$ -$ -$
7,051,297$ -$ -$ -$ -$ -$ -$
4,182,588$ -$ -$ -$ -$ -$ -$
1,820,467$ -$ -$ 45,983$ -$ -$ 45,983$
-$ -$ -$ -$ -$ -$ -$
851,470$ -$ -$ -$ -$ -$ -$
4,414,607$ -$ -$ -$ -$ -$ -$
3,056,455$ -$ -$ -$ -$ -$ -$
4,474,911$ 183,932$ -$ -$ -$ -$ 183,932$
3,661,815$ 91,966$ -$ -$ -$ -$ 91,966$
5,186,483$ -$ -$ 91,966$ -$ -$ 91,966$
4,542,497$ -$ -$ 91,966$ -$ -$ 91,966$
9,322,404$ 367,864$ 84,374$ -$ -$ -$ 452,238$
4,072,669$ -$ -$ -$ -$ -$ -$
Data as of 3/9/2015 Page 11 of 16
Boston Public Schools - FY16 Allocations to Schools
RC School Name
101426 Tobin K-8
101428 Trotter Elementary
101432 Tynan Elementary
101526 UP Academy Boston
101343 UP Academy Dorchester
101679 Urban Science Academy
101434 Warren/Prescott K-8
101683 West Roxbury Academy
101435 West Zone Elc
101436 Winship Elementary
101438 Winthrop Elementary
101433 Young Achievers K-8
101006 Students Held in Reserve
Total
Number of Schools receiving allocation type
Emotional Impairment SIFE Inclusion
EEC/ELC
Supplemental Other ProgramsAll Funds Allocation
Programmatic Supports
Total Programmatic
Supports
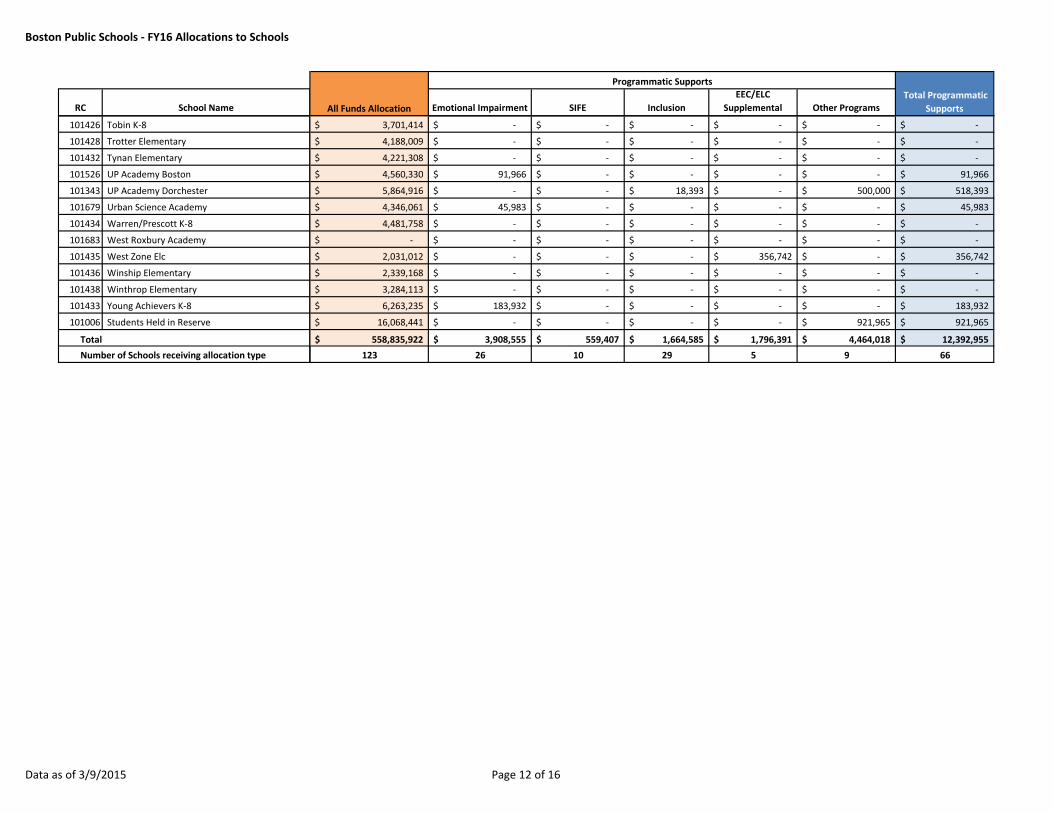
3,701,414$ -$ -$ -$ -$ -$ -$
4,188,009$ -$ -$ -$ -$ -$ -$
4,221,308$ -$ -$ -$ -$ -$ -$
4,560,330$ 91,966$ -$ -$ -$ -$ 91,966$
5,864,916$ -$ -$ 18,393$ -$ 500,000$ 518,393$
4,346,061$ 45,983$ -$ -$ -$ -$ 45,983$
4,481,758$ -$ -$ -$ -$ -$ -$
-$ -$ -$ -$ -$ -$ -$
2,031,012$ -$ -$ -$ 356,742$ -$ 356,742$
2,339,168$ -$ -$ -$ -$ -$ -$
3,284,113$ -$ -$ -$ -$ -$ -$
6,263,235$ 183,932$ -$ -$ -$ -$ 183,932$
16,068,441$ -$ -$ -$ -$ 921,965$ 921,965$
558,835,922$ 3,908,555$ 559,407$ 1,664,585$ 1,796,391$ 4,464,018$ 12,392,955$
123 26 10 29 5 9 66
Data as of 3/9/2015 Page 12 of 16
Boston Public Schools - FY16 Allocations to Schools
RC School Name
101203 Adams Elementary
101206 Alighieri Elementary
101605 Another Course College
101367 Baldwin Pilot Academy
101217 Bates Elementary
101376 Beethoven/Ohrenberger
101223 Blackstone Elementary
101650 Boston Adult Technical Academy
101607 Boston Arts Academy
101609 Boston Community Leadership Academy
101638 Boston Day/Evening Academy
101645 Boston Green Academy
101649 Boston International High School
101615 Boston Latin Academy
101612 Boston Latin School
101229 Bradley Elementary
101624 Brighton High
101266 BTU K-8 Pilot
101627 Burke High
101165 Carter Center
101239 Channing Elementary
101630 Charlestown High
101247 Chittick Elementary
101603 Community Academy
101656 Community Academy Science & Health
101251 Condon Elementary
101253 Conley Elementary
101256 Curley K-8
101516 Dearborn 6-12 Stem Academy
101257 Dever Elementary
101637 Dorchester Academy
101258 Dudley St Neighborhood School
101285 E Greenwood Leadership Academy
101355 East Boston EEC
101641 East Boston High
101519 Edison K-8
101522 Edwards Middle
101261 Eliot K-8
Autonomous
Buybacks New Classrooms
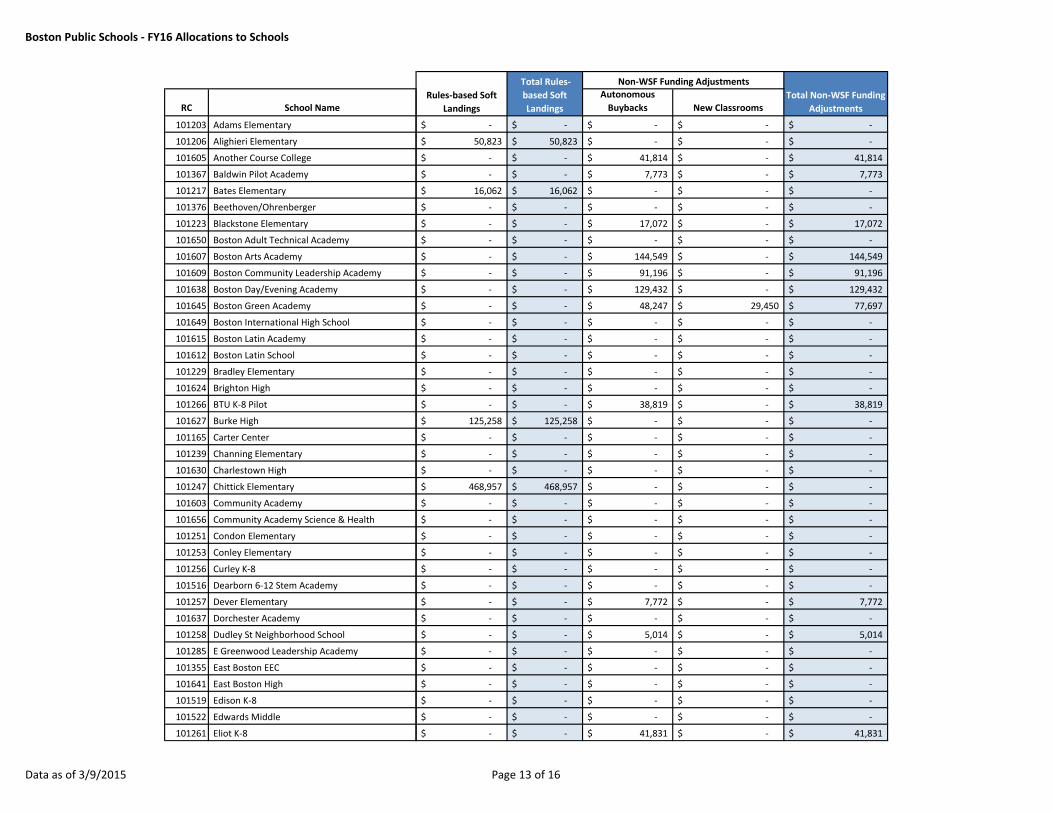
-$ -$ -$ -$ -$
50,823$ 50,823$ -$ -$ -$
-$ -$ 41,814$ -$ 41,814$
-$ -$ 7,773$ -$ 7,773$
16,062$ 16,062$ -$ -$ -$
-$ -$ -$ -$ -$
-$ -$ 17,072$ -$ 17,072$
-$ -$ -$ -$ -$
-$ -$ 144,549$ -$ 144,549$
-$ -$ 91,196$ -$ 91,196$
-$ -$ 129,432$ -$ 129,432$
-$ -$ 48,247$ 29,450$ 77,697$
-$ -$ -$ -$ -$
-$ -$ -$ -$ -$
-$ -$ -$ -$ -$
-$ -$ -$ -$ -$
-$ -$ -$ -$ -$
-$ -$ 38,819$ -$ 38,819$
125,258$ 125,258$ -$ -$ -$
-$ -$ -$ -$ -$
-$ -$ -$ -$ -$
-$ -$ -$ -$ -$
468,957$ 468,957$ -$ -$ -$
-$ -$ -$ -$ -$
-$ -$ -$ -$ -$
-$ -$ -$ -$ -$
-$ -$ -$ -$ -$
-$ -$ -$ -$ -$
-$ -$ -$ -$ -$
-$ -$ 7,772$ -$ 7,772$
-$ -$ -$ -$ -$
-$ -$ 5,014$ -$ 5,014$
-$ -$ -$ -$ -$
-$ -$ -$ -$ -$
-$ -$ -$ -$ -$
-$ -$ -$ -$ -$
-$ -$ -$ -$ -$
-$ -$ 41,831$ -$ 41,831$
Total Non-WSF Funding
Adjustments
Total Rules-
based Soft
Landings
Rules-based Soft
Landings
Non-WSF Funding Adjustments
Data as of 3/9/2015 Page 13 of 16
Boston Public Schools - FY16 Allocations to Schools
RC School Name
101262 Ellis Elementary
101209 Ellison/Parks EEC
101644 English High
101267 Everett Elementary
101671 Excel High
101646 Fenway High
101511 Frederick Pilot Middle
101279 Gardner Pilot Academy
101632 Greater Egleston High
101288 Grew Elementary
101290 Guild Elementary
101292 Hale Elementary
101293 Haley K-6
101324 Harvard/Kent Elementary
101401 Haynes EEC
101373 Henderson K-12
101299 Hennigan Elementary
101301 Hernandez K-8
101303 Higginson (K-2)
101540 Higginson/Lewis K-8
101307 Holland Elementary
101309 Holmes Elementary
101064 Horace Mann
101310 Hurley K-8
101531 Irving Middle
101316 Jackson/Mann K-8
101648 Kennedy Health Careers
101318 Kennedy John F Elementary
101320 Kennedy Patrick Elementary
101322 Kenny Elementary
101326 Kilmer K-8
101534 King K-8
101329 Lee Academy
101328 Lee K-8
101335 Lyndon K-8
101647 Lyon High
101339 Lyon K-8
101657 Madison Park High
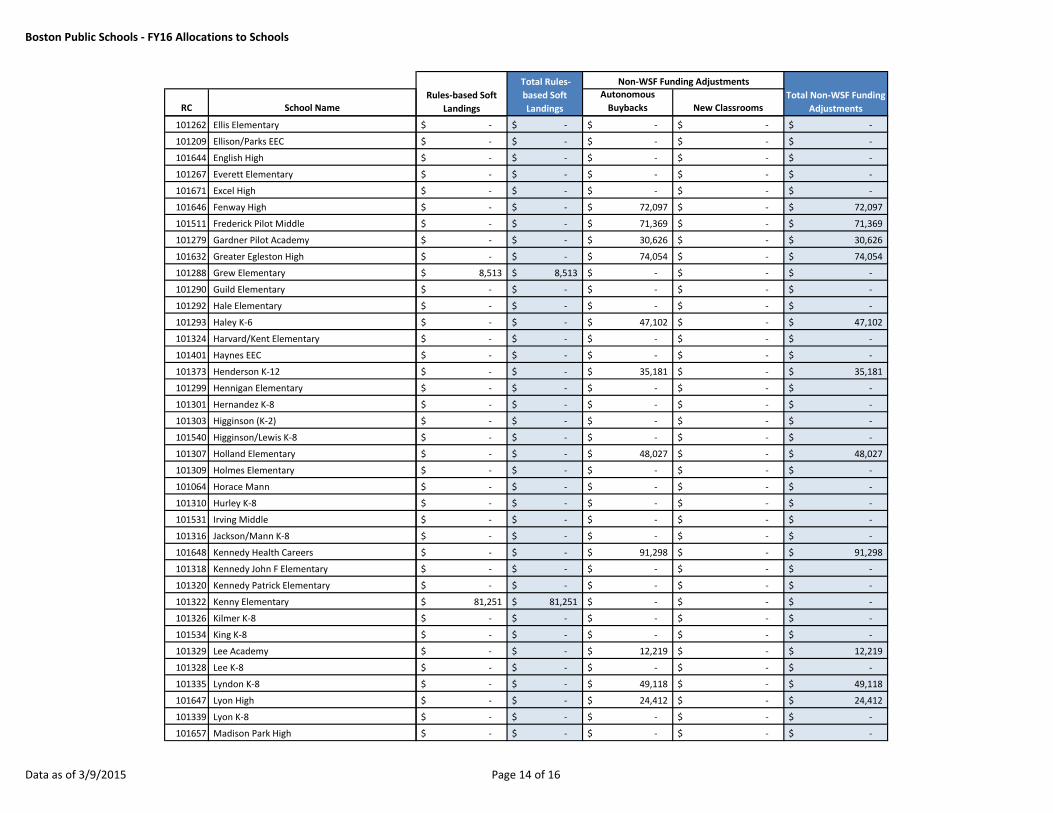
Autonomous
Buybacks New ClassroomsTotal Non-WSF Funding
Adjustments
Total Rules-
based Soft
Landings
Rules-based Soft
Landings
Non-WSF Funding Adjustments
-$ -$ -$ -$ -$
-$ -$ -$ -$ -$
-$ -$ -$ -$ -$
-$ -$ -$ -$ -$
-$ -$ -$ -$ -$
-$ -$ 72,097$ -$ 72,097$
-$ -$ 71,369$ -$ 71,369$
-$ -$ 30,626$ -$ 30,626$
-$ -$ 74,054$ -$ 74,054$
8,513$ 8,513$ -$ -$ -$
-$ -$ -$ -$ -$
-$ -$ -$ -$ -$
-$ -$ 47,102$ -$ 47,102$
-$ -$ -$ -$ -$
-$ -$ -$ -$ -$
-$ -$ 35,181$ -$ 35,181$
-$ -$ -$ -$ -$
-$ -$ -$ -$ -$
-$ -$ -$ -$ -$
-$ -$ -$ -$ -$
-$ -$ 48,027$ -$ 48,027$
-$ -$ -$ -$ -$
-$ -$ -$ -$ -$
-$ -$ -$ -$ -$
-$ -$ -$ -$ -$
-$ -$ -$ -$ -$
-$ -$ 91,298$ -$ 91,298$
-$ -$ -$ -$ -$
-$ -$ -$ -$ -$
81,251$ 81,251$ -$ -$ -$
-$ -$ -$ -$ -$
-$ -$ -$ -$ -$
-$ -$ 12,219$ -$ 12,219$
-$ -$ -$ -$ -$
-$ -$ 49,118$ -$ 49,118$
-$ -$ 24,412$ -$ 24,412$
-$ -$ -$ -$ -$
-$ -$ -$ -$ -$
Data as of 3/9/2015 Page 14 of 16
Boston Public Schools - FY16 Allocations to Schools
RC School Name
101342 Manning Elementary
101667 Margarita Muniz Academy
101504 Mario Umana Academy
101346 Mason Elementary
101348 Mather Elementary
101350 Mattahunt Elementary
101549 McCormack Middle
101352 Mckay K-8
101079 McKinley Schools
101356 Mendell Elementary
101553 Middle School Academy
101548 Mildred Avenue K-8
101224 Mission Hill K-8
101364 Mozart Elementary
101366 Murphy K-8
101664 New Mission High
101190 Newcomers Academy
101618 O'Bryant Math & Science HS
101370 O'Donnell Elementary
101377 Orchard Gardens K-8
101382 Otis Elementary
101411 Pauline Shaw Elementary
101390 Perkins Elementary
101392 Perry K-8
101394 Philbrick Elementary
101398 Quincy Elementary
101551 Quincy Upper School
101249 Roger Clap Innovation School
101555 Rogers Middle
101663 Roland B Hayes
101404 Roosevelt K-8
101406 Russell Elementary
101286 Sarah Greenwood K-8
101633 Snowden International
101420 Sumner Elementary
101422 Taylor Elementary
101674 TechBoston Academy 6-12
101570 Timilty Middle
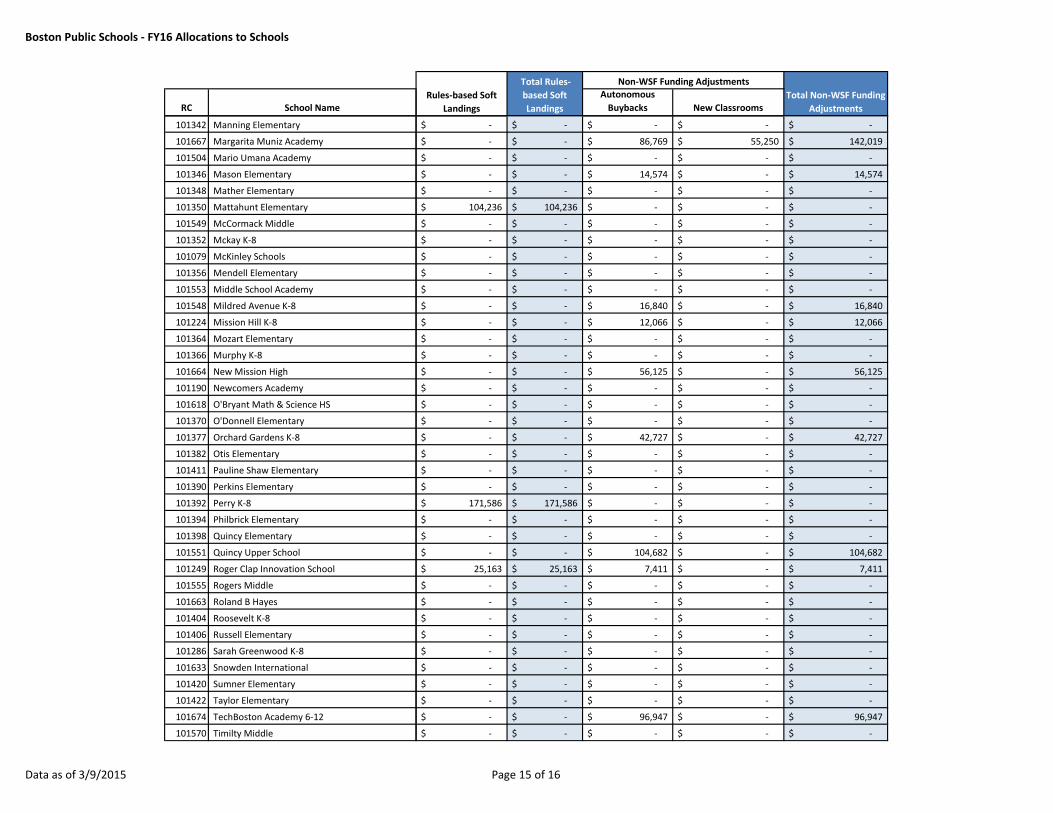
Autonomous
Buybacks New ClassroomsTotal Non-WSF Funding
Adjustments
Total Rules-
based Soft
Landings
Rules-based Soft
Landings
Non-WSF Funding Adjustments
-$ -$ -$ -$ -$
-$ -$ 86,769$ 55,250$ 142,019$
-$ -$ -$ -$ -$
-$ -$ 14,574$ -$ 14,574$
-$ -$ -$ -$ -$
104,236$ 104,236$ -$ -$ -$
-$ -$ -$ -$ -$
-$ -$ -$ -$ -$
-$ -$ -$ -$ -$
-$ -$ -$ -$ -$
-$ -$ -$ -$ -$
-$ -$ 16,840$ -$ 16,840$
-$ -$ 12,066$ -$ 12,066$
-$ -$ -$ -$ -$
-$ -$ -$ -$ -$
-$ -$ 56,125$ -$ 56,125$
-$ -$ -$ -$ -$
-$ -$ -$ -$ -$
-$ -$ -$ -$ -$
-$ -$ 42,727$ -$ 42,727$
-$ -$ -$ -$ -$
-$ -$ -$ -$ -$
-$ -$ -$ -$ -$
171,586$ 171,586$ -$ -$ -$
-$ -$ -$ -$ -$
-$ -$ -$ -$ -$
-$ -$ 104,682$ -$ 104,682$
25,163$ 25,163$ 7,411$ -$ 7,411$
-$ -$ -$ -$ -$
-$ -$ -$ -$ -$
-$ -$ -$ -$ -$
-$ -$ -$ -$ -$
-$ -$ -$ -$ -$
-$ -$ -$ -$ -$
-$ -$ -$ -$ -$
-$ -$ -$ -$ -$
-$ -$ 96,947$ -$ 96,947$
-$ -$ -$ -$ -$
Data as of 3/9/2015 Page 15 of 16
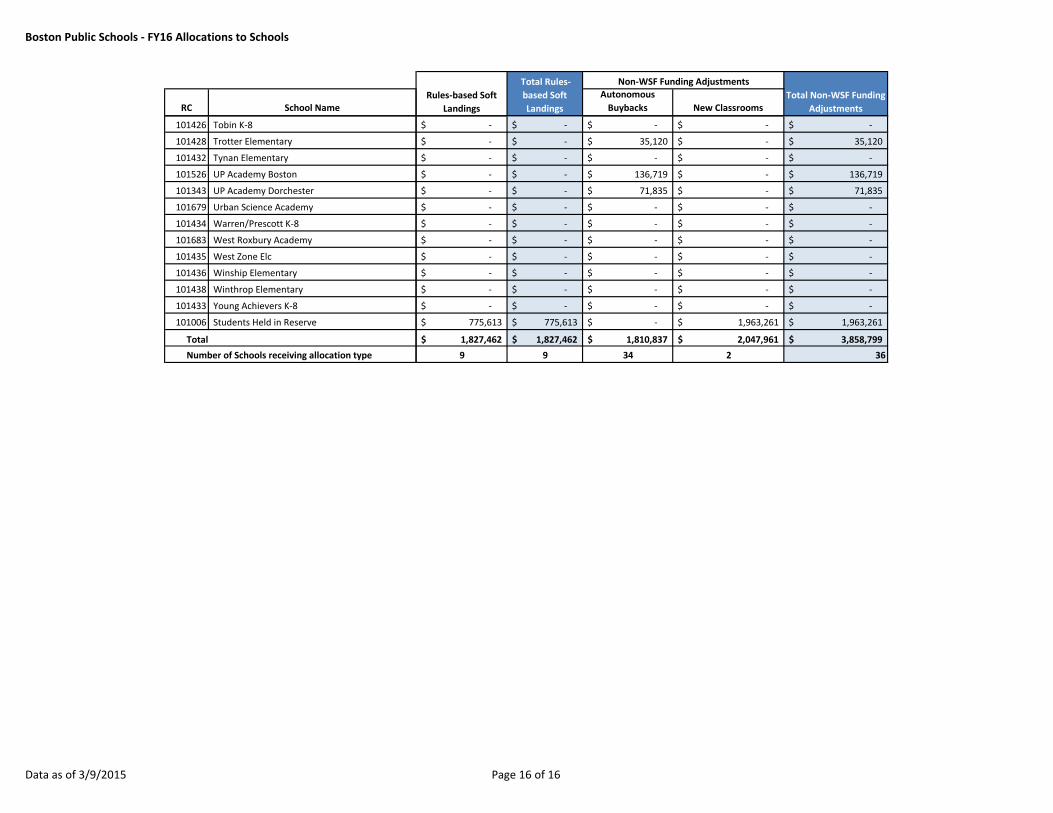
Boston Public Schools - FY16 Allocations to Schools
RC School Name
101426 Tobin K-8
101428 Trotter Elementary
101432 Tynan Elementary
101526 UP Academy Boston
101343 UP Academy Dorchester
101679 Urban Science Academy
101434 Warren/Prescott K-8
101683 West Roxbury Academy
101435 West Zone Elc
101436 Winship Elementary
101438 Winthrop Elementary
101433 Young Achievers K-8
101006 Students Held in Reserve
Total
Number of Schools receiving allocation type
Autonomous
Buybacks New ClassroomsTotal Non-WSF Funding
Adjustments
Total Rules-
based Soft
Landings
Rules-based Soft
Landings
Non-WSF Funding Adjustments
-$ -$ -$ -$ -$
-$ -$ 35,120$ -$ 35,120$
-$ -$ -$ -$ -$
-$ -$ 136,719$ -$ 136,719$
-$ -$ 71,835$ -$ 71,835$
-$ -$ -$ -$ -$
-$ -$ -$ -$ -$
-$ -$ -$ -$ -$
-$ -$ -$ -$ -$
-$ -$ -$ -$ -$
-$ -$ -$ -$ -$
-$ -$ -$ -$ -$
775,613$ 775,613$ -$ 1,963,261$ 1,963,261$
1,827,462$ 1,827,462$ 1,810,837$ 2,047,961$ 3,858,799$
9 9 34 2 36
Data as of 3/9/2015 Page 16 of 16