Embed Size (px)
Citation preview
Botswana Development Corporation Limited
GO ONLINEThis Annual Report, together with trading
statments and previous Annual Reports is is available online at www.bdc.com
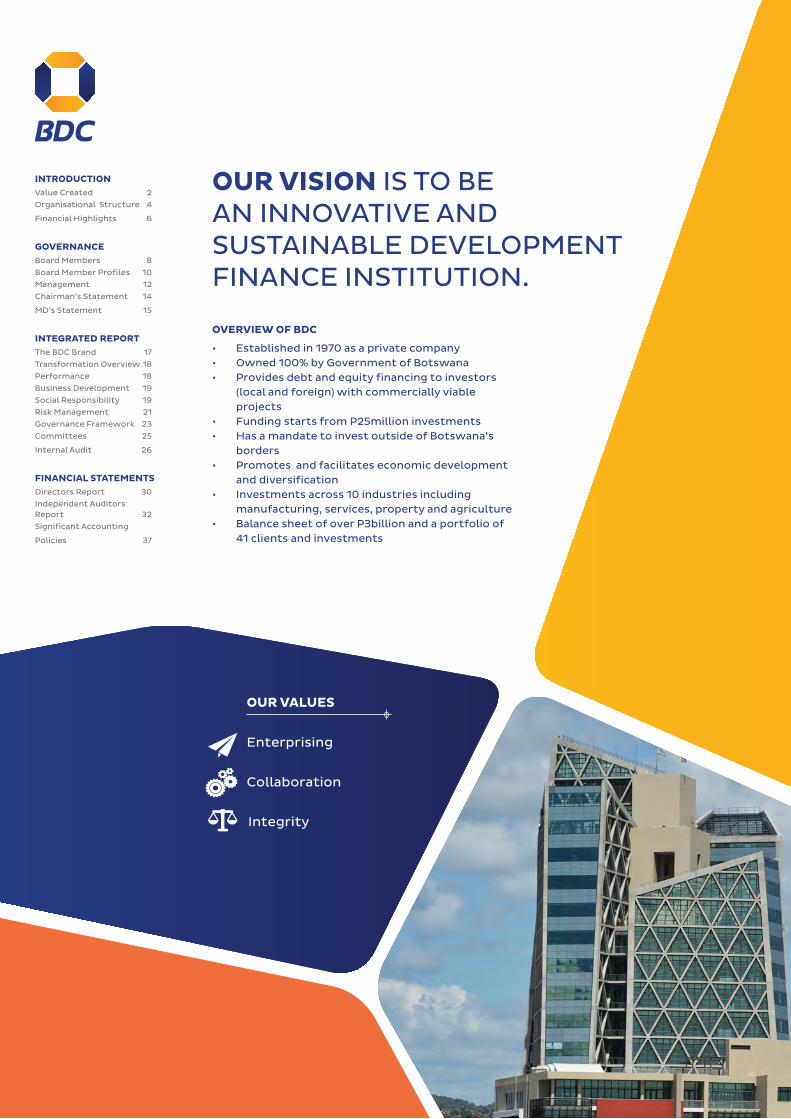
OVERVIEW OF BDC
• Established in 1970 as a private company • Owned 100% by Government of Botswana • Provides debt and equity financing to investors
(local and foreign) with commercially viable projects
• Funding starts from P25million investments• Has a mandate to invest outside of Botswana’s
borders • Promotes and facilitates economic development
and diversification • Investments across 10 industries including
manufacturing, services, property and agriculture • Balance sheet of over P3billion and a portfolio of
41 clients and investments
OUR VISION IS TO BE AN INNOVATIVE AND SUSTAINABLE DEVELOPMENT FINANCE INSTITUTION.
GO ONLINEThis Annual Report, together with trading
statments and previous Annual Reports is is available online at www.bdc.bw
Enterprising
Collaboration
Integrity
OUR VALUES
INTRODUCTIONValue Created 2
Organisational Structure 4
Financial Highlights 6
GOVERNANCEBoard Members 8
Board Member Profiles 10
Management 12
Chairman’s Statement 14
MD’s Statement 15
INTEGRATED REPORTThe BDC Brand 17
Transformation Overview 18
Performance 18
Business Development 19
Social Responsibility 19
Risk Management 21
Governance Framework 23
Committees 25
Internal Audit 26
FINANCIAL STATEMENTSDirectors Report 30
Independent AuditorsReport 32
Significant Accounting
Policies 37

BDC Annual Report 2014 1
OUR PURPOSE IS TO PROVIDE, FACILITATE AND SUPPORT THE FINANCING OF COMMERCIALLY VIABLE DEVELOPMENTS IN ORDER TO CONTRIBUTE TO A SUSTAINABLE AND DIVERSIFIED BOTSWANA ECONOMY.
Head Marketing Communications
Botswana Development Corporation
Fairscape Precinct, Plot 70667
Fairgrounds Office Park
P/Bag 160, Gaborone
Tel: (267) 365 1300
Fax: (267) 397 5072
Email: [email protected]
Website: www.bdc.bw
OUR MANDATE
• Promotion and facilitation of the economic development of Botswana
• Development of new or existing industrial, commercial, agricultural and property development businesses.
• Provision of direct financial investment or assistance to local or foreign investors with commercially viable projects.
• Conducting profitable, innovative and sustainable business.
BDC Annual Report 2014
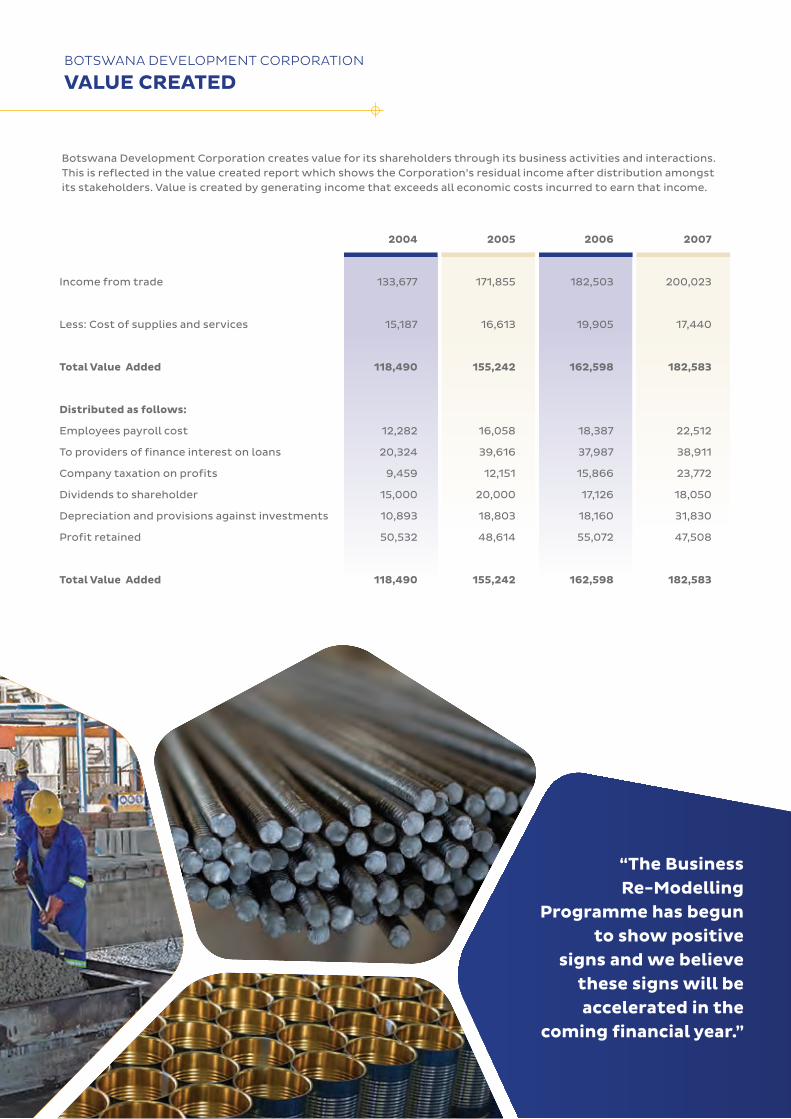
2004 2005 2006 2007
Income from trade 133,677 171,855 182,503 200,023
Less: Cost of supplies and services 15,187 16,613 19,905 17,440
Total Value Added 118,490 155,242 162,598 182,583
Distributed as follows:
Employees payroll cost 12,282 16,058 18,387 22,512
To providers of finance interest on loans 20,324 39,616 37,987 38,911
Company taxation on profits 9,459 12,151 15,866 23,772
Dividends to shareholder 15,000 20,000 17,126 18,050
Depreciation and provisions against investments 10,893 18,803 18,160 31,830
Profit retained 50,532 48,614 55,072 47,508
Total Value Added 118,490 155,242 162,598 182,583
BOTSWANA DEVELOPMENT CORPORATION
VALUE CREATED
Botswana Development Corporation creates value for its shareholders through its business activities and interactions. This is reflected in the value created report which shows the Corporation’s residual income after distribution amongst its stakeholders. Value is created by generating income that exceeds all economic costs incurred to earn that income.
“The Business Re-Modelling
Programme has begun to show positive
signs and we believe these signs will be accelerated in the
coming financial year.”
BDC Annual Report 2014 3
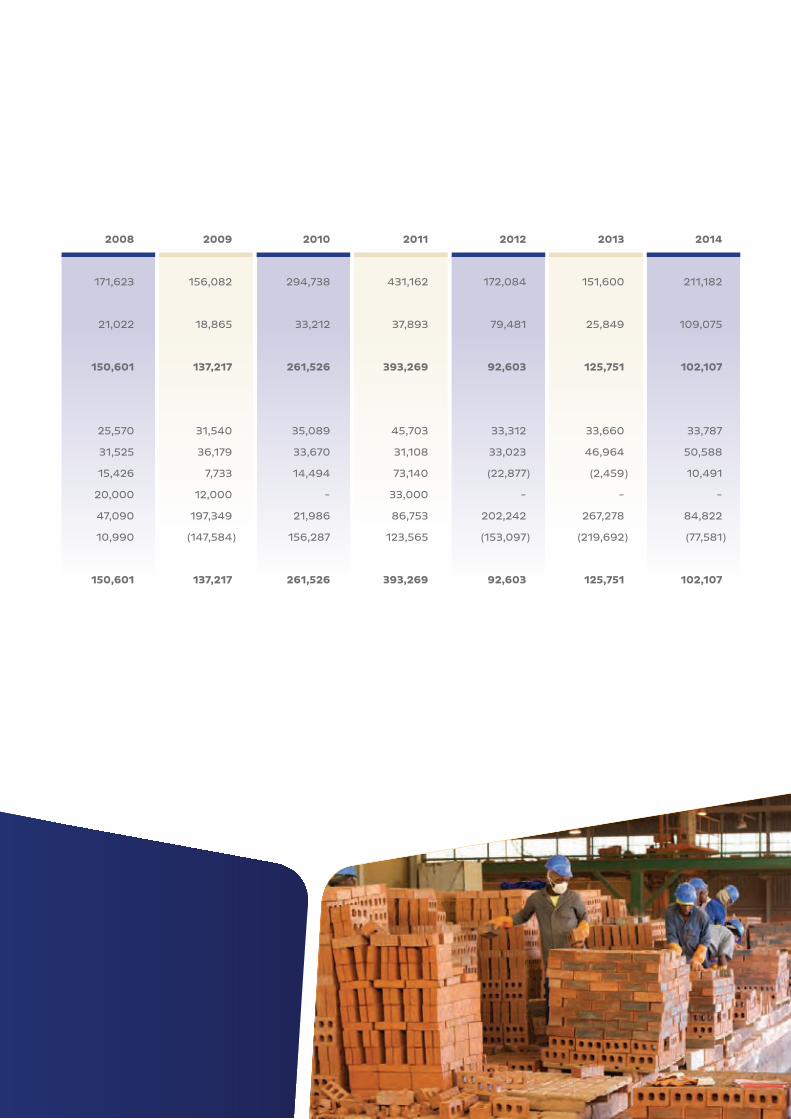
2008 2009 2010 2011 2012 2013 2014
171,623 156,082 294,738 431,162 172,084 151,600 211,182
21,022 18,865 33,212 37,893 79,481 25,849 109,075
150,601 137,217 261,526 393,269 92,603 125,751 102,107
25,570 31,540 35,089 45,703 33,312 33,660 33,787
31,525 36,179 33,670 31,108 33,023 46,964 50,588
15,426 7,733 14,494 73,140 (22,877 ) (2,459 ) 10,491
20,000 12,000 - 33,000 - - -
47,090 197,349 21,986 86,753 202,242 267,278 84,822
10,990 (147,584 ) 156,287 123,565 (153,097 ) (219,692 ) (77,581 )
150,601 137,217 261,526 393,269 92,603 125,751 102,107
BDC Annual Report 2014 Front Section 3
4 BDC Annual Report 2014
BOTSWANA DEVELOPMENT CORPORATION
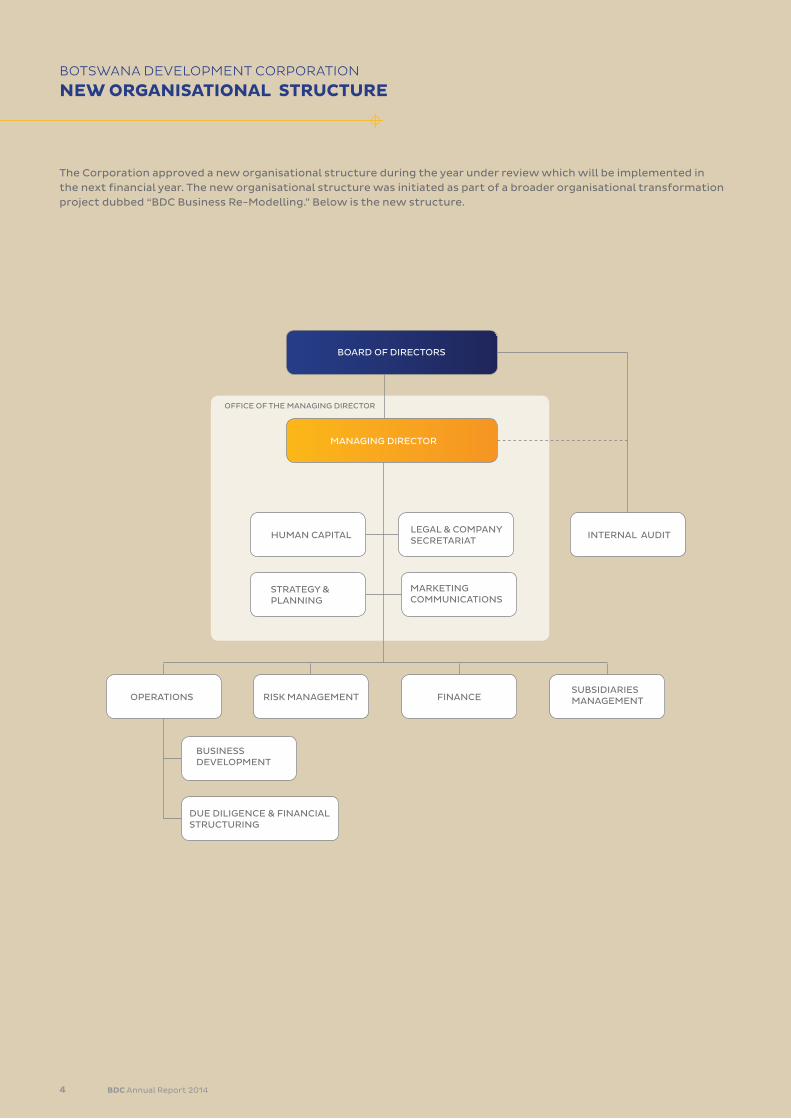
NEW ORGANISATIONAL STRUCTURE
BOARD OF DIRECTORS
MANAGING DIRECTOR
HUMAN CAPITALLEGAL & COMPANYSECRETARIAT
STRATEGY & PLANNING
MARKETINGCOMMUNICATIONS
INTERNAL AUDIT
RISK MANAGEMENT FINANCESUBSIDIARIESMANAGEMENT
BUSINESSDEVELOPMENT
DUE DILIGENCE & FINANCIAL STRUCTURING
OPERATIONS
OFFICE OF THE MANAGING DIRECTOR
The Corporation approved a new organisational structure during the year under review which will be implemented in the next financial year. The new organisational structure was initiated as part of a broader organisational transformation project dubbed “BDC Business Re-Modelling.” Below is the new structure.

BDC Annual Report 2014 5
The latest BDC Development: Fairscape Precinct. Amongst many major tenants this building will also house BDC’s new headquaters.
6 BDC Annual Report 2014
BOTSWANA DEVELOPMENT CORPORATION
FINANCIAL HIGHLIGHTS
(50,000.00)
100,000.00
150,000.00
200,000.00
250,000.00
300,000.00
350,000.00
400,000.00
Revenue Gross Profit Profit / (Loss)Before Tax
Loss for the year TotalComprehensive Income
50,000.00
2014
2013
GROUP PERFORMANCE SUMMARY
100
0
200
300
400
500
600
700
800
900
2010 2011 2012 2013 2014
LISTED INVESTMENTS
121 145
348374
278
2010 2011 2012 2013 2014
50
0
100
150
200
250
300
350
400
450
EXPENDITURE
100
300
400
500
700
2010 2011 2012 2013 2014
Mil
lio
n P
ula
200
800
600
49
163
244
752
414
728
171
410
518
640
628
8968
52 45
68
1049387
52
BUSINESS SECTOR DISTRIBUTION
Mil
lio
n P
ula
Mil
lio
n P
ula
Mil
lio
n P
ula
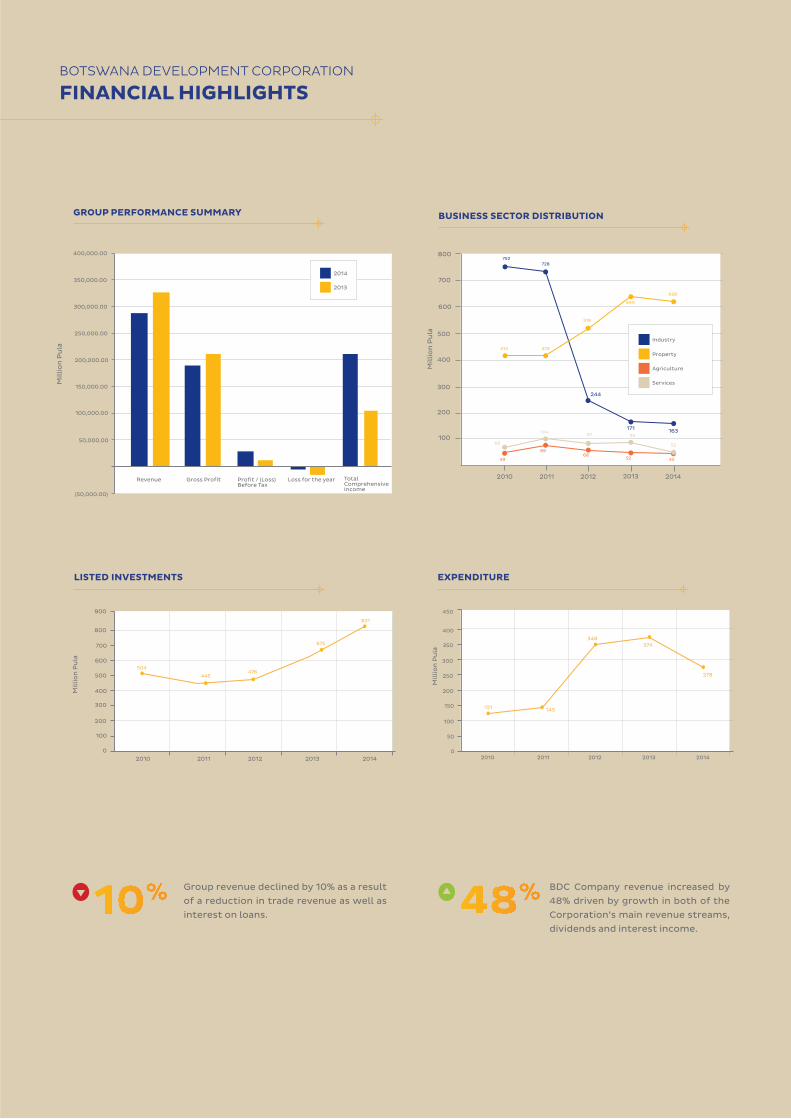
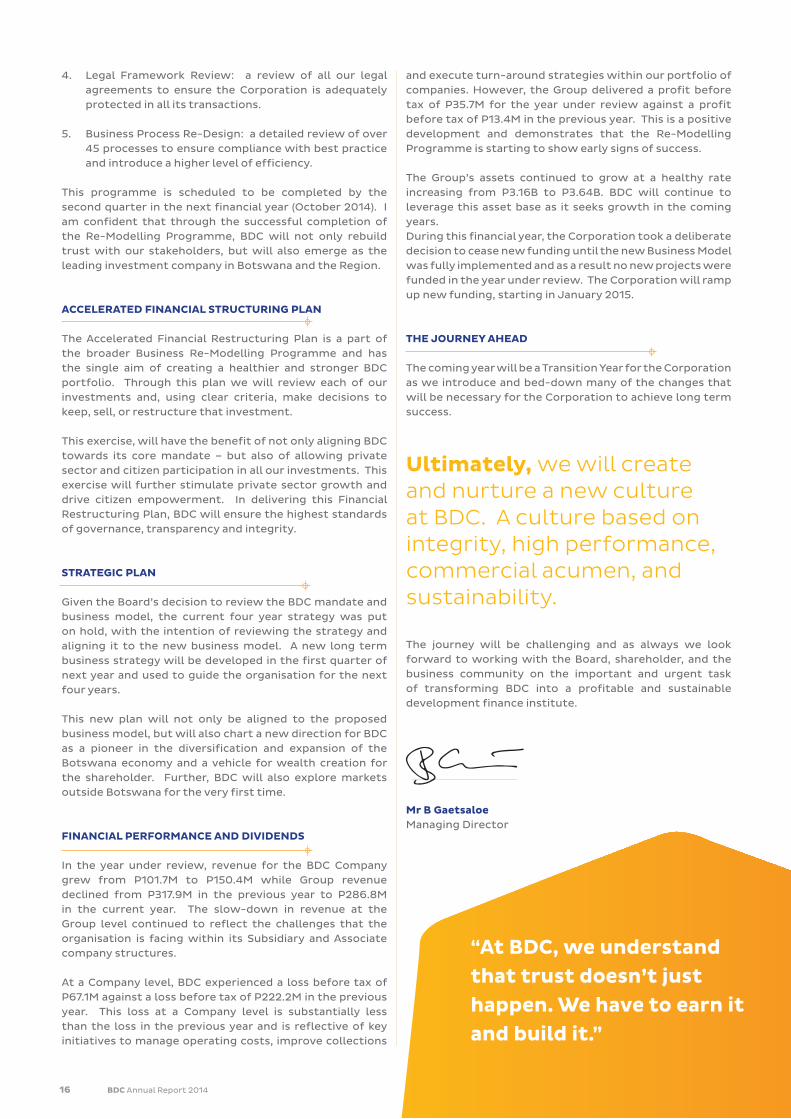
Group revenue declined by 10% as a result
of a reduction in trade revenue as well as
interest on loans.
BDC Company revenue increased by
48% driven by growth in both of the
Corporation’s main revenue streams,
dividends and interest income.
504
445476
675
831
Industry
Property
Agriculture
Services
BDC Annual Report 2014 7
Equity
Loans
200
400
600
800
1000
1200
1139
144
2010
1074
256
2011
753
165
2012
745
212
2013
705
183
2014
PRODUCT RANGE
Mil
lio
n P
ula
12
64
75
2010 2011 2012 2013 2014
100
200
300
400
500
600
700
800
900
1000
1100
Mil
lio
n P
ula
INVESTMENTS DISTRIBUTION
100
200
300
400
500
600
2010 2011 2012 2013 2014M
illi
on
Pu
la
43
45
130
13
52
336
11
80
82
24
68
116
REVENUE DISTRIBUTION
Dividend Income
Interest Income
Other Income
Subsidaries Associates Non Affiliates
1,006
895
1,012
1,123
1,065
172 128
183
57
45
105 120 83 85
35
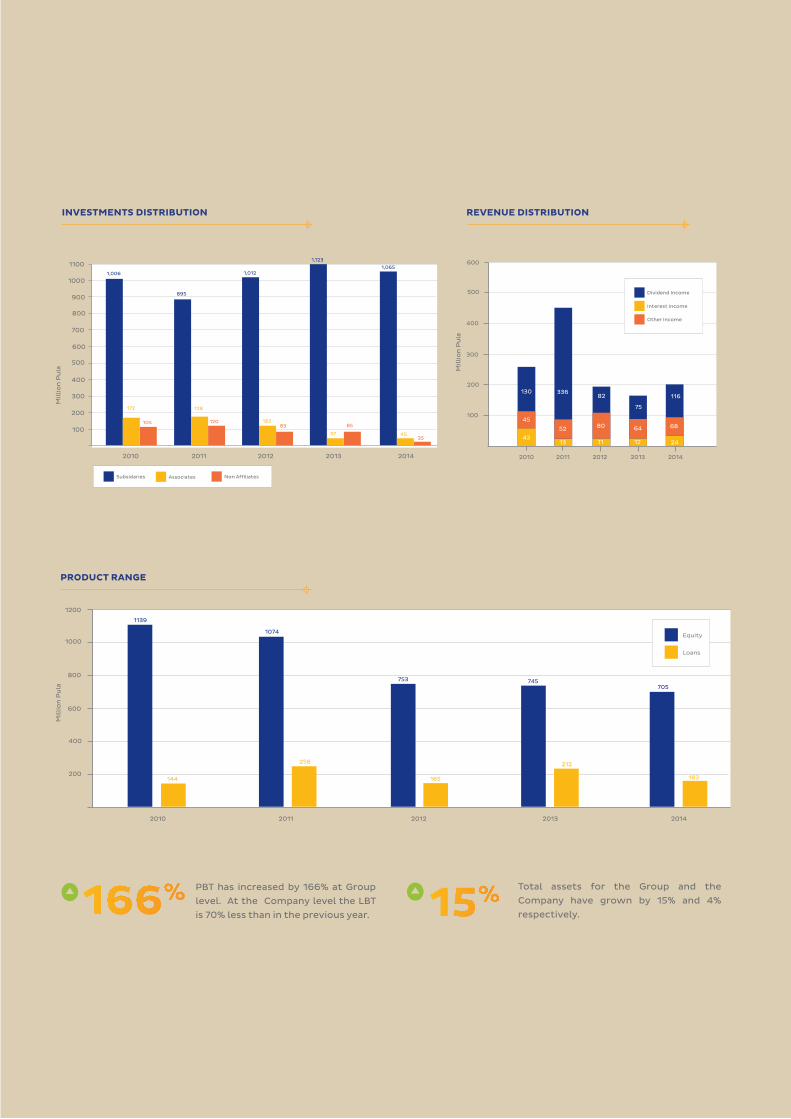
PBT has increased by 166% at Group
level. At the Company level the LBT
is 70% less than in the previous year.
Total assets for the Group and the
Company have grown by 15% and 4%
respectively.

8 BDC Annual Report 2014
BOTSWANA DEVELOPMENT CORPORATION
BOARD MEMBERS
1
2
3
4

BDC Annual Report 2014 9
5
6
7
8 9
1
2
3
4
5
Blackie Marole Chairman of the Board
Bashi Gaetsaloe Managing Director
Mpho Moremong - Gobe
Reetsang Willie Mokgatlhe
Banny K. Molosiwa Deputy Chairperson of the Board
6
7
8
9
Verily Molatedi
Amando Vasco Lionjanga
Solomon M. Sekwakwa
Richard Vaka

10 BDC Annual Report 2014
BLACKIE MAROLE Board Chairman.
Appointed 14 November, 2011.
An Economist by profession, Mr. Marole spent 21 years in the
civil service, rising to the position of Permanent Secretary at the
Ministry of Energy, Water and Minerals Resources.
Mr. Marole has served on numerous national and international
Boards including: African Energy Resources; Associated Fund
Administrators (AFA); Botswana Diamond Valuing company;
Diamond Manufacturing Botswana; Diamond Trading Company;
Debswana Pension Fund Board of Trustees; Botswana Power
Corporation (Chairman); Water Utilities Corporation (Chairman);
Water Apportionment Board (Chairman); Debswana Diamond
Company (Director and Chairman); De Beers Centenary AG/De
Beers Consolidated Mines; BCL Limited; Botswana Ash; De Beers
Prospecting (Pty) Ltd; De Beers Botswana (Pty) Ltd; Barclays Bank of
Botswana (Chairman); CIC Energy among others.
Mr. Marole has a Master of Arts Degree in Economics from the
Williams College, Massachusetts, United States. He also has a
Bachelor of Arts Degree in Economics from the University of
Botswana, and an Economic Institute Diploma from the University
of Colorado.
BANNY K MOLOSIWA Board Deputy Chairperson.
Appointed 1 August, 2004.
An Economist, Ms. Molosiwa is Permanent Secretary in the Ministry
of Trade and Industry. Previously, she served in different capacities
at the Ministry of Finance and Development Planning, and held the
positions of Deputy Secretary and Secretary for Economic Affairs as
well as Director for Development Programmes.
Ms. Molosiwa has served on the Boards of several institutions
including BHC, WUC, BOTEC, BEDIA (now BITC), SPEDU, Okavango
Diamond Company, Bank of Botswana, National Employment
Manpower Incomes Council, National AIDS Council, and the Rural
Development Council. She was also the Alternate Governor
for Botswana on the African Development Bank (ADB) Board of
Governors.
Ms. Molosiwa has a Masters Degree in Development Economics
from the Institute of Social Studies at The Hague in the Netherlands.
BASHI GAETSALOE Managing Director.
Appointed 1 April, 2014.
Mr. Gaetsaloe joined BDC from Accenture Botswana where he was
the Country Managing Director. A former Partner and Director of
HRMC Management Consultants and later held the position of Chief
Executive Officer at KPMG Consulting before joining Accenture
Botswana. He has advised and consulted to the Botswana
Government as well as to Botswana’s leading companies across
the banking, telecommunications, insurance, manufacturing and
mining industries.
Mr. Gaetsaloe has a MA in Economics from Yale University, New
Haven, USA and a Bachelor of Arts in Economics from Connecticut
College, New London, USA.
AMANDO VASCO LIONJANGA Chairman, Board Tender Committee.
Appointed 1 February, 2012
A Civil Engineer, Mr. Lionjanga, is currently the Registrar (CEO) of
the Engineers Registration Board, a statutory body responsible
for regulating the activities and conduct of registered engineers in
Botswana.
He joined the Roads Department under the then Ministry ofWorks,
Transport & Communications (WTC) in 1975 as an Assistant Roads
Engineer and rose through the ranks to become Permanent
Secretary in Ministry of WTC, a position he held from 1992 to 1999.
Mr. Lionjanga was appointed Chairman of a number of statutory
bodies under the Ministry of WTC including: Air Botswana,
Botswana Railways, Botswana Telecommunications Corporation
and Botswana Postal Services.
He retired from the Public Service in 1999 and joined Haas Consult,
a local firm of Consulting Civil Engineers. In 2002 he was appointed
founding Executive Chairman of the Public Procurement and Asset
Disposal Board (PPADB), a position he held until 2010. During the
same period he also served as Board Member of the Botswana
Bureau of Standards.
Mr. Lionjanga has a Bachelor of Engineering (Civil) Degree from the
University of Zambia and a Master of Science in Highway Engineering
from University of Birmingham, UK.
VERILY MOLATEDI Chairperson, Board Finance and Audit Committee; Member Board Human Capital Committee.
Appointed 1 February, 2012.
A Certified Chartered Accountant, Ms. Molatedi is the Chief
Executive Officer of Botswana Institute of Chartered Accountants
(BICA) where she is responsible for driving the strategic direction of
the Institute.
Prior to joining BICA she was Deputy Chief Executive Officer (Support
Services) at the Local Enterprise Authority (LEA) responsible for
Corporate Services, Human Recourses, Research and Development
as well as Stakeholder Engagement and Communications.
Previously, she worked in both the parastatal and private sectors
for organisations such as Water Utilities Corporation, Botswana
Housing Corporation, Botswana Meat Commission and Standard
Chartered Bank, She has many years of managerial experience
working in the areas of Strategic Planning, Corporate Governance,
Project Management and implementation, Financial Management
and systems of Internal Control improvements.
Ms. Molatedi has served on several National and Regional Boards
including Botswana Medical Aid Society, Botswana Railways, Rural
Industries Promotion Company and SADCAS, a subsidiary of SADC.
Ms. Molatedi has a Bachelor of Commerce Degree from the
University of Botswana and ACCA Qualification. She has attended
a number of leadership development programmes. She is a Fellow
Member of ACCA and an Associate of the Botswana Institute of
Chartered Accountants.
RICHARD VAKA Chairman, Human Capital Committee; Member Finance and Audit Committee. Appointed 1 February, 2012.
A Human Resources practitioner, Mr. Richard Vaka is Group
Employee Relations Manager for Debswana Diamond Company. He
joined Debswana in 1988 as a Graduate Trainee and has held various
Human Resources and Industrial Relations roles in the Debswana
Group over the years. He was appointed to his current position in
2005.
Mr. Vaka has a BSc (Honours) in Psychology and a Post Graduate
Diploma in Occupational Psychology both from Hull University, UK.
He also has a Bachelor of Laws Degree from the University of South
Africa.
Mr. Vaka is currently Chairman of the Debswana Pension Fund
and Debswana ART and Wellness Fund Boards. He is the former

BDC Annual Report 2014 11
Chairman of the Botswana Medical Aid Society and Botswana
Amateur Athletics Association.
REETSANG WILLIE MOKGATLHE Chairman, Board Risk and Investment Committee; Member, Board Finance and Audit Committee. Appointed 1 December, 2012.
Mr. Mokgatlhe is the founding Chief Executive Officer of Botswana
Oil Limited, a Government-owned company tasked with ensuring
security of supply and facilitation of citizen participation in the
petroleum sector. He is the former Managing Director of Vivo
Energy Botswana and Vivo Energy Namibia.
Mr. Mokgatlhe has held a range of senior positions in large private
and parastatal organisations in Botswana, Namibia, South Africa
and the Netherlands including Government Relations Advisor-
Africa at Shell International; Country Chairman, Shell Namibia; and
Chief Executive Officer, Air Botswana.
He had held directorships in several companies including Shell
Namibia Limited (Chairman); Shell Oil Botswana (Chairman); National
Development Bank (Chairman); Botswana Post; Air Botswana; and
Airline Association of Southern Africa (Chairman).
Mr. Mokgatlhe has a Masters Degree from Canfields Institute of
Technology, UK, and a Bachelor of Commerce from the University
of Botswana.
SOLOMON M. SEKWAKWA Former Board Chairman (2009-2011).
Appointed 1 November, 2011.
An economist, Mr. Sekwakwa is the Permanent Secretary in the
Ministry of Finance and Development Planning.
Having started his career as an Industrial Planner at the Selibe-
Phikwe mine in 1979, Mr. Sekwakwa later joined the Southern
District Council, first as an Assistant Economist and later as Senior
Economist. He became Principal Economist for the Central District
Council and thereafter the Ministry of Finance and Development
Planning where he subsequently became Chief Economist and later,
Director of Economic Affairs (Macro), Secretary, Development and
Budget Division; and finally- Permanent Secretary in the Ministry of
Finance and Development Planning.
Mr. Sekwakwa has served on a number of Boards including:
Citizen Entrepreneurial Development Agency (CEDA), University
of Botswana’s Finance and Audit Committee (Chairman), National
Development Bank, Vision 2016 Council, Bank of Botswana, De Beers
Societe Anonyme, Debswana, Debswana Investment Board, De
Beers Audit Committee and Banyana Farm Pty Ltd. Mr. Sekwakwa
has a Masters of Arts Degree in Development Economics from the
University of Sussex, UK and a Bachelor of Arts in Economics and
Sociology from the University of Botswana
MPHO MOREMONG-GOBE Member, Board Tender Committee and Board Risk and Investment Committee. Appointed 1 December, 2012
A Real Estate Practitioner, Ms. Moremong-Gobe is Managing
Director of MG Properties and a member of the Royal Institute of
Chartered Surveyors (RICS), UK; as well as the Real Estate Institute
of Botswana and Real Estate Advisory Council.
Previously she was Managing Director at Pam Golding International
Botswana. She has worked with Knight Frank Botswana (KFB) as an
Associate Partner.
Ms. Moremong-Gobe has served on numerous Boards including
Gaborone City Council Adjudication Board (Chairperson); RICS
Governing Council, UK (Africa Representative). Royal Institution of
Chartered Surveyors Botswana Group (Chairperson) Real Estate
Institute of Botswana (Vice President) and Real Estate Advisory
Council (Chairperson), amongst others.
She has a Bachelor of Science (BSc) Hons. in Estate Management
from Oxford Brookes University, UK, and a Masters in Business
Administration (MBA), University of North West, RSA, jointly with
the University of Liverpool, UK.
Independent Board Committee MembersWhen appropriate, the Board brings in independent professionals
to assist the Board to better execute its duties and responsibility.
The current independent members are:
MICHAEL LESOLLE Independent member, Board Audit Committee. Appointed February, 2012.
A Certified Chartered Accountant, Mr. Lesolle is Executive Director of
Botswana Accountancy College (BAC) and former CEO of Botswana
Savings Bank. He is a Fellow of the Association of Chartered Certified
Accountants (ACCA) and has extensive experience in various aspects
of business and the accountancy profession as well as in business
leadership, organisational transformation, strategy formulation
and its implementation, and managing change.
He has contributed extensively in the accountancy profession both
locally at the Botswana Institute of Accountants (BIA, now BICA)
where for many years he was Member of Council, and ultimately
as President of the Institute. He is Non-Executive Director for a
number of Boards including the BDC Audit Committee, Chairman of
VPB, former Member of University of Botswana Council and others.
Mr. Lesolle has an ACCA qualification and is also a Member of the
Botswana Institute of Chartered Accountants.
MALEBOGO ITUMELENG MPUGWA Independent member, Human Capital Committee, Appointed 9 August, 2012.
Ms. Mpugwa is Head of Human Resources and part of the Executive
Committee for De Beers Global Sightholder Sales (DBGSS) where
her primary responsibility is to lead and manage the company’s
people management strategy.
She previously held several human resources managerial and
executive positions at Standard Chartered Bank, including as
Regional Head of Human Resources for Consumer Banking Business
in Southern Africa Debswana Diamond Company; and Debswana
mines.
She is a Board member of Botswana Fibre Networks (BoFiNet) and
the De Beers Global Sightholder Sales (DBGSS).
Ms. Mpugwa has a Bachelor of Arts Degree in Public Administration
and Political Science from the University of Botswana and holds
several professional certifications including Executive Leadership
Programme – London Business School; and Certificate Programme
in Labour Relations (Wits University) among others.
SEAN RASEBOTSA Independent member, Risk and Investment Committee. Appointed 8 October, 2013.
Mr. Rasebotsa is Managing Director of Coronation Fund Managers
(Botswana). Previously he served as Chief Executive Officer at
Glenrand MIB. Prior to that held various positions at Barclays Bank
in Botswana, Zambia and South Africa. Mr. Rasebotsa has a Bachelor
of Commerce Degree from the University of Botswana.

12 BDC Annual Report 2014
BOTSWANA DEVELOPMENT CORPORATION
MANAGEMENT
1
2
3
4
5
6

BDC Annual Report 2014 13
7
8
910
11
12
1
2
3
4
5
6
7
8
9
10
12
11
Bashi GaetsaloeManaging Director
Jennifer DubeManager, Legal
Boitshwarelo Lebang Manager, Corporate Communications and Public Relations (Ag)
Emmanuel MaiteManager, Human Resource & Development
Magdeline TsianeGeneral Manager, Management Services (Ag)
Ronald PholeGroup Internal Auditor
Kebareileng LebalangChief Information Officer (Ag)
Kamogelo KesiilweManager, Invoice Discounting
Judith DintwaManager, Risk Management (Ag)
Jezenga UezesaManager, Industry
Batlang MmualefheManager, Marketing and Research
Diketso RantshabengManager, Agribusiness & Services
14 BDC Annual Report 2014
In the year ending June 2014, the Corporation continued to manage the effects of financial losses accumulated over the past few years.
The decision to liquidate Fengyue Glass Manufacturing Botswana Pty Ltd led to a full impairment of the investment, which further worsened the financial performance of the Corporation. The impairment was spread over three years with a considerable amount in the prior financial year and a restatement in the 2011 and 2012 financials. The Corporation also experienced challenges during the year as many of its investment companies faced different and difficult market conditions.
The different operating conditions manifested in liquidity and other deficits, a problem further compounded by the fact that the Corporation had for a long time depended on short term funding for long term projects.
All these problems led the Board to review the fundamentals of the Corporation. The review, carried out with the assistance of KPMG as business consultants, went well and resulted in recommended structural reforms. The anticipated changes in the Corporation’s business model caused some anxiety amongst staff which resulted in some
unusually high turnover. After the approval of the new business model, all BDC staff members were given notice of possible job losses in terms of the Section 25 of the Employment Act, further increasing the uncertainty in the security of their jobs.
The implementation of the Business Re-Modelling Programme commenced in April 2014 with a clear action plan to address problems in the areas listed below over a period of six months. The exercise ended in December 2014.
1. Organisational Structure Design and Implementation
2. Risk Framework Design and Implementation3. Governance Framework Design and
Implementation4. Legal Framework Design and Implementation5. Business Process Re-Design and Implementation6. Strategy Development and Implementation
Implementation of this plan began in April 2014 and the exercise will be completed by October 2014. The Board has every confidence that through this Re-Modelling Programme, BDC will not only solve many of its current challenges, but most importantly, will lay the foundation for future success and sustainability.
This will be a challenging and difficult journey, but we believe we are on the right path. The Business Re-Modelling Programme has begun to show positive signs and we believe these signs will be accelerated in the coming financial year.
On behalf of the Board, I want to thank all our stakeholders for their understanding, patience and continued loyalty and commitment to BDC and to what BDC can accomplish for the Nation.
I also want to express our utmost appreciation for the unwavering support and guidance that we received from the Honourable Minister of Trade and Industry, Ms. Dorcas Makgato.
Mr B MaroleChairman
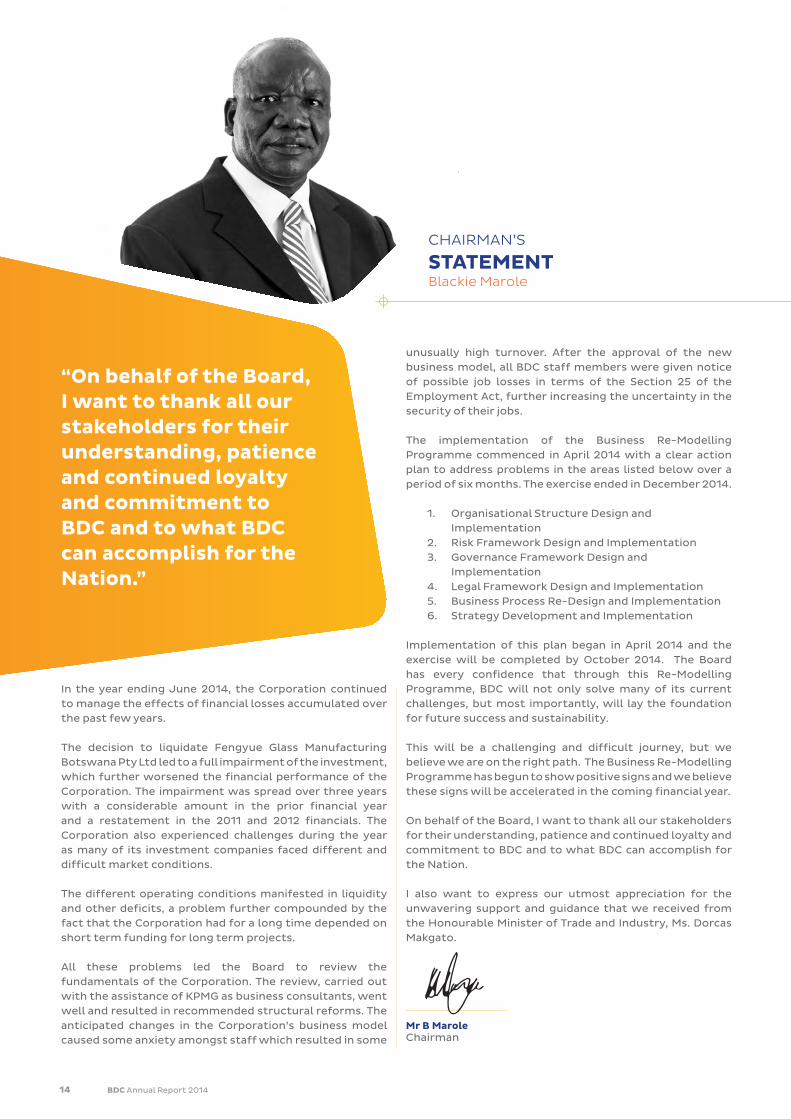
CHAIRMAN’S
STATEMENTBlackie Marole
“On behalf of the Board, I want to thank all our stakeholders for their understanding, patience and continued loyalty and commitment to BDC and to what BDC can accomplish for the Nation.”
BDC Annual Report 2014 15
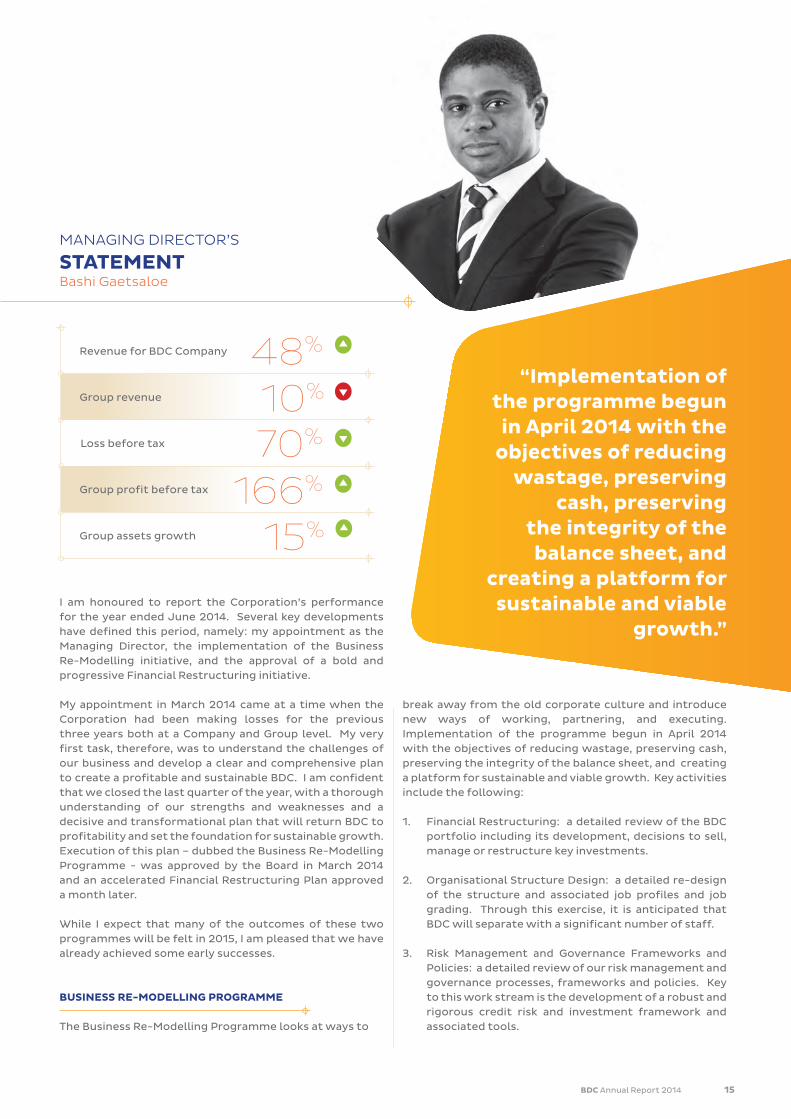
I am honoured to report the Corporation’s performance for the year ended June 2014. Several key developments have defined this period, namely: my appointment as the Managing Director, the implementation of the Business Re-Modelling initiative, and the approval of a bold and progressive Financial Restructuring initiative.
My appointment in March 2014 came at a time when the Corporation had been making losses for the previous three years both at a Company and Group level. My very first task, therefore, was to understand the challenges of our business and develop a clear and comprehensive plan to create a profitable and sustainable BDC. I am confident that we closed the last quarter of the year, with a thorough understanding of our strengths and weaknesses and a decisive and transformational plan that will return BDC to profitability and set the foundation for sustainable growth. Execution of this plan – dubbed the Business Re-Modelling Programme - was approved by the Board in March 2014 and an accelerated Financial Restructuring Plan approved a month later.
While I expect that many of the outcomes of these two programmes will be felt in 2015, I am pleased that we have already achieved some early successes.
BUSINESS RE-MODELLING PROGRAMME
The Business Re-Modelling Programme looks at ways to
break away from the old corporate culture and introduce new ways of working, partnering, and executing. Implementation of the programme begun in April 2014 with the objectives of reducing wastage, preserving cash, preserving the integrity of the balance sheet, and creating a platform for sustainable and viable growth. Key activities include the following:
1. Financial Restructuring: a detailed review of the BDC portfolio including its development, decisions to sell, manage or restructure key investments.
2. Organisational Structure Design: a detailed re-design of the structure and associated job profiles and job grading. Through this exercise, it is anticipated that BDC will separate with a significant number of staff.
3. Risk Management and Governance Frameworks and Policies: a detailed review of our risk management and governance processes, frameworks and policies. Key to this work stream is the development of a robust and rigorous credit risk and investment framework and associated tools.
“Implementation of the programme begun in April 2014 with the
objectives of reducing wastage, preserving
cash, preserving the integrity of the balance sheet, and
creating a platform for sustainable and viable
growth.”
MANAGING DIRECTOR’S
STATEMENTBashi Gaetsaloe
Revenue for BDC Company
Group revenue
Loss before tax
Group profit before tax
48%
10%
70%
166%
15%Group assets growth
16 BDC Annual Report 2014
4. Legal Framework Review: a review of all our legal agreements to ensure the Corporation is adequately protected in all its transactions.
5. Business Process Re-Design: a detailed review of over 45 processes to ensure compliance with best practice and introduce a higher level of efficiency.
This programme is scheduled to be completed by the second quarter in the next financial year (October 2014). I am confident that through the successful completion of the Re-Modelling Programme, BDC will not only rebuild trust with our stakeholders, but will also emerge as the leading investment company in Botswana and the Region.
ACCELERATED FINANCIAL STRUCTURING PLAN
The Accelerated Financial Restructuring Plan is a part of the broader Business Re-Modelling Programme and has the single aim of creating a healthier and stronger BDC portfolio. Through this plan we will review each of our investments and, using clear criteria, make decisions to keep, sell, or restructure that investment.
This exercise, will have the benefit of not only aligning BDC towards its core mandate – but also of allowing private sector and citizen participation in all our investments. This exercise will further stimulate private sector growth and drive citizen empowerment. In delivering this Financial Restructuring Plan, BDC will ensure the highest standards of governance, transparency and integrity.
STRATEGIC PLAN
Given the Board’s decision to review the BDC mandate and business model, the current four year strategy was put on hold, with the intention of reviewing the strategy and aligning it to the new business model. A new long term business strategy will be developed in the first quarter of next year and used to guide the organisation for the next four years.
This new plan will not only be aligned to the proposed business model, but will also chart a new direction for BDC as a pioneer in the diversification and expansion of the Botswana economy and a vehicle for wealth creation for the shareholder. Further, BDC will also explore markets outside Botswana for the very first time.
FINANCIAL PERFORMANCE AND DIVIDENDS
In the year under review, revenue for the BDC Company grew from P101.7M to P150.4M while Group revenue declined from P317.9M in the previous year to P286.8M in the current year. The slow-down in revenue at the Group level continued to reflect the challenges that the organisation is facing within its Subsidiary and Associate company structures.
At a Company level, BDC experienced a loss before tax of P67.1M against a loss before tax of P222.2M in the previous year. This loss at a Company level is substantially less than the loss in the previous year and is reflective of key initiatives to manage operating costs, improve collections
and execute turn-around strategies within our portfolio of companies. However, the Group delivered a profit before tax of P35.7M for the year under review against a profit before tax of P13.4M in the previous year. This is a positive development and demonstrates that the Re-Modelling Programme is starting to show early signs of success.
The Group’s assets continued to grow at a healthy rate increasing from P3.16B to P3.64B. BDC will continue to leverage this asset base as it seeks growth in the coming years.During this financial year, the Corporation took a deliberate decision to cease new funding until the new Business Model was fully implemented and as a result no new projects were funded in the year under review. The Corporation will ramp up new funding, starting in January 2015.
THE JOURNEY AHEAD
The coming year will be a Transition Year for the Corporation as we introduce and bed-down many of the changes that will be necessary for the Corporation to achieve long term success.
Ultimately, we will create and nurture a new culture at BDC. A culture based on integrity, high performance, commercial acumen, and sustainability.
The journey will be challenging and as always we look forward to working with the Board, shareholder, and the business community on the important and urgent task of transforming BDC into a profitable and sustainable development finance institute.
Mr B GaetsaloeManaging Director

BDC Annual Report 2014 17
INTEGRATED REPORT
THE CORPORATION
Legal Persona
Botswana Development Corporation Limited, the
“Corporation” or “BDC”, incorporated in 1970, is a state
owned enterprise, with separate legal persona, distinct
from its members and employees and all stakeholders.
Incorporated as a private limited company 100% owned by
the Botswana Government, the shareholding and control
is through a delegated Ministry. Since incorporation, the
Ministry of Finance and Development Planning had the
oversight responsibility, which continued until January
2013 when the Ministry of Trade and Industry assumed the
shareholder’s oversight role.
About the Corporation
In terms of its mandate, the Corporation provides equity
and debt finance as well as short-term working capital
primarily to start-up entrepreneurs but also to other
corporates that can benefit from a financier which has
the balance sheet, resources and processes sufficiently
robust to understand their business and support them
in their pursuit of success. To date the market niche for
these products and services has been predominantly in
property development and management, manufacturing
industries, agro-based large scale processing as well as in
the service and hospitality industries.
THE BDC BRAND
BDC has a strong brand that has developed over the
past 44 years. Our Corporate Brand values: enterprising,
collaboration and integrity are a benchmark to measure
the behaviour and performance of the Corporation and
its employees. Employees measure themselves against,
and are in turned measured by, their adherence to these
values.
Our logo is a graphic representation of who we are, and
the important role we play as a development finance
institution.
The BDC logo depicts four “pillars“ of Botswana
Development Corporation Limited, encompassing a
“round table.“
The “pillars“ represent the Corporation’s continued
support of local and foreign investors through providing
financial support to commercially viable projects, for the
benefit of Botswana’s economic development.
The pillars therefore firmly position BDC as
a commercial and industrial development
agency that occupies a central and
responsible position in Botswana.
The “round table” – a universal
symbol of discussion and
negotiation – reinforces
BDC’s commitment
to forging viable
partnerships and
cementing
lasting

relationships in order to improve the quality of life. This
underpins the Corporation’s brand values and promise.
A Brand Promise is an extension of the mandate of a brand.
The BDC’s Brand Promise is “To promote and facilitate
economic development for Botswana” through:
Providing financial assistance to investors with
commercially viable projects that:
• Pioneer new industries
• Unlock value in existing industries
• Stimulate private sector growth and linkages
• Drive diversification and exports
• Create significant employment
• Generate wealth from outside the country
The BDC Brand Differentiator, “Your Investment
Partner,” puts emphasis on the mutual cooperation and
responsibility of both the Corporation and its stakeholders
towards a sphere of common interest. It positions BDC as
the leader in equity investments and as an agency that is
worthy of its stakeholders’ trust to improve their quality
of life.
BDC TRANSFORMATION OVERVIEW
In August 2013, BDC appointed KPMG to review and
analyse its business model. By benchmarking it against
similar institutions both regionally and globally
and to recommend a new business model based on
BDC’s mandate, governance structures, risk appetite,
sustainable growth potential and overall performance. The
consultants were also asked to provide a high level scope,
budget and timeline for the successful implementation of
their recommended business model.
The internal analysis required the project team to engage
with key BDC stakeholders as well as review relevant
documentation from BDC in order to understand the
issues and challenges with the business model. The
review was conducted across seven areas of the business:
Strategy, Operating Model, Organisational Design,
Financial Structuring, Legal, Risk and Governance.
A benchmarking review critically evaluated four
development financial institutions in order to benchmark
leading practice and compared BDC to these organisations.
The organisations reviewed were: Industrial Development
Corporation (South Africa), Brazilian Development Bank,
Business Development Bank of Canada and Malaysian
Industrial Development Finance Berhad.
An important finding from the analysis was that BDC’s
mandate was still relevant but that there were issues
when it came to putting the mandate into operation. The
consultants proposed three future state Target Operating
Models for BDC which would address these issues.
After assessing each option, BDC selected its preferred
future state operating model – to be a Niche Development
Finance Institute. The Business Model Review was then
completed by developing a high level scope, budget and
timeline for its implementation.
In May 2014, BDC appointed a Transformation Manager
to work with consultants in the implementation of the
selected Business Model. This initiative was done under
the auspices of a project dubbed the “Business Re-
Modelling” project. The project focused on addressing
two critical platforms: a financial review and balance
sheet restructuring; and organisational restructuring.
In addition, five foundational building blocks - Risk
Management, Governance, Legal Agreements and
Frameworks, Operational Strategy and Capabilities and
Processes, were identified and addressed during the
Business Model Implementation.
The project will be completed in October 2014, ushering
in the #NewBDC.
OUR PERFORMANCE
The Corporation’s performance is evaluated against
key Corporate Governance requirements from a triple
bottom line perspective, encompassing social, economic
and environmental considerations and progress made
during the financial year. The purpose of this is to ensure
that all stakeholders gain a better understanding of the
governance systems and processes that the Board of
Directors deploy to control and manage the affairs or the
Corporation and the BDC Group as a whole.
The Board and Management of the Corporation recognise
that they have a duty to make an informed assessment
of the sustainability of the Corporation’s business
before investing the
BDC Annual Report 2014 19
C continued to pay close attention to Risk and the
mitigation and management of acceptable business
risks. BDC is continually exposed to a spectrum of risks
as part of its daily business operations. It is therefore a
business imperative that there is a full understanding and
management of current and prospective risks.
Towards the end of June 2014, BDC started to develop a new
Risk Management Policy and Framework (RMPF). The new
RMPF was aimed at building a holistic framework which
would allow the Corporate to more effectively assess,
quantify, monitor and control risk all with an appropriate
governance structure.
An overview of the inter-relationships between the
principle components of this risk management framework
are outlined in the diagram below:
Figure 1: Principle Elements of the Risk Management
Framework
The Risk Management framework aims to ensure that
risks are managed in a co-ordinated, comprehensive
and systematic manner that is line with BDC’s corporate
mandate, national legislation and is consistent with
internationally accepted standards and guidelines.
This framework regulates all risk management initiatives
and activities, and facilitates their alignment with the
strategic and operational objectives to ensure that the
risks threatening the achievement of BDC’s objectives are
adequately and effectively managed at acceptable levels.
Three Lines of Defence Philosophy
BDC follows a “three lines of defence” philosophy which
defines the roles of line management, support functions
and internal and external functions in relation to the risk
management process. A high level outline of this philosophy
is outlined in the table below:
Corporation’s ultimate beneficiaries’ equity. The Board
is also aware that the ultimate beneficiaries of the
Corporation are the more than two million citizens of
Botswana, and all other stakeholders.
This report therefore forms part of the non-financial
information essential for integrated reporting, to assist the
ultimate beneficiaries regarding who runs the Corporation’s
operations, how it is run, how it makes its money, how it
deals with its customers and how it adds value to society,
the environment and the economy.
BUSINESS DEVELOPMENT AND PORTFOLIO OVERVIEW
During the review period, Business Development reflected
on its portfolio and specific strategic actions were
formulated to address key areas of the portfolio that were
a source of concern. The biggest concern was the non-
performance and poor performance of a proportion of
the portfolio. Business Development adopted a strategic
operational plan which was aimed at reappraising the
entire portfolio with the view to making project-by-
project decisions on key issues identified during the re-
appraisal exercise. Bold decisions had to be taken on
some projects given the results of the reappraisal.
The division also embarked on a ‘’crisis
response plan’’ strategy which
was put in place after the
adoption of the new BDC
strategy.
The crisis response strategy
was multi-faceted. Business
Developments proposed
the divestment from assets
that were not aligned to the
current organisational strategy.
The Corporation is focusing
and realigning its strategy to its
mandate and hence focuses on
transformational projects that
pioneer and turn industries and sectors
around. The Corporation’s position is that it will no longer
play a role in industries and sectors that are deemed to be
mature in order to avoid crowding out the private sector,
especially where it is proven that private companies can
play competently. The criteria on divestment were based
on this principle. Companies that were considered to not
be performing to desired levels were to be subjected to a
“turnaround plan.”
CORPORATE SOCIAL RESPONSIBILITY
In the period under review, the Corporation did not
undertake any major Corporate Social Responsibility
(CSR) projects due to the Re-Modelling exercise which
also involved a review and update of the CSR policy. The
Corporation however, engaged in ad hoc donations and
sponsorships to support communities in which we operate.
BDC’s revised CSR approach is premised on the following:
• The need to align the CSR Policy to the Corporation’s
business strategy, objectives, vision, mission, and
values.
• The need to align the CSR Policy to best practice
standards with regard to the BDC mandate,
management, operation, budget, administration and
reporting structures.
• The need to clearly define how the CSR budget is
allocated and distributed towards deserving projects,
donations and sponsorships and how these fit into the
overall BDC Corporate strategy.
• By using greener practices and helping entrepreneurs
to do the same.
THE ENVIRONMENT
We are determined that as we pursue the Corporation’s
business, we, together with our partners, shall preserve
what nature has offered to the inhabitants of planet earth.
We understand that a healthy environment is a necessary
condition for individuals, communities, businesses
and economies to thrive. We view environmental
stewardship both as an important responsibility
and as an opportunity to bring our
knowledge and resources to bear on
initiatives that will shape the
future for our business, the
global economy and
society.
Therefore we have to
take every opportunity
to make a difference and
to reduce environmental
degradation. This is a priority
for our organisation because we
also understand that as a financial
institution, the Corporation will not
directly participate in the operations
of projects which may have negative
impact on the environment’s scarce
natural resources. However, it is possible that projects we
finance might.
In short, we endeavour to support environmentally
beneficial projects and refuse those that do harm. We seek
to give priority to and support entrepreneurs who create
and use clean technologies as well as renewable energy
companies. Our property portfolio, including our new Head
Office, will be designed to ensure we manage energy and
other resources used.
Through our continuous monitoring of projects and
through independent Boards of entities that we invest
in, the Boards of the BDC Group of companies continually
ensure that minimising environmental impact is an essential
component of policy frameworks.
20 BDC Annual Report 2014
The Corporation will continue to report in a candid manner
the performance of entities that we have invested in which
have the potential to impact the environment and need
to be carefully managed. At present, the Corporation has
interests in entities that, by the nature of their business,
would be so characterised.
Ultimately, we believe that when we help our subsidiaries
and clients develop business strategies that take
advantage of green opportunities and reduce the adverse
environmental impacts of their business, we help to build
the foundation for a sustainable future.
OUR SOCIETY
All citizens expect the Corporation and its sister companies
and partners to fulfill their critical role of promoting and
supporting present and future entrepreneurs. Similarly
it is expected that we are accountable and transparent
while doing so. The BDC team understands that it should
continuously apply good business judgment, guided by
high ethical business practices as qualified, motivated
employees engaged to provide entrepreneurs with
high-quality service at all times. We work to fulfill these
expectations in a variety of ways. The proof is reflected
in the trust our customers, our Board of Directors and
National leaders afford us. However, we understand that
we have to earn their trust.
We have a responsibility to do our job and deliver on our
obligations in ways that engender the trust and approval
of both the Botswana and global society. While ensuring
that our business partners are proud to be associated with
us. In striving to achieve this, we continuously monitor our
attitudes towards:
• Good governance
• Responsible Corporate Citizenship and business
practices
• The workplace we create
Our mandate was handed down by the Botswana
Parliament: our officials are accountable to an independent
Board of Directors, who are in turn accountable, through
the Minister of Trade and Industry, to Parliament, and
ultimately to Botswana citizens. This means that we have
structured accountability. At the end of the day, we are
entrusted with the mandate and therefore responsible
to every citizen. We also need and expect the society to
hold us to our mandate and to demand high standards in
everything we do.
In pursuing our mandate, our Shareholder and our Board
of Directors demand of our people an understanding that
how we seek to do business and project ourselves are
as important as the business we do – hence the need to
always uphold our Corporate Values. At BDC we promise to:
• Do business with professionalism and display the
highest levels of ethics and adhere to standards;
uphold Integrity; and act in a fair and honest manner
in our dealings with internal and external stakeholders
• Ensure that because our Stakeholders have dynamic
needs, we shall continuously innovate and through
team work, guarantee delivery on all our promises
• Always be customer centric, enthusiastic and
committed when dealing with our customers,
stakeholders and colleagues.
OUR HUMAN CAPITAL
The Corporation underwent a major restructuring process
in the year under review. This project was aimed at ensuring
that the organisational structure, job profiles, salary
structure and other strategic human capital management
tools are aligned to the vision of the new BDC. This was done
to ensure that the Corporation has the necessary capacity,
in terms of human capital, to deliver on its mandate.
As part of the restructuring exercise, there were,
regrettably, some job losses. This was consistent with the
decisions taken to reposition the business – ensuring that
it rebuilds itself into a position of strength and resilience.
A degree of right sizing was therefore an imperative. The
Corporation carried this out with the seriousness and
sensitivity it required.
The Corporation continues to enjoy a positive
labour relations environment. During this
reporting period, the staff members
registered a Trade Union (Botswana
Development Corporation Staff Union)
and the Corporation recognised it within a
very short period of time. The parties look
forward to having a collaborative and
mutually beneficial relationship.
On the human capital development
front, the Corporation has been taking
advantage of the special relationships
it has built among its sister companies
within the SADC region. A number of
BDC Annual Report 2014 21
employees have spent time at these organisations giving
them the necessary exposure to acquire the skills and
competencies needed in the new BDC. This will continue
during the next financial year.
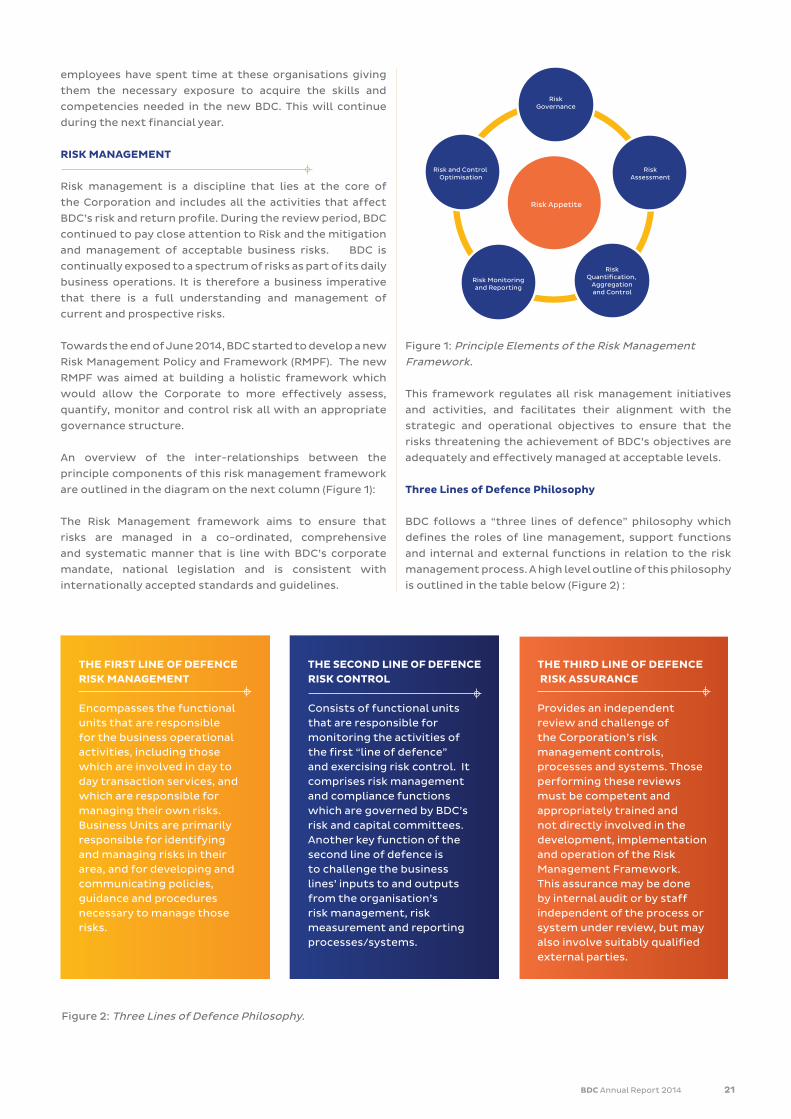
RISK MANAGEMENT
Risk management is a discipline that lies at the core of
the Corporation and includes all the activities that affect
BDC’s risk and return profile. During the review period, BDC
continued to pay close attention to Risk and the mitigation
and management of acceptable business risks. BDC is
continually exposed to a spectrum of risks as part of its daily
business operations. It is therefore a business imperative
that there is a full understanding and management of
current and prospective risks.
Towards the end of June 2014, BDC started to develop a new
Risk Management Policy and Framework (RMPF). The new
RMPF was aimed at building a holistic framework which
would allow the Corporate to more effectively assess,
quantify, monitor and control risk all with an appropriate
governance structure.
An overview of the inter-relationships between the
principle components of this risk management framework
are outlined in the diagram on the next column (Figure 1):
The Risk Management framework aims to ensure that
risks are managed in a co-ordinated, comprehensive
and systematic manner that is line with BDC’s corporate
mandate, national legislation and is consistent with
internationally accepted standards and guidelines.
This framework regulates all risk management initiatives
and activities, and facilitates their alignment with the
strategic and operational objectives to ensure that the
risks threatening the achievement of BDC’s objectives are
adequately and effectively managed at acceptable levels.
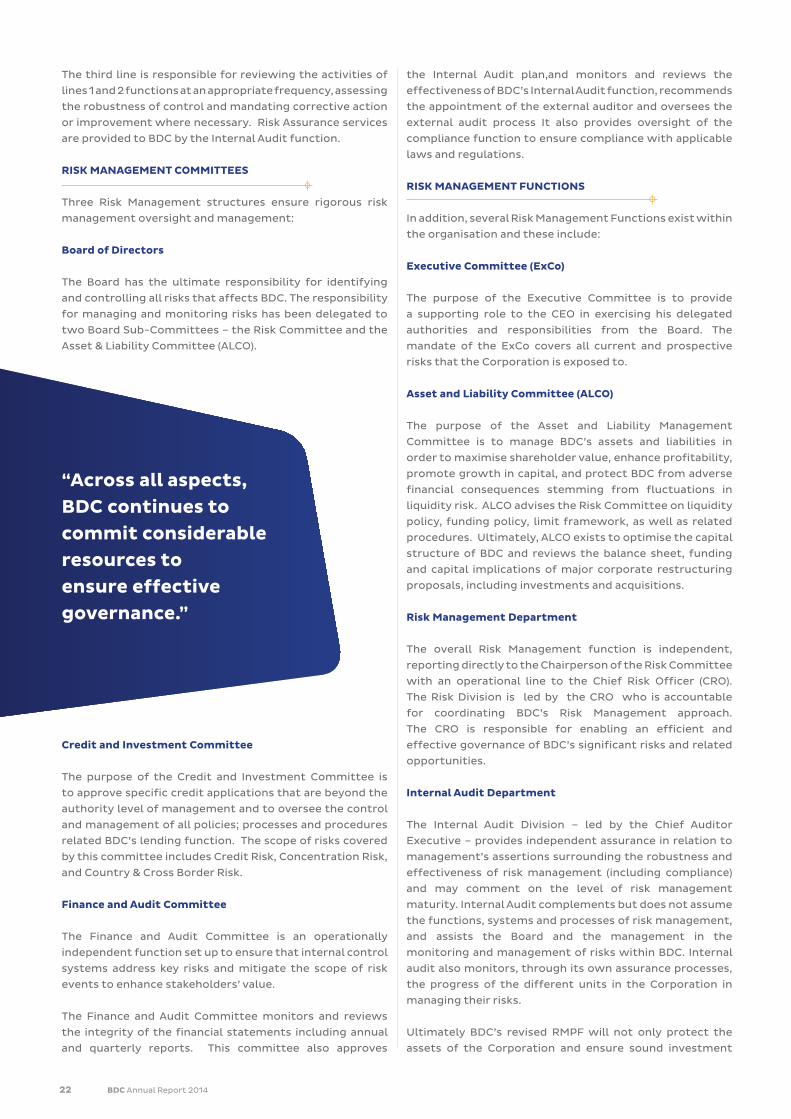
Three Lines of Defence Philosophy
BDC follows a “three lines of defence” philosophy which
defines the roles of line management, support functions
and internal and external functions in relation to the risk
management process. A high level outline of this philosophy
is outlined in the table below (Figure 2) :
THE FIRST LINE OF DEFENCERISK MANAGEMENT
Encompasses the functional units that are responsible for the business operational activities, including those which are involved in day to day transaction services, and which are responsible for managing their own risks. Business Units are primarily responsible for identifying and managing risks in their area, and for developing and communicating policies, guidance and procedures necessary to manage those risks.
THE SECOND LINE OF DEFENCE RISK CONTROL
Consists of functional units that are responsible for monitoring the activities of the first “line of defence” and exercising risk control. It comprises risk management and compliance functions which are governed by BDC’s risk and capital committees. Another key function of the second line of defence is to challenge the business lines’ inputs to and outputs from the organisation’s risk management, risk measurement and reporting processes/systems.
THE THIRD LINE OF DEFENCE RISK ASSURANCE
Provides an independent review and challenge of the Corporation’s risk management controls, processes and systems. Those performing these reviews must be competent and appropriately trained and not directly involved in the development, implementation and operation of the Risk Management Framework. This assurance may be done by internal audit or by staff independent of the process or system under review, but may also involve suitably qualified external parties.
Risk Appetite
Risk and Control Optimisation
RiskGovernance
RiskAssessment
Risk Monitoringand Reporting
RiskQuantification,
Aggregationand Control
Figure 1: Principle Elements of the Risk Management Framework.
Figure 2: Three Lines of Defence Philosophy.
22 BDC Annual Report 2014
The third line is responsible for reviewing the activities of
lines 1 and 2 functions at an appropriate frequency, assessing
the robustness of control and mandating corrective action
or improvement where necessary. Risk Assurance services
are provided to BDC by the Internal Audit function.
RISK MANAGEMENT COMMITTEES
Three Risk Management structures ensure rigorous risk
management oversight and management:
Board of Directors
The Board has the ultimate responsibility for identifying
and controlling all risks that affects BDC. The responsibility
for managing and monitoring risks has been delegated to
two Board Sub-Committees – the Risk Committee and the
Asset & Liability Committee (ALCO).
Credit and Investment Committee
The purpose of the Credit and Investment Committee is
to approve specific credit applications that are beyond the
authority level of management and to oversee the control
and management of all policies; processes and procedures
related BDC’s lending function. The scope of risks covered
by this committee includes Credit Risk, Concentration Risk,
and Country & Cross Border Risk.
Finance and Audit Committee
The Finance and Audit Committee is an operationally
independent function set up to ensure that internal control
systems address key risks and mitigate the scope of risk
events to enhance stakeholders’ value.
The Finance and Audit Committee monitors and reviews
the integrity of the financial statements including annual
and quarterly reports. This committee also approves
the Internal Audit plan,and monitors and reviews the
effectiveness of BDC’s Internal Audit function, recommends
the appointment of the external auditor and oversees the
external audit process It also provides oversight of the
compliance function to ensure compliance with applicable
laws and regulations.
RISK MANAGEMENT FUNCTIONS
In addition, several Risk Management Functions exist within
the organisation and these include:
Executive Committee (ExCo)
The purpose of the Executive Committee is to provide
a supporting role to the CEO in exercising his delegated
authorities and responsibilities from the Board. The
mandate of the ExCo covers all current and prospective
risks that the Corporation is exposed to.
Asset and Liability Committee (ALCO)
The purpose of the Asset and Liability Management
Committee is to manage BDC’s assets and liabilities in
order to maximise shareholder value, enhance profitability,
promote growth in capital, and protect BDC from adverse
financial consequences stemming from fluctuations in
liquidity risk. ALCO advises the Risk Committee on liquidity
policy, funding policy, limit framework, as well as related
procedures. Ultimately, ALCO exists to optimise the capital
structure of BDC and reviews the balance sheet, funding
and capital implications of major corporate restructuring
proposals, including investments and acquisitions.
Risk Management Department
The overall Risk Management function is independent,
reporting directly to the Chairperson of the Risk Committee
with an operational line to the Chief Risk Officer (CRO).
The Risk Division is led by the CRO who is accountable
for coordinating BDC’s Risk Management approach.
The CRO is responsible for enabling an efficient and
effective governance of BDC’s significant risks and related
opportunities.
Internal Audit Department
The Internal Audit Division – led by the Chief Auditor
Executive – provides independent assurance in relation to
management’s assertions surrounding the robustness and
effectiveness of risk management (including compliance)
and may comment on the level of risk management
maturity. Internal Audit complements but does not assume
the functions, systems and processes of risk management,
and assists the Board and the management in the
monitoring and management of risks within BDC. Internal
audit also monitors, through its own assurance processes,
the progress of the different units in the Corporation in
managing their risks.
Ultimately BDC’s revised RMPF will not only protect the
assets of the Corporation and ensure sound investment
“Across all aspects, BDC continues to commit considerable resources to ensure effective governance.”

BDC Annual Report 2014 23
decisions, but will also drive a new culture of accountability
and integrity.
GOVERNANCE FRAMEWORK
Strong and sustainable corporate performance cannot be
achieved without sound governance. Across all aspects,
BDC continues to commit considerable resources to ensure
effective governance, recognising that we are stewards
for our shareholder, our clients, our people and our
communities.
From June 2013 through June 2014, the BDC Board
engaged independent consultants, as part of the Business
Model Review project, to conduct extensive internal and
external stakeholder engagements in order to solicit their
views about the Corporation’s governance structures.
The ultimate objective of this was the designing a new
governance framework that will ensure sustainability of
the Corporation. A new governance framework, which
includes a new Governance Policy, a revised Board Charter, a
revamped and robust Delegation of Authority Policy with its
Authority Arrangements, and a Shareholder Compact have
been developed and approved, and the implementation
thereof has commenced. The key principles of the new
governance framework include:
• To ensure that there is clarity and proper translation
of the Corporation’s mandate by all stakeholders and
those charged with the responsibility of guiding the
Corporation.
• To enforce division of responsibilities so that there is
role clarity between those charged with the customer
relations responsibilities and those who have to
enforce the obligations that go with that relationship.
• To develop an environment wherein those charged with
governance and assurance have both the obligations
and conditions to perform their duties.
• To improve the Corporation’s financial governance
which will result in improving the Corporation’s
fund raising capability and ability to compete in the
market by providing its full services with competitive
packages.
• To strengthen the BDC Group governance framework
that will ensure that the companies in which BDC
invests are self-sufficient and structured to be able to
compete in their own right
• To enhance the Corporation’s risk management
framework to ensure that the Corporation is able to do
business by taking opportunities where it should but
continuously managing risk.
Our Commitment to Good Governance
We prefer to approach the governance of the Corporation
and everything around it as a foundation of a well - run
company, embodying principles and commitments
that share fundamental aspirations: increasing value
for shareholders, promoting valued service to clients,
managing risks, and making lasting contributions to the
communities where we do business.
• Successful governance for the Corporation is a vibrant
process that involves the diversity of our businesses,
the global nature of our partners, and the rapidly
changing needs of our clients.
• We are conscious of the fact that quality governance
starts at the very top, the Board. For that reason
eight of our Board members are independent from
management. Mr Blackie Marole, an independent Non-
Executive Director, chairs the Board.
• Profiles and relevant details of all current members of
the Board and independent members are set out on
page 10-11 of this report.
Shareholder Engagement
The Board Chairman, Board members and management
continued to engage with the Shareholder throughout the
year to ensure that at all times there is alignment between
the Shareholder vision about the Corporation and the Board
and Management execution of that vision. To augment the
continuous engagement and reporting to the shareholder,
the Board has approved a Shareholder Compact between
the Botswana Government and BDC not only to introduce
performance contracting as an instrument for monitoring
performance, but also to ensure that the parameters of the
relationship between the Shareholder and BDC articulate
the shareholder’s expectations, set performance targets,
monitor and evaluate performance and confirm the
“These independent control functions ensure that we meet the control and reporting obligations required of a self-regulated financial institution such as BDC.”
24 BDC Annual Report 2014
performance targets as indicated in the Strategic Plan and
Business Plan of BDC.
Independent Oversight
• The Board executes independent oversight over areas
of risk to our business including the performance of
our senior management team, succession planning,
compensation issues, and overall business strategy.
• The Board also receives input from employees working
in areas that include Risk management, Financial
Accounting, Legal, Information Management and
Internal Audit to name a few. These employees work in
the “control” side of BDC and make up about half of the
Corporation’s staff compliment.
• The primary goal of all these independent control
functions is to ensure that we meet the control and
reporting obligations required of a self-regulated
financial institution such as BDC.
• Our credit risk professionals are independent of the
revenue producing sides of our businesses. They are
expected to evaluate the potential for loss due to
counter party default and to seek to mitigate risk
though limits, collateral, hedging and other techniques.
• Our Group Internal Audit professionals are independent
of the management activities of the Corporation
and report to the Board through the Board Audit
Committee.
Governance and Internal Control Systems
• The Board is confident that following the
implementation of the reviewed Business Model,
the Corporation has robust policies, systems and
procedures that provide reasonable assurance in
safeguarding assets; preventing and detecting errors;
and accuracy and completeness of management
information, accounting records and reliability of
financial statements.
• The internal checks serve management and the Board by
performing independent evaluations of the adequacy
and effectiveness of financial reporting mechanisms,
records, and operations as well as protecting the
interests of the Corporation.
Governance at Subsidiaries.
In line with good business practice, the Board of the
holding company has vested the control and direction of its
subsidiaries, set up as separate legal entities, in the Boards
that it appoints directly or through Management.
In order to ensure that there is a clear separation of roles and
to avoid any inherent conflict of interest, the Corporation
appoints independent Non-Executive Directors in subsidiary
Boards, and a few of its personnel participate in the Boards
of those companies.
In the governance and direction of subsidiaries, the Boards
of those subsidiaries are expected to follow the same
principles of good corporate governance and best practice
as those of the Corporation.
IT Governance
Information systems in 21st century enterprises are all
pervasive, no longer used only to enable a company to
work more efficiently. They are now the very heart of the
enterprise.
BDC is acutely aware of the critical role played by
information systems and as a result, ours are being aligned
with the long-term strategy of the Corporation.
Information Management is central to effective IT
Governance, especially as it relates to Information Security.
The Information Technology department is an integral part of
business process management within BDC. The Department
continually reviews the security policies and procedures
that represent the foundation for BDC’s information
security program. The information security policies serve
as overarching guidelines for the use, management, and
implementation of information security. The IT department
also tests and enforces the internal controls to provide
a system of checks and balances intended to identify
irregularities, prevent waste, fraud or abuse, and assists
in resolving discrepancies that are accidentally introduced
in the operation of day to day business. Furthermore, in
order to sustain reliability and efficiency of the IT services
the Department maintains an upgraded schedule to keep
the Corporation’s infrastructure in tune with the latest
technology. The Department also maintains robust security
solutions by installing internationally recommended
firewall solutions, as well as proactive end point protection.
BDC Annual Report 2014 25
Board Governance
The Corporation has a unitary Board structure appointed
by the Shareholder which also appoints Chairman and the
Managing Director. The unitary structure enables the Board
to obtain the desired level of objectivity and independence
in Board deliberations and decision-making. The Board is
assisted by four Board Committees.
Delegation of Authority
In the interest of promoting efficiency and effective
management, the Board has delegated some of its authority
to its Committees and Management. Despite this, the
Board understands that it still retains accountability and
liability for its delegated authority. The Board has therefore
put in place internal control and internal audit mechanisms
to ensure the proper discharge of the delegated authority.
COMMITTEES OF THE BOARD
The Board performs its overall oversight on the
Corporation and Management’s activities by reviewing
reports from Management and its auditors through its
normal meetings and in detail through its Sub-
Committees as set out below:
Board Finance and Audit Committee
The overall objectives
of the Board Finance
and Audit Committee are
to monitor the adequacy
of financial controls and
reporting; review audit plans
and adherence to these by
external and internal auditor;
ascertain the reliability of
accounting records; ensure that
financial statements comply with
International Financial Reporting
Standards (IFRS) and the Companies
Act; review and make recommendations on all financial
matters; and recommend the appointment of external
auditors to the Board.
The Board Finance and Audit committee’s role also
includes assisting the Board of Directors in discharging its
responsibilities in relation to audit; finance and corporate
governance; and to enhance the credibility and objectivity
of BDC’s financial reporting. This Committee considers
any matters relating to the financial affairs of BDC and its
controlled entities. It also considers matters concerning
BDC’s Internal and External Audit as well as taking account
of reports by management and Auditors on financial,
business and strategic risk issues. The Committee also
monitors BDC’s appetite for risk and mitigating controls.
Board Human Capital Committee
The Committee assists the Board in the development of
Human Capital strategies, plans and performance goals,
as well as specific compensation levels for BDC. The
Committee annually manages the Board’s evaluation of the
performance of the Managing Director and also assists the
Board in fulfilling its oversight responsibilities relating to
succession planning as well as overall compensation and
human resource policies for all BDC employees.
Board Tender Committee
Central to the Committee’s key consideration in
procurement is a continued effort to promote citizen
economic empowerment, both through development of
policies to guide the bigger picture as well as the taking
of deliberate decisions that promote citizen economic
empowerment in awarding contracts
Board Risk and Investment Committee
The Committee was formed and constituted
subsequent to the end of the financial year. The
Committee’s main role is to ensure effective
management of the risk function within
BDC; outline the scope of risk
management; review and assess
the integrity of the risk
control systems; ensure
that the risk policies and
strategies are effectively
managed; provide
independent and objective
oversight; evaluate credit and
investment risk; and review and
approve or make recommendations
on new investments and financing.
Its mandate as well as approval limits
will be determined during the course of
the current financial year.
Board Performance and Emoluments
The Corporation recognises the need and importance of
attracting and retaining competent Directors to drive
the Corporation’s mandate, and efforts are underway to
establish a compensation mechanism that will achieve this.
Nevertheless, as a 100% Government-owned entity, the
Corporation complies with the government directives that
control the payment of fees to Directors.
In accordance with the Corporation’s Board Charter,
Directors made efforts to attend all meetings of the
26 BDC Annual Report 2014
Board and its Committees. In line with best practice,
non-executive Directors met at least once without the
Executive Director and Management being present.
At present, Directors are paid a seating allowance at the
prevailing rates issued by the shareholder from time to
time. During the review period, seating allowances were
paid at P840 for Directors and P1, 050 for Chairperson of
the Board as well as Chairpersons of each Board Committee,
both amounts being net of withholding tax.
Board members are also paid the equivalent of a seating
allowance for any other official engagements that they are
involved in. Fees for civil servants who also serve on the
Board are payable directly to the Botswana Government.
Consequently, all fees for both S.M Sekwakwa and B.K
Molosiwa were paid to the Botswana Government.
Statement of Compliance
The Board is satisfied that every effort is being made to
comply in all material respects with all principles of good
governance, as set out in the King III Corporate Governance
Code and the Companies Act 2003, as well as the principles
as set out in the proposed Corporate Governance Code for
Botswana, as issued by the Directors’ Institute of Botswana.
The Corporation’s compliance is further verified by the
various assurance providers including the Internal and
External Auditors and the ISO9001:2008 Quality Auditors.
INTERNAL AUDIT
Governance Assurance and Internal Audit
While it is understood that the Board of Directors has
overall responsibility for assuring that there is robust
control and governance throughout the organisation at
all times and to ensure there is also conformance and
compliance to the Corporation’s policies and procedures as
well as compliance to other external requirements and best
practice, the Board will be unable to provide such assurance
without an effective internal assurance that is provided by
the internal audit function.
Recognising this, the BDC Board established an independent
internal audit function, whose mandate is established
through an internal audit charter based on the Botswana
Code on Corporate Governance, King III as well as the
professional standards as pronounced by the Institute of
Internal Auditors Incorporated, globally.
In line with best practice, the head of Internal is accountable
to the Board of Directors through the Board Audit
Committee, while also recognising the administrative
responsibility to the Chief Executive.
The Board Audit Committee monitors the adequacy
and effectiveness of the internal audit function by
recommending the appointment of the Group Internal
Auditor, a position that has subsequently been renamed
Chief Audit Executive, approving and reviewing execution
of the Internal audit plans as well as the Internal audit
reports to the Board.
The Board Audit committee and the Board of Directors at
all times seek to ensure promotion of an effective Internal
Audit function. To that end the Corporation’s Chief Audit
Executive is regarded as central to strategy planning,
execution, monitoring and assurance and is a key contributor
to the achievement of strategy and an objective provider of
assurance on the Corporation’s mandate.
The Board Audit Committee has oversight over the internal
auditor who in turn has open access to the Chairman of the
Audit Committee and the Chairman of the Board.
The Board recognises that Internal Audit is central to
the combined assurance provided by Internal Audit and
external auditors, which are both especially important for
a Non-Executive Director.
Therefore the Internal Audit function provides a helicopter
view of and audit assurance to the holding company as well
as to the minority interests, to the extent that they may not
have their own Internal Audit assurance. The Board through
the Board Audit Committee ensures that swift and decisive
action is taken especially on significant issues reported by
Internal Audit.
Tip-Offs Anonymous
Internal Audit oversees and provides liaison between the
Corporation’s structures and an independent 24 hours
anonymous tip-off Service
The service forms part of the mechanisms that assist the
Corporation in fraud and corruption deterrence as well as
detection. The Corporation in turn has a Whistle-blowers’
Protection Policy to support the service by ensuring that
whistle-blowers are both protected and are afforded fair
treatment in dealing with any alleged reports.
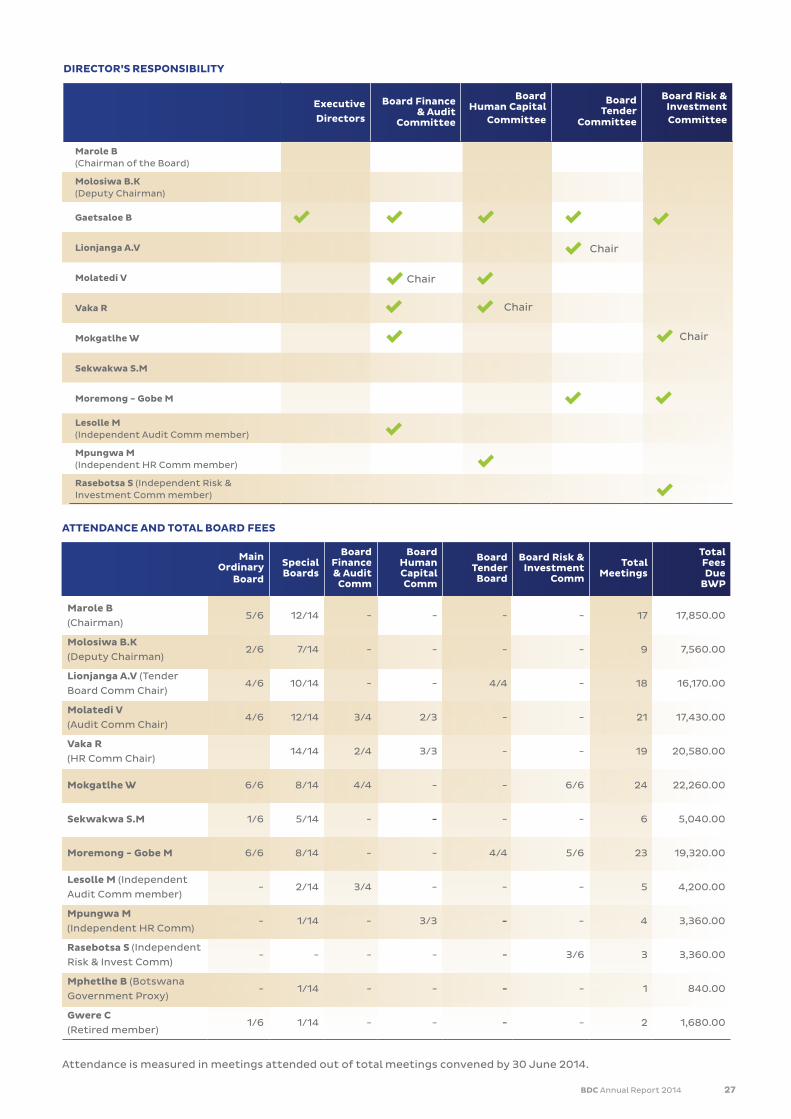
BDC Annual Report 2014 27
ExecutiveDirectors
Board Finance & Audit
Committee
BoardHuman Capital
Committee
BoardTender
Committee
Board Risk & InvestmentCommittee
Marole B(Chairman of the Board)
Molosiwa B.K(Deputy Chairman)
Gaetsaloe B
Lionjanga A.V
Molatedi V
Vaka R
Mokgatlhe W
Sekwakwa S.M
Moremong - Gobe M
Lesolle M(Independent Audit Comm member)
Mpungwa M (Independent HR Comm member)
Rasebotsa S (Independent Risk & Investment Comm member)
Chair
Chair
Chair
Chair
ATTENDANCE AND TOTAL BOARD FEES
Main Ordinary
Board
Special Boards
BoardFinance & Audit
Comm
Board Human CapitalComm
Board Tender
Board
Board Risk &Investment
Comm
TotalMeetings
TotalFeesDue
BWP
Marole B
(Chairman)5/6 12/14 - - - - 17 17,850.00
Molosiwa B.K(Deputy Chairman)
2/6 7/14 - - - - 9 7,560.00
Lionjanga A.V (Tender
Board Comm Chair)4/6 10/14 - - 4/4 - 18 16,170.00
Molatedi V(Audit Comm Chair)
4/6 12/14 3/4 2/3 - - 21 17,430.00
Vaka R(HR Comm Chair)
14/14 2/4 3/3 - - 19 20,580.00
Mokgatlhe W 6/6 8/14 4/4 - - 6/6 24 22,260.00
Sekwakwa S.M 1/6 5/14 - - - - 6 5,040.00
Moremong - Gobe M 6/6 8/14 - - 4/4 5/6 23 19,320.00
Lesolle M (Independent
Audit Comm member)- 2/14 3/4 - - - 5 4,200.00
Mpungwa M
(Independent HR Comm)- 1/14 - 3/3 - - 4 3,360.00
Rasebotsa S (Independent
Risk & Invest Comm)- - - - - 3/6 3 3,360.00
Mphetlhe B (Botswana
Government Proxy)- 1/14 - - - - 1 840.00
Gwere C(Retired member)
1/6 1/14 - - - - 2 1,680.00
Attendance is measured in meetings attended out of total meetings convened by 30 June 2014.
DIRECTOR’S RESPONSIBILITY

28 BDC Annual Report 2014
GROUPANNUAL FINANCIAL STATEMENTSFor the year ended 30 June 2014
Directors’ report 30
Directors’ responsibilities and approval of the financial statements 31
Independent auditor’s report 32
Statements of comprehensive income 33
Statements of financial position 34
Statements of cash flows 35
Statements of changes in equity 36
Significant accounting policies 37 - 50
Notes to the financial statements 51 - 77

BDC Annual Report 2014 29
GROUPANNUAL FINANCIAL STATEMENTSFor the year ended 30 June 2014
Directors’ report 30
Directors’ responsibilities and approval of the financial statements 31
Independent auditor’s report 32
Statements of comprehensive income 33
Statements of financial position 34
Statements of cash flows 35
Statements of changes in equity 36
Significant accounting policies 37 - 50
Notes to the financial statements 51 - 77
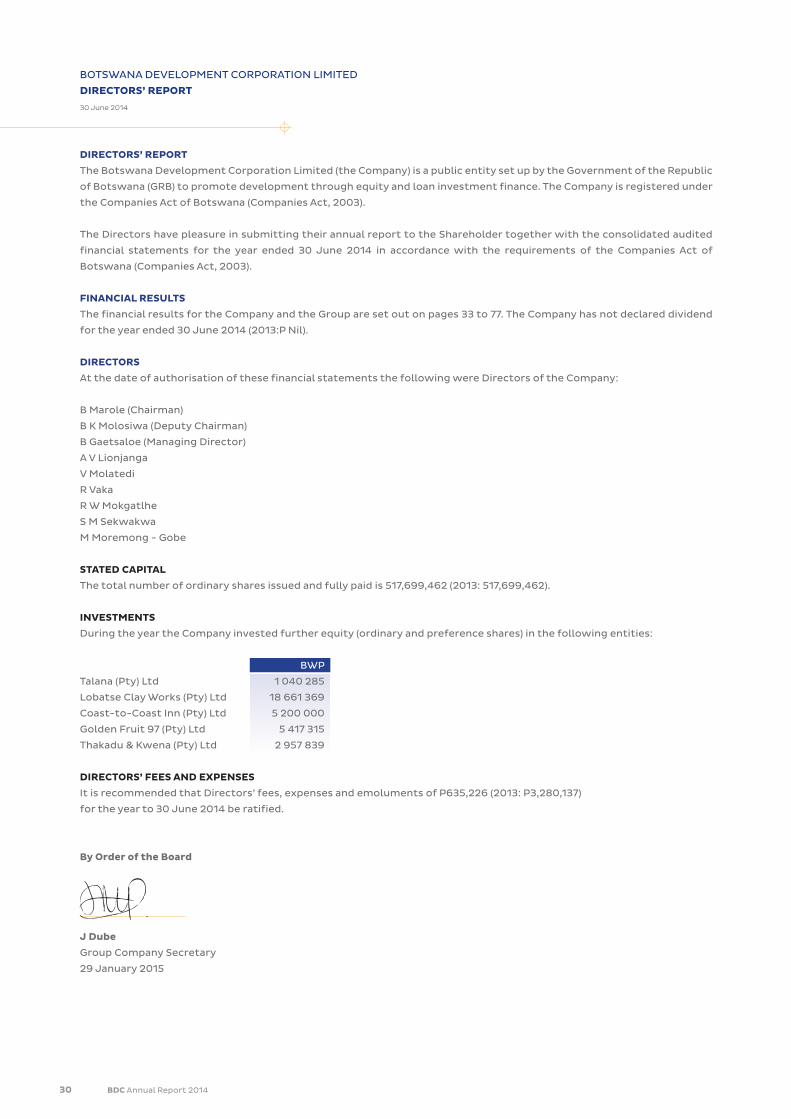
30 BDC Annual Report 2014
BOTSWANA DEVELOPMENT CORPORATION LIMITED
DIRECTORS’ REPORT
30 June 2014
DIRECTORS’ REPORT
The Botswana Development Corporation Limited (the Company) is a public entity set up by the Government of the Republic
of Botswana (GRB) to promote development through equity and loan investment finance. The Company is registered under
the Companies Act of Botswana (Companies Act, 2003).
The Directors have pleasure in submitting their annual report to the Shareholder together with the consolidated audited
financial statements for the year ended 30 June 2014 in accordance with the requirements of the Companies Act of
Botswana (Companies Act, 2003).
FINANCIAL RESULTS
The financial results for the Company and the Group are set out on pages 33 to 77. The Company has not declared dividend
for the year ended 30 June 2014 (2013:P Nil).
DIRECTORS
At the date of authorisation of these financial statements the following were Directors of the Company:
B Marole (Chairman)
B K Molosiwa (Deputy Chairman)
B Gaetsaloe (Managing Director)
A V Lionjanga
V Molatedi
R Vaka
R W Mokgatlhe
S M Sekwakwa
M Moremong - Gobe
STATED CAPITAL
The total number of ordinary shares issued and fully paid is 517,699,462 (2013: 517,699,462).
INVESTMENTS
During the year the Company invested further equity (ordinary and preference shares) in the following entities:
BWP
Talana (Pty) Ltd 1 040 285
Lobatse Clay Works (Pty) Ltd 18 661 369
Coast-to-Coast Inn (Pty) Ltd 5 200 000
Golden Fruit 97 (Pty) Ltd 5 417 315
Thakadu & Kwena (Pty) Ltd 2 957 839
DIRECTORS’ FEES AND EXPENSES
It is recommended that Directors’ fees, expenses and emoluments of P635,226 (2013: P3,280,137)
for the year to 30 June 2014 be ratified.
By Order of the Board
J Dube
Group Company Secretary
29 January 2015
BDC Annual Report 2014 31
BOTSWANA DEVELOPMENT CORPORATION LIMITED
DIRECTORS’ RESPONSIBILITIES AND APPROVAL OF THE FINANCIAL STATEMENTS
30 June 2014
DIRECTORS’ RESPONSIBILITY STATEMENTThe Directors are responsible for the preparation and fair presentation of the Group and Company financial statements of
Botswana Development Corporation Limited (the Company), comprising the statements of financial position as at 30 June
2014 and the statements of comprehensive income, changes in equity and cash flows for the year then ended, and the notes
to the financial statements, which include a summary of significant accounting policies and other explanatory notes in
accordance with International Financial Reporting Standards (“IFRS”).
The Directors are required by the Companies Act of Botswana (Companies Act, 2003) to maintain adequate accounting
records and are responsible for the content and integrity of the financial information included in this report. It is their
responsibility to ensure that the Group and Company financial statements fairly present the state of affairs of the Group
and Company as at 30 June 2014 and the results of their operations and cash flows for the year then ended, in conformity
with IFRS. The external auditors are engaged to express an independent opinion on the Group and Company financial
statements.
The Directors’ are responsible for such internal controls as the Directors determine is necessary to enable the preparation
of financial statements that are free from material misstatement, whether due to fraud or error.
The Group and Company annual financial statements are prepared in accordance with IFRS and are based upon appropriate
accounting policies consistently applied and supported by reasonable and prudent judgments and estimates. The Directors’
responsibility also includes maintaining adequate accounting records and an effective system of risk management as well
as the preparation of the supplementary schedules included in the financial statements.
The Directors acknowledge that they are ultimately responsible for the system of internal financial control established
by the Group and place considerable importance on maintaining a strong control environment. To enable the Directors
to meet these responsibilities, the Board sets standards for internal control aimed at reducing the risk of error or loss in a
cost effective manner. The standards include the proper delegation of responsibilities within a clearly defined framework,
effective accounting procedures and adequate segregation of duties to ensure an acceptable level of risk. These controls
are monitored throughout the Group and all employees are required to maintain the highest ethical standards in ensuring
the Group’s business is conducted in a manner that in all reasonable circumstances is above reproach. The focus of risk
management in the Group is on identifying, assessing, managing and monitoring all known forms of risk across the
Group. While operating risk cannot be fully eliminated, the Group endeavours to minimise it by ensuring that appropriate
infrastructure, controls, systems and ethical behaviour are applied and managed within predetermined procedures and
constraints.
The Directors have made an assessment of the Company’s ability to continue as a going concern and there is no reason to
believe the business will not be a going concern in the year ahead. The Directors are of the opinion, based on the information
and explanations given by Management, that the system of internal control provides reasonable assurance that the financial
records may be relied on for the preparation of the annual financial statements. However, any system of internal financial
control can provide only reasonable, and not absolute, assurance against material misstatement or loss.
The external auditors are responsible for independently reviewing and reporting on the Group and Company financial
statements, which were examined by the external auditors and their report is presented on page 32.
DISCLOSURE OF AUDIT INFORMATIONEach of the Directors at the date of approval of this report confirms that:
• in so far as the director is aware, there is no relevant audit information of which the Group’s and Company’s auditor is
unaware; and
• the Director has taken all the steps that he/she ought to have taken as a Director to make himself/herself aware of
any relevant audit information and to establish that the Group’s and Company’s auditor is aware of that information.
DIRECTORS’ APPROVAL OF THE ANNUAL FINANCIAL STATEMENTSThe Group and Company financial statements set out on pages 33 to 77 which have been prepared on the going concern
basis, were approved by the Board on 29 January 2015 and are signed on its behalf by:
Mr B Marole Ms V MolatediChairman Director
32 BDC Annual Report 2014
INDEPENDENT AUDITOR’S REPORT
TO THE MEMBERS OF BOTSWANA DEVELOPMENT CORPORATION LIMITED
We have audited the accompanying consolidated and separate financial statements of Botswana Development
Corporation Limited, which comprise the consolidated and separate statements of financial position as at 30 June 2014,
and the consolidated and separate statements of comprehensive income, changes in equity and cash flows for the year
then ended, and a summary of significant accounting policies and other explanatory notes, as set out on pages 33 to 77.
DIRECTORS’ RESPONSIBILITY FOR THE FINANCIAL STATEMENTS
The Directors are responsible for the preparation and fair presentation of these financial statements in accordance with
International Financial Reporting Standards and for such internal control as the Directors determine is necessary to enable
the preparation of financial statements that are free from material misstatement, whether due to fraud or error.
AUDITOR’S RESPONSIBILITY
Our responsibility is to express an opinion on these financial statements based on our audit. We conducted our audit in
accordance with International Standards on Auditing. Those standards require that we comply with ethical requirements
and plan and perform the audit to obtain reasonable assurance about whether the financial statements are free from
material misstatement.
An audit involves performing procedures to obtain audit evidence about the amounts and disclosures in the financial
statements. The procedures selected depend on the auditor’s judgement, including the assessment of the risks of
material misstatement of the financial statements, whether due to fraud or error. In making those risk assessments, the
auditor considers internal control relevant to the entity’s preparation and fair presentation of the financial statements
in order to design audit procedures that are appropriate in the circumstances, but not for the purpose of expressing an
opinion on the effectiveness of the entity’s internal control. An audit also includes evaluating the appropriateness of
accounting principles used and the reasonableness of accounting estimates made by the Directors, as well as evaluating
the overall financial statement presentation.
We believe that the audit evidence we have obtained is sufficient and appropriate to provide a basis for our audit opinion.
OPINION
In our opinion, the consolidated and separate financial statements give a true and fair view of the consolidated and
separate financial position of Botswana Development Corporation Limited as at 30 June 2014, and its consolidated and
separate financial performance and consolidated and separate cash flows for the year then ended in accordance with
International Financial Reporting Standards.
Deloitte & ToucheCertified Auditors Practicing Member: F C Els (19980074) Gaborone 16 February 2015
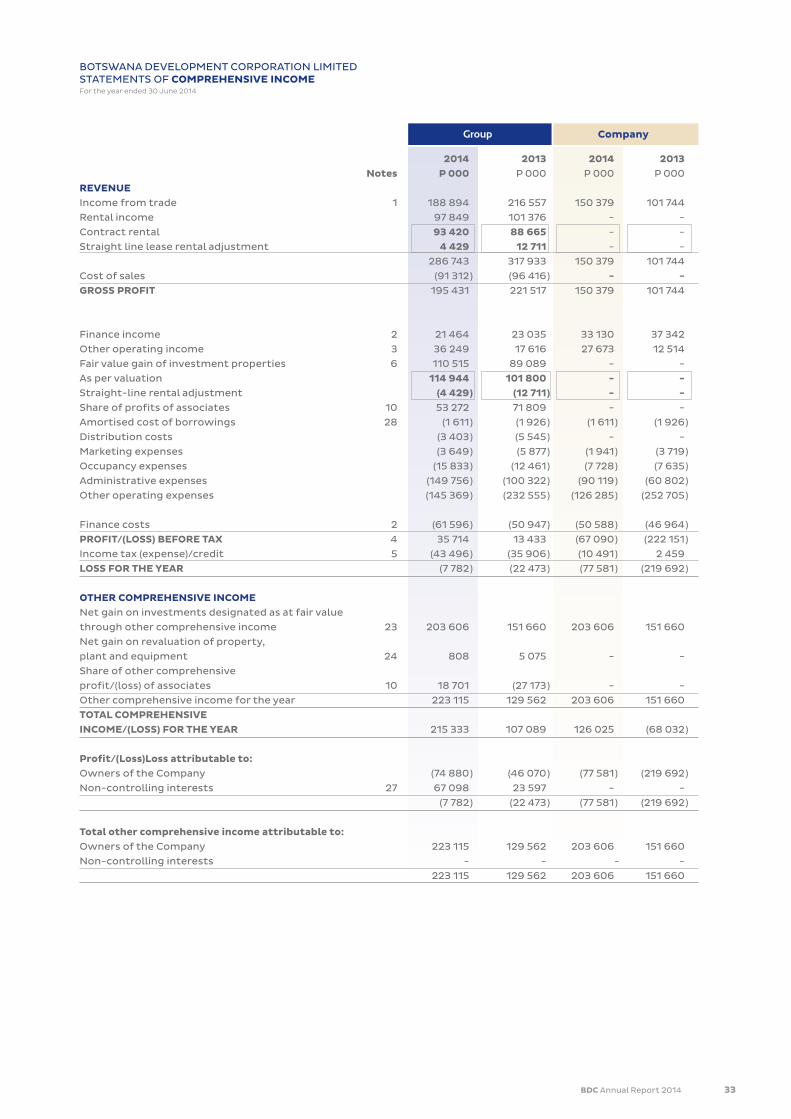
BDC Annual Report 2014 33
2014 2013 2014 2013 Notes P 000 P 000 P 000 P 000
REVENUEIncome from trade 1 188 894 216 557 150 379 101 744
Rental income 97 849 101 376 - -
Contract rental 93 420 88 665 - -
Straight line lease rental adjustment 4 429 12 711 - -
286 743 317 933 150 379 101 744
Cost of sales (91 312 ) (96 416 ) - -GROSS PROFIT 195 431 221 517 150 379 101 744
Finance income 2 21 464 23 035 33 130 37 342
Other operating income 3 36 249 17 616 27 673 12 514
Fair value gain of investment properties 6 110 515 89 089 - -
As per valuation 114 944 101 800 - -Straight-line rental adjustment (4 429 ) (12 711 ) - -Share of profits of associates 10 53 272 71 809 - -
Amortised cost of borrowings 28 (1 611 ) (1 926 ) (1 611 ) (1 926 )
Distribution costs (3 403 ) (5 545 ) - -
Marketing expenses (3 649 ) (5 877 ) (1 941 ) (3 719 )
Occupancy expenses (15 833 ) (12 461 ) (7 728 ) (7 635 )
Administrative expenses (149 756 ) (100 322 ) (90 119 ) (60 802 )
Other operating expenses (145 369 ) (232 555 ) (126 285 ) (252 705 )
Finance costs 2 (61 596 ) (50 947 ) (50 588 ) (46 964 )
PROFIT/(LOSS) BEFORE TAX 4 35 714 13 433 (67 090 ) (222 151 )
Income tax (expense)/credit 5 (43 496 ) (35 906 ) (10 491 ) 2 459
LOSS FOR THE YEAR (7 782 ) (22 473 ) (77 581 ) (219 692 )
OTHER COMPREHENSIVE INCOMENet gain on investments designated as at fair value
through other comprehensive income 23 203 606 151 660 203 606 151 660
Net gain on revaluation of property,
plant and equipment 24 808 5 075 - -
Share of other comprehensive
profit/(loss) of associates 10 18 701 (27 173 ) - -
Other comprehensive income for the year 223 115 129 562 203 606 151 660
TOTAL COMPREHENSIVE INCOME/(LOSS) FOR THE YEAR 215 333 107 089 126 025 (68 032 )
Profit/(Loss)Loss attributable to:Owners of the Company (74 880 ) (46 070 ) (77 581 ) (219 692 )
Non-controlling interests 27 67 098 23 597 - -
(7 782 ) (22 473 ) (77 581 ) (219 692 )
Total other comprehensive income attributable to:Owners of the Company 223 115 129 562 203 606 151 660
Non-controlling interests - - - -
223 115 129 562 203 606 151 660
BOTSWANA DEVELOPMENT CORPORATION LIMITEDSTATEMENTS OF COMPREHENSIVE INCOMEFor the year ended 30 June 2014
Group Company
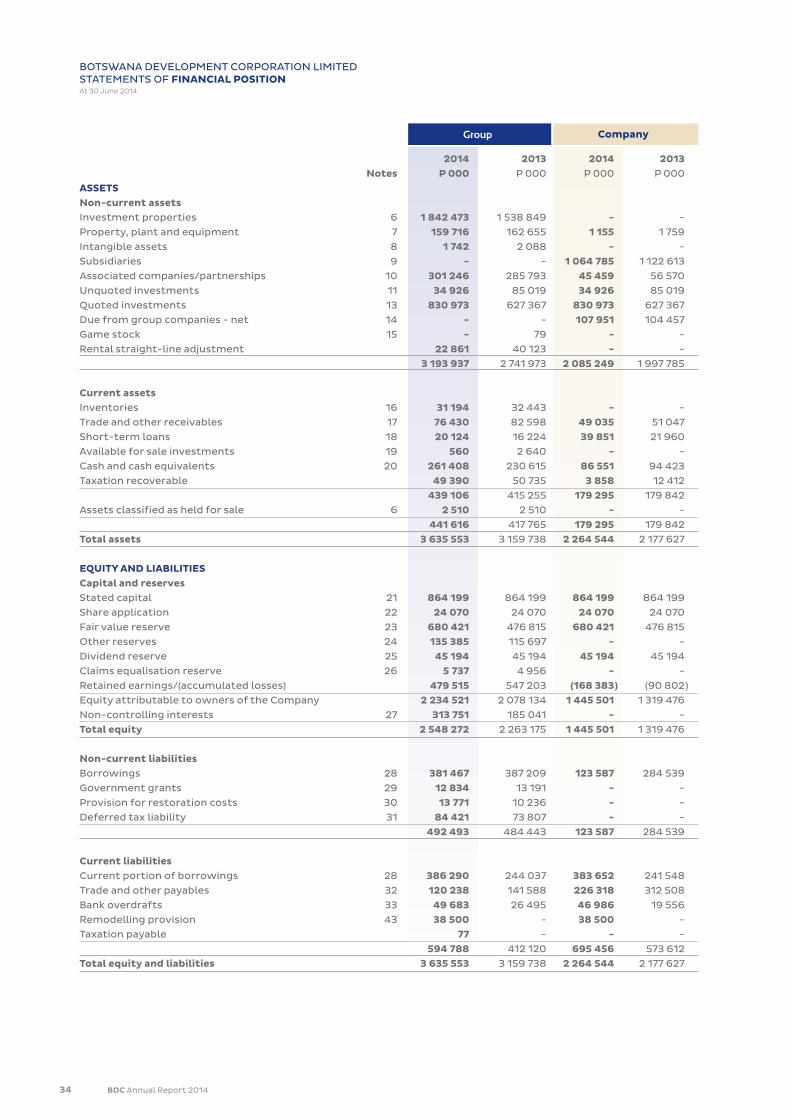
34 BDC Annual Report 2014
2014 2013 2014 2013 Notes P 000 P 000 P 000 P 000
ASSETSNon-current assetsInvestment properties 6 1 842 473 1 538 849 - -
Property, plant and equipment 7 159 716 162 655 1 155 1 759
Intangible assets 8 1 742 2 088 - -
Subsidiaries 9 - - 1 064 785 1 122 613
Associated companies/partnerships 10 301 246 285 793 45 459 56 570
Unquoted investments 11 34 926 85 019 34 926 85 019
Quoted investments 13 830 973 627 367 830 973 627 367
Due from group companies - net 14 - - 107 951 104 457
Game stock 15 - 79 - -
Rental straight-line adjustment 22 861 40 123 - -
3 193 937 2 741 973 2 085 249 1 997 785
Current assetsInventories 16 31 194 32 443 - -
Trade and other receivables 17 76 430 82 598 49 035 51 047
Short-term loans 18 20 124 16 224 39 851 21 960
Available for sale investments 19 560 2 640 - -
Cash and cash equivalents 20 261 408 230 615 86 551 94 423
Taxation recoverable 49 390 50 735 3 858 12 412
439 106 415 255 179 295 179 842
Assets classified as held for sale 6 2 510 2 510 - -
441 616 417 765 179 295 179 842
Total assets 3 635 553 3 159 738 2 264 544 2 177 627
EQUITY AND LIABILITIESCapital and reservesStated capital 21 864 199 864 199 864 199 864 199
Share application 22 24 070 24 070 24 070 24 070
Fair value reserve 23 680 421 476 815 680 421 476 815
Other reserves 24 135 385 115 697 - -
Dividend reserve 25 45 194 45 194 45 194 45 194
Claims equalisation reserve 26 5 737 4 956 - -
Retained earnings/(accumulated losses) 479 515 547 203 (168 383 ) (90 802 )
Equity attributable to owners of the Company 2 234 521 2 078 134 1 445 501 1 319 476
Non-controlling interests 27 313 751 185 041 - -
Total equity 2 548 272 2 263 175 1 445 501 1 319 476
Non-current liabilitiesBorrowings 28 381 467 387 209 123 587 284 539
Government grants 29 12 834 13 191 - -
Provision for restoration costs 30 13 771 10 236 - -
Deferred tax liability 31 84 421 73 807 - -
492 493 484 443 123 587 284 539
Current liabilitiesCurrent portion of borrowings 28 386 290 244 037 383 652 241 548
Trade and other payables 32 120 238 141 588 226 318 312 508
Bank overdrafts 33 49 683 26 495 46 986 19 556
Remodelling provision 43 38 500 - 38 500 -
Taxation payable 77 - - -
594 788 412 120 695 456 573 612
Total equity and liabilities 3 635 553 3 159 738 2 264 544 2 177 627
BOTSWANA DEVELOPMENT CORPORATION LIMITEDSTATEMENTS OF FINANCIAL POSITIONAt 30 June 2014
Group Company
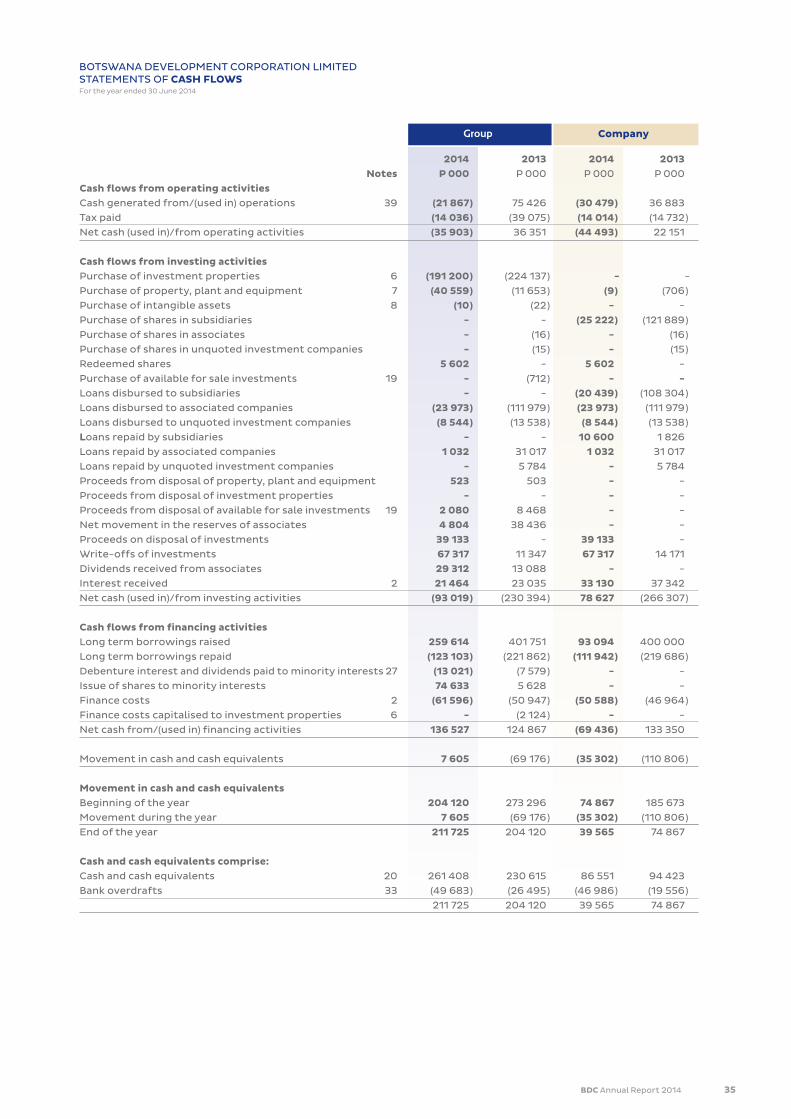
BDC Annual Report 2014 35
2014 2013 2014 2013 Notes P 000 P 000 P 000 P 000
Cash flows from operating activitiesCash generated from/(used in) operations 39 (21 867 ) 75 426 (30 479 ) 36 883
Tax paid (14 036 ) (39 075 ) (14 014 ) (14 732 )
Net cash (used in)/from operating activities (35 903 ) 36 351 (44 493 ) 22 151
Cash flows from investing activitiesPurchase of investment properties 6 (191 200 ) (224 137 ) - -
Purchase of property, plant and equipment 7 (40 559 ) (11 653 ) (9 ) (706 )
Purchase of intangible assets 8 (10 ) (22 ) - -
Purchase of shares in subsidiaries - - (25 222 ) (121 889 )
Purchase of shares in associates - (16 ) - (16 )
Purchase of shares in unquoted investment companies - (15 ) - (15 )
Redeemed shares 5 602 - 5 602 -
Purchase of available for sale investments 19 - (712 ) - -Loans disbursed to subsidiaries - - (20 439 ) (108 304 )
Loans disbursed to associated companies (23 973 ) (111 979 ) (23 973 ) (111 979 )
Loans disbursed to unquoted investment companies (8 544 ) (13 538 ) (8 544 ) (13 538 )
Loans repaid by subsidiaries - - 10 600 1 826
Loans repaid by associated companies 1 032 31 017 1 032 31 017
Loans repaid by unquoted investment companies - 5 784 - 5 784
Proceeds from disposal of property, plant and equipment 523 503 - -
Proceeds from disposal of investment properties - - - -
Proceeds from disposal of available for sale investments 19 2 080 8 468 - -
Net movement in the reserves of associates 4 804 38 436 - -
Proceeds on disposal of investments 39 133 - 39 133 -
Write-offs of investments 67 317 11 347 67 317 14 171
Dividends received from associates 29 312 13 088 - -
Interest received 2 21 464 23 035 33 130 37 342
Net cash (used in)/from investing activities (93 019 ) (230 394 ) 78 627 (266 307 )
Cash flows from financing activities
Long term borrowings raised 259 614 401 751 93 094 400 000
Long term borrowings repaid (123 103 ) (221 862 ) (111 942 ) (219 686 )
Debenture interest and dividends paid to minority interests 27 (13 021 ) (7 579 ) - -
Issue of shares to minority interests 74 633 5 628 - -
Finance costs 2 (61 596 ) (50 947 ) (50 588 ) (46 964 )
Finance costs capitalised to investment properties 6 - (2 124 ) - -
Net cash from/(used in) financing activities 136 527 124 867 (69 436 ) 133 350
Movement in cash and cash equivalents 7 605 (69 176 ) (35 302 ) (110 806 )
Movement in cash and cash equivalents
Beginning of the year 204 120 273 296 74 867 185 673
Movement during the year 7 605 (69 176 ) (35 302 ) (110 806 )
End of the year 211 725 204 120 39 565 74 867
Cash and cash equivalents comprise:Cash and cash equivalents 20 261 408 230 615 86 551 94 423
Bank overdrafts 33 (49 683 ) (26 495 ) (46 986 ) (19 556 )
211 725 204 120 39 565 74 867
BOTSWANA DEVELOPMENT CORPORATION LIMITEDSTATEMENTS OF CASH FLOWSFor the year ended 30 June 2014
Group Company
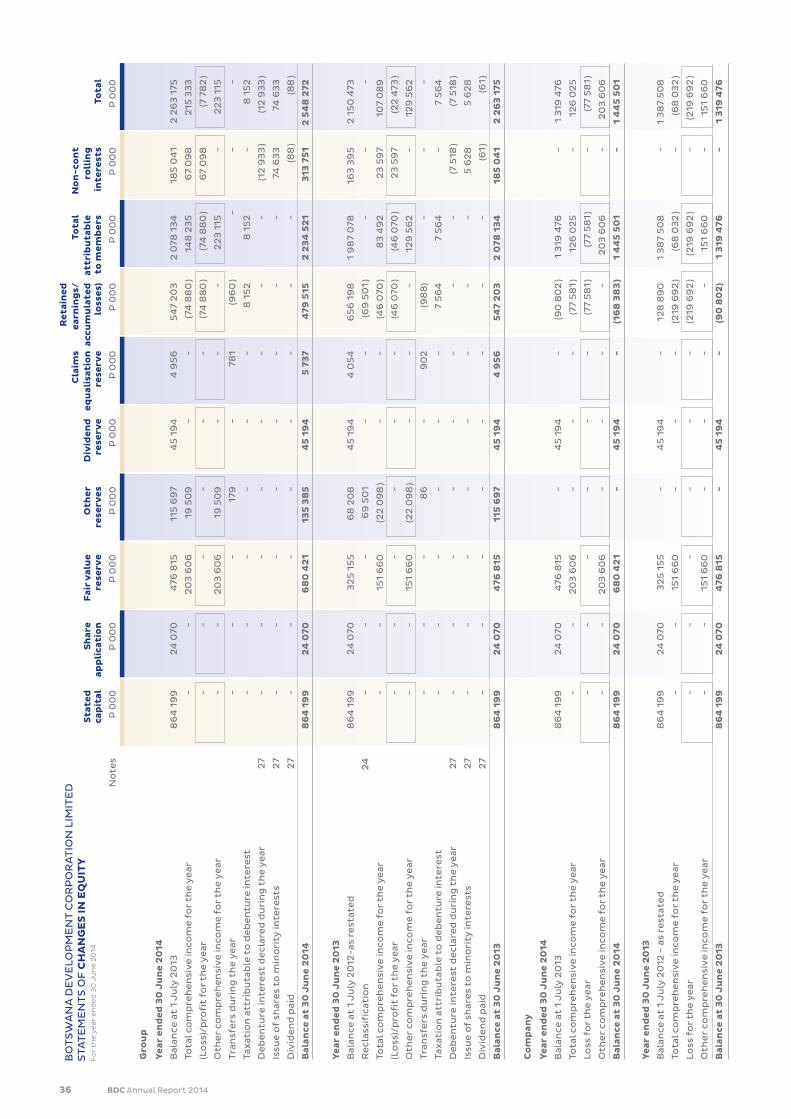
36 BDC Annual Report 2014
Ret
ain
ed
Cla
ims
ea
rnin
gs/
To
tal
N
on
-co
nt
S
tate
d w
S
har
e
Fai
r v
alu
e
Oth
er
Div
iden
d
equ
alis
atio
n a
ccu
mu
late
d
attr
ibu
tab
le
roll
ing
cap
ital
ap
pli
cati
on
re
serv
e
rese
rves
re
serv
e
rese
rve
lo
sses
) t
o m
emb
ers
in
tere
sts
To
tal
N
ote
s
P 0
00
P
00
0
P 0
00
P
00
0
P 0
00
P
00
0
P 0
00
P
00
0
P 0
00
P
00
0
Gro
up
Yea
r en
ded
30
Ju
ne
20
14
Bal
ance
at
1 J
uly
20
13
8
64
19
9
24
070
4
76 8
15
115
69
7
45
19
4
4 9
56
5
47
20
3
2 0
78 1
34
18
5 0
41
2
26
3 1
75
Tota
l co
mp
reh
en
siv
e in
com
e f
or
the
ye
ar
-
-
2
03
60
6
19 5
09
-
-
(7
4 8
80
) 14
8 2
35
6
7 0
98
2
15 3
33
(Lo
ss)/
pro
fit
for
the
ye
ar
-
-
-
-
-
-
(7
4 8
80
) (7
4 8
80
) 6
7 0
98
(7
78
2 )
Oth
er
com
pre
he
nsi
ve
inco
me
fo
r th
e y
ear
-
-
20
3 6
06
19
50
9
-
-
-
22
3 1
15
-
22
3 1
15
Tra
nsf
ers
du
rin
g t
he
ye
ar
-
-
-
17
9
-
781
(9
60
) -
-
-
Tax
atio
n a
ttri
bu
tab
le t
o d
eb
en
ture
inte
rest
-
-
-
-
-
-
8 1
52
8
15
2
-
8 1
52
De
be
ntu
re in
tere
st d
ecl
are
d d
uri
ng
th
e y
ear
2
7
-
-
-
-
-
-
-
-
(12
93
3 )
(12
93
3 )
Issu
e o
f sh
are
s to
min
ori
ty in
tere
sts
27
-
-
-
-
-
-
-
-
74
63
3
74 6
33
Div
ide
nd
pai
d
27
-
-
-
-
-
-
-
-
(8
8 )
(88
)
Bal
ance
at
30
Ju
ne
20
14
8
64
19
9
24
070
6
80
42
1
135
38
5
45
19
4
5 7
37
4
79 5
15
2 2
34
52
1
313
75
1
2 5
48
272
Yea
r en
ded
30
Ju
ne
20
13
Bal
ance
at
1 J
uly
20
12-a
s re
stat
ed
86
4 1
99
2
4 0
70
32
5 1
55
6
8 2
08
4
5 1
94
4
05
4
65
6 1
98
1
98
7 0
78
163
39
5
2 1
50
473
Re
clas
sifi
cati
on
2
4
-
-
-
69
50
1
-
-
(69
50
1 )
-
-
-
Tota
l co
mp
reh
en
siv
e in
com
e f
or
the
ye
ar
-
-
15
1 6
60
(2
2 0
98
) -
-
(4
6 0
70 )
83
49
2
23
59
7
107
08
9
(Lo
ss)/
pro
fit
for
the
ye
ar
-
-
-
-
-
-
(4
6 0
70 )
(46
070
) 2
3 5
97
(2
2 4
73 )
Oth
er
com
pre
he
nsi
ve
inco
me
fo
r th
e y
ear
-
-
151
66
0
(22
09
8 )
-
-
-
129
56
2
-
129
56
2
Tra
nsf
ers
du
rin
g t
he
ye
ar
-
-
-
8
6
-
90
2
(98
8)
-
-
-
Tax
atio
n a
ttri
bu
tab
le t
o d
eb
en
ture
inte
rest
-
-
-
-
-
-
7 5
64
7
56
4
-
7 5
64
De
be
ntu
re in
tere
st d
ecl
are
d d
uri
ng
th
e y
ear
2
7
-
-
-
-
-
-
-
-
(7 5
18 )
(7 5
18 )
Issu
e o
f sh
are
s to
min
ori
ty in
tere
sts
27
-
-
-
-
-
-
-
-
5
62
8
5 6
28
Div
ide
nd
pai
d
27
-
-
-
-
-
-
-
-
(6
1 )
(61
)
Bal
ance
at
30
Ju
ne
20
13
8
64
19
9
24
070
4
76 8
15
115
69
7
45
19
4
4 9
56
5
47
20
3
2 0
78 1
34
18
5 0
41
2
26
3 1
75
Co
mp
any
Yea
r en
ded
30
Ju
ne
20
14
Bal
ance
at
1 J
uly
20
13
8
64
19
9
24
070
4
76 8
15
-
45
19
4
-
(90
80
2 )
1 3
19 4
76
-
1 3
19 4
76
Tota
l co
mp
reh
en
siv
e in
com
e f
or
the
ye
ar
-
-
2
03
60
6
-
-
-
(77
58
1 )
126
02
5
-
126
02
5
Lo
ss f
or
the
ye
ar
-
-
-
-
-
-
(7
7 5
81
) (7
7 5
81
) -
(7
7 5
81
)
Oth
er
com
pre
he
nsi
ve
inco
me
fo
r th
e y
ear
-
-
20
3 6
06
-
-
-
-
2
03
60
6
-
20
3 6
06
Bal
ance
at
30
Ju
ne
20
14
8
64
19
9
24
070
6
80
42
1
-
45
19
4
-
(16
8 3
83
) 1
44
5 5
01
-
1
44
5 5
01
Yea
r en
ded
30
Ju
ne
20
13
Bal
ance
at
1 J
uly
20
12 -
as
rest
ate
d
8
64
19
9
24
070
3
25
15
5
-
45
19
4
-
128
89
0
1 3
87
50
8
-
1 3
87
50
8
Tota
l co
mp
reh
en
siv
e in
com
e f
or
the
ye
ar
-
-
15
1 6
60
-
-
-
(2
19 6
92
) (6
8 0
32
) -
(6
8 0
32
)
Lo
ss f
or
the
ye
ar
-
-
-
-
-
-
(2
19 6
92
) (2
19 6
92
) -
(2
19 6
92
)
Oth
er
com
pre
he
nsi
ve
inco
me
fo
r th
e y
ear
-
-
151
66
0
-
-
-
-
151
66
0
-
151
66
0
Bal
ance
at
30
Ju
ne
20
13
8
64
19
9
24
070
4
76 8
15
-
45
19
4
-
(90
80
2)
1
319
476
-
1
319
476
BO
TS
WA
NA
DE
VE
LOP
ME
NT
CO
RP
OR
AT
ION
LIM
ITE
D
STA
TE
ME
NT
S O
F C
HA
NG
ES
IN E
QU
ITY
Fo
r th
e y
ea
r e
nd
ed
30
Ju
ne
20
14
BDC Annual Report 2014 37
BOTSWANA DEVELOPMENT CORPORATION LIMITEDSIGNIFICANT ACCOUNTING POLICIES30 June 2014
GENERAL INFORMATION
Botswana Development Corporation Limited (the Company)
is a public entity set up by the Government of the Republic
of Botswana (GRB) to promote development through equity
and loan investment finance. The Company is registered
under the Companies Act of Botswana (Companies Act,
2003) and holds investments in companies involved in
various business categories, for example, agriculture,
manufacturing, properties and services provision. The
Company’s address, registered office and principal place
of business are disclosed in the introduction to the annual
report.
Adoption of new and revised International Financial
Reporting Standards (IFRSs)
NEW AND REVISED STANDARDS AND INTERPRETATIONS
EFFECTIVE FOR THE CURRENT PERIOD:
In the current year, the Group has adopted all the new and
revised Standards and Interpretations of the International
Accounting Standards Board (the IASB) and the International
Financial Reporting Interpretations Committee (IFRIC) of
the IASB that are relevant to its operations and effective for
annual reporting periods beginning on 1 July 2013.
The Group adopted the following amendments to existing
Standards in the current period:
IFRS 7 Financial Instruments - Disclosure (offsetting assets
and liabilities)
The amendment is effective for periods beginning on or
after 1 January 2013. The amendment requires disclosure
of information about recognised financial instruments
subject to enforceable master netting arrangements.
IFRS 10 Consolidated Financial Statements
This is a new Standard effective for periods beginning on
or after 1 January 2013. It outlines the requirements for
the preparation and presentation of consolidated financial
statements, requiring entities to consolidate entities it
controls. Control requires exposure or rights to variable
returns and the ability to affect those returns through
power over an investee.
IFRS 11 Joint Arrangements
This is a new Standard effective for periods beginning
on or after 1 January 2013. It outlines the accounting by
entities that jointly control an arrangement. Joint control
involves the contractually agreed sharing of control and
arrangements subject to joint control are classified as
either a joint venture (representing a share of net assets
and equity accounted) or a joint operation (representing
rights to assets and obligations for liabilities, accounted for
accordingly).
IFRS 12 Disclosure of Interests in Other Entities
This is a new Standard effective for periods beginning on or
after 1 January 2013. It is a consolidated disclosure standard
requiring a wide range of disclosures about an entity’s
interests in subsidiaries, joint arrangements, associates
and unconsolidated ‘structured entities’. Disclosures are
presented as a series of objectives, with detailed guidance
on satisfying those objectives.
IFRS 13 Fair Value Measurement
This is a new Standard effective for periods beginning
on or after 1 January 2013. It applies to IFRSs that require
or permit fair value measurements or disclosures and
provides a single IFRS framework for measuring fair value
and requires disclosures about fair value measurement.
The Standard defines fair value on the basis of an ‘exit price’
notion and uses a ‘fair value hierarchy’, which results in a
market-based, rather than entity-specific, measurement.
IAS 1: Presentation of Financial Statements - Disclosure
requirements for comparative information
The amendment is effective for periods beginning on or
after 1 January 2013. The amendment clarified that there
is no need to present three (3) sets of balance sheet notes
when a third (3rd) balance sheet is presented and that the
third (3rd) balance sheet is only required if the restatement
in terms of IAS 8 has a material impact on the 3rd balance
sheet. The Group has early adopted this Standard in the
prior year.
IAS 19 Employee Benefits
The amendment is effective for periods beginning on or
after 1 January 2013. The amendments were in respect of
the recognition of defined benefit liability, disclosure and
accounting for termination benefits.
IFRIC 20 Stripping costs in the production phase of a
surface mine
The interpretation is effective for periods beginning on or
after 1 January 2013 and deals with waste removal costs
that are incurred in surface mining activity during the
production phase of the mine.
NEW AND REVISED STANDARDS AND INTERPRETATIONS IN
ISSUE BUT NOT YET EFFECTIVE
At the date of authorisation of these financial statements,
the following Standards and Interpretations which are
applicable to the Group were issued but were not yet
effective:
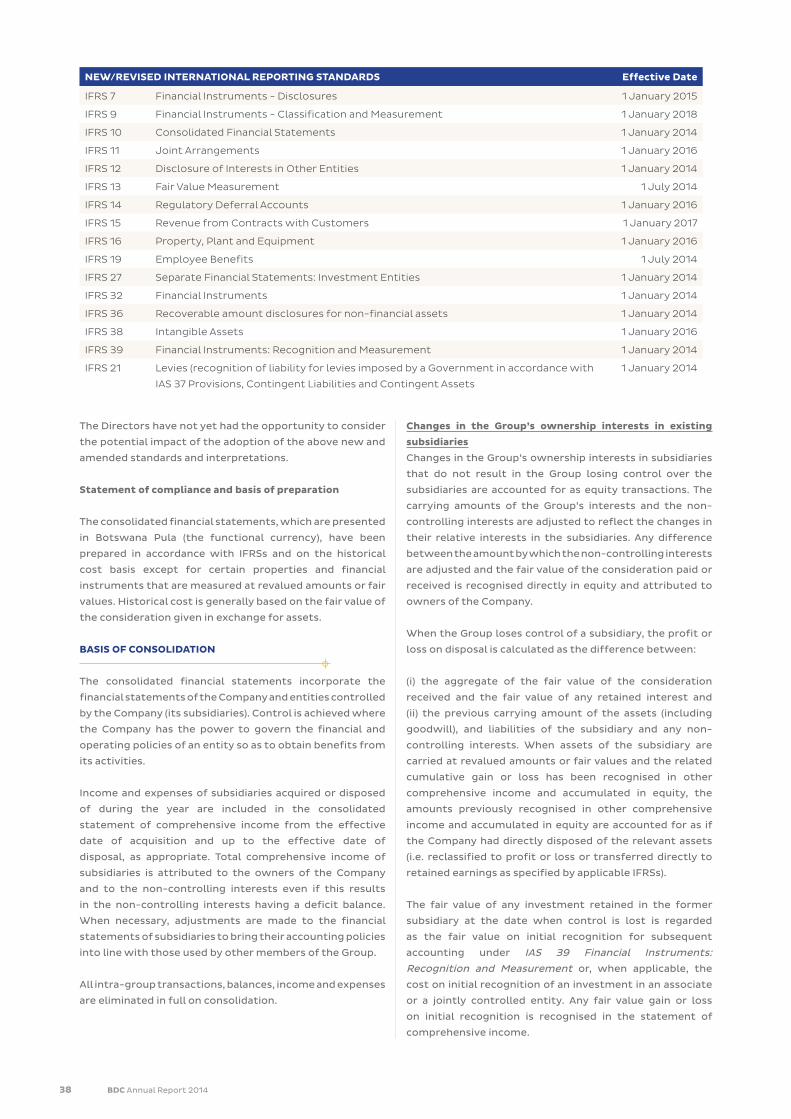
38 BDC Annual Report 2014
The Directors have not yet had the opportunity to consider
the potential impact of the adoption of the above new and
amended standards and interpretations.
Statement of compliance and basis of preparation
The consolidated financial statements, which are presented
in Botswana Pula (the functional currency), have been
prepared in accordance with IFRSs and on the historical
cost basis except for certain properties and financial
instruments that are measured at revalued amounts or fair
values. Historical cost is generally based on the fair value of
the consideration given in exchange for assets.
BASIS OF CONSOLIDATION
The consolidated financial statements incorporate the
financial statements of the Company and entities controlled
by the Company (its subsidiaries). Control is achieved where
the Company has the power to govern the financial and
operating policies of an entity so as to obtain benefits from
its activities.
Income and expenses of subsidiaries acquired or disposed
of during the year are included in the consolidated
statement of comprehensive income from the effective
date of acquisition and up to the effective date of
disposal, as appropriate. Total comprehensive income of
subsidiaries is attributed to the owners of the Company
and to the non-controlling interests even if this results
in the non-controlling interests having a deficit balance.
When necessary, adjustments are made to the financial
statements of subsidiaries to bring their accounting policies
into line with those used by other members of the Group.
All intra-group transactions, balances, income and expenses
are eliminated in full on consolidation.
Changes in the Group’s ownership interests in existing
subsidiaries
Changes in the Group’s ownership interests in subsidiaries
that do not result in the Group losing control over the
subsidiaries are accounted for as equity transactions. The
carrying amounts of the Group’s interests and the non-
controlling interests are adjusted to reflect the changes in
their relative interests in the subsidiaries. Any difference
between the amount by which the non-controlling interests
are adjusted and the fair value of the consideration paid or
received is recognised directly in equity and attributed to
owners of the Company.
When the Group loses control of a subsidiary, the profit or
loss on disposal is calculated as the difference between:
(i) the aggregate of the fair value of the consideration
received and the fair value of any retained interest and
(ii) the previous carrying amount of the assets (including
goodwill), and liabilities of the subsidiary and any non-
controlling interests. When assets of the subsidiary are
carried at revalued amounts or fair values and the related
cumulative gain or loss has been recognised in other
comprehensive income and accumulated in equity, the
amounts previously recognised in other comprehensive
income and accumulated in equity are accounted for as if
the Company had directly disposed of the relevant assets
(i.e. reclassified to profit or loss or transferred directly to
retained earnings as specified by applicable IFRSs).
The fair value of any investment retained in the former
subsidiary at the date when control is lost is regarded
as the fair value on initial recognition for subsequent
accounting under IAS 39 Financial Instruments:
Recognition and Measurement or, when applicable, the
cost on initial recognition of an investment in an associate
or a jointly controlled entity. Any fair value gain or loss
on initial recognition is recognised in the statement of
comprehensive income.
NEW/REVISED INTERNATIONAL REPORTING STANDARDS Effective Date
IFRS 7 Financial Instruments - Disclosures 1 January 2015
IFRS 9 Financial Instruments - Classification and Measurement 1 January 2018
IFRS 10 Consolidated Financial Statements 1 January 2014
IFRS 11 Joint Arrangements 1 January 2016
IFRS 12 Disclosure of Interests in Other Entities 1 January 2014
IFRS 13 Fair Value Measurement 1 July 2014
IFRS 14 Regulatory Deferral Accounts 1 January 2016
IFRS 15 Revenue from Contracts with Customers 1 January 2017
IFRS 16 Property, Plant and Equipment 1 January 2016
IFRS 19 Employee Benefits 1 July 2014
IFRS 27 Separate Financial Statements: Investment Entities 1 January 2014
IFRS 32 Financial Instruments 1 January 2014
IFRS 36 Recoverable amount disclosures for non-financial assets 1 January 2014
IFRS 38 Intangible Assets 1 January 2016
IFRS 39 Financial Instruments: Recognition and Measurement 1 January 2014
IFRS 21 Levies (recognition of liability for levies imposed by a Government in accordance with
IAS 37 Provisions, Contingent Liabilities and Contingent Assets
1 January 2014

BDC Annual Report 2014 39
BUSINESS COMBINATIONS
Acquisitions of businesses are accounted for using the
acquisition method. The consideration transferred in a
business combination is measured at fair value, which is
calculated as the sum of the acquisition-date fair values
of the assets transferred by the Group, liabilities incurred
by the Group to the former owners of the acquiree and the
equity interests issued by the Group in exchange for control
of the acquiree. Acquisition-related costs are generally
recognised in profit or loss as incurred.
At the acquisition date, the identifiable assets acquired and
the liabilities assumed are recognised at their fair value at
the acquisition date, except that:
• deferred tax assets or liabilities and liabilities or
assets related to employee benefit arrangements
are recognised and measured in accordance with
IAS 12 Income Taxes and IAS 19 Employee Benefits
respectively;
• liabilities or equity instruments related to share-based
payment arrangements of the acquiree or share-based
payment arrangements of the Group entered into
to replace share-based payment arrangements of
the acquiree are measured in accordance with IFRS 2
Share-based Payment at the acquisition date; and
• assets (or disposal groups) that are classified as held for
sale in accordance with IFRS 5 Non-current Assets Held
for Sale and Discontinued Operations are measured in
accordance with that Standard.
Goodwill is measured as the excess of the sum of the
consideration transferred, the amount of any non-
controlling interests in the acquiree, and the fair value of
the acquirer’s previously held equity interest in the acquiree
(if any) over the net of the acquisition-date amounts of the
identifiable assets acquired and the liabilities assumed. If,
after reassessment, net of the acquisition-date amounts
of the identifiable assets acquired and liabilities assumed
exceeds the sum of the consideration transferred, the
amount of any non-controlling interests in the acquiree
and the fair value of the acquirer’s previously held interest
in the acquiree (if any), the excess is recognised immediately
in profit or loss as a bargain purchase gain.
Non-controlling interests that are present ownership
interests and entitle their holders to a proportionate share
of the entity’s net assets in the event of liquidation may
be initially measured either at fair value or at the non-
controlling interests’ proportionate share of the recognised
amounts of the acquiree’s identifiable net assets. The
choice of measurement basis is made on a transaction-by-
transaction basis. Other types of non-controlling interests
are measured at fair value or, when applicable, on the basis
specified in another IFRS.
When the consideration transferred by the Group in a
business combination includes assets or liabilities resulting
from a contingent consideration arrangement, the
contingent consideration is measured at its acquisition-
date fair value and included as part of the consideration
transferred in a business combination. Changes in the
fair value of the contingent consideration that qualify
as measurement period adjustments are adjusted
retrospectively, with corresponding adjustments
against goodwill. Measurement period adjustments
are adjustments that arise from additional information
obtained during the ‘measurement period’ (which cannot
exceed one year from the acquisition date) about facts and
circumstances that existed at the acquisition date.
• The subsequent accounting for changes in the fair
value of the contingent consideration that do not
qualify as measurement period adjustments depends
on how the contingent consideration is classified.
Contingent consideration that is classified as equity is
not remeasured at subsequent reporting dates and its
subsequent settlement is accounted for within equity.
Contingent consideration that is classified as an asset
or a liability is remeasured at subsequent reporting
dates in accordance with IAS 39, or IAS 37 Provisions,
Contingent Liabilities and Contingent Assets, as
appropriate, with the corresponding gain or loss being
recognised in profit or loss.
When a business combination is achieved in stages, the
Group’s previously held equity interest in the acquiree is
remeasured to fair value at the acquisition date (i.e. the date
when the Group obtains control) and the resulting gain or
loss, if any, is recognised in profit or loss. Amounts arising
from interests in the acquiree prior to the acquisition
date that have previously been recognised in other
comprehensive income are reclassified to profit or loss
where such treatment would be appropriate if that interest
were disposed of.
If the initial accounting for a business combination is
incomplete by the end of the reporting period in which the
combination occurs, the Group reports provisional amounts
for the items for which the accounting is incomplete. Those
provisional amounts are adjusted during the measurement
period (see above), or additional assets or liabilities are
recognised, to reflect new information obtained about
facts and circumstances that existed at the acquisition
date that, if known, would have affected the amounts
recognised at that date.
Business combinations that took place prior to 1 July 2010
were accounted for in accordance with the previous version
of IFRS 3 Business Combinations.
GOODWILL
Goodwill arising on an acquisition of a business is carried
at cost as established at the date of acquisition of the
business less accumulated impairment losses, if any. For
the purposes of impairment testing, goodwill is allocated
to each of the Group’s cash-generating units (or groups of
cash-generating units) that is expected to benefit from the
synergies of the combination.

40 BDC Annual Report 2014
A cash-generating unit to which goodwill has been allocated
is tested for impairment annually, or more frequently when
there is indication that the unit may be impaired. If the
recoverable amount of the cash-generating unit is less than
its carrying amount, the impairment loss is allocated first
to reduce the carrying amount of any goodwill allocated
to the unit and then to the other assets of the unit on a
pro-rata basis based on the carrying amount of each asset
in the unit. Any impairment loss for goodwill is recognised
directly in profit or loss in the consolidated statement of
comprehensive income. An impairment loss recognised for
goodwill is not reversed in subsequent periods.
On disposal of the relevant cash-generating unit, the
attributable amount of goodwill is included in the
determination of the profit or loss on disposal.
The Group’s policy for goodwill arising on the acquisition of
an associate is described under investments in associates.
INVESTMENTS IN ASSOCIATES
An associate is an entity over which the Group has
significant influence and that is neither a subsidiary nor an
interest in a joint venture. Significant influence is the power
to participate in the financial and operating decisions of
the investee but is not control or joint control over those
policies.
The results and assets and liabilities of associates are
incorporated in these financial statements using the equity
method of accounting, except when the investment is
classified as held-for-sale, in which case it is accounted for
in accordance with IFRS 5 Non-current Assets Held for Sale
and Discontinued Operations. Under the equity method,
investments in associates are carried in the consolidated
statement of financial position at cost as adjusted for post-
acquisition changes in the Group’s share of the net assets or
the associates, less any impairment in the value of individual
investments. Losses of an associate in excess of the Group’s
interest in that associate (which includes any long-term
interests that, in substance, form part of the Group’s net
investment in the associate) are recognised only to the
extent that the Group has incurred legal or constructive
obligations or made payments on behalf of the associate.
Any excess of the cost of acquisition over the Group’s share
of the net fair value of the identification assets, liabilities
and contingent liabilities of the associate recognised as the
date of acquisition is recognised as goodwill. The goodwill
is included within the carrying amount of the investment
and is assessed for impairment as part of that investment.
Any excess of the Group’s share of the net fair value of the
identifiable assets, liabilities and contingent liabilities over
the cost of acquisition, after reassessment, is recognised
immediately in profit or loss.
The requirements of applied to determine whether it is
necessary to recognise any impairment loss with respect
to the Group’s investment in an associate. When necessary,
the entire carrying amount of the investment (including
goodwill) is tested for impairment in accordance with IAS
36 Impairment of Assets as a single asset by comparing its
recoverable amount (higher of value in use and fair value
less costs to sell) with its carrying amount, Any impairment
loss recognised forms part of the carrying amount of
the investment. Any reversal of that impairment loss is
recognised in accordance with IAS 36 to the extent that
the recoverable amount of the investment subsequently
increases.
When a Group entity transacts with its associate, profits
and losses resulting from the transactions with the
associate are recognised in the Group’ consolidated
financial statements only to the extent of interests in the
associate that are not related to the Group.
INTERESTS IN JOINT VENTURES
A joint venture is a contractual arrangement whereby the
Group and other parties undertake an economic activity that
is subject to joint control (i.e. when the strategic financial
and operating policy decisions relating to the activities of
the joint venture require the unanimous consent of the
parties sharing control).
When a Group entity undertakes its activities under joint
venture arrangements directly, the Group’s share of jointly
controlled assets and any liabilities incurred jointly with
other ventures are recognised in the financial statements
of the relevant entity and classified according to their
nature. Liabilities and expenses incurred directly in respect
of interests in jointly controlled assets are accounted for
on an accrual basis. Income from the sale or use of the
Group’s share of the output of jointly controlled assets, and
its share of joint venture expenses, are recognised when it
is probable that the economic benefits associated with the
transactions will flow to/from the Group and their amount
can be measured reliably.
Joint venture arrangements that involve the establishment
of a separate entity in which each venture has an interest
are referred to as jointly controlled entities. The Group
reports its interests in jointly controlled entities using
proportionate consolidation, except when the investment
is classified as held for sale, in which case it is accounted
for in accordance with IFRS 5 Non-current assets Held
for Sale and Discontinued Operations. The Group’s share
of interests, liabilities, income and expenses of jointly
controlled entities is combined with the equivalent items
in the consolidated financial statements on a line-by-line
basis. Any goodwill arising on the acquisition of the Group’s
interest in a jointly controlled entity is accounted for in
accordance with the Group’s accounting policy for goodwill
arising in a business combination as described above.
When a Group entity transacts with its jointly controlled
entity, profits and losses resulting from the transactions
with the jointly controlled entity are recognised in the
Group’ consolidated financial statements only to the extent
of interests in the jointly controlled entity that are not
related to the Group.
BDC Annual Report 2014 41
NON-CURRENT ASSETS HELD FOR SALE
Non-current assets and disposal groups are classified as
held for sale if their carrying amount will be recovered
principally through a sale transaction rather than through
continuing use. This condition is regarded as met only
when the sale is highly probable and the non-current asset
(or disposal group) is available for immediate sale in its
present condition. Management must be committed to the
sale, which should be expected to qualify for recognition
as a complete sale within one year from the date of
classification.
When the Group is committed to a sale plan involving loss
of control of a subsidiary, all of the assets and liabilities
of that subsidiary are classified as held for sale when the
criteria described above are met, regardless of whether the
Group will retain a non-controlling interest in its former
subsidiary after the sale.
Non-current assets (and disposal groups) classified as held
for sale measured at the lower of their previous carrying
amount and fair value less costs to sell.
REVENUE RECOGNITION
Revenue is measured at the fair value of the consideration
received or receivable. Revenue is reduced for estimated
customer returns, rebates and other similar allowances.
Sale of goods
Revenue from the sale of goods is recognised when all the
following conditions are satisfied:
• the Group has transferred to the buyer the significant
risks and rewards of ownership of the goods;
• the Group retains neither continuing managerial
involvement to the degree usually associated with
ownership nor effective control over the goods sold;
• the amount of revenue can be measured reliably;
• it is probable that the economic benefits associated
with the transaction will flow to the entity; and
• the costs incurred or to be incurred in respect of the
transaction can be measured reliably.
Specifically, revenue from the sale of goods is recognised
when goods are delivered and legal title is passed.
Rendering of services
Revenue from a contract to provide services is recognised
by reference to the stage of completion of the contract.
The stage of completion of the contract is determined as
follows:
• installation fees from a recognised by reference to the
stage of completion of the installation, determined
as the proportion of the total time expected to install
that has elapsed at the end of the reporting period;
• servicing fees included in the price of products sold are
recognised by reference to the proportion of the total
cost of providing the servicing for the product sold,
taking into account historical trends in the number of
services actually provided on past goods sold; and
• revenue from time and material contracts is recognised
at the contractual rates as labour hours are delivered
and direct expenses are incurred.
The Group’s policy for recognition of revenue from
construction contracts is described separately below.
Dividend and interest revenue
Dividend revenue from investments is recognised when
the shareholder’s right to receive payment has been
established (provided that it is probable that the economic
benefits will flow to the Group and the amount of revenue
can be measured reliably).
Interest revenue is recognised when it is probable that the
economic benefits will flow to the Group and the amount
of revenue can be measured reliably. Interest revenue
is accrued on a time basis, by reference to the principal
outstanding and at the effective interest rate applicable,
which is the rate that exactly discounts estimated future
cash receipts through the expected life if the financial asset
to that asset’s net carrying amount on initial recognition.
Premium income
Premium income is recognised in the period in which the
related risk is notified to the Group. A provision for unearned
premiums, which represents the estimated portion of net
premiums written relating to unearned risks, is made at
end of the financial year. Salvage income is recognised as
and when realised.
Rental income
The Group’s policy for recognition of revenue from
operating leases described under leasing below.
CONSTRUCTION CONTRACTS
Where the outcome of a construction contract can be
estimated reliably, revenue and costs are recognised by
reference to the stage of completion of the contract
activity at the end of the reporting period, measured based
on the proportion of contract costs incurred for work
performed to date relative to the estimated total contract
costs, except where this would not be representative
of the stage of completion. Variations in contract work,
claims and incentive payments are included to the extent
that the amount can be measured reliably and its receipt is
considered probable.
Where the outcome of a construction contract cannot be
estimated reliably, contract revenue is recognised to the
extent of contract costs incurred that it is probable will be
recoverable. Contract costs are recognised as expenses in
the period in which they are incurred.
When it is probable that total contract costs will exceed
total contract revenue, the expected loss is recognised as
an expense immediately.
42 BDC Annual Report 2014
Where contract costs incurred to date plus recognised
profits less recognised losses exceed progress billings,
the surplus is shown as amounts due from customers
for contract work. For contracts where progress billings
exceed contract costs incurred to date plus recognised
profits less recognised losses, the surplus is shown as the
amounts due to customers for contract work. Amounts
received before the related work is performed are included
in the consolidated statement of financial position, as a
liability, as advances received. Amounts billed for work
performed but not yet paid by the customer are included
in the consolidated statement of financial position under
trade and other receivables.
LEASING
Leases are classified as finance leases whenever the terms
of the lease transfer substantially all the risks and rewards
of ownership to the lessee. All other leases are classified as
operating leases.
The Group as lessor
Amounts due from lessees under the finance leases are
recognised as receivables at the amount of the Group’s net
investment in the leases. Finances lease income is allocated
to accounting periods so as to reflect a constant periodic
rate of return on the Group’s net investment outstanding
in respect of the leases.
Rental income from operating leases is recognised on a
straight-line basis over the term of the relevant lease.
Initial direct costs incurred in negotiating and arranging an
operating lease are added to the carrying amount of the
leased asset and recognised on a straight-line basis over
the lease term.
The Group as lessee
Assets held under finance leases are initially recognised
as assets of the Group at their fair value at the inception
of the lease or, if lower, at present value of the minimum
lease payments. The corresponding liability to the lessor is
included in the statement of financial position as a finance
lease obligation.
Lease payments are apportioned between finance expenses
and reduction of the lease obligation so as to achieve a
constant rate of interest on the remaining balance of the
liability. Finance expenses are recognised immediately
in profit or loss, unless they are directly attributable
to qualifying assets, in which case they capitalised in
accordance with the Group’s general policy on borrowing
costs. Contingent rentals are recognised as expenses in the
periods in which they are incurred.
Operating lease payments are recognised as an expense
on a straight-line basis over the lease term, except where
another systematic basis is more representative of the time
pattern in which economic benefits from the leased asset
are consumed.
In the event that lease incentives are received to enter
into operating leases, such incentives are recognised as a
liability. The aggregate benefit of incentives is recognised as
a reduction of rental expense on a straight-line basis, except
where another systematic basis is more representative
of the time pattern in which economic benefits from the
leased asset are consumed.
Contingent rentals arising under operating leases are
recognised as an expense in the period in which they are
incurred.
FOREIGN CURRENCIES
In preparing the financial statements of each individual
Group entity, transactions in currencies other than the
entity’s functional currency (foreign currencies) are
recognised at the rates of exchange prevailing at the dates
of the transactions. At the end of each reporting period,
monetary items denominated in foreign currencies are
retranslated at the rates prevailing at that date. Non-
monetary items carried at fair value that are denominated
in foreign currencies are retranslated at the rates prevailing
at the date when the fair value was determined. Non-
monetary items that are measured in terms of historical
cost in a foreign currency are not retranslated.
Exchange differences on monetary items are recognised in
profit or loss in the period in which they arise except for:
• exchange differences on foreign currency borrowings
relating to assets under construction for future
productive use, which are included in the cost of those
assets when they are regarded as an adjustment to
interest costs on those foreign currency borrowings;
• exchange differences on transactions entered into in
order to hedge certain foreign currency risks; and
• exchange differences on monetary items receivable
from or payable to a foreign operation for which
settlement is neither planned nor likely to occur
(therefore forming part of the net investment in the
foreign operation), which are recognised initially
in other comprehensive income and reclassified
from equity to profit or loss on disposal of the net
investment.
BORROWING COSTS
Borrowing costs directly attributable to the acquisition,
construction or production of qualifying assets, which are
assets that necessarily take a substantial period of time
to get ready for their intended use or sale, are added to
the cost of those assets, until such time as the assets are
substantially ready for their intended use or sale.
Investment income earned on the temporary investment of
specific borrowings pending their expenditure on qualifying
assets is deducted from the borrowing costs eligible for
BDC Annual Report 2014 43
capitalisation. All other borrowing costs are recognised in
profit or loss in the period in which they are incurred.
GOVERNMENT GRANTS
Government grants are not recognised until there is
reasonable assurance that the Group will comply with the
conditions attaching to them and that the grants will be
received.
Government grants are recognised in profit or loss on
a systematic basis over the periods in which the Group
recognises as expenses the related costs for which
the grants are intended to compensate. Specifically,
government grants whose primary condition is that the
Group should purchase, construct or otherwise acquire
non-current assets are recognised as deferred revenue
in the consolidated statement of financial position and
transferred to profit or loss on a systematic and rational
basis over the useful lives of the related assets.
Government grants that are receivable as compensation
for expenses or losses already incurred or for the purpose
of giving immediate financial support to the Group with no
future related costs are recognised in profit or loss in the
period in which they become receivable.
The benefit of a Government loan at a below-market rate of
interest is treated as a government grant, measured as the
difference between proceeds received and the fair value of
the loan based on prevailing market interest rates.
RETIREMENT BENEFIT COSTS
Pension obligations
Group companies have various defined contribution
pension schemes. The schemes are generally funded
through payments to insurance companies or trustee-
administered funds. A defined contribution plan is a pension
plan under which the group pays fixed regular contributions
into a separate entity (a fund) and will have no legal or
constructive obligations to pay further contributions if the
fund does not hold sufficient assets to pay all employees
benefits relating to employee service in the current and
prior periods.
Payments to defined contribution retirement benefit
plans are recognised as an expense when employees have
rendered service entitling them to the contributions.
Severance pay and gratuity
Citizen employees are entitled to statutory severance
benefits and gratuities at end of every five years. Non-
citizen employees receive gratuities at end of every two-
year contract. Provision is made in respect of these benefits
on an annual basis and included in operating results.
TAXATION
Income tax expense represents the sum of the tax currently
payable and deferred tax.
Current tax
The tax currently payable is based on taxable profit for
the year. Taxable profit differs from profit as reported in
the consolidated statement of comprehensive income
because of items of income or expense that are taxable or
deductible in other years and items that are never taxable or
deductible. The Group’s liability for current tax is calculated
using tax rates that have been enacted or substantively
enacted by the end of the reporting period.
Deferred tax
Deferred tax is recognised on temporary differences
between the carrying amounts of assets and liabilities in
the financial statements and the corresponding tax bases
used in the computation of taxable profit. Deferred tax
liabilities are generally recognised for all taxable temporary
differences. Deferred tax assets are generally recognised for
all deductible temporary differences to the extent that it is
probable that taxable profits will be available against which
those deductible temporary differences can be utilised.
Such deferred tax assets and liabilities are not recognised if
the temporary difference arises from goodwill or from the
initial recognition (other than in a business combination)
of other assets and liabilities in a transaction that affects
neither the taxable profit nor the accounting profit.
Deferred tax liabilities are recognised for taxable temporary
differences associated with investments in subsidiaries and
associates, and interests in joint ventures, except where
the Group is able to control the reversal of the temporary
difference and it is probable that the temporary difference
will not reverse in the foreseeable future. Deferred tax
assets arising from deductible temporary differences
associated with such investments and interests are only
recognised to the extent that it is probable that there
will be sufficient taxable profits against which to utilise
the benefits of the temporary differences and they are
expected to reverse in the foreseeable future.
The carrying amount of deferred tax assets is reviewed
at the end of each reporting period and reduced to the
extent that it is no longer probable that sufficient taxable
profits will be available to allow all or part of the asset to
be recovered.
Deferred tax assets and liabilities are measured at the
tax rates that are expected to apply in the period in
which the liability is settled or the asset realised, based
on tax rates (and tax laws) that have been enacted or
substantively enacted by the end of the reporting period.
The measurement of deferred tax liabilities and assets
reflects the tax consequences that would follow from
the manner in which the Group expects, at the end of the
reporting period, to recover or settle the carrying amount
of its assets and liabilities.
Deferred tax assets and liabilities are offset when there
is a legally enforceable right to set off current tax assets
against current tax liabilities and when they relate to
income taxes levied by the same taxation authority and the
Group intends to settle its current tax assets and liabilities
on a net basis.
44 BDC Annual Report 2014
Current and deferred tax for the period
Current and deferred tax are recognised as an expense or
income in profit or loss, except when they relate to items
that are recognised outside profit or loss (when in other
comprehensive income or directly in equity), in which
case the tax is also recognised outside profit or loss, or
where they arise from the initial accounting for a business
combination. In the case of a business combination, the
tax effect is included in the accounting for the business
combination.
Biological assets and agricultural produce
The Group recognises a biological asset or agricultural
produce only when: a group entity controls the asset as a
result of past events;
It is probable that future economic benefits associated
with the asset will flow to the group entity; and
the cost or fair value of the asset can be measured reliably.
Biological assets or agricultural produce are measured
at their fair values less estimated costs to sell. A gain or
loss arising on initial recognition of biological assets or
agricultural produce at fair value less estimated costs to
sell is included in profit or loss for the period in which it
arises. Where market-determined prices or values are not
available, the estimated future cash flows are discounted
to their present value using a pre-tax discount rate that
reflects current market assessments of the time value
of money and the risk specific to the asset for which the
estimates of future cash flows have not been adjusted.
PROPERTY, PLANT AND EQUIPMENT
Properties held for use in the production or supply of goods
or services, or for administrative purposes, are stated in
the consolidated statement of financial position at their
revalued amounts, being the fair value at the date of
revaluation, less any subsequent accumulated depreciation
and subsequent accumulated impairment losses.
Revaluations are performed with sufficient regularity such
that the carrying amounts do not differ materially from
those that would be determined using fair values at the end
of each reporting period.
Any revaluation increase arising on the revaluation of such
property is recognised in other comprehensive income and
accumulated under the heading of revaluation reserve,
except to the extent that it reverses a revaluation decrease
for the same asset previously recognised in profit or loss,
in which case the increase is credited to profit or loss to
the extent of the decrease previously expensed. A decrease
in the carrying amount arising on the revaluation of such
property is recognised in profit or loss to the extent that it
exceeds the balance, if any, held in the revaluation reserve
relating to a previous revaluation of that asset.
Properties in the course of construction for production,
supply or administrative purposes are carried at cost, less
any recognised impairment loss. Cost includes professional
fees and, for qualifying assets, borrowing costs capitalised
in accordance with the Group’s accounting policy. Such
properties are classified to the appropriate categories of
property when completed and ready for intended use.
Depreciation of these assets, on the same basis as other
property assets, commences when the assets are ready for
their intended use.
Depreciation on revalued buildings is recognised in profit
or loss. On the subsequent sale or retirement of a revalued
property, the attributable revaluation surplus remaining in
the revaluation reserve is transferred directly to retained
earnings.
Freehold land is not depreciated. Plant and equipment
are stated at cost less accumulated depreciation and
accumulated impairment losses.
Depreciation is recognised so as to write off the cost or
valuation of assets (other than freehold land and properties
under construction) less their residual values over their
useful lives, using the straight-line method. The estimated
useful lives, residual values and depreciation method
are reviewed at the end of each reporting period, with
the effect of any changes in estimate accounted for on a
prospective basis.
The estimated useful lives of property, plant and equipment
are as follows:
Buildings 25 - 50 years
Plant and machinery 14 - 25 years
Furniture and equipment 4 - 10 years
Computer equipment 3 - 5 years
Motor vehicles 3 - 5 years
Assets held under finance leases are depreciated over their
expected useful lives on the same basis as owned assets or,
where shorter, the term of the relevant lease.
An item of property, plant and equipment is derecognised
upon disposal or when no future economic benefits are
expected to arise from the continued use of the asset. Any
gain or loss arising on the disposal or retirement of an item
of property, plant and equipment is determined as the
difference between the sales proceeds and the carrying
amount of the asset and is recognised in profit or loss.
Repairs and maintenance are charged to the income
statement during the financial period in which they are
incurred. The cost of major renovations is included in
the carrying amount of the asset when it is probable
that future economic benefits in excess of the originally
assessed standard of performance of the existing asset will
flow to the Group. Major renovations are depreciated over
the remaining useful life of the related asset.
INVESTMENT PROPERTIES
Investment properties are properties held to earn rentals
and/or for capital appreciation (including property under
BDC Annual Report 2014 45
construction for such purposes). Investment properties
are measured initially at cost, including transaction costs.
Subsequent to initial recognition, investment properties
are measured at fair value. Gains and losses arising from
changes in the fair value of investment properties are
included in profit or loss in the period in which they arise.
An investment property is derecognised upon disposal or
when the investment property is permanently withdrawn
from use and no future economic benefits are expected
from the disposal. Any gain or loss arising on derecognition
of the property (calculated as the difference between
the net disposal proceeds and the carrying amount of the
asset) is included in profit or loss in the period in which the
property is derecognised.
INTANGIBLE ASSETS
Intangible assets acquired separately
Intangible assets with finite useful lives that are acquired
separately are carried at cost less accumulated amortisation
and accumulated impairment losses. Amortisation is
recognised on a straight-line basis over their estimated
useful lives. The estimated useful life and amortisation
method are reviewed at the end of each reporting period,
with the effect of any changes in estimate being accounted
for on a prospective basis. Intangible assets with indefinite
useful lives that are acquired separately are carried at cost
less accumulated impairment losses.
Internally-generated intangible assets - research and
development expenditure
Expenditure on research activities is recognised as an
expense in the period in which it is incurred. An internally-
generated intangible asset arising from development
(or from the development phase of an internal project)
is recognised if, and only if, all of the following have been
demonstrated:
• the technical feasibility of completing the intangible
asset so that it will be available for use or sale;
• the intention t o complete the intangible asset and use
or sell it;
• the ability to use or sell the intangible asset;
• how the intangible asset will generate probable future
economic benefits;
• the availability of adequate technical, financial and
other resources to complete the development and to
use or sell the intangible asset; and
• the ability to measure reliably the expenditure
attributable to the intangible asset during its
development.
The amount initially recognised for internally-generated
intangible assets is the sum of the expenditure incurred
from the date when the intangible asset first meets the
recognition criteria listed above. Where no internally-
generated intangible asset can be recognised, development
expenditure is recognised in profit or loss in the period
in which it is incurred. Subsequent to initial recognition,
internally-generated intangible assets are reported at
cost less accumulated amortisation and accumulated
impairment losses, on the same basis as intangible assets
that are acquired separately.
Intangible assets acquired in a business combination
Intangible assets that are acquired in a business combination
are recognised separately from goodwill and are initially
recognised at their fair value at the acquisition date (which
is regarded as their cost). Subsequent to initial recognition,
intangible assets acquired in a business combination
are reported at cost less accumulated amortisation and
accumulated impairment losses, on the same basis as
intangible assets that are acquired separately.
Derecognition of intangible assets
An intangible asset is derecognised on disposal, or when
no future economic benefits are expected from its use
or disposal. Gains or losses arising from derecognition of
an intangible asset, measured as the difference between
the net disposal proceeds and the carrying amount of the
asset, and are recognised in profit or loss when the asset is
derecognised.
Impairment of tangible and intangible assets other than
goodwill
At the end of each reporting period, the Group reviews the
carrying amounts of its tangible and intangible assets to
determine whether there is any indication that those assets
have suffered an impairment loss. If any such indication
exists, the recoverable amount of the asset is estimated
in order to determine the extent of the impairment loss (if
any). Where it is not possible to estimate the recoverable
amount of an individual asset, the Group estimates the
recoverable amount of the cash-generating unit to which
the asset belongs. Where a reasonable and consistent basis
of allocation can be identified, corporate assets are also
allocated to individual cash-generating units, or otherwise
they are allocated to the smallest group of cash-generating
units for which a reasonable and consistent allocation basis
can be identified.
Intangible assets with indefinite useful lives and intangible
assets not yet available for use are tested for impairment at
least annually, and whenever there is an indication that the
asset may be impaired.
Recoverable amount is the higher of fair value less costs to
sell and value in use. In assessing value in use, the estimated
future cash flows are discounted to their present value
using a pre-tax discount rate that reflects current market
assessments of the time value of money and the risks
specific to the asset for which the estimates of future cash
flows have not been adjusted.
If the recoverable amount of an asset (or a cash-generating
unit) is estimated to be less than its carrying amount,
the carrying amount of the asset (or the cash-generating
unit) is reduced to its recoverable amount. An impairment
loss is recognised immediately in profit or loss, unless the
relevant asset is carried at a revalued amount, in which case
the impairment loss is treated as a revaluation decrease.
46 BDC Annual Report 2014
Where an impairment loss subsequently reverses, the
carrying amount of the asset (or a cash-generating unit) is
increased to the revised estimate of its recoverable amount,
but so that the increased carrying amount does not exceed
the carrying amount that would have been determined
had no impairment loss been recognised for the asset (or
the cash-generating unit) in prior years. A reversal of an
impairment loss is recognised immediately in profit or loss,
unless the relevant asset is carried at a revalued amount, in
which case the reversal of the impairment loss is treated as
a revaluation increase.
INVENTORIES
Inventories are stated at the lower of cost or net realisable
value. Cost is determined using the first-in first-out (FIFO)
method. The cost of finished goods and work in progress
comprises raw materials, direct labour, other direct costs
and related production overheads (based on normal
operating capacity) but excludes borrowing costs. Net
realisable value is the estimated selling price in the ordinary
course of business, less the costs of completion and selling
expenses. Provision is made for obsolete, slow- moving and
defective inventory.
CASH AND CASH EQUIVALENTS
Cash and cash equivalents are carried in the statement of
financial position at cost. For the purposes of the statement
of cash flows, cash and cash equivalents comprise cash
on hand, deposits held at call with banks, other short
highly liquid investments with original maturities of three
months and bank overdrafts. Bank overdrafts are included
within borrowings in current liabilities on the statement of
financial position.
PROVISIONS
Provisions are recognised when the Group has a present
obligation (legal or constructive) as a result of a past event,
it is probable that the Group will be required to settle the
obligation, and a reliable estimate can be made of the
amount of the obligation.
The amount recognised as a provision is the best estimate of
the consideration required to settle the present obligation
at the end of the reporting period, taking into account the
risks and uncertainties surrounding the obligation. When
a provision is measured using the cash flows estimated to
settle the present obligation, its carrying amount is the
present value of those cash flows (where the effect of the
time value of money is material).
When some or all of the economic benefits required to
settle a provision are expected to be recovered from a third
party, a receivable is recognised as an asset if it is virtually
certain that reimbursement will be received and the
amount of the receivable can be measured reliably.
Onerous contracts
Present obligations arising under onerous contracts
are recognised and measured as provisions. An onerous
contract is considered to exist where the Group has a
contract under which the unavoidable costs of meeting
the obligations under the contract exceed the economic
benefits expected to be received from the contract.
Restructurings
A restructuring provision is recognised when the Group has
developed a detailed formal plan for the restructuring and
has raised a valid expectation in those affected that it will
carry out the restructuring by starting to implement the
plan or announcing its main features to those affected by
it. The measurement of a restructuring provision includes
only the direct expenditures arising from the restructuring,
which are those amounts that are both necessarily entailed
by the restructuring and not associated with the ongoing
activities of the entity.
Warranties
Provisions for the expected cost of warranty obligations
under local sale of goods legislation are recognised at the
date of sale of the relevant products, at the directors’ best
estimate of the expenditure required to settle the Group’s
obligation.
Contingent liabilities acquired in a business combination
Contingent liabilities acquired in a business combination
are initially measured at fair value at the acquisition date. At
the end of subsequent reporting periods, such contingent
liabilities are measured at the higher of the amount that
would be recognised in accordance with IAS 37 Provisions,
Contingent Liabilities and Contingent Assets and the
amount initially recognised less cumulative amortisation
recognised in accordance with IAS 18 Revenue.
DIVIDEND RESERVE
Dividends proposed or declared after the statement of
financial position date are shown as a component of capital
and reserves as required by the Standard, and not as a
liability.
Related party transactions
Related parties are defined as those parties:
(a) directly, or indirectly through one or more intermediaries,
the party:
(i) controls, is controlled by, or is under common
control with, the entity (this includes parents,
subsidiaries and fellow subsidiaries);
(ii) has an interest in the entity that gives it
significant influence over the entity; or
(b) that are members of the key management personnel
of the entity or its parent including close members of the
family.
All dealings with related parties are transacted on an arm’s
length basis and accordingly included in profit or loss for
the year.
BDC Annual Report 2014 47
FINANCIAL INSTRUMENTS
Financial assets and financial liabilities are recognised
when a group entity becomes a party to the contractual
provisions of the instrument.
Financial assets and financial liabilities are initially measured
at fair value. Transaction costs that are directly attributable
to the acquisition or issue of financial assets and financial
liabilities (other than financial assets and financial liabilities
at fair value through profit or loss) are added to or deducted
from the fair value of the financial assets or financial
liabilities, as appropriate, on initial recognition. Transaction
costs directly attributable to the acquisition of financial
assets or financial liabilities at fair value through profit or
loss are recognised immediately in profit or loss.
FINANCIAL ASSETS
Financial assets are classified into the following specified
categories: financial assets ‘at fair value through profit or
loss’ (FVTPL), ‘held-to-maturity’ investments, ‘available-
for-sale’ (AFS) financial assets and ‘loans and receivables’.
The classification depends on the nature and purpose of
the financial assets and is determined at the time of initial
recognition. All regular way purchases or sales of financial
assets are recognised and derecognised on a trade date
basis. Regular way purchases or sales are purchases or sales
of financial assets that require delivery of assets within the
time frame established by regulation or convention in the
marketplace.
Effective interest method
The effective interest method is a method of calculating
the amortised cost of a debt instrument and of allocating
interest income over the relevant period. The effective
interest rate is the rate that exactly discounts estimated
future cash receipts (including all fees and points paid or
received that form an integral part of the effective interest
rate, transaction costs and other premiums or discounts)
through the expected life of the debt instrument, or, where
appropriate, a shorter period, to the net carrying amount
on initial recognition.
Income is recognised on an effective interest basis for debt
instruments other than those financial assets classified as
at FVTPL.
Financial assets at FVTPL
Financial assets are classified as at FVTPL when the financial
asset is either held for trading or it is designated as at FVTPL.
A financial asset is classified as held for trading if:
• it has been acquired principally for the purpose of
selling it in the near term; or
• on initial recognition it is part of a portfolio of identified
financial instruments that the Group manages
together and has a recent actual pattern of short-term
profit-taking; or
• it is a derivative that is not designated and effective as
a hedging instrument.
A financial asset other than a financial asset held for trading
may be designated as at FVTPL upon initial recognition if:
• such designation eliminates or significantly reduces a
measurement or recognition inconsistency that would
otherwise arise; or
• the financial asset forms part of a group of financial
assets or financial liabilities or both, which is managed
and its performance is evaluated on a fair value basis,
in accordance with the Group’s documented risk
management or investment strategy, and information
about the grouping is provided internally on that basis;
or
• it forms part of a contract containing one or
more embedded derivatives, and IAS 39 Financial
Instruments: Recognition and Measurement permits
the entire combined contract (asset or liability) to be
designated as at FVTPL.
Financial assets at FVTPL are stated at fair value, with any
gains or losses arising on remeasurement recognised in
profit or loss. The net gain or loss recognised in profit or
loss incorporates any dividend or interest earned on the
financial asset and is included in the net gains and losses on
investments in other comprehensive income. Fair value is
determined in the manner described in note 40.
Held-to-maturity investments
Held-to-maturity investments are non-derivative financial
assets with fixed or determinable payments and fixed
maturity dates that the Group has the positive intent
and ability to hold to maturity. Subsequent to initial
recognition, held-to-maturity investments are measured
at amortised cost using the effective interest method less
any impairment.
Available-for-sale financial assets (AFS financial assets)
AFS financial assets are non-derivatives that are either
designated as AFS or are not classified as (a) loans and
receivables, (b) held-to-maturity investments or (c)
financial assets at fair value through profit or loss.
Listed redeemable notes held by the Group that are traded
in an active market are classified as AFS and are stated at fair
value at the end of each reporting period. The Group also
has investments in unlisted shares that are not traded in an
active market but that are also classified as AFS financial
assets and stated at fair value at the end of each reporting
period (because the directors consider that fair value can be
reliably measured). Fair value is determined in the manner
described in note 43. Changes in the carrying amount
of AFS monetary financial assets relating to changes in
foreign currency rates, interest income calculated using
the effective interest method and dividends on AFS
equity investments are recognised in profit or loss. Other
changes in the carrying amount of available-for-sale
financial assets are recognised in other comprehensive
income and accumulated under the heading of investments

48 BDC Annual Report 2014
revaluation reserve. Where the investment is disposed of or
is determined to be impaired, the cumulative gain or loss
previously accumulated in the investments revaluation
reserve is reclassified to profit or loss.
Dividends on AFS equity instruments are recognised
in profit or loss when the Group’s right to receive the
dividends is established.
The fair value of AFS monetary financial assets denominated
in a foreign currency is determined in that foreign currency
and translated at the spot rate prevailing at the end of
the reporting period. The foreign exchange gains and
losses that are recognised in profit or loss are determined
based on the amortised cost of the monetary asset. Other
foreign exchange gains and losses are recognised in other
comprehensive income.
AFS equity investments that do not have a quoted market
price in an active market and whose fair value cannot
be reliably measured and derivatives that are linked to
and must be settled by delivery of such unquoted equity
investments are measured at cost less any identified
impairment losses at the end of each reporting period.
Loans and receivables
Loans and receivables are non-derivative financial assets
with fixed or determinable payments that are not quoted
in an active market. Loans and receivables (including trade
and other receivables, bank balances and cash, and related
party balances) are measured at amortised cost using the
effective interest method, less any impairment.
Interest income is recognised by applying the effective
interest rate, except for short-term receivables when the
recognition of interest would be immaterial.
Impairment of financial assets
Financial assets, other than those at FVTPL, are assessed
for indicators of impairment at the end of each reporting
period. Financial assets are considered to be impaired
when there is objective evidence that, as a result of one or
more events that occurred after the initial recognition of
the financial asset, the estimated future cash flows of the
investment have been affected.
For AFS equity investments, a significant or prolonged
decline in the fair value of the security below its cost is
considered to be objective evidence of impairment.
For all other financial assets, objective evidence of
impairment could include:
• significant financial difficulty of the issuer or
counterparty; or
• breach of contract, such as a default or delinquency in
interest or principal payments; or
• it becoming probable that the borrower will enter
bankruptcy or financial re-organisation; or
• the disappearance of an active market for that financial
asset because of financial difficulties.
For certain categories of financial assets, such as trade
receivables, assets that are assessed not to be impaired
individually are, in addition, assessed for impairment on
a collective basis. Objective evidence of impairment for
a portfolio of receivables could include the Group’s past
experience of collecting payments, an increase in the
number of delayed payments in the portfolio past the
average credit period of 60 days, as well as observable
changes in national or local economic conditions that
correlate with default on receivables.
For financial assets carried at amortised cost, the amount
of the impairment loss recognised is the difference
between the asset’s carrying amount and the present value
of estimated future cash flows, discounted at the financial
asset’s original effective interest rate.
For financial assets carried at cost, the amount of the
impairment loss is measured as the difference between
the asset’s carrying amount and the present value of the
estimated future cash flows discounted at the current
market rate of return for a similar financial asset. Such
impairment loss will not be reversed in subsequent periods.
The carrying amount of the financial asset is reduced by
the impairment loss directly for all financial assets with the
exception of trade receivables, where the carrying amount
is reduced through the use of an allowance account. When
a trade receivable is considered uncollectible, it is written
off against the allowance account. Subsequent recoveries
of amounts previously written off are credited against the
allowance account. Changes in the carrying amount of the
allowance account are recognised in profit or loss.
When an AFS financial asset is considered to be impaired,
cumulative gains or losses previously recognised in other
comprehensive income are reclassified to profit or loss in
the period.
For financial assets measured at amortised cost, if, in a
subsequent period, the amount of the impairment loss
decreases and the decrease can be related objectively to an
event occurring after the impairment was recognised, the
previously recognised impairment loss is reversed through
profit or loss to the extent that the carrying amount of the
investment at the date the impairment is reversed does not
exceed what the amortised cost would have been had the
impairment not been recognised.
In respect of AFS equity securities, impairment losses
previously recognised in profit or loss are not reversed
through profit or loss. Any increase in fair value subsequent
to an impairment loss is recognised in other comprehensive
income and accumulated under the heading of investments
revaluation reserve. In respect of AFS debt securities,
impairment losses are subsequently reversed through
profit or loss if an increase in the fair value of the investment
can be objectively related to an event occurring after the
recognition of the impairment loss.
BDC Annual Report 2014 49
Derecognition of financial assets
The Group derecognises a financial asset only when the
contractual rights to the cash flows from the asset expire,
or when it transfers the financial asset and substantially
all the risks and rewards of ownership of the asset to
another entity. If the Group neither transfers nor retains
substantially all the risks and rewards of ownership
and continues to control the transferred asset, the
Group recognises its retained interest in the asset and
an associated liability for amounts it may have to pay. If
the Group retains substantially all the risks and rewards
of ownership of a transferred financial asset, the Group
continues to recognise the financial asset and also
recognises a collateralised borrowing for the proceeds
received.
On derecognition of a financial asset in its entirety, the
difference between the asset’s carrying amount and the
sum of the consideration received and receivable and the
cumulative gain or loss that had been recognised in other
comprehensive income and accumulated in equity is
recognised in profit or loss.
On derecognition of a financial asset other than in its entirety
(e.g. when the Group retains an option to repurchase part
of a transferred asset or retains a residual interest that
does not result in the retention of substantially all the risks
and rewards of ownership and the Group retains control),
the Group allocates the previous carrying amount of the
financial asset between the part it continues to recognise
under continuing involvement, and the part it no longer
recognises on the basis of the relative fair values of those
parts on the date of the transfer. The difference between
the carrying amount allocated to the part that is no longer
recognised and the sum of the consideration received for
the part no longer recognised and any cumulative gain
or loss allocated to it that had been recognised in other
comprehensive income is recognised in profit or loss. A
cumulative gain or loss that had been recognised in other
comprehensive income is allocated between the part that
continues to be recognised and the part that is no longer
recognised on the basis of the relative fair values of those
parts.
FINANCIAL LIABILITIES AND EQUITY INSTRUMENTS
Classification as debt or equity
Debt and equity instruments issued by a group entity
are classified as either financial liabilities or as equity
in accordance with the substance of the contractual
arrangements and the definitions of a financial liability and
an equity instrument.
Equity instruments
An equity instrument is any contract that evidences a
residual interest in the assets of an entity after deducting
all of its liabilities. Equity instruments issued by the Group
are recognised at the proceeds received, net of direct issue
costs.
Repurchase of the Company’s own equity instruments is
recognised and deducted directly in equity. No gain or loss
is recognised in profit or loss on the purchase, sale, issue or
cancellation of the Company’s own equity instruments.
Compound instruments
The component parts of compound instruments
(convertible notes) issued by the Company are classified
separately as financial liabilities and equity in accordance
with the substance of the contractual arrangements
and the definitions of a financial liability and an equity
instrument. Conversion option that will be settled by the
exchange of a fixed amount of cash or another financial
asset for a fixed number of the Company’s own equity
instruments is an equity instrument.
At the date of issue, the fair value of the liability component
is estimated using the prevailing market interest rate
for similar non-convertible instruments. This amount is
recorded as a liability on an amortised cost basis using
the effective interest method until extinguished upon
conversion or at the instrument’s maturity date.
The conversion option classified as equity is determined
by deducting the amount of the liability component from
the fair value of the compound instrument as a whole.
This is recognised and included in equity, net of income tax
effects, and is not subsequently remeasured. In addition,
the conversion option classified as equity will remain in
equity until the conversion option is exercised, in which
case, the balance recognised in equity will be transferred
to stated capital. Where the conversion option remains
unexercised at the maturity date of the convertible note,
the balance recognised in equity will be transferred to
stated capital. No gain or loss is recognised in profit or loss
upon conversion or expiration of the conversion option.
Transaction costs that relate to the issue of the convertible
notes are allocated to the liability and equity components
in proportion to the allocation of the gross proceeds.
Transaction costs relating to the equity component are
recognised directly in equity. Transaction costs relating to
the liability component are included in the carrying amount
of the liability component and are amortised over the
lives of the convertible notes using the effective interest
method.
Financial liabilities
Financial liabilities are classified as either financial liabilities
‘at FVTPL’ or ‘other financial liabilities’.
A financial liability other than a financial liability held
for trading may be designated as at FVTPL upon initial
recognition if:
• such designation eliminates or significantly reduces a
measurement or recognition inconsistency that would
otherwise arise; or
• the financial liability forms part of a group of financial
assets or financial liabilities or both, which is managed
and its performance is evaluated on a fair value basis,
50 BDC Annual Report 2014
in accordance with the Group’s documented risk
management or investment strategy, and information
about the grouping is provided internally on that basis;
or
• it forms part of a contract containing one or
more embedded derivatives, and IAS 39 Financial
Instruments: Recognition and Measurement permits
the entire combined contract (asset or liability) to be
designated as at FVTPL.
Financial liabilities at FVTPL are stated at fair value, with
any gains or losses arising on remeasurement recognised
in profit or loss. The net gain or loss recognised in profit or
loss incorporates any interest paid on the financial liability
and is included in the ‘other gains and losses’ line item in the
consolidated statement of comprehensive income.
Other financial liabilities
Other financial liabilities (including borrowings) are
subsequently measured at amortised cost using the
effective interest method.
The effective interest method is a method of calculating
the amortised cost of a financial liability and of allocating
interest expense over the relevant period. The effective
interest rate is the rate that exactly discounts estimated
future cash payments (including all fees and points paid or
received that form an integral part of the effective interest
rate, transaction costs and other premiums or discounts)
through the expected life of the financial liability, or (where
appropriate) a shorter period, to the net carrying amount
on initial recognition.
Financial guarantee contracts
A financial guarantee contract is a contract that requires
the issuer to make specified payments to reimburse the
holder for a loss it incurs because a specified debtor fails to
make payments when due in accordance with the terms of
a debt instrument.
Financial guarantee contracts issued by the Group are
initially measured at their fair values and, if not designated
as at FVTPL, are subsequently measured at the higher of:
• the amount of the obligation under the contract, as
determined in accordance with IAS 37 Provisions,
Contingent Liabilities and Contingent Assets; and
• the amount initially recognised less, where
appropriate, cumulative amortisation recognised in
accordance with the revenue recognition policies.
Derecognition of financial liabilities
The Group derecognises financial liabilities when, and only
when, the Group’s obligations are discharged, cancelled or
they expire. The difference between the carrying amount
of the financial liability derecognised and the consideration
paid and payable is recognised in profit or loss.
CRITICAL ACCOUNTING ESTIMATES AND JUDGEMENTS IN APPLYING ACCOUNTING POLICIES
In the application of the Group’s accounting policies,
the Directors and Management are required to make
judgements, estimates and assumptions about the carrying
amounts of assets and liabilities that are not readily
apparent from other sources. The estimates and associated
assumptions are based on historical experience and other
factors that are considered to be relevant. Actual results
may differ from these estimates.
The estimates and underlying assumptions are reviewed
on an ongoing basis. Revisions to accounting estimates are
recognised in the period in which the estimate is revised
if the revision affects only that period or in the period of
the revision and future periods if the revision affects both
current and future periods.
KEY SOURCES OF ESTIMATION UNCERTAINTY
The following are assumptions concerning the future and
other key sources of estimation uncertainty at the end of
the reporting period, that have a significant risk of causing a
material adjustment to the carrying amounts of assets and
liabilities within the next financial year:
• the recognition of revenue and contract incentives;
• the recognition of penalties and claims on contracts;
• the calculation of the provision for doubtful debts;
• the calculation of the provision for obsolete
inventories;
• the determination of income tax and deferred taxation
liabilities;
• the calculation of any provision for claims, litigation
and other legal matters;
• the assessment of impairments and calculation of the
recoverable amounts of assets (including investments);
• the calculation of any other provisions including
warrantees, guarantees and bonuses; and
• the determination of useful lives and residual values of
items of property, plant and equipment.
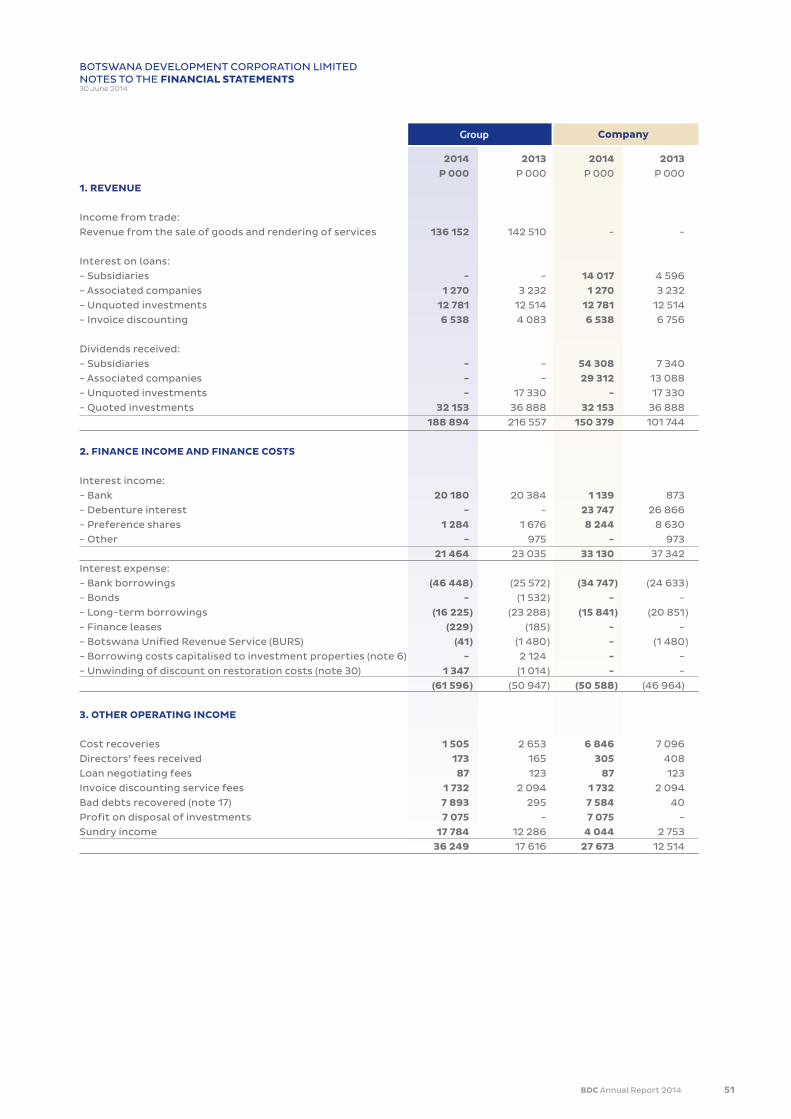
BDC Annual Report 2014 51
2014 2013 2014 2013 P 000 P 000 P 000 P 000
1. REVENUE
Income from trade:
Revenue from the sale of goods and rendering of services 136 152 142 510 - -
Interest on loans:
- Subsidiaries - - 14 017 4 596
- Associated companies 1 270 3 232 1 270 3 232
- Unquoted investments 12 781 12 514 12 781 12 514
- Invoice discounting 6 538 4 083 6 538 6 756
Dividends received:
- Subsidiaries - - 54 308 7 340
- Associated companies - - 29 312 13 088
- Unquoted investments - 17 330 - 17 330
- Quoted investments 32 153 36 888 32 153 36 888
188 894 216 557 150 379 101 744
2. FINANCE INCOME AND FINANCE COSTS
Interest income:
- Bank 20 180 20 384 1 139 873
- Debenture interest - - 23 747 26 866
- Preference shares 1 284 1 676 8 244 8 630
- Other - 975 - 973
21 464 23 035 33 130 37 342
Interest expense:
- Bank borrowings (46 448 ) (25 572 ) (34 747 ) (24 633 )
- Bonds - (1 532 ) - -
- Long-term borrowings (16 225 ) (23 288 ) (15 841 ) (20 851 )
- Finance leases (229 ) (185 ) - -
- Botswana Unified Revenue Service (BURS) (41 ) (1 480 ) - (1 480 )
- Borrowing costs capitalised to investment properties (note 6) - 2 124 - -
- Unwinding of discount on restoration costs (note 30) 1 347 (1 014 ) - -
(61 596 ) (50 947 ) (50 588 ) (46 964)
3. OTHER OPERATING INCOME
Cost recoveries 1 505 2 653 6 846 7 096
Directors’ fees received 173 165 305 408
Loan negotiating fees 87 123 87 123
Invoice discounting service fees 1 732 2 094 1 732 2 094
Bad debts recovered (note 17) 7 893 295 7 584 40
Profit on disposal of investments 7 075 - 7 075 -
Sundry income 17 784 12 286 4 044 2 753
36 249 17 616 27 673 12 514
BOTSWANA DEVELOPMENT CORPORATION LIMITEDNOTES TO THE FINANCIAL STATEMENTS30 June 2014
Group Company
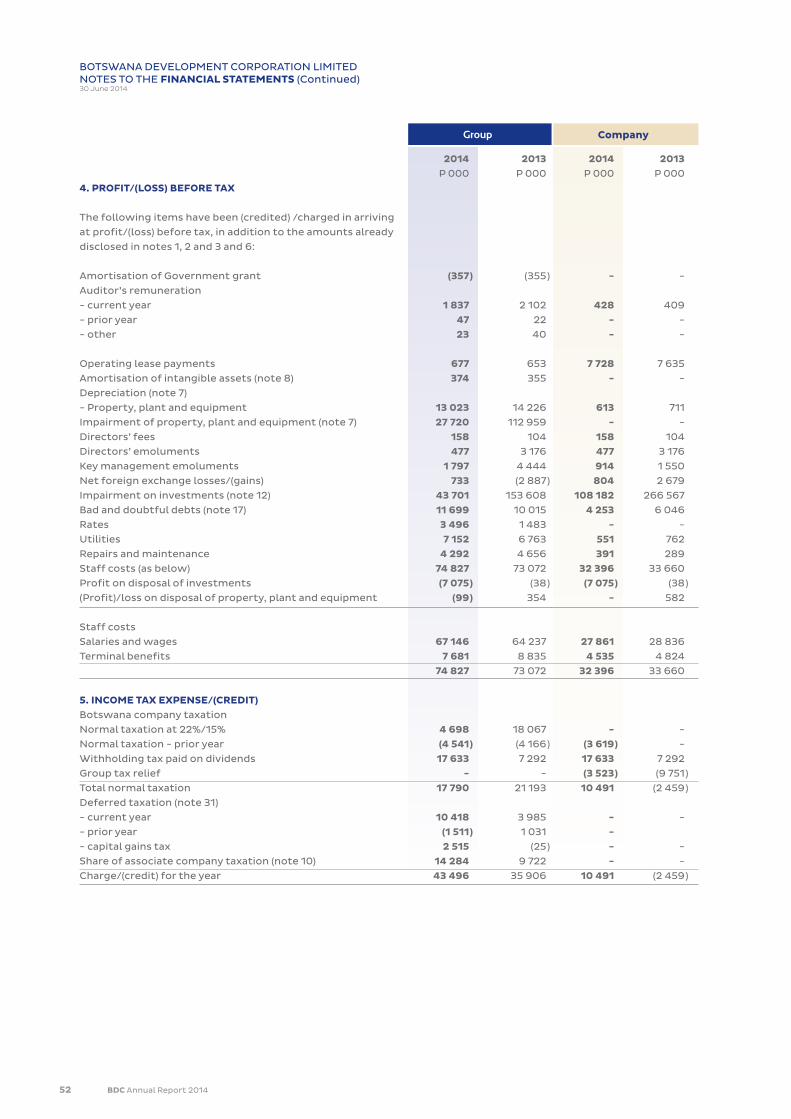
52 BDC Annual Report 2014
2014 2013 2014 2013 P 000 P 000 P 000 P 000
4. PROFIT/(LOSS) BEFORE TAX
The following items have been (credited) /charged in arriving
at profit/(loss) before tax, in addition to the amounts already
disclosed in notes 1, 2 and 3 and 6:
Amortisation of Government grant (357 ) (355 ) - -
Auditor’s remuneration
- current year 1 837 2 102 428 409
- prior year 47 22 - -
- other 23 40 - -
Operating lease payments 677 653 7 728 7 635
Amortisation of intangible assets (note 8) 374 355 - -
Depreciation (note 7)
- Property, plant and equipment 13 023 14 226 613 711
Impairment of property, plant and equipment (note 7) 27 720 112 959 - -
Directors’ fees 158 104 158 104
Directors’ emoluments 477 3 176 477 3 176
Key management emoluments 1 797 4 444 914 1 550
Net foreign exchange losses/(gains) 733 (2 887 ) 804 2 679
Impairment on investments (note 12) 43 701 153 608 108 182 266 567
Bad and doubtful debts (note 17) 11 699 10 015 4 253 6 046
Rates 3 496 1 483 - -
Utilities 7 152 6 763 551 762
Repairs and maintenance 4 292 4 656 391 289
Staff costs (as below) 74 827 73 072 32 396 33 660
Profit on disposal of investments (7 075 ) (38 ) (7 075 ) (38 )
(Profit)/loss on disposal of property, plant and equipment (99 ) 354 - 582
Staff costs
Salaries and wages 67 146 64 237 27 861 28 836
Terminal benefits 7 681 8 835 4 535 4 824
74 827 73 072 32 396 33 660
5. INCOME TAX EXPENSE/(CREDIT)Botswana company taxation
Normal taxation at 22%/15% 4 698 18 067 - -
Normal taxation - prior year (4 541 ) (4 166 ) (3 619 ) -
Withholding tax paid on dividends 17 633 7 292 17 633 7 292
Group tax relief - - (3 523 ) (9 751 )
Total normal taxation 17 790 21 193 10 491 (2 459 )
Deferred taxation (note 31)
- current year 10 418 3 985 - -
- prior year (1 511 ) 1 031 -
- capital gains tax 2 515 (25 ) - -
Share of associate company taxation (note 10) 14 284 9 722 - -
Charge/(credit) for the year 43 496 35 906 10 491 (2 459 )
BOTSWANA DEVELOPMENT CORPORATION LIMITEDNOTES TO THE FINANCIAL STATEMENTS (Continued)30 June 2014
Group Company
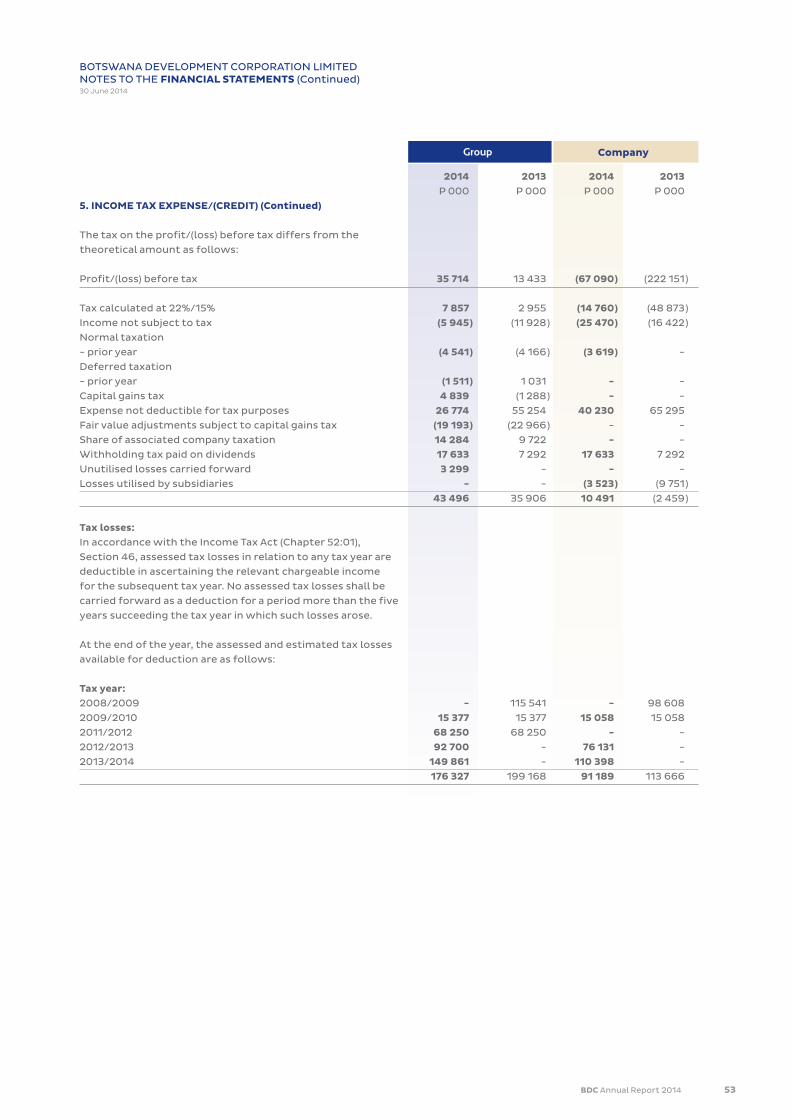
BDC Annual Report 2014 53
2014 2013 2014 2013 P 000 P 000 P 000 P 000
5. INCOME TAX EXPENSE/(CREDIT) (Continued)
The tax on the profit/(loss) before tax differs from the
theoretical amount as follows:
Profit/(loss) before tax 35 714 13 433 (67 090 ) (222 151 )
Tax calculated at 22%/15% 7 857 2 955 (14 760 ) (48 873 )
Income not subject to tax (5 945 ) (11 928 ) (25 470 ) (16 422 )
Normal taxation
- prior year (4 541 ) (4 166 ) (3 619 ) -
Deferred taxation
- prior year (1 511 ) 1 031 - -
Capital gains tax 4 839 (1 288 ) - -
Expense not deductible for tax purposes 26 774 55 254 40 230 65 295
Fair value adjustments subject to capital gains tax (19 193 ) (22 966 ) - -
Share of associated company taxation 14 284 9 722 - -
Withholding tax paid on dividends 17 633 7 292 17 633 7 292
Unutilised losses carried forward 3 299 - - -
Losses utilised by subsidiaries - - (3 523 ) (9 751 )
43 496 35 906 10 491 (2 459 )
Tax losses:In accordance with the Income Tax Act (Chapter 52:01),
Section 46, assessed tax losses in relation to any tax year are
deductible in ascertaining the relevant chargeable income
for the subsequent tax year. No assessed tax losses shall be
carried forward as a deduction for a period more than the five
years succeeding the tax year in which such losses arose.
At the end of the year, the assessed and estimated tax losses
available for deduction are as follows:
Tax year:2008/2009 - 115 541 - 98 608
2009/2010 15 377 15 377 15 058 15 058
2011/2012 68 250 68 250 - -
2012/2013 92 700 - 76 131 -
2013/2014 149 861 - 110 398 -
176 327 199 168 91 189 113 666
BOTSWANA DEVELOPMENT CORPORATION LIMITEDNOTES TO THE FINANCIAL STATEMENTS (Continued)30 June 2014
Group Company

54 BDC Annual Report 2014
2014 2013 P 000 P 000
6. INVESTMENT PROPERTIES
Land and buildings at fair value 1 888 681 1 580 628
Straight line lease rental adjustment (46 208 ) (41 779 )
Balance at end of year 1 842 473 1 538 849
Reconciliation of fair valueBalance at beginning of the year 1 538 849 1 200 253
At valuation 1 580 628 1 229 321
Straight line lease rental adjustment (41 779 ) (29 068 )
Additions during the year 191 200 224 137
Borrowing costs capitalised - 2 124
Transfers from properties, plant and equipment (note 7) 1 909 25 756
Transfer to assets classified as held for sale - (2 510 )
Fair value of investment properties 110 515 89 089
Increase in fair value during the year 114 944 101 800
Straight line lease rental adjustment (4 429 ) (12 711 )
Balance at end of the year 1 842 473 1 538 849
Fair value of investment propertiesThe fair value of the investment property has been arrived at
on the basis of valuations carried out at 30 June 2014 by
professional internal and external valuers. Both the internal
and external valuers are members of the Real Estate Institute
of Botswana and they have appropriate qualifications and
recent experience in the valuation of properties in the relevant
locations.
The valuations were done in conformity with and are subject
to the requirements of the Code of Professional Ethics and
Standards of Professional Conduct of the appraisal
organisations with which the valuers are affiliated. The market
value was determined by the valuers using an investment
valuation model for industrial and commercial properties.
The effective date of valuation was 30 June 2014.
All of the Company’s investment property is held under free
hold interests.
Investment property available for saleA subsidiary company is in the process of negotiating the sale
of an investment property. As a result the investment
property has been disclosed as an ”Asset classified as held
for sale”. Proceeds from this sale will be utilised for other
projects. The property has not been disposed yet as
management is currently in the process of
Transactions associated with investment properties are:Rental income 97 849 101 376
Repairs and maintenance expenses (2 630 ) (2 552 )
BOTSWANA DEVELOPMENT CORPORATION LIMITEDNOTES TO THE FINANCIAL STATEMENTS (Continued)30 June 2014
Group
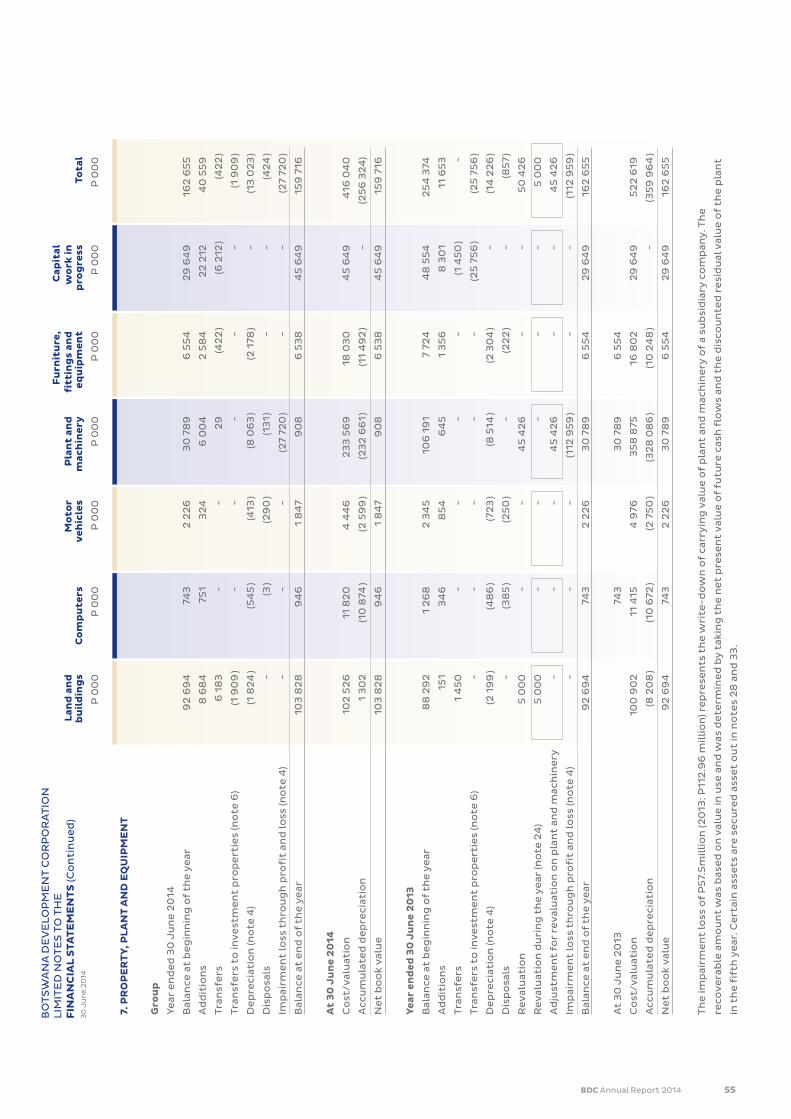
BDC Annual Report 2014 55
F
urn
itu
re,
C
apit
al
L
and
an
d
M
oto
r
Pla
nt
and
fi
ttin
gs
and
w
ork
in
b
uil
din
gs
C
om
pu
ters
v
ehic
les
m
ach
iner
y
equ
ipm
ent
p
rog
ress
To
tal
P
00
0
P 0
00
P
00
0
P 0
00
P
00
0
P 0
00
P
00
0
7. P
RO
PE
RT
Y, P
LA
NT
AN
D E
QU
IPM
EN
T
Gro
up
Ye
ar e
nd
ed
30
Ju
ne
20
14
Bal
ance
at
be
gin
nin
g o
f th
e y
ear
9
2 6
94
74
3
2 2
26
3
0 7
89
6
55
4
29
64
9
162
65
5
Ad
dit
ion
s 8
68
4
751
3
24
6
00
4
2 5
84
2
2 2
12
40
55
9
Tra
nsf
ers
6
18
3
-
-
29
(4
22
) (6
212
) (4
22
)
Tra
nsf
ers
to
inv
est
me
nt
pro
pe
rtie
s (n
ote
6)
(1 9
09
) -
-
-
-
-
(1
90
9 )
De
pre
ciat
ion
(no
te 4
) (1
82
4 )
(54
5 )
(413
) (8
06
3 )
(2 1
78 )
-
(13
02
3 )
Dis
po
sals
-
(3
) (2
90
) (1
31 )
-
-
(4
24
)
Imp
airm
en
t lo
ss t
hro
ug
h p
rofi
t an
d lo
ss (n
ote
4)
-
-
-
(27
720
) -
-
(2
7 72
0 )
Bal
ance
at
en
d o
f th
e y
ear
10
3 8
28
9
46
1
84
7
90
8
6 5
38
4
5 6
49
15
9 7
16
At
30
Ju
ne
20
14
Co
st/v
alu
atio
n
102
52
6
11 8
20
4
44
6
23
3 5
69
18
03
0
45
64
9
416
04
0
Acc
um
ula
ted
de
pre
ciat
ion
1
30
2
(10
874
) (2
59
9 )
(23
2 6
61 )
(1
1 4
92
) -
(2
56
32
4)
Ne
t b
oo
k v
alu
e
103
82
8
94
6
1 8
47
9
08
6
53
8
45
64
9
159
716
Yea
r en
ded
30
Ju
ne
20
13
Bal
ance
at
be
gin
nin
g o
f th
e y
ear
8
8 2
92
1
26
8
2 3
45
10
6 1
91
7
724
4
8 5
54
2
54
374
Ad
dit
ion
s 15
1
34
6
85
4
64
5
1 3
56
8
30
1
11 6
53
Tra
nsf
ers
1
45
0
-
-
-
-
(1 4
50
) -
Tra
nsf
ers
to
inv
est
me
nt
pro
pe
rtie
s (n
ote
6)
-
-
-
-
-
(25
75
6 )
(25
75
6 )
De
pre
ciat
ion
(no
te 4
) (2
19
9 )
(48
6 )
(72
3 )
(8 5
14 )
(2 3
04
) -
(1
4 2
26
)
Dis
po
sals
-
(3
85
) (2
50
) -
(2
22
) -
(8
57
)
Re
val
uat
ion
5
00
0
-
-
45
42
6
-
-
50
42
6
Re
val
uat
ion
du
rin
g t
he
ye
ar (n
ote
24
) 5
00
0
-
-
-
-
-
5 0
00
Ad
just
me
nt
for
rev
alu
atio
n o
n p
lan
t an
d m
ach
ine
ry
-
-
-
45
42
6
-
-
45
42
6
Imp
airm
en
t lo
ss t
hro
ug
h p
rofi
t an
d lo
ss (n
ote
4)
-
-
-
(112
95
9 )
-
-
(112
95
9 )
Bal
ance
at
en
d o
f th
e y
ear
9
2 6
94
74
3
2 2
26
3
0 7
89
6
55
4
29
64
9
162
65
5
At
30
Ju
ne
20
13
74
3
3
0 7
89
6
55
4
Co
st/v
alu
atio
n
100
90
2
11 4
15
4 9
76
35
8 8
75
16 8
02
2
9 6
49
5
22
619
Acc
um
ula
ted
de
pre
ciat
ion
(8
20
8 )
(10
672
) (2
75
0 )
(32
8 0
86
) (1
0 2
48
) -
(3
59
96
4 )
Ne
t b
oo
k v
alu
e
92
69
4
743
2
22
6
30
78
9
6 5
54
2
9 6
49
16
2 6
55
Th
e im
pai
rme
nt
loss
of
P5
7.5
mil
lio
n (2
013
: P11
2.9
6 m
illi
on
) re
pre
sen
ts t
he
wri
te-d
ow
n o
f ca
rry
ing
val
ue
of
pla
nt
and
mac
hin
ery
of
a su
bsi
dia
ry c
om
pan
y. T
he
reco
ve
rab
le a
mo
un
t w
as b
ase
d o
n v
alu
e in
use
an
d w
as d
ete
rmin
ed
by
tak
ing
th
e n
et
pre
sen
t v
alu
e o
f fu
ture
cas
h f
low
s an
d t
he
dis
cou
nte
d r
esi
du
al v
alu
e o
f th
e p
lan
t
in t
he
fif
th y
ear
. Ce
rtai
n a
sse
ts a
re s
ecu
red
ass
et
ou
t in
no
tes
28
an
d 3
3.
BO
TS
WA
NA
DE
VE
LOP
ME
NT
CO
RP
OR
AT
ION
L
IMIT
ED
NO
TE
S T
O T
HE
F
INA
NC
IAL
STA
TE
ME
NT
S (C
on
tin
ue
d)
30
Ju
ne
20
14
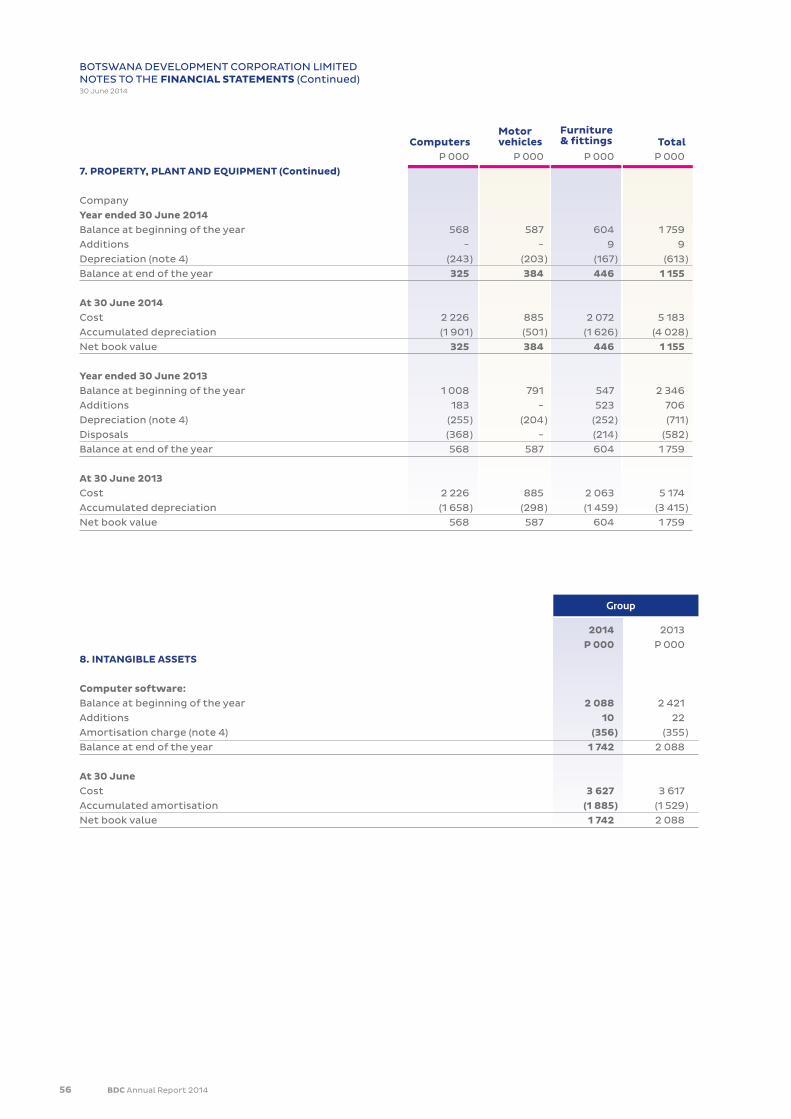
56 BDC Annual Report 2014
P 000 P 000 P 000 P 000
7. PROPERTY, PLANT AND EQUIPMENT (Continued)
Company
Year ended 30 June 2014Balance at beginning of the year 568 587 604 1 759
Additions - - 9 9
Depreciation (note 4) (243 ) (203 ) (167 ) (613 )
Balance at end of the year 325 384 446 1 155
At 30 June 2014Cost 2 226 885 2 072 5 183
Accumulated depreciation (1 901 ) (501 ) (1 626 ) (4 028 )
Net book value 325 384 446 1 155
Year ended 30 June 2013Balance at beginning of the year 1 008 791 547 2 346
Additions 183 - 523 706
Depreciation (note 4) (255 ) (204 ) (252 ) (711 )
Disposals (368 ) - (214 ) (582 )
Balance at end of the year 568 587 604 1 759
At 30 June 2013Cost 2 226 885 2 063 5 174
Accumulated depreciation (1 658 ) (298 ) (1 459 ) (3 415 )
Net book value 568 587 604 1 759
BOTSWANA DEVELOPMENT CORPORATION LIMITEDNOTES TO THE FINANCIAL STATEMENTS (Continued)30 June 2014
ComputersMotorvehicles Total
Furniture& fittings
2014 2013
P 000 P 000
8. INTANGIBLE ASSETS
Computer software:Balance at beginning of the year 2 088 2 421
Additions 10 22
Amortisation charge (note 4) (356 ) (355 )
Balance at end of the year 1 742 2 088
At 30 JuneCost 3 627 3 617
Accumulated amortisation (1 885 ) (1 529 )
Net book value 1 742 2 088
Group
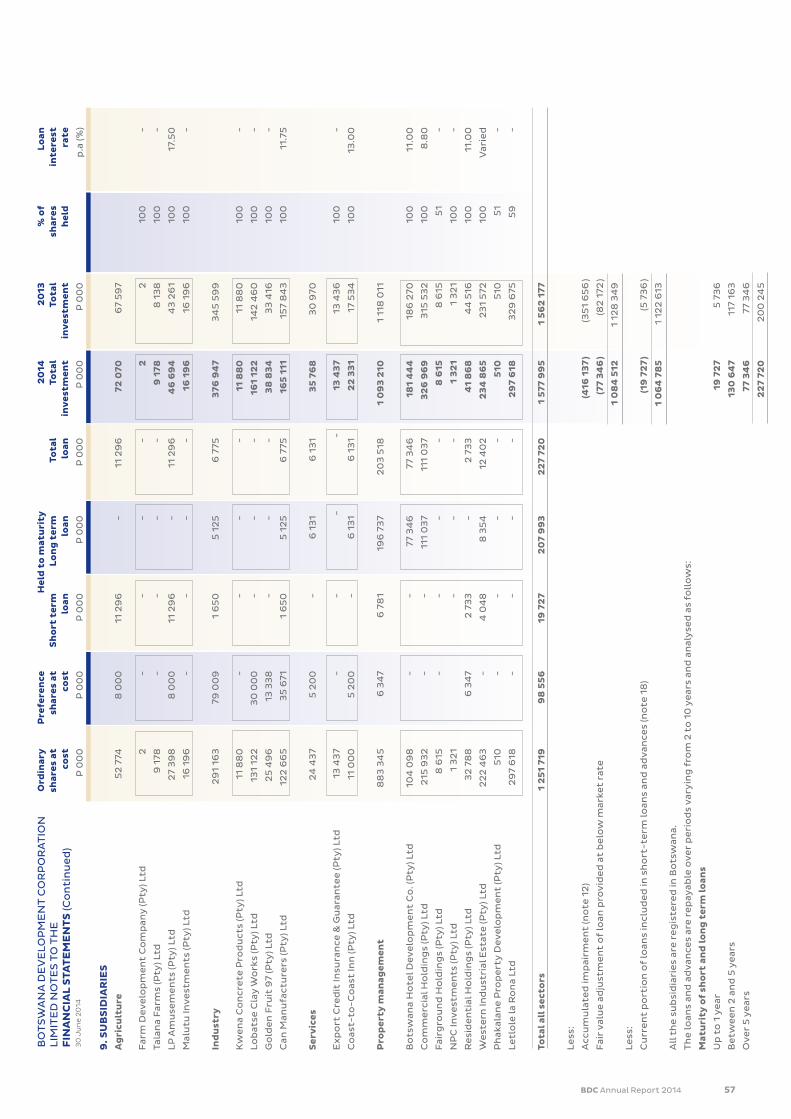
BDC Annual Report 2014 57
O
rdin
ary
P
refe
ren
ce
Hel
d t
o m
atu
rity
20
14
20
13
% o
f
Lo
an
shar
es a
t
shar
es a
t
Sh
ort
ter
m
Lo
ng
ter
m
Tota
l
Tota
l
Tota
l
shar
es
inte
rest
co
st
cost
lo
an
loan
lo
an
inv
estm
ent
in
ves
tmen
t
hel
d
rate
P
00
0
P 0
00
P
00
0
P 0
00
P
00
0
P 0
00
P
00
0
p
.a (%
)
9. S
UB
SID
IAR
IES
A
gri
cult
ure
5
2 7
74
8 0
00
11
29
6
-
11 2
96
72
070
6
7 5
97
Far
m D
ev
elo
pm
en
t C
om
pan
y (P
ty) L
td
2
-
-
-
-
2
2
100
-
Tala
na
Far
ms
(Pty
) Ltd
9
178
-
-
-
-
9
178
8
13
8
100
-
LP
Am
use
me
nts
(Pty
) Ltd
2
7 3
98
8
00
0
11 2
96
-
11
29
6
46
69
4
43
26
1
100
17
.50
Mal
utu
Inv
est
me
nts
(Pty
) Ltd
16
19
6
-
-
-
-
16 1
96
16
19
6
100
-
Ind
ust
ry
29
1 16
3
79 0
09
1
65
0
5 1
25
6
775
3
76 9
47
3
45
59
9
Kw
en
a C
on
cre
te P
rod
uct
s (P
ty) L
td
11 8
80
-
-
-
-
11
88
0
11 8
80
10
0
-
Lo
bat
se C
lay
Wo
rks
(Pty
) Ltd
13
1 12
2
30
00
0
-
-
-
161
122
14
2 4
60
10
0
-
Go
lde
n F
ruit
97
(Pty
) Ltd
2
5 4
96
13
33
8
-
-
-
38
83
4
33
416
10
0
-
Can
Man
ufa
ctu
rers
(Pty
) Ltd
12
2 6
65
3
5 6
71
1 6
50
5
12
5
6 7
75
165
111
15
7 8
43
10
0
11.7
5
Ser
vic
es
24
43
7
5 2
00
-
6
13
1
6 1
31
3
5 7
68
3
0 9
70
Ex
po
rt C
red
it In
sura
nce
& G
uar
ante
e (P
ty) L
td
13 4
37
-
-
-
- 13
43
7
13 4
36
10
0
-
Co
ast-
to-C
oas
t In
n (P
ty) L
td
11 0
00
5
20
0
-
6 1
31
6
13
1
22
33
1
17 5
34
10
0
13.0
0
Pro
per
ty m
anag
emen
t 8
83
34
5
6 3
47
6
78
1
196
73
7
20
3 5
18
1 0
93
210
1
118
011
Bo
tsw
ana
Ho
tel D
ev
elo
pm
en
t C
o. (
Pty
) Ltd
10
4 0
98
-
-
77
34
6
77 3
46
18
1 4
44
18
6 2
70
100
11
.00
Co
mm
erc
ial H
old
ing
s (P
ty) L
td
215
93
2
-
-
111
03
7
111
03
7
32
6 9
69
3
15 5
32
10
0
8.8
0
Fai
rgro
un
d H
old
ing
s (P
ty) L
td
8 6
15
-
-
-
-
8 6
15
8 6
15
51
-
NP
C In
ve
stm
en
ts (P
ty) L
td
1 3
21
-
-
-
1 3
21
1
32
1
100
-
Re
sid
en
tial
Ho
ldin
gs
(Pty
) Ltd
3
2 7
88
6
34
7
2 7
33
-
2
73
3
41
86
8
44
516
10
0
11.0
0
We
ste
rn In
du
stri
al E
stat
e (P
ty) L
td
22
2 4
63
-
4
04
8
8 3
54
12
40
2
23
4 8
65
2
31
572
10
0
Var
ied
Ph
akal
ane
Pro
pe
rty
De
ve
lop
me
nt
(Pty
) Ltd
5
10
-
-
-
-
510
5
10
51
-
Le
tlo
le la
Ro
na
Ltd
2
97
618
-
-
-
-
2
97
618
3
29
675
5
9
-
Tota
l all
sec
tors
1
25
1 71
9
98
55
6
19 7
27
2
07
99
3
22
7 72
0
1 5
77 9
95
1
56
2 1
77
Le
ss:
Acc
um
ula
ted
imp
airm
en
t (n
ote
12
)
(416
13
7 )
(35
1 6
56
)
Fai
r v
alu
e a
dju
stm
en
t o
f lo
an p
rov
ide
d a
t b
elo
w m
arke
t ra
te
(7
7 3
46
) (8
2 1
72 )
1 0
84
512
1
128
34
9
Le
ss:
Cu
rre
nt
po
rtio
n o
f lo
ans
incl
ud
ed
in s
ho
rt-t
erm
loan
s an
d a
dv
ance
s (n
ote
18
)
(1
9 7
27
) (5
73
6 )
1 0
64
78
5
1 12
2 6
13
All
th
e s
ub
sid
iari
es
are
re
gis
tere
d in
Bo
tsw
ana.
Th
e lo
ans
and
ad
van
ces
are
re
pay
able
ov
er
pe
rio
ds
var
yin
g f
rom
2 t
o 1
0 y
ear
s an
d a
nal
yse
d a
s fo
llo
ws:
Mat
uri
ty o
f sh
ort
an
d lo
ng
ter
m lo
ans
Up
to
1 y
ear
19 7
27
5
73
6
Be
twe
en
2 a
nd
5 y
ear
s
130
64
7
117
163
Ov
er
5 y
ear
s
77 3
46
77
34
6
22
7 72
0
20
0 2
45
BO
TS
WA
NA
DE
VE
LOP
ME
NT
CO
RP
OR
AT
ION
L
IMIT
ED
NO
TE
S T
O T
HE
F
INA
NC
IAL
STA
TE
ME
NT
S (C
on
tin
ue
d)
30
Ju
ne
20
14

58 BDC Annual Report 2014
BO
TS
WA
NA
DE
VE
LOP
ME
NT
CO
RP
OR
AT
ION
LIM
ITE
D
NO
TE
S T
O T
HE
FIN
AN
CIA
L S
TAT
EM
EN
TS
(Co
nti
nu
ed
)3
0 J
un
e 2
014
O
rdin
ary
P
refe
ren
ce
Hel
d t
o m
atu
rity
To
tal
P
ost
2
014
2
013
%
of
L
oan
sh
ares
at
sh
ares
at
S
ho
rt t
erm
L
on
g t
erm
lo
an/
ac
qu
isit
ion
To
tal
To
tal
sh
ares
in
tere
st
cost
co
st
loan
lo
an
deb
entu
re
rese
rves
in
ves
tmen
t
inv
estm
ent
h
eld
ra
te
P
00
0
P 0
00
P
00
0
P 0
00
P
00
0
P 0
00
P
00
0
P 0
00
p.a
(%)
10. A
SS
OC
IAT
ED
CO
MP
AN
IES
/PA
RT
NE
RS
HIP
S
Ag
ricu
ltu
re
10 4
77
10 0
00
-
9
33
4
9 3
34
(1
0 5
54
) 19
25
7
17 1
50
Bo
tala
na
Ve
ntu
res
(Pty
) Ltd
3
83
5
7 5
00
-
6
06
7
6 0
67
(6
48
7 )
10 9
15
10 5
89
3
3
17.5
0
Kw
alap
e (P
ty) L
td
2 2
10
2 5
00
-
3
26
7
3 2
67
(8
32
) 7
145
6
25
3
40
17
.50
Mar
ek
ise
tso
A M
ero
go
(Pty
) Ltd
4
43
2
-
-
-
-
(3 2
35
) 1
197
3
08
3
3
-
Ind
ust
ry
141
96
9
57
23
2
-
32
8 0
89
3
28
08
9
32
64
1
55
9 9
31
5
56
56
5
Asp
hal
t B
ots
wan
a (P
ty) L
td
6 8
04
-
-
-
-
2
1 5
30
2
8 3
34
4
1 2
80
4
8
-
Fe
ng
yu
e G
lass
Man
ufa
ctu
rin
g (B
ots
wan
a) (P
ty) L
td
132
470
5
7 2
32
-
3
28
08
9
32
8 0
89
-
5
17 7
91
4
93
82
1
43
11
.75
Kw
en
a R
ocl
a (P
ty) L
td
2 6
95
-
-
-
-
11
111
13
80
6
14 8
36
4
9
-
Tan
ne
ry In
du
stri
es
(Bo
tsw
ana)
(Pty
) Ltd
-
-
-
-
-
-
-
6
62
8
32
-
Ser
vic
es
38
113
-
-
-
-
17
3 4
09
2
11 5
22
15
8 5
43
Pe
erm
on
t G
lob
al (B
ots
wan
a) L
td
3 0
00
-
-
-
-
4
9 4
59
5
2 4
59
6
0 6
32
4
0
-
He
alth
care
Ho
ldin
gs
(Pty
) Ltd
3
80
9
-
-
-
-
15 0
05
18
814
17
08
4
30
-
Inv
est
ec
Ho
ldin
gs
Bo
tsw
ana
Ltd
8
70
-
-
-
-
1 3
57
2
22
7
3 0
89
2
4
-
Tra
nsU
nio
n (P
ty) L
td
147
-
-
-
-
1
731
1
878
2
29
7
49
-
Mas
hat
u N
atu
re R
ese
rve
(Pty
) Ltd
10
28
7
-
-
-
-
72 0
31
8
2 3
18
37
69
0
30
-
Me
tro
po
lita
n L
ife
of
Bo
tsw
ana
Ltd
2
0 0
00
-
-
-
-
3
3 8
26
5
3 8
26
3
7 75
1
25
-
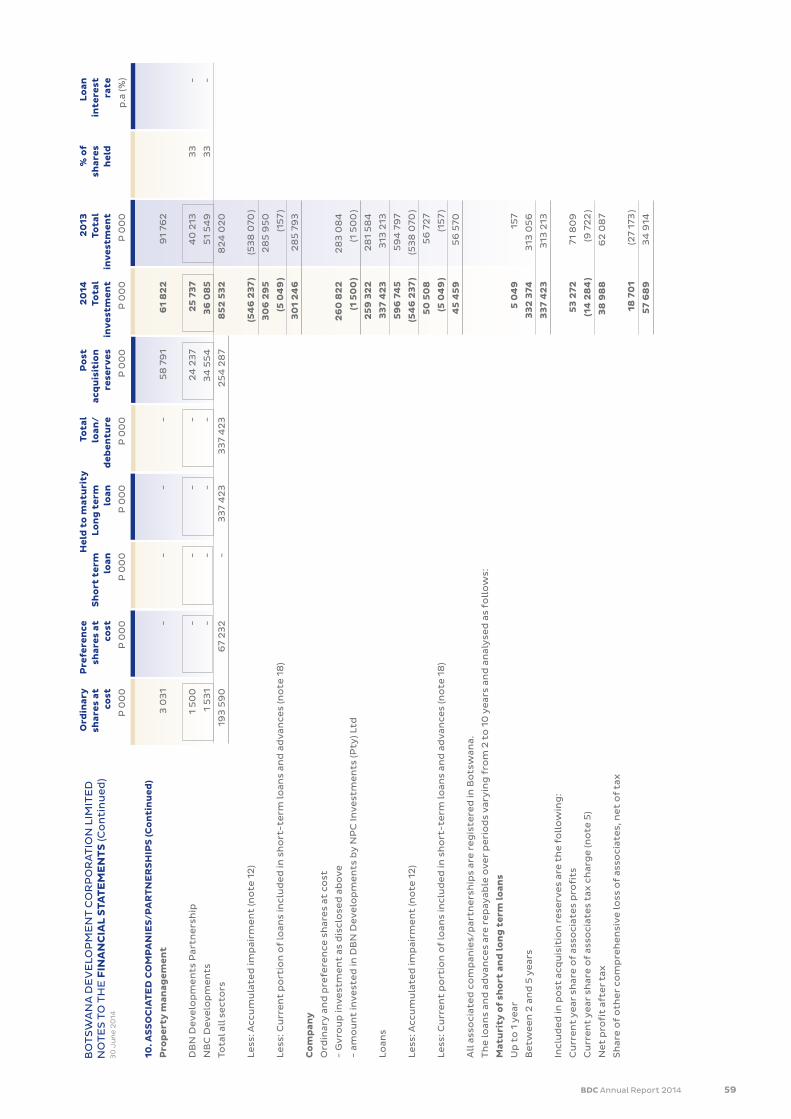
BDC Annual Report 2014 59
O
rdin
ary
P
refe
ren
ce
Hel
d t
o m
atu
rity
To
tal
P
ost
2
014
2
013
%
of
L
oan
sh
ares
at
sh
ares
at
S
ho
rt t
erm
L
on
g t
erm
lo
an/
ac
qu
isit
ion
To
tal
To
tal
sh
ares
in
tere
st
cost
co
st
loan
lo
an
deb
entu
re
rese
rves
in
ves
tmen
t
inv
estm
ent
h
eld
ra
te
P
00
0
P 0
00
P
00
0
P 0
00
P
00
0
P 0
00
P
00
0
P 0
00
p.a
(%)
10. A
SS
OC
IAT
ED
CO
MP
AN
IES
/PA
RT
NE
RS
HIP
S (C
on
tin
ued
)
Pro
per
ty m
anag
emen
t 3
03
1
-
-
-
-
58
79
1
61
82
2
91
762
DB
N D
ev
elo
pm
en
ts P
artn
ers
hip
1
50
0
-
-
-
-
24
23
7
25
73
7
40
213
3
3
-
NB
C D
ev
elo
pm
en
ts
1 5
31
-
-
-
-
3
4 5
54
3
6 0
85
5
1 5
49
3
3
-
Tota
l all
se
cto
rs
193
59
0
67
23
2
-
33
7 4
23
3
37
42
3
25
4 2
87
8
52
53
2
82
4 0
20
Le
ss: A
ccu
mu
late
d im
pai
rme
nt
(no
te 1
2)
(54
6 2
37
) (5
38
070
)
3
06
29
5
28
5 9
50
Le
ss: C
urr
en
t p
ort
ion
of
loan
s in
clu
de
d in
sh
ort
-te
rm lo
ans
and
ad
van
ces
(no
te 1
8)
(5
04
9 )
(15
7 )
3
01
24
6
28
5 7
93
Co
mp
any
Ord
inar
y a
nd
pre
fere
nce
sh
are
s at
co
st
- G
vro
up
inv
est
me
nt
as d
iscl
ose
d a
bo
ve
2
60
82
2
28
3 0
84
- am
ou
nt
inv
est
ed
in D
BN
De
ve
lop
me
nts
by
NP
C In
ve
stm
en
ts (P
ty) L
td
(1 5
00
) (1
50
0 )
2
59
32
2
28
1 5
84
Lo
ans
33
7 4
23
3
13 2
13
5
96
74
5
5
94
79
7
Le
ss: A
ccu
mu
late
d im
pai
rme
nt
(no
te 1
2)
(54
6 2
37
) (5
38
070
)
5
0 5
08
5
6 7
27
Le
ss: C
urr
en
t p
ort
ion
of
loan
s in
clu
de
d in
sh
ort
-te
rm lo
ans
and
ad
van
ces
(no
te 1
8)
(5
04
9 )
(15
7 )
4
5 4
59
5
6 5
70
All
ass
oci
ate
d c
om
pan
ies/
par
tne
rsh
ips
are
re
gis
tere
d in
Bo
tsw
ana.
Th
e lo
ans
and
ad
van
ces
are
re
pay
able
ov
er
pe
rio
ds
var
yin
g f
rom
2 t
o 1
0 y
ear
s an
d a
nal
yse
d a
s fo
llo
ws:
Mat
uri
ty o
f sh
ort
an
d lo
ng
ter
m lo
ans
Up
to
1 y
ear
5
04
9
157
Be
twe
en
2 a
nd
5 y
ear
s
3
32
374
3
13 0
56
3
37
42
3
313
213
Incl
ud
ed
in p
ost
acq
uis
itio
n r
ese
rve
s ar
e t
he
fo
llo
win
g:
Cu
rre
nt
ye
ar s
har
e o
f as
soci
ate
s p
rofi
ts
53
272
71
80
9
Cu
rre
nt
ye
ar s
har
e o
f as
soci
ate
s ta
x c
har
ge
(no
te 5
)
(1
4 2
84
) (9
72
2 )
Ne
t p
rofi
t af
ter
tax
3
8 9
88
6
2 0
87
Sh
are
of
oth
er
com
pre
he
nsi
ve
loss
of
asso
ciat
es,
ne
t o
f ta
x
18
70
1
(27
173
)
5
7 6
89
3
4 9
14
BO
TS
WA
NA
DE
VE
LOP
ME
NT
CO
RP
OR
AT
ION
LIM
ITE
D
NO
TE
S T
O T
HE
FIN
AN
CIA
L S
TAT
EM
EN
TS
(Co
nti
nu
ed
)3
0 J
un
e 2
014
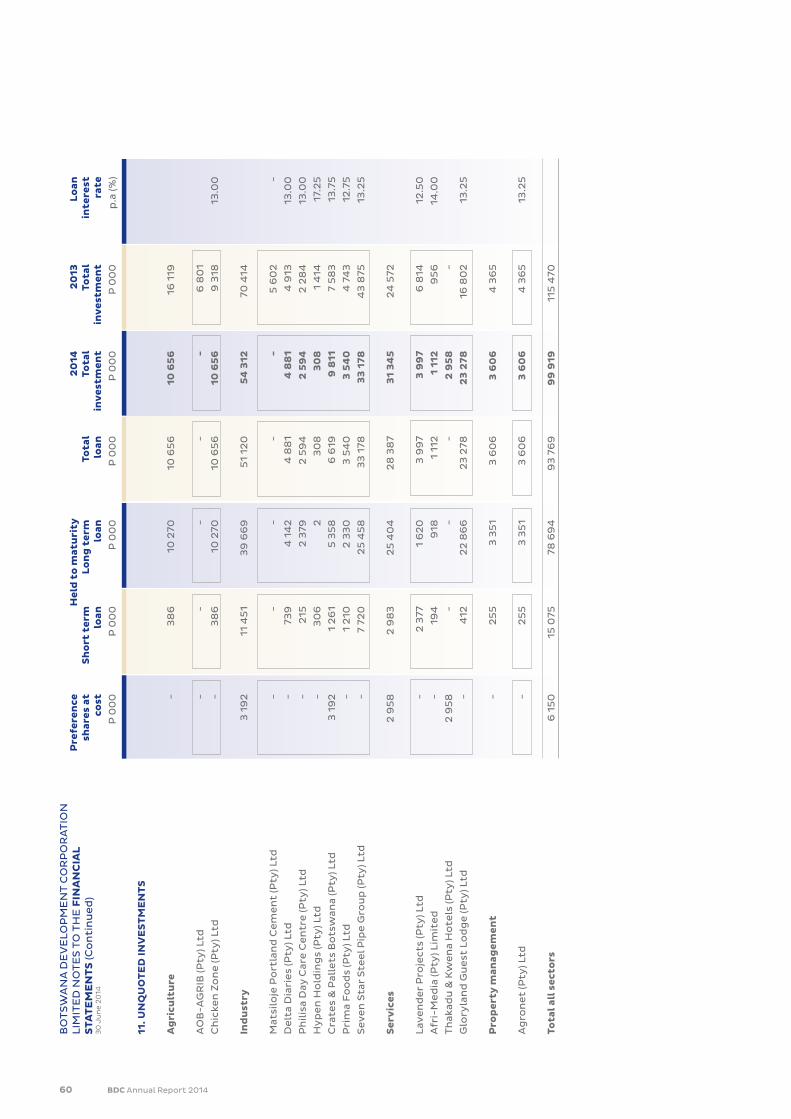
60 BDC Annual Report 2014
P
refe
ren
ce
Hel
d t
o m
atu
rity
20
14
20
13
Lo
an
shar
es a
t
Sh
ort
ter
m
Lo
ng
ter
m
Tota
l
Tota
l
Tota
l
inte
rest
co
st
loan
lo
an
loan
in
ves
tmen
t
inv
estm
ent
ra
te
P 0
00
P
00
0
P 0
00
P
00
0
P 0
00
P
00
0
p.a
(%)
11. U
NQ
UO
TE
D IN
VE
ST
ME
NT
S
Ag
ricu
ltu
re
-
38
6
10 2
70
10 6
56
10
65
6
16 1
19
AO
B-A
GR
IB (P
ty) L
td
-
-
-
-
-
6 8
01
Ch
icke
n Z
on
e (P
ty) L
td
-
38
6
10 2
70
10 6
56
10
65
6
9 3
18
13.0
0
Ind
ust
ry
3 1
92
11
45
1
39
66
9
51
120
5
4 3
12
70 4
14
Mat
silo
je P
ort
lan
d C
em
en
t (P
ty) L
td
-
-
-
-
-
5 6
02
-
De
lta
Dia
rie
s (P
ty) L
td
-
739
4
14
2
4 8
81
4
88
1
4 9
13
13.0
0
Ph
ilis
a D
ay C
are
Ce
ntr
e (P
ty) L
td
-
215
2
379
2
59
4
2 5
94
2
28
4
13.0
0
Hy
pe
n H
old
ing
s (P
ty) L
td
-
30
6
2
30
8
30
8
1 4
14
17.2
5
Cra
tes
& P
alle
ts B
ots
wan
a (P
ty) L
td
3 1
92
1
26
1
5 3
58
6
619
9
811
7
58
3
13.7
5
Pri
ma
Fo
od
s (P
ty) L
td
-
1 2
10
2 3
30
3
54
0
3 5
40
4
74
3
12.7
5
Se
ve
n S
tar
Ste
el P
ipe
Gro
up
(Pty
) Ltd
-
7
720
2
5 4
58
3
3 1
78
33
178
4
3 8
75
13.2
5
Ser
vic
es
2 9
58
2
98
3
25
40
4
28
38
7
31
34
5
24
572
Lav
en
de
r P
roje
cts
(Pty
) Ltd
-
2
377
1
62
0
3 9
97
3
99
7
6 8
14
12.5
0
Afr
i-M
ed
ia (P
ty) L
imit
ed
-
19
4
918
1
112
1
112
9
56
14
.00
Th
akad
u &
Kw
en
a H
ote
ls (P
ty) L
td
2 9
58
-
-
-
2
95
8
-
Glo
ryla
nd
Gu
est
Lo
dg
e (P
ty) L
td
-
412
2
2 8
66
2
3 2
78
23
278
16
80
2
13.2
5
Pro
per
ty m
anag
emen
t -
2
55
3
35
1
3 6
06
3
60
6
4 3
65
Ag
ron
et
(Pty
) Ltd
-
2
55
3
35
1
3 6
06
3
60
6
4 3
65
13
.25
Tota
l all
sec
tors
6
15
0
15 0
75
78 6
94
9
3 7
69
9
9 9
19
115
470
BO
TS
WA
NA
DE
VE
LOP
ME
NT
CO
RP
OR
AT
ION
L
IMIT
ED
NO
TE
S T
O T
HE
FIN
AN
CIA
L S
TAT
EM
EN
TS
(Co
nti
nu
ed
)3
0 J
un
e 2
014

BDC Annual Report 2014 61
Group and Company
2014 2013 P 000 P 000
11. UNQUOTED INVESTMENTS (Continued)
Total all sectors 99 919 115 470
Accumulated impairment (49 918 ) (14 384 )
50 001 101 086
Less: Current portion of loans included in short-term loans and advances (note 18) (15 075 ) (16 067 )
34 926 85 019
All unquoted investments are registered in Botswana.
The loans and advances are repayable over periods varying from 2 to 10 years and
analysed as follows:
Maturity of short and long term loansUp to 1 year 15 075 16 067
Between 2 and 5 years 78 694 88 513
93 769 104 580
Securities pledged for the above loans 1 243 537 264 387
At the financial year end the value of security obtained on individual loans was greater
than the carrying amounts of the respective loans.
2014 2013 2014 2013 P 000 P 000 P 000 P 000
12. ACCUMULATED IMPAIRMENT OF INVESTMENTS
Balance at beginning of the year 552 454 398 846 904 110 637 543
Increase in impairment during the year (note 4) 43 701 153 608 108 182 266 567
Balance at end of the year 596 155 552 454 1 012 292 904 110
Represents provision against:Subsidiaries (note 9) - - 416 137 351 656
Associated companies/partnerships (note 10) 546 237 538 070 546 237 538 070
Unquoted investments (note 11) 49 918 14 384 49 918 14 384
596 155 552 454 1 012 292 904 110
13. QUOTED INVESTMENTSShares at cost 150 552 150 552 150 552 150 552
Net gain transferred to fair value reserve (note 23) 680 421 476 815 680 421 476 815
Shares at market value 830 973 627 367 830 973 627 367
At cost comprising:
Sechaba Breweries Holdings Ltd 72 612 72 612 72 612 72 612
Cresta Marakanelo Ltd 77 940 77 940 77 940 77 940
150 552 150 552 150 552 150 552
The Company holds 34,044,315 (2013: 34,044, 315) and 50,283,975 (2013: 50,283,975) ordinary shares in Sechaba Breweries
Holdings Ltd and Cresta Marakanelo Ltd, respectively.
Although the Company owns 25% (2013: 25%) Of Sechaba Breweries Holdings Ltd’s issued capital, the equity method of
accounting is not followed as the Company does not exercise significant influence over Sechaba Breweries Holdings Ltd’s
financial and operating policies.
Although the Company owns 27% (2013: 27%) of Cresta Marakanelo Ltd’s issued capital, the equity method of accounting is
not followed as the company does not exercise significant influence over Cresta Marakanelo Ltd’s financial and operating
policies.
Group Company
BOTSWANA DEVELOPMENT CORPORATION LIMITEDNOTES TO THE FINANCIAL STATEMENTS (Continued)30 June 2014
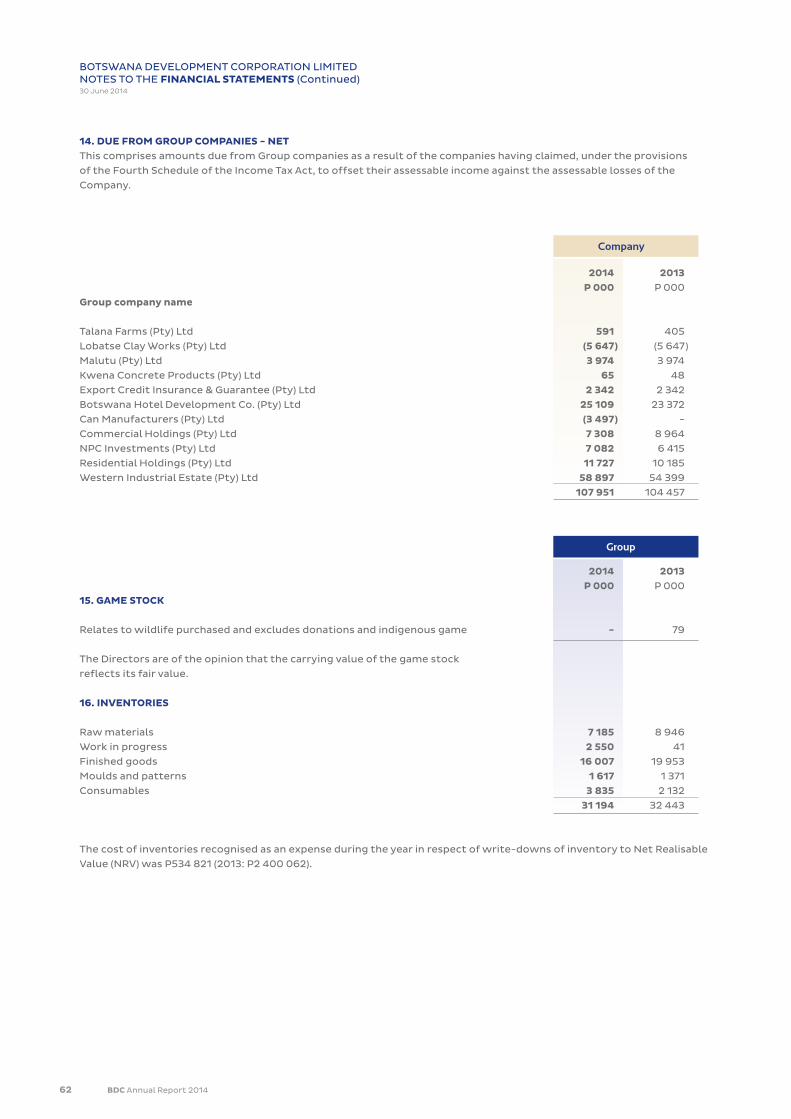
62 BDC Annual Report 2014
14. DUE FROM GROUP COMPANIES - NETThis comprises amounts due from Group companies as a result of the companies having claimed, under the provisions
of the Fourth Schedule of the Income Tax Act, to offset their assessable income against the assessable losses of the
Company.
2014 2013 P 000 P 000
Group company name
Talana Farms (Pty) Ltd 591 405
Lobatse Clay Works (Pty) Ltd (5 647 ) (5 647 )
Malutu (Pty) Ltd 3 974 3 974
Kwena Concrete Products (Pty) Ltd 65 48
Export Credit Insurance & Guarantee (Pty) Ltd 2 342 2 342
Botswana Hotel Development Co. (Pty) Ltd 25 109 23 372
Can Manufacturers (Pty) Ltd (3 497 ) -
Commercial Holdings (Pty) Ltd 7 308 8 964
NPC Investments (Pty) Ltd 7 082 6 415
Residential Holdings (Pty) Ltd 11 727 10 185
Western Industrial Estate (Pty) Ltd 58 897 54 399
107 951 104 457
Company
2014 2013 P 000 P 000
15. GAME STOCK
Relates to wildlife purchased and excludes donations and indigenous game - 79
The Directors are of the opinion that the carrying value of the game stock
reflects its fair value.
16. INVENTORIES
Raw materials 7 185 8 946
Work in progress 2 550 41
Finished goods 16 007 19 953
Moulds and patterns 1 617 1 371
Consumables 3 835 2 132
31 194 32 443
The cost of inventories recognised as an expense during the year in respect of write-downs of inventory to Net Realisable
Value (NRV) was P534 821 (2013: P2 400 062).
Group
BOTSWANA DEVELOPMENT CORPORATION LIMITEDNOTES TO THE FINANCIAL STATEMENTS (Continued)30 June 2014
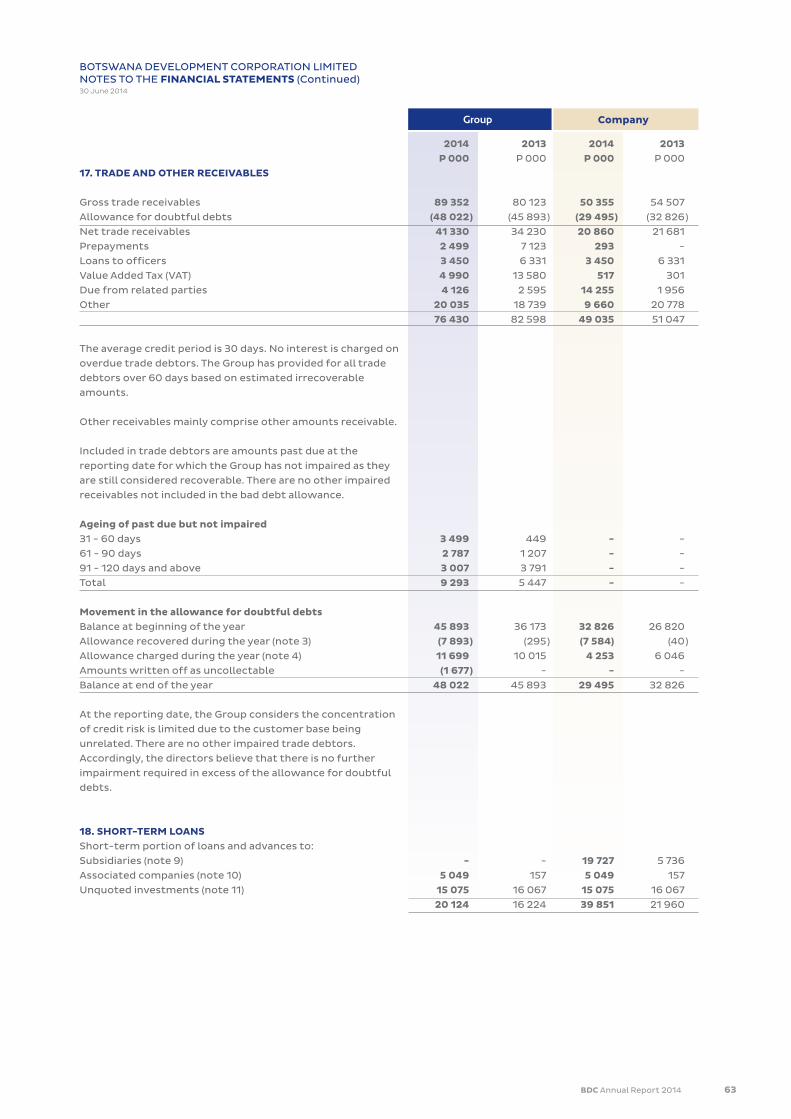
BDC Annual Report 2014 63
2014 2013 2014 2013 P 000 P 000 P 000 P 000
17. TRADE AND OTHER RECEIVABLES
Gross trade receivables 89 352 80 123 50 355 54 507
Allowance for doubtful debts (48 022 ) (45 893 ) (29 495 ) (32 826 )
Net trade receivables 41 330 34 230 20 860 21 681
Prepayments 2 499 7 123 293 -
Loans to officers 3 450 6 331 3 450 6 331
Value Added Tax (VAT) 4 990 13 580 517 301
Due from related parties 4 126 2 595 14 255 1 956
Other 20 035 18 739 9 660 20 778
76 430 82 598 49 035 51 047
The average credit period is 30 days. No interest is charged on
overdue trade debtors. The Group has provided for all trade
debtors over 60 days based on estimated irrecoverable
amounts.
Other receivables mainly comprise other amounts receivable.
Included in trade debtors are amounts past due at the
reporting date for which the Group has not impaired as they
are still considered recoverable. There are no other impaired
receivables not included in the bad debt allowance.
Ageing of past due but not impaired31 - 60 days 3 499 449 - -
61 - 90 days 2 787 1 207 - -
91 - 120 days and above 3 007 3 791 - -
Total 9 293 5 447 - -
Movement in the allowance for doubtful debtsBalance at beginning of the year 45 893 36 173 32 826 26 820
Allowance recovered during the year (note 3) (7 893 ) (295 ) (7 584) (40 )
Allowance charged during the year (note 4) 11 699 10 015 4 253 6 046
Amounts written off as uncollectable (1 677 ) - - -
Balance at end of the year 48 022 45 893 29 495 32 826
At the reporting date, the Group considers the concentration
of credit risk is limited due to the customer base being
unrelated. There are no other impaired trade debtors.
Accordingly, the directors believe that there is no further
impairment required in excess of the allowance for doubtful
debts.
18. SHORT-TERM LOANSShort-term portion of loans and advances to:
Subsidiaries (note 9) - - 19 727 5 736
Associated companies (note 10) 5 049 157 5 049 157
Unquoted investments (note 11) 15 075 16 067 15 075 16 067
20 124 16 224 39 851 21 960
Group Company
BOTSWANA DEVELOPMENT CORPORATION LIMITEDNOTES TO THE FINANCIAL STATEMENTS (Continued)30 June 2014
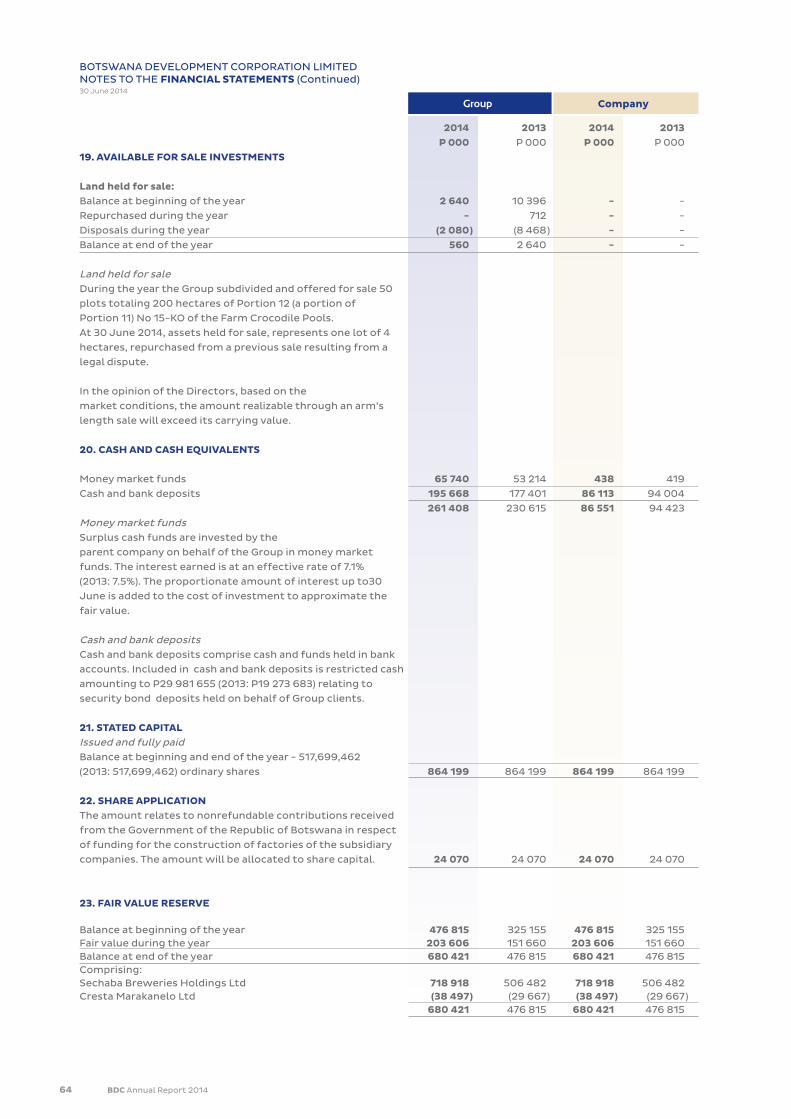
64 BDC Annual Report 2014
2014 2013 2014 2013 P 000 P 000 P 000 P 000
19. AVAILABLE FOR SALE INVESTMENTS
Land held for sale:Balance at beginning of the year 2 640 10 396 - -
Repurchased during the year - 712 - -
Disposals during the year (2 080 ) (8 468 ) - -
Balance at end of the year 560 2 640 - -
Land held for saleDuring the year the Group subdivided and offered for sale 50
plots totaling 200 hectares of Portion 12 (a portion of
Portion 11) No 15-KO of the Farm Crocodile Pools.
At 30 June 2014, assets held for sale, represents one lot of 4
hectares, repurchased from a previous sale resulting from a
legal dispute.
In the opinion of the Directors, based on the
market conditions, the amount realizable through an arm’s
length sale will exceed its carrying value.
20. CASH AND CASH EQUIVALENTS
Money market funds 65 740 53 214 438 419
Cash and bank deposits 195 668 177 401 86 113 94 004
261 408 230 615 86 551 94 423
Money market fundsSurplus cash funds are invested by the
parent company on behalf of the Group in money market
funds. The interest earned is at an effective rate of 7.1%
(2013: 7.5%). The proportionate amount of interest up to30
June is added to the cost of investment to approximate the
fair value.
Cash and bank depositsCash and bank deposits comprise cash and funds held in bank
accounts. Included in cash and bank deposits is restricted cash
amounting to P29 981 655 (2013: P19 273 683) relating to
security bond deposits held on behalf of Group clients.
21. STATED CAPITALIssued and fully paidBalance at beginning and end of the year - 517,699,462
(2013: 517,699,462) ordinary shares 864 199 864 199 864 199 864 199
22. SHARE APPLICATIONThe amount relates to nonrefundable contributions received
from the Government of the Republic of Botswana in respect
of funding for the construction of factories of the subsidiary
companies. The amount will be allocated to share capital. 24 070 24 070 24 070 24 070
23. FAIR VALUE RESERVE
Balance at beginning of the year 476 815 325 155 476 815 325 155Fair value during the year 203 606 151 660 203 606 151 660 Balance at end of the year 680 421 476 815 680 421 476 815Comprising:Sechaba Breweries Holdings Ltd 718 918 506 482 718 918 506 482Cresta Marakanelo Ltd (38 497 ) (29 667 ) (38 497 ) (29 667 ) 680 421 476 815 680 421 476 815
Group Company
BOTSWANA DEVELOPMENT CORPORATION LIMITEDNOTES TO THE FINANCIAL STATEMENTS (Continued)30 June 2014

BDC Annual Report 2014 65
Statutory Repairs & capital & maintenance solvency Revaluation reserve reserves reserve Total P000 P000 P000 P000
24. OTHER RESERVES
SubsidiariesBalance at 30 June 2012 415 1 509 66 284 68 208Reclassification - - (27 173 ) (27 173 )Transfers from/(to) retained earnings 55 285 (254 ) 86Revaluation during the year (note 7) - - 5 000 5 000Deferred tax adjustments during the year (note 31) - - 75 75 Balance at 30 June 2013 470 1 794 43 932 46 196Transfers from/(to) retained earnings 59 374 (254 ) 179Deferred tax adjustments during the year (note 31) - - 808 808Balance at 30 June 2014 529 2 168 44 486 47 183
AssociatesBalance at 30 June 2012 - - - -
Reclassifications - - 96 674 96 674
Share of other comprehensive loss of associates (note 10) - - (27 173 ) (27 173 )
Balance at 30 June 2013 - - 69 501 69 501
Share of other comprehensive loss of associates (note 10) - - 18 701 18 701
Balance at 30 June 2014 - - 88 202 88 202
Total Other reserves at 30 June 2012 415 1 509 66 284 68 208
Total Other reserves at 30 June 2013 470 1 794 113 433 115 697
Total Other reserves at 30 June 2014 529 2 168 132 688 135 385
Statutory capital and solvency reservesIn terms of the Insurance Act (CAP46:01), 15% of profit after taxation and 10% of profit before tax of a subsidiary company, which is providing export and domestic credit insurance, is transferred to statutory capital and solvency
reserves respectively.
2014 201325. DIVIDEND RESERVE P 000 P 000
Balance at beginning of the year 45 194 45 194
Balance at end of the year 45 194 45 194
26. CLAIMS EQUALISATION RESERVE 2014 2013 P 000 P 000
Balance at beginning of the year 4 956 4 054
Transfers from other reserves 781 902
Balance at end of the year 5 737 4 956
It is the policy of a subsidiary company to transfer 10% of the net commercial and domestic premium income from retained earnings in to the claims equalization reserve. The transfer from retained earnings ceases when the balance in the reserve account amounts to 150% of the highest gross premium income over the past five years.
Group and Company
Group
BOTSWANA DEVELOPMENT CORPORATION LIMITEDNOTES TO THE FINANCIAL STATEMENTS (Continued)30 June 2014
Group
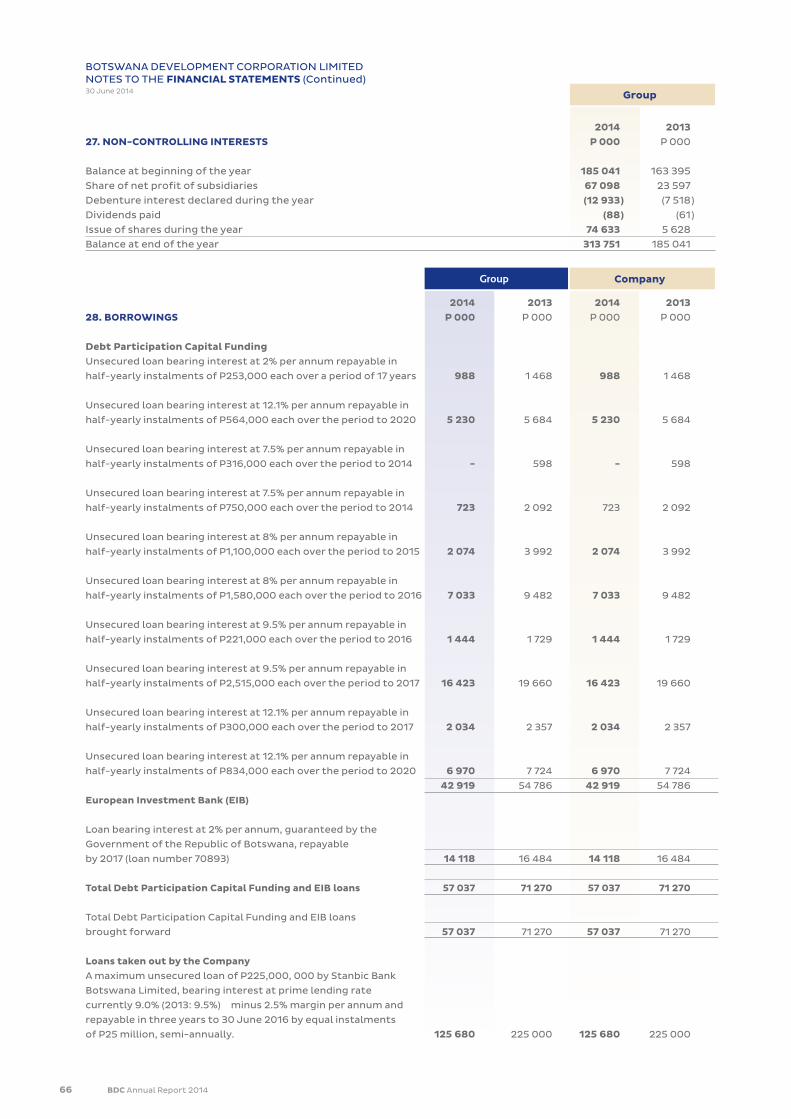
66 BDC Annual Report 2014
2014 201327. NON-CONTROLLING INTERESTS P 000 P 000
Balance at beginning of the year 185 041 163 395
Share of net profit of subsidiaries 67 098 23 597
Debenture interest declared during the year (12 933 ) (7 518 )
Dividends paid (88 ) (61 )
Issue of shares during the year 74 633 5 628
Balance at end of the year 313 751 185 041
2014 2013 2014 201328. BORROWINGS P 000 P 000 P 000 P 000
Debt Participation Capital FundingUnsecured loan bearing interest at 2% per annum repayable in
half-yearly instalments of P253,000 each over a period of 17 years 988 1 468 988 1 468
Unsecured loan bearing interest at 12.1% per annum repayable in
half-yearly instalments of P564,000 each over the period to 2020 5 230 5 684 5 230 5 684
Unsecured loan bearing interest at 7.5% per annum repayable in
half-yearly instalments of P316,000 each over the period to 2014 - 598 - 598
Unsecured loan bearing interest at 7.5% per annum repayable in
half-yearly instalments of P750,000 each over the period to 2014 723 2 092 723 2 092
Unsecured loan bearing interest at 8% per annum repayable in
half-yearly instalments of P1,100,000 each over the period to 2015 2 074 3 992 2 074 3 992
Unsecured loan bearing interest at 8% per annum repayable in
half-yearly instalments of P1,580,000 each over the period to 2016 7 033 9 482 7 033 9 482
Unsecured loan bearing interest at 9.5% per annum repayable in
half-yearly instalments of P221,000 each over the period to 2016 1 444 1 729 1 444 1 729
Unsecured loan bearing interest at 9.5% per annum repayable in
half-yearly instalments of P2,515,000 each over the period to 2017 16 423 19 660 16 423 19 660
Unsecured loan bearing interest at 12.1% per annum repayable in
half-yearly instalments of P300,000 each over the period to 2017 2 034 2 357 2 034 2 357
Unsecured loan bearing interest at 12.1% per annum repayable in
half-yearly instalments of P834,000 each over the period to 2020 6 970 7 724 6 970 7 724
42 919 54 786 42 919 54 786
European Investment Bank (EIB)
Loan bearing interest at 2% per annum, guaranteed by the
Government of the Republic of Botswana, repayable
by 2017 (loan number 70893) 14 118 16 484 14 118 16 484
Total Debt Participation Capital Funding and EIB loans 57 037 71 270 57 037 71 270
Total Debt Participation Capital Funding and EIB loans
brought forward 57 037 71 270 57 037 71 270
Loans taken out by the Company
A maximum unsecured loan of P225,000, 000 by Stanbic Bank
Botswana Limited, bearing interest at prime lending rate
currently 9.0% (2013: 9.5%) minus 2.5% margin per annum and
repayable in three years to 30 June 2016 by equal instalments
of P25 million, semi-annually. 125 680 225 000 125 680 225 000
Group Company
BOTSWANA DEVELOPMENT CORPORATION LIMITEDNOTES TO THE FINANCIAL STATEMENTS (Continued)30 June 2014 Group
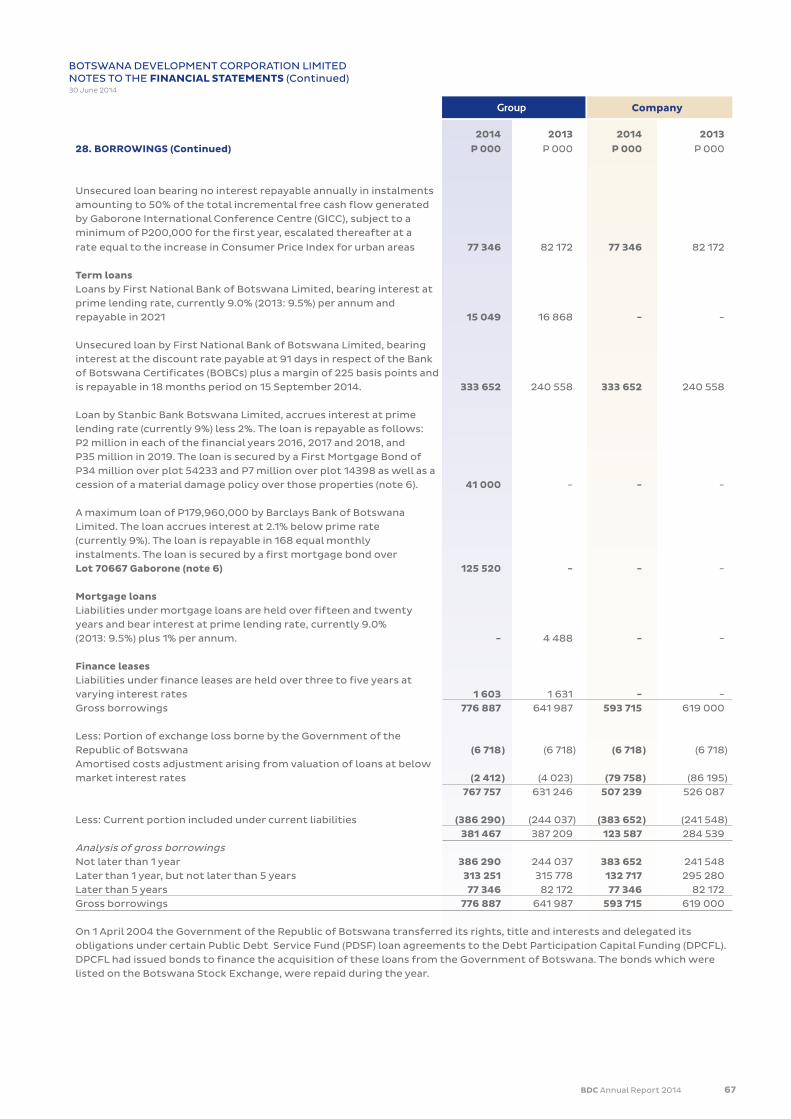
BDC Annual Report 2014 67
Group Company
2014 2013 2014 201328. BORROWINGS (Continued) P 000 P 000 P 000 P 000
Unsecured loan bearing no interest repayable annually in instalmentsamounting to 50% of the total incremental free cash flow generated by Gaborone International Conference Centre (GICC), subject to a minimum of P200,000 for the first year, escalated thereafter at a
rate equal to the increase in Consumer Price Index for urban areas 77 346 82 172 77 346 82 172
Term loansLoans by First National Bank of Botswana Limited, bearing interest atprime lending rate, currently 9.0% (2013: 9.5%) per annum andrepayable in 2021 15 049 16 868 - -
Unsecured loan by First National Bank of Botswana Limited, bearinginterest at the discount rate payable at 91 days in respect of the Bank of Botswana Certificates (BOBCs) plus a margin of 225 basis points and is repayable in 18 months period on 15 September 2014. 333 652 240 558 333 652 240 558
Loan by Stanbic Bank Botswana Limited, accrues interest at primelending rate (currently 9%) less 2%. The loan is repayable as follows:P2 million in each of the financial years 2016, 2017 and 2018, andP35 million in 2019. The loan is secured by a First Mortgage Bond ofP34 million over plot 54233 and P7 million over plot 14398 as well as acession of a material damage policy over those properties (note 6). 41 000 - - -
A maximum loan of P179,960,000 by Barclays Bank of BotswanaLimited. The loan accrues interest at 2.1% below prime rate(currently 9%). The loan is repayable in 168 equal monthly instalments. The loan is secured by a first mortgage bond over Lot 70667 Gaborone (note 6) 125 520 - - -
Mortgage loansLiabilities under mortgage loans are held over fifteen and twenty years and bear interest at prime lending rate, currently 9.0% (2013: 9.5%) plus 1% per annum. - 4 488 - -
Finance leasesLiabilities under finance leases are held over three to five years at varying interest rates 1 603 1 631 - -Gross borrowings 776 887 641 987 593 715 619 000
Less: Portion of exchange loss borne by the Government of theRepublic of Botswana (6 718 ) (6 718 ) (6 718 ) (6 718 )Amortised costs adjustment arising from valuation of loans at below market interest rates (2 412 ) (4 023) (79 758 ) (86 195 ) 767 757 631 246 507 239 526 087
Less: Current portion included under current liabilities (386 290 ) (244 037 ) (383 652 ) (241 548 ) 381 467 387 209 123 587 284 539Analysis of gross borrowingsNot later than 1 year 386 290 244 037 383 652 241 548Later than 1 year, but not later than 5 years 313 251 315 778 132 717 295 280Later than 5 years 77 346 82 172 77 346 82 172Gross borrowings 776 887 641 987 593 715 619 000
On 1 April 2004 the Government of the Republic of Botswana transferred its rights, title and interests and delegated its obligations under certain Public Debt Service Fund (PDSF) loan agreements to the Debt Participation Capital Funding (DPCFL). DPCFL had issued bonds to finance the acquisition of these loans from the Government of Botswana. The bonds which were listed on the Botswana Stock Exchange, were repaid during the year.
BOTSWANA DEVELOPMENT CORPORATION LIMITEDNOTES TO THE FINANCIAL STATEMENTS (Continued)30 June 2014
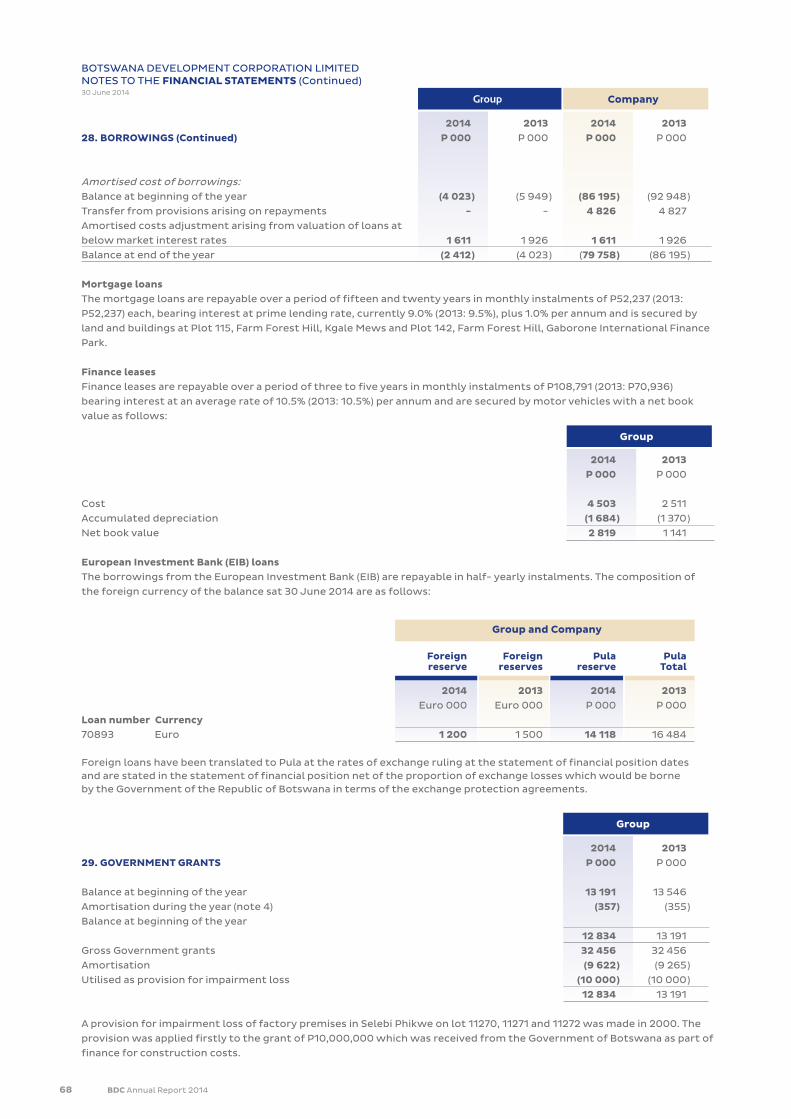
68 BDC Annual Report 2014
Group
Group Company
BOTSWANA DEVELOPMENT CORPORATION LIMITEDNOTES TO THE FINANCIAL STATEMENTS (Continued)30 June 2014
Foreign Foreign Pula Pula reserve reserves reserve Total
2014 2013 2014 2013 Euro 000 Euro 000 P 000 P 000
Loan number Currency
70893 Euro 1 200 1 500 14 118 16 484
Foreign loans have been translated to Pula at the rates of exchange ruling at the statement of financial position dates and are stated in the statement of financial position net of the proportion of exchange losses which would be borne by the Government of the Republic of Botswana in terms of the exchange protection agreements.
2014 201329. GOVERNMENT GRANTS P 000 P 000
Balance at beginning of the year 13 191 13 546
Amortisation during the year (note 4) (357 ) (355 )
Balance at beginning of the year
12 834 13 191
Gross Government grants 32 456 32 456
Amortisation (9 622 ) (9 265 )
Utilised as provision for impairment loss (10 000 ) (10 000 )
12 834 13 191
A provision for impairment loss of factory premises in Selebi Phikwe on lot 11270, 11271 and 11272 was made in 2000. The
provision was applied firstly to the grant of P10,000,000 which was received from the Government of Botswana as part of
finance for construction costs.
Group
2014 2013 2014 201328. BORROWINGS (Continued) P 000 P 000 P 000 P 000
Amortised cost of borrowings:Balance at beginning of the year (4 023 ) (5 949 ) (86 195 ) (92 948 )
Transfer from provisions arising on repayments - - 4 826 4 827
Amortised costs adjustment arising from valuation of loans at
below market interest rates 1 611 1 926 1 611 1 926
Balance at end of the year (2 412 ) (4 023 ) (79 758 ) (86 195 )
Mortgage loansThe mortgage loans are repayable over a period of fifteen and twenty years in monthly instalments of P52,237 (2013:
P52,237) each, bearing interest at prime lending rate, currently 9.0% (2013: 9.5%), plus 1.0% per annum and is secured by
land and buildings at Plot 115, Farm Forest Hill, Kgale Mews and Plot 142, Farm Forest Hill, Gaborone International Finance
Park.
Finance leasesFinance leases are repayable over a period of three to five years in monthly instalments of P108,791 (2013: P70,936)
bearing interest at an average rate of 10.5% (2013: 10.5%) per annum and are secured by motor vehicles with a net book
value as follows:
2014 2013 P 000 P 000
Cost 4 503 2 511
Accumulated depreciation (1 684 ) (1 370 )
Net book value 2 819 1 141
European Investment Bank (EIB) loansThe borrowings from the European Investment Bank (EIB) are repayable in half- yearly instalments. The composition of
the foreign currency of the balance sat 30 June 2014 are as follows:
Group and Company
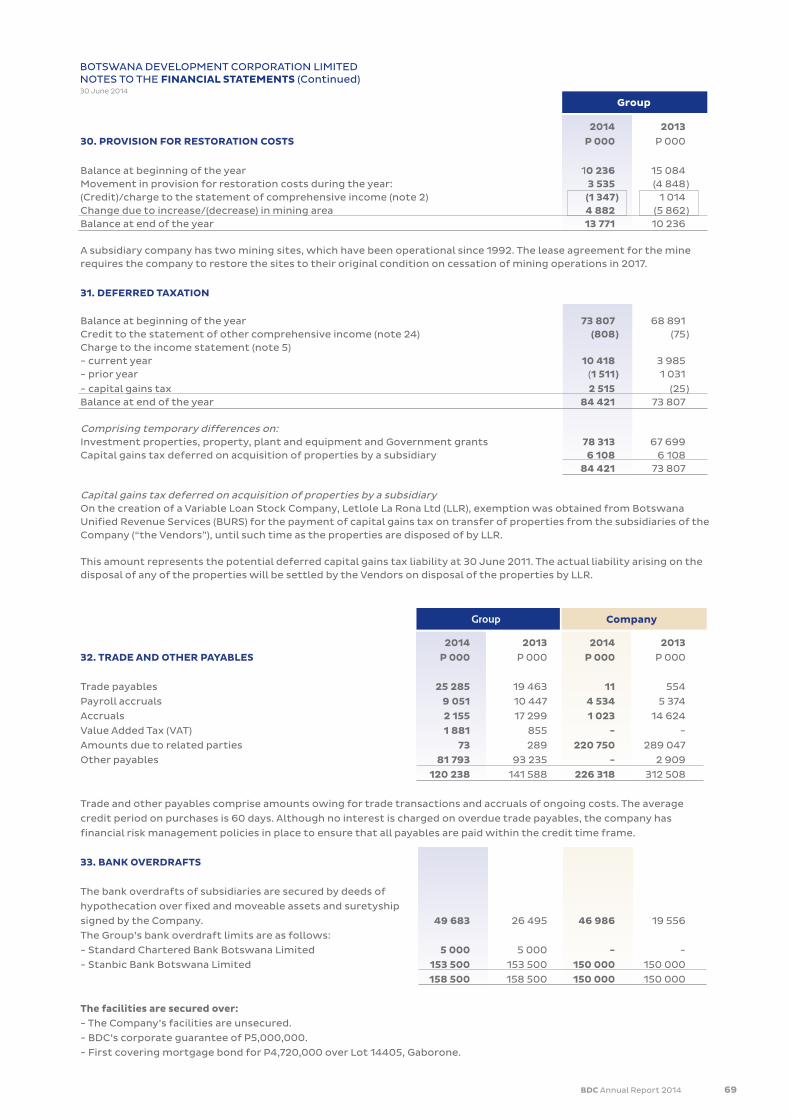
BDC Annual Report 2014 69
Group Company
Group
BOTSWANA DEVELOPMENT CORPORATION LIMITEDNOTES TO THE FINANCIAL STATEMENTS (Continued)30 June 2014
2014 201330. PROVISION FOR RESTORATION COSTS P 000 P 000
Balance at beginning of the year 10 236 15 084Movement in provision for restoration costs during the year: 3 535 (4 848 )(Credit)/charge to the statement of comprehensive income (note 2) (1 347 ) 1 014Change due to increase/(decrease) in mining area 4 882 (5 862 )Balance at end of the year 13 771 10 236
A subsidiary company has two mining sites, which have been operational since 1992. The lease agreement for the mine requires the company to restore the sites to their original condition on cessation of mining operations in 2017.
31. DEFERRED TAXATION
Balance at beginning of the year 73 807 68 891Credit to the statement of other comprehensive income (note 24) (808 ) (75 )Charge to the income statement (note 5)- current year 10 418 3 985- prior year (1 511 ) 1 031
- capital gains tax 2 515 (25 )Balance at end of the year 84 421 73 807
Comprising temporary differences on:Investment properties, property, plant and equipment and Government grants 78 313 67 699Capital gains tax deferred on acquisition of properties by a subsidiary 6 108 6 108 84 421 73 807
Capital gains tax deferred on acquisition of properties by a subsidiaryOn the creation of a Variable Loan Stock Company, Letlole La Rona Ltd (LLR), exemption was obtained from Botswana Unified Revenue Services (BURS) for the payment of capital gains tax on transfer of properties from the subsidiaries of the Company (“the Vendors”), until such time as the properties are disposed of by LLR.
This amount represents the potential deferred capital gains tax liability at 30 June 2011. The actual liability arising on the disposal of any of the properties will be settled by the Vendors on disposal of the properties by LLR.
2014 2013 2014 201332. TRADE AND OTHER PAYABLES P 000 P 000 P 000 P 000
Trade payables 25 285 19 463 11 554
Payroll accruals 9 051 10 447 4 534 5 374
Accruals 2 155 17 299 1 023 14 624
Value Added Tax (VAT) 1 881 855 - -
Amounts due to related parties 73 289 220 750 289 047
Other payables 81 793 93 235 - 2 909
120 238 141 588 226 318 312 508
Trade and other payables comprise amounts owing for trade transactions and accruals of ongoing costs. The average
credit period on purchases is 60 days. Although no interest is charged on overdue trade payables, the company has
financial risk management policies in place to ensure that all payables are paid within the credit time frame.
33. BANK OVERDRAFTS
The bank overdrafts of subsidiaries are secured by deeds of
hypothecation over fixed and moveable assets and suretyship
signed by the Company. 49 683 26 495 46 986 19 556
The Group’s bank overdraft limits are as follows:
- Standard Chartered Bank Botswana Limited 5 000 5 000 - -
- Stanbic Bank Botswana Limited 153 500 153 500 150 000 150 000
158 500 158 500 150 000 150 000
The facilities are secured over:- The Company’s facilities are unsecured.
- BDC’s corporate guarantee of P5,000,000.
- First covering mortgage bond for P4,720,000 over Lot 14405, Gaborone.
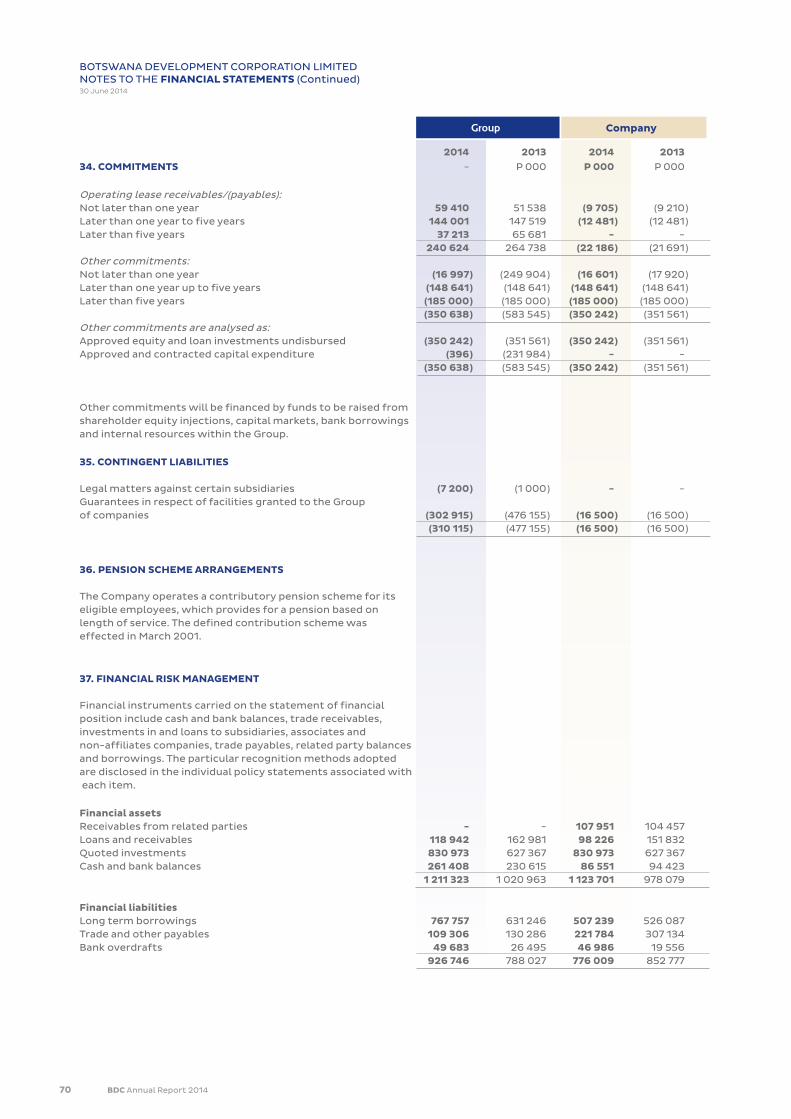
70 BDC Annual Report 2014
2014 2013 2014 201334. COMMITMENTS - P 000 P 000 P 000
Operating lease receivables/(payables):Not later than one year 59 410 51 538 (9 705 ) (9 210 )Later than one year to five years 144 001 147 519 (12 481 ) (12 481 )Later than five years 37 213 65 681 - - 240 624 264 738 (22 186 ) (21 691 )Other commitments:Not later than one year (16 997 ) (249 904 ) (16 601 ) (17 920 )Later than one year up to five years (148 641 ) (148 641 ) (148 641 ) (148 641 )Later than five years (185 000 ) (185 000 ) (185 000 ) (185 000 ) (350 638 ) (583 545 ) (350 242 ) (351 561 )Other commitments are analysed as:Approved equity and loan investments undisbursed (350 242 ) (351 561 ) (350 242 ) (351 561 )Approved and contracted capital expenditure (396 ) (231 984 ) - - (350 638 ) (583 545 ) (350 242 ) (351 561 )
Other commitments will be financed by funds to be raised from shareholder equity injections, capital markets, bank borrowings and internal resources within the Group.
35. CONTINGENT LIABILITIES
Legal matters against certain subsidiaries (7 200 ) (1 000 ) - -Guarantees in respect of facilities granted to the Group of companies (302 915 ) (476 155 ) (16 500 ) (16 500 ) (310 115 ) (477 155 ) (16 500 ) (16 500 )
36. PENSION SCHEME ARRANGEMENTS
The Company operates a contributory pension scheme for its eligible employees, which provides for a pension based on length of service. The defined contribution scheme was effected in March 2001.
37. FINANCIAL RISK MANAGEMENT
Financial instruments carried on the statement of financial position include cash and bank balances, trade receivables, investments in and loans to subsidiaries, associates and non-affiliates companies, trade payables, related party balancesand borrowings. The particular recognition methods adopted are disclosed in the individual policy statements associated with each item.
Financial assetsReceivables from related parties - - 107 951 104 457Loans and receivables 118 942 162 981 98 226 151 832Quoted investments 830 973 627 367 830 973 627 367Cash and bank balances 261 408 230 615 86 551 94 423 1 211 323 1 020 963 1 123 701 978 079
Financial liabilitiesLong term borrowings 767 757 631 246 507 239 526 087Trade and other payables 109 306 130 286 221 784 307 134Bank overdrafts 49 683 26 495 46 986 19 556 926 746 788 027 776 009 852 777
Group Company
BOTSWANA DEVELOPMENT CORPORATION LIMITEDNOTES TO THE FINANCIAL STATEMENTS (Continued)30 June 2014
BDC Annual Report 2014 71
37. FINANCIAL RISK MANAGEMENT (Continued)
In the normal course of business the Group is exposed to capital, credit, interest rate, currency and liquidity risk. The
Group manages its exposure by meeting on a regular basis to ensure the treasury activities are carried out in an orderly
and efficient manner adhering to Management procedures and policies.
(i) Capital risk management
The Group manages its capital to ensure that entities in the Group will be able to continue as going concerns while
maximizing the return to stakeholders. The capital structure of the Group consists of debt, which includes the borrowings
disclosed in note 28, cash and cash equivalents and equity attributable to equity holders of the parent, comprising stated
capital, reserves and retained earnings as disclosed in notes 21 to 26.
The Group risk management committee reviews the capital structure of the Group. The committee considers the cost of
capital and the risks associated with each class of capital.
(ii) Credit risk
Credit risk refers to the risk that a counter party will default on its contractual obligations resulting in financial loss to the
Group. The Group has adopted a policy of only dealing with credit worthy counterparties as a means of mitigating the risk
of financial loss from defaults. Trade receivables consist of a large number of customers, spread across diverse industries
and geographical areas. Ongoing credit evaluation is performed on the financial condition of accounts receivable.
The Group does not have any significant credit risk exposure to any single counter party or any Group of counterparties
having similar characteristics.
(iii) Interest rate risk
Financial instruments that are sensitive to interest rate risk are bank balances and borrowings. Exposure to interest rate
risk applicable to these financial instruments is managed through constant monitoring of prevailing interest rates in the
market.
(iv) Foreign currency risk
In the normal course of business, the Group enters into transactions denominated in foreign currencies. As a result, the
Group is subject to exposure to fluctuation in foreign currency exchange rates.
(v) Liquidity risk management
Ultimate responsibility for liquidity risk management rests with the Board of Directors, which has built an appropriate
liquidity risk management framework for the management of the Group short, medium and long-term funding and
liquidity management requirements.
The Group manages liquidity risk by maintaining adequate reserves and continuously monitoring forecast and actual cash
flows and matching the maturity profiles of financial assets and liabilities.
(vi) Fair value
At 30 June 2014 and 2013, the carrying value of cash and bank balances, trade receivables, trade payables and related
party balances reported in the financial statements approximate their fair values due to their short term maturity. These
financial instruments are held in the ordinary course of business.
BOTSWANA DEVELOPMENT CORPORATION LIMITEDNOTES TO THE FINANCIAL STATEMENTS (Continued)30 June 2014
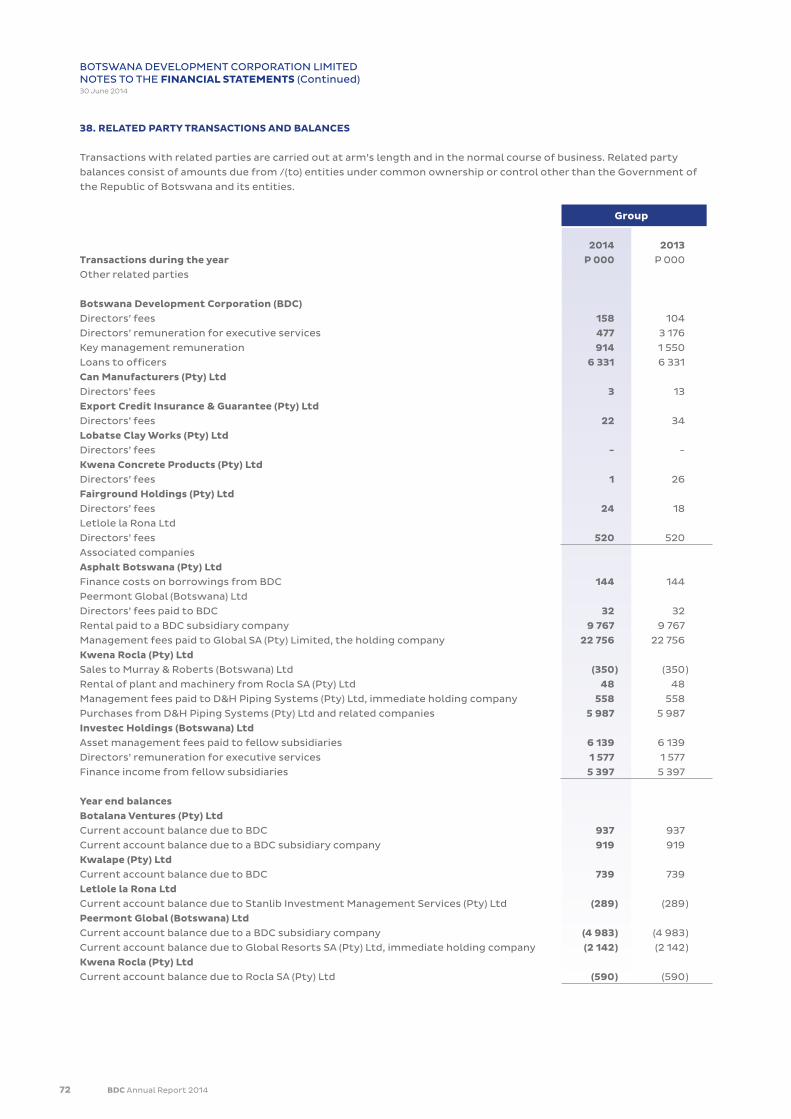
72 BDC Annual Report 2014
38. RELATED PARTY TRANSACTIONS AND BALANCES
Transactions with related parties are carried out at arm’s length and in the normal course of business. Related party
balances consist of amounts due from /(to) entities under common ownership or control other than the Government of
the Republic of Botswana and its entities.
2014 2013Transactions during the year P 000 P 000
Other related parties
Botswana Development Corporation (BDC)Directors’ fees 158 104
Directors’ remuneration for executive services 477 3 176
Key management remuneration 914 1 550
Loans to officers 6 331 6 331
Can Manufacturers (Pty) LtdDirectors’ fees 3 13
Export Credit Insurance & Guarantee (Pty) LtdDirectors’ fees 22 34
Lobatse Clay Works (Pty) LtdDirectors’ fees - -
Kwena Concrete Products (Pty) LtdDirectors’ fees 1 26
Fairground Holdings (Pty) LtdDirectors’ fees 24 18
Letlole la Rona Ltd
Directors’ fees 520 520
Associated companies
Asphalt Botswana (Pty) LtdFinance costs on borrowings from BDC 144 144
Peermont Global (Botswana) Ltd
Directors’ fees paid to BDC 32 32
Rental paid to a BDC subsidiary company 9 767 9 767
Management fees paid to Global SA (Pty) Limited, the holding company 22 756 22 756
Kwena Rocla (Pty) LtdSales to Murray & Roberts (Botswana) Ltd (350 ) (350 )
Rental of plant and machinery from Rocla SA (Pty) Ltd 48 48
Management fees paid to D&H Piping Systems (Pty) Ltd, immediate holding company 558 558
Purchases from D&H Piping Systems (Pty) Ltd and related companies 5 987 5 987
Investec Holdings (Botswana) LtdAsset management fees paid to fellow subsidiaries 6 139 6 139
Directors’ remuneration for executive services 1 577 1 577
Finance income from fellow subsidiaries 5 397 5 397
Year end balancesBotalana Ventures (Pty) LtdCurrent account balance due to BDC 937 937
Current account balance due to a BDC subsidiary company 919 919
Kwalape (Pty) LtdCurrent account balance due to BDC 739 739
Letlole la Rona LtdCurrent account balance due to Stanlib Investment Management Services (Pty) Ltd (289 ) (289 )
Peermont Global (Botswana) LtdCurrent account balance due to a BDC subsidiary company (4 983 ) (4 983 )
Current account balance due to Global Resorts SA (Pty) Ltd, immediate holding company (2 142 ) (2 142 )
Kwena Rocla (Pty) LtdCurrent account balance due to Rocla SA (Pty) Ltd (590 ) (590 )
Group
BOTSWANA DEVELOPMENT CORPORATION LIMITEDNOTES TO THE FINANCIAL STATEMENTS (Continued)30 June 2014
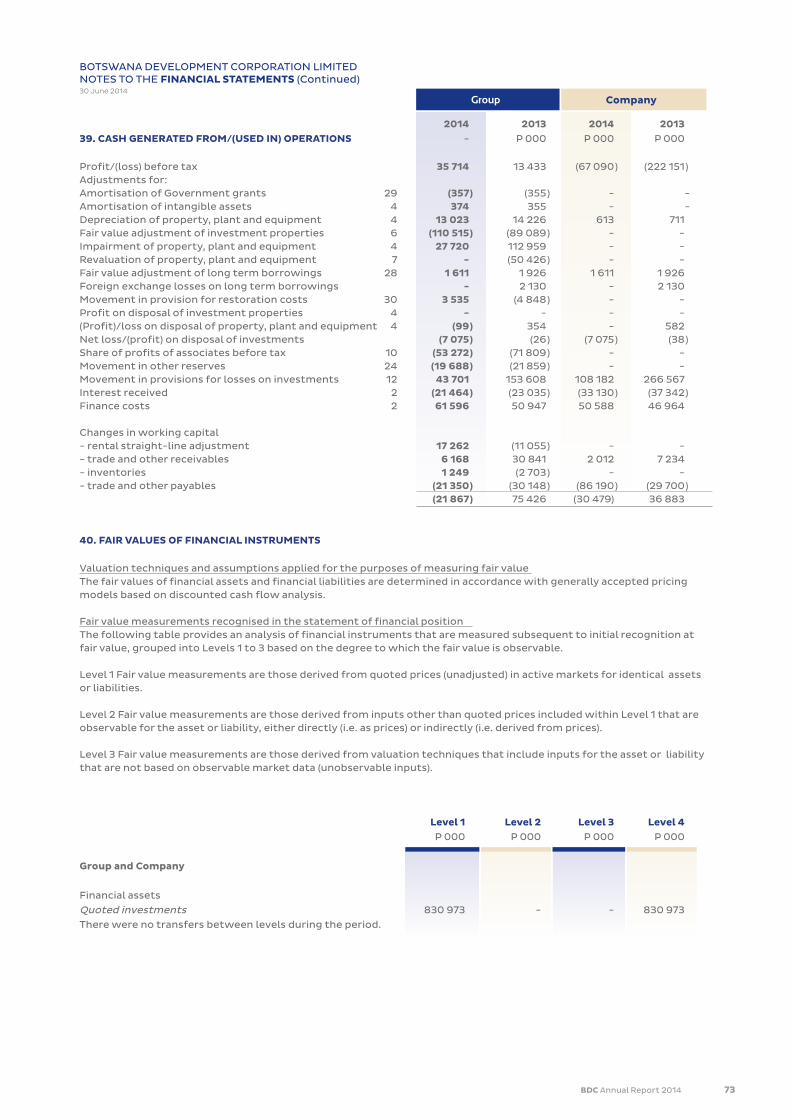
BDC Annual Report 2014 73
2014 2013 2014 201339. CASH GENERATED FROM/(USED IN) OPERATIONS - P 000 P 000 P 000
Profit/(loss) before tax 35 714 13 433 (67 090 ) (222 151 )Adjustments for:Amortisation of Government grants 29 (357 ) (355 ) - -Amortisation of intangible assets 4 374 355 - - Depreciation of property, plant and equipment 4 13 023 14 226 613 711Fair value adjustment of investment properties 6 (110 515 ) (89 089 ) - -Impairment of property, plant and equipment 4 27 720 112 959 - -Revaluation of property, plant and equipment 7 - (50 426 ) - -Fair value adjustment of long term borrowings 28 1 611 1 926 1 611 1 926Foreign exchange losses on long term borrowings - 2 130 - 2 130 Movement in provision for restoration costs 30 3 535 (4 848 ) - -Profit on disposal of investment properties 4 - - - -(Profit)/loss on disposal of property, plant and equipment 4 (99 ) 354 - 582Net loss/(profit) on disposal of investments (7 075 ) (26 ) (7 075 ) (38 )Share of profits of associates before tax 10 (53 272 ) (71 809 ) - -Movement in other reserves 24 (19 688 ) (21 859 ) - -Movement in provisions for losses on investments 12 43 701 153 608 108 182 266 567Interest received 2 (21 464 ) (23 035 ) (33 130 ) (37 342 )Finance costs 2 61 596 50 947 50 588 46 964
Changes in working capital- rental straight-line adjustment 17 262 (11 055 ) - - - trade and other receivables 6 168 30 841 2 012 7 234- inventories 1 249 (2 703 ) - -- trade and other payables (21 350 ) (30 148 ) (86 190 ) (29 700 ) (21 867 ) 75 426 (30 479) 36 883
40. FAIR VALUES OF FINANCIAL INSTRUMENTS
Valuation techniques and assumptions applied for the purposes of measuring fair value The fair values of financial assets and financial liabilities are determined in accordance with generally accepted pricing models based on discounted cash flow analysis.
Fair value measurements recognised in the statement of financial position The following table provides an analysis of financial instruments that are measured subsequent to initial recognition at fair value, grouped into Levels 1 to 3 based on the degree to which the fair value is observable.
Level 1 Fair value measurements are those derived from quoted prices (unadjusted) in active markets for identical assets or liabilities.
Level 2 Fair value measurements are those derived from inputs other than quoted prices included within Level 1 that are observable for the asset or liability, either directly (i.e. as prices) or indirectly (i.e. derived from prices).
Level 3 Fair value measurements are those derived from valuation techniques that include inputs for the asset or liability that are not based on observable market data (unobservable inputs).
Group Company
BOTSWANA DEVELOPMENT CORPORATION LIMITEDNOTES TO THE FINANCIAL STATEMENTS (Continued)30 June 2014
Level 1 Level 2 Level 3 Level 4 P 000 P 000 P 000 P 000
Group and Company
Financial assets
Quoted investments 830 973 - - 830 973
There were no transfers between levels during the period.
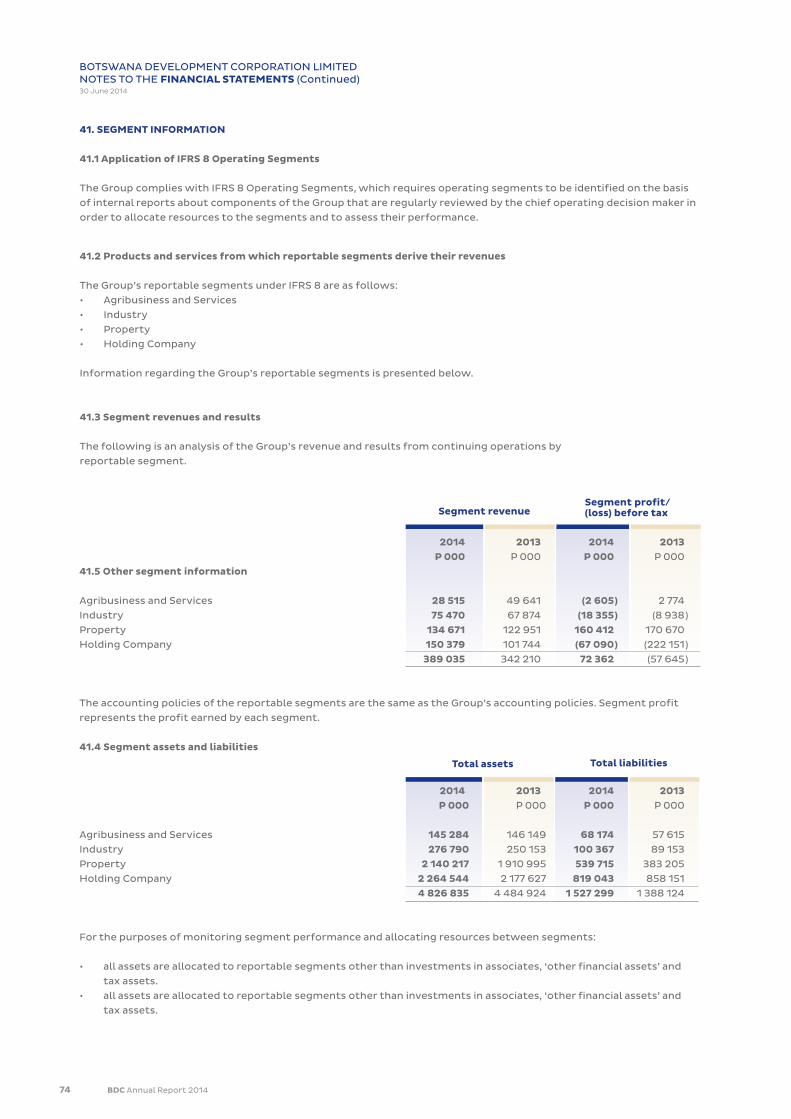
74 BDC Annual Report 2014
BOTSWANA DEVELOPMENT CORPORATION LIMITEDNOTES TO THE FINANCIAL STATEMENTS (Continued)30 June 2014
41. SEGMENT INFORMATION
41.1 Application of IFRS 8 Operating Segments
The Group complies with IFRS 8 Operating Segments, which requires operating segments to be identified on the basis
of internal reports about components of the Group that are regularly reviewed by the chief operating decision maker in
order to allocate resources to the segments and to assess their performance.
41.2 Products and services from which reportable segments derive their revenues
The Group’s reportable segments under IFRS 8 are as follows:
• Agribusiness and Services
• Industry
• Property
• Holding Company
Information regarding the Group’s reportable segments is presented below.
41.3 Segment revenues and results
The following is an analysis of the Group’s revenue and results from continuing operations by
reportable segment.
Segment revenueSegment profit/(loss) before tax
Total assets Total liabilities
2014 2013 2014 2013 P 000 P 000 P 000 P 000
41.5 Other segment information
Agribusiness and Services 28 515 49 641 (2 605 ) 2 774
Industry 75 470 67 874 (18 355 ) (8 938 )
Property 134 671 122 951 160 412 170 670
Holding Company 150 379 101 744 (67 090 ) (222 151 )
389 035 342 210 72 362 (57 645 )
The accounting policies of the reportable segments are the same as the Group’s accounting policies. Segment profit
represents the profit earned by each segment.
41.4 Segment assets and liabilities
2014 2013 2014 2013 P 000 P 000 P 000 P 000
Agribusiness and Services 145 284 146 149 68 174 57 615
Industry 276 790 250 153 100 367 89 153
Property 2 140 217 1 910 995 539 715 383 205
Holding Company 2 264 544 2 177 627 819 043 858 151
4 826 835 4 484 924 1 527 299 1 388 124
For the purposes of monitoring segment performance and allocating resources between segments:
• all assets are allocated to reportable segments other than investments in associates, ‘other financial assets’ and
tax assets.
• all assets are allocated to reportable segments other than investments in associates, ‘other financial assets’ and
tax assets.
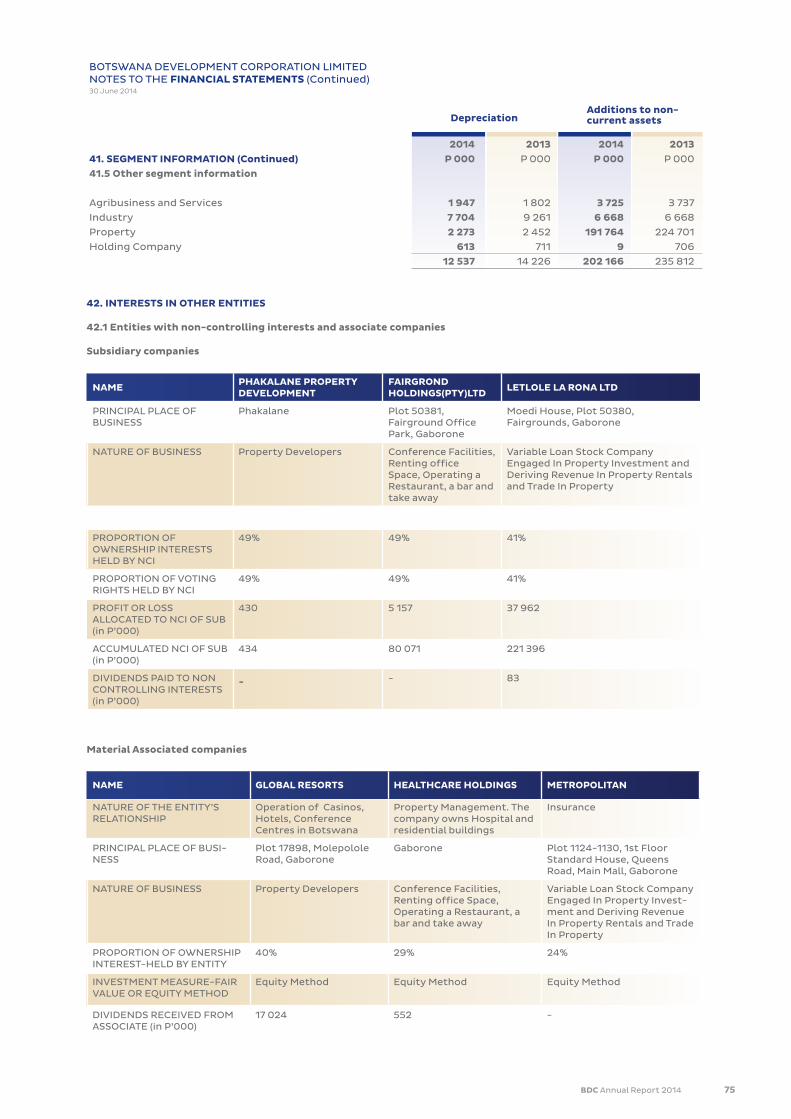
BDC Annual Report 2014 75
BOTSWANA DEVELOPMENT CORPORATION LIMITEDNOTES TO THE FINANCIAL STATEMENTS (Continued)30 June 2014
2014 2013 2014 201341. SEGMENT INFORMATION (Continued) P 000 P 000 P 000 P 000
41.5 Other segment information
Agribusiness and Services 1 947 1 802 3 725 3 737
Industry 7 704 9 261 6 668 6 668
Property 2 273 2 452 191 764 224 701
Holding Company 613 711 9 706
12 537 14 226 202 166 235 812
DepreciationAdditions to non-current assets
42. INTERESTS IN OTHER ENTITIES
42.1 Entities with non-controlling interests and associate companies
Subsidiary companies
NAME PHAKALANE PROPERTY DEVELOPMENT
FAIRGROND HOLDINGS(PTY)LTD LETLOLE LA RONA LTD
PRINCIPAL PLACE OF BUSINESS
Phakalane Plot 50381, Fairground Office Park, Gaborone
Moedi House, Plot 50380, Fairgrounds, Gaborone
NATURE OF BUSINESS Property Developers Conference Facilities, Renting office Space, Operating a Restaurant, a bar and take away
Variable Loan Stock Company Engaged In Property Investment and Deriving Revenue In Property Rentals and Trade In Property
PROPORTION OF OWNERSHIP INTERESTS HELD BY NCI
49% 49% 41%
PROPORTION OF VOTING RIGHTS HELD BY NCI
49% 49% 41%
PROFIT OR LOSS ALLOCATED TO NCI OF SUB (in P’000)
430 5 157 37 962
ACCUMULATED NCI OF SUB (in P’000)
434 80 071 221 396
DIVIDENDS PAID TO NON CONTROLLING INTERESTS (in P’000)
- - 83
Material Associated companies
NAME GLOBAL RESORTS HEALTHCARE HOLDINGS METROPOLITAN
NATURE OF THE ENTITY’S RELATIONSHIP
Operation of Casinos, Hotels, Conference Centres in Botswana
Property Management. The company owns Hospital and residential buildings
Insurance
PRINCIPAL PLACE OF BUSI-NESS
Plot 17898, Molepolole Road, Gaborone
Gaborone Plot 1124-1130, 1st Floor Standard House, Queens Road, Main Mall, Gaborone
NATURE OF BUSINESS Property Developers Conference Facilities, Renting office Space, Operating a Restaurant, a bar and take away
Variable Loan Stock Company Engaged In Property Invest-ment and Deriving Revenue In Property Rentals and Trade In Property
PROPORTION OF OWNERSHIP INTEREST-HELD BY ENTITY
40% 29% 24%
INVESTMENT MEASURE-FAIR VALUE OR EQUITY METHOD
Equity Method Equity Method Equity Method
DIVIDENDS RECEIVED FROM ASSOCIATE (in P’000)
17 024 552 -
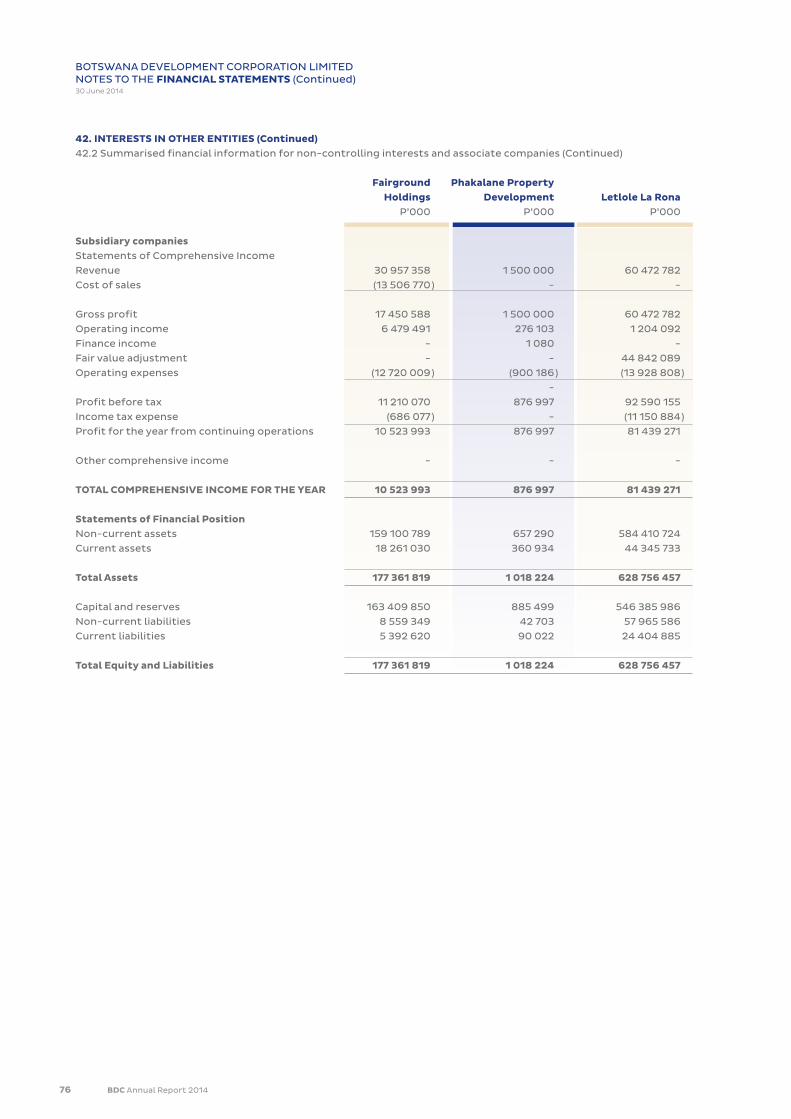
76 BDC Annual Report 2014
BOTSWANA DEVELOPMENT CORPORATION LIMITEDNOTES TO THE FINANCIAL STATEMENTS (Continued)30 June 2014
42. INTERESTS IN OTHER ENTITIES (Continued)42.2 Summarised financial information for non-controlling interests and associate companies (Continued)
Fairground Phakalane Property Holdings Development Letlole La Rona P’000 P’000 P’000
Subsidiary companiesStatements of Comprehensive Income
Revenue 30 957 358 1 500 000 60 472 782
Cost of sales (13 506 770 ) - -
Gross profit 17 450 588 1 500 000 60 472 782
Operating income 6 479 491 276 103 1 204 092
Finance income - 1 080 -
Fair value adjustment - - 44 842 089
Operating expenses (12 720 009 ) (900 186 ) (13 928 808 )
-
Profit before tax 11 210 070 876 997 92 590 155
Income tax expense (686 077 ) - (11 150 884 )
Profit for the year from continuing operations 10 523 993 876 997 81 439 271
Other comprehensive income - - -
TOTAL COMPREHENSIVE INCOME FOR THE YEAR 10 523 993 876 997 81 439 271
Statements of Financial PositionNon-current assets 159 100 789 657 290 584 410 724
Current assets 18 261 030 360 934 44 345 733
Total Assets 177 361 819 1 018 224 628 756 457
Capital and reserves 163 409 850 885 499 546 385 986
Non-current liabilities 8 559 349 42 703 57 965 586
Current liabilities 5 392 620 90 022 24 404 885
Total Equity and Liabilities 177 361 819 1 018 224 628 756 457
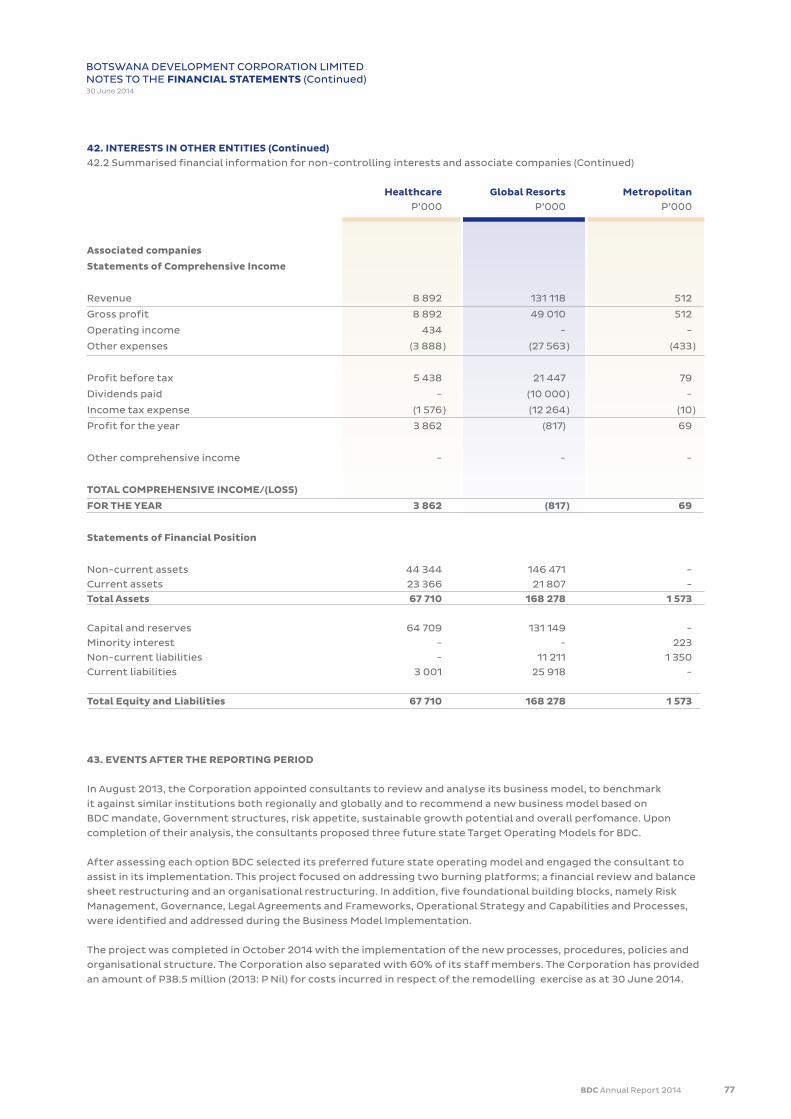
BDC Annual Report 2014 77
42. INTERESTS IN OTHER ENTITIES (Continued)42.2 Summarised financial information for non-controlling interests and associate companies (Continued)
Healthcare Global Resorts Metropolitan P’000 P’000 P’000
Associated companies
Statements of Comprehensive Income
Revenue 8 892 131 118 512
Gross profit 8 892 49 010 512
Operating income 434 - -
Other expenses (3 888 ) (27 563 ) (433 )
Profit before tax 5 438 21 447 79
Dividends paid - (10 000 ) -
Income tax expense (1 576 ) (12 264 ) (10 )
Profit for the year 3 862 (817) 69
Other comprehensive income - - -
TOTAL COMPREHENSIVE INCOME/(LOSS)
FOR THE YEAR 3 862 (817 ) 69
Statements of Financial Position
Non-current assets 44 344 146 471 -
Current assets 23 366 21 807 -
Total Assets 67 710 168 278 1 573
Capital and reserves 64 709 131 149 -
Minority interest - - 223
Non-current liabilities - 11 211 1 350
Current liabilities 3 001 25 918 -
Total Equity and Liabilities 67 710 168 278 1 573
43. EVENTS AFTER THE REPORTING PERIOD
In August 2013, the Corporation appointed consultants to review and analyse its business model, to benchmark
it against similar institutions both regionally and globally and to recommend a new business model based on
BDC mandate, Government structures, risk appetite, sustainable growth potential and overall perfomance. Upon
completion of their analysis, the consultants proposed three future state Target Operating Models for BDC.
After assessing each option BDC selected its preferred future state operating model and engaged the consultant to
assist in its implementation. This project focused on addressing two burning platforms; a financial review and balance
sheet restructuring and an organisational restructuring. In addition, five foundational building blocks, namely Risk
Management, Governance, Legal Agreements and Frameworks, Operational Strategy and Capabilities and Processes,
were identified and addressed during the Business Model Implementation.
The project was completed in October 2014 with the implementation of the new processes, procedures, policies and
organisational structure. The Corporation also separated with 60% of its staff members. The Corporation has provided
an amount of P38.5 million (2013: P Nil) for costs incurred in respect of the remodelling exercise as at 30 June 2014.
BOTSWANA DEVELOPMENT CORPORATION LIMITEDNOTES TO THE FINANCIAL STATEMENTS (Continued)30 June 2014

Botswana Development Corporation Limited
GO ONLINEThis Annual Report, together with trading
statments and previous Annual Reports is available online at www.bdc.bw

Botswana Development Corporation Limited
GO ONLINEThis Annual Report, together with trading
statments and previous Annual Reports is available online at www.bdc.bw