Embed Size (px)
Citation preview
ARTICLE IN PRESS
Contents lists available at ScienceDirect
Atmospheric Environment
Atmospheric Environment 42 (2008) 6067– 6077
1352-23
doi:10.1
� Cor
E-m
journal homepage: www.elsevier.com/locate/atmosenv
Bottom-up uncertainty estimates of global ammonia emissions fromglobal agricultural production systems
A.H.W. Beusen a,�, A.F. Bouwman a,b, P.S.C. Heuberger c, G. Van Drecht a, K.W. Van Der Hoek d
a Netherlands Environmental Assessment Agency, P.O. Box 303, 3720 AH Bilthoven, The Netherlandsb Earth System Science and Climate Change Group, Wageningen University Research Centre (WUR), P.O. Box 47, 6700 AA Wageningen, The Netherlandsc Delft Center for Systems and Control, Delft University of Technology, Mekelweg 2, 2628 CD, Delft, The Netherlandsd Laboratory for Environmental Monitoring, National Institute for Public Health and the Environment, P.O. Box 1, 3720 BA Bilthoven, The Netherlands
a r t i c l e i n f o
Article history:
Received 17 July 2007
Received in revised form
12 March 2008
Accepted 19 March 2008
Keywords:
Agriculture
Ammonia
Fertilizer
Livestock
Manure
Nitrogen
Uncertainty
10/$ - see front matter & 2008 Elsevier Ltd.
016/j.atmosenv.2008.03.044
responding author.
ail address: [email protected] (A.H.W.
a b s t r a c t
Here we present an uncertainty analysis of NH3 emissions from agricultural production
systems based on a global NH3 emission inventory with a 5�5 min resolution. Of all
results the mean is given with a range (10% and 90% percentile). The uncertainty range for
the global NH3 emission from agricultural systems is 27–38 (with a mean of 32) Tg NH3-
N yr�1, N fertilizer use contributing 10–12 (11) Tg yr�1 and livestock production 16–27
(21) Tg yr�1. Most of the emissions from livestock production come from animal houses
and storage systems (31–55%); smaller contributions come from the spreading of animal
manure (23–38%) and grazing animals (17–37%). This uncertainty analysis allows for
identifying and improving those input parameters with a major influence on the results.
The most important determinants of the uncertainty related to the global agricultural NH3
emission comprise four parameters (N excretion rates, NH3 emission rates for manure in
animal houses and storage, the fraction of the time that ruminants graze and the fraction
of non-agricultural use of manure) specific to mixed and landless systems, and total
animal stocks. Nitrogen excretion rates and NH3 emission rates from animal houses and
storage systems are shown consistently to be the most important parameters in most
parts of the world. Input parameters for pastoral systems are less relevant. However, there
are clear differences between world regions and individual countries, reflecting the
differences in livestock production systems.
& 2008 Elsevier Ltd. All rights reserved.
1. Introduction
Ammonia is an important atmospheric pollutant witha wide variety of impacts. A large portion of atmosphericaerosols, acting as cloud condensation nuclei, consists ofsulfate neutralized to various extents by NH3 (Graedel andCrutzen, 1993). Essentially, all emitted NH3 is returned tothe surface by deposition, which is known to be one of thecauses of soil acidification (Van Breemen et al., 1982),eutrophication of natural ecosystems and loss of biodi-
All rights reserved.
Beusen).
versity (Bouwman et al., 2002b; Millennium EcosystemAssessment, 2006).
At present the annual global use of synthetic nitrogen(N) fertilizers is about 80 Tg (Tg ¼ teragram; 1 Tg ¼ 1012
g); an even larger amount of animal manure N is producedin livestock production systems. The use of N fertilizer andthe production of animal wastes are expected to increasein the coming decades, particularly in developing coun-tries (Bruinsma, 2003).
One of the major pathways of N loss from agriculturalsystems is ammonia (NH3) volatilization. Ammonia isconstantly formed in soils from biological degradation oforganic compounds and from ammonium (NH4
+) yieldingsynthetic and organic fertilizers. Since NH3 is a gas, any of
ARTICLE IN PRESS
A.H.W. Beusen et al. / Atmospheric Environment 42 (2008) 6067–60776068
it present in the soil, water or fertilizer can volatilize tothe atmosphere; its reactions in water are fundamental inregulating the rate of loss. After NH3 is applied to the soil,the NH4
+ can be retained on the exchange sites, nitrified tonitrate (NO3
�), or decomposed to NH3, depending on soiland environmental conditions.
Ammonia volatilization may be responsible for the lossof 10–30% of the N fertilizer applied and the N excreted byanimals, and is the major anthropogenic source of atmo-spheric NH3 (Bouwman et al., 2002a). In agriculturalproduction systems there are several technical options toreduce NH3 emissions, such as reduction of the N input,increase of the efficiency of N use in both crop andlivestock production systems, for example by reducingNH3 loss from the system (Van Egmond et al., 2002).Given the concern about the environmental impacts ofNH3, several industrialized countries have policies toreduce NH3 emissions. Most of the policies in Europeand the USA intend to decrease human and plant exposureto S and N pollutants and ecosystem loads. Europeancountries therefore agreed on significant reductions ofNH3 emissions by signing different protocols developedunder the convention on long range transboundary airpollution (CLRTAP) (UN-ECE, 1999).
Here we present a global inventory of NH3 emissionsassociated with livestock production and fertilizer use. Weupdated the 11�11 resolution inventory for agriculturalNH3 emission for the year 1990, as presented by Bouw-man et al. (1997), with data for the year 2000 andimplemented several other improvements. Here weanalyze the uncertainties of calculated NH3 emissions inthe updated inventory for agricultural systems resultingfrom uncertainty in the input parameters. This allows foridentifying and improving those input parameters with amajor influence on the results.
The issue of scaling of emissions has been addressed bymany authors, see for example Bouwman (1999). Ammo-nia inventories are available at the global, continental,national and finer scales (Asman et al., 1998). At the globalscale the distributions are based on country data mainly.However, within grids the emissions show variability thatis not captured at the scale of global emission inventories(Bouwman and Asman, 1997). For example, Dragosits et al.(2002) investigated the variability of emissions, deposi-tion and impacts of NH3 within a 5�5 km grid cell(comparable in size to our grid cells) of the nationalinventory for the UK. Their results indicated that the mostextreme local variability is linked to housing and storagesystems similar to findings in other countries (Bouwmanand Asman, 1997).
The purpose of this model-based inventory is toprovide input for global atmospheric chemistry transportmodels (CTM) (see Dentener et al., 2006). Since wet anddry deposition is modeled by the different CTMs indifferent ways, the emission fields in the inventorydescribed in this paper, represent the potential or grossflux of NH3 to the atmosphere. The potential flux does notaccount for the difference between ambient NH3 concen-trations and the compensation concentrations regulatingthe exchange of NH3 between the surface and theatmosphere. Hence, local deposition is not accounted for
in our inventory. Emission fields can provide input formodeling the role of NH3 in global cycles of S species andradiative forcing of climate through aerosol formation.Investigation of subgrid variability is therefore not withinthe scope of this study, in view of the purpose of ourinventory.
In this paper we describe differences in the uncertaintyof NH3 emissions from agriculture and the major factorsdetermining the uncertainty between countries and worldregions, i.e. the USA, the India and China regions, WesternEurope and the Netherlands as well as differences withinthe USA.
2. Data and methods
2.1. Ammonia emission inventory
We updated the 11�11 resolution NH3 emissioninventory for the year 1990, as presented by Bouwmanet al. (1997), with data for the year 2000 and implementedseveral improvements: (i) more detailed spatial land-useinformation (5�5 min, or about 8�8 km at the equator,which is an increase in resolution by a factor of 144), (ii)different livestock production systems, (iii) recent esti-mates for animal N excretion rates, and (iv) improved NH3
emission calculations for the spreading of manure and Nfertilizer, (v) emission factors representing the lumpedeffect of housing, grazing and spreading were replaced bya mass-flow approach, where at each stage of manuremanagement a proportion of N is lost (mainly as NH3) andthe remainder is passed on the next stage. This also allowsfor assessing the consequences of abatement at one stageof manure management on NH3 losses at later stages ofmanure management.
The global 5�5 min resolution land-cover distributionused in this study is based on a combination of two datasets from different satellite sensors, i.e. the IGBP-DisCoverand the GLC2000 data set (Klein Goldewijk and VanDrecht, 2006). Our land-cover data set includes agricul-tural areas for cropland and grassland that are consistentwith statistical information from FAO (2007) on thecountry scale and for some large countries at the state(USA) or provincial (China) level.
Two livestock production systems are distinguished,i.e. pastoral systems, and mixed and landless systems.A grid cell is assumed to be covered by mixed andlandless systems where cropland covers more than 25%.Otherwise the grid cell is considered to be dominated bypastoral production systems. This approach is similar tothe approaches of Bouwman et al. (2005a) and Kruskaet al. (2003). Although there may be a large variationbetween countries, this assumption yields a roughdistinction between pastoral, and mixed and landlesssystems (Table 1).
It should be noted that areas designated for parks,nature reserves or protected areas may or maybe notincluded in the definition of permanent pastures of FAO(2007) in some countries. For example, national Australianreports (National Land and Water Resources Audit, 2001)indicate that the area of permanent pastures from FAO
ARTICLE IN PRESS
A.H.W. Beusen et al. / Atmospheric Environment 42 (2008) 6067–6077 6069
(2007) for Australia includes a range of land tenures, andmany of these are actually located in the ‘wildernessareas’ that we excluded from the available area forallocation.
We used data from FAO (2007) for animal stocks for 10animal categories (beef cattle, dairy cattle, buffalo, pigs,poultry, sheep and goats, along with the category of smallruminants, asses, mules, horses and camels). Associated Nexcretion rates (specified for Western Europe, NorthAmerica, rest of the industrialized countries and develop-ing countries) were taken from van der Hoek (1998).Within a country, excretion rates are assumed to be thesame in mixed and landless, and pastoral systems.
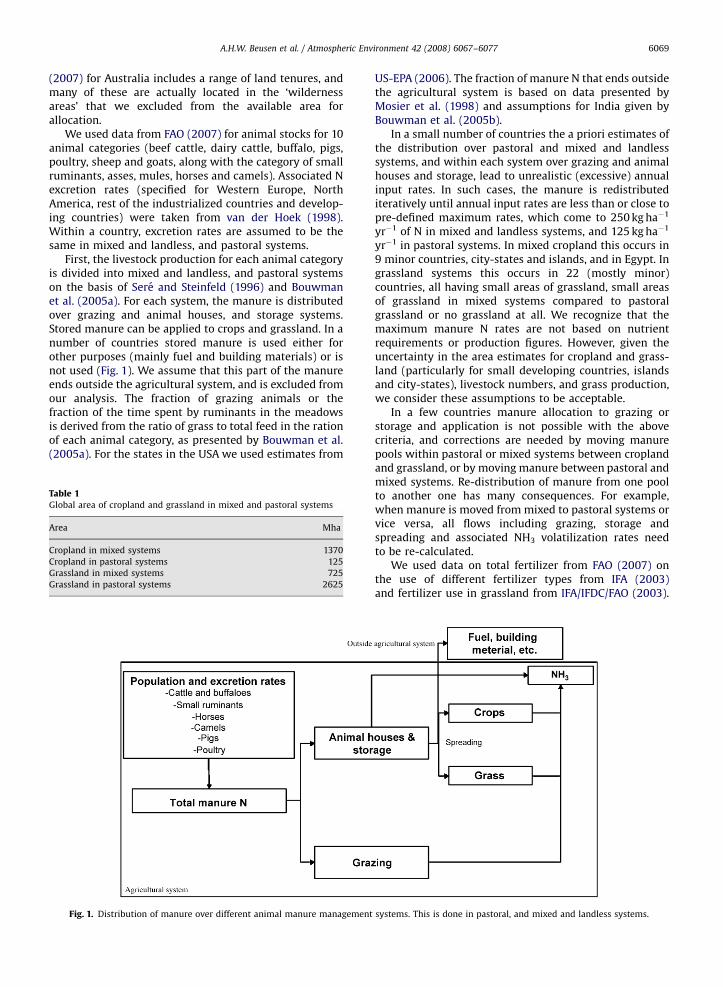
First, the livestock production for each animal categoryis divided into mixed and landless, and pastoral systemson the basis of Sere and Steinfeld (1996) and Bouwmanet al. (2005a). For each system, the manure is distributedover grazing and animal houses, and storage systems.Stored manure can be applied to crops and grassland. In anumber of countries stored manure is used either forother purposes (mainly fuel and building materials) or isnot used (Fig. 1). We assume that this part of the manureends outside the agricultural system, and is excluded fromour analysis. The fraction of grazing animals or thefraction of the time spent by ruminants in the meadowsis derived from the ratio of grass to total feed in the rationof each animal category, as presented by Bouwman et al.(2005a). For the states in the USA we used estimates from
Table 1Global area of cropland and grassland in mixed and pastoral systems
Area Mha
Cropland in mixed systems 1370
Cropland in pastoral systems 125
Grassland in mixed systems 725
Grassland in pastoral systems 2625
Fig. 1. Distribution of manure over different animal manure management
US-EPA (2006). The fraction of manure N that ends outsidethe agricultural system is based on data presented byMosier et al. (1998) and assumptions for India given byBouwman et al. (2005b).
In a small number of countries the a priori estimates ofthe distribution over pastoral and mixed and landlesssystems, and within each system over grazing and animalhouses and storage, lead to unrealistic (excessive) annualinput rates. In such cases, the manure is redistributediteratively until annual input rates are less than or close topre-defined maximum rates, which come to 250 kg ha�1
yr�1 of N in mixed and landless systems, and 125 kg ha�1
yr�1 in pastoral systems. In mixed cropland this occurs in9 minor countries, city-states and islands, and in Egypt. Ingrassland systems this occurs in 22 (mostly minor)countries, all having small areas of grassland, small areasof grassland in mixed systems compared to pastoralgrassland or no grassland at all. We recognize that themaximum manure N rates are not based on nutrientrequirements or production figures. However, given theuncertainty in the area estimates for cropland and grass-land (particularly for small developing countries, islandsand city-states), livestock numbers, and grass production,we consider these assumptions to be acceptable.
In a few countries manure allocation to grazing orstorage and application is not possible with the abovecriteria, and corrections are needed by moving manurepools within pastoral or mixed systems between croplandand grassland, or by moving manure between pastoral andmixed systems. Re-distribution of manure from one poolto another one has many consequences. For example,when manure is moved from mixed to pastoral systems orvice versa, all flows including grazing, storage andspreading and associated NH3 volatilization rates needto be re-calculated.
We used data on total fertilizer from FAO (2007) onthe use of different fertilizer types from IFA (2003)and fertilizer use in grassland from IFA/IFDC/FAO (2003).
systems. This is done in pastoral, and mixed and landless systems.
ARTICLE IN PRESS
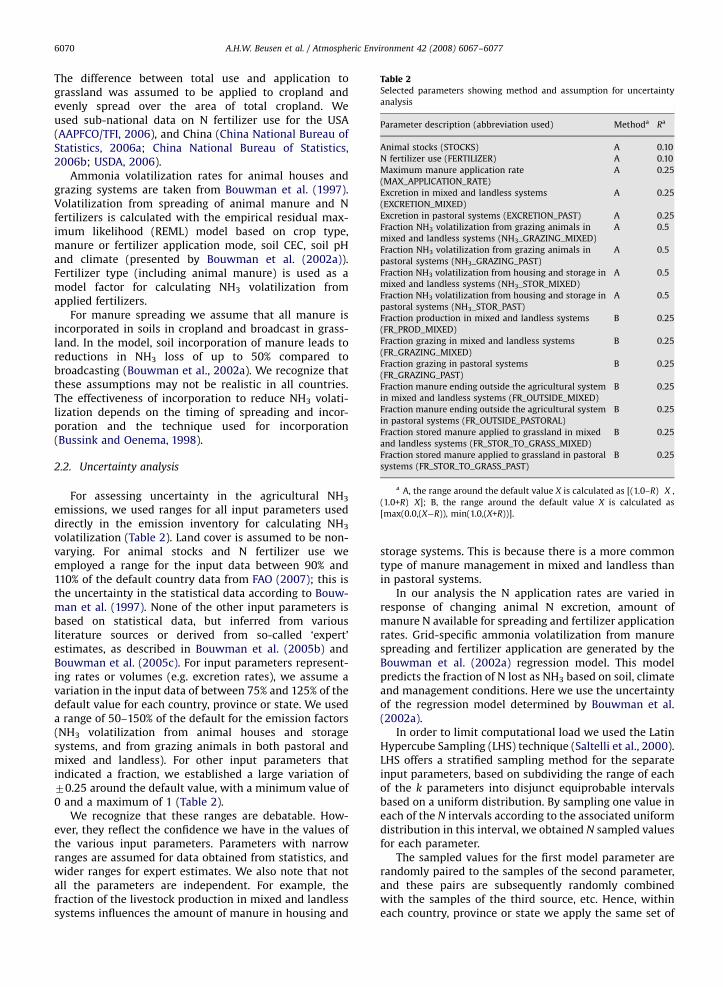
Table 2Selected parameters showing method and assumption for uncertainty
analysis
Parameter description (abbreviation used) Methoda Ra
Animal stocks (STOCKS) A 0.10
N fertilizer use (FERTILIZER) A 0.10
Maximum manure application rate
(MAX_APPLICATION_RATE)
A 0.25
Excretion in mixed and landless systems
(EXCRETION_MIXED)
A 0.25
Excretion in pastoral systems (EXCRETION_PAST) A 0.25
Fraction NH3 volatilization from grazing animals in
mixed and landless systems (NH3_GRAZING_MIXED)
A 0.5
Fraction NH3 volatilization from grazing animals in
pastoral systems (NH3_GRAZING_PAST)
A 0.5
Fraction NH3 volatilization from housing and storage in
mixed and landless systems (NH3_STOR_MIXED)
A 0.5
Fraction NH3 volatilization from housing and storage in
pastoral systems (NH3_STOR_PAST)
A 0.5
Fraction production in mixed and landless systems
(FR_PROD_MIXED)
B 0.25
Fraction grazing in mixed and landless systems
(FR_GRAZING_MIXED)
B 0.25
Fraction grazing in pastoral systems
(FR_GRAZING_PAST)
B 0.25
Fraction manure ending outside the agricultural system
in mixed and landless systems (FR_OUTSIDE_MIXED)
B 0.25
Fraction manure ending outside the agricultural system
in pastoral systems (FR_OUTSIDE_PASTORAL)
B 0.25
Fraction stored manure applied to grassland in mixed
and landless systems (FR_STOR_TO_GRASS_MIXED)
B 0.25
Fraction stored manure applied to grassland in pastoral
systems (FR_STOR_TO_GRASS_PAST)
B 0.25
a A, the range around the default value X is calculated as [(1.0–R)�X ,
(1.0+R)�X]; B, the range around the default value X is calculated as
[max(0.0,(X�R)), min(1.0,(X+R))].
A.H.W. Beusen et al. / Atmospheric Environment 42 (2008) 6067–60776070
The difference between total use and application tograssland was assumed to be applied to cropland andevenly spread over the area of total cropland. Weused sub-national data on N fertilizer use for the USA(AAPFCO/TFI, 2006), and China (China National Bureau ofStatistics, 2006a; China National Bureau of Statistics,2006b; USDA, 2006).
Ammonia volatilization rates for animal houses andgrazing systems are taken from Bouwman et al. (1997).Volatilization from spreading of animal manure and Nfertilizers is calculated with the empirical residual max-imum likelihood (REML) model based on crop type,manure or fertilizer application mode, soil CEC, soil pHand climate (presented by Bouwman et al. (2002a)).Fertilizer type (including animal manure) is used as amodel factor for calculating NH3 volatilization fromapplied fertilizers.
For manure spreading we assume that all manure isincorporated in soils in cropland and broadcast in grass-land. In the model, soil incorporation of manure leads toreductions in NH3 loss of up to 50% compared tobroadcasting (Bouwman et al., 2002a). We recognize thatthese assumptions may not be realistic in all countries.The effectiveness of incorporation to reduce NH3 volati-lization depends on the timing of spreading and incor-poration and the technique used for incorporation(Bussink and Oenema, 1998).
2.2. Uncertainty analysis
For assessing uncertainty in the agricultural NH3
emissions, we used ranges for all input parameters useddirectly in the emission inventory for calculating NH3
volatilization (Table 2). Land cover is assumed to be non-varying. For animal stocks and N fertilizer use weemployed a range for the input data between 90% and110% of the default country data from FAO (2007); this isthe uncertainty in the statistical data according to Bouw-man et al. (1997). None of the other input parameters isbased on statistical data, but inferred from variousliterature sources or derived from so-called ‘expert’estimates, as described in Bouwman et al. (2005b) andBouwman et al. (2005c). For input parameters represent-ing rates or volumes (e.g. excretion rates), we assume avariation in the input data of between 75% and 125% of thedefault value for each country, province or state. We useda range of 50–150% of the default for the emission factors(NH3 volatilization from animal houses and storagesystems, and from grazing animals in both pastoral andmixed and landless). For other input parameters thatindicated a fraction, we established a large variation of70.25 around the default value, with a minimum value of0 and a maximum of 1 (Table 2).
We recognize that these ranges are debatable. How-ever, they reflect the confidence we have in the values ofthe various input parameters. Parameters with narrowranges are assumed for data obtained from statistics, andwider ranges for expert estimates. We also note that notall the parameters are independent. For example, thefraction of the livestock production in mixed and landlesssystems influences the amount of manure in housing and
storage systems. This is because there is a more commontype of manure management in mixed and landless thanin pastoral systems.
In our analysis the N application rates are varied inresponse of changing animal N excretion, amount ofmanure N available for spreading and fertilizer applicationrates. Grid-specific ammonia volatilization from manurespreading and fertilizer application are generated by theBouwman et al. (2002a) regression model. This modelpredicts the fraction of N lost as NH3 based on soil, climateand management conditions. Here we use the uncertaintyof the regression model determined by Bouwman et al.(2002a).
In order to limit computational load we used the LatinHypercube Sampling (LHS) technique (Saltelli et al., 2000).LHS offers a stratified sampling method for the separateinput parameters, based on subdividing the range of eachof the k parameters into disjunct equiprobable intervalsbased on a uniform distribution. By sampling one value ineach of the N intervals according to the associated uniformdistribution in this interval, we obtained N sampled valuesfor each parameter.
The sampled values for the first model parameter arerandomly paired to the samples of the second parameter,and these pairs are subsequently randomly combinedwith the samples of the third source, etc. Hence, withineach country, province or state we apply the same set of
ARTICLE IN PRESS
A.H.W. Beusen et al. / Atmospheric Environment 42 (2008) 6067–6077 6071
samples (Table 2). This results in an LHS consisting of N
combinations of k parameters (Fig. 2). The parameterspace is thus representatively sampled with a limitednumber of samples. Although a ratio of N/k 44/3 isgenerally considered to be sufficient (Iman and Helton,1985), we used a ratio of 30. In this paper we use N ¼ 500and 16 input parameters (k ¼ 16).
LHS can be used in combination with linear regressionto quantify the uncertainty contributions of the inputparameters to the model outputs (Saltelli et al., 2000,2004). The output Y (NH3 volatilization for any spatialunit, in this paper country or world region) is approxi-mated by a linear function of the parameters Xi (Table 2)expressed by
Y ¼ b0 þ b1X1 þ b2X2 � � � þ bnXn þ e (1)
where bi is the so-called ordinary regression coefficientand e is the error of the approximation. The quality of theregression model is expressed by the coefficient ofdetermination (R2), representing the amount of variationY explained by Y–e. Since bi depends on the scale anddimension of Xi, we used the standardized regressioncoefficient (SRC), which is a relative sensitivity measure
Fig. 2. Example of a Latin hypercube with two parameters, x1 and x2
(k ¼ 2) and N ¼ 5.
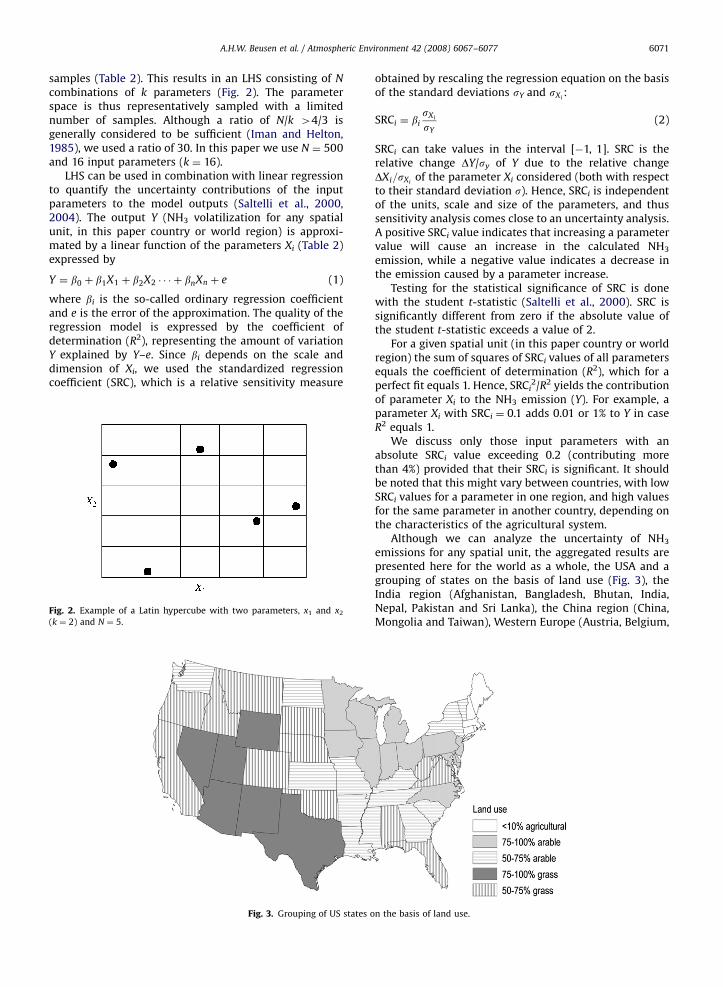
Fig. 3. Grouping of US states o
obtained by rescaling the regression equation on the basisof the standard deviations sY and sXi
:
SRCi ¼ bi
sXi
sY(2)
SRCi can take values in the interval [�1, 1]. SRC is therelative change DY/sy of Y due to the relative changeDXi=sXi
of the parameter Xi considered (both with respectto their standard deviation s). Hence, SRCi is independentof the units, scale and size of the parameters, and thussensitivity analysis comes close to an uncertainty analysis.A positive SRCi value indicates that increasing a parametervalue will cause an increase in the calculated NH3
emission, while a negative value indicates a decrease inthe emission caused by a parameter increase.
Testing for the statistical significance of SRC is donewith the student t-statistic (Saltelli et al., 2000). SRC issignificantly different from zero if the absolute value ofthe student t-statistic exceeds a value of 2.
For a given spatial unit (in this paper country or worldregion) the sum of squares of SRCi values of all parametersequals the coefficient of determination (R2), which for aperfect fit equals 1. Hence, SRCi
2/R2 yields the contributionof parameter Xi to the NH3 emission (Y). For example, aparameter Xi with SRCi ¼ 0.1 adds 0.01 or 1% to Y in caseR2 equals 1.
We discuss only those input parameters with anabsolute SRCi value exceeding 0.2 (contributing morethan 4%) provided that their SRCi is significant. It shouldbe noted that this might vary between countries, with lowSRCi values for a parameter in one region, and high valuesfor the same parameter in another country, depending onthe characteristics of the agricultural system.
Although we can analyze the uncertainty of NH3
emissions for any spatial unit, the aggregated results arepresented here for the world as a whole, the USA and agrouping of states on the basis of land use (Fig. 3), theIndia region (Afghanistan, Bangladesh, Bhutan, India,Nepal, Pakistan and Sri Lanka), the China region (China,Mongolia and Taiwan), Western Europe (Austria, Belgium,
n the basis of land use.
ARTICLE IN PRESS
A.H.W. Beusen et al. / Atmospheric Environment 42 (2008) 6067–60776072
Denmark, Finland, France, Germany, Gibraltar, Greece,Iceland, Ireland, Italy, Luxembourg, the Netherlands, Nor-way, Portugal, Spain, Sweden, Switzerland and UnitedKingdom) and the Netherlands. This enables us toillustrate differences between various parts of the world,and large and small regions, with a wide variation in thecharacteristics of livestock and crop production systems.
3. Results and discussion
We will first discuss the N flows and NH3 emissions,and their uncertainty. Subsequently, we will discuss theuncertainty caused by the individual input parameters. Ofall results the mean is given with a range (10% and 90%percentile). All N flows and NH3 emissions are expressedin units of N.
3.1. Uncertainty of the N flows and NH3 emissions
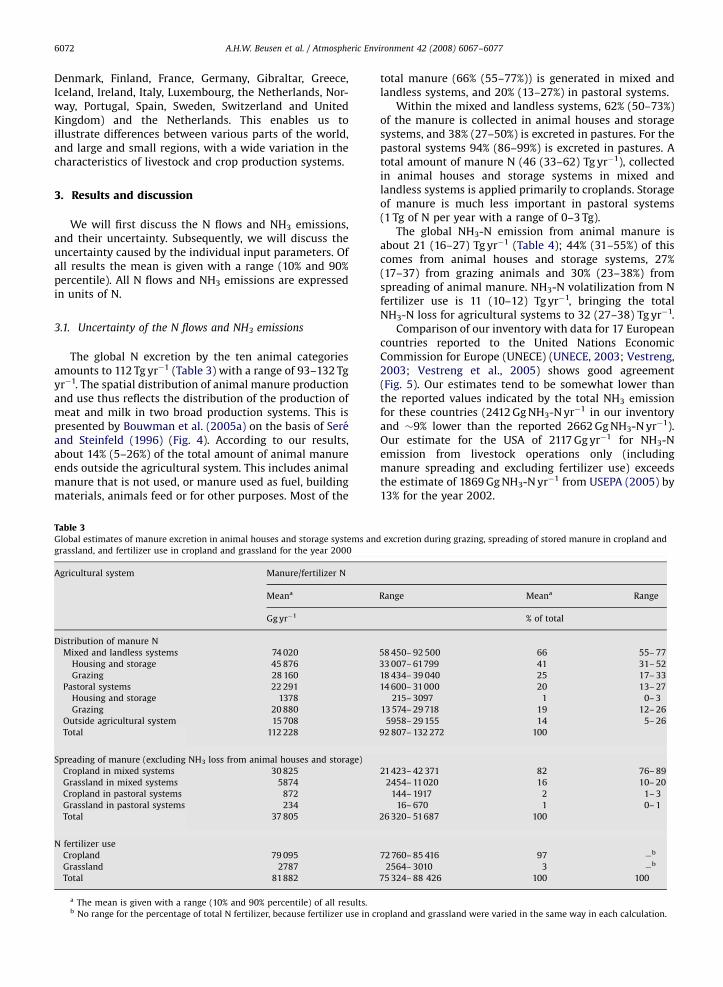
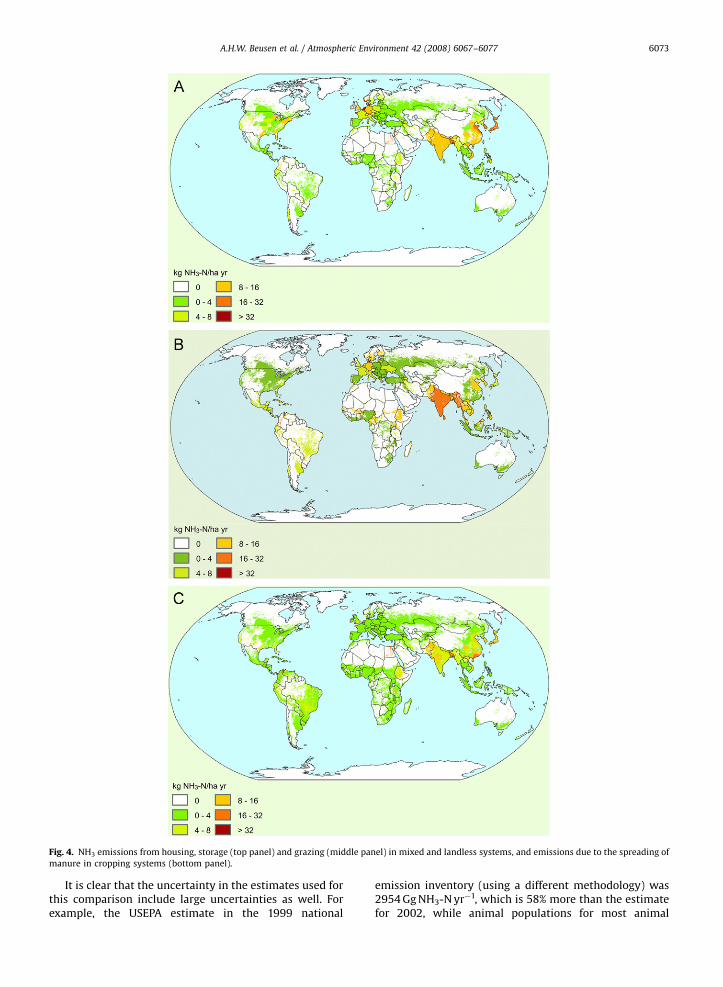
The global N excretion by the ten animal categoriesamounts to 112 Tg yr�1 (Table 3) with a range of 93–132 Tgyr�1. The spatial distribution of animal manure productionand use thus reflects the distribution of the production ofmeat and milk in two broad production systems. This ispresented by Bouwman et al. (2005a) on the basis of Sereand Steinfeld (1996) (Fig. 4). According to our results,about 14% (5–26%) of the total amount of animal manureends outside the agricultural system. This includes animalmanure that is not used, or manure used as fuel, buildingmaterials, animals feed or for other purposes. Most of the
Table 3Global estimates of manure excretion in animal houses and storage systems and
grassland, and fertilizer use in cropland and grassland for the year 2000
Agricultural system Manure/fertilizer N
Meana
Gg yr�1
Distribution of manure N
Mixed and landless systems 74 020
Housing and storage 45 876
Grazing 28 160
Pastoral systems 22 291
Housing and storage 1378
Grazing 20 880
Outside agricultural system 15 708
Total 112 228
Spreading of manure (excluding NH3 loss from animal houses and storage)
Cropland in mixed systems 30 825
Grassland in mixed systems 5874
Cropland in pastoral systems 872
Grassland in pastoral systems 234
Total 37 805
N fertilizer use
Cropland 79 095
Grassland 2787
Total 81882
a The mean is given with a range (10% and 90% percentile) of all results.b No range for the percentage of total N fertilizer, because fertilizer use in cr
total manure (66% (55–77%)) is generated in mixed andlandless systems, and 20% (13–27%) in pastoral systems.
Within the mixed and landless systems, 62% (50–73%)of the manure is collected in animal houses and storagesystems, and 38% (27–50%) is excreted in pastures. For thepastoral systems 94% (86–99%) is excreted in pastures. Atotal amount of manure N (46 (33–62) Tg yr�1), collectedin animal houses and storage systems in mixed andlandless systems is applied primarily to croplands. Storageof manure is much less important in pastoral systems(1 Tg of N per year with a range of 0–3 Tg).
The global NH3-N emission from animal manure isabout 21 (16–27) Tg yr�1 (Table 4); 44% (31–55%) of thiscomes from animal houses and storage systems, 27%(17–37) from grazing animals and 30% (23–38%) fromspreading of animal manure. NH3-N volatilization from Nfertilizer use is 11 (10–12) Tg yr�1, bringing the totalNH3-N loss for agricultural systems to 32 (27–38) Tg yr�1.
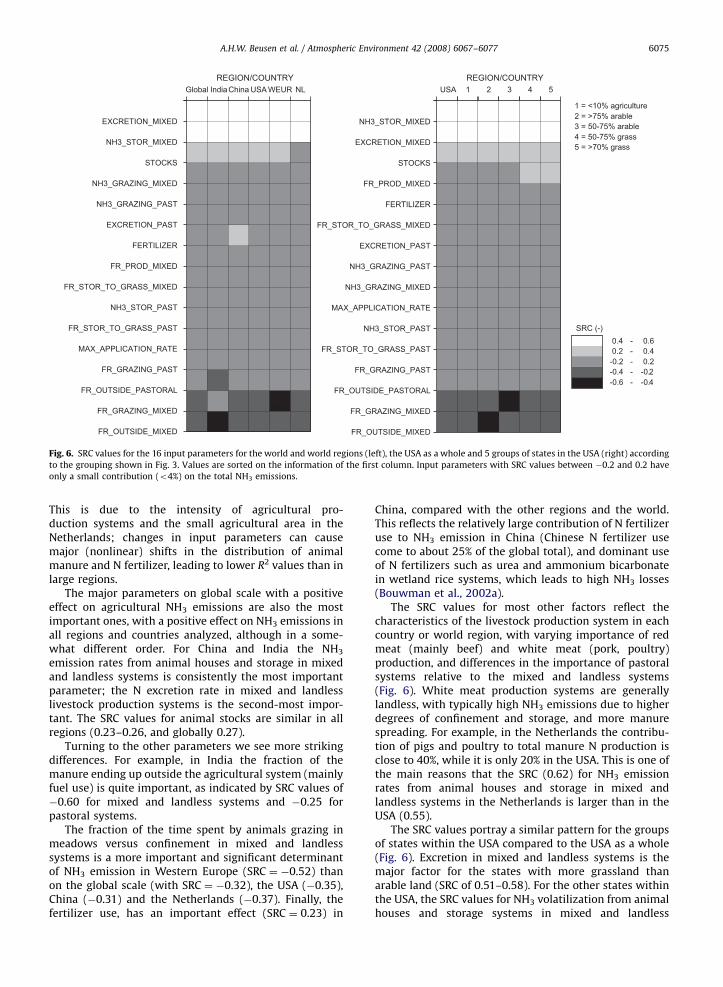
Comparison of our inventory with data for 17 Europeancountries reported to the United Nations EconomicCommission for Europe (UNECE) (UNECE, 2003; Vestreng,2003; Vestreng et al., 2005) shows good agreement(Fig. 5). Our estimates tend to be somewhat lower thanthe reported values indicated by the total NH3 emissionfor these countries (2412 Gg NH3-N yr�1 in our inventoryand �9% lower than the reported 2662 Gg NH3-N yr�1).Our estimate for the USA of 2117 Gg yr�1 for NH3-Nemission from livestock operations only (includingmanure spreading and excluding fertilizer use) exceedsthe estimate of 1869 Gg NH3-N yr�1 from USEPA (2005) by13% for the year 2002.
excretion during grazing, spreading of stored manure in cropland and
Range Meana Range
% of total
58 450– 92 500 66 55– 77
33 007– 61799 41 31– 52
18 434– 39 040 25 17– 33
14 600– 31000 20 13– 27
215– 3097 1 0– 3
13 574– 29 718 19 12– 26
5958– 29 155 14 5– 26
92 807– 132 272 100
21423– 42 371 82 76– 89
2454– 11020 16 10– 20
144– 1917 2 1– 3
16– 670 1 0– 1
26 320– 51687 100
72 760– 85 416 97 �b
2564– 3010 3 �b
75 324– 88 426 100 100
opland and grassland were varied in the same way in each calculation.
ARTICLE IN PRESS
Fig. 4. NH3 emissions from housing, storage (top panel) and grazing (middle panel) in mixed and landless systems, and emissions due to the spreading of
manure in cropping systems (bottom panel).
A.H.W. Beusen et al. / Atmospheric Environment 42 (2008) 6067–6077 6073
It is clear that the uncertainty in the estimates used forthis comparison include large uncertainties as well. Forexample, the USEPA estimate in the 1999 national
emission inventory (using a different methodology) was2954 Gg NH3-N yr�1, which is 58% more than the estimatefor 2002, while animal populations for most animal
ARTICLE IN PRESS
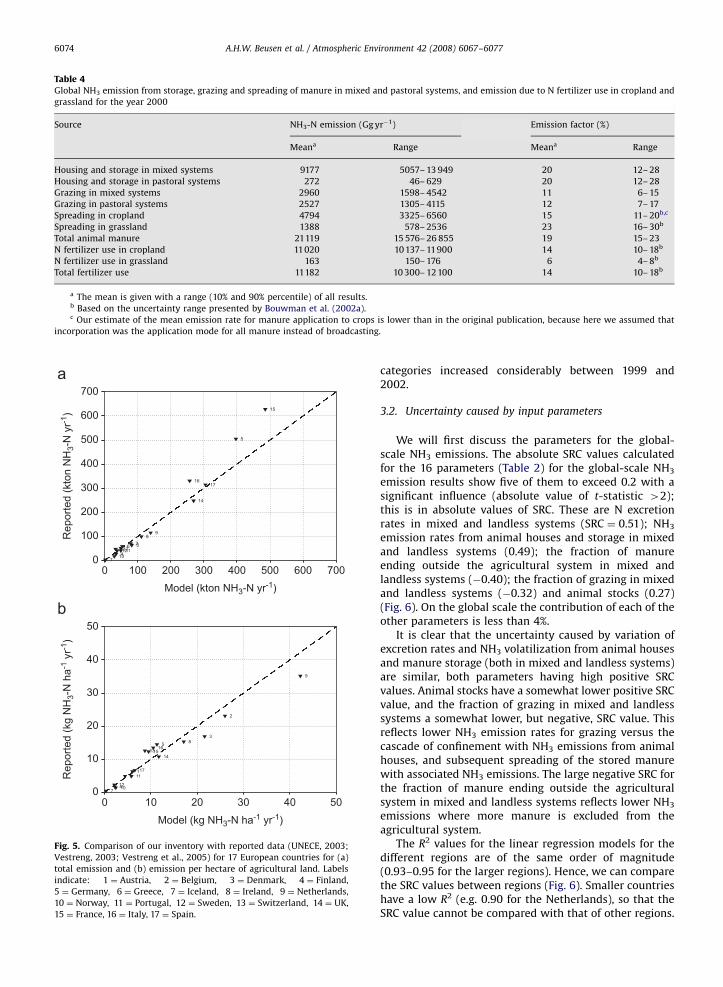
Table 4Global NH3 emission from storage, grazing and spreading of manure in mixed and pastoral systems, and emission due to N fertilizer use in cropland and
grassland for the year 2000
Source NH3-N emission (Gg yr�1) Emission factor (%)
Meana Range Meana Range
Housing and storage in mixed systems 9177 5057– 13 949 20 12– 28
Housing and storage in pastoral systems 272 46– 629 20 12– 28
Grazing in mixed systems 2960 1598– 4542 11 6– 15
Grazing in pastoral systems 2527 1305– 4115 12 7– 17
Spreading in cropland 4794 3325– 6560 15 11– 20b,c
Spreading in grassland 1388 578– 2536 23 16– 30b
Total animal manure 21119 15 576– 26 855 19 15– 23
N fertilizer use in cropland 11020 10 137– 11900 14 10– 18b
N fertilizer use in grassland 163 150– 176 6 4– 8b
Total fertilizer use 11182 10 300– 12 100 14 10– 18b
a The mean is given with a range (10% and 90% percentile) of all results.b Based on the uncertainty range presented by Bouwman et al. (2002a).c Our estimate of the mean emission rate for manure application to crops is lower than in the original publication, because here we assumed that
incorporation was the application mode for all manure instead of broadcasting.
00
100 200 300 400 500 600 700
Model (kton NH3-N yr-1)
100
200
300
400
500
600
700
Rep
orte
d (k
ton
NH
3-N
yr-1
)
0 10 20 30 40 50
Model (kg NH3-N ha-1 yr-1)
0
10
20
30
40
50
Rep
orte
d (k
g N
H3-
N h
a-1 y
r-1)
Fig. 5. Comparison of our inventory with reported data (UNECE, 2003;
Vestreng, 2003; Vestreng et al., 2005) for 17 European countries for (a)
total emission and (b) emission per hectare of agricultural land. Labels
indicate: 1 ¼ Austria, 2 ¼ Belgium, 3 ¼ Denmark, 4 ¼ Finland,
5 ¼ Germany, 6 ¼ Greece, 7 ¼ Iceland, 8 ¼ Ireland, 9 ¼ Netherlands,
10 ¼ Norway, 11 ¼ Portugal, 12 ¼ Sweden, 13 ¼ Switzerland, 14 ¼ UK,
15 ¼ France, 16 ¼ Italy, 17 ¼ Spain.
A.H.W. Beusen et al. / Atmospheric Environment 42 (2008) 6067–60776074
categories increased considerably between 1999 and2002.
3.2. Uncertainty caused by input parameters
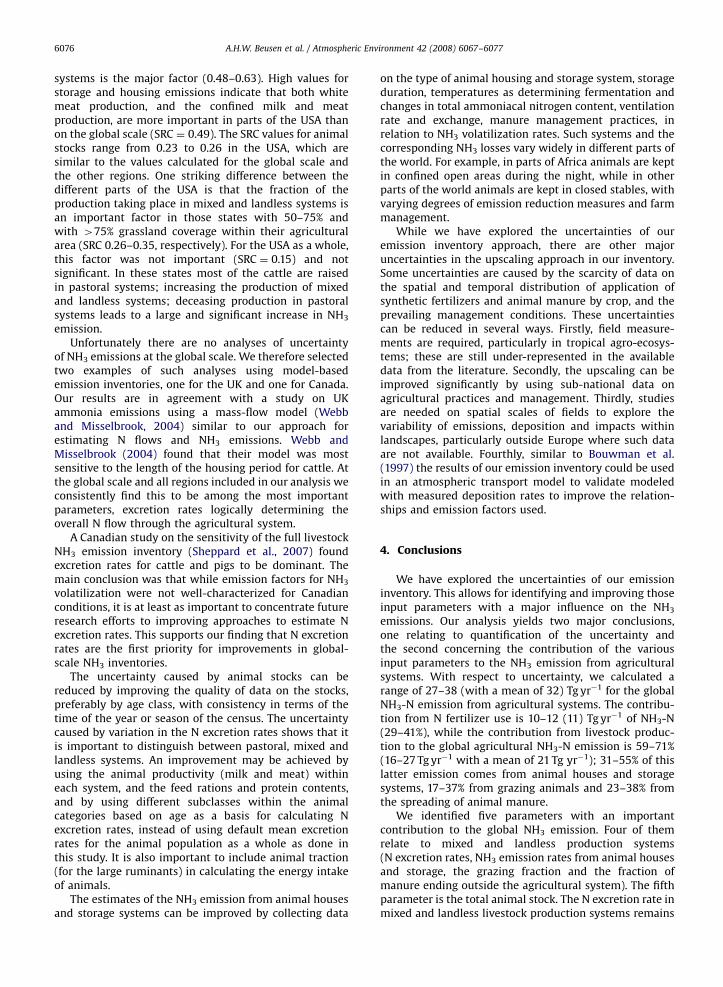
We will first discuss the parameters for the global-scale NH3 emissions. The absolute SRC values calculatedfor the 16 parameters (Table 2) for the global-scale NH3
emission results show five of them to exceed 0.2 with asignificant influence (absolute value of t-statistic 42);this is in absolute values of SRC. These are N excretionrates in mixed and landless systems (SRC ¼ 0.51); NH3
emission rates from animal houses and storage in mixedand landless systems (0.49); the fraction of manureending outside the agricultural system in mixed andlandless systems (�0.40); the fraction of grazing in mixedand landless systems (�0.32) and animal stocks (0.27)(Fig. 6). On the global scale the contribution of each of theother parameters is less than 4%.
It is clear that the uncertainty caused by variation ofexcretion rates and NH3 volatilization from animal housesand manure storage (both in mixed and landless systems)are similar, both parameters having high positive SRCvalues. Animal stocks have a somewhat lower positive SRCvalue, and the fraction of grazing in mixed and landlesssystems a somewhat lower, but negative, SRC value. Thisreflects lower NH3 emission rates for grazing versus thecascade of confinement with NH3 emissions from animalhouses, and subsequent spreading of the stored manurewith associated NH3 emissions. The large negative SRC forthe fraction of manure ending outside the agriculturalsystem in mixed and landless systems reflects lower NH3
emissions where more manure is excluded from theagricultural system.
The R2 values for the linear regression models for thedifferent regions are of the same order of magnitude(0.93–0.95 for the larger regions). Hence, we can comparethe SRC values between regions (Fig. 6). Smaller countrieshave a low R2 (e.g. 0.90 for the Netherlands), so that theSRC value cannot be compared with that of other regions.
ARTICLE IN PRESS
Global IndiaChina USA WEUR NL
FR_OUTSIDE_MIXED
FR_GRAZING_MIXED
FR_OUTSIDE_PASTORAL
FR_GRAZING_PAST
MAX_APPLICATION_RATE
FR_STOR_TO_GRASS_PAST
NH3_STOR_PAST
FR_STOR_TO_GRASS_MIXED
FR_PROD_MIXED
FERTILIZER
EXCRETION_PAST
NH3_GRAZING_PAST
NH3_GRAZING_MIXED
STOCKS
NH3_STOR_MIXED
EXCRETION_MIXED
REGION/COUNTRYUSA 1 2 3 4 5
FR_OUTSIDE_MIXED
FR_GRAZING_MIXED
FR_OUTSIDE_PASTORAL
FR_GRAZING_PAST
FR_STOR_TO_GRASS_PAST
NH3_STOR_PAST
MAX_APPLICATION_RATE
NH3_GRAZING_MIXED
NH3_GRAZING_PAST
EXCRETION_PAST
FR_STOR_TO_GRASS_MIXED
FERTILIZER
FR_PROD_MIXED
STOCKS
EXCRETION_MIXED
NH3_STOR_MIXED
REGION/COUNTRY
SRC (-)0.4 - 0.60.2 - 0.4
-0.2 - 0.2-0.4 - -0.2-0.6 - -0.4
1 = <10% agriculture2 = >75% arable3 = 50-75% arable4 = 50-75% grass5 = >70% grass
Fig. 6. SRC values for the 16 input parameters for the world and world regions (left), the USA as a whole and 5 groups of states in the USA (right) according
to the grouping shown in Fig. 3. Values are sorted on the information of the first column. Input parameters with SRC values between �0.2 and 0.2 have
only a small contribution (o4%) on the total NH3 emissions.
A.H.W. Beusen et al. / Atmospheric Environment 42 (2008) 6067–6077 6075
This is due to the intensity of agricultural pro-duction systems and the small agricultural area in theNetherlands; changes in input parameters can causemajor (nonlinear) shifts in the distribution of animalmanure and N fertilizer, leading to lower R2 values than inlarge regions.
The major parameters on global scale with a positiveeffect on agricultural NH3 emissions are also the mostimportant ones, with a positive effect on NH3 emissions inall regions and countries analyzed, although in a some-what different order. For China and India the NH3
emission rates from animal houses and storage in mixedand landless systems is consistently the most importantparameter; the N excretion rate in mixed and landlesslivestock production systems is the second-most impor-tant. The SRC values for animal stocks are similar in allregions (0.23–0.26, and globally 0.27).
Turning to the other parameters we see more strikingdifferences. For example, in India the fraction of themanure ending up outside the agricultural system (mainlyfuel use) is quite important, as indicated by SRC values of�0.60 for mixed and landless systems and �0.25 forpastoral systems.
The fraction of the time spent by animals grazing inmeadows versus confinement in mixed and landlesssystems is a more important and significant determinantof NH3 emission in Western Europe (SRC ¼ �0.52) thanon the global scale (with SRC ¼ �0.32), the USA (�0.35),China (�0.31) and the Netherlands (�0.37). Finally, thefertilizer use, has an important effect (SRC ¼ 0.23) in
China, compared with the other regions and the world.This reflects the relatively large contribution of N fertilizeruse to NH3 emission in China (Chinese N fertilizer usecome to about 25% of the global total), and dominant useof N fertilizers such as urea and ammonium bicarbonatein wetland rice systems, which leads to high NH3 losses(Bouwman et al., 2002a).
The SRC values for most other factors reflect thecharacteristics of the livestock production system in eachcountry or world region, with varying importance of redmeat (mainly beef) and white meat (pork, poultry)production, and differences in the importance of pastoralsystems relative to the mixed and landless systems(Fig. 6). White meat production systems are generallylandless, with typically high NH3 emissions due to higherdegrees of confinement and storage, and more manurespreading. For example, in the Netherlands the contribu-tion of pigs and poultry to total manure N production isclose to 40%, while it is only 20% in the USA. This is one ofthe main reasons that the SRC (0.62) for NH3 emissionrates from animal houses and storage in mixed andlandless systems in the Netherlands is larger than in theUSA (0.55).
The SRC values portray a similar pattern for the groupsof states within the USA compared to the USA as a whole(Fig. 6). Excretion in mixed and landless systems is themajor factor for the states with more grassland thanarable land (SRC of 0.51–0.58). For the other states withinthe USA, the SRC values for NH3 volatilization from animalhouses and storage systems in mixed and landless
ARTICLE IN PRESS
A.H.W. Beusen et al. / Atmospheric Environment 42 (2008) 6067–60776076
systems is the major factor (0.48–0.63). High values forstorage and housing emissions indicate that both whitemeat production, and the confined milk and meatproduction, are more important in parts of the USA thanon the global scale (SRC ¼ 0.49). The SRC values for animalstocks range from 0.23 to 0.26 in the USA, which aresimilar to the values calculated for the global scale andthe other regions. One striking difference between thedifferent parts of the USA is that the fraction of theproduction taking place in mixed and landless systems isan important factor in those states with 50–75% andwith 475% grassland coverage within their agriculturalarea (SRC 0.26–0.35, respectively). For the USA as a whole,this factor was not important (SRC ¼ 0.15) and notsignificant. In these states most of the cattle are raisedin pastoral systems; increasing the production of mixedand landless systems; deceasing production in pastoralsystems leads to a large and significant increase in NH3
emission.Unfortunately there are no analyses of uncertainty
of NH3 emissions at the global scale. We therefore selectedtwo examples of such analyses using model-basedemission inventories, one for the UK and one for Canada.Our results are in agreement with a study on UKammonia emissions using a mass-flow model (Webband Misselbrook, 2004) similar to our approach forestimating N flows and NH3 emissions. Webb andMisselbrook (2004) found that their model was mostsensitive to the length of the housing period for cattle. Atthe global scale and all regions included in our analysis weconsistently find this to be among the most importantparameters, excretion rates logically determining theoverall N flow through the agricultural system.
A Canadian study on the sensitivity of the full livestockNH3 emission inventory (Sheppard et al., 2007) foundexcretion rates for cattle and pigs to be dominant. Themain conclusion was that while emission factors for NH3
volatilization were not well-characterized for Canadianconditions, it is at least as important to concentrate futureresearch efforts to improving approaches to estimate Nexcretion rates. This supports our finding that N excretionrates are the first priority for improvements in global-scale NH3 inventories.
The uncertainty caused by animal stocks can bereduced by improving the quality of data on the stocks,preferably by age class, with consistency in terms of thetime of the year or season of the census. The uncertaintycaused by variation in the N excretion rates shows that itis important to distinguish between pastoral, mixed andlandless systems. An improvement may be achieved byusing the animal productivity (milk and meat) withineach system, and the feed rations and protein contents,and by using different subclasses within the animalcategories based on age as a basis for calculating Nexcretion rates, instead of using default mean excretionrates for the animal population as a whole as done inthis study. It is also important to include animal traction(for the large ruminants) in calculating the energy intakeof animals.
The estimates of the NH3 emission from animal housesand storage systems can be improved by collecting data
on the type of animal housing and storage system, storageduration, temperatures as determining fermentation andchanges in total ammoniacal nitrogen content, ventilationrate and exchange, manure management practices, inrelation to NH3 volatilization rates. Such systems and thecorresponding NH3 losses vary widely in different parts ofthe world. For example, in parts of Africa animals are keptin confined open areas during the night, while in otherparts of the world animals are kept in closed stables, withvarying degrees of emission reduction measures and farmmanagement.
While we have explored the uncertainties of ouremission inventory approach, there are other majoruncertainties in the upscaling approach in our inventory.Some uncertainties are caused by the scarcity of data onthe spatial and temporal distribution of application ofsynthetic fertilizers and animal manure by crop, and theprevailing management conditions. These uncertaintiescan be reduced in several ways. Firstly, field measure-ments are required, particularly in tropical agro-ecosys-tems; these are still under-represented in the availabledata from the literature. Secondly, the upscaling can beimproved significantly by using sub-national data onagricultural practices and management. Thirdly, studiesare needed on spatial scales of fields to explore thevariability of emissions, deposition and impacts withinlandscapes, particularly outside Europe where such dataare not available. Fourthly, similar to Bouwman et al.(1997) the results of our emission inventory could be usedin an atmospheric transport model to validate modeledwith measured deposition rates to improve the relation-ships and emission factors used.
4. Conclusions
We have explored the uncertainties of our emissioninventory. This allows for identifying and improving thoseinput parameters with a major influence on the NH3
emissions. Our analysis yields two major conclusions,one relating to quantification of the uncertainty andthe second concerning the contribution of the variousinput parameters to the NH3 emission from agriculturalsystems. With respect to uncertainty, we calculated arange of 27–38 (with a mean of 32) Tg yr�1 for the globalNH3-N emission from agricultural systems. The contribu-tion from N fertilizer use is 10–12 (11) Tg yr�1 of NH3-N(29–41%), while the contribution from livestock produc-tion to the global agricultural NH3-N emission is 59–71%(16–27 Tg yr�1 with a mean of 21 Tg yr�1); 31–55% of thislatter emission comes from animal houses and storagesystems, 17–37% from grazing animals and 23–38% fromthe spreading of animal manure.
We identified five parameters with an importantcontribution to the global NH3 emission. Four of themrelate to mixed and landless production systems(N excretion rates, NH3 emission rates from animal housesand storage, the grazing fraction and the fraction ofmanure ending outside the agricultural system). The fifthparameter is the total animal stock. The N excretion rate inmixed and landless livestock production systems remains
ARTICLE IN PRESS
A.H.W. Beusen et al. / Atmospheric Environment 42 (2008) 6067–6077 6077
consistently the dominant parameter in the large worldregions. However, in countries where landless white meatand confined milk and beef production systems make amajor contribution to total manure N, the contribution ofanimal houses and storage systems to total agriculturalNH3 emission exceeds that of animal N excretion. Futureinventories, both on the global and country scales, shouldfocus on these factors.
Acknowledgments
The work of AB, AFB, PH and GvD comprised part of theproject, ‘Integrated Terrestrial Modeling’ (S/550035/01/DD)of the Netherlands Environmental Assessment Agency.
References
AAPFCO/TFI, 2006. Commercial fertilizers 2005, Association of AmericanPlant Food Control Officials/The Fertilizer Institute /www.aapfco.orgS, Washington, DC.
Asman, W.A.H., Sutton, M.A., Schjorring, J.K., 1998. Ammonia: emission,atmospheric transport and deposition. New Phytologist 139, 27–48.
Bouwman, A.F., 1999. Approaches to Scaling of Trace Gas Fluxes inEcosystems. Elsevier Science, Amsterdam, 362pp.
Bouwman, A.F., Asman, W.A.H., 1997. Scaling of nitrogen gas fluxesfrom grasslands. In: Jarvis, S.C., Pain, B.F. (Eds.), Gaseous NitrogenEmissions from Grasslands. CAB International, Wallingford,New York, pp. 311–330.
Bouwman, A.F., et al., 1997. A global high-resolution emission inventoryfor ammonia. Global Biogeochemical Cycles 11, 561–587.
Bouwman, A.F., Boumans, L.J.M., Batjes, N.H., 2002a. Estimation of globalNH3 volatilization loss from synthetic fertilizers and animal manureapplied to arable lands and grasslands. Global Biogeochemical Cycles16 (2), 1024.
Bouwman, A.F., Van Vuuren, D.P., Derwent, R.G., Posch, M., 2002b.A global analysis of acidification and eutrophication of terrestrialecosystems. Water, Air and Soil Pollution 141, 349–382.
Bouwman, A.F., Van der Hoek, K.W., Eickhout, B., Soenario, I., 2005a.Exploring changes in world ruminant production systems. Agricul-tural Systems 84 (2), 121–153.
Bouwman, A.F., Van Drecht, G., Van der Hoek, K.W., 2005b. Nitrogen surfacebalances in intensive agricultural production systems in different worldregions for the period 1970–2030. Pedosphere 15 (2), 137–155.
Bouwman, A.F., Van Drecht, G., Van der Hoek, K.W., 2005c. Surface Nbalances and reactive N loss to the environment from intensiveagricultural production systems for the period 1970–2030, Science inChina Ser. C. Life Sciences, pp. 1–13.
Bruinsma, J.E., 2003. World agriculture: towards 2015/2030. An FAOperspective. Earthscan, London, 432pp.
Bussink, D.W., Oenema, O., 1998. Ammonia volatilization from dairyfarming systems in temperate areas: a review. Nutrient Cycling inAgroecosystems 51, 19–33.
China National Bureau of Statistics, 2006a. China Agricultural Statistics,Beijing.
China National Bureau of Statistics, 2006b. China Statistical Yearbook, Beijing.Dentener, F., et al., 2006. The global atmospheric environment for the next
generation. Environment Science and Technology 40, 3586–3594.Dragosits, U., et al., 2002. Ammonia emission, deposition and impact
assessment at the field scale: a case study of sug-grid spatialvariability. Environmental Pollution 117, 147–158.
FAO, 2007. FAOSTAT database collections /www.apps.fao.orgS. Food andAgriculture Organization of the United Nations, Rome.
Graedel, T.E., Crutzen, P.J., 1993. Atmospheric Change. An Earth SystemPerspective. W.H. Freeman & Company, New York.
IFA, 2003. IFADATA statistics from 1973/74–1973 to 2001–2001/02,production, imports, exports and consumption statistics for nitrogen,
phosphate and potash fertilizers. Data on CD-ROM /http://www.fertilizer.org/ifa/statistics/IFADATA/dataline.aspS, International Ferti-lizer Industry Association, Paris.
IFA/IFDC/FAO, 2003. Fertilizer use by crop, 5th ed. Food and AgricultureOrganization of the United Nations, Rome.
Iman, R.L., Helton, J.C., 1985. A Comparison of Uncertainty and SensitivityAnalysis Techniques for Computer Models. Sandia National Labora-tories, Albequrque, New Mexico.
Klein Goldewijk, K., Van Drecht, G., 2006. HYDE 3: Current and historicalpopulation and land cover, Integrated modelling of global environ-mental change. An overview of IMAGE 2.4. Netherlands Environ-mental Assessment Agency, Bilthoven, pp. 93–111.
Kruska, R.L., Reid, R.S., Thornton, P.K., Henninger, N., Kristjanson, P.M.,2003. Mapping livestock-oriented agricultural production systemsfor the developing world. Agricultural Systems 77, 39–63.
Millennium Ecosystem Assessment, 2006. Ecosystems and human well-being: scenarios, Carpenter S.R., Pingali P.L., Bennett, E.M. and Zurek,M.B. (Eds.), Vol. 2. Island Press, Washington, DC.
Mosier, A.R., et al., 1998. Closing the global atmospheric N2O budget:nitrous oxide emissions through the agricultural nitrogen cycle.Nutrient Cycling in Agroecosystems 52, 225–248.
National Land and Water Resources Audit, 2001. Rangelands: andoverview, National Land and Water Resources Audit. The NationalHeritage Trust, Commonwealth of Australia, Canberra.
Saltelli, A., Chan, K., Scott, E.M., 2000. Sensitivity analysis. Wiley andSons, Chichester.
Saltelli, A., Tarantola, S., Campolongo, F., Ratto, M., 2004. Sensitivityanalysis in practice. A guide to assessing scientific models. Wiley,Chichester.
Sere, C., Steinfeld, H., 1996. World livestock production systems.Current status, issues and trends. Animal Production and HealthPaper 127. Food and Agriculture Organization of the United Nations,Rome.
Sheppard, S.C., Bittman, S., Tait, J., Sommer, S.G., Webb, J.A., 2007.Sensitivity analysis of alternative model structures for an indicator ofammonia emissions from agriculture. Canadian Journal of SoilScience 87, 129–139.
UN-ECE, 1999. Draft protocol to the 1979 Convention on Long rangeTransboundary Air Pollution to abate acidification, eutrophicationand ground-level ozone. EB.AIR/1999/1, United Nations-EconomicCommission for Europe (UN-ECE), Geneva.
UNECE, 2003. Present state of emission data. EB.AIR/GE.1/2004/10.United Nations Economic Commission for Europe (UNECE),Geneva.
US-EPA, 2006. Inventory of US Greenhouse Gas Emissions andSinks 1990–2004. United States Environmental Protection Agency,Washington, DC.
USDA, 2006. China Agricultural and Economic Data: Provincial Data,United States Department of Agriculture. Economic Research Service/www.ers.usda.govS.
USEPA, 2005. National emission inventory. Ammonia emissions fromanimal agricultural operations. United States Environmental Protec-tion Agency.
Van Breemen, N., et al., 1982. Soil acidification from atmosphericammonium sulphate in forest canopy throughfall. Nature 299,548–550.
Van der Hoek, K.W., 1998. Nitrogen efficiency in global animalproduction. In: Van der Hoek, K.W., Erisman, J.W., Smeulders, S.,Wisniewski, J.R., Wisniewski, J. (Eds.), Nitrogen, the Confer-N-s.Elsevier, Amsterdam, pp. 127–132.
Van Egmond, K., Bresser, T., Bouwman, L., 2002. The European nitrogencase. Ambio 31, 72–78.
Vestreng, V., 2003. EMEP/MSC-W Technical Report. Review and Revision.Emission data reported to CLRTAP. MSC-W Status Report 2003.EMEP/MSC-W Note 1/2003, EMEP-Meteorological Synthesizingcentre West (MSC-W), Oslo, Norway.
Vestreng, V., et al., 2005. Inventory Review 2005, Emission Data reportedto LRTAP Convention and NEC Directive, Initial review of HMs andPOPs. Technical Report MSC-W 1/2005, EMEP-MeteorologicalSynthesizing Centre West (MSC-W), Oslo, Norway.
Webb, J., Misselbrook, T.H., 2004. A mass-flow model of ammoniaemissions from UK livestock production. Atmospheric Environment38, 2163–2176.