Embed Size (px)
Citation preview

PUSHINGBOUNDARIES
2009 ANNUAl RePoRt

IMPACTING THE INDUSTRY ACROSS THE GLOBE We continually push
boundaries to meet the changing needs of our customers who are developing complex assets
in increasingly challenging environments. As the service intensity of complex wells increases in
markets such as deepwater and unconventional reservoirs, we are deploying new technologies
and workflows that help customers develop productive assets and increase efficiency resulting
in improved project economics. Our global footprint allows us to expand our expertise while
leveraging our infrastructure, processes, and partnerships to support our growth and deliver a
superior return on investment.
Continental United StateS
alaSKa
noRWaY
RUSSia
WeSt aFRiCa
CHina
MalaYSia
As the technology leader for unconventional gas plays, Halliburton continued to pioneer new applications of microseismic fracture mapping technology and horizontal logging solutions to better understand the complex reservoirs in the Haynesville and Marcellus shale plays.
In 2009, Halliburton won $130 million of additional revenue in Alaska byusing an optimized formation- evaluation approach for an international oil company for openhole and cased-hole wireline.
Significant 2009 contract awards included Baroid work with Talisman; contracts for Baroid and Cementing with BP; and 2-year extensions on all major Statoil contracts.
Halliburton set new drilling recordsin Russia and opened the first Real Time Center complementing our state-of-the-art directional drilling maintenance center.
In line with our long-term investments in deepwater markets, Halliburton’s operations based in Labuan moved into a new facility. Additionally, a new manufacturing plant was established in Johor.
In 2009, Halliburton executed the first GeoBalance® Managed Pressure Drill-ing (MPD) operations for PetroChina and drilled the longest horizontal lateral recorded in the Tarim Basin.
Halliburton entered an R&D agreement with Petrobras to develop customtechnology for Brazil’s subsalt areas, including the establishment of the Halliburton Technology and Solutions Center in Rio de Janeiro.
Halliburton launched the new Stim Star Angola, a versatile vessel certified with dynamic positioning designed to minimize offshore rig downtime.
BRaZil
eXPANDING oUR ReACHPUSHING BOUNDARIES

Halliburton serves the upstream oil and gas industry throughout the life cycle of the reservoir – from locating hydrocarbons and managing geological data, to drilling and formation evaluation, well construction and completion, and optimizing production through the life of the field.
Increased service intensity driven by the exploitation of more complex reservoirs, accelerated investments in our people and infrastructure for international growth, and a well-integrated technology strategy will continue to set us apart in the industry.
PUSHING BOUNDARIES 01
REVENUE in millions OPERATING INCOME in millions RETURN ON CAPITAl EMPlOyEd (ROCE)*
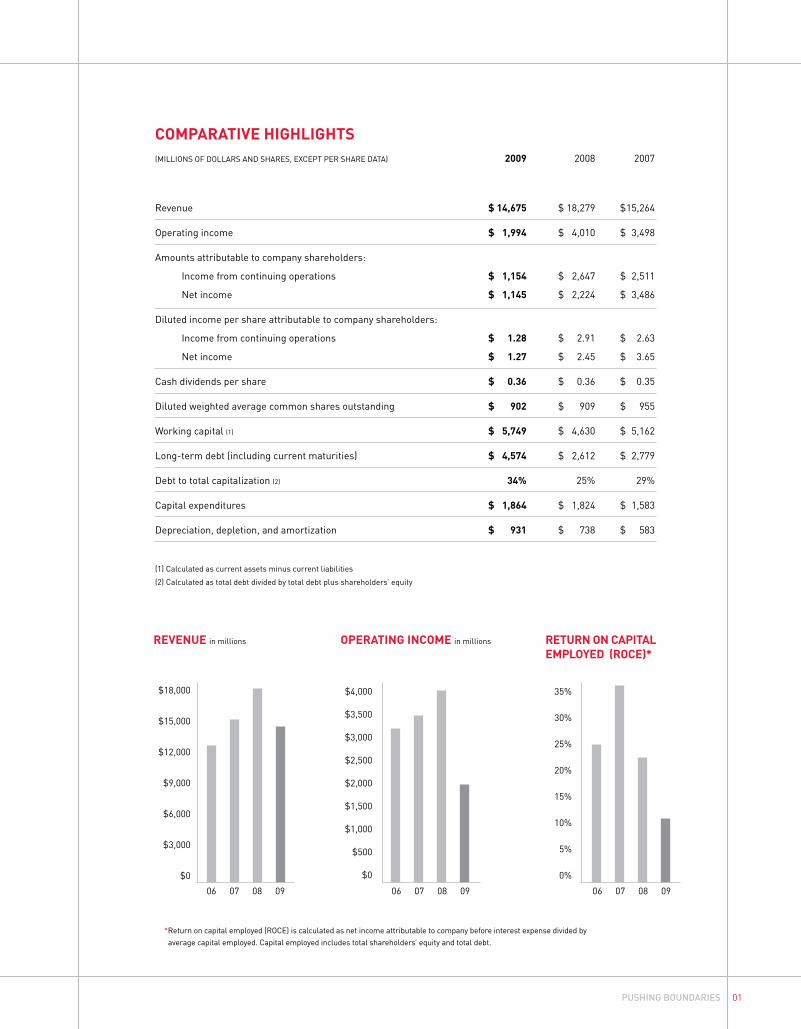
COMPARATIVE HIGHlIGHTS(MILLIONS OF DOLLARS AND SHARES, EXCEPT PER SHARE DATA) 2009 2008 2007
Revenue $ 14,675 $ 18,279 $ 15,264
Operating income $ 1,994 $ 4,010 $ 3,498
Amounts attributable to company shareholders:
Income from continuing operations $ 1,154 $ 2,647 $ 2,511
Net income $ 1,145 $ 2,224 $ 3,486
Diluted income per share attributable to company shareholders:
Income from continuing operations $ 1.28 $ 2.91 $ 2.63
Net income $ 1.27 $ 2.45 $ 3.65
Cash dividends per share $ 0.36 $ 0.36 $ 0.35
Diluted weighted average common shares outstanding $ 902 $ 909 $ 955
Working capital (1) $ 5,749 $ 4,630 $ 5,162
Long-term debt (including current maturities) $ 4,574 $ 2,612 $ 2,779
Debt to total capitalization (2) 34% 25% 29%
Capital expenditures $ 1,864 $ 1,824 $ 1,583
Depreciation, depletion, and amortization $ 931 $ 738 $ 583
(1) Calculated as current assets minus current liabilities
(2) Calculated as total debt divided by total debt plus shareholders’ equity
$18,000
$15,000
$12,000
$9,000
$6,000
$3,000
$0
$4,000
$3,500
$3,000
$2,500
$2,000
$1,500
$1,000
$500
$0
35%
30%
25%
20%
15%
10%
5%
0%
06 06 0609 09 0908 08 0807 07 07
*Return on capital employed (ROCE) is calculated as net income attributable to company before interest expense divided by average capital employed. Capital employed includes total shareholders’ equity and total debt.

2009 was a year of unprecedented challenges as the global economy faced widespread recession leading to declines
in energy investment. Amid this climate of economic uncertainty, Halliburton rose to the challenge and increased the
strength of its global franchise.
In response to the global recession, demand for oil and natural gas weakened, reducing global drilling activity
and causing customers to change their priorities. North America experienced a shift in the resource mix.
For the first time, the number of horizontal wells exceeded the number of vertical wells drilled, as operators
focused on unconventional basins, such as tight natural gas and shale reservoirs. Operators have increased
their production rates by leveraging “fit-for-purpose” technology to drill longer horizontal laterals and increase
stimulation intensity.
International drilling activity experienced an average 8 percent decline as the economic slowdown increased the
amount of spare capacity, discouraging investment in new upstream projects. In contrast, deepwater markets were
resilient due to their larger scale and long-term capital commitments.
Globally, operators migrated from focusing on individual supplier costs toward reducing total project execution costs.
To achieve this objective, customers purchased large packages of services spanning well construction and completion
activities. Our broad portfolio of offerings and our ability to deliver integrated services make us uniquely qualified to
meet this increased demand for comprehensive solutions.
A DifferentiAteD StrAtegy While short-term activity declined, we continued our focus on positioning for
growth and generating superior returns. We maintained our investment in capital equipment and infrastructure to
strengthen our global franchise in key markets. With the increased volatility of the financial markets, we also took steps
to maintain our financial flexibility by managing costs, increasing our cash reserves, and protecting our credit rating.
In North America, we opened new service centers in unconventional basins such as the Williston, Marcellus, and
Haynesville shale plays. In addition, we deployed customized technology such as shale formation evaluation tools and
specialized stimulation units built to increase reliability and efficiency.
In international markets, we continued to expand our footprint. We opened a Sperry Drilling facility in
Nizhnevartovsk, Russia, that includes the first Remote Operations Center to provide real-time operations support
for geosteering and drilling optimization in Western Siberia. In Libya, we opened a new state-of-the-art base camp
to support our expanded product service line offerings. Additionally, in Angola, we launched the Stim Star Angola
stimulation vessel, which is specialized to work in difficult sea conditions.
executing to PlAn, Achieving reSultS We executed our strategy through several key initiatives. Most
importantly, we focused on protecting and expanding our market share. While markets remained competitive, we
expanded the scope of our services for many global customers. We also maintained our investment in technology and
people, further ensuring the competitive strength of our future service offerings.
TO OUR SHAREHOLDERS:
PUSHINGBOUNdARIES
02 HALLIBURTON 2009 ANNUAL REPORT

PUSHING BOUNDARIES 03
We leveraged the breadth of our portfolio to offer packaged services that capitalized on our reservoir knowledge and
leading technology. Using this model, we managed the integration of services from planning through execution to
deliver greater efficiency and lower project costs. Through these initiatives, Halliburton has strengthened its share
across all major product service lines with significant gains in testing, drill bits, and directional drilling.
The successful execution of our strategy is reflected in our financial results. Even at the most difficult point of the year,
we posted returns above the peer average, which will serve the company well as the industry comes out of the downturn.
In addition, we generated positive cash flow and ended the year with $3.4 billion of cash and marketable securities.
Moving forwArD through growth As we move forward, we will continue to execute our strategy. We
will leverage our balanced portfolio of industry-leading technologies to continue growing our international business
and expand our presence in underserved markets. China, Iraq, and Russia will provide growth opportunities in 2010 as
energy investment increases. Deepwater markets, such as Brazil and Angola, will increase the demand for complex
drilling and completion solutions. Deepwater markets will remain strong, as over 30 deepwater rigs are forecasted to
enter into the global market in 2010. We will also maintain our heavy investment in capital equipment and technology.
Finally, we will remain financially flexible, as we continue to focus on our cash flows by managing working capital and
our cost structure.
We believe in the strength of the long-term fundamentals of our business. Our customers will continue to pursue
more complex reservoirs, expecting greater efficiency and ingenuity. Our focus on developing technology to optimize
well construction and completions as complementary systems will differentiate our solutions for these
challenging reservoirs.
We will continue to manage through this downturn by focusing on expanding our market position, reducing input costs,
and delivering the superior execution and quality that our customers have come to expect. We will continue to push
boundaries by deploying our resources where activity will be robust in the recovery, enabling us to retain the share gains
we have experienced and to accelerate our growth.
david J. lesarChairman of the Board,President and Chief Executive Officer
Albert O. Cornelison, Jr.Executive Vice President andGeneral Counsel
Mark A. McCollumExecutive Vice President andChief Financial Officer
Timothy J. ProbertPresident, Global Business Linesand Corporate Development

04 HALLIBURTON 2009 ANNUAL REPORT
BR
AZI
L
Enhanced visualization and subsurface analysis was provided in part by the 2009 acquisition of Geo-Logic Systems, LLC, whose software helps validate interpretations and assists in analyzing and modeling hydrocarbon migration pathways, maturation histories, and fault seal characteristics in complex geology.
PUSHING BOUNDARIES IN
PUSHING BOUNDARIES 05
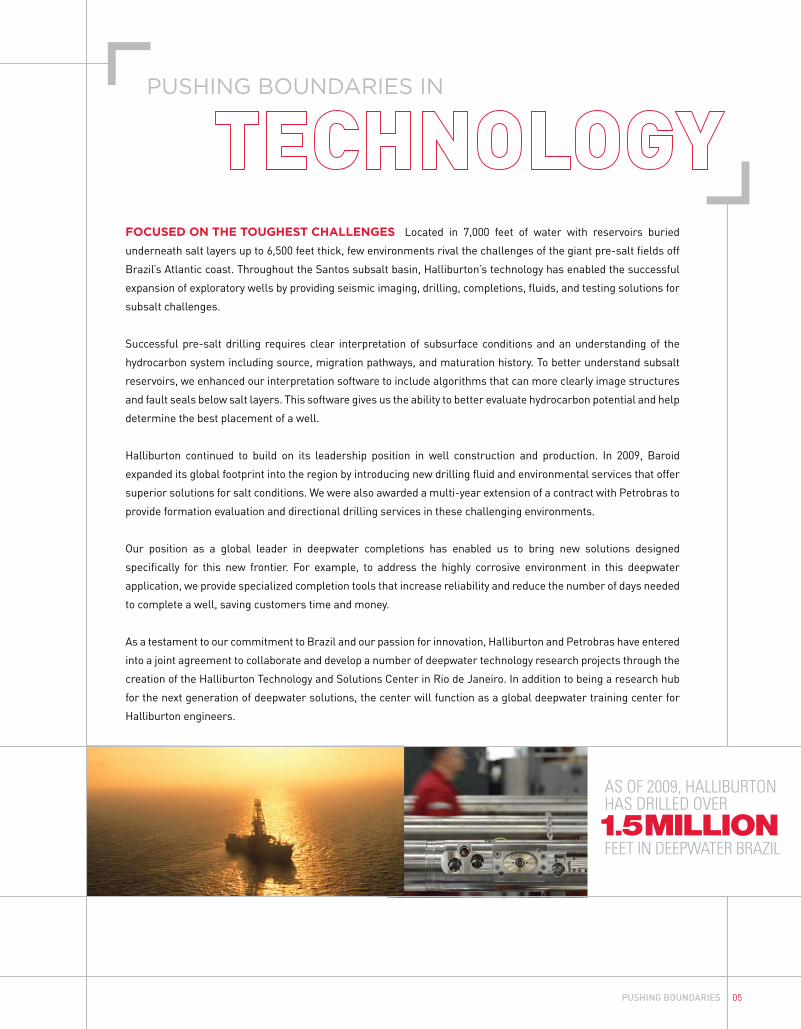
focuSeD on the tougheSt chAllengeS Located in 7,000 feet of water with reservoirs buried
underneath salt layers up to 6,500 feet thick, few environments rival the challenges of the giant pre-salt fields off
Brazil’s Atlantic coast. Throughout the Santos subsalt basin, Halliburton’s technology has enabled the successful
expansion of exploratory wells by providing seismic imaging, drilling, completions, fluids, and testing solutions for
subsalt challenges.
Successful pre-salt drilling requires clear interpretation of subsurface conditions and an understanding of the
hydrocarbon system including source, migration pathways, and maturation history. To better understand subsalt
reservoirs, we enhanced our interpretation software to include algorithms that can more clearly image structures
and fault seals below salt layers. This software gives us the ability to better evaluate hydrocarbon potential and help
determine the best placement of a well.
Halliburton continued to build on its leadership position in well construction and production. In 2009, Baroid
expanded its global footprint into the region by introducing new drilling fluid and environmental services that offer
superior solutions for salt conditions. We were also awarded a multi-year extension of a contract with Petrobras to
provide formation evaluation and directional drilling services in these challenging environments.
Our position as a global leader in deepwater completions has enabled us to bring new solutions designed
specifically for this new frontier. For example, to address the highly corrosive environment in this deepwater
application, we provide specialized completion tools that increase reliability and reduce the number of days needed
to complete a well, saving customers time and money.
As a testament to our commitment to Brazil and our passion for innovation, Halliburton and Petrobras have entered
into a joint agreement to collaborate and develop a number of deepwater technology research projects through the
creation of the Halliburton Technology and Solutions Center in Rio de Janeiro. In addition to being a research hub
for the next generation of deepwater solutions, the center will function as a global deepwater training center for
Halliburton engineers.
AS OF 2009, HALLIBURTON HAS DRILLED OVER
FEET IN DEEPWATER BRAZIL1.5MILLION

06 HALLIBURTON 2009 ANNUAL REPORT
NO
RTH
AM
ERIC
A
Halliburton’s equipment, engineering, and technology bring the reliability and power needed to stimulate the deep, hot Haynesville shale. Because we manufacture our own equipment designed for the application, we can offer customized completion solutions that increase efficiency during stimulation treatments.
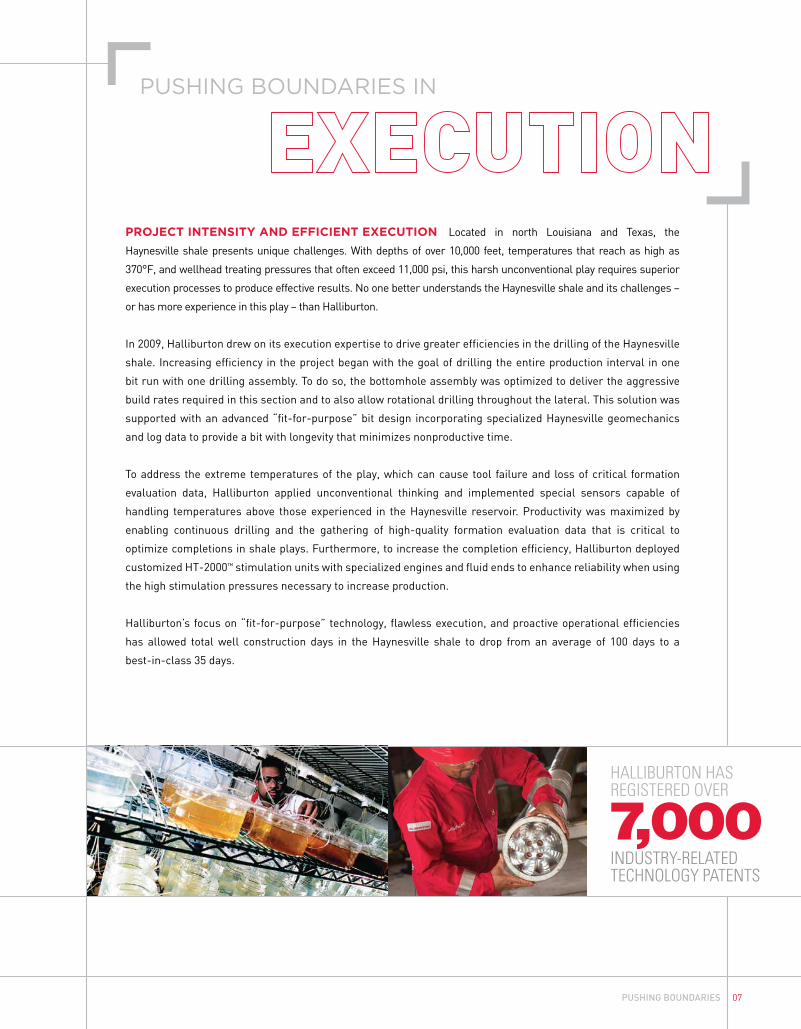
HALLIBURTON HASREGISTERED OVER
INDUSTRY-RELATEDTECHNOLOGY PATENTS
7
PUSHING BOUNDARIES IN
PUSHING BOUNDARIES 07
ProJect intenSity AnD efficient execution Located in north Louisiana and Texas, the
Haynesville shale presents unique challenges. With depths of over 10,000 feet, temperatures that reach as high as
370°F, and wellhead treating pressures that often exceed 11,000 psi, this harsh unconventional play requires superior
execution processes to produce effective results. No one better understands the Haynesville shale and its challenges –
or has more experience in this play – than Halliburton.
In 2009, Halliburton drew on its execution expertise to drive greater efficiencies in the drilling of the Haynesville
shale. Increasing efficiency in the project began with the goal of drilling the entire production interval in one
bit run with one drilling assembly. To do so, the bottomhole assembly was optimized to deliver the aggressive
build rates required in this section and to also allow rotational drilling throughout the lateral. This solution was
supported with an advanced “fit-for-purpose” bit design incorporating specialized Haynesville geomechanics
and log data to provide a bit with longevity that minimizes nonproductive time.
To address the extreme temperatures of the play, which can cause tool failure and loss of critical formation
evaluation data, Halliburton applied unconventional thinking and implemented special sensors capable of
handling temperatures above those experienced in the Haynesville reservoir. Productivity was maximized by
enabling continuous drilling and the gathering of high-quality formation evaluation data that is critical to
optimize completions in shale plays. Furthermore, to increase the completion efficiency, Halliburton deployed
customized HT-2000™ stimulation units with specialized engines and fluid ends to enhance reliability when using
the high stimulation pressures necessary to increase production.
Halliburton’s focus on “fit-for-purpose” technology, flawless execution, and proactive operational efficiencies
has allowed total well construction days in the Haynesville shale to drop from an average of 100 days to a
best-in-class 35 days.

08 HALLIBURTON 2009 ANNUAL REPORT
SAU
DI A
RA
BIA
From well construction to fluid systems,drilling and formation evaluation toproduction optimization, Halliburton has worked in a multitude of different reservoirs and wells, ranging from basic to complex,in Saudi Arabia.
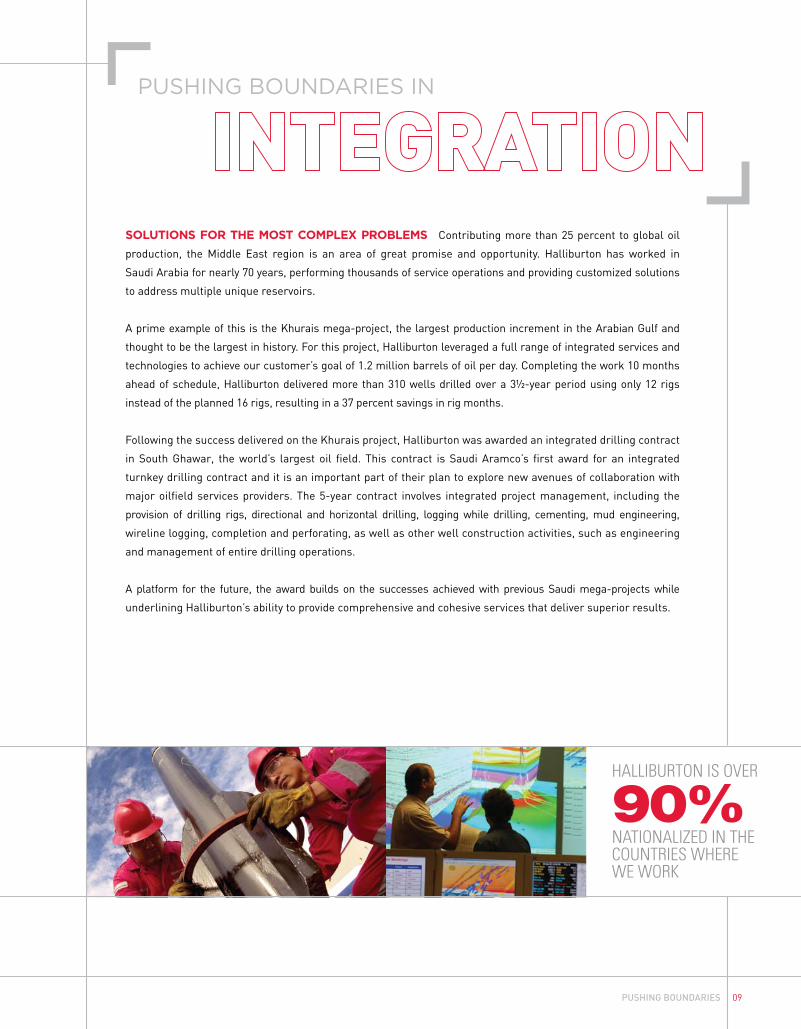
HALLIBURTON IS OVER
NATIONALIZED IN THECOUNTRIES WHERE WE WORK
PUSHING BOUNDARIES IN
PUSHING BOUNDARIES 09
SolutionS for the MoSt coMPlex ProBleMS Contributing more than 25 percent to global oil
production, the Middle East region is an area of great promise and opportunity. Halliburton has worked in
Saudi Arabia for nearly 70 years, performing thousands of service operations and providing customized solutions
to address multiple unique reservoirs.
A prime example of this is the Khurais mega-project, the largest production increment in the Arabian Gulf and
thought to be the largest in history. For this project, Halliburton leveraged a full range of integrated services and
technologies to achieve our customer’s goal of 1.2 million barrels of oil per day. Completing the work 10 months
ahead of schedule, Halliburton delivered more than 310 wells drilled over a 3½-year period using only 12 rigs
instead of the planned 16 rigs, resulting in a 37 percent savings in rig months.
Following the success delivered on the Khurais project, Halliburton was awarded an integrated drilling contract
in South Ghawar, the world’s largest oil field. This contract is Saudi Aramco’s first award for an integrated
turnkey drilling contract and it is an important part of their plan to explore new avenues of collaboration with
major oilfield services providers. The 5-year contract involves integrated project management, including the
provision of drilling rigs, directional and horizontal drilling, logging while drilling, cementing, mud engineering,
wireline logging, completion and perforating, as well as other well construction activities, such as engineering
and management of entire drilling operations.
A platform for the future, the award builds on the successes achieved with previous Saudi mega-projects while
underlining Halliburton’s ability to provide comprehensive and cohesive services that deliver superior results.

10 HALLIBURTON 2009 ANNUAL REPORT
GLO
BA
L C
OM
MIT
MEN
T
Halliburton continuously develops new materials that are compatible with a broad range of produced water. Onsite quality testing helps assure continued high fluid performance.

PUSHING BOUNDARIES IN
PUSHING BOUNDARIES 11
DeDicAteD to SAfe environMentAl SolutionS At Halliburton, striving to understand how every
business activity impacts our sustainability efforts enables us to make sound decisions. Our actions are guided
by our vision: “To be welcomed as a good corporate neighbor in our communities; to minimize harm to the
environment; to provide demonstrable social and economic benefits through sustainable relationships, sustainable
technology, and sustainable sourcing; and to validate our progress through transparency and reporting.”
This past year, we expanded our sustainability initiatives. For example, we are experimenting with ways to
reduce the amount of potable water needed to provide our services, evaluating new engine technology to reduce
emissions on location, and aggressively identifying local sources for our raw materials. In the United States, we
were recently selected to provide services for a carbon dioxide (CO2) storage project backed by the U.S. Department
of Energy in which approximately 4,000 tons of CO2 were injected into a storage well 8,500 feet below the surface.
From reservoir modeling, understanding the cap rock, to deploying tools with specialized metallurgy to
withstand the CO2 environment, the lessons learned from this project can be applied in other parts of the
world to create better carbon storage solutions.
In response to the substantial increase in unconventional oil and natural gas projects in the United States,
Halliburton is helping operators to reduce the environmental profile of stimulation treatments. While 99 percent
of stimulation fluid consists of water, Halliburton has pioneered a method for operators to understand the
significance of the kinds of additives they choose to treat their wells. To address this need, the Halliburton
Chemistry Scoring Index will be introduced in 2010, providing a standardized tool for assessing the health, safety,
and environmental implications of chemicals used in the stimulation treatment.
As oil and natural gas projects continue to grow in complexity, we see our ability to offer sustainable technology
solutions as a key part of our broad portfolio of services. We will continue to invest, establish partnerships, and
develop the needed technology to provide viable solutions to meet our sustainability goals.
HALLIBURTON RANKED
OUT OF 27 ENERGY SECTOR COmPANIES FOR CLImATE-RELATED INNOVATION*
THIRD
*2010 Maplecroft Climate Innovation Index listed on the Bloomberg Professional Service

12 HALLIBURTON 2009 ANNUAL REPORT
Advanced logging-while-drilling (LWD) technology in Brazil is helping to maximize production by optimizing the placement of the wellbore in the best part of the reservoir. Utilizing the full range of LWD technology, including magnetic-resonance logging while drilling, has eliminated redundant wireline logging runs while achieving results equivalent or superior to wireline measurements.

PUSHINGBOUNDARIES
FORM 10-K
UNITED STATES SECURITIES AND EXCHANGE COMMISSION
Washington, D.C. 20549 FORM 10-K
(Mark One) [X] Annual Report Pursuant to Section 13 or 15(d) of the Securities Exchange Act of 1934
For the fiscal year ended December 31, 2009
OR
[ ] Transition Report Pursuant to Section 13 or 15(d) of the Securities Exchange Act of 1934 For the transition period from ______ to ______ Commission File Number 001-03492
HALLIBURTON COMPANY (Exact name of registrant as specified in its charter)
Delaware 75-2677995
(State or other jurisdiction of (I.R.S. Employer incorporation or organization) Identification No.)
3000 North Sam Houston Parkway East Houston, Texas 77032
(Address of principal executive offices) Telephone Number – Area code (281) 871-2699
Securities registered pursuant to Section 12(b) of the Act:
Name of each exchange on
Title of each class which registered Common Stock par value $2.50 per share New York Stock Exchange
Securities registered pursuant to Section 12(g) of the Act: None
Indicate by check mark if the registrant is a well-known seasoned issuer, as defined in Rule 405 of the Securities Act. Yes X No Indicate by check mark if the registrant is not required to file reports pursuant to Section 13 or Section 15(d) of the Act. Yes No X Indicate by check mark whether the registrant (1) has filed all reports required to be filed by Section 13 or 15(d) of the Securities Exchange Act of 1934 during the preceding 12 months (or for such shorter period that the registrant was required to file such reports), and (2) has been subject to such filing requirements for the past 90 days. Yes X No Indicate by check mark whether the registrant has submitted electronically and posted on its corporate Web site, if any, every Interactive Data File required to be submitted and posted pursuant to Rule 405 of Regulation S-T (§ 232.405 of this chapter) during the preceding 12 months (or for such shorter period that the registrant was required to submit and post such files). Yes X No Indicate by check mark if disclosure of delinquent filers pursuant to Item 405 of Regulation S-K (§229.405 of this chapter) is not contained herein, and will not be contained, to the best of registrant’s knowledge, in definitive proxy or information statements incorporated by reference in Part III of this Form 10-K or any amendment to this Form 10-K. [ X] Indicate by check mark whether the registrant is a large accelerated filer, an accelerated filer, a non-accelerated filer, or a smaller reporting company. See the definitions of “large accelerated filer,” “accelerated filer,” and “smaller reporting company” in Rule 12b-2 of the Exchange Act.:
Large accelerated filer [X] Accelerated filer [ ] Non-accelerated filer [ ] Smaller reporting company [ ]
Indicate by check mark whether the registrant is a shell company (as defined in Rule 12b-2 of the Exchange Act). Yes No X The aggregate market value of Common Stock held by nonaffiliates on June 30, 2009, determined using the per share closing price on the New York Stock Exchange Composite tape of $20.70 on that date was approximately $18,573,000,000. As of February 12, 2010, there were 905,090,232 shares of Halliburton Company Common Stock, $2.50 par value per share, outstanding. Portions of the Halliburton Company Proxy Statement for our 2010 Annual Meeting of Stockholders (File No. 001-03492) are incorporated by reference into Part III of this report.
HALLIBURTON COMPANY
Index to Form 10-K For the Year Ended December 31, 2009
PART I PAGE Item 1. Business 1 Item 1(a). Risk Factors 6 Item 1(b). Unresolved Staff Comments 6 Item 2. Properties 6 Item 3. Legal Proceedings 6 Item 4. Submission of Matters to a Vote of Security Holders 6 PART II Item 5. Market for Registrant’s Common Equity, Related Stockholder Matters, and Issuer Purchases of Equity Securities 7 Item 6. Selected Financial Data 8 Item 7. Management’s Discussion and Analysis of Financial Condition and Results of Operations 8 Item 7(a). Quantitative and Qualitative Disclosures About Market Risk 8 Item 8. Financial Statements and Supplementary Data 9 Item 9. Changes in and Disagreements with Accountants on Accounting and Financial Disclosure 9 Item 9(a). Controls and Procedures 9 Item 9(b). Other Information 9 MD&A AND FINANCIAL STATEMENTS Management’s Discussion and Analysis of Financial Condition and Results of Operations 10 Management’s Report on Internal Control Over Financial Reporting 46 Reports of Independent Registered Public Accounting Firm 47 Consolidated Statements of Operations 49 Consolidated Balance Sheets 50 Consolidated Statements of Shareholders’ Equity 51 Consolidated Statements of Cash Flows 52 Notes to Consolidated Financial Statements 53 Selected Financial Data (Unaudited) 86 Quarterly Data and Market Price Information (Unaudited) 87 PART III Item 10. Directors, Executive Officers, and Corporate Governance 88 Item 11. Executive Compensation 88 Item 12(a). Security Ownership of Certain Beneficial Owners 88 Item 12(b). Security Ownership of Management 88 Item 12(c). Changes in Control 89 Item 12(d). Securities Authorized for Issuance Under Equity Compensation Plans 89 Item 13. Certain Relationships and Related Transactions, and Director Independence 89 Item 14. Principal Accounting Fees and Services 89 PART IV Item 15. Exhibits 90 SIGNATURES 99
(i)
1
PART I Item 1. Business.
General description of business Halliburton Company’s predecessor was established in 1919 and incorporated under the laws of
the State of Delaware in 1924. We provide a variety of services and products to customers in the energy industry related to the exploration, development, and production of oil and natural gas. We serve major, national, and independent oil and natural gas companies throughout the world and operate under two divisions, which form the basis for the two operating segments we report: the Completion and Production segment and the Drilling and Evaluation segment. See Note 2 to the consolidated financial statements for further financial information related to each of our business segments and a description of the services and products provided by each segment.
Business strategy Our business strategy is to secure a distinct and sustainable competitive position as an oilfield
service company by delivering products and services to our customers that maximize their production and recovery and realize proven reserves from difficult environments. Our objectives are to: - create a balanced portfolio of products and services supported by global infrastructure
and anchored by technology innovation with a well-integrated digital strategy to further differentiate our company;
- reach a distinguished level of operational excellence that reduces costs and creates real value from everything we do;
- preserve a dynamic workforce by being a preferred employer to attract, develop, and retain the best global talent; and
- uphold the ethical and business standards of the company and maintain the highest standards of health, safety, and environmental performance.
Markets and competition We are one of the world’s largest diversified energy services companies. Our services and
products are sold in highly competitive markets throughout the world. Competitive factors impacting sales of our services and products include: - price; - service delivery (including the ability to deliver services and products on an “as needed,
where needed” basis); - health, safety, and environmental standards and practices; - service quality; - global talent retention; - understanding of the geological characteristics of the hydrocarbon reservoir; - product quality; - warranty; and - technical proficiency.
2
We conduct business worldwide in approximately 70 countries. The business operations of our divisions are organized around four primary geographic regions: North America, Latin America, Europe/Africa/CIS, and Middle East/Asia. In 2009, based on the location of services provided and products sold, 36% of our consolidated revenue was from the United States. In 2008 and 2007, 43% and 44% of our consolidated revenue was from the United States. No other country accounted for more than 10% of our consolidated revenue during these periods. See “Management’s Discussion and Analysis of Financial Condition and Results of Operations – Business Environment and Results of Operations” and Note 2 to the consolidated financial statements for additional financial information about geographic operations in the last three years. Because the markets for our services and products are vast and cross numerous geographic lines, a meaningful estimate of the total number of competitors cannot be made. The industries we serve are highly competitive, and we have many substantial competitors. Largely, all of our services and products are marketed through our servicing and sales organizations.
Operations in some countries may be adversely affected by unsettled political conditions, acts of terrorism, civil unrest, expropriation or other governmental actions, exchange control problems, and highly inflationary currencies. We believe the geographic diversification of our business activities reduces the risk that loss of operations in any one country would be material to the conduct of our operations taken as a whole.
Information regarding our exposure to foreign currency fluctuations, risk concentration, and financial instruments used to minimize risk is included in “Management’s Discussion and Analysis of Financial Condition and Results of Operations – Financial Instrument Market Risk” and in Note 12 to the consolidated financial statements.
Customers Our revenue from continuing operations during the past three years was derived from the sale of
services and products to the energy industry. No customer represented more than 10% of consolidated revenue in any period presented.
Raw materials Raw materials essential to our business are normally readily available. Market conditions can
trigger constraints in the supply of certain raw materials, such as sand, cement, and specialty metals. We are always seeking ways to ensure the availability of resources, as well as manage costs of raw materials. Our procurement department is using our size and buying power through several programs designed to ensure that we have access to key materials at competitive prices.
Research and development costs We maintain an active research and development program. The program improves existing
products and processes, develops new products and processes, and improves engineering standards and practices that serve the changing needs of our customers, such as those related to high pressure/high temperature environments. Our expenditures for research and development activities were $325 million in 2009, $326 million in 2008, and $301 million in 2007, of which over 96% was company-sponsored in each year.
Patents We own a large number of patents and have pending a substantial number of patent applications
covering various products and processes. We are also licensed to utilize patents owned by others. We do not consider any particular patent to be material to our business operations.
Seasonality Weather and natural phenomena can temporarily affect the performance of our services, but the
widespread geographical locations of our operations serve to mitigate those effects. Examples of how weather can impact our business include:
3
- the severity and duration of the winter in North America can have a significant impact on natural gas storage levels and drilling activity for natural gas;
- the timing and duration of the spring thaw in Canada directly affects activity levels due to road restrictions;
- typhoons and hurricanes can disrupt coastal and offshore operations; and - severe weather during the winter months normally results in reduced activity levels in the
North Sea and Russia. In addition, due to higher spending near the end of the year by customers for software and
completion tools and services, software and asset solutions and completion tools results of operations are generally stronger in the fourth quarter of the year than at the beginning of the year.
Employees At December 31, 2009, we employed approximately 51,000 people worldwide compared to
approximately 57,000 at December 31, 2008. At December 31, 2009, approximately 20% of our employees were subject to collective bargaining agreements. Based upon the geographic diversification of these employees, we believe any risk of loss from employee strikes or other collective actions would not be material to the conduct of our operations taken as a whole.
Environmental regulation We are subject to numerous environmental, legal, and regulatory requirements related to our
operations worldwide. For further information related to environmental matters and regulation, see Note 8 to the consolidated financial statements and “Management’s Discussion and Analysis of Financial Condition and Results of Operations—Risk Factors” under the subheadings “Customers and Business—Environmental requirements.”
Working capital We fund our business operations through a combination of available cash and equivalents, short-
term investments, and cash flow generated from operations. In addition, our revolving credit facility is available for additional working capital needs.
Web site access Our annual reports on Form 10-K, quarterly reports on Form 10-Q, current reports on Form 8-K,
and amendments to those reports filed or furnished pursuant to Section 13(a) or 15(d) of the Exchange Act of 1934 are made available free of charge on our internet web site at www.halliburton.com as soon as reasonably practicable after we have electronically filed the material with, or furnished it to, the Securities and Exchange Commission (SEC). The public may read and copy any materials we have filed with the SEC at the SEC’s Public Reference Room at 100 F Street, NE, Room 1580, Washington, DC 20549. Information on the operation of the Public Reference Room may be obtained by calling the SEC at 1-800-SEC-0330. The SEC maintains an internet site that contains our reports, proxy and information statements, and our other SEC filings. The address of that site is www.sec.gov. We have posted on our web site our Code of Business Conduct, which applies to all of our employees and Directors and serves as a code of ethics for our principal executive officer, principal financial officer, principal accounting officer, and other persons performing similar functions. Any amendments to our Code of Business Conduct or any waivers from provisions of our Code of Business Conduct granted to the specified officers above are disclosed on our web site within four business days after the date of any amendment or waiver pertaining to these officers. There have been no waivers from provisions of our Code of Business Conduct for the years 2009, 2008, or 2007.
4
Executive Officers of the Registrant
The following table indicates the names and ages of the executive officers of Halliburton Company as of February 12, 2010, including all offices and positions held by each in the past five years:
Name and Age Offices Held and Term of Office Evelyn M. Angelle Vice President, Corporate Controller, and Principal Accounting Officer of (Age 42) Halliburton Company, since January 2008 Vice President, Operations Finance of Halliburton Company, December 2007 to January 2008 Vice President, Investor Relations of Halliburton Company, April 2005 to November 2007 Assistant Controller of Halliburton Company, April 2003 to March 2005 James S. Brown President, Western Hemisphere of Halliburton Company, since January 2008 (Age 55) Senior Vice President, Western Hemisphere of Halliburton Company, June 2006 to December 2007 Senior Vice President, United States Region of Halliburton Company, December 2003 to June 2006 * Albert O. Cornelison, Jr. Executive Vice President and General Counsel of Halliburton Company, (Age 60) since December 2002 David S. King President, Completion and Production Division of Halliburton Company, (Age 53) since January 2008 Senior Vice President, Completion and Production Division of Halliburton Company, July 2007 to December 2007 Senior Vice President, Production Optimization of Halliburton Company, January 2007 to July 2007 Senior Vice President, Eastern Hemisphere of Halliburton Energy Services Group, July 2006 to December 2006 Senior Vice President, Global Operations of Halliburton Energy Services Group, July 2004 to July 2006 * David J. Lesar Chairman of the Board, President, and Chief Executive Officer of Halliburton (Age 56) Company, since August 2000
5
Name and Age Offices Held and Term of Office Ahmed H. M. Lotfy President, Eastern Hemisphere of Halliburton Company, since January 2008 (Age 55) Senior Vice President, Eastern Hemisphere of Halliburton Company, January 2007 to December 2007 Vice President, Africa Region of Halliburton Company, January 2005 to December 2006 * Mark A. McCollum Executive Vice President and Chief Financial Officer of Halliburton Company, (Age 50) since January 2008 Senior Vice President and Chief Accounting Officer of Halliburton Company, August 2003 to December 2007 Craig W. Nunez Senior Vice President and Treasurer of Halliburton Company, (Age 48) since January 2007 Vice President and Treasurer of Halliburton Company, February 2006 to January 2007 Treasurer of Colonial Pipeline Company, November 1999 to January 2006 * Lawrence J. Pope Executive Vice President of Administration and Chief Human Resources Officer (Age 41) of Halliburton Company, since January 2008 Vice President, Human Resources and Administration of Halliburton Company, January 2006 to December 2007 Senior Vice President, Administration of Kellogg Brown & Root, Inc., August 2004 to January 2006 * Timothy J. Probert President, Global Business Lines and Corporate Development of (Age 58) Halliburton Company, since January 2010 President, Drilling and Evaluation Division and Corporate Development of Halliburton Company, March 2009 to December 2009 Executive Vice President, Strategy and Corporate Development of Halliburton Company, January 2008 to March 2009 Senior Vice President, Drilling and Evaluation of Halliburton Company, July 2007 to December 2007 Senior Vice President, Drilling and Evaluation and Digital Solutions of Halliburton Company, May 2006 to July 2007 Vice President, Drilling and Formation Evaluation of Halliburton Company, January 2003 to May 2006 * Members of the Policy Committee of the registrant.
There are no family relationships between the executive officers of the registrant or between any director and any executive officer of the registrant.
6
Item 1(a). Risk Factors. Information related to risk factors is described in “Management’s Discussion and Analysis of
Financial Condition and Results of Operations—Forward-Looking Information and Risk Factors.” Item 1(b). Unresolved Staff Comments.
None.
Item 2. Properties. We own or lease numerous properties in domestic and foreign locations. The following locations
represent our major facilities and corporate offices.
Location Owned/Leased Description Completion and Production segment: Arbroath, United Kingdom Owned Manufacturing facility Johor, Malaysia Leased Manufacturing facility Monterrey, Mexico Leased Manufacturing facility Sao Jose dos Campos, Brazil Leased Manufacturing facility Stavanger, Norway Leased Research and development laboratory Drilling and Evaluation segment: Alvarado, Texas Owned/Leased Manufacturing facility Nisku, Canada Owned Manufacturing facility Singapore Leased Manufacturing and technology facility The Woodlands, Texas Leased Manufacturing facility Shared/corporate facilities: Carrollton, Texas Owned Manufacturing facility Dubai, United Arab Emirates Leased Corporate executive offices Duncan, Oklahoma Owned Manufacturing, technology, and campus facilities Houston, Texas Owned Corporate executive offices, manufacturing, technology, and campus facilities Houston, Texas Owned Campus facility Houston, Texas Leased Campus facility Pune, India Leased Technology facility
All of our owned properties are unencumbered. In addition, we have 133 international and 103 United States field camps from which we deliver
our services and products. We also have numerous small facilities that include sales offices, project offices, and bulk storage facilities throughout the world.
We believe all properties that we currently occupy are suitable for their intended use. Item 3. Legal Proceedings.
Information related to various commitments and contingencies is described in “Management’s Discussion and Analysis of Financial Condition and Results of Operations—Forward-Looking Information and Risk Factors” and in Note 8 to the consolidated financial statements.
Item 4. Submission of Matters to a Vote of Security Holders.
There were no matters submitted to a vote of security holders during the fourth quarter of 2009.
7
PART II Item 5. Market for Registrant’s Common Equity, Related Stockholder Matters, and Issuer Purchases of Equity Securities.
Halliburton Company’s common stock is traded on the New York Stock Exchange. Information related to the high and low market prices of common stock and quarterly dividend payments is included under the caption “Quarterly Data and Market Price Information” on page 87 of this annual report. Cash dividends on common stock in the amount of $0.09 per share were paid in March, June, September, and December of 2009 and 2008. Our Board of Directors intends to consider the payment of quarterly dividends on the outstanding shares of our common stock in the future. The declaration and payment of future dividends, however, will be at the discretion of the Board of Directors and will depend upon, among other things, future earnings, general financial condition and liquidity, success in business activities, capital requirements, and general business conditions.
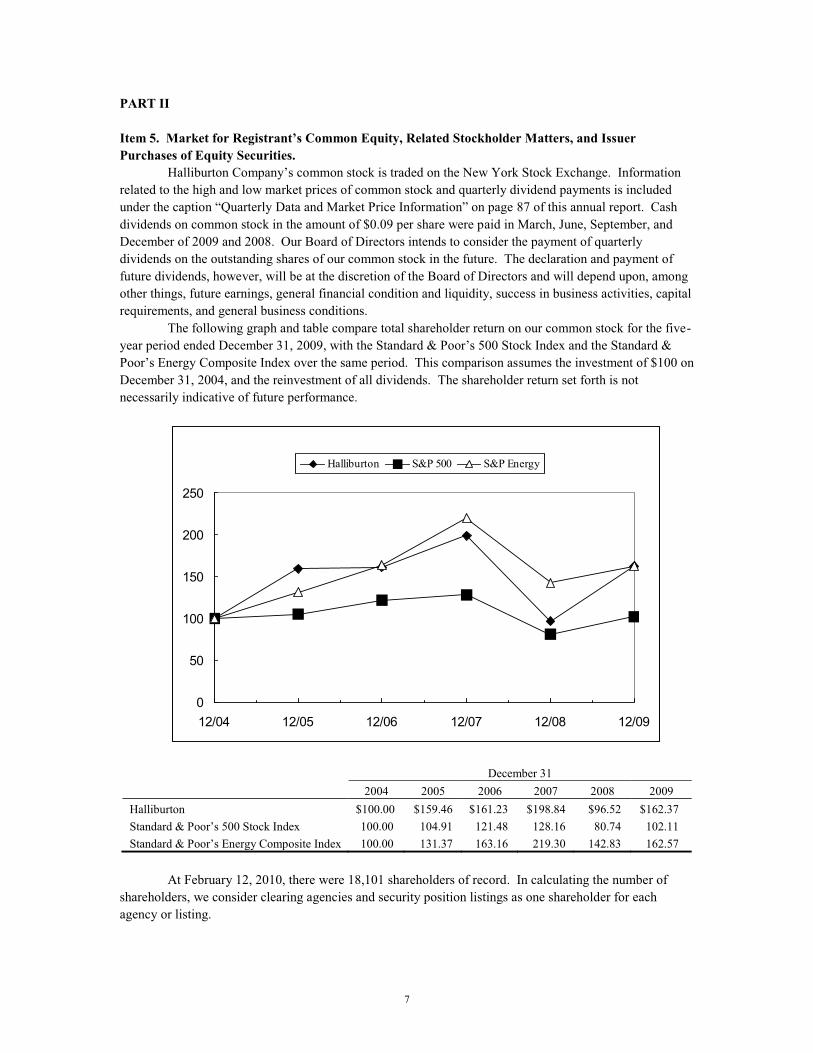
The following graph and table compare total shareholder return on our common stock for the five-year period ended December 31, 2009, with the Standard & Poor’s 500 Stock Index and the Standard & Poor’s Energy Composite Index over the same period. This comparison assumes the investment of $100 on December 31, 2004, and the reinvestment of all dividends. The shareholder return set forth is not necessarily indicative of future performance.
0
50
100
150
200
250
12/04 12/05 12/06 12/07 12/08 12/09
Halliburton S&P 500 S&P Energy
December 31 2004 2005 2006 2007 2008 2009 Halliburton $100.00 $159.46 $161.23 $198.84 $96.52 $162.37 Standard & Poor’s 500 Stock Index 100.00 104.91 121.48 128.16 80.74 102.11 Standard & Poor’s Energy Composite Index 100.00 131.37 163.16 219.30 142.83 162.57
At February 12, 2010, there were 18,101 shareholders of record. In calculating the number of shareholders, we consider clearing agencies and security position listings as one shareholder for each agency or listing.
8
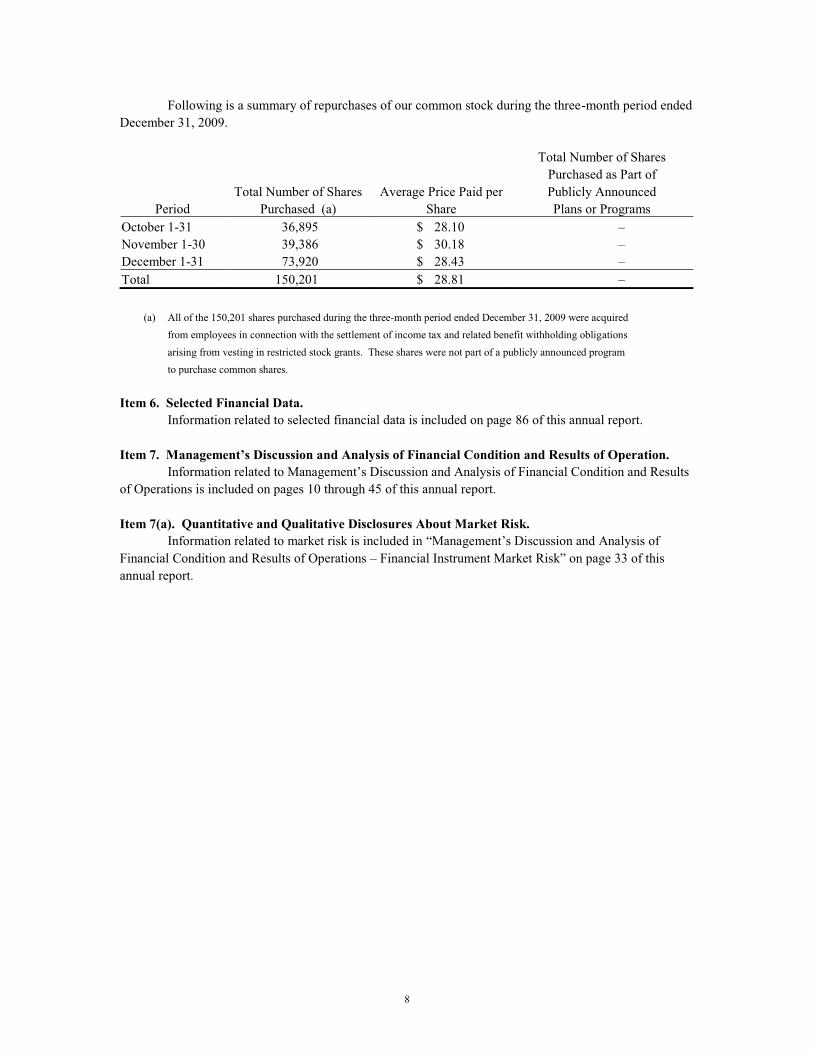
Following is a summary of repurchases of our common stock during the three-month period ended December 31, 2009.
Total Number of Shares Purchased as Part of Total Number of Shares Average Price Paid per Publicly Announced
Period Purchased (a) Share Plans or Programs October 1-31 36,895 $ 28.10 – November 1-30 39,386 $ 30.18 – December 1-31 73,920 $ 28.43 – Total 150,201 $ 28.81 –
(a) All of the 150,201 shares purchased during the three-month period ended December 31, 2009 were acquired
from employees in connection with the settlement of income tax and related benefit withholding obligations arising from vesting in restricted stock grants. These shares were not part of a publicly announced program to purchase common shares.
Item 6. Selected Financial Data.
Information related to selected financial data is included on page 86 of this annual report.
Item 7. Management’s Discussion and Analysis of Financial Condition and Results of Operation. Information related to Management’s Discussion and Analysis of Financial Condition and Results
of Operations is included on pages 10 through 45 of this annual report.
Item 7(a). Quantitative and Qualitative Disclosures About Market Risk. Information related to market risk is included in “Management’s Discussion and Analysis of
Financial Condition and Results of Operations – Financial Instrument Market Risk” on page 33 of this annual report.
9
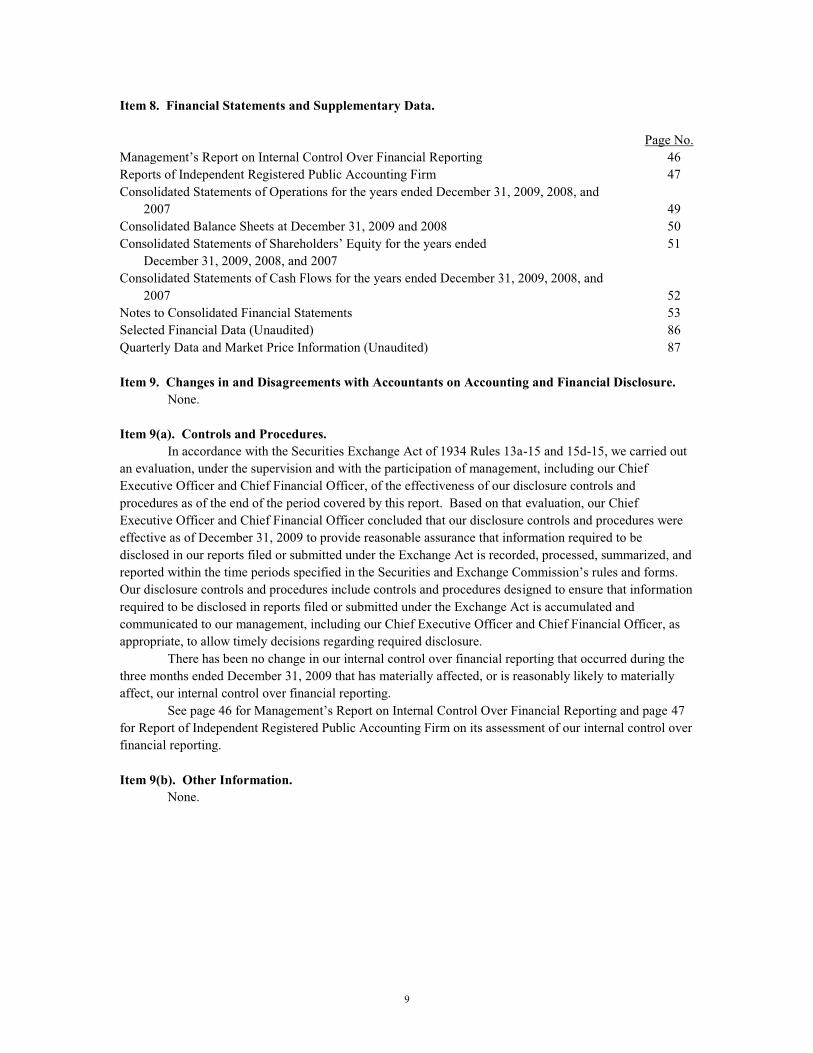
Item 8. Financial Statements and Supplementary Data. Page No. Management’s Report on Internal Control Over Financial Reporting 46 Reports of Independent Registered Public Accounting Firm 47 Consolidated Statements of Operations for the years ended December 31, 2009, 2008, and 2007 49 Consolidated Balance Sheets at December 31, 2009 and 2008 50 Consolidated Statements of Shareholders’ Equity for the years ended 51 December 31, 2009, 2008, and 2007 Consolidated Statements of Cash Flows for the years ended December 31, 2009, 2008, and 2007 52 Notes to Consolidated Financial Statements 53 Selected Financial Data (Unaudited) 86 Quarterly Data and Market Price Information (Unaudited) 87 Item 9. Changes in and Disagreements with Accountants on Accounting and Financial Disclosure.
None. Item 9(a). Controls and Procedures.
In accordance with the Securities Exchange Act of 1934 Rules 13a-15 and 15d-15, we carried out an evaluation, under the supervision and with the participation of management, including our Chief Executive Officer and Chief Financial Officer, of the effectiveness of our disclosure controls and procedures as of the end of the period covered by this report. Based on that evaluation, our Chief Executive Officer and Chief Financial Officer concluded that our disclosure controls and procedures were effective as of December 31, 2009 to provide reasonable assurance that information required to be disclosed in our reports filed or submitted under the Exchange Act is recorded, processed, summarized, and reported within the time periods specified in the Securities and Exchange Commission’s rules and forms. Our disclosure controls and procedures include controls and procedures designed to ensure that information required to be disclosed in reports filed or submitted under the Exchange Act is accumulated and communicated to our management, including our Chief Executive Officer and Chief Financial Officer, as appropriate, to allow timely decisions regarding required disclosure.
There has been no change in our internal control over financial reporting that occurred during the three months ended December 31, 2009 that has materially affected, or is reasonably likely to materially affect, our internal control over financial reporting.
See page 46 for Management’s Report on Internal Control Over Financial Reporting and page 47 for Report of Independent Registered Public Accounting Firm on its assessment of our internal control over financial reporting.
Item 9(b). Other Information.
None.
10
HALLIBURTON COMPANY Management’s Discussion and Analysis of Financial Condition and Results of Operations
EXECUTIVE OVERVIEW
Organization We are a leading provider of products and services to the energy industry. We serve the upstream
oil and natural gas industry throughout the lifecycle of the reservoir, from locating hydrocarbons and managing geological data, to drilling and formation evaluation, well construction and completion, and optimizing production through the life of the field. Activity levels within our operations are significantly impacted by spending on upstream exploration, development, and production programs by major, national, and independent oil and natural gas companies. We report our results under two segments, Completion and Production and Drilling and Evaluation:
- our Completion and Production segment delivers cementing, stimulation, intervention, and completion services. The segment consists of production enhancement services, completion tools and services, and cementing services; and
- our Drilling and Evaluation segment provides field and reservoir modeling, drilling, evaluation, and precise wellbore placement solutions that enable customers to model, measure, and optimize their well construction activities. The segment consists of fluid services, drilling services, drill bits, wireline and perforating services, testing and subsea, software and asset solutions, and integrated project management services.
The business operations of our segments are organized around four primary geographic regions: North America, Latin America, Europe/Africa/CIS, and Middle East/Asia. We have significant manufacturing operations in various locations, including, but not limited to, the United States, Canada, the United Kingdom, Malaysia, Mexico, Brazil, and Singapore. With approximately 51,000 employees, we operate in approximately 70 countries around the world, and our corporate headquarters are in Houston, Texas and Dubai, United Arab Emirates.
Financial results During 2009, we produced revenue of $14.7 billion and operating income of $2 billion, reflecting
an operating margin of 14%. Revenue decreased $3.6 billion or 20% from 2008, while operating income decreased $2 billion or 50% from 2008. These decreases were caused by a significant decline in our customers’ capital spending as a result of the global recession and its impact on commodity prices, which resulted in lower activity, lower pricing, and severe margin contraction.
Business outlook We continue to believe in the strength of the long-term fundamentals of our business. However,
due to the financial crisis that developed in mid-2008, the ensuing negative impact on credit availability and industry activity, and the current excess supply of oil and natural gas, the near-term outlook for our business and the industry remains uncertain. Forecasting the depth and length of the current cycle is challenging as it is different from past cycles due to the overlay of the financial crisis in combination with broad demand weakness.
In North America, the industry experienced an unprecedented decline in drilling activity during 2009 as rig counts declined approximately 43% from 2008 highs. This decline, coupled with natural gas storage levels reaching record levels, resulted in severe margin contraction in 2009. During the fourth quarter of 2009, we saw some rebound in rig activity as conditions began to improve with positive seasonal withdrawals from natural gas storage. With the trend toward increasing levels of service intensity, our equipment utilization is improving, and prices are stabilizing across many areas. However, this rebound will require a sustained increase in natural gas drilling activity. In order for this to occur, we believe it will be important that North America exits the winter heating season with storage levels in line with historical averages and there is increased recovery in industrial demand.
11
Outside of North America, 2009 rig count declined approximately 8% from 2008 highs. Margins declined throughout 2009, and we have not yet felt the full impact of pricing concessions that were renegotiated during last year’s contract retendering process. As such, we believe margins will continue to be under pressure in 2010. We also believe that 2010 may be a period of transition for this market. Oil supply/demand fundamentals are showing some improvement as weak hydrocarbon demand shows signs of recovery, but the timing of reinvestment remains uneven across geographies and customers. Operators remain flexible in their spending patterns and continue to be heavily focused on restraining oilfield price and cost inflation. Our operating performance and business outlook are described in more detail in “Business Environment and Results of Operations.” Financial markets, liquidity, and capital resources
Since mid-2008, the global financial markets have been volatile. While this has created additional risks for our business, we believe we have invested our cash balances conservatively and secured sufficient financing to help mitigate any near-term negative impact on our operations. To provide additional liquidity and flexibility in the current environment, we issued $2 billion in senior notes during the first quarter of 2009 and invested $1.5 billion in United States Treasury securities during the second quarter of 2009. For additional information, see “Liquidity and Capital Resources,” “Risk Factors,” “Business Environment and Results of Operations,” and Notes 6 and 12 to the consolidated financial statements. LIQUIDITY AND CAPITAL RESOURCES
We ended 2009 with cash and equivalents of $2.1 billion compared to $1.1 billion at December 31, 2008. We also held $1.3 billion of short-term, United States Treasury securities at December 31, 2009.
Significant sources of cash Cash flows from operating activities contributed $2.4 billion to cash in 2009. Our focus on
managing working capital levels during the year helped to offset the significant reduction in income during 2009.
In March 2009, we issued $1 billion of 6.15% senior notes due 2019 and $1 billion of 7.45% senior notes due 2039.
In 2009, we sold approximately $300 million of United States Treasury securities. We received payments of $90 million for our asbestos-related insurance settlements during 2009. Further available sources of cash. We have an unsecured $1.2 billion, five-year revolving credit
facility to provide commercial paper support, general working capital, and credit for other corporate purposes. There were no cash drawings under the facility as of December 31, 2009. In addition, we have $1.3 billion in United States Treasury securities that will be maturing at various dates through September 2010.
Significant uses of cash Capital expenditures were $1.9 billion in 2009 and were predominantly made in the production
enhancement, drilling services, wireline and perforating, and cementing product service lines. During 2009, we purchased approximately $1.6 billion in United States Treasury securities, with
varying maturity dates. We paid $417 million to the Department of Justice (DOJ) and Securities and Exchange
Commission (SEC) in 2009 related to the settlements with them and under the indemnity provided to KBR, Inc. (KBR) upon separation.
We paid $324 million in dividends to our shareholders in 2009. We contributed $99 million to fund our defined benefit plans in 2009.
12
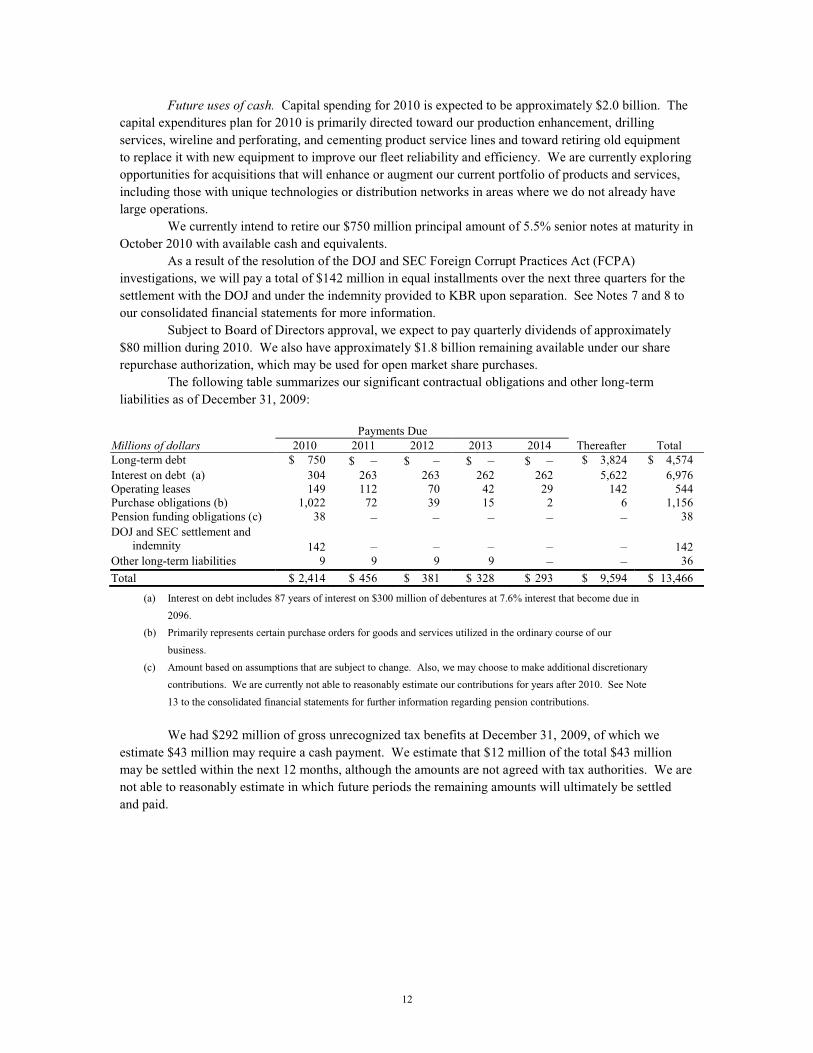
Future uses of cash. Capital spending for 2010 is expected to be approximately $2.0 billion. The capital expenditures plan for 2010 is primarily directed toward our production enhancement, drilling services, wireline and perforating, and cementing product service lines and toward retiring old equipment to replace it with new equipment to improve our fleet reliability and efficiency. We are currently exploring opportunities for acquisitions that will enhance or augment our current portfolio of products and services, including those with unique technologies or distribution networks in areas where we do not already have large operations.
We currently intend to retire our $750 million principal amount of 5.5% senior notes at maturity in October 2010 with available cash and equivalents.
As a result of the resolution of the DOJ and SEC Foreign Corrupt Practices Act (FCPA) investigations, we will pay a total of $142 million in equal installments over the next three quarters for the settlement with the DOJ and under the indemnity provided to KBR upon separation. See Notes 7 and 8 to our consolidated financial statements for more information.
Subject to Board of Directors approval, we expect to pay quarterly dividends of approximately $80 million during 2010. We also have approximately $1.8 billion remaining available under our share repurchase authorization, which may be used for open market share purchases.
The following table summarizes our significant contractual obligations and other long-term liabilities as of December 31, 2009:
Payments Due
Millions of dollars 2010 2011 2012 2013 2014 Thereafter Total Long-term debt $ 750 $ – $ – $ – $ – $ 3,824 $ 4,574 Interest on debt (a) 304 263 263 262 262 5,622 6,976 Operating leases 149 112 70 42 29 142 544 Purchase obligations (b) 1,022 72 39 15 2 6 1,156 Pension funding obligations (c) 38 – – – – – 38 DOJ and SEC settlement and indemnity 142 – – – – – 142 Other long-term liabilities 9 9 9 9 – – 36 Total $ 2,414 $ 456 $ 381 $ 328 $ 293 $ 9,594 $ 13,466
(a) Interest on debt includes 87 years of interest on $300 million of debentures at 7.6% interest that become due in 2096.
(b) Primarily represents certain purchase orders for goods and services utilized in the ordinary course of our business.
(c) Amount based on assumptions that are subject to change. Also, we may choose to make additional discretionary contributions. We are currently not able to reasonably estimate our contributions for years after 2010. See Note 13 to the consolidated financial statements for further information regarding pension contributions. We had $292 million of gross unrecognized tax benefits at December 31, 2009, of which we
estimate $43 million may require a cash payment. We estimate that $12 million of the total $43 million may be settled within the next 12 months, although the amounts are not agreed with tax authorities. We are not able to reasonably estimate in which future periods the remaining amounts will ultimately be settled and paid.
13
Other factors affecting liquidity Letters of credit. In the normal course of business, we have agreements with financial institutions
under which approximately $1.8 billion of letters of credit, bank guarantees, or surety bonds were outstanding as of December 31, 2009, including $380 million of surety bonds related to Venezuela. In addition, $390 million of the total $1.8 billion relates to KBR letters of credit, bank guarantees, or surety bonds that are being guaranteed by us in favor of KBR’s customers and lenders. KBR has agreed to compensate us for these guarantees and indemnify us if we are required to perform under any of these guarantees. Some of the outstanding letters of credit have triggering events that would entitle a bank to require cash collateralization.
Financial position in current market. Our $2.1 billion of cash and equivalents and $1.3 billion in investments in marketable securities as of December 31, 2009 provide sufficient liquidity and flexibility, given the current market environment. Our debt maturities extend over a long period of time. We currently have a total of $1.2 billion of committed bank credit under our revolving credit facility to support our operations and any commercial paper we may issue in the future. We have no financial covenants or material adverse change provisions in our bank agreements. Currently, there are no borrowings under the revolving credit facility. Although a portion of earnings from our foreign subsidiaries is reinvested overseas indefinitely, we do not consider this to have a significant impact on our liquidity.
In addition, we manage our cash investments by investing principally in United States Treasury securities and repurchase agreements collateralized by United States Treasury securities.
Credit ratings. Credit ratings for our long-term debt remain A2 with Moody’s Investors Service and A with Standard & Poor’s. The credit ratings on our short-term debt remain P-1 with Moody’s Investors Service and A-1 with Standard & Poor’s.
Customer receivables. In line with industry practice, we bill our customers for our services in arrears and are, therefore, subject to our customers delaying or failing to pay our invoices. In weak economic environments, we may experience increased delays and failures due to, among other reasons, a reduction in our customer’s cash flow from operations and their access to the credit markets. For example, we have seen a delay in receiving payment on our receivables from one of our primary customers in Venezuela. However, during the fourth quarter of 2009, we reached a settlement with this customer and received payment on approximately one-third of our outstanding receivables. If our customers delay in paying or fail to pay us a significant amount of our outstanding receivables, it could have a material adverse effect on our liquidity, consolidated results of operations, and consolidated financial condition.
14
BUSINESS ENVIRONMENT AND RESULTS OF OPERATIONS We operate in approximately 70 countries throughout the world to provide a comprehensive range
of discrete and integrated services and products to the energy industry. The majority of our consolidated revenue is derived from the sale of services and products to major, national, and independent oil and natural gas companies worldwide. We serve the upstream oil and natural gas industry throughout the lifecycle of the reservoir, from locating hydrocarbons and managing geological data, to drilling and formation evaluation, well construction and completion, and optimizing production throughout the life of the field. Our two business segments are the Completion and Production segment and the Drilling and Evaluation segment. The industries we serve are highly competitive with many substantial competitors in each segment. In 2009, based upon the location of the services provided and products sold, 36% of our consolidated revenue was from the United States. In 2008, 43% of our consolidated revenue was from the United States. No other country accounted for more than 10% of our revenue during these periods.
Operations in some countries may be adversely affected by unsettled political conditions, acts of terrorism, civil unrest, force majeure, war or other armed conflict, expropriation or other governmental actions, inflation, exchange control problems, and highly inflationary currencies. We believe the geographic diversification of our business activities reduces the risk that loss of operations in any one country would be materially adverse to our consolidated results of operations.
Activity levels within our business segments are significantly impacted by spending on upstream exploration, development, and production programs by major, national, and independent oil and natural gas companies. Also impacting our activity is the status of the global economy, which impacts oil and natural gas consumption. See “Risk Factors—Worldwide recession and effect on exploration and production activity” for further information related to the effect of the current recession.
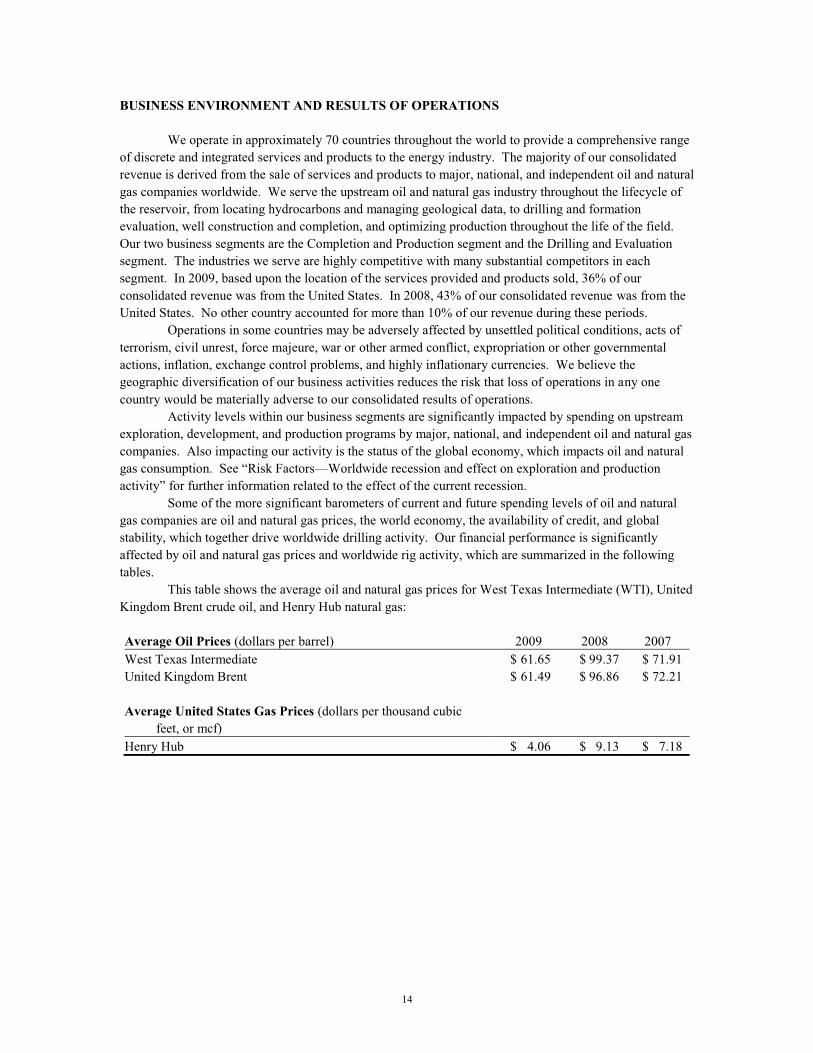
Some of the more significant barometers of current and future spending levels of oil and natural gas companies are oil and natural gas prices, the world economy, the availability of credit, and global stability, which together drive worldwide drilling activity. Our financial performance is significantly affected by oil and natural gas prices and worldwide rig activity, which are summarized in the following tables.
This table shows the average oil and natural gas prices for West Texas Intermediate (WTI), United Kingdom Brent crude oil, and Henry Hub natural gas: Average Oil Prices (dollars per barrel) 2009 2008 2007 West Texas Intermediate $ 61.65 $ 99.37 $ 71.91 United Kingdom Brent $ 61.49 $ 96.86 $ 72.21 Average United States Gas Prices (dollars per thousand cubic feet, or mcf) Henry Hub $ 4.06 $ 9.13 $ 7.18
15
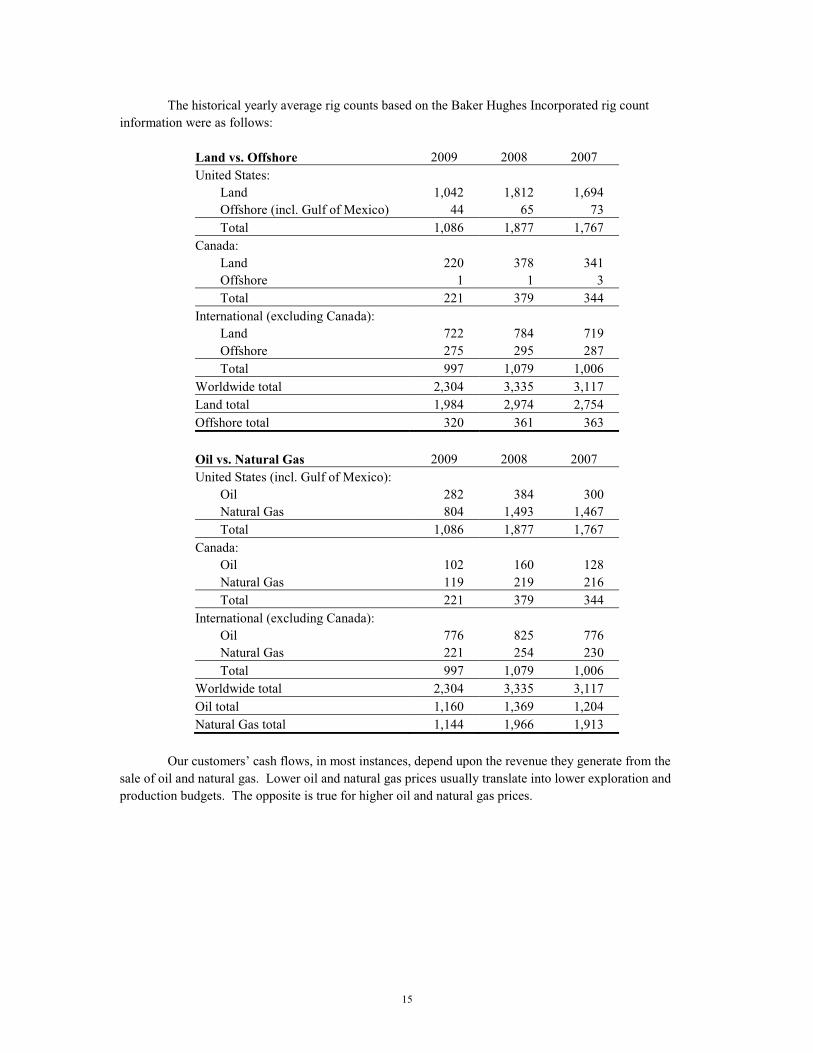
The historical yearly average rig counts based on the Baker Hughes Incorporated rig count information were as follows:
Land vs. Offshore 2009 2008 2007 United States: Land 1,042 1,812 1,694 Offshore (incl. Gulf of Mexico) 44 65 73 Total 1,086 1,877 1,767 Canada: Land 220 378 341 Offshore 1 1 3 Total 221 379 344 International (excluding Canada): Land 722 784 719 Offshore 275 295 287 Total 997 1,079 1,006 Worldwide total 2,304 3,335 3,117 Land total 1,984 2,974 2,754 Offshore total 320 361 363 Oil vs. Natural Gas 2009 2008 2007 United States (incl. Gulf of Mexico): Oil 282 384 300 Natural Gas 804 1,493 1,467 Total 1,086 1,877 1,767 Canada: Oil 102 160 128 Natural Gas 119 219 216 Total 221 379 344 International (excluding Canada): Oil 776 825 776 Natural Gas 221 254 230 Total 997 1,079 1,006 Worldwide total 2,304 3,335 3,117 Oil total 1,160 1,369 1,204 Natural Gas total 1,144 1,966 1,913
Our customers’ cash flows, in most instances, depend upon the revenue they generate from the
sale of oil and natural gas. Lower oil and natural gas prices usually translate into lower exploration and production budgets. The opposite is true for higher oil and natural gas prices.
16
WTI oil spot prices fell from a high of approximately $145 per barrel in July 2008 to a low of approximately $30 per barrel in December 2008. Since then prices have rebounded. As noted above, during 2009, the WTI spot price averaged $61.65 per barrel. As of February 12, 2010 the WTI oil spot price was $74.13 per barrel. According to the International Energy Agency’s (IEA) February 2010 “Oil Market Report,” 2010 world petroleum demand is forecasted to increase 2% over 2009 levels. Despite the overall decline in oil and natural gas prices from 2008 levels and reduction in our customers’ capital spending, we believe that, over the long term, any major macroeconomic disruptions may ultimately correct themselves as the underlying trends of smaller and more complex reservoirs, high depletion rates, and the need for continual reserve replacement should drive the long-term need for our services.
North America operations Volatility in natural gas prices can impact our customers' drilling and production activities,
particularly in North America. In 2009, we experienced an unprecedented decline in drilling activity as rig count dropped approximately 43% from 2008 highs. Correlating with this decline, the Henry Hub spot price decreased from an average of $9.13 per mcf in 2008 to $4.06 per mcf in 2009. As of February 12, 2010, the Henry Hub spot price was $5.65 per mcf. Weak domestic natural gas demand, coupled with the productivity of new shale resources, led to natural gas storage reaching record levels in 2009 and severe margin compression. We saw some rebound in rig activity toward the end of 2009 as conditions began to improve with seasonal withdrawals from natural gas storage. With the trend toward increasing levels of service intensity, our equipment utilization is improving, and prices are stabilizing across many areas. However, this rebound will require a sustained increase in natural gas drilling activity. For activity levels to improve, we believe it will be important that North America exits the winter heating season with storage levels in line with historical averages and there is increased recovery in industrial demand.
International operations Consistent with our long-term strategy to grow our operations outside of North America, we
expect to continue to invest capital in our international operations. During 2009, international energy services activity declined as well, but not to the extent the North American market fell. As of December 31, 2009, the international rig count had declined approximately 8% from 2008 highs. International margins declined throughout 2009, and we have not yet felt the full impact of pricing concessions that were renegotiated during last year’s contract retendering process. As such, we believe margins will continue to be under pressure in 2010. We also believe that 2010 may be a period of transition for this market. Oil supply/demand fundamentals are showing some improvement as weak global hydrocarbon demand shows signs of recovery, but the timing of reinvestment remains uneven across geographies and customers. Operators are remaining flexible in their spending patterns and continue to be heavily focused on restraining oilfield price and cost inflation.
Venezuela. In January 2010, the Venezuelan government announced a devaluation of the Bolívar Fuerte under a new two-exchange rate system; one rate for essential products and the other rate for non-essential products. As a result of the devaluation, we are estimating a loss of approximately $30 million in the first quarter of 2010 based on our current understanding of how the new two-exchange rate system will work for oil services activity. Our estimate utilizes a 4.3 Bolívar Fuerte to United States dollar exchange rate.

17
Initiatives and recent contract awards Following is a brief discussion of some of our recent and current initiatives:
leveraging our technologies to deploy our packaged-services strategy to provide our customers with the ability to more efficiently drill and complete their wells, especially in service-intensive environments such as deepwater and shale plays;
- retaining key investments in technology and capital to accelerate growth opportunities; - increasing our market share in unconventional and deepwater markets by enhancing our
technological position and leveraging our technical expertise and wide portfolio of products and services;
- lowering our input costs from vendors by negotiating price reductions for both materials used in our operations and those utilized in the manufacturing of capital equipment;
- negotiating with our customers to trade an expansion of scope and a lengthening of contract duration for price concessions;
- optimizing headcount in locations experiencing significant changes in activity; - improving working capital, operating within our cash flow, and managing our balance
sheet to maximize our financial flexibility; - continuing the globalization of our manufacturing and supply chain processes,
preserving work at our lower-cost manufacturing centers, and utilizing our international infrastructure to lower costs from our supply chain through delivery;
- expanding our business with national oil companies; and - minimizing discretionary spending.
Contract wins positioning us to grow our operations over the long term include: - a five-year integrated turnkey drilling contract, with an option for an additional five-year
period, which includes drilling and completion activities in South Ghawar, Saudi Arabia; - a three-year, $122 million contract, to provide drilling and completion fluid solutions in
Indonesia; - a three-year technical cooperation agreement by Brazil’s state energy company for
research and development in Brazil’s subsalt areas; - a two-year, $229 million contract with multiple extension options, to provide drilling
fluids and associated services in Norway; - a three-year contract renewal for continued access to a broad suite of software
technology and petro-technical consulting services for the development, deployment, and ongoing global support of exploration and production technology and workflows;
- a five-year, $1.5 billion contract to provide a broad base of products and services to an international oil company for its work associated with North America;
- several wins totaling $1 billion, including $700 million to provide deepwater drilling fluid services in the Gulf of Mexico, Brazil, Indonesia, Angola, and other countries, which solidifies our position in the deepwater drilling fluids market and $300 million for shelf- and land-related work; and
- a two-year contract extension, estimated to be valued at $450 million, to provide cementing services and completion and drilling fluids for StatoilHydro in offshore fields on the Norwegian continental shelf.
18
- a five-year, $190 million contract to provide drilling fluid, completion fluid, and drilling
waste management services for Petrobras in the offshore markets of Brazil - a five-year, $100 million contract to provide directional-drilling and logging-while-
drilling services in the Middle East - a contract award in Algeria to provide integrated project management services for a
number of delineation wells initially with the potential to expand to 120 wells for full field development
- a four-year contract to provide directional-drilling, measurement-while-drilling, and logging-while-drilling, along with drilling fluids and cementing services in Russia; and
- a multi-year contract scheduled to commence in 2010 to provide completion products and services and drilling and completion fluids in the deepwater, offshore fields of Angola.
19
RESULTS OF OPERATIONS IN 2009 COMPARED TO 2008
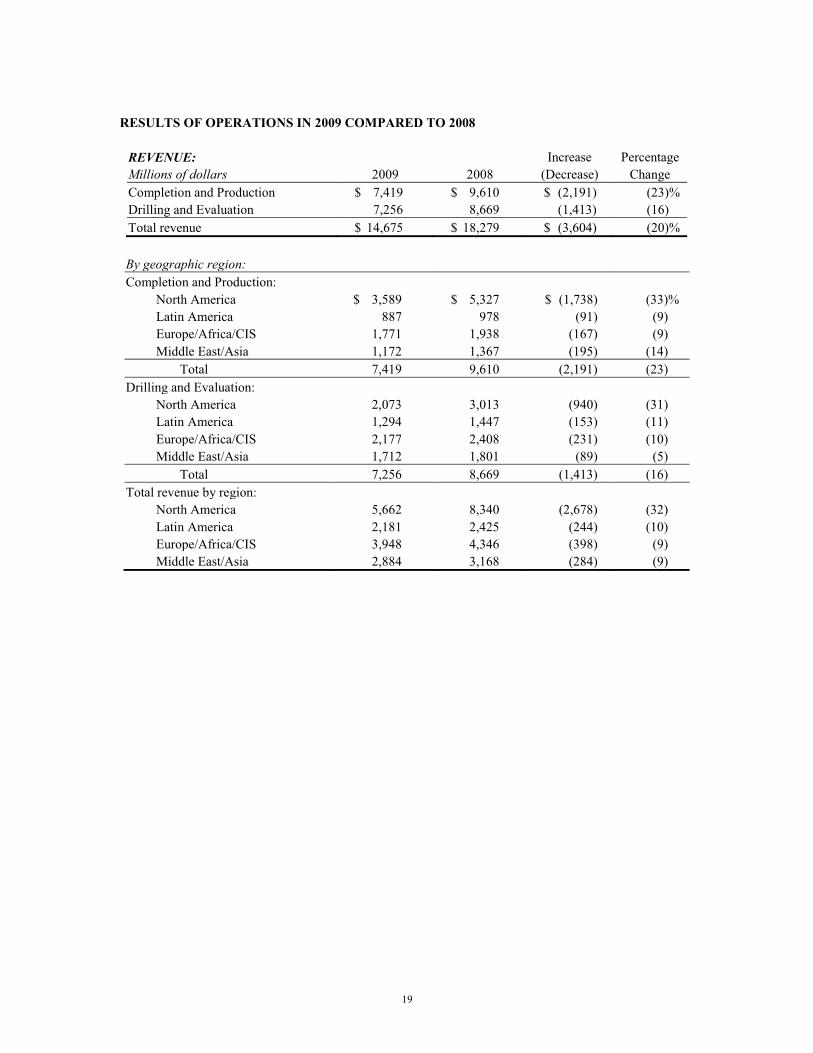
REVENUE: Increase Percentage Millions of dollars 2009 2008 (Decrease) Change Completion and Production $ 7,419 $ 9,610 $ (2,191) (23)% Drilling and Evaluation 7,256 8,669 (1,413) (16) Total revenue $ 14,675 $ 18,279 $ (3,604) (20)%
By geographic region: Completion and Production: North America $ 3,589 $ 5,327 $ (1,738) (33)% Latin America 887 978 (91) (9) Europe/Africa/CIS 1,771 1,938 (167) (9) Middle East/Asia 1,172 1,367 (195) (14) Total 7,419 9,610 (2,191) (23) Drilling and Evaluation: North America 2,073 3,013 (940) (31) Latin America 1,294 1,447 (153) (11) Europe/Africa/CIS 2,177 2,408 (231) (10) Middle East/Asia 1,712 1,801 (89) (5) Total 7,256 8,669 (1,413) (16) Total revenue by region: North America 5,662 8,340 (2,678) (32) Latin America 2,181 2,425 (244) (10) Europe/Africa/CIS 3,948 4,346 (398) (9) Middle East/Asia 2,884 3,168 (284) (9)
20
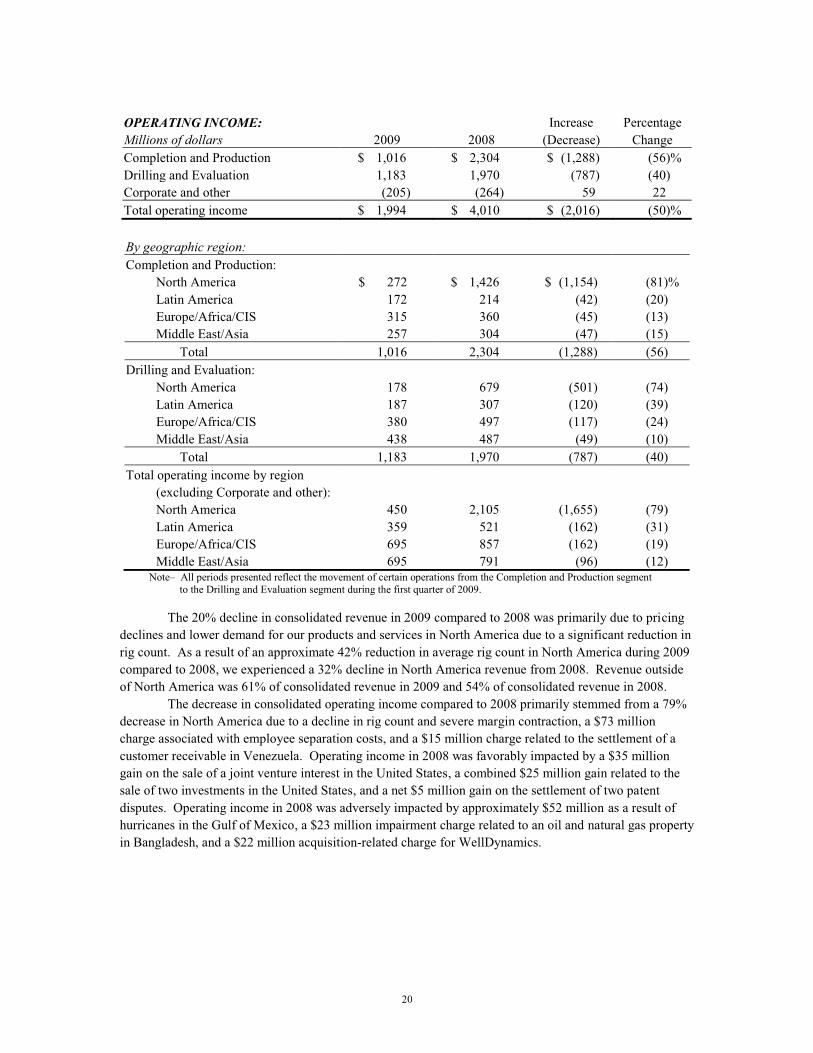
OPERATING INCOME: Increase Percentage Millions of dollars 2009 2008 (Decrease) Change Completion and Production $ 1,016 $ 2,304 $ (1,288) (56)% Drilling and Evaluation 1,183 1,970 (787) (40) Corporate and other (205) (264) 59 22 Total operating income $ 1,994 $ 4,010 $ (2,016) (50)%
By geographic region: Completion and Production: North America $ 272 $ 1,426 $ (1,154) (81)% Latin America 172 214 (42) (20) Europe/Africa/CIS 315 360 (45) (13) Middle East/Asia 257 304 (47) (15) Total 1,016 2,304 (1,288) (56) Drilling and Evaluation: North America 178 679 (501) (74) Latin America 187 307 (120) (39) Europe/Africa/CIS 380 497 (117) (24) Middle East/Asia 438 487 (49) (10) Total 1,183 1,970 (787) (40) Total operating income by region (excluding Corporate and other): North America 450 2,105 (1,655) (79) Latin America 359 521 (162) (31) Europe/Africa/CIS 695 857 (162) (19) Middle East/Asia 695 791 (96) (12)
Note– All periods presented reflect the movement of certain operations from the Completion and Production segment to the Drilling and Evaluation segment during the first quarter of 2009.
The 20% decline in consolidated revenue in 2009 compared to 2008 was primarily due to pricing
declines and lower demand for our products and services in North America due to a significant reduction in rig count. As a result of an approximate 42% reduction in average rig count in North America during 2009 compared to 2008, we experienced a 32% decline in North America revenue from 2008. Revenue outside of North America was 61% of consolidated revenue in 2009 and 54% of consolidated revenue in 2008.
The decrease in consolidated operating income compared to 2008 primarily stemmed from a 79% decrease in North America due to a decline in rig count and severe margin contraction, a $73 million charge associated with employee separation costs, and a $15 million charge related to the settlement of a customer receivable in Venezuela. Operating income in 2008 was favorably impacted by a $35 million gain on the sale of a joint venture interest in the United States, a combined $25 million gain related to the sale of two investments in the United States, and a net $5 million gain on the settlement of two patent disputes. Operating income in 2008 was adversely impacted by approximately $52 million as a result of hurricanes in the Gulf of Mexico, a $23 million impairment charge related to an oil and natural gas property in Bangladesh, and a $22 million acquisition-related charge for WellDynamics.
21
Following is a discussion of our results of operations by reportable segment. Completion and Production decrease in revenue compared to 2008 was primarily a result of
overall pricing declines and lower demand for our products and services in North America. More specifically, North America revenue fell 33% as a result of pricing declines and a drop in demand for production enhancement services and cementing services. Latin America revenue decreased 9% as increased activity for all product service lines in Mexico and Colombia was outweighed by lower activity across all product service lines in Venezuela and Argentina. Europe/Africa/CIS revenue decreased 9% on lower demand for completion tools and services in Africa. In addition, production enhancement services in Europe were negatively impacted by job delays in the North Sea. Middle East/Asia revenue fell 14% due to job delays and a decrease in demand for all products and services in the Middle East. Revenue outside of North America was 52% of total segment revenue in 2009 and 45% of total segment revenue in 2008.
The Completion and Production segment operating income decrease compared to 2008 was primarily due to the North America region, where operating income fell 81% largely due to pricing declines and significant reductions in rig count resulting in lower demand for our products and services. Results in 2009 were adversely impacted by $34 million in employee separation costs. In 2008, North America was negatively impacted by approximately $25 million due to Gulf of Mexico hurricanes but benefited from a $35 million gain on the sale of a joint venture interest. Latin America operating income decreased 20% driven by lower activity across all product service lines in Venezuela and Argentina. Europe/Africa/CIS operating income decreased 13% as improved cost management and higher demand for cementing services across the region were outweighed by job delays and lower demand for completion tools and services in Africa and production enhancement services in the North Sea and Angola. Middle East/Asia operating income decreased 15% primarily due to lower completion tools sales in Saudi Arabia and lower demand for production enhancement services in Oman and Malaysia.
Drilling and Evaluation revenue decrease compared to 2008 was primarily a result of pricing declines and decreased demand for our products and services stemming from a reduction in rig count in North America, where revenue fell 31%. Latin America revenue fell 11% as increased drilling activity in Brazil was outweighed by lower demand for all product service lines in Venezuela, Argentina, and Colombia. Europe/Africa/CIS revenue decreased 10% as increases in software sales and consulting services in Algeria were offset by decreased demand for drilling fluids services in Nigeria and Angola and drilling services in Europe. Pricing pressure also had a significant impact on revenue in Europe and Russia. Middle East/Asia revenue decreased 5% as increased demand for drilling fluid services and testing and subsea services in Asia Pacific were outweighed by lower drilling activity in the Middle East and declines in software sales and consulting services and wireline and perforating services in Asia Pacific. Revenue outside of North America was 71% of total segment revenue in 2009 and 65% of total segment revenue in 2008.
22
The decrease in segment operating income compared to 2008 was primarily due to a 74% decrease in North America operating income related to pricing declines and rig count reductions. Results in 2009 were also adversely impacted by $34 million in employee separation costs. In 2008, this segment’s results were negatively impacted by approximately $27 million due to Gulf of Mexico hurricanes and a $23 million impairment charge related to an oil and natural gas property in Bangladesh, but benefited from $25 million of gains related to the sale of two investments in the United States. Latin America operating income fell 39% primarily due to lower activity across all product service lines in Venezuela and decreased demand and pricing pressure for drilling services and wireline and perforating services in Argentina, Colombia, and Mexico. The region was also adversely affected by a $12 million charge related to the settlement of a customer receivable in Venezuela. The Europe/Africa/CIS region operating income fell 24% as increased demand for drilling fluid services in Norway and Kazakhstan and increased software sales and consulting services in Africa were outweighed by pricing pressures and decreased drilling activity in Europe and lower demand for drilling fluid services in Africa. Middle East/Asia operating income decreased 10% over 2008 as declines in drilling activity in Saudi Arabia and China outweighed an increase in software sales and consulting services in the Middle East and higher demand for testing and subsea services in Asia. This region was negatively impacted by the impairment charge related to an oil and natural gas property in Bangladesh in 2008.
Corporate and other expenses were $205 million in 2009 compared to $264 million in 2008. The 2009 results include $5 million in employee separation costs. The 22% reduction was primarily attributable to our 2009 focus on reducing discretionary spending and optimizing headcount and a $22 million acquisition-related charge for WellDynamics related to employee incentive compensation awards in 2008. 2008 also included a net $5 million gain on the settlement of two patent disputes.
NONOPERATING ITEMS
Interest expense increased $130 million in 2009 compared to 2008 primarily due to the issuance of $2 billion in senior notes during the first quarter of 2009, partially offset by the redemption of our convertible senior notes early in the third quarter of 2008.
Interest income decreased $27 million in 2009 compared to 2008 due to a general decline in market interest rates.
Loss from discontinued operations, net of income tax in 2008 included $420 million in charges reflecting the resolution of the DOJ and SEC FCPA investigations and the impact of our assumption changes during that period regarding the resolution of the Barracuda-Caratinga bolt arbitration matter under the indemnities and guarantees provided to KBR upon separation.
Noncontrolling interest in net income of subsidiaries increased $19 million compared to 2008, primarily related to the impact of a change in effective ownership of a joint venture in 2008.
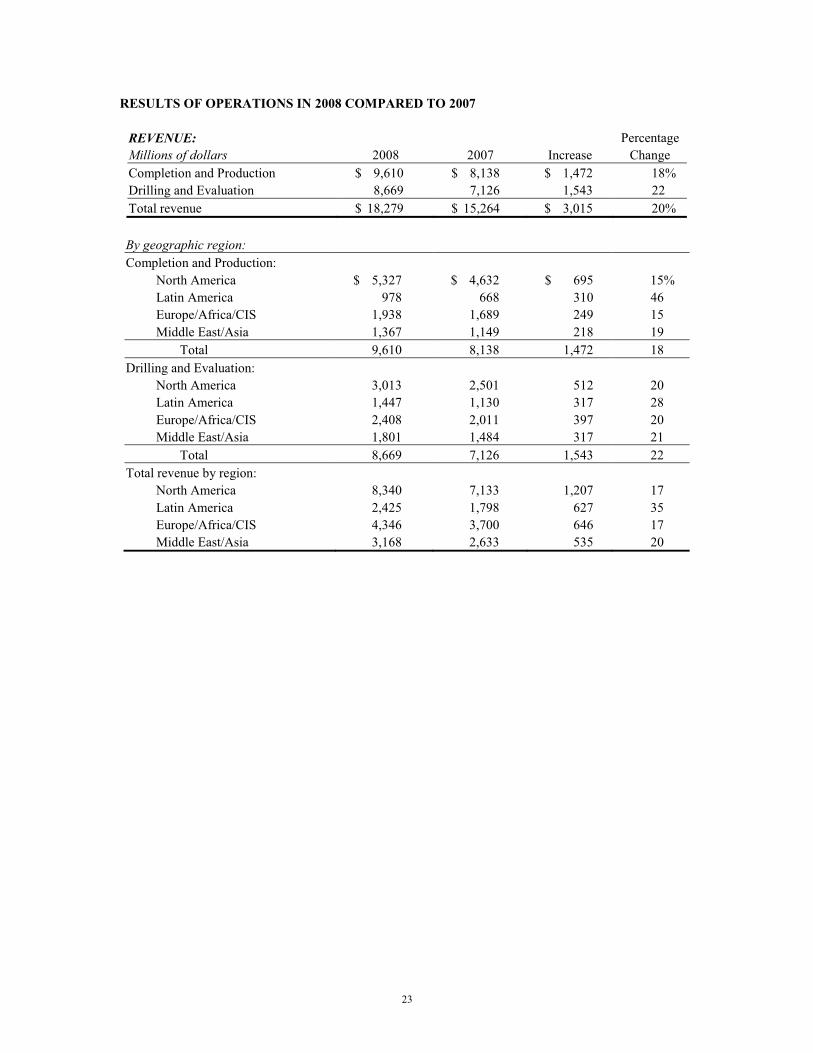
23
RESULTS OF OPERATIONS IN 2008 COMPARED TO 2007
REVENUE: Percentage Millions of dollars 2008 2007 Increase Change Completion and Production $ 9,610 $ 8,138 $ 1,472 18% Drilling and Evaluation 8,669 7,126 1,543 22 Total revenue $ 18,279 $ 15,264 $ 3,015 20%
By geographic region: Completion and Production: North America $ 5,327 $ 4,632 $ 695 15% Latin America 978 668 310 46 Europe/Africa/CIS 1,938 1,689 249 15 Middle East/Asia 1,367 1,149 218 19 Total 9,610 8,138 1,472 18 Drilling and Evaluation: North America 3,013 2,501 512 20 Latin America 1,447 1,130 317 28 Europe/Africa/CIS 2,408 2,011 397 20 Middle East/Asia 1,801 1,484 317 21 Total 8,669 7,126 1,543 22 Total revenue by region: North America 8,340 7,133 1,207 17 Latin America 2,425 1,798 627 35 Europe/Africa/CIS 4,346 3,700 646 17 Middle East/Asia 3,168 2,633 535 20
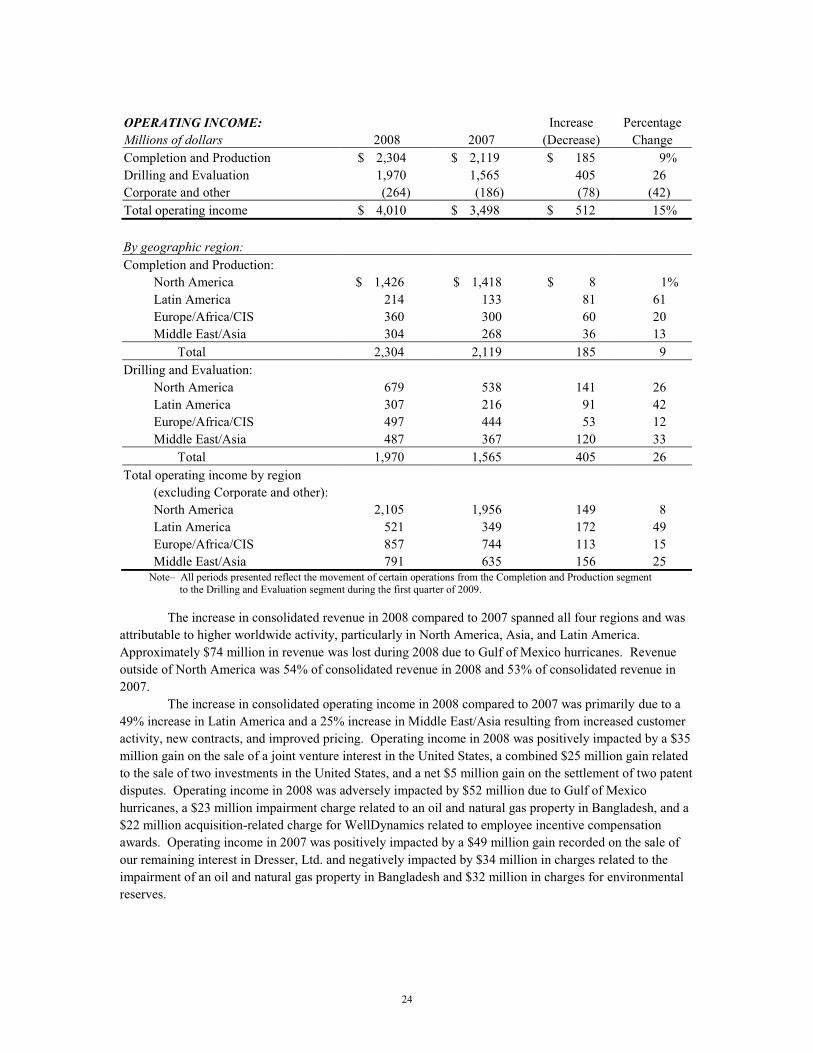
24
OPERATING INCOME: Increase Percentage Millions of dollars 2008 2007 (Decrease) Change Completion and Production $ 2,304 $ 2,119 $ 185 9% Drilling and Evaluation 1,970 1,565 405 26 Corporate and other (264) (186) (78) (42) Total operating income $ 4,010 $ 3,498 $ 512 15%
By geographic region: Completion and Production: North America $ 1,426 $ 1,418 $ 8 1% Latin America 214 133 81 61 Europe/Africa/CIS 360 300 60 20 Middle East/Asia 304 268 36 13 Total 2,304 2,119 185 9 Drilling and Evaluation: North America 679 538 141 26 Latin America 307 216 91 42 Europe/Africa/CIS 497 444 53 12 Middle East/Asia 487 367 120 33 Total 1,970 1,565 405 26 Total operating income by region (excluding Corporate and other): North America 2,105 1,956 149 8 Latin America 521 349 172 49 Europe/Africa/CIS 857 744 113 15 Middle East/Asia 791 635 156 25
Note– All periods presented reflect the movement of certain operations from the Completion and Production segment to the Drilling and Evaluation segment during the first quarter of 2009.
The increase in consolidated revenue in 2008 compared to 2007 spanned all four regions and was
attributable to higher worldwide activity, particularly in North America, Asia, and Latin America. Approximately $74 million in revenue was lost during 2008 due to Gulf of Mexico hurricanes. Revenue outside of North America was 54% of consolidated revenue in 2008 and 53% of consolidated revenue in 2007.
The increase in consolidated operating income in 2008 compared to 2007 was primarily due to a 49% increase in Latin America and a 25% increase in Middle East/Asia resulting from increased customer activity, new contracts, and improved pricing. Operating income in 2008 was positively impacted by a $35 million gain on the sale of a joint venture interest in the United States, a combined $25 million gain related to the sale of two investments in the United States, and a net $5 million gain on the settlement of two patent disputes. Operating income in 2008 was adversely impacted by $52 million due to Gulf of Mexico hurricanes, a $23 million impairment charge related to an oil and natural gas property in Bangladesh, and a $22 million acquisition-related charge for WellDynamics related to employee incentive compensation awards. Operating income in 2007 was positively impacted by a $49 million gain recorded on the sale of our remaining interest in Dresser, Ltd. and negatively impacted by $34 million in charges related to the impairment of an oil and natural gas property in Bangladesh and $32 million in charges for environmental reserves.
25
Following is a discussion of our results of operations by reportable segments. Completion and Production increase in revenue compared to 2007 was derived from all regions.
Europe/Africa/CIS revenue grew 15% primarily from increased production enhancement services activity, largely related to the acquisition of PSL Energy Services Limited. Additionally, completion tools revenue benefited from increased sales and service in Africa. Middle East/Asia revenue grew 19% from increased completion tools sales and deliveries and new contracts for production enhancement services in the region. Increased demand for cementing products and services in the Middle East and Australia also contributed to the increase. North America revenue grew 15% from improved demand for production enhancement services and cementing products and services largely driven by increased capacity and rig count in the United States. Partially offsetting the improvement in the United States was $34 million in lost revenue due to Gulf of Mexico hurricanes. Latin America revenue grew 46% as a result of higher activity for all product service lines, particularly in Mexico and Brazil. Higher demand for production enhancement services, new cementing contracts with more favorable pricing, and improved completion tools sales were large contributors to the increase in revenue. Revenue outside of North America was 45% of total segment revenue in 2008 and 43% in 2007.
The increase in segment operating income in 2008 compared to 2007 spanned all regions. Europe/Africa/CIS operating income increased 20% from increased completion tools sales and services in Africa and higher production enhancement activity in Europe. Middle East/Asia operating income increased 13% primarily due to increased sales and service revenue from completion tools and increased production enhancement activity in the region. North America operating income was essentially flat, primarily due to a $25 million negative impact from Gulf of Mexico hurricanes and pricing declines and cost increases in the United States for production enhancement, offset by improved completion tools sales and services and a $35 million gain on the sale of a joint venture interest in the United States. Latin America operating income increased 61% with improved cementing and production enhancement performance primarily in Mexico and Brazil.
Drilling and Evaluation revenue increase compared to 2007 was derived from all regions. Europe/Africa/CIS revenue grew 20% from increased drilling services activity and higher customer demand for fluid and wireline and perforating services throughout the region. Middle East/Asia revenue grew 21% primarily due to increased fluid services activity throughout the region and higher customer demand for drilling services in Asia. North America revenue grew 20% from higher activity across all product service lines in the United States primarily due to increased land rig count and higher demand for new technology. The region also benefited from higher activity for fluid services in Canada. Partially offsetting the improvement in the United States was $40 million in lost revenue due to Gulf of Mexico hurricanes. Latin America revenue grew 28% as a result of increased customer demand for drilling services, increased activity and new contracts for wireline and perforating services, and increased project management services. Revenue outside of North America was 65% of total segment revenue in 2008 and 2007.
26
The increase in segment operating income in 2008 compared to 2007 was derived from all regions led by growth in North America, Latin America, and Asia. Europe/Africa/CIS operating income increased 12% benefiting from higher customer demand for wireline and perforating services in Africa. Higher demand for software sales and consulting services in Europe also contributed to the increase. Middle East/Asia operating income grew 33% primarily due to increased fluid services results in the Middle East as well as higher demand for drilling services and improved wireline and perforating services and software sales and consulting services in Asia. Operating income was impacted by a $23 million impairment charge related to an oil and natural gas property in Bangladesh. North America operating income increased 26% primarily from increased activity in most of the product service lines including higher demand for fluid services and increased drilling activity. Negatively impacting the region was a loss of $27 million due to Gulf of Mexico hurricanes. This region’s results also reflect $25 million of gains related to the sale of two investments in the United States. Latin America operating income increased 42% primarily due to increased activity in drilling services and wireline and perforating services and improvements in software sales and consulting services.
Corporate and other expenses were $264 million in 2008 compared to $186 million in 2007. 2008 included a $35 million gain in the fourth quarter and a $30 million charge in the second quarter related to patent dispute settlements, a $22 million acquisition-related charge for WellDynamics related to employee incentive compensation awards, higher legal costs, and increased corporate development costs. 2007 was impacted by a $49 million gain on the sale of our remaining interest in Dresser, Ltd. and a $12 million charge for executive separation costs. NONOPERATING ITEMS
Interest income decreased $85 million in 2008 compared to 2007 due to a decrease of cash and equivalents and marketable securities balances and a general decline in market interest rates.
Other, net in 2008 included a $31 million loss on foreign exchange due to the general weakening of the United States dollar against certain foreign currencies.
Provision for income taxes from continuing operations of $1.2 billion in 2008 resulted in an effective tax rate of 31% compared to an effective tax rate of 26% in 2007. The lower tax rate in 2007 is primarily related to a $205 million favorable income tax impact from the ability to recognize foreign tax credits previously estimated not to be fully utilizable.
Income (loss) from discontinued operations, net of income tax in 2008 included $420 million in charges reflecting the resolution of the DOJ and SEC FCPA investigations and the impact of our assumption changes during that period regarding the resolution of the Barracuda-Caratinga bolt arbitration matter under the indemnities and guarantees provided to KBR upon separation. 2007 included a $933 million net gain on the disposition of KBR, which included the estimated fair value of the indemnities and guarantees provided to KBR and our 81% share of KBR’s $28 million in net income in the first quarter of 2007.
Noncontrolling interest in net income of subsidiaries decreased $59 million compared to 2007, primarily related to a change in effective ownership of a joint venture in 2008.
27
CRITICAL ACCOUNTING ESTIMATES The preparation of financial statements requires the use of judgments and estimates. Our critical
accounting policies are described below to provide a better understanding of how we develop our assumptions and judgments about future events and related estimations and how they can impact our financial statements. A critical accounting estimate is one that requires our most difficult, subjective, or complex estimates and assessments and is fundamental to our results of operations. We identified our most critical accounting estimates to be: - forecasting our effective income tax rate, including our future ability to utilize foreign tax
credits and the realizability of deferred tax assets, and providing for uncertain tax positions;
- legal and investigation matters; - valuations of indemnities; - valuations of long-lived assets, including intangible assets; - purchase price allocation for acquired businesses; - pensions; - allowance for bad debts; and - percentage-of-completion accounting for long-term, construction-type contracts.
We base our estimates on historical experience and on various other assumptions we believe to be reasonable according to the current facts and circumstances, the results of which form the basis for making judgments about the carrying values of assets and liabilities that are not readily apparent from other sources. We believe the following are the critical accounting policies used in the preparation of our consolidated financial statements, as well as the significant estimates and judgments affecting the application of these policies. This discussion and analysis should be read in conjunction with our consolidated financial statements and related notes included in this report.
We have discussed the development and selection of these critical accounting policies and estimates with the Audit Committee of our Board of Directors, and the Audit Committee has reviewed the disclosure presented below.
Income tax accounting We recognize the amount of taxes payable or refundable for the current year and use an asset and
liability approach in recognizing the amount of deferred tax liabilities and assets for the future tax consequences of events that have been recognized in our financial statements or tax returns. We apply the following basic principles in accounting for our income taxes: - a current tax liability or asset is recognized for the estimated taxes payable or refundable
on tax returns for the current year; - a deferred tax liability or asset is recognized for the estimated future tax effects
attributable to temporary differences and carryforwards; - the measurement of current and deferred tax liabilities and assets is based on provisions
of the enacted tax law, and the effects of potential future changes in tax laws or rates are not considered; and
- the value of deferred tax assets is reduced, if necessary, by the amount of any tax benefits that, based on available evidence, are not expected to be realized.
28
We determine deferred taxes separately for each tax-paying component (an entity or a group of entities that is consolidated for tax purposes) in each tax jurisdiction. That determination includes the following procedures: - identifying the types and amounts of existing temporary differences; - measuring the total deferred tax liability for taxable temporary differences using the
applicable tax rate; - measuring the total deferred tax asset for deductible temporary differences and operating
loss carryforwards using the applicable tax rate; - measuring the deferred tax assets for each type of tax credit carryforward; and - reducing the deferred tax assets by a valuation allowance if, based on available evidence,
it is more likely than not that some portion or all of the deferred tax assets will not be realized.
Our methodology for recording income taxes requires a significant amount of judgment in the use of assumptions and estimates. Additionally, we use forecasts of certain tax elements, such as taxable income and foreign tax credit utilization, as well as evaluate the feasibility of implementing tax planning strategies. Given the inherent uncertainty involved with the use of such variables, there can be significant variation between anticipated and actual results. Unforeseen events may significantly impact these variables, and changes to these variables could have a material impact on our income tax accounts related to both continuing and discontinued operations.
We have operations in approximately 70 countries other than the United States. Consequently, we are subject to the jurisdiction of a significant number of taxing authorities. The income earned in these various jurisdictions is taxed on differing bases, including income actually earned, income deemed earned, and revenue-based tax withholding. The final determination of our income tax liabilities involves the interpretation of local tax laws, tax treaties, and related authorities in each jurisdiction. Changes in the operating environment, including changes in tax law and currency/repatriation controls, could impact the determination of our income tax liabilities for a tax year.
Tax filings of our subsidiaries, unconsolidated affiliates, and related entities are routinely examined in the normal course of business by tax authorities. These examinations may result in assessments of additional taxes, which we work to resolve with the tax authorities and through the judicial process. Predicting the outcome of disputed assessments involves some uncertainty. Factors such as the availability of settlement procedures, willingness of tax authorities to negotiate, and the operation and impartiality of judicial systems vary across the different tax jurisdictions and may significantly influence the ultimate outcome. We review the facts for each assessment, and then utilize assumptions and estimates to determine the most likely outcome and provide taxes, interest, and penalties as needed based on this outcome. We provide for uncertain tax positions pursuant to current accounting standards, which prescribe a minimum recognition threshold and measurement methodology that a tax position taken or expected to be taken in a tax return is required to meet before being recognized in the financial statements. They also provide guidance for derecognition classification, interest and penalties, accounting in interim periods, disclosure, and transition.
29
Legal and investigation matters As discussed in Note 8 of our consolidated financial statements, as of December 31, 2009, we
have accrued an estimate of the probable and estimable costs for the resolution of some of these legal and investigation matters. For other matters for which the liability is not probable and reasonably estimable, we have not accrued any amounts. Attorneys in our legal department monitor and manage all claims filed against us and review all pending investigations. Generally, the estimate of probable costs related to these matters is developed in consultation with internal and outside legal counsel representing us. Our estimates are based upon an analysis of potential results, assuming a combination of litigation and settlement strategies. The precision of these estimates is impacted by the amount of due diligence we have been able to perform. We attempt to resolve these matters through settlements, mediation, and arbitration proceedings when possible. If the actual settlement costs, final judgments, or fines, after appeals, differ from our estimates, our future financial results may be adversely affected. We have in the past recorded significant adjustments to our initial estimates of these types of contingencies.
Indemnity valuations We provided indemnification in favor of KBR for certain contingent liabilities related to FCPA
investigations and the Barracuda-Caratinga bolts matter. See Note 7 and 8 to the consolidated financial statements for further information. Accounting standards require recognition of third-party indemnities at their inception. Therefore, we recorded our estimate of the fair market value of these indemnities as of the date of KBR’s separation. The initial amounts recorded for the FCPA and Barracuda-Caratinga indemnities were based upon analyses conducted by a third-party valuation expert. The valuation models employed a probability-weighted cost analysis, with certain assumptions based upon the accumulation of data and knowledge of the relevant issues. The accounting standards state that the subsequent measurement of such liabilities should not necessarily be based on fair value. The standards reference accounting for subsequent adjustments to these types of liabilities as you would under the current accounting guidance for contingent liabilities. As such, subsequent adjustments to the indemnities provided to KBR upon separation, including the indemnity relating to the FCPA investigations, have been recorded when the loss is both probable and estimable.
Value of long-lived assets, including intangible assets We carry a variety of long-lived assets on our balance sheet including property, plant and
equipment, goodwill, and other intangibles. We conduct impairment tests on long-lived assets whenever events or changes in circumstances indicate that the carrying value may not be recoverable and intangible assets quarterly. Impairment is the condition that exists when the carrying amount of a long-lived asset exceeds its fair value, and any impairment charge that we record reduces our earnings. We review the carrying value of these assets based upon estimated future cash flows while taking into consideration assumptions and estimates including the future use of the asset, remaining useful life of the asset, and service potential of the asset.
30
Goodwill is the excess of the cost of an acquired entity over the net of the amounts assigned to assets acquired and liabilities assumed. We test goodwill for impairment annually, during the third quarter, or if an event occurs or circumstances change that would more likely than not reduce the fair value of a reporting unit below its carrying amount. For purposes of performing the goodwill impairment test our reporting units are the same as our reportable segments, the Completion and Production division and the Drilling and Evaluation division. The impairment test consists of a two-step process. The first step compares the fair value of a reporting unit with its carrying amount, including goodwill, and utilizes a future cash flow analysis based on the estimates and assumptions of our forecasted long-term growth model. If the fair value of a reporting unit exceeds its carrying amount, goodwill of the reporting unit is considered not impaired. If the carrying amount of a reporting unit exceeds its fair value, we perform the second step of the goodwill impairment test to measure the amount of the impairment loss, if any. The second step of the goodwill impairment test compares the implied fair value of the reporting unit’s goodwill with the carrying amount of that goodwill. The implied fair value of goodwill is determined in the same manner as the amount of goodwill recognized in a business combination. In other words, the estimated fair value of the reporting unit is allocated to all of the assets and liabilities of that unit (including any unrecognized intangible assets) as if the reporting unit had been acquired in a business combination and the fair value of the reporting unit was the purchase price paid. If the carrying amount of the reporting unit’s goodwill exceeds the implied fair value of that goodwill, an impairment loss is recognized in an amount equal to that excess. Any impairment charge that we record reduces our earnings. The fair value of each of our reporting units exceeded its carrying amount by a significant margin for 2009, 2008, and 2007. See Note 1 to the consolidated financial statements for accounting policies related to long-lived assets and intangible assets.
Acquisitions-purchase price allocation We allocate the purchase price of an acquired business to its identifiable assets and liabilities
based on estimated fair values. The excess of the purchase price over the amount allocated to the assets and liabilities, if any, is recorded as goodwill. We use all available information to estimate fair values including quoted market prices, the carrying value of acquired assets, and widely accepted valuation techniques such as discounted cash flows. We engage third-party appraisal firms to assist in fair value determination of inventory, identifiable intangible assets, and any other significant assets or liabilities when appropriate. We adjust the preliminary purchase price allocation, as necessary, as we obtain more information regarding asset valuations and liabilities assumed until the expiration of the measurement period. The judgments made in determining the estimated fair value assigned to each class of assets acquired and liabilities assumed, as well as asset lives, can materially impact our results of operations.
Pensions Our pension benefit obligations and expenses are calculated using actuarial models and methods.
Two of the more critical assumptions and estimates used in the actuarial calculations are the discount rate for determining the current value of plan benefit obligations and the expected long-term rate of return on plan assets used in determining net periodic pension expense. Other critical assumptions and estimates used in determining benefit obligations and plan expenses, including demographic factors such as retirement age, mortality, and turnover, are also evaluated periodically and updated accordingly to reflect our actual experience.
Discount rates are determined annually and are based on the prevailing market rate of a portfolio of high-quality debt instruments with maturities matching the expected timing of the payment of the benefit obligations. Expected long-term rates of return on plan assets are determined annually and are based on an evaluation of our plan assets and historical trends and experience, taking into account current and expected market conditions. Plan assets are comprised primarily of equity and debt securities. As we have both domestic and international plans, these assumptions differ based on varying factors specific to each particular country or economic environment.
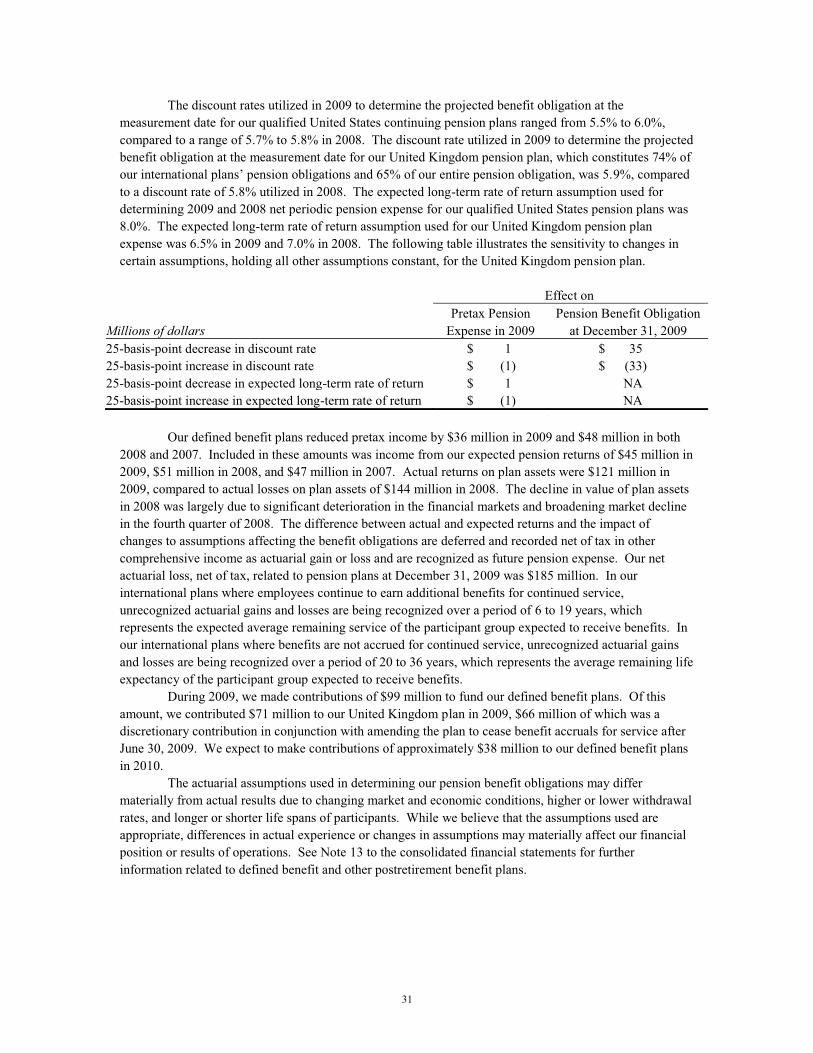
31
The discount rates utilized in 2009 to determine the projected benefit obligation at the measurement date for our qualified United States continuing pension plans ranged from 5.5% to 6.0%, compared to a range of 5.7% to 5.8% in 2008. The discount rate utilized in 2009 to determine the projected benefit obligation at the measurement date for our United Kingdom pension plan, which constitutes 74% of our international plans’ pension obligations and 65% of our entire pension obligation, was 5.9%, compared to a discount rate of 5.8% utilized in 2008. The expected long-term rate of return assumption used for determining 2009 and 2008 net periodic pension expense for our qualified United States pension plans was 8.0%. The expected long-term rate of return assumption used for our United Kingdom pension plan expense was 6.5% in 2009 and 7.0% in 2008. The following table illustrates the sensitivity to changes in certain assumptions, holding all other assumptions constant, for the United Kingdom pension plan.
Effect on Pretax Pension Pension Benefit Obligation Millions of dollars Expense in 2009 at December 31, 2009 25-basis-point decrease in discount rate $ 1 $ 35 25-basis-point increase in discount rate $ (1) $ (33) 25-basis-point decrease in expected long-term rate of return $ 1 NA 25-basis-point increase in expected long-term rate of return $ (1) NA
Our defined benefit plans reduced pretax income by $36 million in 2009 and $48 million in both
2008 and 2007. Included in these amounts was income from our expected pension returns of $45 million in 2009, $51 million in 2008, and $47 million in 2007. Actual returns on plan assets were $121 million in 2009, compared to actual losses on plan assets of $144 million in 2008. The decline in value of plan assets in 2008 was largely due to significant deterioration in the financial markets and broadening market decline in the fourth quarter of 2008. The difference between actual and expected returns and the impact of changes to assumptions affecting the benefit obligations are deferred and recorded net of tax in other comprehensive income as actuarial gain or loss and are recognized as future pension expense. Our net actuarial loss, net of tax, related to pension plans at December 31, 2009 was $185 million. In our international plans where employees continue to earn additional benefits for continued service, unrecognized actuarial gains and losses are being recognized over a period of 6 to 19 years, which represents the expected average remaining service of the participant group expected to receive benefits. In our international plans where benefits are not accrued for continued service, unrecognized actuarial gains and losses are being recognized over a period of 20 to 36 years, which represents the average remaining life expectancy of the participant group expected to receive benefits.
During 2009, we made contributions of $99 million to fund our defined benefit plans. Of this amount, we contributed $71 million to our United Kingdom plan in 2009, $66 million of which was a discretionary contribution in conjunction with amending the plan to cease benefit accruals for service after June 30, 2009. We expect to make contributions of approximately $38 million to our defined benefit plans in 2010.
The actuarial assumptions used in determining our pension benefit obligations may differ materially from actual results due to changing market and economic conditions, higher or lower withdrawal rates, and longer or shorter life spans of participants. While we believe that the assumptions used are appropriate, differences in actual experience or changes in assumptions may materially affect our financial position or results of operations. See Note 13 to the consolidated financial statements for further information related to defined benefit and other postretirement benefit plans.
32
Allowance for bad debts We evaluate our accounts receivable through a continuous process of assessing our portfolio on an
individual customer and overall basis. This process consists of a thorough review of historical collection experience, current aging status of the customer accounts, financial condition of our customers, and whether the receivables involve retainages. We also consider the economic environment of our customers, both from a marketplace and geographic perspective, in evaluating the need for an allowance. Based on our review of these factors, we establish or adjust allowances for specific customers and the accounts receivable portfolio as a whole. This process involves a high degree of judgment and estimation, and frequently involves significant dollar amounts. Accordingly, our results of operations can be affected by adjustments to the allowance due to actual write-offs that differ from estimated amounts. Our estimates of allowances for bad debts have historically been accurate. Over the last five years, our estimates of allowances for bad debts, as a percentage of notes and accounts receivable before the allowance, have ranged from 1.5% to 3.0%. At December 31, 2009, allowance for bad debts totaled $90 million or 3.0% of notes and accounts receivable before the allowance, and at December 31, 2008, allowance for bad debts totaled $60 million or 1.6% of notes and accounts receivable before the allowance. A 1% change in our estimate of the collectability of our notes and accounts receivable balance as of December 31, 2009 would have resulted in a $30 million adjustment to 2009 total operating costs and expenses.
Percentage of completion Revenue from certain long-term, integrated project management contracts to provide well
construction and completion services is reported on the percentage-of-completion method of accounting. This method of accounting requires us to calculate job profit to be recognized in each reporting period for each job based upon our projections of future outcomes, which include: - estimates of the total cost to complete the project; - estimates of project schedule and completion date; - estimates of the extent of progress toward completion; and - amounts of any probable unapproved claims and change orders included in revenue.
Progress is generally based upon physical progress related to contractually defined units of work. At the outset of each contract, we prepare a detailed analysis of our estimated cost to complete the project. Risks related to service delivery, usage, productivity, and other factors are considered in the estimation process. Our project personnel periodically evaluate the estimated costs, claims, change orders, and percentage of completion at the project level. The recording of profits and losses on long-term contracts requires an estimate of the total profit or loss over the life of each contract. This estimate requires consideration of total contract value, change orders, and claims, less costs incurred and estimated costs to complete. Anticipated losses on contracts are recorded in full in the period in which they become evident. Profits are recorded based upon the total estimated contract profit times the current percentage complete for the contract.
When calculating the amount of total profit or loss on a long-term contract, we include unapproved claims as revenue when the collection is deemed probable based upon the four criteria for recognizing unapproved claims under current accounting standards. Including probable unapproved claims in this calculation increases the operating income (or reduces the operating loss) that would otherwise be recorded without consideration of the probable unapproved claims. Probable unapproved claims are recorded to the extent of costs incurred and include no profit element. In all cases, the probable unapproved claims included in determining contract profit or loss are less than the actual claim that will be or has been presented to the customer.
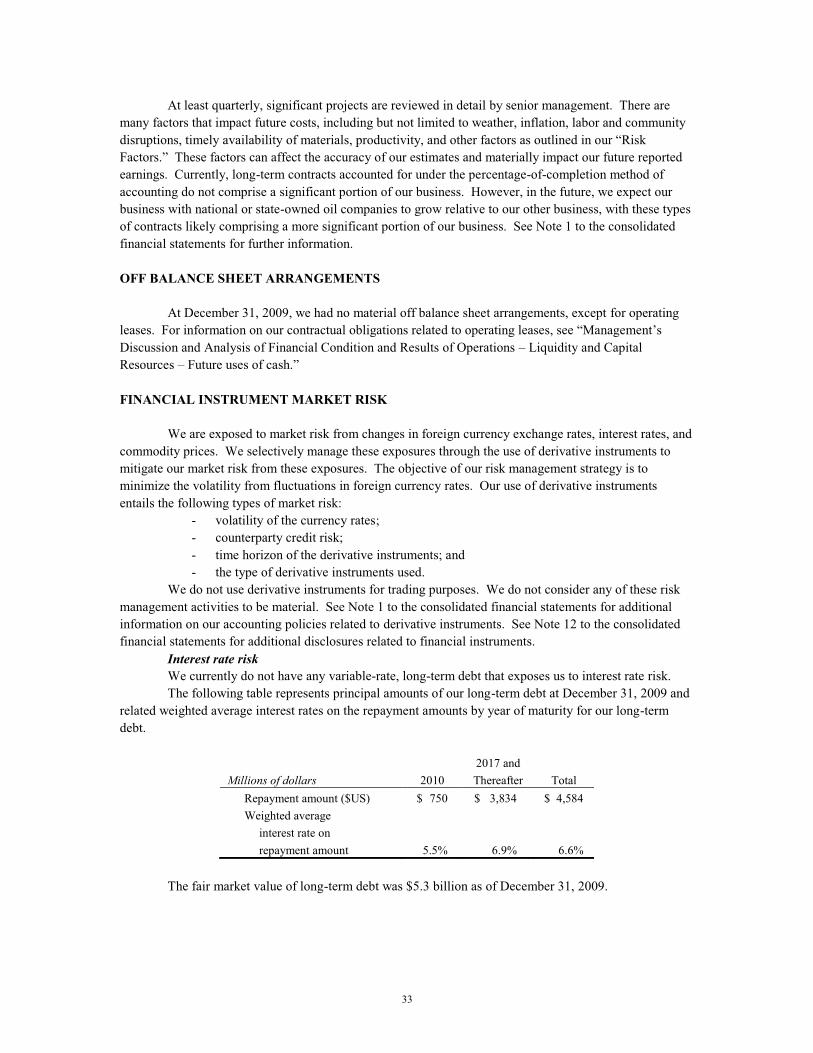
33
At least quarterly, significant projects are reviewed in detail by senior management. There are many factors that impact future costs, including but not limited to weather, inflation, labor and community disruptions, timely availability of materials, productivity, and other factors as outlined in our “Risk Factors.” These factors can affect the accuracy of our estimates and materially impact our future reported earnings. Currently, long-term contracts accounted for under the percentage-of-completion method of accounting do not comprise a significant portion of our business. However, in the future, we expect our business with national or state-owned oil companies to grow relative to our other business, with these types of contracts likely comprising a more significant portion of our business. See Note 1 to the consolidated financial statements for further information. OFF BALANCE SHEET ARRANGEMENTS
At December 31, 2009, we had no material off balance sheet arrangements, except for operating
leases. For information on our contractual obligations related to operating leases, see “Management’s Discussion and Analysis of Financial Condition and Results of Operations – Liquidity and Capital Resources – Future uses of cash.” FINANCIAL INSTRUMENT MARKET RISK
We are exposed to market risk from changes in foreign currency exchange rates, interest rates, and commodity prices. We selectively manage these exposures through the use of derivative instruments to mitigate our market risk from these exposures. The objective of our risk management strategy is to minimize the volatility from fluctuations in foreign currency rates. Our use of derivative instruments entails the following types of market risk: - volatility of the currency rates; - counterparty credit risk; - time horizon of the derivative instruments; and - the type of derivative instruments used.
We do not use derivative instruments for trading purposes. We do not consider any of these risk management activities to be material. See Note 1 to the consolidated financial statements for additional information on our accounting policies related to derivative instruments. See Note 12 to the consolidated financial statements for additional disclosures related to financial instruments.
Interest rate risk We currently do not have any variable-rate, long-term debt that exposes us to interest rate risk. The following table represents principal amounts of our long-term debt at December 31, 2009 and
related weighted average interest rates on the repayment amounts by year of maturity for our long-term debt.
2017 and Millions of dollars 2010 Thereafter Total Repayment amount ($US) $ 750 $ 3,834 $ 4,584 Weighted average interest rate on repayment amount 5.5% 6.9% 6.6%
The fair market value of long-term debt was $5.3 billion as of December 31, 2009.
34
ENVIRONMENTAL MATTERS We are subject to numerous environmental, legal, and regulatory requirements related to our
operations worldwide. For information related to environmental matters, see Note 8 to the consolidated financial statements and “Risk Factors—Customers and Business” under the subheading “Environmental requirements.” NEW ACCOUNTING PRONOUNCEMENTS
In October 2009, the FASB issued an update to existing guidance on revenue recognition for
arrangements with multiple deliverables. This update will allow companies to allocate consideration received for qualified separate deliverables using estimated selling price for both delivered and undelivered items when vendor-specific objective evidence or third-party evidence is unavailable. Additional disclosures discussing the nature of multiple element arrangements, the types of deliverables under the arrangements, the general timing of their delivery, and significant factors and estimates used to determine estimated selling prices are required. We will adopt this update for new revenue arrangements entered into or materially modified beginning January 1, 2011. We have not yet determined the impact on our consolidated financial statements.
In June 2009, the FASB issued a new accounting standard which provides amendments to previous guidance on the consolidation of variable interest entities. This standard clarifies the characteristics that identify a variable interest entity (VIE) and changes how a reporting entity identifies a primary beneficiary that would consolidate the VIE from a quantitative risk and rewards calculation to a qualitative approach based on which variable interest holder has controlling financial interest and the ability to direct the most significant activities that impact the VIE’s economic performance. This standard requires the primary beneficiary assessment to be performed on a continuous basis. It also requires additional disclosures about an entity’s involvement with a VIE, restrictions on the VIE’s assets and liabilities that are included in the reporting entity’s consolidated balance sheet, significant risk exposures due to the entity’s involvement with the VIE, and how its involvement with a VIE impacts the reporting entity’s consolidated financial statements. The standard is effective for fiscal years beginning after November 15, 2009. We adopted the standard on January 1, 2010, and it will not have a material impact on our consolidated financial statements. FORWARD-LOOKING INFORMATION
The Private Securities Litigation Reform Act of 1995 provides safe harbor provisions for forward-
looking information. Forward-looking information is based on projections and estimates, not historical information. Some statements in this Form 10-K are forward-looking and use words like “may,” “may not,” “believes,” “do not believe,” “expects,” “do not expect,” “anticipates,” “do not anticipate,” and other expressions. We may also provide oral or written forward-looking information in other materials we release to the public. Forward-looking information involves risk and uncertainties and reflects our best judgment based on current information. Our results of operations can be affected by inaccurate assumptions we make or by known or unknown risks and uncertainties. In addition, other factors may affect the accuracy of our forward-looking information. As a result, no forward-looking information can be guaranteed. Actual events and the results of operations may vary materially.
We do not assume any responsibility to publicly update any of our forward-looking statements regardless of whether factors change as a result of new information, future events, or for any other reason. You should review any additional disclosures we make in our press releases and Forms 10-K, 10-Q, and 8-K filed with or furnished to the SEC. We also suggest that you listen to our quarterly earnings release conference calls with financial analysts.
35
RISK FACTORS While it is not possible to identify all risk factors, we continue to face many risks and uncertainties
that could cause actual results to differ from our forward-looking statements and could otherwise have a material adverse effect on our liquidity, consolidated results of operations, and consolidated financial condition. Foreign Corrupt Practices Act Investigations
Background. As a result of an ongoing FCPA investigation at the time of the KBR separation, we provided indemnification in favor of KBR under the master separation agreement for certain contingent liabilities, including our indemnification of KBR and any of its greater than 50%-owned subsidiaries as of November 20, 2006, the date of the master separation agreement, for fines or other monetary penalties or direct monetary damages, including disgorgement, as a result of a claim made or assessed by a governmental authority in the United States, the United Kingdom, France, Nigeria, Switzerland, and/or Algeria, or a settlement thereof, related to alleged or actual violations occurring prior to November 20, 2006 of the FCPA or particular, analogous applicable foreign statutes, laws, rules, and regulations in connection with investigations pending as of that date, including with respect to the construction and subsequent expansion by TSKJ of a multibillion dollar natural gas liquefaction complex and related facilities at Bonny Island in Rivers State, Nigeria.
TSKJ is a private limited liability company registered in Madeira, Portugal whose members are Technip SA of France, Snamprogetti Netherlands B.V. (a subsidiary of Saipem SpA of Italy), JGC Corporation of Japan, and Kellogg Brown & Root LLC (a subsidiary of KBR), each of which had an approximate 25% beneficial interest in the venture. Part of KBR’s ownership in TSKJ was held through M.W. Kellogg Limited (MWKL), a United Kingdom joint venture and subcontractor on the Bonny Island project, in which KBR beneficially owns a 55% interest. TSKJ and other similarly owned entities entered into various contracts to build and expand the liquefied natural gas project for Nigeria LNG Limited, which is owned by the Nigerian National Petroleum Corporation, Shell Gas B.V., Cleag Limited (an affiliate of Total), and Agip International B.V. (an affiliate of ENI SpA of Italy).
DOJ and SEC investigations resolved. In February 2009, the FCPA investigations by the DOJ and the SEC were resolved with respect to KBR and us. The DOJ and SEC investigations resulted from allegations of improper payments to government officials in Nigeria in connection with the construction and subsequent expansion by TSKJ of the Bonny Island project.
The DOJ investigation was resolved with respect to us with a non-prosecution agreement in which the DOJ agreed not to bring FCPA or bid coordination-related charges against us with respect to the matters under investigation, and in which we agreed to continue to cooperate with the DOJ’s ongoing investigation and to refrain from and self-report certain FCPA violations. The DOJ agreement did not provide a monitor for us.
As part of the resolution of the SEC investigation, we retained an independent consultant to conduct a 60-day review and evaluation of our internal controls and record-keeping policies as they relate to the FCPA, and we agreed to adopt any necessary anti-bribery and foreign agent internal controls and record-keeping procedures recommended by the independent consultant. The review and evaluation were completed during the second quarter of 2009, and we have implemented the consultant’s immediate recommendations and will implement the remaining long-term recommendations by mid-year 2010. As a result of the substantial enhancement of our anti-bribery and foreign agent internal controls and record-keeping procedures prior to the review of the independent consultant, we do not expect the implementation of the consultant’s recommendations to materially impact our long-term strategy to grow our international operations. In 2010, the independent consultant will perform a 30-day, follow-up review to confirm that we have implemented the recommendations and continued the application of our current policies and procedures and to recommend any additional improvements.
36
KBR has agreed that our indemnification obligations with respect to the DOJ and SEC FCPA investigations have been fully satisfied.
Other matters. In addition to the DOJ and the SEC investigations, we are aware of other investigations in France, Nigeria, the United Kingdom, and Switzerland regarding the Bonny Island project. In the United Kingdom, the Serious Fraud Office (SFO) is considering civil claims or criminal prosecution under various United Kingdom laws and appears to be focused on the actions of MWKL, among others. Violations of these laws could result in fines, restitution and confiscation of revenues, among other penalties, some of which could be subject to our indemnification obligations under the master separation agreement. Our indemnity for penalties under the master separation agreement with respect to MWKL is limited to 55% of such penalties, which is KBR’s beneficial ownership interest in MWKL. MWKL is cooperating with the SFO’s investigation. Whether the SFO pursues civil or criminal claims, and the amount of any fines, restitution, confiscation of revenues or other penalties that could be assessed would depend on, among other factors, the SFO’s findings regarding the amount, timing, nature and scope of any improper payments or other activities, whether any such payments or other activities were authorized by or made with knowledge of MWKL, the amount of revenue involved, and the level of cooperation provided to the SFO during the investigations. MWKL has informed the SFO that it intends to self-report corporate liability for corruption-related offenses arising out of the Bonny Island project. Based on discussions with the SFO, MWKL expects to receive confirmation that it will be admitted into the plea negotiation process under the Guidelines on Plea Discussions in Cases of Complex or Serious Fraud, which have been issued by the Attorney General for England and Wales.
The DOJ and SEC settlements and the other ongoing investigations could result in third-party claims against us, which may include claims for special, indirect, derivative or consequential damages, damage to our business or reputation, loss of, or adverse effect on, cash flow, assets, goodwill, results of operations, business prospects, profits or business value or claims by directors, officers, employees, affiliates, advisors, attorneys, agents, debt holders, or other interest holders or constituents of us or our current or former subsidiaries.
Our indemnity of KBR and its majority-owned subsidiaries continues with respect to other investigations within the scope of our indemnity. Our indemnification obligation to KBR does not include losses resulting from third-party claims against KBR, including claims for special, indirect, derivative or consequential damages, nor does our indemnification apply to damage to KBR’s business or reputation, loss of, or adverse effect on, cash flow, assets, goodwill, results of operations, business prospects, profits or business value or claims by directors, officers, employees, affiliates, advisors, attorneys, agents, debt holders, or other interest holders or constituents of KBR or KBR’s current or former subsidiaries.
At this time, other than the claims being considered by the SFO, no claims by governmental authorities in foreign jurisdictions have been asserted against the indemnified parties. Therefore, we are unable to estimate the maximum potential amount of future payments that could be required to be made under our indemnity to KBR and its majority-owned subsidiaries related to these matters. An adverse determination or result against us or any party indemnified by us in any investigation or third-party claim related to these FCPA matters could have a material adverse effect on our liquidity, consolidated results of operations, and consolidated financial condition. See Note 7 to our consolidated financial statements for additional information.
37
Barracuda-Caratinga Arbitration We also provided indemnification in favor of KBR under the master separation agreement for all
out-of-pocket cash costs and expenses (except for legal fees and other expenses of the arbitration so long as KBR controls and directs it), or cash settlements or cash arbitration awards, KBR may incur after November 20, 2006 as a result of the replacement of certain subsea flowline bolts installed in connection with the Barracuda-Caratinga project. Under the master separation agreement, KBR currently controls the defense, counterclaim, and settlement of the subsea flowline bolts matter. As a condition of our indemnity, for any settlement to be binding upon us, KBR must secure our prior written consent to such settlement’s terms. We have the right to terminate the indemnity in the event KBR enters into any settlement without our prior written consent.
At Petrobras’ direction, KBR replaced certain bolts located on the subsea flowlines that failed through mid-November 2005, and KBR has informed us that additional bolts have failed thereafter, which were replaced by Petrobras. These failed bolts were identified by Petrobras when it conducted inspections of the bolts. We understand KBR believes several possible solutions may exist, including replacement of the bolts. Initial estimates by KBR indicated that costs of these various solutions ranged up to $148 million. In March 2006, Petrobras commenced arbitration against KBR claiming $220 million plus interest for the cost of monitoring and replacing the defective bolts and all related costs and expenses of the arbitration, including the cost of attorneys’ fees. We understand KBR is vigorously defending this matter and has submitted a counterclaim in the arbitration seeking the recovery of $22 million. The arbitration panel held an evidentiary hearing in March 2008 to determine which party is responsible for the designation of the material used for the bolts. On May 13, 2009, the arbitration panel held that KBR and not Petrobras selected the material to be used for the bolts. Accordingly, the arbitration panel held that there is no implied warranty by Petrobras to KBR as to the suitability of the bolt material and that the parties' rights are to be governed by the express terms of their contract. The arbitration panel set the final hearing on liability and damages for early May 2010. Our estimation of the indemnity obligation regarding the Barracuda-Caratinga arbitration is recorded as a liability in our consolidated financial statements as of December 31, 2009 and December 31, 2008. An adverse determination or result against KBR in the arbitration could have a material adverse effect on our liquidity, consolidated results of operations, and consolidated financial condition. See Note 7 to our consolidated financial statements for additional information regarding the KBR indemnification. Impairment of Oil and Natural Gas Properties
We have interests in oil and natural gas properties in Bangladesh and North America totaling approximately $175 million, net of accumulated depletion, which we account for under the successful efforts method. These oil and natural gas properties are assessed for impairment whenever changes in facts and circumstances indicate that the properties’ carrying amounts may not be recoverable. The expected future cash flows used for impairment reviews and related fair-value calculations are based on judgmental assessments of future production volumes, prices, and costs, considering all available information at the date of review.
A downward trend in estimates of production volumes or prices or an upward trend in costs could have an adverse effect on our results of operations and might result in an impairment of or higher depletion rate on our oil and natural gas properties. Geopolitical and International Environment
International and political events A significant portion of our revenue is derived from our non-United States operations, which
exposes us to risks inherent in doing business in each of the countries in which we transact business. The occurrence of any of the risks described below could have a material adverse effect on our consolidated results of operations and consolidated financial condition.
38
Our operations in countries other than the United States accounted for approximately 64% of our consolidated revenue during 2009, 57% of our consolidated revenue in 2008, and 56% of our consolidated revenue in 2007. Operations in countries other than the United States are subject to various risks unique to each country. With respect to any particular country, these risks may include: - expropriation and nationalization of our assets in that country; - political and economic instability; - civil unrest, acts of terrorism, force majeure, war, or other armed conflict; - natural disasters, including those related to earthquakes and flooding; - inflation; - currency fluctuations, devaluations, and conversion restrictions; - confiscatory taxation or other adverse tax policies; - governmental activities that limit or disrupt markets, restrict payments, or limit the
movement of funds; - governmental activities that may result in the deprivation of contract rights; and - governmental activities that may result in the inability to obtain or retain licenses
required for operation. Due to the unsettled political conditions in many oil-producing countries, our revenue and profits
are subject to the adverse consequences of war, the effects of terrorism, civil unrest, strikes, currency controls, and governmental actions. Countries where we operate that have significant political risk include: Algeria, Indonesia, Iraq, Nigeria, Russia, Kazakhstan, Venezuela, and Yemen. In addition, military action or continued unrest in the Middle East could impact the supply and pricing for oil and natural gas, disrupt our operations in the region and elsewhere, and increase our costs for security worldwide.
Our operations outside the United States require us to comply with a number of United States and international regulations. For example, our operations in countries outside the United States are subject to the FCPA, which prohibits United States companies or their agents and employees from providing anything of value to a foreign official for the purposes of influencing any act or decision of these individuals in their official capacity to help obtain or retain business, direct business to any person or corporate entity, or obtain any unfair advantage. Our activities in countries outside the United States create the risk of unauthorized payments or offers of payments by one of our employees or agents that could be in violation of the FCPA, even though these parties are not always subject to our control. We have internal control policies and procedures and have implemented training and compliance programs for our employees and agents with respect to the FCPA. However, we cannot assure that our policies, procedures and programs always will protect us from reckless or criminal acts committed by our employees or agents. In the event that we believe or have reason to believe that our employees or agents have or may have violated applicable anti-corruption laws, including the FCPA, we may be required to investigate or have outside counsel investigate the relevant facts and circumstances. Violations of the FCPA may result in severe criminal or civil sanctions, and we may be subject to other liabilities, which could negatively affect our business, operating results and financial condition.
In addition, investigations by governmental authorities as well as legal, social, economic, and political issues in these countries could materially and adversely affect our business and operations.
Our facilities and our employees are under threat of attack in some countries where we operate. In addition, the risks related to loss of life of our personnel and our subcontractors in these areas continue.
We are also subject to the risks that our employees, joint venture partners, and agents outside of the United States may fail to comply with applicable laws.
39
Military action, other armed conflicts, or terrorist attacks Military action in Iraq and the Middle East, military tension involving North Korea and Iran, as
well as the terrorist attacks of September 11, 2001 and subsequent terrorist attacks, threats of attacks, and unrest, have caused instability or uncertainty in the world’s financial and commercial markets and have significantly increased political and economic instability in some of the geographic areas in which we operate. Acts of terrorism and threats of armed conflicts in or around various areas in which we operate, such as the Middle East, Nigeria, and Indonesia, could limit or disrupt markets and our operations, including disruptions resulting from the evacuation of personnel, cancellation of contracts, or the loss of personnel or assets.
Such events may cause further disruption to financial and commercial markets and may generate greater political and economic instability in some of the geographic areas in which we operate. In addition, any possible reprisals as a consequence of the wars and ongoing military action in the Middle East, such as acts of terrorism in the United States or elsewhere, could materially and adversely affect us in ways we cannot predict at this time.
Income taxes We have operations in approximately 70 countries other than the United States. Consequently, we
are subject to the jurisdiction of a significant number of taxing authorities. The income earned in these various jurisdictions is taxed on differing bases, including net income actually earned, net income deemed earned, and revenue-based tax withholding. The final determination of our income tax liabilities involves the interpretation of local tax laws, tax treaties, and related authorities in each jurisdiction, as well as the significant use of estimates and assumptions regarding the scope of future operations and results achieved and the timing and nature of income earned and expenditures incurred. Changes in the operating environment, including changes in or interpretation of tax law and currency/repatriation controls, could impact the determination of our income tax liabilities for a tax year.
Foreign exchange and currency risks A sizable portion of our consolidated revenue and consolidated operating expenses is in foreign
currencies. As a result, we are subject to significant risks, including: - foreign exchange risks resulting from changes in foreign exchange rates and the
implementation of exchange controls; and - limitations on our ability to reinvest earnings from operations in one country to fund the
capital needs of our operations in other countries. We conduct business in countries, such as Venezuela, that have nontraded or “soft” currencies
which, because of their restricted or limited trading markets, may be more difficult to exchange for “hard” currency. We may accumulate cash in soft currencies, and we may be limited in our ability to convert our profits into United States dollars or to repatriate the profits from those countries.
We selectively use hedging transactions to limit our exposure to risks from doing business in foreign currencies. For those currencies that are not readily convertible, our ability to hedge our exposure is limited because financial hedge instruments for those currencies are nonexistent or limited. Our ability to hedge is also limited because pricing of hedging instruments, where they exist, is often volatile and not necessarily efficient.
In addition, the value of the derivative instruments could be impacted by: - adverse movements in foreign exchange rates; - interest rates; - commodity prices; or - the value and time period of the derivative being different than the exposures or cash
flows being hedged.
40
Customers and Business Exploration and production activity Demand for our services and products is particularly sensitive to the level of exploration,
development, and production activity of, and the corresponding capital spending by, oil and natural gas companies, including national oil companies. Demand is directly affected by trends in oil and natural gas prices, which, historically, have been volatile and are likely to continue to be volatile.
Prices for oil and natural gas are subject to large fluctuations in response to relatively minor changes in the supply of and demand for oil and natural gas, market uncertainty, and a variety of other economic factors that are beyond our control. Any prolonged reduction in oil and natural gas prices will depress the immediate levels of exploration, development, and production activity. Perceptions of longer-term lower oil and natural gas prices by oil and natural gas companies can similarly reduce or defer major expenditures given the long-term nature of many large-scale development projects.
The recent worldwide recession has reduced the levels of economic activity and the expansion of industrial business operations. This has negatively impacted worldwide demand for energy, resulting in lower oil and natural gas prices, a lowering of the level of exploration, development, and production activity, and a corresponding decline in the demand for our well services and products. This reduction in demand could continue through 2010 and beyond, which could have an adverse effect on revenue and profitability.
Factors affecting the prices of oil and natural gas include: - governmental regulations, including the policies of governments regarding the
exploration for and production and development of their oil and natural gas reserves; - global weather conditions and natural disasters; - worldwide political, military, and economic conditions; - the level of oil production by non-OPEC countries and the available excess production
capacity within OPEC; - oil refining capacity and shifts in end-customer preferences toward fuel efficiency and the
use of natural gas; - the cost of producing and delivering oil and natural gas; - potential acceleration of development of alternative fuels; and - the level of supply and demand for oil and natural gas, especially demand for natural gas
in the United States. Capital spending Our business is directly affected by changes in capital expenditures by our customers. Some of
the changes that may materially and adversely affect us include: - the consolidation of our customers, which could: - cause customers to reduce their capital spending, which would in turn reduce the
demand for our services and products; and - result in customer personnel changes, which in turn affect the timing of contract
negotiations; - adverse developments in the business and operations of our customers in the oil and
natural gas industry, including write-downs of reserves and reductions in capital spending for exploration, development, and production; and
- ability of our customers to timely pay the amounts due us.
41
Customers We depend on a limited number of significant customers. While none of these customers
represented more than 10% of consolidated revenue in any period presented, the loss of one or more significant customers could have a material adverse effect on our business and our consolidated results of operations.
In most cases, we bill our customers for our services in arrears and are, therefore, subject to our customers delaying or failing to pay our invoices. In weak economic environments, we may experience increased delays and failures due to, among other reasons, a reduction in our customer’s cash flow from operations and their access to the credit markets. If our customers delay in paying or fail to pay us a significant amount of our outstanding receivables, it could have a material adverse effect on our liquidity, consolidated results of operations, and consolidated financial condition.
In addition, there is an increased risk in doing business with customers in countries that have significant political risk or significant exposure to falling oil and natural gas prices.
Risks related to our business in Venezuela We believe there are risks associated with our operations in Venezuela. For example, the
Venezuela National Assembly enacted legislation that allows the Venezuelan government, directly or through its state-owned oil company, to assume control over the operations and assets of certain oil service providers in exchange for reimbursement of the book value of the assets adjusted for certain liabilities. Venezuelan government officials have stated this legislation is not applicable to our company.
However, we continue to see a delay in receiving payment on our receivables from our primary customer in Venezuela. If our customer further delays in paying or fails to pay us a significant amount of our outstanding receivables, it could have a material adverse effect on our liquidity, consolidated results of operations, and consolidated financial condition.
As of December 31, 2009, our total net investment in Venezuela was approximately $236 million. In addition to this amount, we also have $380 million of surety bond guarantees outstanding relating to our Venezuelan operations.
We historically have remeasured our net Bolívar Fuerte-denominated monetary asset position at the official exchange rate. In January 2010, the Venezuelan government announced a devaluation of the Bolívar Fuerte under a new two-exchange rate system: one rate for essential products and the other rate for non-essential products.
The future results of our Venezuelan operations will be affected by many factors, including our ability to take actions to mitigate the effect of the devaluation, further actions of the Venezuelan government, and general economic conditions such as continued inflation and future customer payments and spending.
Business with national oil companies Much of the world’s oil and natural gas reserves are controlled by national or state-owned oil
companies (NOCs). Several of the NOCs are among our top 20 customers. Increasingly, NOCs are turning to oilfield services companies like us to provide the services, technologies, and expertise needed to develop their reserves. Reserve estimation is a subjective process that involves estimating location and volumes based on a variety of assumptions and variables that cannot be directly measured. As such, the NOCs may provide us with inaccurate information in relation to their reserves that may result in cost overruns, delays, and project losses. In addition, NOCs often operate in countries with unsettled political conditions, war, civil unrest, or other types of community issues. These types of issues may also result in similar cost overruns, losses, and contract delays.
42
Long-term, fixed-price contracts Customers, primarily NOCs, often require integrated, long-term, fixed-price contracts that could
require us to provide integrated project management services outside our normal discrete business to act as project managers as well as service providers. Providing services on an integrated basis may require us to assume additional risks associated with cost over-runs, operating cost inflation, labor availability and productivity, supplier and contractor pricing and performance, and potential claims for liquidated damages. For example, we generally rely on third-party subcontractors and equipment providers to assist us with the completion of our contracts. To the extent that we cannot engage subcontractors or acquire equipment or materials, our ability to complete a project in a timely fashion or at a profit may be impaired. If the amount we are required to pay for these goods and services exceeds the amount we have estimated in bidding for fixed-price work, we could experience losses in the performance of these contracts. These delays and additional costs may be substantial, and we may be required to compensate the NOCs for these delays. This may reduce the profit to be realized or result in a loss on a project. Currently, long-term, fixed price contracts with NOCs do not comprise a significant portion of our business. However, in the future, based on the anticipated growth of NOCs, we expect our business with NOCs to grow relative to our other business, with these types of contracts likely comprising a more significant portion of our business.
Acquisitions, dispositions, investments, and joint ventures We continually seek opportunities to maximize efficiency and value through various transactions,
including purchases or sales of assets, businesses, investments, or joint ventures. These transactions are intended to result in the realization of savings, the creation of efficiencies, the generation of cash or income, or the reduction of risk. Acquisition transactions may be financed by additional borrowings or by the issuance of our common stock. These transactions may also affect our consolidated results of operations.
These transactions also involve risks, and we cannot ensure that: - any acquisitions would result in an increase in income; - any acquisitions would be successfully integrated into our operations and internal
controls; - the due diligence prior to an acquisition would uncover situations that could result in
legal exposure, including under the FCPA, or that we will appropriately quantify the exposure from known risks;
- any disposition would not result in decreased earnings, revenue, or cash flow; - use of cash for acquisitions would not adversely affect our cash available for capital
expenditures and other uses; - any dispositions, investments, acquisitions, or integrations would not divert management
resources; or - any dispositions, investments, acquisitions, or integrations would not have a material
adverse effect on our results of operations or financial condition. We conduct some operations through joint ventures, where control may be shared with unaffiliated
third parties. As with any joint venture arrangement, differences in views among the joint venture participants may result in delayed decisions or in failures to agree on major issues. We also cannot control the actions of our joint venture partners, including any nonperformance, default, or bankruptcy of our joint venture partners. These factors could potentially materially and adversely affect the business and operations of the joint venture and, in turn, our business and operations.
43
Environmental requirements Our businesses are subject to a variety of environmental laws, rules, and regulations in the United
States and other countries, including those covering hazardous materials and requiring emission performance standards for facilities. For example, our well service operations routinely involve the handling of significant amounts of waste materials, some of which are classified as hazardous substances. We also store, transport, and use radioactive and explosive materials in certain of our operations. Environmental requirements include, for example, those concerning: - the containment and disposal of hazardous substances, oilfield waste, and other waste
materials; - the importation and use of radioactive materials; - the use of underground storage tanks; and - the use of underground injection wells.
Environmental and other similar requirements generally are becoming increasingly strict. Sanctions for failure to comply with these requirements, many of which may be applied retroactively, may include: - administrative, civil, and criminal penalties; - revocation of permits to conduct business; and - corrective action orders, including orders to investigate and/or clean up contamination.
Failure on our part to comply with applicable environmental requirements could have a material adverse effect on our consolidated financial condition. We are also exposed to costs arising from environmental compliance, including compliance with changes in or expansion of environmental requirements, which could have a material adverse effect on our business, financial condition, operating results, or cash flows.
We are exposed to claims under environmental requirements and, from time to time, such claims have been made against us. In the United States, environmental requirements and regulations typically impose strict liability. Strict liability means that in some situations we could be exposed to liability for cleanup costs, natural resource damages, and other damages as a result of our conduct that was lawful at the time it occurred or the conduct of prior operators or other third parties. Liability for damages arising as a result of environmental laws could be substantial and could have a material adverse effect on our consolidated results of operations.
We are periodically notified of potential liabilities at state and federal superfund sites. These potential liabilities may arise from both historical Halliburton operations and the historical operations of companies that we have acquired. Our exposure at these sites may be materially impacted by unforeseen adverse developments both in the final remediation costs and with respect to the final allocation among the various parties involved at the sites. For any particular federal or state superfund site, since our estimated liability is typically within a range and our accrued liability may be the amount on the low end of that range, our actual liability could eventually be well in excess of the amount accrued. The relevant regulatory agency may bring suit against us for amounts in excess of what we have accrued and what we believe is our proportionate share of remediation costs at any superfund site. We also could be subject to third-party claims, including punitive damages, with respect to environmental matters for which we have been named as a potentially responsible party.
44
Changes in environmental requirements may negatively impact demand for our services. For example, oil and natural gas exploration and production may decline as a result of environmental requirements (including land use policies responsive to environmental concerns). State, national, and international governments and agencies have been evaluating climate-related legislation and other regulatory initiatives that would restrict emissions of greenhouse gases in areas in which we conduct business. Because our business depends on the level of activity in the oil and natural gas industry, existing or future laws, regulations, treaties or international agreements related to greenhouse gases and climate change, including incentives to conserve energy or use alternative energy sources, could have a negative impact on our business if such laws, regulations, treaties, or international agreements reduce the worldwide demand for oil and natural gas. Likewise, such restrictions may result in additional compliance obligations with respect to the release, capture, and use of carbon dioxide that could have an adverse effect on our results of operations, liquidity, and financial condition.
We are a leading provider of hydraulic fracturing services, a process that creates fractures extending from the well bore through the rock formation to enable natural gas or oil to move more easily through the rock pores to a production well. Bills pending in the United States House and Senate have asserted that chemicals used in the fracturing process could adversely affect drinking water supplies. The proposed legislation would require the reporting and public disclosure of chemicals used in the fracturing process. This legislation, if adopted, could establish an additional level of regulation at the federal level that could lead to operational delays and increased operating costs. The adoption of any future federal or state laws or implementing regulations imposing reporting obligations on, or otherwise limiting, the hydraulic fracturing process could make it more difficult to complete natural gas and oil wells and could have an adverse impact on our future results of operations, liquidity, and financial condition.
Law and regulatory requirements In the countries in which we conduct business, we are subject to multiple and, at times,
inconsistent regulatory regimes, including those that govern our use of radioactive materials, explosives, and chemicals in the course of our operations. Various national and international regulatory regimes govern the shipment of these items. Many countries, but not all, impose special controls upon the export and import of radioactive materials, explosives, and chemicals. Our ability to do business is subject to maintaining required licenses and complying with these multiple regulatory requirements applicable to these special products. In addition, the various laws governing import and export of both products and technology apply to a wide range of services and products we offer. In turn, this can affect our employment practices of hiring people of different nationalities because these laws may prohibit or limit access to some products or technology by employees of various nationalities. Changes in, compliance with, or our failure to comply with these laws may negatively impact our ability to provide services in, make sales of equipment to, and transfer personnel or equipment among some of the countries in which we operate and could have a material adverse affect on the results of operations.
Raw materials Raw materials essential to our business are normally readily available. Market conditions can
trigger constraints in the supply chain of certain raw materials, such as sand, cement, and specialty metals. The majority of our risk associated with supply chain constraints occurs in those situations where we have a relationship with a single supplier for a particular resource.
Intellectual property rights We rely on a variety of intellectual property rights that we use in our services and products. We
may not be able to successfully preserve these intellectual property rights in the future, and these rights could be invalidated, circumvented, or challenged. In addition, the laws of some foreign countries in which our services and products may be sold do not protect intellectual property rights to the same extent as the laws of the United States. Our failure to protect our proprietary information and any successful intellectual property challenges or infringement proceedings against us could materially and adversely affect our competitive position.
45
Technology The market for our services and products is characterized by continual technological developments
to provide better and more reliable performance and services. If we are not able to design, develop, and produce commercially competitive products and to implement commercially competitive services in a timely manner in response to changes in technology, our business and revenue could be materially and adversely affected, and the value of our intellectual property may be reduced. Likewise, if our proprietary technologies, equipment and facilities, or work processes become obsolete, we may no longer be competitive, and our business and revenue could be materially and adversely affected.
Reliance on management We depend greatly on the efforts of our executive officers and other key employees to manage our
operations. The loss or unavailability of any of our executive officers or other key employees could have a material adverse effect on our business.
Technical personnel Many of the services that we provide and the products that we sell are complex and highly
engineered and often must perform or be performed in harsh conditions. We believe that our success depends upon our ability to employ and retain technical personnel with the ability to design, utilize, and enhance these services and products. In addition, our ability to expand our operations depends in part on our ability to increase our skilled labor force. A significant increase in the wages paid by competing employers could result in a reduction of our skilled labor force, increases in the wage rates that we must pay, or both. If either of these events were to occur, our cost structure could increase, our margins could decrease, and any growth potential could be impaired.
Weather Our business could be materially and adversely affected by severe weather, particularly in the Gulf
of Mexico where we have operations. Repercussions of severe weather conditions may include: - evacuation of personnel and curtailment of services; - weather-related damage to offshore drilling rigs resulting in suspension of operations; - weather-related damage to our facilities and project work sites; - inability to deliver materials to jobsites in accordance with contract schedules; and - loss of productivity. Because demand for natural gas in the United States drives a significant amount of our business, warmer than normal winters in the United States are detrimental to the demand for our services to natural gas producers.
46
MANAGEMENT’S REPORT ON INTERNAL CONTROL OVER FINANCIAL REPORTING
The management of Halliburton Company is responsible for establishing and maintaining adequate internal control over financial reporting as defined in the Securities Exchange Act Rule 13a-15(f).
Internal control over financial reporting, no matter how well designed, has inherent limitations. Therefore, even those systems determined to be effective can provide only reasonable assurance with respect to financial statement preparation and presentation. Further, because of changes in conditions, the effectiveness of internal control over financial reporting may vary over time.
Under the supervision and with the participation of our management, including our chief executive officer and chief financial officer, we conducted an evaluation to assess the effectiveness of our internal control over financial reporting as of December 31, 2009 based upon criteria set forth in the Internal Control - Integrated Framework issued by the Committee of Sponsoring Organizations of the Treadway Commission. Based on our assessment, we believe that, as of December 31, 2009, our internal control over financial reporting is effective.
The effectiveness of Halliburton’s internal control over financial reporting as of December 31, 2009 has been audited by KPMG LLP, an independent registered public accounting firm, as stated in their report that is included herein.
HALLIBURTON COMPANY by
/s/ David J. Lesar /s/ Mark A. McCollum David J. Lesar Mark A. McCollum
Chairman of the Board, Executive Vice President and President, and Chief Executive Officer Chief Financial Officer
47
REPORT OF INDEPENDENT REGISTERED PUBLIC ACCOUNTING FIRM
The Board of Directors and Shareholders Halliburton Company: We have audited the accompanying consolidated balance sheets of Halliburton Company and subsidiaries as of December 31, 2009 and 2008, and the related consolidated statements of operations, shareholders’ equity, and cash flows for each of the years in the three-year period ended December 31, 2009. These consolidated financial statements are the responsibility of the Company’s management. Our responsibility is to express an opinion on these consolidated financial statements based on our audits. We conducted our audits in accordance with the standards of the Public Company Accounting Oversight Board (United States). Those standards require that we plan and perform the audit to obtain reasonable assurance about whether the financial statements are free of material misstatement. An audit includes examining, on a test basis, evidence supporting the amounts and disclosures in the financial statements. An audit also includes assessing the accounting principles used and significant estimates made by management, as well as evaluating the overall financial statement presentation. We believe that our audits provide a reasonable basis for our opinion. In our opinion, the consolidated financial statements referred to above present fairly, in all material respects, the financial position of Halliburton Company and subsidiaries as of December 31, 2009 and 2008, and the results of their operations and their cash flows for each of the years in the three-year period ended December 31, 2009, in conformity with U.S. generally accepted accounting principles. As discussed in Note 14, to the consolidated financial statements, the Company changed its method of accounting for instruments granted in share-based payment transactions as participating securities, its method of accounting for convertible debt, and its method of accounting for non-controlling interests beginning on January 1, 2009. We also have audited, in accordance with the standards of the Public Company Accounting Oversight Board (United States), Halliburton Company’s internal control over financial reporting as of December 31, 2009, based on criteria established in Internal Control - Integrated Framework issued by the Committee of Sponsoring Organizations of the Treadway Commission (COSO), and our report dated February 17, 2010 expressed an unqualified opinion on the effectiveness of the Company’s internal control over financial reporting. /s/ KPMG LLP Houston, Texas February 17, 2010

48
REPORT OF INDEPENDENT REGISTERED PUBLIC ACCOUNTING FIRM The Board of Directors and Shareholders Halliburton Company: We have audited Halliburton Company’s internal control over financial reporting as of December 31, 2009, based on criteria established in Internal Control - Integrated Framework issued by the Committee of Sponsoring Organizations of the Treadway Commission (COSO). Halliburton Company's management is responsible for maintaining effective internal control over financial reporting and for its assessment of the effectiveness of internal control over financial reporting, included in the accompanying Management’s Report on Internal Control Over Financial Reporting. Our responsibility is to express an opinion on the Company’s internal control over financial reporting based on our audit. We conducted our audit in accordance with the standards of the Public Company Accounting Oversight Board (United States). Those standards require that we plan and perform the audit to obtain reasonable assurance about whether effective internal control over financial reporting was maintained in all material respects. Our audit included obtaining an understanding of internal control over financial reporting, assessing the risk that a material weakness exists, and testing and evaluating the design and operating effectiveness of internal control based on the assessed risk. Our audit also included performing such other procedures as we considered necessary in the circumstances. We believe that our audit provides a reasonable basis for our opinion. A company's internal control over financial reporting is a process designed to provide reasonable assurance regarding the reliability of financial reporting and the preparation of financial statements for external purposes in accordance with generally accepted accounting principles. A company's internal control over financial reporting includes those policies and procedures that (1) pertain to the maintenance of records that, in reasonable detail, accurately and fairly reflect the transactions and dispositions of the assets of the company; (2) provide reasonable assurance that transactions are recorded as necessary to permit preparation of financial statements in accordance with generally accepted accounting principles, and that receipts and expenditures of the company are being made only in accordance with authorizations of management and directors of the company; and (3) provide reasonable assurance regarding prevention or timely detection of unauthorized acquisition, use, or disposition of the company’s assets that could have a material effect on the financial statements. Because of its inherent limitations, internal control over financial reporting may not prevent or detect misstatements. Also, projections of any evaluation of effectiveness to future periods are subject to the risk that controls may become inadequate because of changes in conditions, or that the degree of compliance with the policies or procedures may deteriorate. In our opinion, Halliburton Company maintained, in all material respects, effective internal control over financial reporting as of December 31, 2009, based on criteria established in Internal Control - Integrated Framework issued by COSO. We also have audited, in accordance with the standards of the Public Company Accounting Oversight Board (United States), the consolidated balance sheets of Halliburton Company as of December 31, 2009 and 2008, and the related consolidated statements of operations, shareholders’ equity, and cash flows for each of the years in the three-year period ended December 31, 2009, and our report dated February 17, 2010 expressed an unqualified opinion on those consolidated financial statements. /s/ KPMG LLP Houston, Texas February 17, 2010
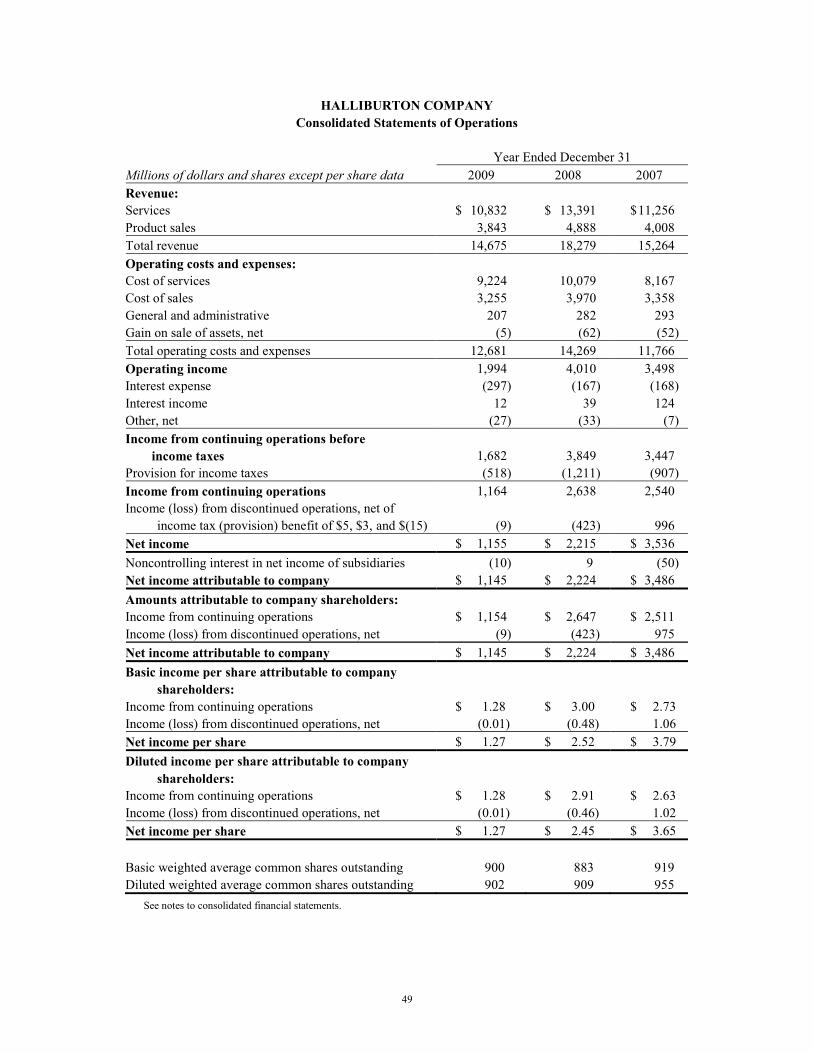
49
HALLIBURTON COMPANY Consolidated Statements of Operations
Year Ended December 31
Millions of dollars and shares except per share data 2009 2008 2007 Revenue: Services $ 10,832 $ 13,391 $ 11,256 Product sales 3,843 4,888 4,008 Total revenue 14,675 18,279 15,264 Operating costs and expenses: Cost of services 9,224 10,079 8,167 Cost of sales 3,255 3,970 3,358 General and administrative 207 282 293 Gain on sale of assets, net (5) (62) (52) Total operating costs and expenses 12,681 14,269 11,766 Operating income 1,994 4,010 3,498 Interest expense (297) (167) (168) Interest income 12 39 124 Other, net (27) (33) (7) Income from continuing operations before
income taxes 1,682 3,849 3,447 Provision for income taxes (518) (1,211) (907) Income from continuing operations 1,164 2,638 2,540 Income (loss) from discontinued operations, net of
income tax (provision) benefit of $5, $3, and $(15) (9) (423) 996 Net income $ 1,155 $ 2,215 $ 3,536 Noncontrolling interest in net income of subsidiaries (10) 9 (50) Net income attributable to company $ 1,145 $ 2,224 $ 3,486 Amounts attributable to company shareholders: Income from continuing operations $ 1,154 $ 2,647 $ 2,511 Income (loss) from discontinued operations, net (9) (423) 975 Net income attributable to company $ 1,145 $ 2,224 $ 3,486 Basic income per share attributable to company
shareholders: Income from continuing operations $ 1.28 $ 3.00 $ 2.73 Income (loss) from discontinued operations, net (0.01) (0.48) 1.06 Net income per share $ 1.27 $ 2.52 $ 3.79 Diluted income per share attributable to company
shareholders: Income from continuing operations $ 1.28 $ 2.91 $ 2.63 Income (loss) from discontinued operations, net (0.01) (0.46) 1.02 Net income per share $ 1.27 $ 2.45 $ 3.65
Basic weighted average common shares outstanding 900 883 919 Diluted weighted average common shares outstanding 902 909 955
See notes to consolidated financial statements.
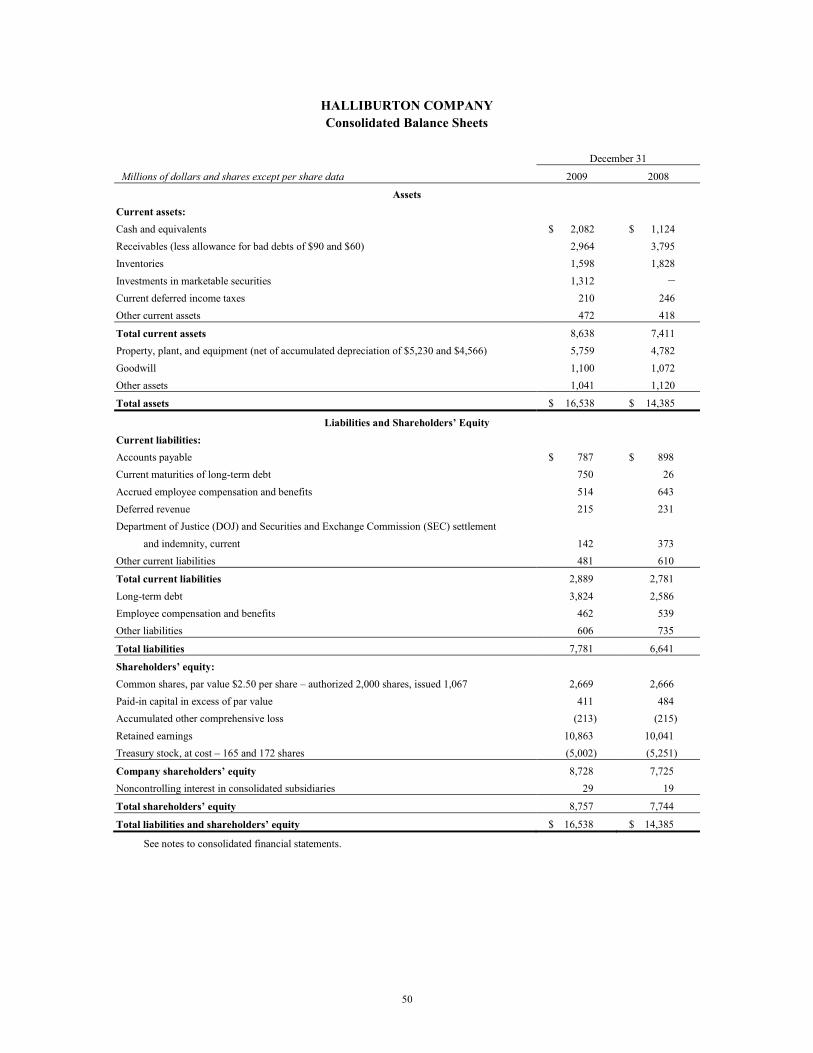
50
HALLIBURTON COMPANY Consolidated Balance Sheets
December 31
Millions of dollars and shares except per share data 2009 2008
Assets Current assets: Cash and equivalents $ 2,082 $ 1,124 Receivables (less allowance for bad debts of $90 and $60) 2,964 3,795 Inventories 1,598 1,828 Investments in marketable securities 1,312 –
Current deferred income taxes 210 246 Other current assets 472 418
Total current assets 8,638 7,411 Property, plant, and equipment (net of accumulated depreciation of $5,230 and $4,566) 5,759 4,782 Goodwill 1,100 1,072 Other assets 1,041 1,120
Total assets $ 16,538 $ 14,385
Liabilities and Shareholders’ Equity Current liabilities: Accounts payable $ 787 $ 898 Current maturities of long-term debt 750 26 Accrued employee compensation and benefits 514 643 Deferred revenue 215 231 Department of Justice (DOJ) and Securities and Exchange Commission (SEC) settlement and indemnity, current 142 373 Other current liabilities 481 610
Total current liabilities 2,889 2,781 Long-term debt 3,824 2,586 Employee compensation and benefits 462 539 Other liabilities 606 735
Total liabilities 7,781 6,641
Shareholders’ equity: Common shares, par value $2.50 per share – authorized 2,000 shares, issued 1,067 2,669 2,666 Paid-in capital in excess of par value 411 484 Accumulated other comprehensive loss (213) (215) Retained earnings 10,863 10,041 Treasury stock, at cost – 165 and 172 shares (5,002) (5,251)
Company shareholders’ equity 8,728 7,725 Noncontrolling interest in consolidated subsidiaries 29 19
Total shareholders’ equity 8,757 7,744
Total liabilities and shareholders’ equity $ 16,538 $ 14,385
See notes to consolidated financial statements.
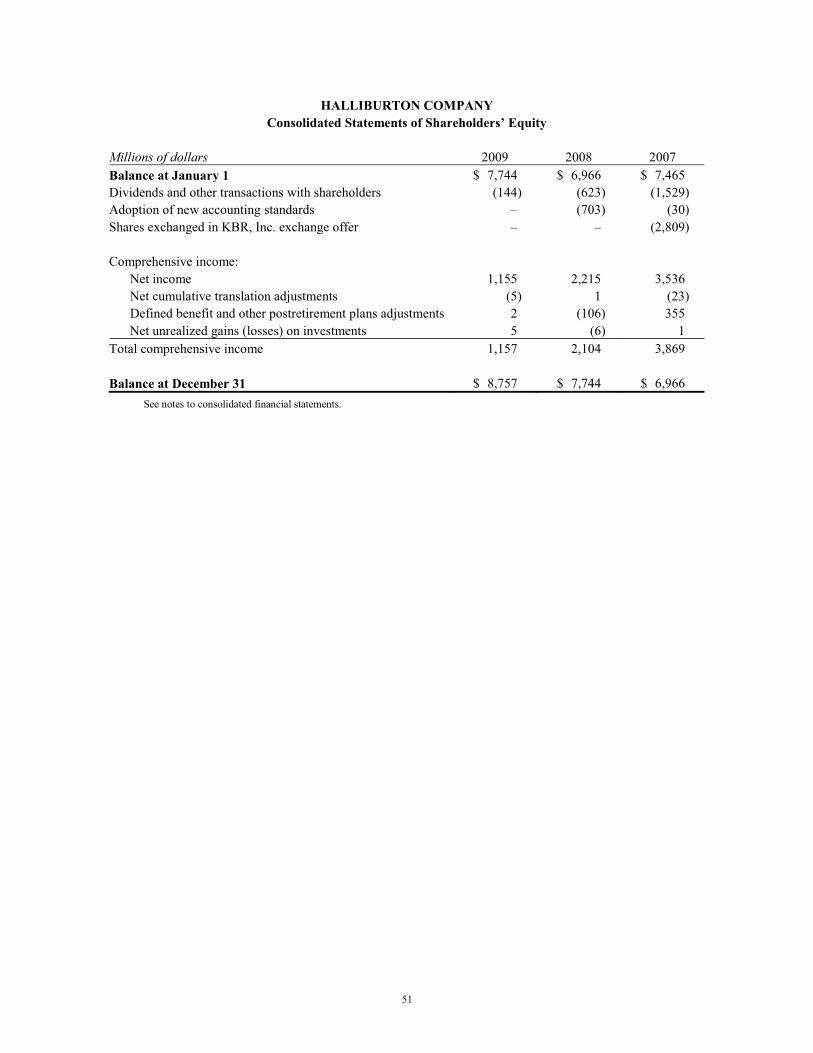
51
HALLIBURTON COMPANY Consolidated Statements of Shareholders’ Equity
Millions of dollars 2009 2008 2007 Balance at January 1 $ 7,744 $ 6,966 $ 7,465 Dividends and other transactions with shareholders (144) (623) (1,529) Adoption of new accounting standards – (703) (30) Shares exchanged in KBR, Inc. exchange offer – – (2,809)
Comprehensive income:
Net income 1,155 2,215 3,536 Net cumulative translation adjustments (5) 1 (23) Defined benefit and other postretirement plans adjustments 2 (106) 355 Net unrealized gains (losses) on investments 5 (6) 1
Total comprehensive income 1,157 2,104 3,869
Balance at December 31 $ 8,757 $ 7,744 $ 6,966 See notes to consolidated financial statements.
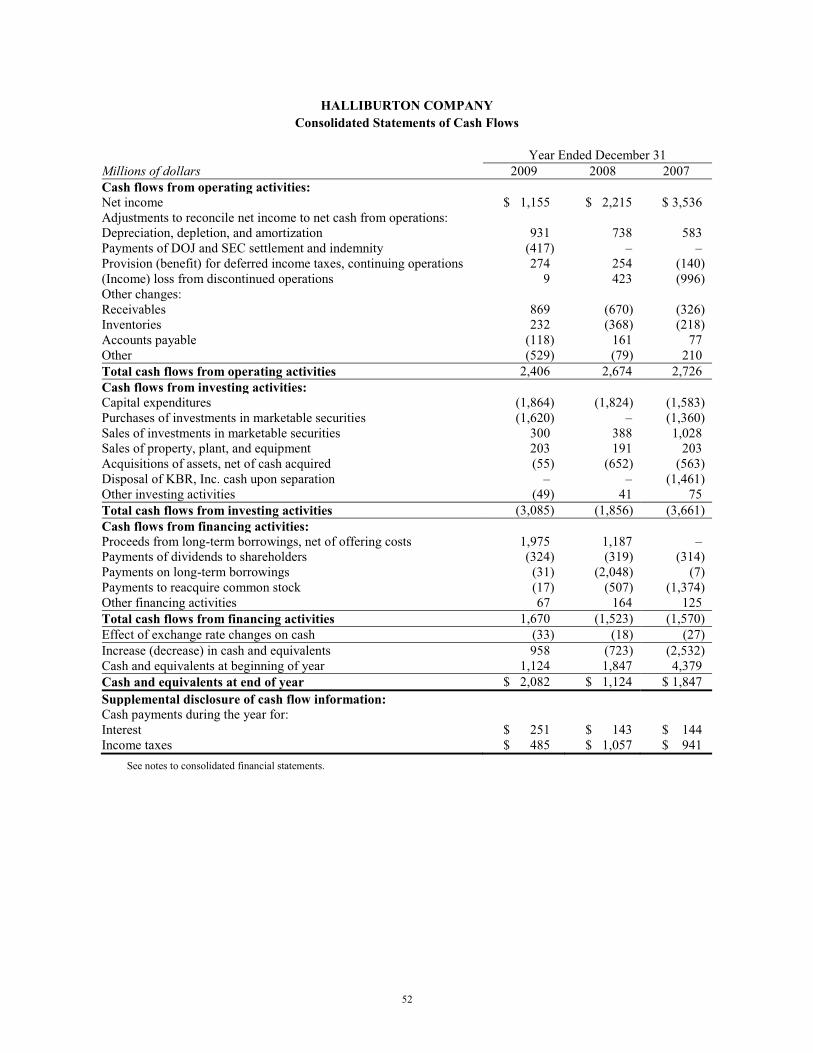
52
HALLIBURTON COMPANY Consolidated Statements of Cash Flows
Year Ended December 31
Millions of dollars 2009 2008 2007 Cash flows from operating activities: Net income $ 1,155 $ 2,215 $ 3,536 Adjustments to reconcile net income to net cash from operations: Depreciation, depletion, and amortization 931 738 583 Payments of DOJ and SEC settlement and indemnity (417) – – Provision (benefit) for deferred income taxes, continuing operations 274 254 (140) (Income) loss from discontinued operations 9 423 (996) Other changes: Receivables 869 (670) (326) Inventories 232 (368) (218) Accounts payable (118) 161 77 Other (529) (79) 210 Total cash flows from operating activities 2,406 2,674 2,726 Cash flows from investing activities: Capital expenditures (1,864) (1,824) (1,583) Purchases of investments in marketable securities (1,620) – (1,360) Sales of investments in marketable securities 300 388 1,028 Sales of property, plant, and equipment 203 191 203 Acquisitions of assets, net of cash acquired (55) (652) (563) Disposal of KBR, Inc. cash upon separation – – (1,461) Other investing activities (49) 41 75 Total cash flows from investing activities (3,085) (1,856) (3,661) Cash flows from financing activities: Proceeds from long-term borrowings, net of offering costs 1,975 1,187 – Payments of dividends to shareholders (324) (319) (314) Payments on long-term borrowings (31) (2,048) (7) Payments to reacquire common stock (17) (507) (1,374) Other financing activities 67 164 125 Total cash flows from financing activities 1,670 (1,523) (1,570) Effect of exchange rate changes on cash (33) (18) (27) Increase (decrease) in cash and equivalents 958 (723) (2,532) Cash and equivalents at beginning of year 1,124 1,847 4,379 Cash and equivalents at end of year $ 2,082 $ 1,124 $ 1,847 Supplemental disclosure of cash flow information: Cash payments during the year for: Interest $ 251 $ 143 $ 144 Income taxes $ 485 $ 1,057 $ 941
See notes to consolidated financial statements.
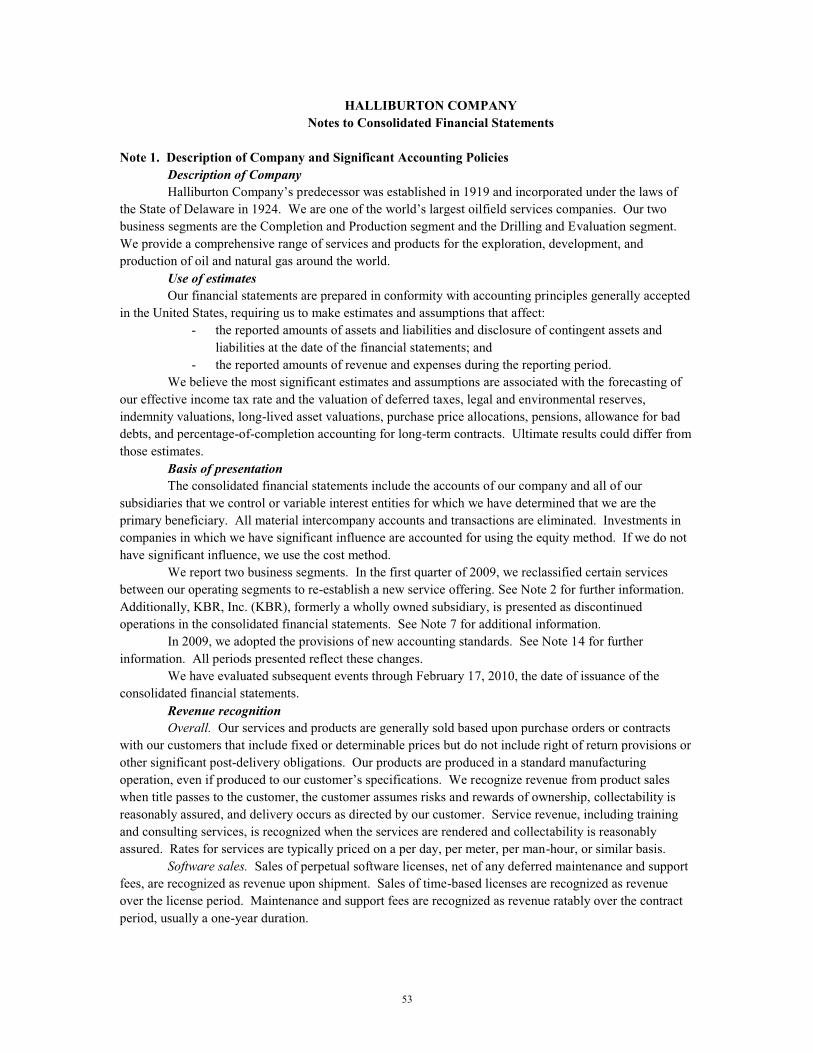
53
HALLIBURTON COMPANY Notes to Consolidated Financial Statements
Note 1. Description of Company and Significant Accounting Policies
Description of Company Halliburton Company’s predecessor was established in 1919 and incorporated under the laws of
the State of Delaware in 1924. We are one of the world’s largest oilfield services companies. Our two business segments are the Completion and Production segment and the Drilling and Evaluation segment. We provide a comprehensive range of services and products for the exploration, development, and production of oil and natural gas around the world.
Use of estimates Our financial statements are prepared in conformity with accounting principles generally accepted
in the United States, requiring us to make estimates and assumptions that affect: - the reported amounts of assets and liabilities and disclosure of contingent assets and
liabilities at the date of the financial statements; and - the reported amounts of revenue and expenses during the reporting period.
We believe the most significant estimates and assumptions are associated with the forecasting of our effective income tax rate and the valuation of deferred taxes, legal and environmental reserves, indemnity valuations, long-lived asset valuations, purchase price allocations, pensions, allowance for bad debts, and percentage-of-completion accounting for long-term contracts. Ultimate results could differ from those estimates.
Basis of presentation The consolidated financial statements include the accounts of our company and all of our
subsidiaries that we control or variable interest entities for which we have determined that we are the primary beneficiary. All material intercompany accounts and transactions are eliminated. Investments in companies in which we have significant influence are accounted for using the equity method. If we do not have significant influence, we use the cost method.
We report two business segments. In the first quarter of 2009, we reclassified certain services between our operating segments to re-establish a new service offering. See Note 2 for further information. Additionally, KBR, Inc. (KBR), formerly a wholly owned subsidiary, is presented as discontinued operations in the consolidated financial statements. See Note 7 for additional information.
In 2009, we adopted the provisions of new accounting standards. See Note 14 for further information. All periods presented reflect these changes.
We have evaluated subsequent events through February 17, 2010, the date of issuance of the consolidated financial statements.
Revenue recognition Overall. Our services and products are generally sold based upon purchase orders or contracts
with our customers that include fixed or determinable prices but do not include right of return provisions or other significant post-delivery obligations. Our products are produced in a standard manufacturing operation, even if produced to our customer’s specifications. We recognize revenue from product sales when title passes to the customer, the customer assumes risks and rewards of ownership, collectability is reasonably assured, and delivery occurs as directed by our customer. Service revenue, including training and consulting services, is recognized when the services are rendered and collectability is reasonably assured. Rates for services are typically priced on a per day, per meter, per man-hour, or similar basis.
Software sales. Sales of perpetual software licenses, net of any deferred maintenance and support fees, are recognized as revenue upon shipment. Sales of time-based licenses are recognized as revenue over the license period. Maintenance and support fees are recognized as revenue ratably over the contract period, usually a one-year duration.
54
Percentage of completion. Revenue from certain long-term, integrated project management contracts to provide well construction and completion services is reported on the percentage-of-completion method of accounting. Progress is generally based upon physical progress related to contractually defined units of work. Physical percent complete is determined as a combination of input and output measures as deemed appropriate by the circumstances. All known or anticipated losses on contracts are provided for when they become evident. Cost adjustments that are in the process of being negotiated with customers for extra work or changes in the scope of work are included in revenue when collection is deemed probable.
Research and development Research and development costs are expensed as incurred. Research and development costs were
$325 million in 2009, $326 million in 2008, and $301 million in 2007. Cash equivalents We consider all highly liquid investments with an original maturity of three months or less to be
cash equivalents. Inventories Inventories are stated at the lower of cost or market. Cost represents invoice or production cost for
new items and original cost less allowance for condition for used material returned to stock. Production cost includes material, labor, and manufacturing overhead. Some domestic manufacturing and field service finished products and parts inventories for drill bits, completion products, and bulk materials are recorded using the last-in, first-out method. The remaining inventory is recorded on the average cost method. We regularly review inventory quantities on hand and record provisions for excess or obsolete inventory based primarily on historical usage, estimated product demand, and technological developments.
Allowance for bad debts We establish an allowance for bad debts through a review of several factors, including historical
collection experience, current aging status of the customer accounts, and financial condition of our customers.
Property, plant, and equipment Other than those assets that have been written down to their fair values due to impairment,
property, plant, and equipment are reported at cost less accumulated depreciation, which is generally provided on the straight-line method over the estimated useful lives of the assets. Accelerated depreciation methods are also used for tax purposes, wherever permitted. Upon sale or retirement of an asset, the related costs and accumulated depreciation are removed from the accounts and any gain or loss is recognized. Planned major maintenance costs are generally expensed as incurred. Expenditures for additions, modifications, and conversions are capitalized when they increase the value or extend the useful life of the asset.
55
Goodwill and other intangible assets We record as goodwill the excess purchase price over the fair value of the tangible and identifiable
intangible assets acquired. During 2009, we recorded an immaterial amount of goodwill from acquisitions. During 2008, we recorded an additional $274 million in goodwill arising from 2008 acquisitions, of which $159 million related to the Completion and Production segment and $115 million related to the Drilling and Evaluation segment. The reported amounts of goodwill for each reporting unit are reviewed for impairment on an annual basis, during the third quarter, and more frequently when negative conditions such as significant current or projected operating losses exist. The annual impairment test for goodwill is a two-step process and involves comparing the estimated fair value of each reporting unit to the reporting unit’s carrying value, including goodwill. If the fair value of a reporting unit exceeds its carrying amount, goodwill of the reporting unit is not considered impaired, and the second step of the impairment test is unnecessary. If the carrying amount of a reporting unit exceeds its fair value, the second step of the goodwill impairment test would be performed to measure the amount of impairment loss to be recorded, if any. The second step of the goodwill impairment test compares the implied fair value of the reporting unit’s goodwill with the carrying amount of that goodwill. The implied fair value of goodwill is determined in the same manner as the amount of goodwill recognized in a business combination. In other words, the estimated fair value of the reporting unit is allocated to all of the assets and liabilities of that unit (including any unrecognized intangible assets) as if the reporting unit had been acquired in a business combination and the fair value of the reporting unit was the purchase price paid. If the carrying amount of the reporting unit’s goodwill exceeds the implied fair value of that goodwill, an impairment loss is recognized in an amount equal to that excess. The fair value of each of our reporting units exceeded its carrying amount by a significant margin for 2009, 2008, and 2007. In addition, there were no triggering events that occurred in 2009, 2008, or 2007 requiring us to perform additional impairment reviews.
We amortize other identifiable intangible assets with a finite life on a straight-line basis over the period which the asset is expected to contribute to our future cash flows, ranging from 3 years to 20 years. The components of these other intangible assets generally consist of patents, license agreements, non-compete agreements, trademarks, and customer lists and contracts.
Evaluating impairment of long-lived assets When events or changes in circumstances indicate that long-lived assets other than goodwill may
be impaired, an evaluation is performed. For an asset classified as held for use, the estimated future undiscounted cash flows associated with the asset are compared to the asset’s carrying amount to determine if a write-down to fair value is required. When an asset is classified as held for sale, the asset’s book value is evaluated and adjusted to the lower of its carrying amount or fair value less cost to sell. In addition, depreciation and amortization is ceased while it is classified as held for sale.
Income taxes We recognize the amount of taxes payable or refundable for the year. In addition, deferred tax
assets and liabilities are recognized for the expected future tax consequences of events that have been recognized in the financial statements or tax returns. A valuation allowance is provided for deferred tax assets if it is more likely than not that these items will not be realized.
In assessing the realizability of deferred tax assets, management considers whether it is more likely than not that some portion or all of the deferred tax assets will not be realized. The ultimate realization of deferred tax assets is dependent upon the generation of future taxable income during the periods in which those temporary differences become deductible. Management considers the scheduled reversal of deferred tax liabilities, projected future taxable income, and tax planning strategies in making this assessment. Based upon the level of historical taxable income and projections for future taxable income over the periods in which the deferred tax assets are deductible, management believes it is more likely than not that we will realize the benefits of these deductible differences, net of the existing valuation allowances.
56
We recognize interest and penalties related to unrecognized tax benefits within the provision for income taxes on continuing operations in our consolidated statements of operations.
We generally do not provide income taxes on the undistributed earnings of non-United States subsidiaries because such earnings are intended to be reinvested indefinitely to finance foreign activities. These additional foreign earnings could be subject to additional tax if remitted, or deemed remitted, as a dividend; however, it is not practicable to estimate the additional amount, if any, of taxes payable. Taxes are provided as necessary with respect to earnings that are not permanently reinvested.
Derivative instruments At times, we enter into derivative financial transactions to hedge existing or projected exposures to
changing foreign currency exchange rates. We do not enter into derivative transactions for speculative or trading purposes. We recognize all derivatives on the balance sheet at fair value. Derivatives are adjusted to fair value and reflected through the results of operations. Gains or losses on foreign currency derivatives are included in “Other, net” in our consolidated statements of operations. Our derivatives are not designated as hedges for accounting purposes.
Foreign currency translation Foreign entities whose functional currency is the United States dollar translate monetary assets
and liabilities at year-end exchange rates, and nonmonetary items are translated at historical rates. Income and expense accounts are translated at the average rates in effect during the year, except for depreciation, cost of product sales and revenue, and expenses associated with nonmonetary balance sheet accounts, which are translated at historical rates. Gains or losses from changes in exchange rates are recognized in our consolidated statements of operations in “Other, net” in the year of occurrence. Foreign entities whose functional currency is not the United States dollar translate net assets at year-end rates and income and expense accounts at average exchange rates. Adjustments resulting from these translations are reflected in the consolidated statements of shareholders’ equity as “Net cumulative translation adjustments.”
Stock-based compensation Stock-based compensation cost is measured at the date of grant, based on the calculated fair value
of the award, and is recognized as expense over the employee’s service period, which is generally the vesting period of the equity grant. Additionally, compensation cost is recognized based on awards ultimately expected to vest, therefore, we have reduced the cost for estimated forfeitures based on historical forfeiture rates. Forfeitures are estimated at the time of grant and revised in subsequent periods to reflect actual forfeitures. See Note 10 for additional information related to stock-based compensation.
Note 2. Business Segment and Geographic Information
We operate under two divisions, which form the basis for the two operating segments we report: the Completion and Production segment and the Drilling and Evaluation segment. In the first quarter of 2009, we moved a portion of our completion tools and services from the Completion and Production segment to the Drilling and Evaluation segment to re-establish our testing and subsea services offering, which resulted in a change to our operating segments. All periods presented reflect reclassifications related to the change in operating segments.
Following is a discussion of our operating segments. Completion and Production delivers cementing, stimulation, intervention, and completion
services. This segment consists of production enhancement services, completion tools and services, and cementing services.
57
Production enhancement services include stimulation services, pipeline process services, sand control services, and well intervention services. Stimulation services optimize oil and natural gas reservoir production through a variety of pressure pumping services, nitrogen services, and chemical processes, commonly known as hydraulic fracturing and acidizing. Pipeline process services include pipeline and facility testing, commissioning, and cleaning via pressure pumping, chemical systems, specialty equipment, and nitrogen, which are provided to the midstream and downstream sectors of the energy business. Sand control services include fluid and chemical systems and pumping services for the prevention of formation sand production. Well intervention services enable live well intervention and continuous pipe deployment capabilities through the use of hydraulic workover systems and coiled tubing tools and services.
Completion tools and services include subsurface safety valves and flow control equipment, surface safety systems, packers and specialty completion equipment, intelligent completion systems, expandable liner hanger systems, sand control systems, well servicing tools, and reservoir performance services. Reservoir performance services include testing tools, real-time reservoir analysis, and data acquisition services.
Cementing services involve bonding the well and well casing while isolating fluid zones and maximizing wellbore stability. Our cementing service line also provides casing equipment.
Drilling and Evaluation provides field and reservoir modeling, drilling, evaluation, and well construction solutions that enable customers to model, measure, and optimize their well placement, stability, and reservoir evaluation activities. This segment consists of fluid services, drilling services, drill bits, wireline and perforating services, testing and subsea services, software and asset solutions, and project management services.
Fluid services provides drilling fluid systems, performance additives, completion fluids, solids control, specialized testing equipment, and waste management services for oil and natural gas drilling, completion, and workover operations.
Drilling services provides drilling systems and services. These services include directional and horizontal drilling, measurement-while-drilling, logging-while-drilling, surface data logging, multilateral systems, underbalanced applications, and rig site information systems. Our drilling systems offer directional control for precise wellbore placement while providing important measurements about the characteristics of the drill string and geological formations while drilling wells. Real-time operating capabilities enable the monitoring of well progress and aid decision-making processes.
Drill bits provides roller cone rock bits, fixed cutter bits, hole enlargement and related downhole tools and services used in drilling oil and natural gas wells. In addition, coring equipment and services are provided to acquire cores of the formation drilled for evaluation.
Wireline and perforating services include open-hole wireline services that provide information on formation evaluation, including resistivity, porosity, density, rock mechanics, and fluid sampling. Also offered are cased-hole and slickline services, which provide cement bond evaluation, reservoir monitoring, pipe evaluation, pipe recovery, mechanical services, well intervention, perforating, and borehole seismic services. Perforating services include tubing-conveyed perforating services and products. Borehole seismic services include fracture analysis and mapping.
Testing and subsea services provide acquisition and analysis of dynamic reservoir information and reservoir optimization solutions to the oil and natural gas industry utilizing downhole test tools, data acquisition services using telemetry and electronic memory recording, fluid sampling, surface well testing, subsea safety systems, and reservoir engineering services.
Software and asset solutions is a supplier of integrated exploration, drilling, and production software information systems, as well as consulting and data management services for the upstream oil and natural gas industry.
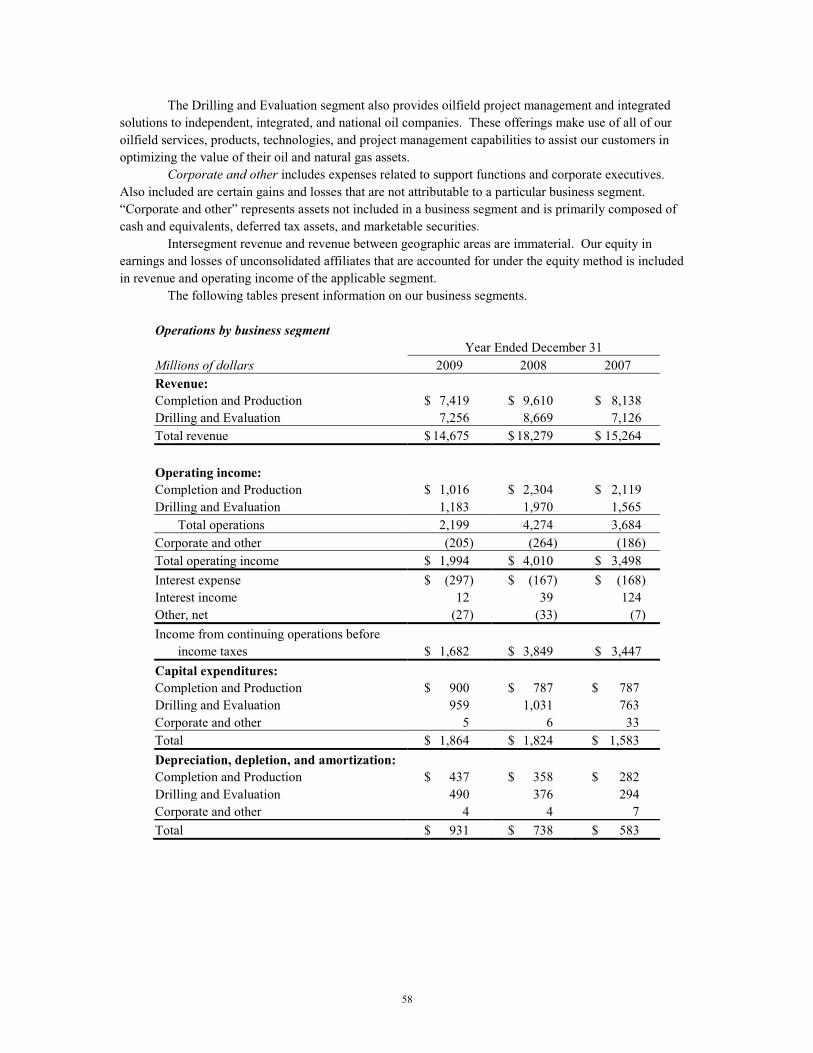
58
The Drilling and Evaluation segment also provides oilfield project management and integrated solutions to independent, integrated, and national oil companies. These offerings make use of all of our oilfield services, products, technologies, and project management capabilities to assist our customers in optimizing the value of their oil and natural gas assets.
Corporate and other includes expenses related to support functions and corporate executives. Also included are certain gains and losses that are not attributable to a particular business segment. “Corporate and other” represents assets not included in a business segment and is primarily composed of cash and equivalents, deferred tax assets, and marketable securities.
Intersegment revenue and revenue between geographic areas are immaterial. Our equity in earnings and losses of unconsolidated affiliates that are accounted for under the equity method is included in revenue and operating income of the applicable segment.
The following tables present information on our business segments.
Operations by business segment Year Ended December 31 Millions of dollars 2009 2008 2007 Revenue: Completion and Production $ 7,419 $ 9,610 $ 8,138 Drilling and Evaluation 7,256 8,669 7,126 Total revenue $ 14,675 $ 18,279 $ 15,264 Operating income: Completion and Production $ 1,016 $ 2,304 $ 2,119 Drilling and Evaluation 1,183 1,970 1,565 Total operations 2,199 4,274 3,684 Corporate and other (205) (264) (186) Total operating income $ 1,994 $ 4,010 $ 3,498 Interest expense $ (297) $ (167) $ (168) Interest income 12 39 124 Other, net (27) (33) (7) Income from continuing operations before income taxes $ 1,682 $ 3,849 $ 3,447 Capital expenditures: Completion and Production $ 900 $ 787 $ 787 Drilling and Evaluation 959 1,031 763 Corporate and other 5 6 33 Total $ 1,864 $ 1,824 $ 1,583 Depreciation, depletion, and amortization: Completion and Production $ 437 $ 358 $ 282 Drilling and Evaluation 490 376 294 Corporate and other 4 4 7 Total $ 931 $ 738 $ 583
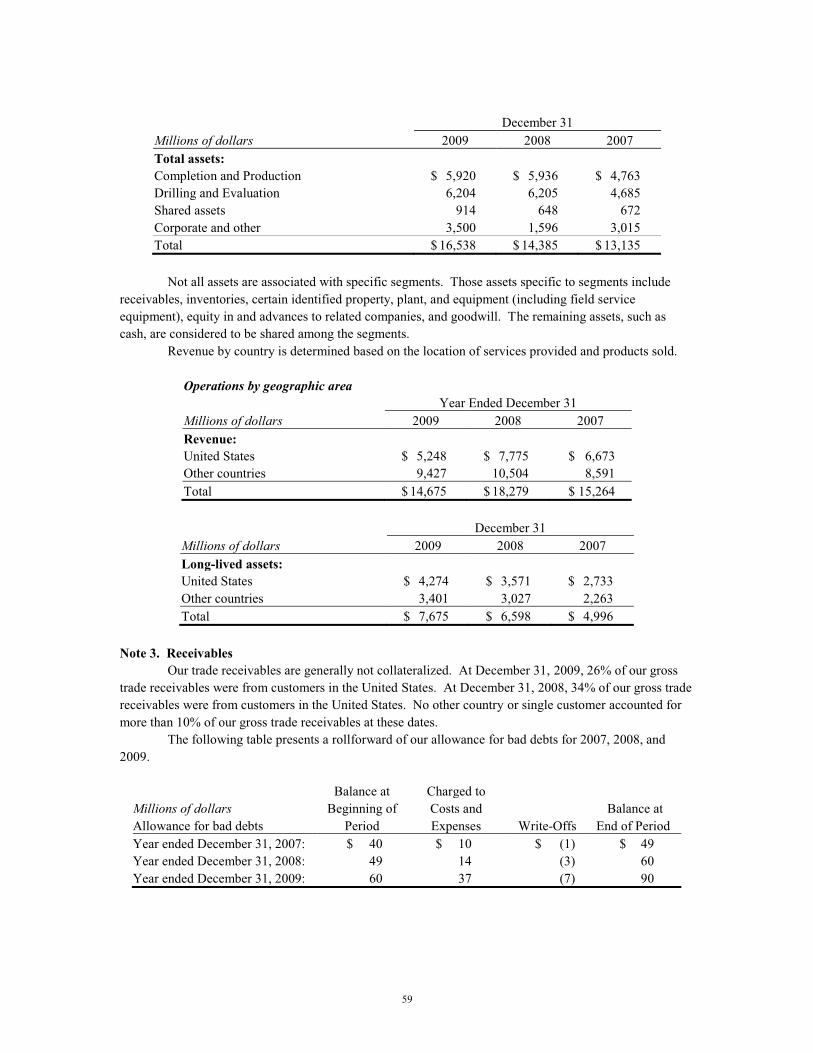
59
December 31 Millions of dollars 2009 2008 2007 Total assets: Completion and Production $ 5,920 $ 5,936 $ 4,763 Drilling and Evaluation 6,204 6,205 4,685 Shared assets 914 648 672 Corporate and other 3,500 1,596 3,015 Total $ 16,538 $ 14,385 $ 13,135
Not all assets are associated with specific segments. Those assets specific to segments include
receivables, inventories, certain identified property, plant, and equipment (including field service equipment), equity in and advances to related companies, and goodwill. The remaining assets, such as cash, are considered to be shared among the segments.
Revenue by country is determined based on the location of services provided and products sold.
Operations by geographic area Year Ended December 31 Millions of dollars 2009 2008 2007 Revenue: United States $ 5,248 $ 7,775 $ 6,673 Other countries 9,427 10,504 8,591 Total $ 14,675 $ 18,279 $ 15,264
December 31 Millions of dollars 2009 2008 2007 Long-lived assets: United States $ 4,274 $ 3,571 $ 2,733 Other countries 3,401 3,027 2,263 Total $ 7,675 $ 6,598 $ 4,996
Note 3. Receivables
Our trade receivables are generally not collateralized. At December 31, 2009, 26% of our gross trade receivables were from customers in the United States. At December 31, 2008, 34% of our gross trade receivables were from customers in the United States. No other country or single customer accounted for more than 10% of our gross trade receivables at these dates.
The following table presents a rollforward of our allowance for bad debts for 2007, 2008, and 2009.
Balance at Charged to Millions of dollars Beginning of Costs and Balance at Allowance for bad debts Period Expenses Write-Offs End of Period Year ended December 31, 2007: $ 40 $ 10 $ (1) $ 49 Year ended December 31, 2008: 49 14 (3) 60 Year ended December 31, 2009: 60 37 (7) 90
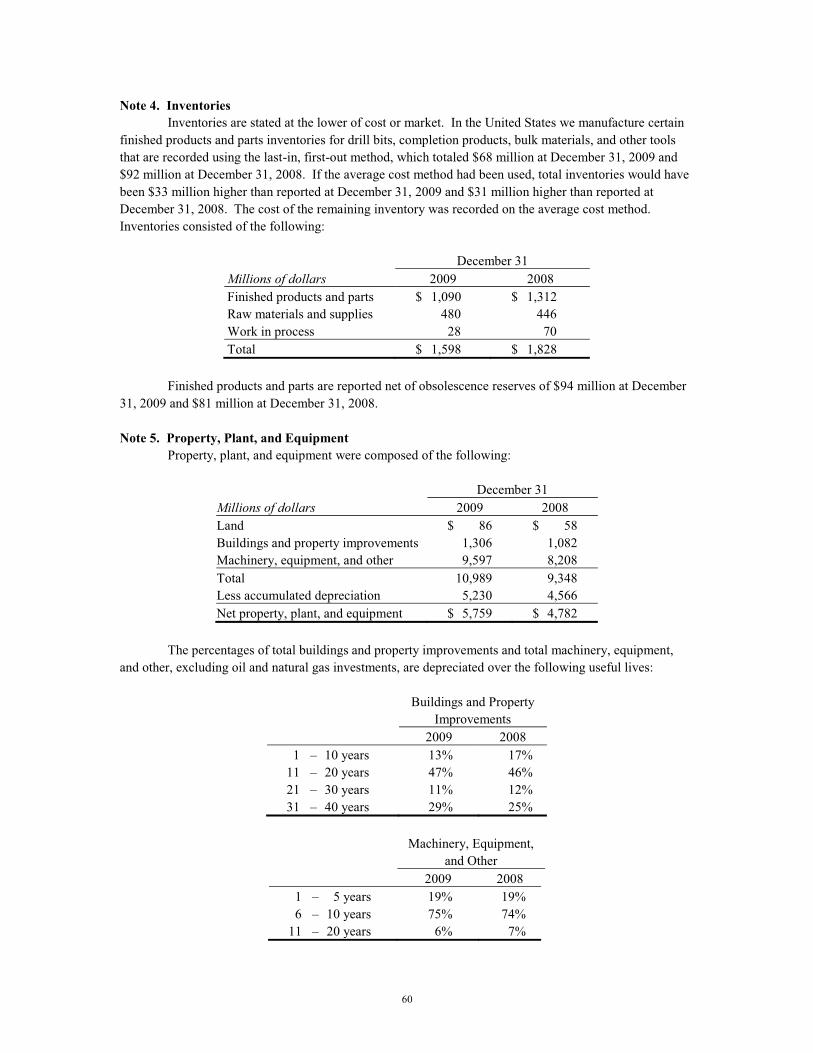
60
Note 4. Inventories Inventories are stated at the lower of cost or market. In the United States we manufacture certain
finished products and parts inventories for drill bits, completion products, bulk materials, and other tools that are recorded using the last-in, first-out method, which totaled $68 million at December 31, 2009 and $92 million at December 31, 2008. If the average cost method had been used, total inventories would have been $33 million higher than reported at December 31, 2009 and $31 million higher than reported at December 31, 2008. The cost of the remaining inventory was recorded on the average cost method. Inventories consisted of the following:
December 31 Millions of dollars 2009 2008 Finished products and parts $ 1,090 $ 1,312 Raw materials and supplies 480 446 Work in process 28 70 Total $ 1,598 $ 1,828
Finished products and parts are reported net of obsolescence reserves of $94 million at December
31, 2009 and $81 million at December 31, 2008. Note 5. Property, Plant, and Equipment
Property, plant, and equipment were composed of the following:
December 31 Millions of dollars 2009 2008 Land $ 86 $ 58 Buildings and property improvements 1,306 1,082 Machinery, equipment, and other 9,597 8,208 Total 10,989 9,348 Less accumulated depreciation 5,230 4,566 Net property, plant, and equipment $ 5,759 $ 4,782
The percentages of total buildings and property improvements and total machinery, equipment,
and other, excluding oil and natural gas investments, are depreciated over the following useful lives:
Buildings and Property Improvements 2009 2008 1 – 10 years 13% 17% 11 – 20 years 47% 46% 21 – 30 years 11% 12% 31 – 40 years 29% 25%
Machinery, Equipment, and Other 2009 2008 1 – 5 years 19% 19% 6 – 10 years 75% 74% 11 – 20 years 6% 7%
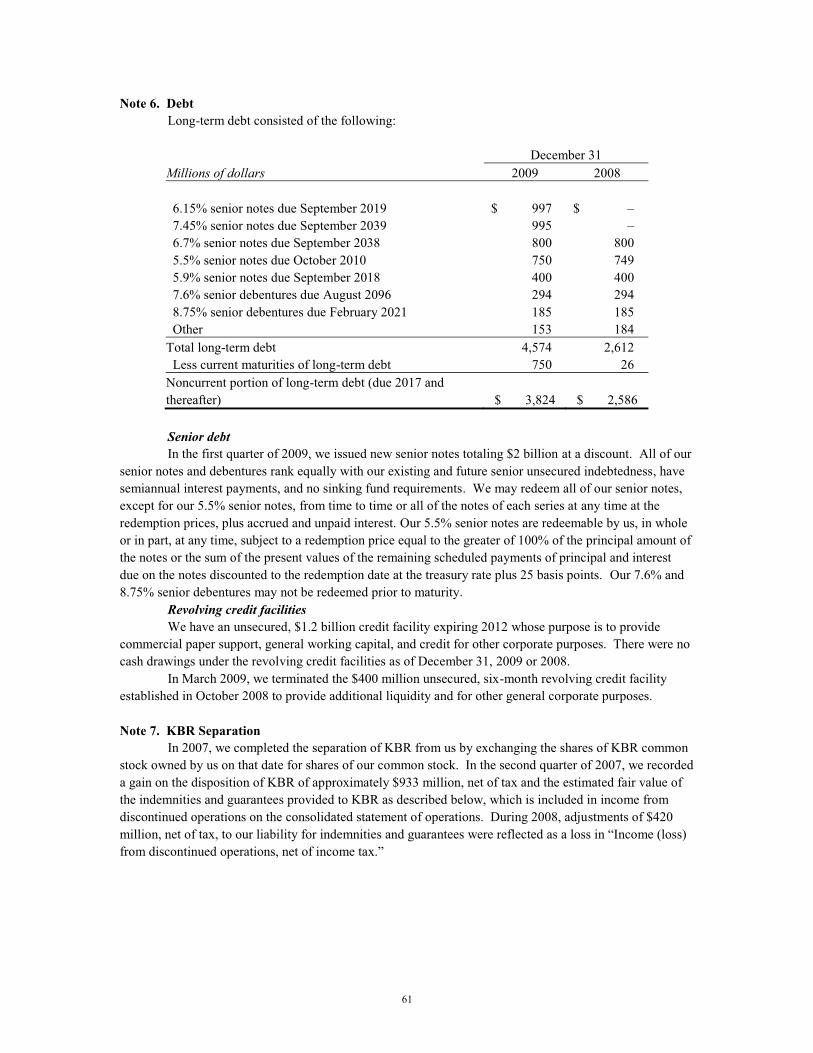
61
Note 6. Debt Long-term debt consisted of the following: December 31 Millions of dollars 2009 2008 6.15% senior notes due September 2019 $ 997 $ – 7.45% senior notes due September 2039 995 – 6.7% senior notes due September 2038 800 800 5.5% senior notes due October 2010 750 749 5.9% senior notes due September 2018 400 400 7.6% senior debentures due August 2096 294 294 8.75% senior debentures due February 2021 185 185 Other 153 184 Total long-term debt 4,574 2,612 Less current maturities of long-term debt 750 26 Noncurrent portion of long-term debt (due 2017 and thereafter) $ 3,824 $ 2,586 Senior debt In the first quarter of 2009, we issued new senior notes totaling $2 billion at a discount. All of our
senior notes and debentures rank equally with our existing and future senior unsecured indebtedness, have semiannual interest payments, and no sinking fund requirements. We may redeem all of our senior notes, except for our 5.5% senior notes, from time to time or all of the notes of each series at any time at the redemption prices, plus accrued and unpaid interest. Our 5.5% senior notes are redeemable by us, in whole or in part, at any time, subject to a redemption price equal to the greater of 100% of the principal amount of the notes or the sum of the present values of the remaining scheduled payments of principal and interest due on the notes discounted to the redemption date at the treasury rate plus 25 basis points. Our 7.6% and 8.75% senior debentures may not be redeemed prior to maturity.
Revolving credit facilities We have an unsecured, $1.2 billion credit facility expiring 2012 whose purpose is to provide
commercial paper support, general working capital, and credit for other corporate purposes. There were no cash drawings under the revolving credit facilities as of December 31, 2009 or 2008.
In March 2009, we terminated the $400 million unsecured, six-month revolving credit facility established in October 2008 to provide additional liquidity and for other general corporate purposes. Note 7. KBR Separation
In 2007, we completed the separation of KBR from us by exchanging the shares of KBR common stock owned by us on that date for shares of our common stock. In the second quarter of 2007, we recorded a gain on the disposition of KBR of approximately $933 million, net of tax and the estimated fair value of the indemnities and guarantees provided to KBR as described below, which is included in income from discontinued operations on the consolidated statement of operations. During 2008, adjustments of $420 million, net of tax, to our liability for indemnities and guarantees were reflected as a loss in “Income (loss) from discontinued operations, net of income tax.”
62
The following table presents the 2007 financial results of KBR, which are reflected as discontinued operations in our consolidated statements of operations. For accounting purposes, we ceased including KBR’s operations in our results effective March 31, 2007.
Year Ended December 31 Millions of dollars 2007 Revenue $ 2,250 Operating income $ 62 Net income $ 23 (a)
(a) Net income for 2007 represents our 81% share of KBR’s results from January 1, 2007 through March 31, 2007.
We entered into various agreements relating to the separation of KBR, including, among others, a
master separation agreement and a tax sharing agreement. The master separation agreement provides for, among other things, KBR’s responsibility for liabilities related to its business and our responsibility for liabilities unrelated to KBR’s business. We provide indemnification in favor of KBR under the master separation agreement for certain contingent liabilities, including our indemnification of KBR and any of its greater than 50%-owned subsidiaries as of November 20, 2006, the date of the master separation agreement, for: - fines or other monetary penalties or direct monetary damages, including disgorgement, as
a result of a claim made or assessed by a governmental authority in the United States, the United Kingdom, France, Nigeria, Switzerland, and/or Algeria, or a settlement thereof, related to alleged or actual violations occurring prior to November 20, 2006 of the United States Foreign Corrupt Practices Act (FCPA) or particular, analogous applicable foreign statutes, laws, rules, and regulations in connection with investigations pending as of that date, including with respect to the construction and subsequent expansion by a consortium of engineering firms comprised of Technip SA of France, Snamprogetti Netherlands B.V., JGC Corporation of Japan, and Kellogg Brown & Root LLC (TSKJ) of a natural gas liquefaction complex and related facilities at Bonny Island in Rivers State, Nigeria; and
- all out-of-pocket cash costs and expenses, or cash settlements or cash arbitration awards in lieu thereof, KBR may incur after the effective date of the master separation agreement as a result of the replacement of the subsea flowline bolts installed in connection with the Barracuda-Caratinga project.
Additionally, we provide indemnities, performance guarantees, surety bond guarantees, and letter of credit guarantees that are currently in place in favor of KBR’s customers or lenders under project contracts, credit agreements, letters of credit, and other KBR credit instruments. These indemnities and guarantees will continue until they expire at the earlier of: (1) the termination of the underlying project contract or KBR obligations thereunder; (2) the expiration of the relevant credit support instrument in accordance with its terms or release of such instrument by the customer; or (3) the expiration of the credit agreements. We have also provided a limited indemnity, with respect to FCPA and anti-trust governmental and third-party claims, to the lender parties under KBR’s revolving credit agreement expiring in December 2010. KBR has agreed to indemnify us, other than for the FCPA and Barracuda-Caratinga bolts matter, if we are required to perform under any of the indemnities or guarantees related to KBR’s revolving credit agreement, letters of credit, surety bonds, or performance guarantees described above.
63
In February 2009, the United States Department of Justice (DOJ) and Securities and Exchange Commission (SEC) FCPA investigations were resolved. The total of fines and disgorgement was $579 million, of which KBR consented to pay $20 million. As of December 31, 2009, we had paid $417 million, consisting of $240 million as a result of the DOJ settlement and the indemnity we provided to KBR upon separation and $177 million as a result of the SEC settlement. Our KBR indemnities and guarantees are primarily included in “Department of Justice (DOJ) and Securities and Exchange Commission (SEC) settlement and indemnity, current” and “Other liabilities” on the consolidated balance sheets and totaled $214 million at December 31, 2009 and $631 million at December 31, 2008. Excluding the remaining amounts necessary to resolve the DOJ and SEC investigations and under the indemnity we provided to KBR, our estimation of the remaining obligation for other indemnities and guarantees provided to KBR upon separation was $72 million at December 31, 2009. See Note 8 for further discussion of the FCPA and Barracuda-Caratinga matters.
The tax sharing agreement provides for allocations of United States and certain other jurisdiction tax liabilities between us and KBR. Note 8. Commitments and Contingencies
Foreign Corrupt Practices Act investigations Background. As a result of an ongoing FCPA investigation at the time of the KBR separation, we
provided indemnification in favor of KBR under the master separation agreement for certain contingent liabilities, including our indemnification of KBR and any of its greater than 50%-owned subsidiaries as of November 20, 2006, the date of the master separation agreement, for fines or other monetary penalties or direct monetary damages, including disgorgement, as a result of a claim made or assessed by a governmental authority in the United States, the United Kingdom, France, Nigeria, Switzerland, and/or Algeria, or a settlement thereof, related to alleged or actual violations occurring prior to November 20, 2006 of the FCPA or particular, analogous applicable foreign statutes, laws, rules, and regulations in connection with investigations pending as of that date, including with respect to the construction and subsequent expansion by TSKJ of a multibillion dollar natural gas liquefaction complex and related facilities at Bonny Island in Rivers State, Nigeria.
TSKJ is a private limited liability company registered in Madeira, Portugal whose members are Technip SA of France, Snamprogetti Netherlands B.V. (a subsidiary of Saipem SpA of Italy), JGC Corporation of Japan, and Kellogg Brown & Root LLC (a subsidiary of KBR), each of which had an approximate 25% beneficial interest in the venture. Part of KBR’s ownership in TSKJ was held through M.W. Kellogg Limited (MWKL), a United Kingdom joint venture and subcontractor on the Bonny Island project, in which KBR beneficially owns a 55% interest. TSKJ and other similarly owned entities entered into various contracts to build and expand the liquefied natural gas project for Nigeria LNG Limited, which is owned by the Nigerian National Petroleum Corporation, Shell Gas B.V., Cleag Limited (an affiliate of Total), and Agip International B.V. (an affiliate of ENI SpA of Italy).
DOJ and SEC investigations resolved. In February 2009, the FCPA investigations by the DOJ and the SEC were resolved with respect to KBR and us. The DOJ and SEC investigations resulted from allegations of improper payments to government officials in Nigeria in connection with the construction and subsequent expansion by TSKJ of the Bonny Island project.
The DOJ investigation was resolved with respect to us with a non-prosecution agreement in which the DOJ agreed not to bring FCPA or bid coordination-related charges against us with respect to the matters under investigation, and in which we agreed to continue to cooperate with the DOJ’s ongoing investigation and to refrain from and self-report certain FCPA violations. The DOJ agreement did not provide a monitor for us.
64
As part of the resolution of the SEC investigation, we retained an independent consultant to conduct a 60-day review and evaluation of our internal controls and record-keeping policies as they relate to the FCPA, and we agreed to adopt any necessary anti-bribery and foreign agent internal controls and record-keeping procedures recommended by the independent consultant. The review and evaluation were completed during the second quarter of 2009, and we have implemented the consultant’s immediate recommendations and will implement the remaining long-term recommendations by mid-year 2010. As a result of the substantial enhancement of our anti-bribery and foreign agent internal controls and record-keeping procedures prior to the review of the independent consultant, we do not expect the implementation of the consultant’s recommendations to materially impact our long-term strategy to grow our international operations. In 2010, the independent consultant will perform a 30-day, follow-up review to confirm that we have implemented the recommendations and continued the application of our current policies and procedures and to recommend any additional improvements.
KBR has agreed that our indemnification obligations with respect to the DOJ and SEC FCPA investigations have been fully satisfied.
Other matters. In addition to the DOJ and the SEC investigations, we are aware of other investigations in France, Nigeria, the United Kingdom, and Switzerland regarding the Bonny Island project. In the United Kingdom, the Serious Fraud Office (SFO) is considering civil claims or criminal prosecution under various United Kingdom laws and appears to be focused on the actions of MWKL, among others. Violations of these laws could result in fines, restitution and confiscation of revenues, among other penalties, some of which could be subject to our indemnification obligations under the master separation agreement. Our indemnity for penalties under the master separation agreement with respect to MWKL is limited to 55% of such penalties, which is KBR’s beneficial ownership interest in MWKL. MWKL is cooperating with the SFO’s investigation. Whether the SFO pursues civil or criminal claims, and the amount of any fines, restitution, confiscation of revenues or other penalties that could be assessed would depend on, among other factors, the SFO’s findings regarding the amount, timing, nature and scope of any improper payments or other activities, whether any such payments or other activities were authorized by or made with knowledge of MWKL, the amount of revenue involved, and the level of cooperation provided to the SFO during the investigations. MWKL has informed the SFO that it intends to self-report corporate liability for corruption-related offenses arising out of the Bonny Island project. Based on discussions with the SFO, MWKL expects to receive confirmation that it will be admitted into the plea negotiation process under the Guidelines on Plea Discussions in Cases of Complex or Serious Fraud, which have been issued by the Attorney General for England and Wales.
The DOJ and SEC settlements and the other ongoing investigations could result in third-party claims against us, which may include claims for special, indirect, derivative or consequential damages, damage to our business or reputation, loss of, or adverse effect on, cash flow, assets, goodwill, results of operations, business prospects, profits or business value or claims by directors, officers, employees, affiliates, advisors, attorneys, agents, debt holders, or other interest holders or constituents of us or our current or former subsidiaries.
Our indemnity of KBR and its majority-owned subsidiaries continues with respect to other investigations within the scope of our indemnity. Our indemnification obligation to KBR does not include losses resulting from third-party claims against KBR, including claims for special, indirect, derivative or consequential damages, nor does our indemnification apply to damage to KBR’s business or reputation, loss of, or adverse effect on, cash flow, assets, goodwill, results of operations, business prospects, profits or business value or claims by directors, officers, employees, affiliates, advisors, attorneys, agents, debt holders, or other interest holders or constituents of KBR or KBR’s current or former subsidiaries.
65
At this time, other than the claims being considered by the SFO, no claims by governmental authorities in foreign jurisdictions have been asserted against the indemnified parties. Therefore, we are unable to estimate the maximum potential amount of future payments that could be required to be made under our indemnity to KBR and its majority-owned subsidiaries related to these matters. See Note 7 for additional information.
Barracuda-Caratinga arbitration We also provided indemnification in favor of KBR under the master separation agreement for all
out-of-pocket cash costs and expenses (except for legal fees and other expenses of the arbitration so long as KBR controls and directs it), or cash settlements or cash arbitration awards, KBR may incur after November 20, 2006 as a result of the replacement of certain subsea flowline bolts installed in connection with the Barracuda-Caratinga project. Under the master separation agreement, KBR currently controls the defense, counterclaim, and settlement of the subsea flowline bolts matter. As a condition of our indemnity, for any settlement to be binding upon us, KBR must secure our prior written consent to such settlement’s terms. We have the right to terminate the indemnity in the event KBR enters into any settlement without our prior written consent.
At Petrobras’ direction, KBR replaced certain bolts located on the subsea flowlines that failed through mid-November 2005, and KBR has informed us that additional bolts have failed thereafter, which were replaced by Petrobras. These failed bolts were identified by Petrobras when it conducted inspections of the bolts. We understand KBR believes several possible solutions may exist, including replacement of the bolts. Initial estimates by KBR indicated that costs of these various solutions ranged up to $148 million. In March 2006, Petrobras commenced arbitration against KBR claiming $220 million plus interest for the cost of monitoring and replacing the defective bolts and all related costs and expenses of the arbitration, including the cost of attorneys’ fees. We understand KBR is vigorously defending this matter and has submitted a counterclaim in the arbitration seeking the recovery of $22 million. The arbitration panel held an evidentiary hearing in March 2008 to determine which party is responsible for the designation of the material used for the bolts. On May 13, 2009, the arbitration panel held that KBR and not Petrobras selected the material to be used for the bolts. Accordingly, the arbitration panel held that there is no implied warranty by Petrobras to KBR as to the suitability of the bolt material and that the parties' rights are to be governed by the express terms of their contract. The arbitration panel set the final hearing on liability and damages for early May 2010. Our estimation of the indemnity obligation regarding the Barracuda-Caratinga arbitration is recorded as a liability in our consolidated financial statements as of December 31, 2009 and December 31, 2008. See Note 7 for additional information regarding the KBR indemnification.
Securities and related litigation In June 2002, a class action lawsuit was filed against us in federal court alleging violations of the
federal securities laws after the SEC initiated an investigation in connection with our change in accounting for revenue on long-term construction projects and related disclosures. In the weeks that followed, approximately twenty similar class actions were filed against us. Several of those lawsuits also named as defendants several of our present or former officers and directors. The class action cases were later consolidated, and the amended consolidated class action complaint, styled Richard Moore, et al. v. Halliburton Company, et al., was filed and served upon us in April 2003. As a result of a substitution of lead plaintiffs, the case is now styled Archdiocese of Milwaukee Supporting Fund (AMSF) v. Halliburton Company, et al. We settled with the SEC in the second quarter of 2004.
In June 2003, the lead plaintiffs filed a motion for leave to file a second amended consolidated complaint, which was granted by the court. In addition to restating the original accounting and disclosure claims, the second amended consolidated complaint included claims arising out of the 1998 acquisition of Dresser Industries, Inc. by Halliburton, including that we failed to timely disclose the resulting asbestos liability exposure.
66
In April 2005, the court appointed new co-lead counsel and named AMSF the new lead plaintiff, directing that it file a third consolidated amended complaint and that we file our motion to dismiss. The court held oral arguments on that motion in August 2005, at which time the court took the motion under advisement. In March 2006, the court entered an order in which it granted the motion to dismiss with respect to claims arising prior to June 1999 and granted the motion with respect to certain other claims while permitting AMSF to re-plead some of those claims to correct deficiencies in its earlier complaint. In April 2006, AMSF filed its fourth amended consolidated complaint. We filed a motion to dismiss those portions of the complaint that had been re-pled. A hearing was held on that motion in July 2006, and in March 2007 the court ordered dismissal of the claims against all individual defendants other than our Chief Executive Officer (CEO). The court ordered that the case proceed against our CEO and Halliburton.
In September 2007, AMSF filed a motion for class certification, and our response was filed in November 2007. The court held a hearing in March 2008, and issued an order November 3, 2008 denying AMSF’s motion for class certification. AMSF then filed a motion with the Fifth Circuit Court of Appeals requesting permission to appeal the district court’s order denying class certification. The Fifth Circuit granted AMSF’s motion. Both parties filed briefs, and the Fifth Circuit heard oral argument in December of 2009. The Fifth Circuit affirmed the district court’s order denying class certification. AMSF will have the opportunity to request additional review by the Fifth Circuit and the United States Supreme Court. As of December 31, 2009, we had not accrued any amounts related to this matter because we do not believe that a loss is probable. Further, an estimate of possible loss or range of loss related to this matter cannot be made.
Shareholder derivative cases In May 2009, two shareholder derivative lawsuits involving us and KBR were filed in Harris
County, Texas naming as defendants various current and retired Halliburton directors and officers and current KBR directors. These cases allege that the individual Halliburton defendants violated their fiduciary duties of good faith and loyalty to the detriment of Halliburton and its shareholders by failing to properly exercise oversight responsibilities and establish adequate internal controls. The District Court consolidated the two cases and the plaintiffs filed a consolidated petition against current and former Halliburton directors and officers only containing various allegations of wrongdoing including violations of the FCPA, claimed KBR offenses while acting as a government contractor in Iraq, claimed KBR offenses and fraud under United States government contracts, Halliburton activity in Iran, and illegal kickbacks. As of December 31, 2009, we had not accrued any amounts related to this matter because we do not believe that a loss is probable. Further, an estimate of possible loss or range of loss related to this matter cannot be made.
Asbestos insurance settlements At December 31, 2004, we resolved all open and future asbestos- and silica-related claims in the
prepackaged Chapter 11 proceedings of DII Industries LLC, Kellogg Brown & Root LLC, and our other affected subsidiaries that had previously been named as defendants in a large number of asbestos- and silica-related lawsuits. During 2004, we settled insurance disputes with substantially all the insurance companies for asbestos- and silica-related claims and all other claims under the applicable insurance policies and terminated all the applicable insurance policies.
Under the insurance settlements entered into as part of the resolution of our Chapter 11 proceedings, we have agreed to indemnify our insurers under certain historic general liability insurance policies in certain situations. We have concluded that the likelihood of any claims triggering the indemnity obligations is remote, and we believe any potential liability for these indemnifications will be immaterial. Further, an estimate of possible loss or range of loss related to this matter cannot be made. At December 31, 2009, we had not recorded any liability associated with these indemnifications.
67
Environmental We are subject to numerous environmental, legal, and regulatory requirements related to our
operations worldwide. In the United States, these laws and regulations include, among others: - the Comprehensive Environmental Response, Compensation, and Liability Act; - the Resource Conservation and Recovery Act; - the Clean Air Act; - the Federal Water Pollution Control Act; and - the Toxic Substances Control Act.
In addition to the federal laws and regulations, states and other countries where we do business often have numerous environmental, legal, and regulatory requirements by which we must abide. We evaluate and address the environmental impact of our operations by assessing and remediating contaminated properties in order to avoid future liabilities and comply with environmental, legal, and regulatory requirements. On occasion, we are involved in specific environmental litigation and claims, including the remediation of properties we own or have operated, as well as efforts to meet or correct compliance-related matters. Our Health, Safety and Environment group has several programs in place to maintain environmental leadership and to prevent the occurrence of environmental contamination.
We do not expect costs related to these remediation requirements to have a material adverse effect on our consolidated financial position or our results of operations. Our accrued liabilities for environmental matters were $53 million as of December 31, 2009 and $64 million as of December 31, 2008. Our total liability related to environmental matters covers numerous properties.
We have subsidiaries that have been named as potentially responsible parties along with other third parties for 10 federal and state superfund sites for which we have established a liability. As of December 31, 2009, those 10 sites accounted for approximately $14 million of our total $53 million liability. For any particular federal or state superfund site, since our estimated liability is typically within a range and our accrued liability may be the amount on the low end of that range, our actual liability could eventually be well in excess of the amount accrued. Despite attempts to resolve these superfund matters, the relevant regulatory agency may at any time bring suit against us for amounts in excess of the amount accrued. With respect to some superfund sites, we have been named a potentially responsible party by a regulatory agency; however, in each of those cases, we do not believe we have any material liability. We also could be subject to third-party claims with respect to environmental matters for which we have been named as a potentially responsible party.
Letters of credit In the normal course of business, we have agreements with financial institutions under which
approximately $1.8 billion of letters of credit, bank guarantees, or surety bonds were outstanding as of December 31, 2009, including $380 million of surety bonds related to Venezuela. In addition, $390 million of the total $1.8 billion relates to KBR letters of credit, bank guarantees, or surety bonds that are being guaranteed by us in favor of KBR’s customers and lenders. KBR has agreed to compensate us for these guarantees and indemnify us if we are required to perform under any of these guarantees. Some of the outstanding letters of credit have triggering events that would entitle a bank to require cash collateralization.
Leases We are obligated under operating leases, principally for the use of land, offices, equipment,
manufacturing and field facilities, and warehouses. Total rentals, net of sublease rentals, were $528 million in 2009, $561 million in 2008, and $487 million in 2007.
Future total rentals on noncancellable operating leases are as follows: $149 million in 2010; $112 million in 2011; $70 million in 2012; $42 million in 2013; $29 million in 2014; and $142 million thereafter.
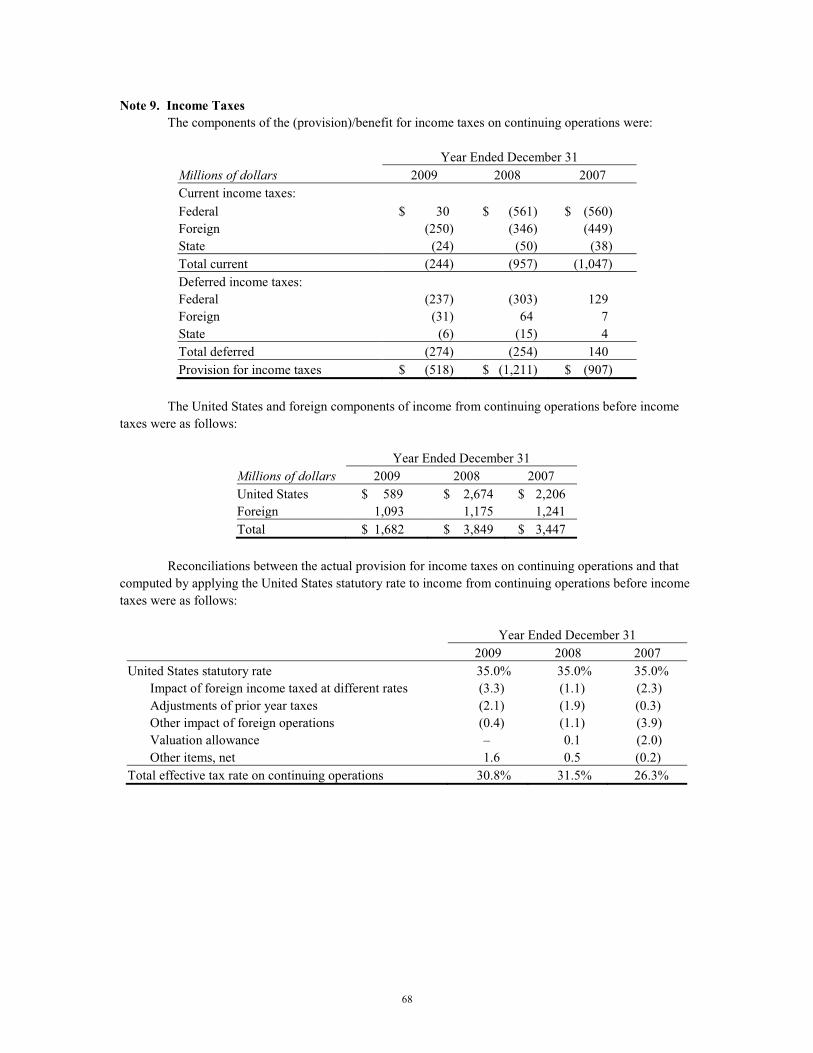
68
Note 9. Income Taxes The components of the (provision)/benefit for income taxes on continuing operations were:
Year Ended December 31 Millions of dollars 2009 2008 2007 Current income taxes: Federal $ 30 $ (561) $ (560) Foreign (250) (346) (449) State (24) (50) (38) Total current (244) (957) (1,047) Deferred income taxes: Federal (237) (303) 129 Foreign (31) 64 7 State (6) (15) 4 Total deferred (274) (254) 140 Provision for income taxes $ (518) $ (1,211) $ (907)
The United States and foreign components of income from continuing operations before income
taxes were as follows:
Year Ended December 31 Millions of dollars 2009 2008 2007 United States $ 589 $ 2,674 $ 2,206 Foreign 1,093 1,175 1,241 Total $ 1,682 $ 3,849 $ 3,447
Reconciliations between the actual provision for income taxes on continuing operations and that
computed by applying the United States statutory rate to income from continuing operations before income taxes were as follows:
Year Ended December 31 2009 2008 2007 United States statutory rate 35.0% 35.0% 35.0% Impact of foreign income taxed at different rates (3.3) (1.1) (2.3) Adjustments of prior year taxes (2.1) (1.9) (0.3) Other impact of foreign operations (0.4) (1.1) (3.9) Valuation allowance – 0.1 (2.0) Other items, net 1.6 0.5 (0.2) Total effective tax rate on continuing operations 30.8% 31.5% 26.3%
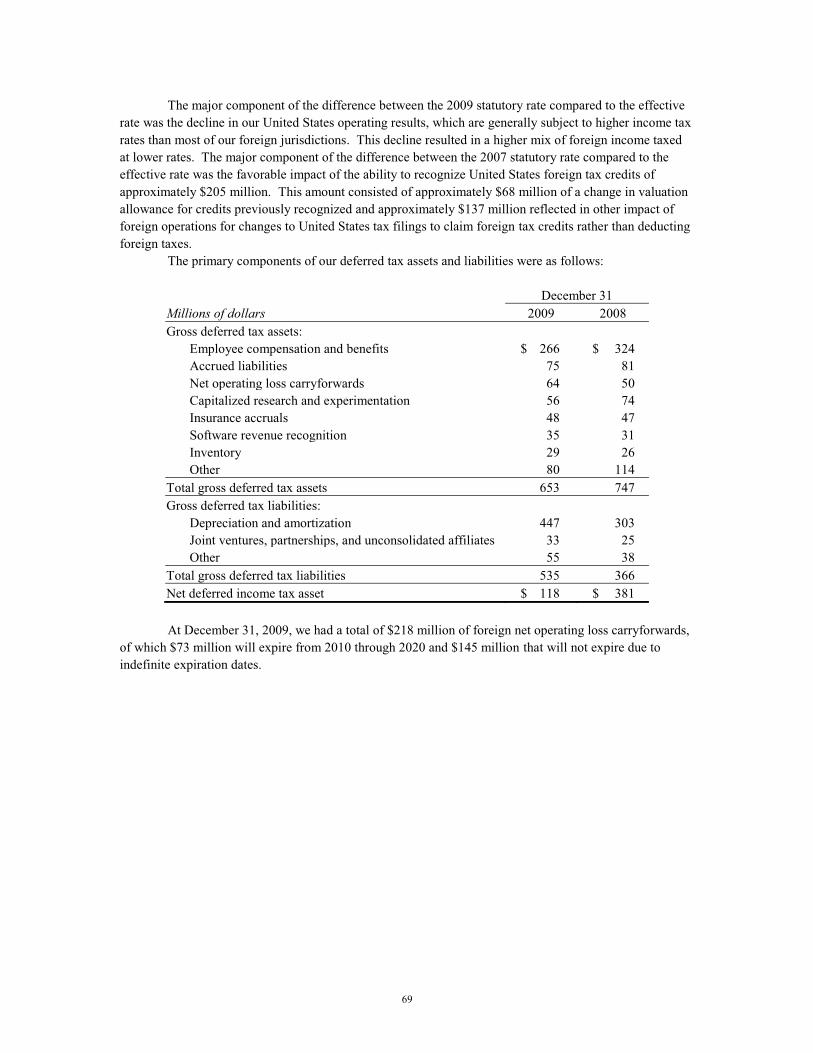
69
The major component of the difference between the 2009 statutory rate compared to the effective rate was the decline in our United States operating results, which are generally subject to higher income tax rates than most of our foreign jurisdictions. This decline resulted in a higher mix of foreign income taxed at lower rates. The major component of the difference between the 2007 statutory rate compared to the effective rate was the favorable impact of the ability to recognize United States foreign tax credits of approximately $205 million. This amount consisted of approximately $68 million of a change in valuation allowance for credits previously recognized and approximately $137 million reflected in other impact of foreign operations for changes to United States tax filings to claim foreign tax credits rather than deducting foreign taxes.
The primary components of our deferred tax assets and liabilities were as follows: December 31 Millions of dollars 2009 2008 Gross deferred tax assets: Employee compensation and benefits $ 266 $ 324 Accrued liabilities 75 81 Net operating loss carryforwards 64 50 Capitalized research and experimentation 56 74 Insurance accruals 48 47 Software revenue recognition 35 31 Inventory 29 26
Other 80 114 Total gross deferred tax assets 653 747 Gross deferred tax liabilities: Depreciation and amortization 447 303 Joint ventures, partnerships, and unconsolidated affiliates 33 25 Other 55 38 Total gross deferred tax liabilities 535 366 Net deferred income tax asset $ 118 $ 381 At December 31, 2009, we had a total of $218 million of foreign net operating loss carryforwards,
of which $73 million will expire from 2010 through 2020 and $145 million that will not expire due to indefinite expiration dates.
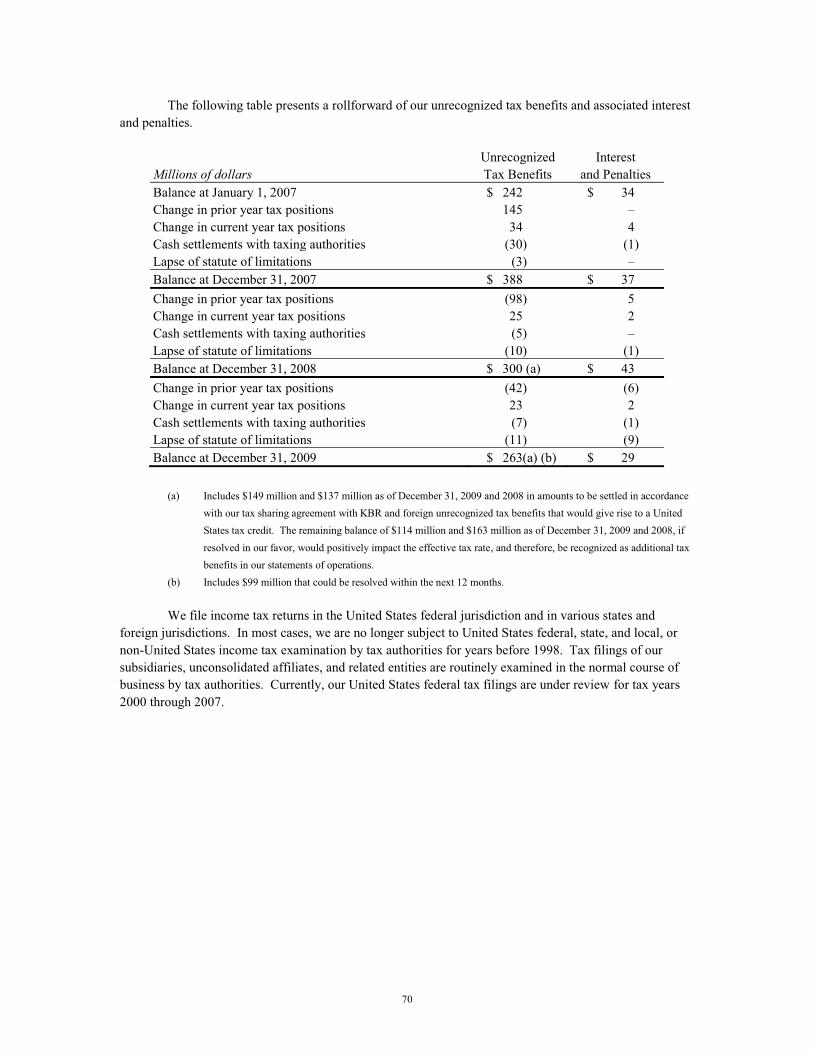
70
The following table presents a rollforward of our unrecognized tax benefits and associated interest and penalties.
Unrecognized Interest
Millions of dollars Tax Benefits and Penalties Balance at January 1, 2007 $ 242 $ 34 Change in prior year tax positions 145 – Change in current year tax positions 34 4 Cash settlements with taxing authorities (30) (1) Lapse of statute of limitations (3) – Balance at December 31, 2007 $ 388 $ 37 Change in prior year tax positions (98) 5 Change in current year tax positions 25 2 Cash settlements with taxing authorities (5) – Lapse of statute of limitations (10) (1) Balance at December 31, 2008 $ 300 (a) $ 43 Change in prior year tax positions (42) (6) Change in current year tax positions 23 2 Cash settlements with taxing authorities (7) (1) Lapse of statute of limitations (11) (9) Balance at December 31, 2009 $ 263(a) (b) $ 29
(a) Includes $149 million and $137 million as of December 31, 2009 and 2008 in amounts to be settled in accordance
with our tax sharing agreement with KBR and foreign unrecognized tax benefits that would give rise to a United States tax credit. The remaining balance of $114 million and $163 million as of December 31, 2009 and 2008, if resolved in our favor, would positively impact the effective tax rate, and therefore, be recognized as additional tax benefits in our statements of operations.
(b) Includes $99 million that could be resolved within the next 12 months. We file income tax returns in the United States federal jurisdiction and in various states and
foreign jurisdictions. In most cases, we are no longer subject to United States federal, state, and local, or non-United States income tax examination by tax authorities for years before 1998. Tax filings of our subsidiaries, unconsolidated affiliates, and related entities are routinely examined in the normal course of business by tax authorities. Currently, our United States federal tax filings are under review for tax years 2000 through 2007.
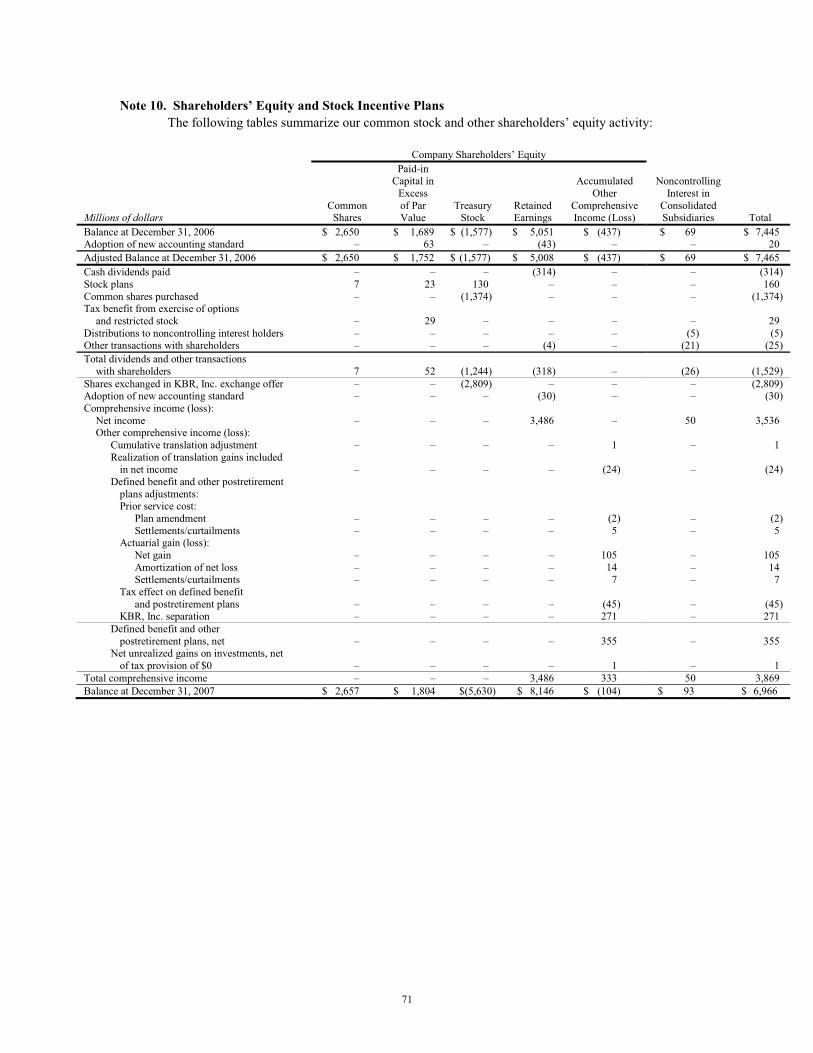
71
Note 10. Shareholders’ Equity and Stock Incentive Plans The following tables summarize our common stock and other shareholders’ equity activity:
Company Shareholders’ Equity Paid-in Capital in Accumulated Noncontrolling Excess Other Interest in Common of Par Treasury Retained Comprehensive Consolidated Millions of dollars Shares Value Stock Earnings Income (Loss) Subsidiaries Total Balance at December 31, 2006 $ 2,650 $ 1,689 $ (1,577) $ 5,051 $ (437) $ 69 $ 7,445 Adoption of new accounting standard – 63 – (43) – – 20 Adjusted Balance at December 31, 2006 $ 2,650 $ 1,752 $ (1,577) $ 5,008 $ (437) $ 69 $ 7,465 Cash dividends paid – – – (314) – – (314) Stock plans 7 23 130 – – – 160 Common shares purchased – – (1,374) – – – (1,374) Tax benefit from exercise of options and restricted stock – 29 – – – – 29 Distributions to noncontrolling interest holders – – – – – (5) (5) Other transactions with shareholders – – – (4) – (21) (25) Total dividends and other transactions with shareholders 7 52 (1,244) (318) – (26) (1,529) Shares exchanged in KBR, Inc. exchange offer – – (2,809) – – – (2,809) Adoption of new accounting standard – – – (30) – – (30) Comprehensive income (loss): Net income – – – 3,486 – 50 3,536 Other comprehensive income (loss): Cumulative translation adjustment – – – – 1 – 1 Realization of translation gains included in net income – – – – (24) – (24) Defined benefit and other postretirement plans adjustments: Prior service cost: Plan amendment – – – – (2) – (2) Settlements/curtailments – – – – 5 – 5 Actuarial gain (loss): Net gain – – – – 105 – 105 Amortization of net loss – – – – 14 – 14 Settlements/curtailments – – – – 7 – 7 Tax effect on defined benefit and postretirement plans – – – – (45) – (45) KBR, Inc. separation – – – – 271 – 271 Defined benefit and other postretirement plans, net – – – – 355 – 355 Net unrealized gains on investments, net of tax provision of $0 – – – – 1 – 1 Total comprehensive income – – – 3,486 333 50 3,869 Balance at December 31, 2007 $ 2,657 $ 1,804 $(5,630) $ 8,146 $ (104) $ 93 $ 6,966
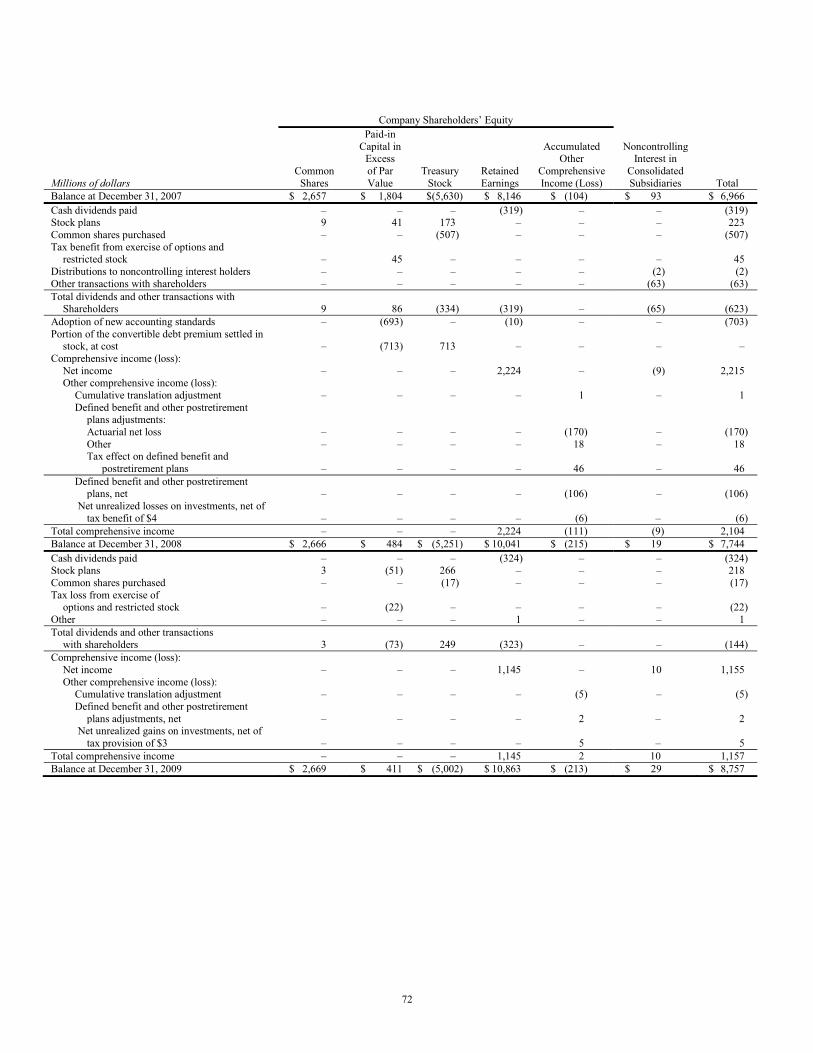
72
Company Shareholders’ Equity Paid-in Capital in Accumulated Noncontrolling Excess Other Interest in Common of Par Treasury Retained Comprehensive Consolidated Millions of dollars Shares Value Stock Earnings Income (Loss) Subsidiaries Total Balance at December 31, 2007 $ 2,657 $ 1,804 $(5,630) $ 8,146 $ (104) $ 93 $ 6,966 Cash dividends paid – – – (319) – – (319) Stock plans 9 41 173 – – – 223 Common shares purchased – – (507) – – – (507) Tax benefit from exercise of options and restricted stock – 45 – – – – 45 Distributions to noncontrolling interest holders – – – – – (2) (2) Other transactions with shareholders – – – – – (63) (63) Total dividends and other transactions with Shareholders 9 86 (334) (319) – (65) (623) Adoption of new accounting standards – (693) – (10) – – (703) Portion of the convertible debt premium settled in stock, at cost – (713) 713 – – – – Comprehensive income (loss): Net income – – – 2,224 – (9) 2,215 Other comprehensive income (loss): Cumulative translation adjustment – – – – 1 – 1 Defined benefit and other postretirement plans adjustments: Actuarial net loss – – – – (170) – (170) Other – – – – 18 – 18 Tax effect on defined benefit and postretirement plans – – – – 46 – 46 Defined benefit and other postretirement plans, net – – – – (106) – (106) Net unrealized losses on investments, net of tax benefit of $4 – – – – (6) – (6) Total comprehensive income – – – 2,224 (111) (9) 2,104 Balance at December 31, 2008 $ 2,666 $ 484 $ (5,251) $ 10,041 $ (215) $ 19 $ 7,744 Cash dividends paid – – – (324) – – (324) Stock plans 3 (51) 266 – – – 218 Common shares purchased – – (17) – – – (17) Tax loss from exercise of options and restricted stock – (22) – – – – (22) Other – – – 1 – – 1 Total dividends and other transactions with shareholders 3 (73) 249 (323) – – (144) Comprehensive income (loss): Net income – – – 1,145 – 10 1,155 Other comprehensive income (loss): Cumulative translation adjustment – – – – (5) – (5) Defined benefit and other postretirement plans adjustments, net – – – – 2 – 2 Net unrealized gains on investments, net of tax provision of $3 – – – – 5 – 5 Total comprehensive income – – – 1,145 2 10 1,157 Balance at December 31, 2009 $ 2,669 $ 411 $ (5,002) $ 10,863 $ (213) $ 29 $ 8,757
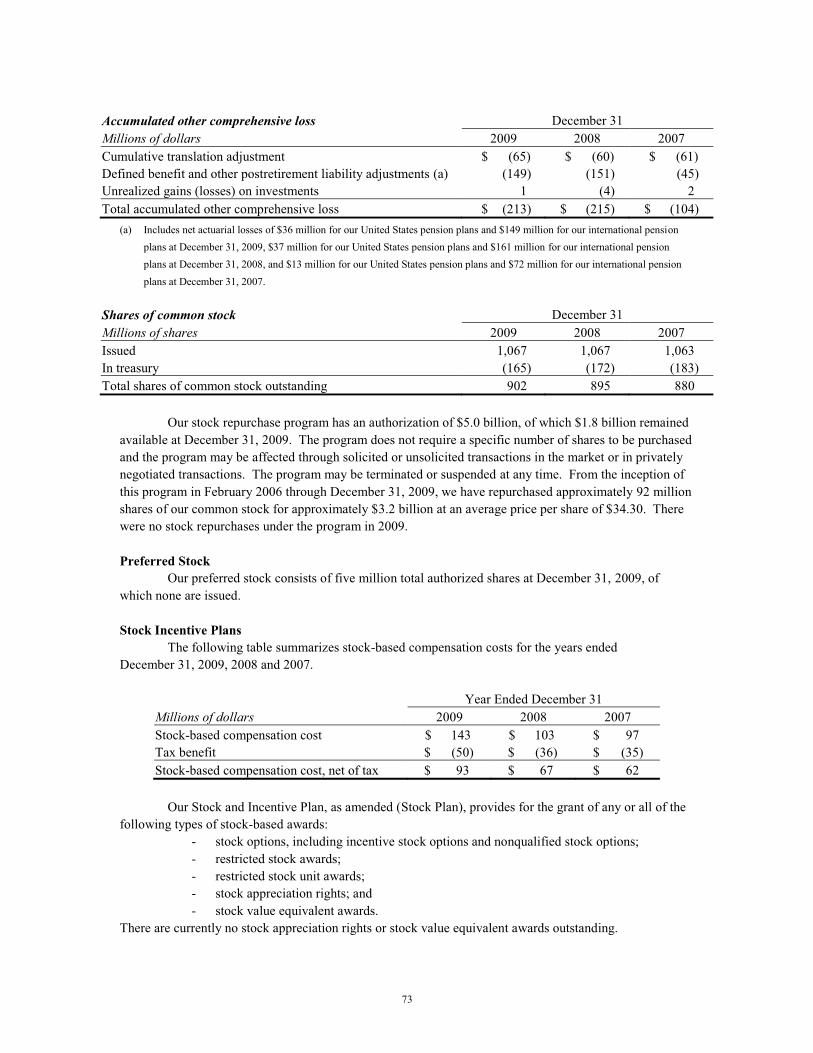
73
Accumulated other comprehensive loss December 31 Millions of dollars 2009 2008 2007 Cumulative translation adjustment $ (65) $ (60) $ (61) Defined benefit and other postretirement liability adjustments (a) (149) (151) (45) Unrealized gains (losses) on investments 1 (4) 2 Total accumulated other comprehensive loss $ (213) $ (215) $ (104)
(a) Includes net actuarial losses of $36 million for our United States pension plans and $149 million for our international pension plans at December 31, 2009, $37 million for our United States pension plans and $161 million for our international pension plans at December 31, 2008, and $13 million for our United States pension plans and $72 million for our international pension plans at December 31, 2007.
Shares of common stock December 31 Millions of shares 2009 2008 2007 Issued 1,067 1,067 1,063 In treasury (165) (172) (183) Total shares of common stock outstanding 902 895 880
Our stock repurchase program has an authorization of $5.0 billion, of which $1.8 billion remained
available at December 31, 2009. The program does not require a specific number of shares to be purchased and the program may be affected through solicited or unsolicited transactions in the market or in privately negotiated transactions. The program may be terminated or suspended at any time. From the inception of this program in February 2006 through December 31, 2009, we have repurchased approximately 92 million shares of our common stock for approximately $3.2 billion at an average price per share of $34.30. There were no stock repurchases under the program in 2009. Preferred Stock
Our preferred stock consists of five million total authorized shares at December 31, 2009, of which none are issued. Stock Incentive Plans
The following table summarizes stock-based compensation costs for the years ended December 31, 2009, 2008 and 2007.
Year Ended December 31 Millions of dollars 2009 2008 2007 Stock-based compensation cost $ 143 $ 103 $ 97 Tax benefit $ (50) $ (36) $ (35) Stock-based compensation cost, net of tax $ 93 $ 67 $ 62
Our Stock and Incentive Plan, as amended (Stock Plan), provides for the grant of any or all of the
following types of stock-based awards: - stock options, including incentive stock options and nonqualified stock options; - restricted stock awards; - restricted stock unit awards; - stock appreciation rights; and - stock value equivalent awards. There are currently no stock appreciation rights or stock value equivalent awards outstanding.
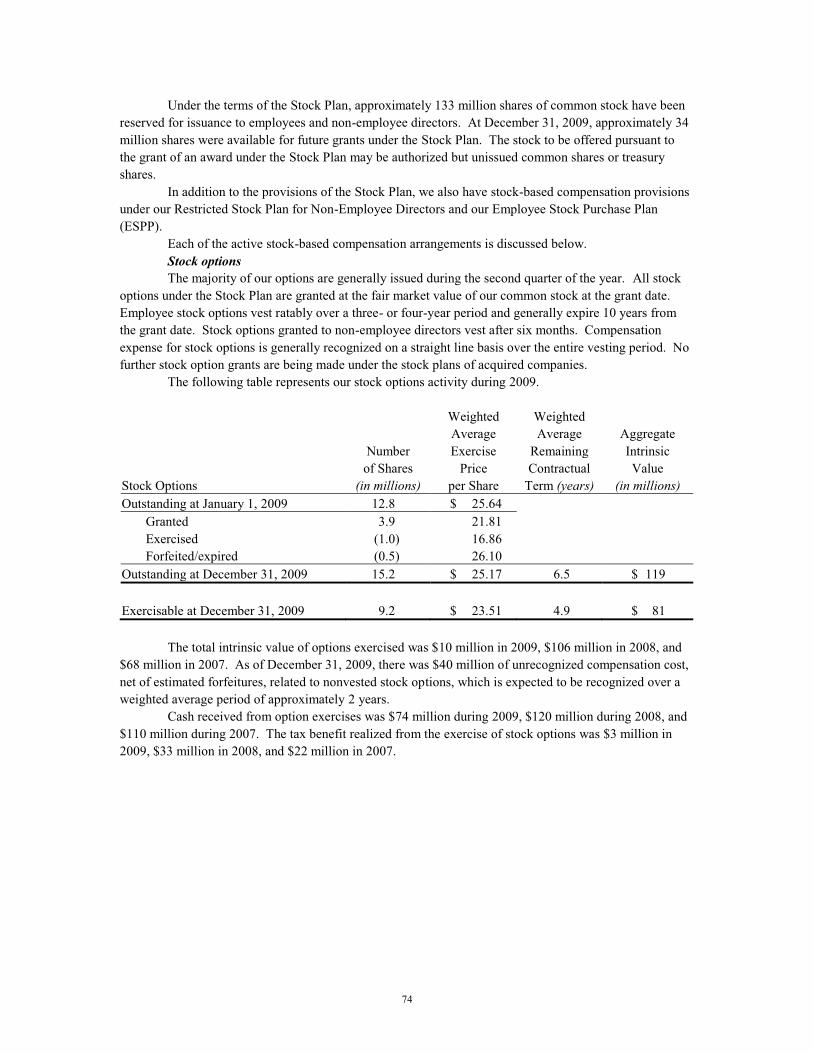
74
Under the terms of the Stock Plan, approximately 133 million shares of common stock have been reserved for issuance to employees and non-employee directors. At December 31, 2009, approximately 34 million shares were available for future grants under the Stock Plan. The stock to be offered pursuant to the grant of an award under the Stock Plan may be authorized but unissued common shares or treasury shares.
In addition to the provisions of the Stock Plan, we also have stock-based compensation provisions under our Restricted Stock Plan for Non-Employee Directors and our Employee Stock Purchase Plan (ESPP).
Each of the active stock-based compensation arrangements is discussed below. Stock options The majority of our options are generally issued during the second quarter of the year. All stock
options under the Stock Plan are granted at the fair market value of our common stock at the grant date. Employee stock options vest ratably over a three- or four-year period and generally expire 10 years from the grant date. Stock options granted to non-employee directors vest after six months. Compensation expense for stock options is generally recognized on a straight line basis over the entire vesting period. No further stock option grants are being made under the stock plans of acquired companies.
The following table represents our stock options activity during 2009.
Weighted Weighted Average Average Aggregate Number Exercise Remaining Intrinsic of Shares Price Contractual Value Stock Options (in millions) per Share Term (years) (in millions) Outstanding at January 1, 2009 12.8 $ 25.64 Granted 3.9 21.81 Exercised (1.0) 16.86 Forfeited/expired (0.5) 26.10 Outstanding at December 31, 2009 15.2 $ 25.17 6.5 $ 119 Exercisable at December 31, 2009 9.2 $ 23.51 4.9 $ 81
The total intrinsic value of options exercised was $10 million in 2009, $106 million in 2008, and
$68 million in 2007. As of December 31, 2009, there was $40 million of unrecognized compensation cost, net of estimated forfeitures, related to nonvested stock options, which is expected to be recognized over a weighted average period of approximately 2 years.
Cash received from option exercises was $74 million during 2009, $120 million during 2008, and $110 million during 2007. The tax benefit realized from the exercise of stock options was $3 million in 2009, $33 million in 2008, and $22 million in 2007.
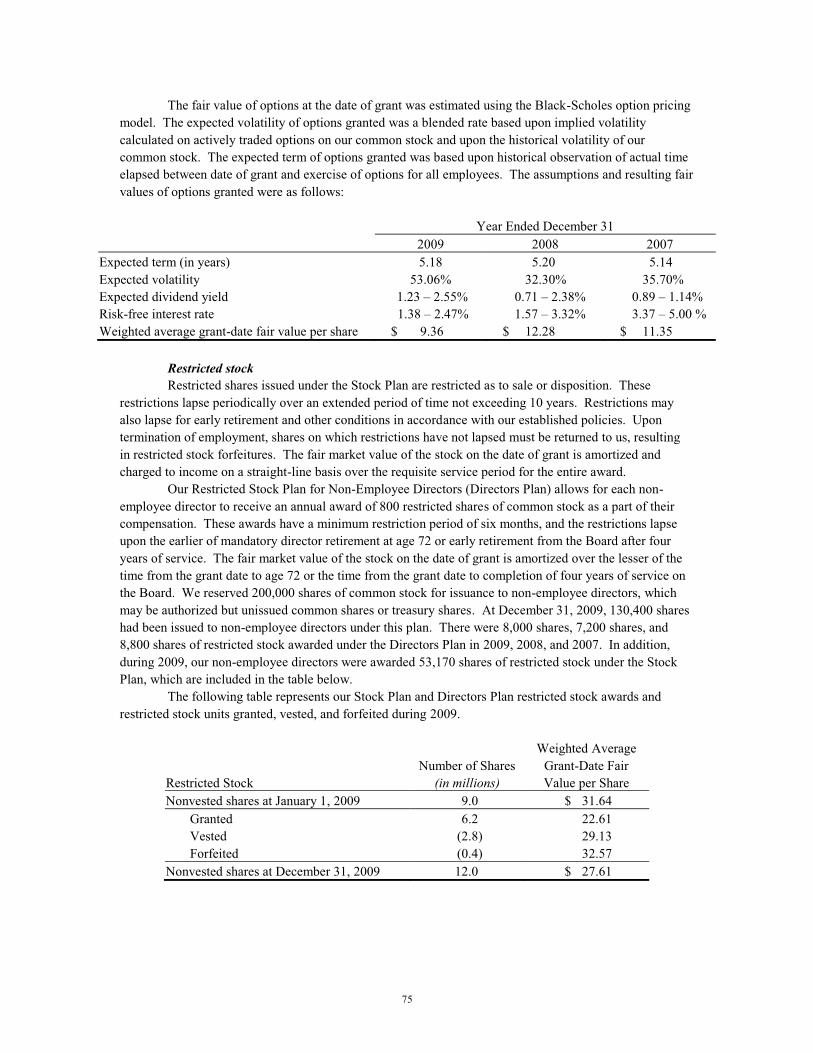
75
The fair value of options at the date of grant was estimated using the Black-Scholes option pricing model. The expected volatility of options granted was a blended rate based upon implied volatility calculated on actively traded options on our common stock and upon the historical volatility of our common stock. The expected term of options granted was based upon historical observation of actual time elapsed between date of grant and exercise of options for all employees. The assumptions and resulting fair values of options granted were as follows:
Year Ended December 31 2009 2008 2007 Expected term (in years) 5.18 5.20 5.14 Expected volatility 53.06% 32.30% 35.70% Expected dividend yield 1.23 – 2.55% 0.71 – 2.38% 0.89 – 1.14% Risk-free interest rate 1.38 – 2.47% 1.57 – 3.32% 3.37 – 5.00 % Weighted average grant-date fair value per share $ 9.36 $ 12.28 $ 11.35
Restricted stock Restricted shares issued under the Stock Plan are restricted as to sale or disposition. These
restrictions lapse periodically over an extended period of time not exceeding 10 years. Restrictions may also lapse for early retirement and other conditions in accordance with our established policies. Upon termination of employment, shares on which restrictions have not lapsed must be returned to us, resulting in restricted stock forfeitures. The fair market value of the stock on the date of grant is amortized and charged to income on a straight-line basis over the requisite service period for the entire award.
Our Restricted Stock Plan for Non-Employee Directors (Directors Plan) allows for each non-employee director to receive an annual award of 800 restricted shares of common stock as a part of their compensation. These awards have a minimum restriction period of six months, and the restrictions lapse upon the earlier of mandatory director retirement at age 72 or early retirement from the Board after four years of service. The fair market value of the stock on the date of grant is amortized over the lesser of the time from the grant date to age 72 or the time from the grant date to completion of four years of service on the Board. We reserved 200,000 shares of common stock for issuance to non-employee directors, which may be authorized but unissued common shares or treasury shares. At December 31, 2009, 130,400 shares had been issued to non-employee directors under this plan. There were 8,000 shares, 7,200 shares, and 8,800 shares of restricted stock awarded under the Directors Plan in 2009, 2008, and 2007. In addition, during 2009, our non-employee directors were awarded 53,170 shares of restricted stock under the Stock Plan, which are included in the table below.
The following table represents our Stock Plan and Directors Plan restricted stock awards and restricted stock units granted, vested, and forfeited during 2009.
Weighted Average Number of Shares Grant-Date Fair Restricted Stock (in millions) Value per Share Nonvested shares at January 1, 2009 9.0 $ 31.64 Granted 6.2 22.61 Vested (2.8) 29.13 Forfeited (0.4) 32.57 Nonvested shares at December 31, 2009 12.0 $ 27.61
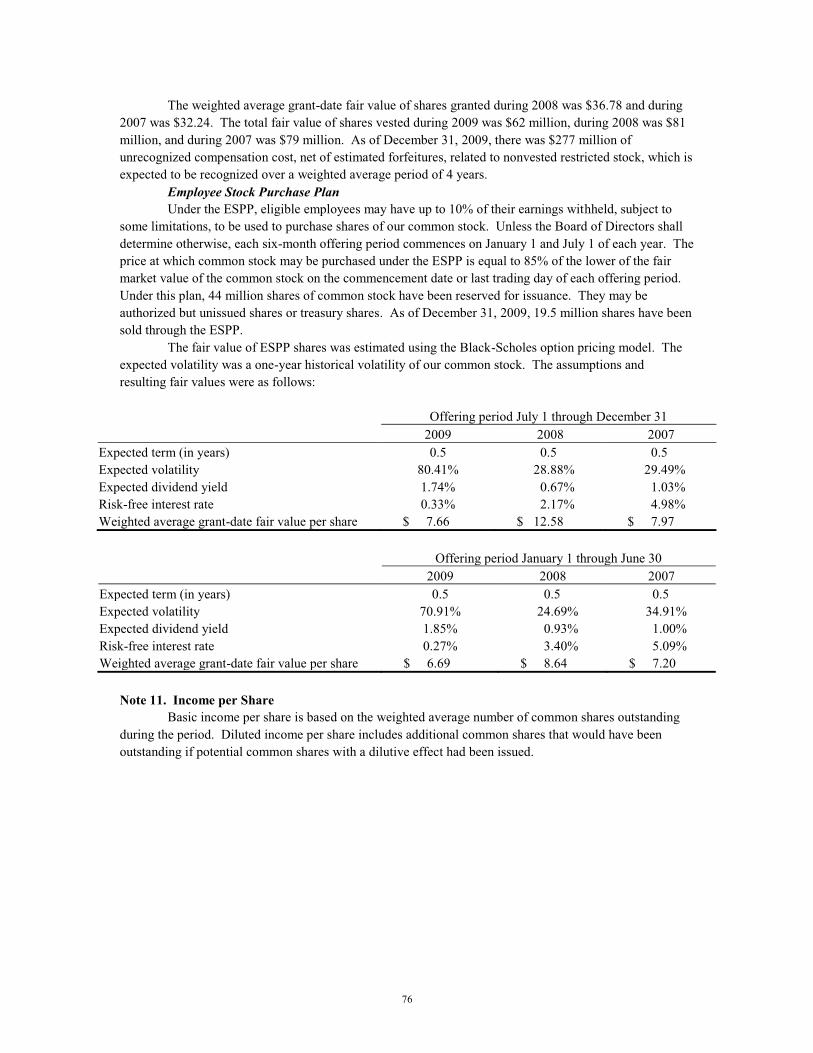
76
The weighted average grant-date fair value of shares granted during 2008 was $36.78 and during 2007 was $32.24. The total fair value of shares vested during 2009 was $62 million, during 2008 was $81 million, and during 2007 was $79 million. As of December 31, 2009, there was $277 million of unrecognized compensation cost, net of estimated forfeitures, related to nonvested restricted stock, which is expected to be recognized over a weighted average period of 4 years.
Employee Stock Purchase Plan Under the ESPP, eligible employees may have up to 10% of their earnings withheld, subject to
some limitations, to be used to purchase shares of our common stock. Unless the Board of Directors shall determine otherwise, each six-month offering period commences on January 1 and July 1 of each year. The price at which common stock may be purchased under the ESPP is equal to 85% of the lower of the fair market value of the common stock on the commencement date or last trading day of each offering period. Under this plan, 44 million shares of common stock have been reserved for issuance. They may be authorized but unissued shares or treasury shares. As of December 31, 2009, 19.5 million shares have been sold through the ESPP.
The fair value of ESPP shares was estimated using the Black-Scholes option pricing model. The expected volatility was a one-year historical volatility of our common stock. The assumptions and resulting fair values were as follows:
Offering period July 1 through December 31 2009 2008 2007 Expected term (in years) 0.5 0.5 0.5 Expected volatility 80.41% 28.88% 29.49% Expected dividend yield 1.74% 0.67% 1.03% Risk-free interest rate 0.33% 2.17% 4.98% Weighted average grant-date fair value per share $ 7.66 $ 12.58 $ 7.97
Offering period January 1 through June 30 2009 2008 2007 Expected term (in years) 0.5 0.5 0.5 Expected volatility 70.91% 24.69% 34.91% Expected dividend yield 1.85% 0.93% 1.00% Risk-free interest rate 0.27% 3.40% 5.09% Weighted average grant-date fair value per share $ 6.69 $ 8.64 $ 7.20
Note 11. Income per Share
Basic income per share is based on the weighted average number of common shares outstanding during the period. Diluted income per share includes additional common shares that would have been outstanding if potential common shares with a dilutive effect had been issued.
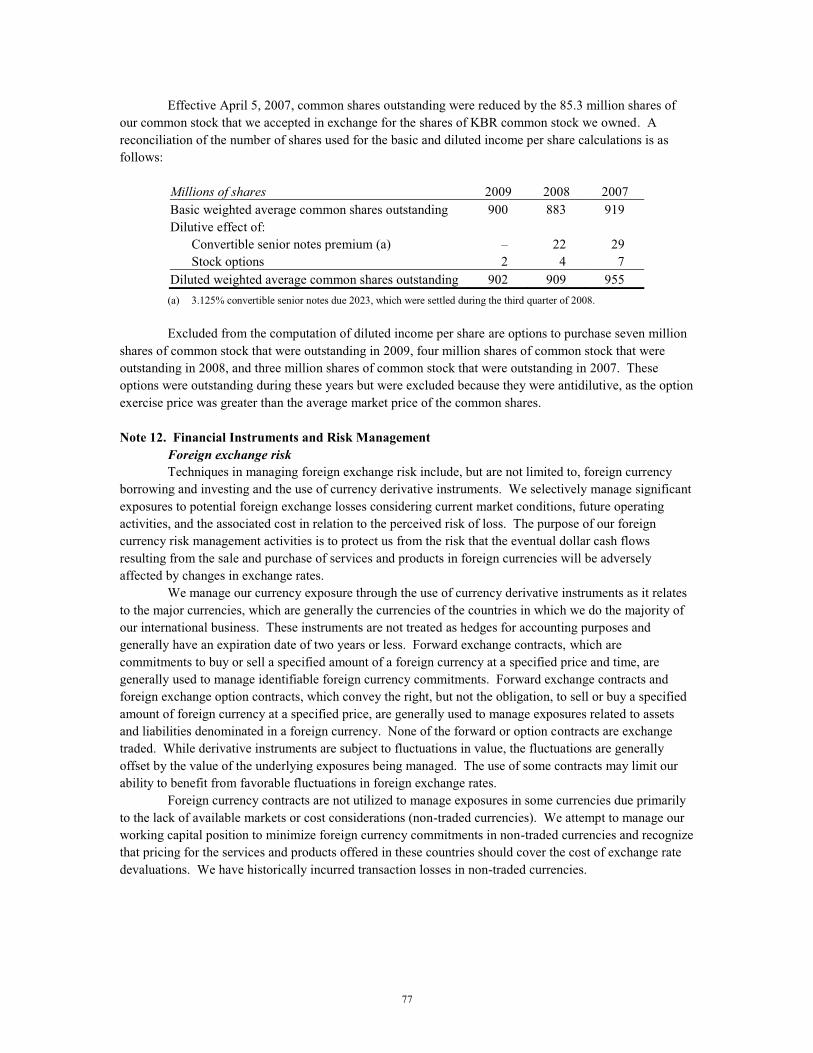
77
Effective April 5, 2007, common shares outstanding were reduced by the 85.3 million shares of our common stock that we accepted in exchange for the shares of KBR common stock we owned. A reconciliation of the number of shares used for the basic and diluted income per share calculations is as follows:
Millions of shares 2009 2008 2007 Basic weighted average common shares outstanding 900 883 919 Dilutive effect of: Convertible senior notes premium (a) – 22 29 Stock options 2 4 7 Diluted weighted average common shares outstanding 902 909 955 (a) 3.125% convertible senior notes due 2023, which were settled during the third quarter of 2008.
Excluded from the computation of diluted income per share are options to purchase seven million
shares of common stock that were outstanding in 2009, four million shares of common stock that were outstanding in 2008, and three million shares of common stock that were outstanding in 2007. These options were outstanding during these years but were excluded because they were antidilutive, as the option exercise price was greater than the average market price of the common shares. Note 12. Financial Instruments and Risk Management
Foreign exchange risk Techniques in managing foreign exchange risk include, but are not limited to, foreign currency
borrowing and investing and the use of currency derivative instruments. We selectively manage significant exposures to potential foreign exchange losses considering current market conditions, future operating activities, and the associated cost in relation to the perceived risk of loss. The purpose of our foreign currency risk management activities is to protect us from the risk that the eventual dollar cash flows resulting from the sale and purchase of services and products in foreign currencies will be adversely affected by changes in exchange rates.
We manage our currency exposure through the use of currency derivative instruments as it relates to the major currencies, which are generally the currencies of the countries in which we do the majority of our international business. These instruments are not treated as hedges for accounting purposes and generally have an expiration date of two years or less. Forward exchange contracts, which are commitments to buy or sell a specified amount of a foreign currency at a specified price and time, are generally used to manage identifiable foreign currency commitments. Forward exchange contracts and foreign exchange option contracts, which convey the right, but not the obligation, to sell or buy a specified amount of foreign currency at a specified price, are generally used to manage exposures related to assets and liabilities denominated in a foreign currency. None of the forward or option contracts are exchange traded. While derivative instruments are subject to fluctuations in value, the fluctuations are generally offset by the value of the underlying exposures being managed. The use of some contracts may limit our ability to benefit from favorable fluctuations in foreign exchange rates.
Foreign currency contracts are not utilized to manage exposures in some currencies due primarily to the lack of available markets or cost considerations (non-traded currencies). We attempt to manage our working capital position to minimize foreign currency commitments in non-traded currencies and recognize that pricing for the services and products offered in these countries should cover the cost of exchange rate devaluations. We have historically incurred transaction losses in non-traded currencies.
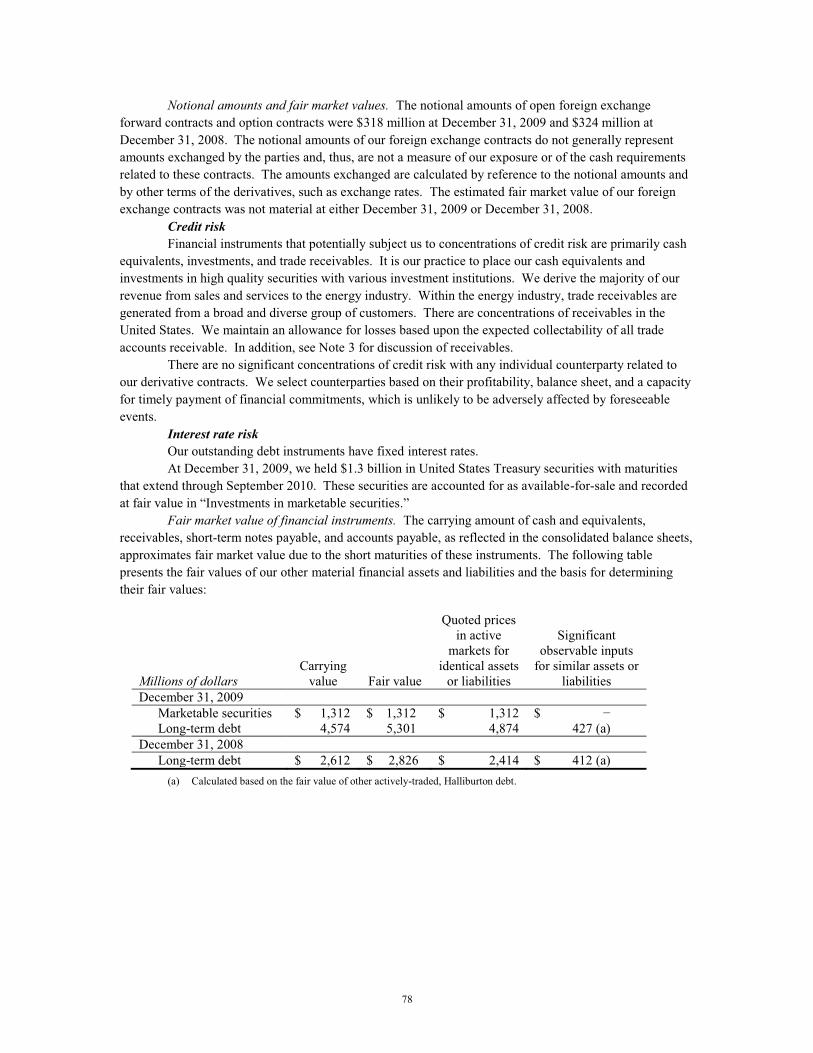
78
Notional amounts and fair market values. The notional amounts of open foreign exchange forward contracts and option contracts were $318 million at December 31, 2009 and $324 million at December 31, 2008. The notional amounts of our foreign exchange contracts do not generally represent amounts exchanged by the parties and, thus, are not a measure of our exposure or of the cash requirements related to these contracts. The amounts exchanged are calculated by reference to the notional amounts and by other terms of the derivatives, such as exchange rates. The estimated fair market value of our foreign exchange contracts was not material at either December 31, 2009 or December 31, 2008.
Credit risk Financial instruments that potentially subject us to concentrations of credit risk are primarily cash
equivalents, investments, and trade receivables. It is our practice to place our cash equivalents and investments in high quality securities with various investment institutions. We derive the majority of our revenue from sales and services to the energy industry. Within the energy industry, trade receivables are generated from a broad and diverse group of customers. There are concentrations of receivables in the United States. We maintain an allowance for losses based upon the expected collectability of all trade accounts receivable. In addition, see Note 3 for discussion of receivables.
There are no significant concentrations of credit risk with any individual counterparty related to our derivative contracts. We select counterparties based on their profitability, balance sheet, and a capacity for timely payment of financial commitments, which is unlikely to be adversely affected by foreseeable events.
Interest rate risk Our outstanding debt instruments have fixed interest rates. At December 31, 2009, we held $1.3 billion in United States Treasury securities with maturities
that extend through September 2010. These securities are accounted for as available-for-sale and recorded at fair value in “Investments in marketable securities.”
Fair market value of financial instruments. The carrying amount of cash and equivalents, receivables, short-term notes payable, and accounts payable, as reflected in the consolidated balance sheets, approximates fair market value due to the short maturities of these instruments. The following table presents the fair values of our other material financial assets and liabilities and the basis for determining their fair values:
Quoted prices in active Significant markets for observable inputs Carrying identical assets for similar assets or Millions of dollars value Fair value or liabilities liabilities December 31, 2009 Marketable securities $ 1,312 $ 1,312 $ 1,312 $ − Long-term debt 4,574 5,301 4,874 427 (a) December 31, 2008 Long-term debt $ 2,612 $ 2,826 $ 2,414 $ 412 (a)
(a) Calculated based on the fair value of other actively-traded, Halliburton debt.
79
Note 13. Retirement Plans Our company and subsidiaries have various plans that cover a significant number of our
employees. These plans include defined contribution plans, defined benefit plans, and other postretirement plans: - our defined contribution plans provide retirement benefits in return for services rendered.
These plans provide an individual account for each participant and have terms that specify how contributions to the participant’s account are to be determined rather than the amount of pension benefits the participant is to receive. Contributions to these plans are based on pretax income and/or discretionary amounts determined on an annual basis. Our expense for the defined contribution plans for continuing operations totaled $186 million in 2009, $178 million in 2008, and $162 million in 2007;
- our defined benefit plans include both funded and unfunded pension plans, which define an amount of pension benefit to be provided, usually as a function of age, years of service, and/or compensation; and
- our postretirement medical plans are offered to specific eligible employees. These plans are contributory. For some plans, our liability is limited to a fixed contribution amount for each participant or dependent. Plan participants share the total cost for all benefits provided above our fixed contributions. Participants’ contributions are adjusted as required to cover benefit payments. We have made no commitment to adjust the amount of our contributions; therefore, the computed accumulated postretirement benefit obligation amount for these plans is not affected by the expected future health care cost inflation rate. The liability at the balance sheet dates presented and the annual cost for these plans are not material.
Effective for our fiscal year ended December 31, 2009, we adopted an update to existing accounting standards that amends the requirements for employers’ disclosures about plan assets for defined benefit pension and other postretirement plans. The objectives of this update are to provide users of financial statements with an understanding of how investment allocation decisions are made, the major categories of assets held by the plans, the inputs and valuation techniques used to measure the fair value of plan assets, significant concentration of risk within the company’s plan assets, and, for fair value measurements determined using significant unobservable inputs, a reconciliation of changes between the beginning and ending balances.
Effective for our fiscal year ended December 31, 2008, we adopted the requirements of a new accounting standard to measure plan assets and benefit obligations as of the date of the employer’s fiscal year-end.
The discontinued operations of KBR have been excluded from all of the following tables and disclosures.
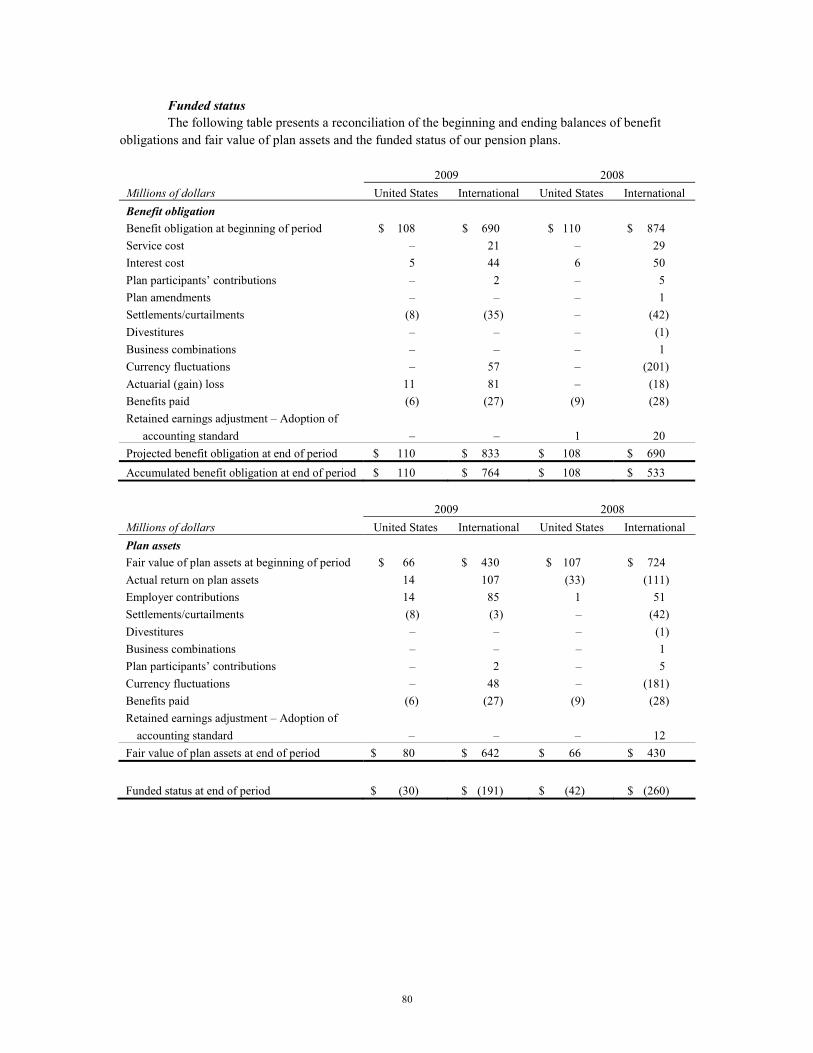
80
Funded status The following table presents a reconciliation of the beginning and ending balances of benefit
obligations and fair value of plan assets and the funded status of our pension plans.
2009 2008 Millions of dollars United States International United States International Benefit obligation Benefit obligation at beginning of period $ 108 $ 690 $ 110 $ 874 Service cost – 21 – 29 Interest cost 5 44 6 50 Plan participants’ contributions – 2 – 5 Plan amendments – – – 1 Settlements/curtailments (8) (35) – (42) Divestitures – – – (1) Business combinations – – – 1 Currency fluctuations – 57 – (201) Actuarial (gain) loss 11 81 – (18) Benefits paid (6) (27) (9) (28) Retained earnings adjustment – Adoption of accounting standard – – 1 20 Projected benefit obligation at end of period $ 110 $ 833 $ 108 $ 690 Accumulated benefit obligation at end of period $ 110 $ 764 $ 108 $ 533
2009 2008 Millions of dollars United States International United States International Plan assets Fair value of plan assets at beginning of period $ 66 $ 430 $ 107 $ 724 Actual return on plan assets 14 107 (33) (111) Employer contributions 14 85 1 51 Settlements/curtailments (8) (3) – (42) Divestitures – – – (1) Business combinations – – – 1 Plan participants’ contributions – 2 – 5 Currency fluctuations – 48 – (181) Benefits paid (6) (27) (9) (28) Retained earnings adjustment – Adoption of accounting standard – – – 12 Fair value of plan assets at end of period $ 80 $ 642 $ 66 $ 430 Funded status at end of period $ (30) $ (191) $ (42) $ (260)
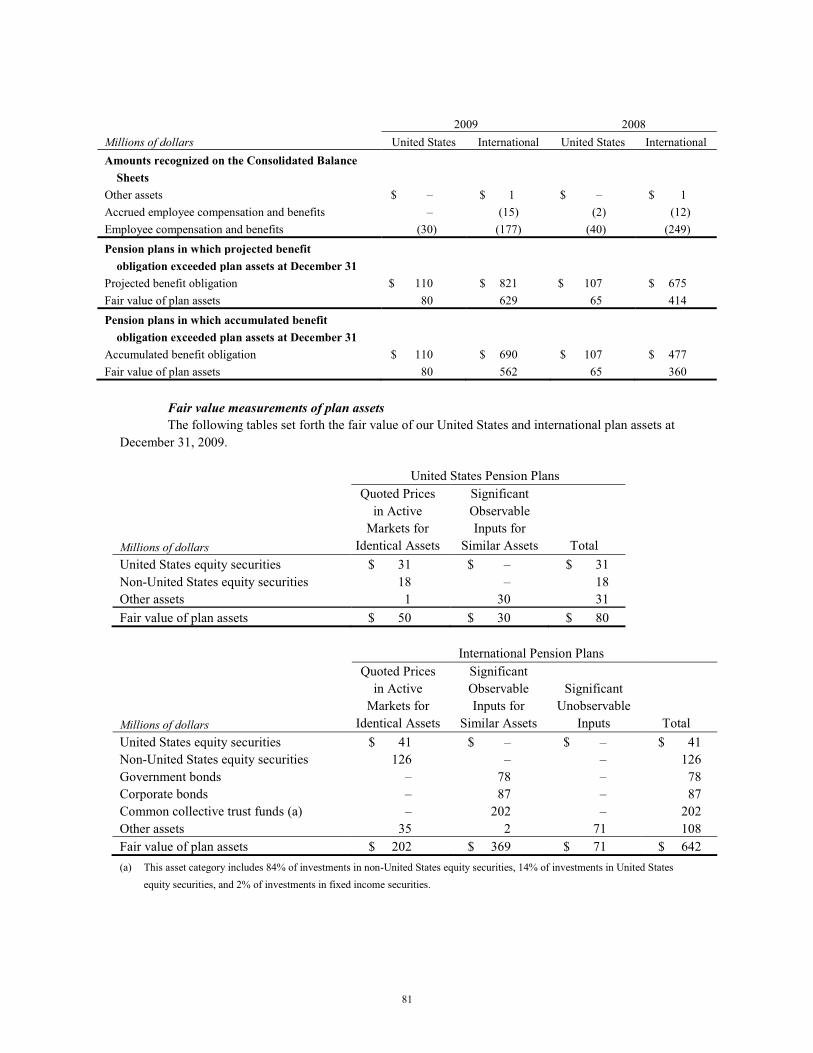
81
2009 2008 Millions of dollars United States International United States International Amounts recognized on the Consolidated Balance Sheets Other assets $ – $ 1 $ – $ 1 Accrued employee compensation and benefits – (15) (2) (12) Employee compensation and benefits (30) (177) (40) (249) Pension plans in which projected benefit obligation exceeded plan assets at December 31 Projected benefit obligation $ 110 $ 821 $ 107 $ 675 Fair value of plan assets 80 629 65 414 Pension plans in which accumulated benefit obligation exceeded plan assets at December 31 Accumulated benefit obligation $ 110 $ 690 $ 107 $ 477 Fair value of plan assets 80 562 65 360
Fair value measurements of plan assets The following tables set forth the fair value of our United States and international plan assets at
December 31, 2009.
United States Pension Plans Quoted Prices Significant in Active Observable Markets for Inputs for Millions of dollars Identical Assets Similar Assets Total United States equity securities $ 31 $ – $ 31 Non-United States equity securities 18 – 18 Other assets 1 30 31 Fair value of plan assets $ 50 $ 30 $ 80 International Pension Plans Quoted Prices Significant in Active Observable Significant Markets for Inputs for Unobservable Millions of dollars Identical Assets Similar Assets Inputs Total United States equity securities $ 41 $ – $ – $ 41 Non-United States equity securities 126 – – 126 Government bonds – 78 – 78 Corporate bonds – 87 – 87 Common collective trust funds (a) – 202 – 202 Other assets 35 2 71 108 Fair value of plan assets $ 202 $ 369 $ 71 $ 642 (a) This asset category includes 84% of investments in non-United States equity securities, 14% of investments in United States
equity securities, and 2% of investments in fixed income securities.
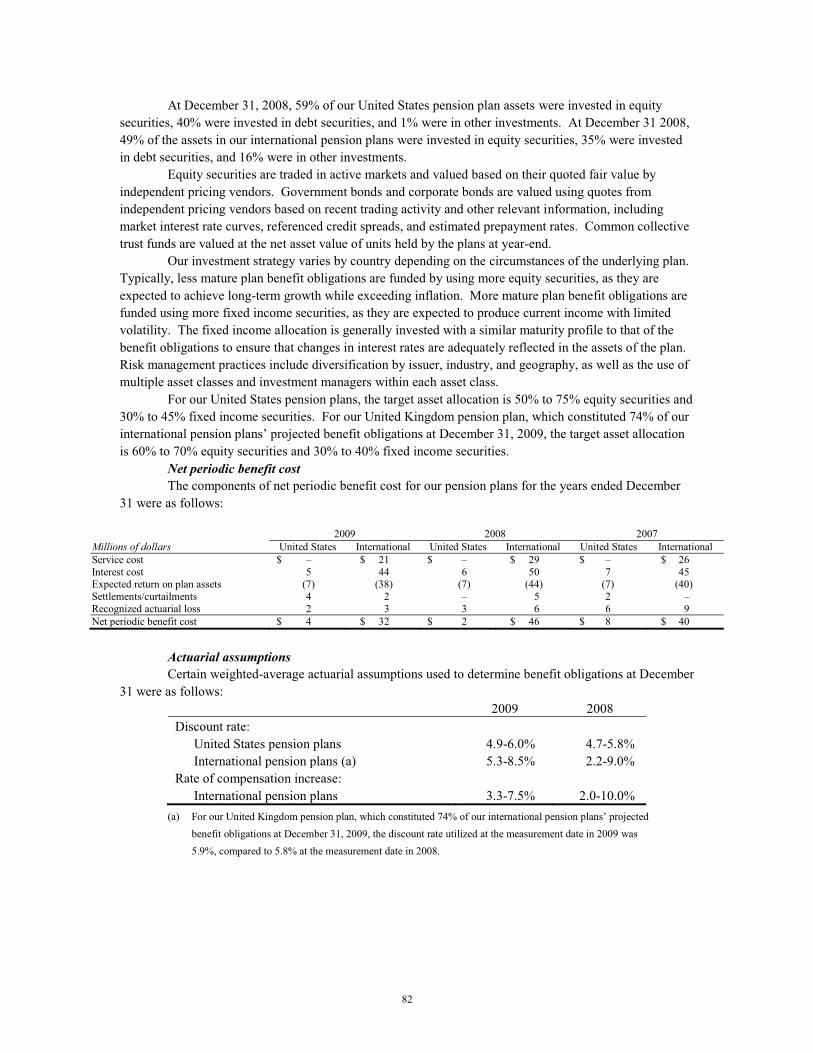
82
At December 31, 2008, 59% of our United States pension plan assets were invested in equity securities, 40% were invested in debt securities, and 1% were in other investments. At December 31 2008, 49% of the assets in our international pension plans were invested in equity securities, 35% were invested in debt securities, and 16% were in other investments.
Equity securities are traded in active markets and valued based on their quoted fair value by independent pricing vendors. Government bonds and corporate bonds are valued using quotes from independent pricing vendors based on recent trading activity and other relevant information, including market interest rate curves, referenced credit spreads, and estimated prepayment rates. Common collective trust funds are valued at the net asset value of units held by the plans at year-end.
Our investment strategy varies by country depending on the circumstances of the underlying plan. Typically, less mature plan benefit obligations are funded by using more equity securities, as they are expected to achieve long-term growth while exceeding inflation. More mature plan benefit obligations are funded using more fixed income securities, as they are expected to produce current income with limited volatility. The fixed income allocation is generally invested with a similar maturity profile to that of the benefit obligations to ensure that changes in interest rates are adequately reflected in the assets of the plan. Risk management practices include diversification by issuer, industry, and geography, as well as the use of multiple asset classes and investment managers within each asset class.
For our United States pension plans, the target asset allocation is 50% to 75% equity securities and 30% to 45% fixed income securities. For our United Kingdom pension plan, which constituted 74% of our international pension plans’ projected benefit obligations at December 31, 2009, the target asset allocation is 60% to 70% equity securities and 30% to 40% fixed income securities.
Net periodic benefit cost The components of net periodic benefit cost for our pension plans for the years ended December
31 were as follows:
2009 2008 2007 Millions of dollars United States International United States International United States International Service cost $ – $ 21 $ – $ 29 $ – $ 26 Interest cost 5 44 6 50 7 45 Expected return on plan assets (7) (38) (7) (44) (7) (40) Settlements/curtailments 4 2 – 5 2 – Recognized actuarial loss 2 3 3 6 6 9 Net periodic benefit cost $ 4 $ 32 $ 2 $ 46 $ 8 $ 40
Actuarial assumptions Certain weighted-average actuarial assumptions used to determine benefit obligations at December
31 were as follows: 2009 2008 Discount rate: United States pension plans 4.9-6.0% 4.7-5.8% International pension plans (a) 5.3-8.5% 2.2-9.0% Rate of compensation increase: International pension plans 3.3-7.5% 2.0-10.0%
(a) For our United Kingdom pension plan, which constituted 74% of our international pension plans’ projected benefit obligations at December 31, 2009, the discount rate utilized at the measurement date in 2009 was 5.9%, compared to 5.8% at the measurement date in 2008.
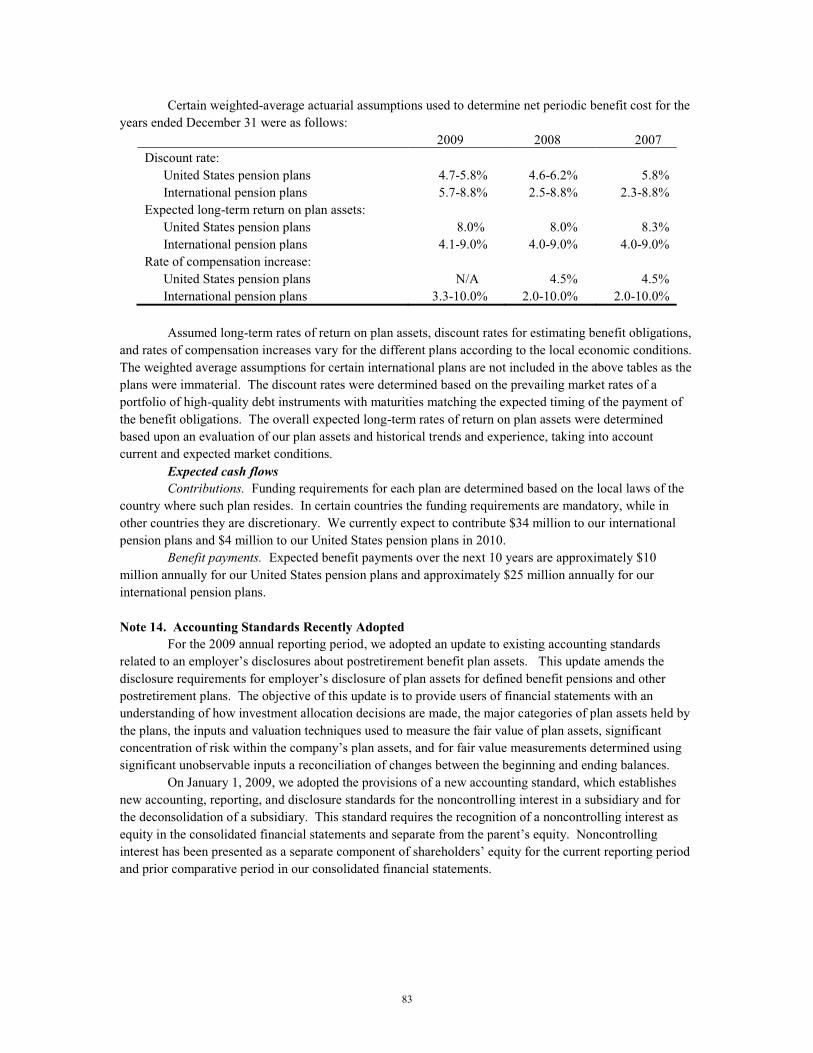
83
Certain weighted-average actuarial assumptions used to determine net periodic benefit cost for the years ended December 31 were as follows:
2009 2008 2007 Discount rate: United States pension plans 4.7-5.8% 4.6-6.2% 5.8% International pension plans 5.7-8.8% 2.5-8.8% 2.3-8.8% Expected long-term return on plan assets: United States pension plans 8.0% 8.0% 8.3% International pension plans 4.1-9.0% 4.0-9.0% 4.0-9.0% Rate of compensation increase: United States pension plans N/A 4.5% 4.5% International pension plans 3.3-10.0% 2.0-10.0% 2.0-10.0%
Assumed long-term rates of return on plan assets, discount rates for estimating benefit obligations,
and rates of compensation increases vary for the different plans according to the local economic conditions. The weighted average assumptions for certain international plans are not included in the above tables as the plans were immaterial. The discount rates were determined based on the prevailing market rates of a portfolio of high-quality debt instruments with maturities matching the expected timing of the payment of the benefit obligations. The overall expected long-term rates of return on plan assets were determined based upon an evaluation of our plan assets and historical trends and experience, taking into account current and expected market conditions.
Expected cash flows Contributions. Funding requirements for each plan are determined based on the local laws of the
country where such plan resides. In certain countries the funding requirements are mandatory, while in other countries they are discretionary. We currently expect to contribute $34 million to our international pension plans and $4 million to our United States pension plans in 2010.
Benefit payments. Expected benefit payments over the next 10 years are approximately $10 million annually for our United States pension plans and approximately $25 million annually for our international pension plans. Note 14. Accounting Standards Recently Adopted
For the 2009 annual reporting period, we adopted an update to existing accounting standards related to an employer’s disclosures about postretirement benefit plan assets. This update amends the disclosure requirements for employer’s disclosure of plan assets for defined benefit pensions and other postretirement plans. The objective of this update is to provide users of financial statements with an understanding of how investment allocation decisions are made, the major categories of plan assets held by the plans, the inputs and valuation techniques used to measure the fair value of plan assets, significant concentration of risk within the company’s plan assets, and for fair value measurements determined using significant unobservable inputs a reconciliation of changes between the beginning and ending balances.
On January 1, 2009, we adopted the provisions of a new accounting standard, which establishes new accounting, reporting, and disclosure standards for the noncontrolling interest in a subsidiary and for the deconsolidation of a subsidiary. This standard requires the recognition of a noncontrolling interest as equity in the consolidated financial statements and separate from the parent’s equity. Noncontrolling interest has been presented as a separate component of shareholders’ equity for the current reporting period and prior comparative period in our consolidated financial statements.
84
On January 1, 2009, we adopted an update to existing accounting standards for business combinations with acquisition dates on or after that date. The update changes the accounting for business combinations in a number of areas. Acquisition costs are no longer considered part of the fair value of an acquisition and will generally be expensed as incurred, noncontrolling interests are valued at fair value at the acquisition date, in-process research and development is recorded at fair value as an indefinite-lived intangible asset at the acquisition date, restructuring costs associated with a business combination are generally expensed subsequent to the acquisition date, and changes in deferred tax asset valuation allowances and income tax uncertainties after the acquisition date generally will affect income tax expense. On April 1, 2009, we adopted an additional update relating to accounting for assets acquired and liabilities assumed in a business combination that arise from contingencies.
On January 1, 2009, we adopted an update to accounting standards related to convertible debt instruments that may be settled in cash upon conversion (including partial cash settlement). The update clarifies that convertible debt instruments that may be settled in cash upon conversion, including partial cash settlement, should separately account for the liability and equity components in a manner that will reflect the entity’s nonconvertible debt borrowing rate when interest cost is recognized in subsequent periods. Upon adopting the update, we retroactively applied its provisions and restated our consolidated financial statements for prior periods.
In applying this update, $63 million of the carrying value of our 3.125% convertible senior notes due July 2023 was reclassified to equity as of the July 2003 issuance date. This amount represents the equity component of the proceeds from the notes, calculated assuming a 4.3% non-convertible borrowing rate. The discount was taken to interest expense over the five-year term of the notes. Accordingly, $14 million of additional non-cash interest expense, or $0.01 per diluted share, was recorded in 2006 and 2007 and $7 million of additional non-cash interest expense was recorded in 2008, all during the first six months of the year. Furthermore, under the provisions of this update, the $693 million loss to settle our convertible debt recorded in the third quarter of 2008 was reversed and recorded to additional paid-in capital. This resulted in an increase of $686 million to income from continuing operations and net income attributable to company in 2008 and a net increase of $630 million to beginning retained earnings as of January 1, 2009. Diluted income per share for 2008 increased by $0.76 as a result of the adoption. These notes were converted and settled during the third quarter of 2008.
On January 1, 2009, we adopted an update to accounting standards related to accounting for instruments granted in share-based payment transactions as participating securities. This update provides that unvested share-based payment awards that contain nonforfeitable rights to dividends or dividend equivalents, whether paid or unpaid, are participating securities and shall be included in the computation of both basic and diluted earnings per share. According to the provisions of this update, we restated prior periods’ basic and diluted earnings per share to include such outstanding unvested restricted shares of our common stock in the basic weighted average shares outstanding calculation. Upon adoption, basic income per share for 2008 decreased by $0.02 for continuing operations and diluted income per share decreased by $0.01 for continuing operations. In addition, basic loss per share decreased by $0.01 for discontinued operations. Both basic and diluted earnings per share decreased by $0.01 for net income attributable to company shareholders.
85
In September 2006, the FASB issued a new accounting standard for fair value measurements, which is intended to increase consistency and comparability in fair value measurements by defining fair value, establishing a framework for measuring fair value, and expanding disclosures about fair value measurements. In February 2008, the FASB issued an update to defer the effective date of the fair value standard for certain nonfinancial assets and nonfinancial liabilities for an additional year. In October 2008, the FASB also issued an update to the original standard related to determining the fair value of a financial asset when the market for that asset is not active. On January 1, 2008, we adopted without material impact on our consolidated financial statements the provisions of the fair value measurement standard related to financial assets and liabilities and to nonfinancial assets and liabilities measured at fair value on a recurring basis. On January 1, 2009, we adopted without material impact on our consolidated financial statements the provisions of the fair value measurement standard related to nonfinancial assets and nonfinancial liabilities that are not required or permitted to be measured at fair value on a recurring basis.
In April 2009, the FASB further updated the fair value measurement standard to provide additional guidance for estimating fair value when the volume and level of activity for the asset or liability have significantly decreased. We adopted this update on June 30, 2009 prospectively to all fair value measurements as appropriate without material impact on our consolidated financial statements.
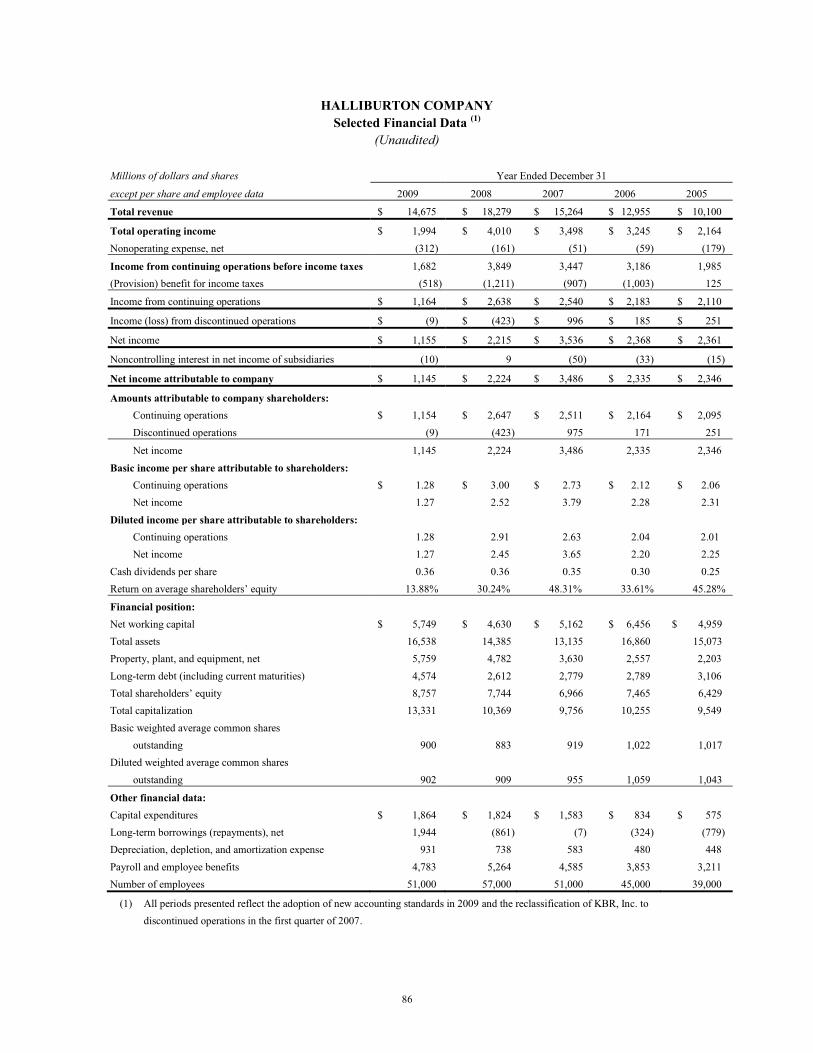
86
HALLIBURTON COMPANY Selected Financial Data (1)
(Unaudited)
Millions of dollars and shares Year Ended December 31
except per share and employee data 2009 2008 2007 2006 2005
Total revenue $ 14,675 $ 18,279 $ 15,264 $ 12,955 $ 10,100
Total operating income $ 1,994 $ 4,010 $ 3,498 $ 3,245 $ 2,164 Nonoperating expense, net (312) (161) (51) (59) (179)
Income from continuing operations before income taxes 1,682 3,849 3,447 3,186 1,985 (Provision) benefit for income taxes (518) (1,211) (907) (1,003) 125
Income from continuing operations $ 1,164 $ 2,638 $ 2,540 $ 2,183 $ 2,110
Income (loss) from discontinued operations $ (9) $ (423) $ 996 $ 185 $ 251
Net income $ 1,155 $ 2,215 $ 3,536 $ 2,368 $ 2,361
Noncontrolling interest in net income of subsidiaries (10) 9 (50) (33) (15)
Net income attributable to company $ 1,145 $ 2,224 $ 3,486 $ 2,335 $ 2,346
Amounts attributable to company shareholders: Continuing operations $ 1,154 $ 2,647 $ 2,511 $ 2,164 $ 2,095 Discontinued operations (9) (423) 975 171 251
Net income 1,145 2,224 3,486 2,335 2,346 Basic income per share attributable to shareholders: Continuing operations $ 1.28 $ 3.00 $ 2.73 $ 2.12 $ 2.06 Net income 1.27 2.52 3.79 2.28 2.31 Diluted income per share attributable to shareholders: Continuing operations 1.28 2.91 2.63 2.04 2.01 Net income 1.27 2.45 3.65 2.20 2.25 Cash dividends per share 0.36 0.36 0.35 0.30 0.25 Return on average shareholders’ equity 13.88% 30.24% 48.31% 33.61% 45.28%
Financial position: Net working capital $ 5,749 $ 4,630 $ 5,162 $ 6,456 $ 4,959 Total assets 16,538 14,385 13,135 16,860 15,073 Property, plant, and equipment, net 5,759 4,782 3,630 2,557 2,203 Long-term debt (including current maturities) 4,574 2,612 2,779 2,789 3,106 Total shareholders’ equity 8,757 7,744 6,966 7,465 6,429 Total capitalization 13,331 10,369 9,756 10,255 9,549 Basic weighted average common shares outstanding 900 883 919 1,022 1,017 Diluted weighted average common shares outstanding 902 909 955 1,059 1,043
Other financial data: Capital expenditures $ 1,864 $ 1,824 $ 1,583 $ 834 $ 575 Long-term borrowings (repayments), net 1,944 (861) (7) (324) (779) Depreciation, depletion, and amortization expense 931 738 583 480 448 Payroll and employee benefits 4,783 5,264 4,585 3,853 3,211 Number of employees 51,000 57,000 51,000 45,000 39,000
(1) All periods presented reflect the adoption of new accounting standards in 2009 and the reclassification of KBR, Inc. to discontinued operations in the first quarter of 2007.
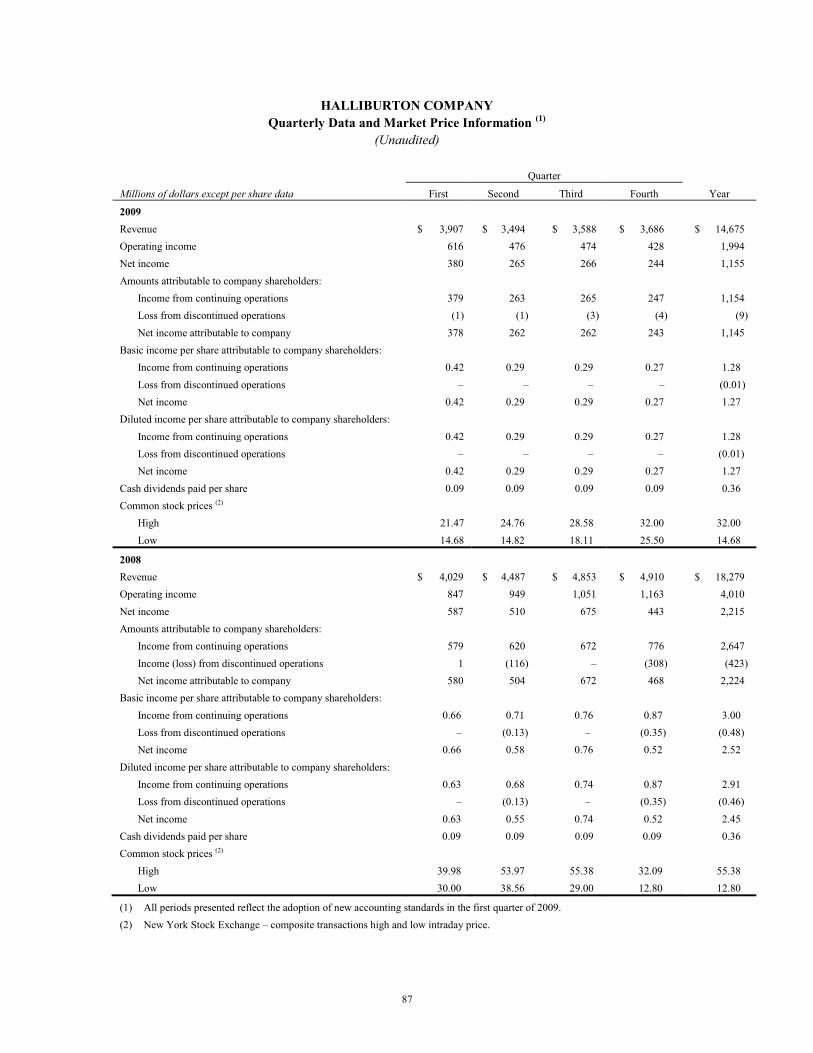
87
HALLIBURTON COMPANY Quarterly Data and Market Price Information (1)
(Unaudited)
Quarter
Millions of dollars except per share data First Second Third Fourth Year
2009 Revenue $ 3,907 $ 3,494 $ 3,588 $ 3,686 $ 14,675 Operating income 616 476 474 428 1,994 Net income 380 265 266 244 1,155 Amounts attributable to company shareholders: Income from continuing operations 379 263 265 247 1,154 Loss from discontinued operations (1) (1) (3) (4) (9) Net income attributable to company 378 262 262 243 1,145 Basic income per share attributable to company shareholders: Income from continuing operations 0.42 0.29 0.29 0.27 1.28 Loss from discontinued operations – – – – (0.01) Net income 0.42 0.29 0.29 0.27 1.27 Diluted income per share attributable to company shareholders: Income from continuing operations 0.42 0.29 0.29 0.27 1.28 Loss from discontinued operations – – – – (0.01) Net income 0.42 0.29 0.29 0.27 1.27 Cash dividends paid per share 0.09 0.09 0.09 0.09 0.36 Common stock prices (2) High 21.47 24.76 28.58 32.00 32.00 Low 14.68 14.82 18.11 25.50 14.68
2008 Revenue $ 4,029 $ 4,487 $ 4,853 $ 4,910 $ 18,279 Operating income 847 949 1,051 1,163 4,010 Net income 587 510 675 443 2,215 Amounts attributable to company shareholders: Income from continuing operations 579 620 672 776 2,647 Income (loss) from discontinued operations 1 (116) – (308) (423) Net income attributable to company 580 504 672 468 2,224 Basic income per share attributable to company shareholders: Income from continuing operations 0.66 0.71 0.76 0.87 3.00 Loss from discontinued operations – (0.13) – (0.35) (0.48) Net income 0.66 0.58 0.76 0.52 2.52 Diluted income per share attributable to company shareholders: Income from continuing operations 0.63 0.68 0.74 0.87 2.91 Loss from discontinued operations – (0.13) – (0.35) (0.46) Net income 0.63 0.55 0.74 0.52 2.45 Cash dividends paid per share 0.09 0.09 0.09 0.09 0.36 Common stock prices (2) High 39.98 53.97 55.38 32.09 55.38 Low 30.00 38.56 29.00 12.80 12.80
(1) All periods presented reflect the adoption of new accounting standards in the first quarter of 2009. (2) New York Stock Exchange – composite transactions high and low intraday price.
88
PART III
Item 10. Directors, Executive Officers, and Corporate Governance. The information required for the directors of the Registrant is incorporated by reference to the
Halliburton Company Proxy Statement for our 2010 Annual Meeting of Stockholders (File No. 1-3492) under the captions “Election of Directors” and “Involvement in Certain Legal Proceedings.” The information required for the executive officers of the Registrant is included under Part I on pages 4 through 5 of this annual report. The information required for a delinquent form required under Section 16(a) of the Securities Exchange Act of 1934 is incorporated by reference to the Halliburton Company Proxy Statement for our 2010 Annual Meeting of Stockholders (File No. 1-3492) under the caption “Section 16(a) Beneficial Ownership Reporting Compliance,” to the extent any disclosure is required. The information for our code of ethics is incorporated by reference to the Halliburton Company Proxy Statement for our 2010 Annual Meeting of Stockholders (File No. 1-3492) under the caption “Corporate Governance.” The information regarding our Audit Committee and the independence of its members, along with information about the audit committee financial expert(s) serving on the Audit Committee, is incorporated by reference to the Halliburton Company Proxy Statement for our 2010 Annual Meeting of Stockholders (File No. 1-3492) under the caption “The Board of Directors and Standing Committees of Directors.” Item 11. Executive Compensation.
This information is incorporated by reference to the Halliburton Company Proxy Statement for our 2010 Annual Meeting of Stockholders (File No. 1-3492) under the captions “Compensation Discussion and Analysis,” “Compensation Committee Report,” “Summary Compensation Table,” “Grants of Plan-Based Awards in Fiscal 2009,” “Outstanding Equity Awards at Fiscal Year End 2009,” “2009 Option Exercises and Stock Vested,” “2009 Nonqualified Deferred Compensation,” “Pension Benefits Table,” “Employment Contracts and Change-in-Control Arrangements,” “Post-Termination Payments,” “Equity Compensation Plan Information,” and “Directors’ Compensation.”
Item 12(a). Security Ownership of Certain Beneficial Owners.
This information is incorporated by reference to the Halliburton Company Proxy Statement for our 2010 Annual Meeting of Stockholders (File No. 1-3492) under the caption “Stock Ownership of Certain Beneficial Owners and Management.”
Item 12(b). Security Ownership of Management.
This information is incorporated by reference to the Halliburton Company Proxy Statement for our 2010 Annual Meeting of Stockholders (File No. 1-3492) under the caption “Stock Ownership of Certain Beneficial Owners and Management.”
89
Item 12(c). Changes in Control. Not applicable.
Item 12(d). Securities Authorized for Issuance Under Equity Compensation Plans. This information is incorporated by reference to the Halliburton Company Proxy Statement for our
2010 Annual Meeting of Stockholders (File No. 1-3492) under the caption “Equity Compensation Plan Information.”
Item 13. Certain Relationships and Related Transactions, and Director Independence.
This information is incorporated by reference to the Halliburton Company Proxy Statement for our 2010 Annual Meeting of Stockholders (File No. 1-3492) under the caption “Corporate Governance” to the extent any disclosure is required and under the caption “The Board of Directors and Standing Committees of Directors.” Item 14. Principal Accounting Fees and Services.
This information is incorporated by reference to the Halliburton Company Proxy Statement for our 2010 Annual Meeting of Stockholders (File No. 1-3492) under the caption “Fees Paid to KPMG LLP.”
90
PART IV Item 15. Exhibits 1. Financial Statements: The reports of the Independent Registered Public Accounting Firm and the financial statements
of the Company as required by Part II, Item 8, are included on pages 47 and 48 and pages 49 through 85 of this annual report. See index on page (i).
2. Exhibits: Exhibit Number Exhibits
3.1 Restated Certificate of Incorporation of Halliburton Company filed with the
Secretary of State of Delaware on May 30, 2006 (incorporated by reference to Exhibit 3.1 to Halliburton’s Form 8-K filed June 5, 2006, File No. 1-3492).
3.2 By-laws of Halliburton revised effective February 10, 2010 (incorporated by
reference to Exhibit 3.1 to Halliburton’s Form 8-K filed February 10, 2010, File No. 1-3492).
4.1 Form of debt security of 8.75% Debentures due February 12, 2021 (incorporated by
reference to Exhibit 4(a) to the Form 8-K of Halliburton Company, now known as Halliburton Energy Services, Inc. (the Predecessor) dated as of February 20, 1991, File No. 1-3492).
4.2 Senior Indenture dated as of January 2, 1991 between the Predecessor and The Bank
of New York Trust Company, N.A. (as successor to Texas Commerce Bank National Association), as Trustee (incorporated by reference to Exhibit 4(b) to the Predecessor’s Registration Statement on Form S-3 (Registration No. 33-38394) originally filed with the Securities and Exchange Commission on December 21, 1990), as supplemented and amended by the First Supplemental Indenture dated as of December 12, 1996 among the Predecessor, Halliburton and the Trustee (incorporated by reference to Exhibit 4.1 of Halliburton’s Registration Statement on Form 8-B dated December 12, 1996, File No. 1-3492).
4.3 Resolutions of the Predecessor’s Board of Directors adopted at a meeting held on
February 11, 1991 and of the special pricing committee of the Board of Directors of the Predecessor adopted at a meeting held on February 11, 1991 and the special pricing committee’s consent in lieu of meeting dated February 12, 1991 (incorporated by reference to Exhibit 4(c) to the Predecessor’s Form 8-K dated as of February 20, 1991, File No. 1-3492).
91
4.4 Second Senior Indenture dated as of December 1, 1996 between the Predecessor and
The Bank of New York Trust Company, N.A. (as successor to Texas Commerce Bank National Association), as Trustee, as supplemented and amended by the First Supplemental Indenture dated as of December 5, 1996 between the Predecessor and the Trustee and the Second Supplemental Indenture dated as of December 12, 1996 among the Predecessor, Halliburton and the Trustee (incorporated by reference to Exhibit 4.2 of Halliburton’s Registration Statement on Form 8-B dated December 12, 1996, File No. 1-3492).
4.5 Third Supplemental Indenture dated as of August 1, 1997 between Halliburton and
The Bank of New York Trust Company, N.A. (as successor to Texas Commerce Bank National Association), as Trustee, to the Second Senior Indenture dated as of December 1, 1996 (incorporated by reference to Exhibit 4.7 to Halliburton’s Form 10-K for the year ended December 31, 1998, File No. 1-3492).
4.6 Fourth Supplemental Indenture dated as of September 29, 1998 between Halliburton
and The Bank of New York Trust Company, N.A. (as successor to Texas Commerce Bank National Association), as Trustee, to the Second Senior Indenture dated as of December 1, 1996 (incorporated by reference to Exhibit 4.8 to Halliburton’s Form 10-K for the year ended December 31, 1998, File No. 1-3492).
4.7 Resolutions of Halliburton’s Board of Directors adopted by unanimous consent dated
December 5, 1996 (incorporated by reference to Exhibit 4(g) of Halliburton’s Form 10-K for the year ended December 31, 1996, File No. 1-3492).
4.8 Form of debt security of 6.75% Notes due February 1, 2027 (incorporated by
reference to Exhibit 4.1 to Halliburton’s Form 8-K dated as of February 11, 1997, File No. 1-3492).
4.9 Resolutions of Halliburton’s Board of Directors adopted at a special meeting held on
September 28, 1998 (incorporated by reference to Exhibit 4.10 to Halliburton’s Form 10-K for the year ended December 31, 1998, File No. 1-3492).
4.10 Copies of instruments that define the rights of holders of miscellaneous long-term
notes of Halliburton and its subsidiaries have not been filed with the Commission. Halliburton agrees to furnish copies of these instruments upon request.
4.11 Form of debt security of 7.53% Notes due May 12, 2017 (incorporated by reference
to Exhibit 4.4 to Halliburton’s Form 10-Q for the quarter ended March 31, 1997, File No. 1-3492)
92
4.12 Form of Indenture, between Dresser and The Bank of New York Trust Company,
N.A. (as successor to Texas Commerce Bank National Association), as Trustee, for 7.60% Debentures due 2096 (incorporated by reference to Exhibit 4 to the Registration Statement on Form S-3 filed by Dresser as amended, Registration No. 333-01303), as supplemented and amended by Form of Supplemental Indenture, between Dresser and The Bank of New York Trust Company, N.A. (as successor to Texas Commerce Bank National Association), Trustee, for 7.60% Debentures due 2096 (incorporated by reference to Exhibit 4.1 to Dresser’s Form 8-K filed on August 9, 1996, File No. 1-4003).
4.13 Second Supplemental Indenture dated as of October 27, 2003 between DII
Industries, LLC and The Bank of New York Trust Company, N.A. (as successor to JPMorgan Chase Bank), as Trustee, to the Indenture dated as of April 18, 1996, as supplemented by the First Supplemental Indenture dated as of August 6, 1996 (incorporated by reference to Exhibit 4.15 to Halliburton’s Form 10-K for the year ended December 31, 2003, File No. 1-3492).
4.14 Third Supplemental Indenture dated as of December 12, 2003 among DII Industries,
LLC, Halliburton and The Bank of New York Trust Company, N.A. (as successor to JPMorgan Chase Bank), as Trustee, to the Indenture dated as of April 18, 1996, as supplemented by the First Supplemental Indenture dated as of August 6, 1996 and the Second Supplemental Indenture dated as of October 27, 2003 (incorporated by reference to Exhibit 4.16 to Halliburton’s Form 10-K for the year ended December 31, 2003, File No. 1-3492).
4.15 Indenture dated as of October 17, 2003 between Halliburton and The Bank of New
York Trust Company, N.A. (as successor to JPMorgan Chase Bank), as Trustee (incorporated by reference to Exhibit 4.1 to Halliburton’s Form 10-Q for the quarter ended September 30, 2003, File No. 1-3492).
4.16 First Supplemental Indenture dated as of October 17, 2003 between Halliburton and
The Bank of New York Trust Company, N.A. (as successor to JPMorgan Chase Bank), as Trustee, to the Senior Indenture dated as of October 17, 2003 (incorporated by reference to Exhibit 4.2 to Halliburton’s Form 10-Q for the quarter ended September 30, 2003, File No. 1-3492).
4.17 Form of note of 5.5% senior notes due October 15, 2010 (included as Exhibit B to
Exhibit 4.16 above). 4.18 Second Supplemental Indenture dated as of December 15, 2003 between Halliburton
and The Bank of New York Trust Company, N.A. (as successor to JPMorgan Chase Bank), as Trustee, to the Senior Indenture dated as of October 17, 2003, as supplemented by the First Supplemental Indenture dated as of October 17, 2003 (incorporated by reference to Exhibit 4.27 to Halliburton’s Form 10-K for the year ended December 31, 2003, File No. 1-3492).
4.19 Form of note of 7.6% debentures due 2096 (included as Exhibit A to Exhibit 4.18
above).
93
4.20 Fourth Supplemental Indenture, dated as of September 12, 2008, between
Halliburton and The Bank of New York Mellon Trust Company, N.A., as successor trustee to JPMorgan Chase Bank, to the Senior Indenture dated as of October 17, 2003 (incorporated by reference to Exhibit 4.2 to Halliburton’s Form 8-K filed September 12, 2008, File No. 1-3492).
4.21 Form of Global Note for Halliburton’s 5.90% Senior Notes due 2018 (included as
part of Exhibit 4.20). 4.22 Form of Global Note for Halliburton’s 6.70% Senior Notes due 2038 (included as
part of Exhibit 4.20). 4.23 Fifth Supplemental Indenture, dated as of March 13, 2009, between Halliburton and
The Bank of New York Mellon Trust Company, N.A., as successor trustee to JPMorgan Chase Bank, to the Senior Indenture dated as of October 17, 2003 (incorporated by reference to Exhibit 4.2 to Halliburton’s Form 8-K filed March 13, 2009, File No. 1-3492).
4.24 Form of Global Note for Halliburton’s 6.15% Senior Notes due 2019 (included as
part of Exhibit 4.23). 4.25 Form of Global Note for Halliburton’s 7.45% Senior Notes due 2039 (included as
part of Exhibit 4.23). 10.1 Halliburton Company Career Executive Incentive Stock Plan as amended November
15, 1990 (incorporated by reference to Exhibit 10(a) to the Predecessor’s Form 10-K for the year ended December 31, 1992, File No. 1-3492).
10.2 Halliburton Company Restricted Stock Plan for Non-Employee Directors
(incorporated by reference to Appendix B of the Predecessor’s proxy statement dated March 23, 1993, File No. 1-3492).
10.3 Dresser Industries, Inc. Deferred Compensation Plan, as amended and restated
effective January 1, 2000 (incorporated by reference to Exhibit 10.16 to Halliburton’s Form 10-K for the year ended December 31, 2000, File No. 1-3492).
10.4 ERISA Excess Benefit Plan for Dresser Industries, Inc., as amended and restated
effective June 1, 1995 (incorporated by reference to Exhibit 10.7 to Dresser’s Form 10-K for the year ended October 31, 1995, File No. 1-4003).
10.5 ERISA Compensation Limit Benefit Plan for Dresser Industries, Inc., as amended
and restated effective June 1, 1995 (incorporated by reference to Exhibit 10.8 to Dresser’s Form 10-K for the year ended October 31, 1995, File No. 1-4003).
10.6 Employment Agreement (David J. Lesar) (incorporated by reference to Exhibit 10(n)
to the Predecessor’s Form 10-K for the year ended December 31, 1995, File No. 1-3492).
94
10.7 Employment Agreement (Mark A. McCollum) (incorporated by reference to Exhibit
10.1 to Halliburton’s Form 10-Q for the quarter ended September 30, 2003, File No. 1-3492).
10.8 Halliburton Company Performance Unit Program (incorporated by reference to
Exhibit 10.2 to Halliburton’s Form 10-Q for the quarter ended September 30, 2001, File No. 1-3492).
10.9 Employment Agreement (Albert O. Cornelison) (incorporated by reference to
Exhibit 10.3 to Halliburton’s Form 10-Q for the quarter ended June 30, 2002, File No. 1-3492).
10.10 Master Separation Agreement between Halliburton Company and KBR, Inc. dated as
of November 20, 2006 (incorporated by reference to Exhibit 10.1 to Halliburton’s Form 8-K filed November 27, 2006, File No. 1-3492).
10.11 Tax Sharing Agreement, effective as of January 1, 2006, by and between Halliburton
Company, KBR Holdings, LLC and KBR, Inc., as amended effective February 26, 2007 (incorporated by reference to Exhibit 10.2 to KBR’s Annual Report on Form 10-K for the year ended December 31, 2006, File No. 1-33146).
10.12 Five Year Revolving Credit Agreement among Halliburton, as Borrower, the Banks
party thereto, and Citicorp North America, Inc., as Administrative Agent (incorporated by reference to Exhibit 10.1 to Halliburton’s Form 8-K filed July 13, 2007, File No. 1-3492).
10.13 Form of Indemnification Agreement for Officers (incorporated by reference to
Exhibit 10.1 to Halliburton’s Form 8-K filed August 3, 2007, File No. 1-3492). 10.14 Form of Indemnification Agreement for Directors (incorporated by reference to
Exhibit 10.2 to Halliburton’s Form 8-K filed August 3, 2007, File No. 1-3492). 10.15 2008 Halliburton Elective Deferral Plan, as amended and restated effective January
1, 2008 (incorporated by reference to Exhibit 10.3 to Halliburton’s Form 10-Q for the quarter ended September 30, 2007, File No. 1-3492).
10.16 Halliburton Company Supplemental Executive Retirement Plan, as amended and
restated effective January 1, 2008 (incorporated by reference to Exhibit 10.4 to Halliburton’s Form 10-Q for the quarter ended September 30, 2007, File No. 1-3492).
10.17 Halliburton Company Benefit Restoration Plan, as amended and restated effective
January 1, 2008 (incorporated by reference to Exhibit 10.5 to Halliburton’s Form 10-Q for the quarter ended September 30, 2007, File No. 1-3492).
95
10.18 Halliburton Company Pension Equalizer Plan, as amended and restated effective
March 1, 2007 (incorporated by reference to Exhibit 10.8 to Halliburton’s Form 10-Q for the quarter ended September 30, 2007, File No. 1-3492).
10.19 Halliburton Company Directors’ Deferred Compensation Plan, as amended and
restated effective January 1, 2007 (incorporated by reference to Exhibit 10.9 to Halliburton’s Form 10-Q for the quarter ended September 30, 2007, File No. 1-3492).
10.20 Retirement Plan for the Directors of Halliburton Company, as amended and restated
effective July 1, 2007 (incorporated by reference to Exhibit 10.10 to Halliburton’s Form 10-Q for the quarter ended September 30, 2007, File No. 1-3492).
10.21 First Amendment to the Retirement Plan for the Directors of Halliburton Company,
effective September 1, 2007 (incorporated by reference to Exhibit 10.11 to Halliburton’s Form 10-Q for the quarter ended September 30, 2007, File No. 1-3492).
10.22 Revolving Bridge Facility Credit Agreement among Halliburton, as Borrower, the
Banks party thereto, and Citibank, N.A., as Agent (incorporated by reference to Exhibit 10.1 to Halliburton’s Form 10-Q for the quarter ended June 30, 2008, File No. 1-3492).
10.23 Underwriting Agreement, dated September 9, 2008, among Halliburton and
Citigroup Global Markets Inc., Greenwich Capital Markets, Inc. and HSBC Securities (USA) Inc., as representatives of the several underwriters identified therein (incorporated by reference to Exhibit 1.1 to Halliburton’s Form 8-K filed September 12, 2008, File No. 1-3492).
10.24 Six Month Revolving Credit Agreement among Halliburton, as Borrower, the Banks
party thereto, and HSBC Bank (USA) N.A., as Administrative Agent (incorporated by reference to Exhibit 10.1 to Halliburton’s Form 8-K filed October 16, 2008, File No. 1-3492).
10.25 Employment Agreement (James S. Brown) (incorporated by reference to Exhibit
10.36 to Halliburton’s Form 10-K for the year ended December 31, 2007, File No. 1-3492).
10.26 Employment Agreement (David S. King) (incorporated by reference to Exhibit 10.37
to Halliburton’s Form 10-K for the year ended December 31, 2007, File No. 1-3492). 10.27 Executive Agreement (Lawrence J. Pope) (incorporated by reference to Exhibit 10.1
to Halliburton’s Form 8-K filed December 12, 2008, File No. 1-3492).
96
10.28 Underwriting Agreement, dated March 10, 2009, among Halliburton and Citigroup
Global Markets Inc., Deutsche Bank Securities Inc., HSBC Securities (USA) Inc. and Greenwich Capital Markets, Inc., as representatives of the several underwriters identified therein (incorporated by reference to Exhibit 1.1 to Halliburton’s Form 8-K filed March 13, 2009, File No. 1-3492).
10.29 Halliburton Company Stock and Incentive Plan, as amended and restated effective
February 11, 2009 (incorporated by reference to Appendix B of Halliburton’s proxy statement filed April 6, 2009, File No. 1-3492).
10.30 Halliburton Company Employee Stock Purchase Plan, as amended and restated
effective February 11, 2009 (incorporated by reference to Appendix C of Halliburton’s proxy statement filed April 6, 2009, File No. 1-3492).
10.31 Form of Nonstatutory Stock Option Agreement (incorporated by reference to Exhibit
10.4 of Halliburton’s Form 10-Q for the quarter ended September 30, 2009, File No. 1-3492).
10.32 Form of Restricted Stock Agreement (incorporated by reference to Exhibit 10.5 of
Halliburton’s Form 10-Q for the quarter ended September 30, 2009, File No. 1-3492).
10.33 Form of Restricted Stock Unit Agreement (incorporated by reference to Exhibit 10.6
of Halliburton’s Form 10-Q for the quarter ended September 30, 2009, File No. 1-3492).
10.34 Form of Non-Employee Director Restricted Stock Agreement (incorporated by
reference to Exhibit 99.5 of Halliburton’s Form S-8 filed May 21, 2009, Registration No. 333-159394).
10.35 First Amendment to Halliburton Company Supplemental Executive Retirement Plan,
as amended and restated effective January 1, 2008 (incorporated by reference to Exhibit 10.1 to Halliburton’s Form 8-K filed September 21, 2009, File No. 1-3492).
10.36 Amendment No. 1 to Halliburton Company Benefit Restoration Plan, as amended
and restated effective January 1, 2008 (incorporated by reference to Exhibit 10.2 to Halliburton’s Form 8-K filed September 21, 2009, File No. 1-3492).
10.37 Halliburton Annual Performance Pay Plan, as amended and restated effective
January 1, 2010 (incorporated by reference to Exhibit 10.3 to Halliburton’s Form 8-K filed September 21, 2009, File No. 1-3492).
10.38 Executive Agreement (Evelyn M. Angelle) (incorporated by reference to Exhibit
10.34 to Halliburton’s Form 10-K for the year ended December 31, 2008, File No. 1-3492).
10.39 Executive Agreement (Ahmed H. Lotfy) (incorporated by reference to Exhibit 10.35
to Halliburton’s Form 10-K for the year ended December 31, 2008, File No. 1-3492).
97
10.40 Executive Agreement (Timothy J. Probert) (incorporated by reference to Exhibit 10.36 to Halliburton’s Form 10-K for the year ended December 31, 2008, File No. 1-3492).
10.41 Executive Agreement (Craig W. Nunez) (incorporated by reference to Exhibit 10.37
to Halliburton’s Form 10-K for the year ended December 31, 2008, File No. 1-3492). 10.42 Amendment to Executive Employment Agreement (David S. King) (incorporated by
reference to Exhibit 10.38 to Halliburton’s Form 10-K for the year ended December 31, 2008, File No. 1-3492).
10.43 Amendment to Executive Employment Agreement (James S. Brown) (incorporated
by reference to Exhibit 10.39 to Halliburton’s Form 10-K for the year ended December 31, 2008, File No. 1-3492).
10.44 Amendment to Executive Employment Agreement (Albert O. Cornelison)
(incorporated by reference to Exhibit 10.40 to Halliburton’s Form 10-K for the year ended December 31, 2008, File No. 1-3492).
10.45 Amendment to Executive Employment Agreement (C. Christopher Gaut)
(incorporated by reference to Exhibit 10.41 to Halliburton’s Form 10-K for the year ended December 31, 2008, File No. 1-3492).
10.46 Amendment to Executive Employment Agreement (David S. King) (incorporated by
reference to Exhibit 10.42 to Halliburton’s Form 10-K for the year ended December 31, 2008, File No. 1-3492).
10.47 Amendment to Executive Employment Agreement (Mark A. McCollum)
(incorporated by reference to Exhibit 10.43 to Halliburton’s Form 10-K for the year ended December 31, 2008, File No. 1-3492).
* 12.1 Statement of Computation of Ratio of Earnings to Fixed Charges. * 21.1 Subsidiaries of the Registrant. * 23.1 Consent of KPMG LLP.
98
24.1 Powers of attorney for the following directors signed in January 2007 (incorporated by reference to Exhibit 24.1 to Halliburton’s Form 10-K for the year ended December 31, 2006, File No. 1-3492):
Alan M. Bennett James R. Boyd Milton Carroll S. Malcolm Gillis J. Landis Martin Jay A. Precourt Debra L. Reed 24.2 Power of attorney for James T. Hackett signed in January 2009 (incorporated by
reference to Exhibit 24.2 to Halliburton’s Form 10-K for the year ended December 31, 2008, File No. 1-3492).
* 24.3 Power of attorney for Nance K. Dicciani, signed in July 2009. * 24.4 Power of attorney for Robert A. Malone, signed in June 2009. * 31.1 Certification of Chief Executive Officer pursuant to Section 302 of the Sarbanes-
Oxley Act of 2002. * 31.2 Certification of Chief Financial Officer pursuant to Section 302 of the Sarbanes-
Oxley Act of 2002. ** 32.1 Certification of Chief Executive Officer pursuant to Section 906 of the Sarbanes-
Oxley Act of 2002. ** 32.2 Certification of Chief Financial Officer pursuant to Section 906 of the Sarbanes-
Oxley Act of 2002. ** 101.INS XBRL Instance Document ** 101.SCH XBRL Taxonomy Extension Schema Document ** 101.CAL XBRL Taxonomy Extension Calculation Linkbase Document ** 101.LAB XBRL Taxonomy Extension Label Linkbase Document ** 101.PRE XBRL Taxonomy Extension Presentation Linkbase Document * Filed with this Form 10-K. ** Furnished with this Form 10-K.
99
SIGNATURES
As required by Section 13 or 15(d) of the Securities Exchange Act of 1934, the registrant has authorized this report to be signed on its behalf by the undersigned authorized individuals on this 17th day of February, 2010. HALLIBURTON COMPANY By /s/ David J. Lesar David J. Lesar Chairman of the Board, President, and Chief Executive Officer As required by the Securities Exchange Act of 1934, this report has been signed below by the following persons in the capacities indicated on this 17th day of February, 2010. Signature Title /s/ David J. Lesar Chairman of the Board, President, David J. Lesar Chief Executive Officer, and Director /s/ Mark A. McCollum Executive Vice President and Mark A. McCollum Chief Financial Officer /s/ Evelyn M. Angelle Vice President, Corporate Controller, and Evelyn M. Angelle Principal Accounting Officer

100
Signature Title * Alan M. Bennett Director Alan M. Bennett * James R. Boyd Director James R. Boyd * Milton Carroll Director Milton Carroll * Nance K. Dicciani Director Nance K. Dicciani * S. Malcolm Gillis Director S. Malcolm Gillis * James T. Hackett Director James T. Hackett * Robert A. Malone Director Robert A. Malone * J. Landis Martin Director J. Landis Martin * Jay A. Precourt Director Jay A. Precourt * Debra L. Reed Director Debra L. Reed * /s/ Sherry D. Williams Sherry D. Williams, Attorney-in-fact

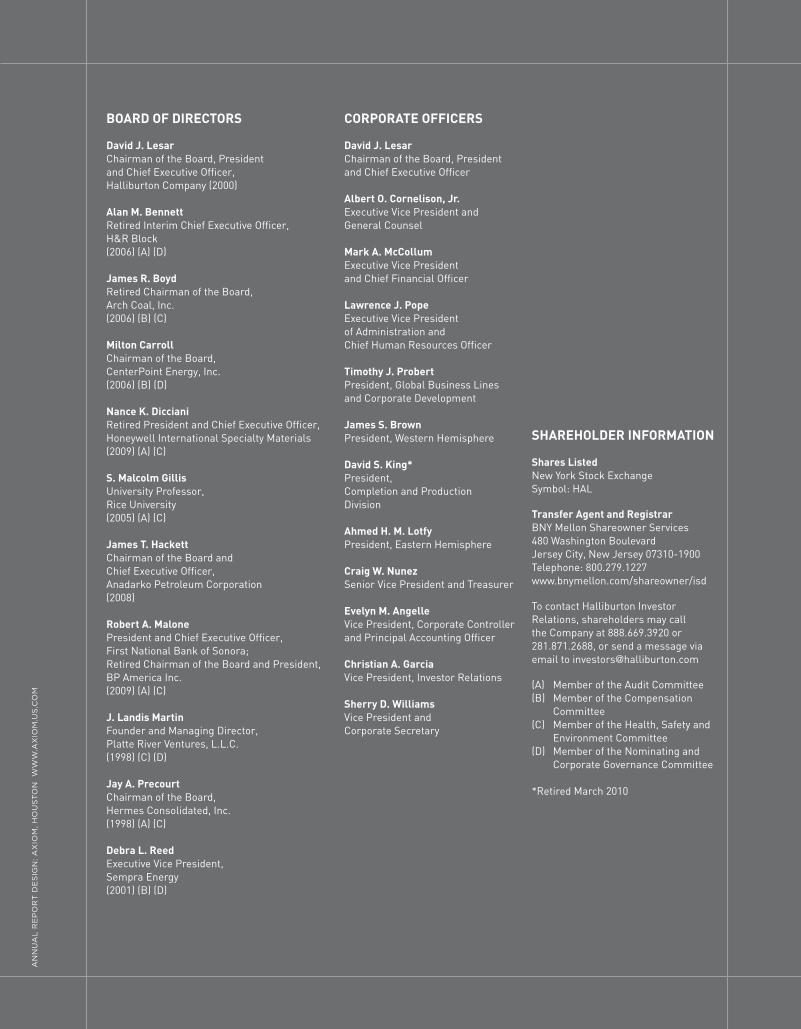
BOARD OF DIRECTORS
David J. LesarChairman of the Board, Presidentand Chief Executive Officer,Halliburton Company (2000)
Alan M. Bennett Retired Interim Chief Executive Officer,H&R Block(2006) (A) (D)
James R. BoydRetired Chairman of the Board,Arch Coal, Inc.(2006) (B) (C)
Milton CarrollChairman of the Board,CenterPoint Energy, Inc.(2006) (B) (D)
Nance K. DiccianiRetired President and Chief Executive Officer,Honeywell International Specialty Materials(2009) (A) (C)
S. Malcolm GillisUniversity Professor,Rice University(2005) (A) (C)
James T. HackettChairman of the Board andChief Executive Officer,Anadarko Petroleum Corporation(2008)
Robert A. MalonePresident and Chief Executive Officer,First National Bank of Sonora;Retired Chairman of the Board and President,BP America Inc.(2009) (A) (C)
J. Landis MartinFounder and Managing Director,Platte River Ventures, L.L.C.(1998) (C) (D)
Jay A. PrecourtChairman of the Board,Hermes Consolidated, Inc.(1998) (A) (C)
Debra L. ReedExecutive Vice President, Sempra Energy(2001) (B) (D)
CORPORATE OFFICERS
David J. LesarChairman of the Board, Presidentand Chief Executive Officer Albert O. Cornelison, Jr.Executive Vice President and General Counsel Mark A. McCollumExecutive Vice Presidentand Chief Financial Officer Lawrence J. PopeExecutive Vice Presidentof Administration andChief Human Resources Officer Timothy J. ProbertPresident, Global Business Linesand Corporate Development James S. BrownPresident, Western Hemisphere
David S. King* President, Completion and Production Division
Ahmed H. M. LotfyPresident, Eastern Hemisphere Craig W. NunezSenior Vice President and Treasurer
Evelyn M. AngelleVice President, Corporate Controllerand Principal Accounting Officer
Christian A. GarciaVice President, Investor Relations
Sherry D. WilliamsVice President andCorporate Secretary
SHAREHOLDER INFORMATION
Shares ListedNew York Stock ExchangeSymbol: HAL
Transfer Agent and RegistrarBNY Mellon Shareowner Services480 Washington BoulevardJersey City, New Jersey 07310-1900Telephone: 800.279.1227www.bnymellon.com/shareowner/isd
To contact Halliburton InvestorRelations, shareholders may callthe Company at 888.669.3920 or281.871.2688, or send a message via email to [email protected]
(A) Member of the Audit Committee(B) Member of the Compensation Committee(C) Member of the Health, Safety and Environment Committee(D) Member of the Nominating and Corporate Governance Committee
*Retired March 2010
AN
NU
AL
RE
PO
RT
DE
SIG
N:
AX
IOM
, H
OU
ST
ON
W
WW
.AX
IOM
.US
.CO
M

281.871.2699
www.halliburton.com
© 2010 Halliburton. All Rights Reserved.
Printed in the USA
H07510