Embed Size (px)
Citation preview
AbstractBrake squeal is an NVH issue experienced by brake systems and vehicle manufacturers for decades. This leads to customer dissatisfaction and the questioning of the quality of the brake system. Advanced testing tools, design modification, dynamometer testing, vehicle validation etc., are performed to study, analyze and eliminate this problem. But still it continues to exist nowadays. One of the most important reasons is the complexity of the brake pad having non-linear material properties. Therefore, it is imperative to understand the behavior of the brake pad in terms of its dynamic properties (eigenfrequencies, damping and mode shapes) under varying boundary conditions. Experimental Modal Analysis (EMA) is used to study the dynamic properties of any structure and is generally performed under free-free boundary conditions. An approach to study brake pads under pressure condition is a step towards reality, as brake pads squeal only during braking events. Therefore, the Brake Impedance Test machine (BIT) was developed. This work describes the development of the BIT to study brake pads under different piston compression loads, analyzing their results and proposing an approach to standardize the testing procedure. The brake pads are excited by a Scalable Automatic Modal hammer (SAM), with a precise controllable force level. The vibration response is measured contactless using a 3D Scanning Laser Doppler Vibrometer (3D SLDV). This research, under these conditions and advanced techniques, results in dynamic characteristics of brake pads closer to those in a real braking event. These results can be correlated with brake dynamometer data for further validation. The conclusions of these upcoming studies will lead to effective brake pad parameters for a robust brake design against squeal research.
Introduction and MotivationBrake squeal has been a key issue in the automotive industry for the past decades. Despite the efforts taken by the industry, undesired brake noise and vibrations are still widespread problems faced by
manufacturers of automobiles, brake systems and OEMs. Constant development in the NVH industry is stimulated by ever decreasing development times, more stringent noise and dust emission regulations and an industry in constant change.
Under a physics standpoint, brake squeal can be interpreted as energy dissipated due to self-excited vibrations caused by fluctuations in the friction forces at the pad/disc interface, due to phenomena like the stick/slip effect [1]. It is generally considered [2-3] that these fluctuations, which result in the annoying low-frequency squeal, are caused by macroscopic geometric instabilities. Many different parameters influence the vibrational behavior of a brake system. These parameters are located both at microscopic and macroscopic levels [4], but a fast-paced automotive industry rarely ventures on the quality assurance at microscopic level for practicality reasons.
The manufacturing process of a brake pad is a very complex procedure. The friction material of the brake pad consists of dozens of different components [5] that undergo processes like blending, molding, heating, grooving, chamfering, grinding, etc. [6] The complexities related to these procedures have an influence on the friction material and, ultimately, on the pads’ propensity to squeal. Thus, any small changes in the geometry or the above mentioned manufacturing processes will have an impact on the dynamic properties (eigenfrequencies, modal damping ratios and mode shapes) of these components.
The state of the art in NVH quality-related R&D comprises experimental and theoretical methods. Dynamical simulations are increasing their accuracy while their complexity is rising as well. On the other hand, OEMs and automobile manufacturers rely on simpler methods in their everyday quality R&D: methods such as compressibility testing, acoustic resonance, ultrasound, dynamometer testing and road testing are experimental methods of extensive use in the industry. However, the analyzed parts’ testing robustness is
Brake Impedance Test Stand - Modal Testing of Brake Pads under Pressurized Condition Using 3D SLDV and a Scalable Automatic Modal Hammer
2017-01-2485
Published 09/17/2017
Tarun Teja Mallareddy, Peter Blaschke, Sarah Schneider, and Daniel J. AlarcónTechnische Hochschule Wildau
CITATION: Mallareddy, T., Blaschke, P., Schneider, S., and Alarcón, D., "Brake Impedance Test Stand - Modal Testing of Brake Pads under Pressurized Condition Using 3D SLDV and a Scalable Automatic Modal Hammer," SAE Technical Paper 2017-01-2485, 2017, doi:10.4271/2017-01-2485.
Copyright © 2017 SAE International
Downloaded from SAE International by Daniel Alarcón, Tuesday, August 22, 2017
sensitive to friction material nonlinearities, geometric tolerances and changing system properties over time. These influences are not taken into account during these test procedures because in general, only one specification is tested at a time [7]. Test procedures and rigs developed in the last years [8, 9, 10] evaluate only small friction material samples, which are useful in order to correlate simulated material parameters; but they don’t describe the dynamic behavior of the entire brake pad assembly. Compressibility testing procedures use entire pads, but compressibility alone has been proven an uninteresting parameter when studying the vibro-acoustic properties of brake pads and more oriented to quality-assurance processes and pedal feel assessment [11].
This work proposes a novel test procedure by means of an in-house developed test stand, the Brake Pad Impedance Test Stand (BIT). The BIT recreates the piston compression conditions an entire brake pad experiences during a braking event. A relationship is established between line pressure, translated as piston compression, and the parameters obtained by Experimental Modal Analysis (EMA). The dynamic characteristics of brake pads are studied for different pressure loads on any kind of brake pad. The obtained results can enhance the understanding of the changes in mode shapes which take place during a braking event. The use of these dynamic properties, correlated with dynamometer results (as shown further on in this work) with Finite Element Analysis (FEA) brake simulations can help to build more robust FEA models and therefore, more accurate simulations and predictions of low-frequency brake squeal.
Materials and MethodsFour brake pads belonging a total of five batches are tested, the batches labeled as X1, X2, Y1, Y2 and Z. A modal test is performed on each pad under seven different compression loads at the Brake Pad Impedance Test Stand (BIT): 0, 5, 10, 15, 20, 25 and 30 bar - according to the specifications of the project industrial partner. Therefore, 140 measurements are performed in total. The manufacturer or serial numbers of the brake pads are not disclosed due to confidentiality reasons. Brake pads from batches X, Y and Z have slightly different manufacturing processes, while batches X1-X2 and Y1-Y2 present differences in terms of their geometry. The amount of obtained data is, therefore, very large and impossible to fit in an academic paper alone. This paper shows representative examples from these datasets and discusses the derived results.
The BIT is based on a traction/compression test stand Zwick Roell Z020, (Zwick GmbH, Ulm, Germany) with a design modification (Figure 1). The test stand can compress the brake pad with an equivalent pressure of up to 120 bar. Two stiff blocks are observable in the picture; the one at the top is the piston adapter, the one at the bottom is the compression block. The piston adapter consists of an aluminum block where manufacturer-specified piston(s) are rigidly attached. Piston adapters are manufactured in the laboratories at the TH Wildau in a case-by-case basis in order to meet the needs in regards of size, number and positioning of brake pistons of different potential project partners /customers. The pad is compressed in between the piston(s) and the compression block during a test.
Figure 1. Test setup of the BIT, with the Scalable Automatic Modal Hammer (SAM) as an excitation input. The brake pad and the pistons are blurred for confidentiality reasons. The piston adapter and the compression blocks are sprayed with reflective spray for testing purposes. A set of pistons is attached to the top aluminum part and a brake pad is compressed between the pistons and the compression block.
Modal analysis is performed on the brake pad at the BIT in order to dynamically characterize the studied brake pad under a given piston compression load. Typically, modal testing is performed under laboratory conditions, where the studied structure is freely suspended. It is obvious that a free-free setting is very different to the setting where brake pads actually work and squeal noise takes place. During a braking event, pads are compressed against a rotating brake disc by means of brake pistons and held together on a caliper. The BIT recreates these conditions during a modal test, although without the friction effects between pad and disc.
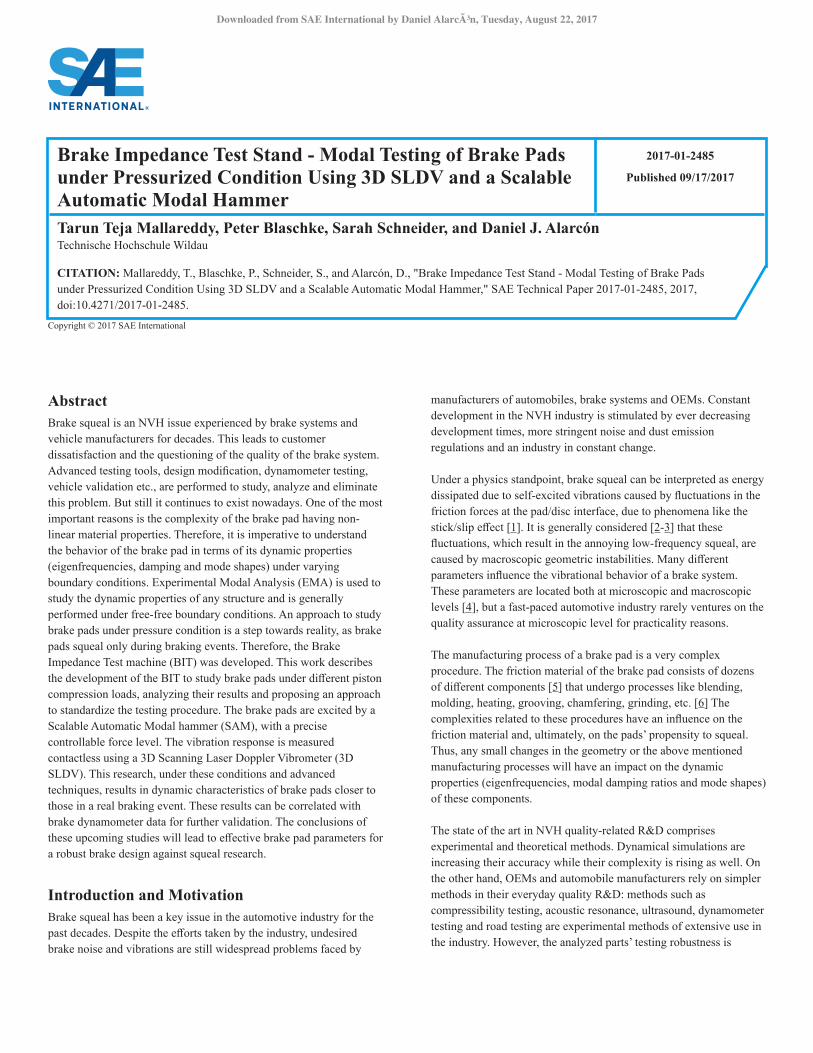
Any kind of experimental modal test needs an input excitation and an output signal. The modal test is in this case performed automatically for each test set up by means of the Scalable Automatic Modal Hammer (SAM, NV-TECH-Design, Steinheim a.d. Murr, Germany), presented in [12] and shown in detail in Figure 2, and a 3D Scanning Laser Doppler Vibrometer (3D SLDV). The tested brake pad is excited at one of its edges (as drawn in Figure 4) by means of the SAM. The SAM allows exciting a structure with precisely adjustable and reproducible force amplitudes. It is designed in a way that only the inertial mass of the impulse hammer tip impacts the test structure with a finely amplitude-adjustable Dirac impulse. The SAM is instrumented with a mini impulse modal hammer tip model 086E80 (PCB Piezotronics Inc., Depew, NY, USA). The rotation is digitally controlled in distance and velocity via the stepper motor software and transmitted to the motor via USB. Without the SAM, the testing time for a large number of DOFs and numerous brake pads in one batch would be of many hours and difficulties related with precision and operator fatigue would arise.
A general modal test setup and diagram can be seen in Figures 3 and 4 respectively. The joint use of these systems aims not only towards an increase in the accuracy of the experimental data, but also in the effective automatization of the data acquisition. Results regarding the successful implementation of these methods are presented in [13] among other works. A higher experimental practicality and a decrease in the testing time compared with more traditional techniques are expected.
Downloaded from SAE International by Daniel Alarcón, Tuesday, August 22, 2017
Figure 2. Detailed view of the Scalable Automatic Modal Hammer (SAM), mounted on a height scale. The SAM was mounted on a magnetic arm for this research in order to allow a better hammer access to the narrow space between brake pad and piston adapter. It also took advantage of the ferromagnetic surface of the traction/compression test stand.
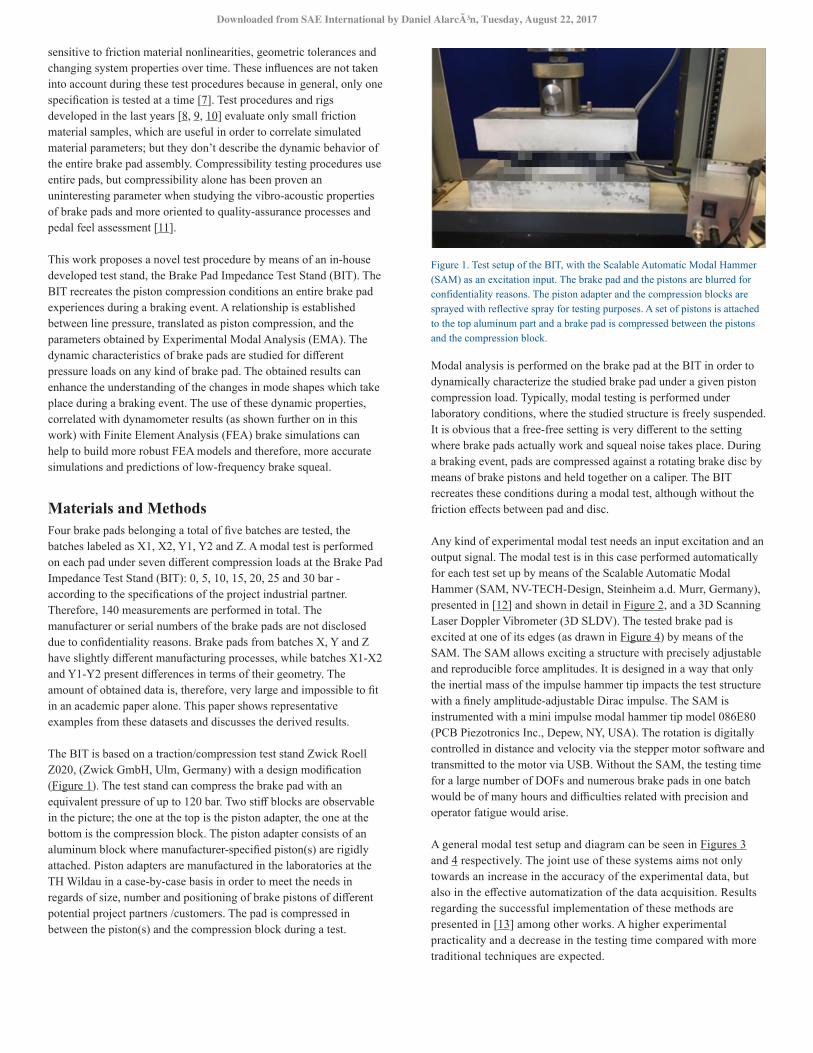
The response signals are measured by means of a 3D SLDV system model PSV-500-3D (Polytec GmbH, Waldbronn, Germany), (Figure 3), property of the Laboratory for Machine Dynamics and NVH at the TH Wildau. The side of the tested brake pad needs to be uniformly sprayed before the test with a non-aqueous white color developer (ARDROX 9D1B, Chemetall GmbH, Frankfurt a.M., Germany) to improve the reflectivity of the laser beams. By triangulating the signals of the three laser heads, the software decomposes the response of each beam on a given XYZ coordinate system. The operational deflection shape (ODS) of the brake pad is observed relative to this three-dimensional coordinate system, enabling the engineer to study both the in-plane and out of plane motion of the structure [14].
Figure 3. Typical modal test setup of the BIT. The SAM excites the brake pad while compressed by the traction/compression test stand. The vibration under compression is acquired by the 3D SLDV in the three directions of space. The entire setup is defined as the BIT.
For these measurements, the sampling frequency is set at 44.1 kHz, resulting in an effective bandwidth of 20 kHz and the signal is discretized with 12800 FFT lines, leading to a measurement resolution of ±1.56 Hz. 48 degrees of freedom (DOFs) are measured at the side of the brake pad with three averaged measurements at each DOF. Velocity output signals are measured at the edge of the brake pad as it is impossible to scan the backing plate surface. Due to the design of the BIT, it is not possible to position the laser beams in most of the surface regions, not even by using mirrors. The BIT should be severely modified, e.g. installing very long piston adapters, with the consequent risks of inaccuracies and even buckling effects
during the compression. The use of 3D SLDV allows obtaining the out-of-plane modes of the pad by measuring the edge of the pad, as seen on Figure 4 and in the next chapter of this work.
Figure 4. Side and top schematic representation of the hammer impact position (red arrow and point) and the SLDV scanned degrees of freedom (DOFs) represented with cyan squares. The brake pad is compressed against the compression block by means of a piston or a set of pistons, and the impacts are inflicted at the right corner of the backing plate surface, about 3 mm from the edges; in order to properly excite both bending and torsion resonant modes.
As seen in the ODSs and mode shapes further on this paper, 48 DOFs set a proper middle ground between spatial aliasing and testing time. The velocity output is measured in the range of 100 mm/s/V. For the excitation, the SAM is set to excite the tested brake pad with 60 N at the edge of the pad as shown in Figure 4. With these techniques, the average testing time for each pad is of around 10 minutes.
The experiments and the analysis of the ODSs are performed by means of the software PSV 9.1 (Polytec GmbH, Waldbronn, Germany). Modal parameters and shapes are extracted using ARTeMIS Modal Pro 5.0 (SVS A/S, Aalborg, Denmark). Eigenfrequencies are extracted by means of Frequency-Domain Decomposition (FDD) in this program and complexity values are calculated by the Complex Mode Indicator Function (CMIF) method and followed by an autocorrelation via Modal Assurance Criterion (MAC). Complexity data, shown further on this work, is also provided by this program. MATLAB 9.0 (MathWorks, Natick, MA, US) is used to create contour plots using the Frequency Response Functions (FRFs) derived from the tests, in order to evaluate the ODS patterns.
Results and Discussion
Robustness of the BITThe BIT was firstly tested in regards with its test robustness and the repeatability and reproducibility of the process. It is of critical importance to assess the non-interference of the BIT itself in the measurement results. If a global BIT vibrational mode is found in the results, it could invalidate the results of many brake pad analyses. Therefore, an ODS analysis was performed in the BIT meanwhile in a normal work cycle. Figure 5 shows the mobility of the DOF with the most deflection. The lack of any resonant peaks in the mobility evidences that this DOF’s deflection is mainly caused by background measurement noise and is of negligible amplitude.
Downloaded from SAE International by Daniel Alarcón, Tuesday, August 22, 2017
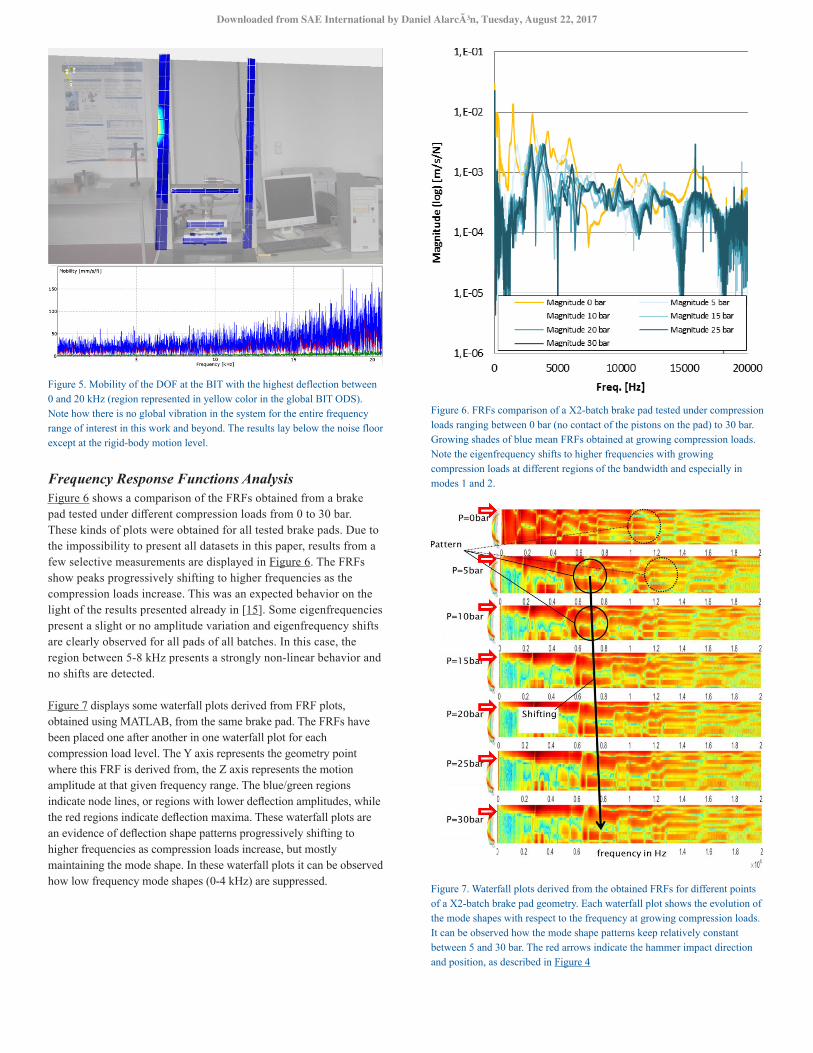
Figure 5. Mobility of the DOF at the BIT with the highest deflection between 0 and 20 kHz (region represented in yellow color in the global BIT ODS). Note how there is no global vibration in the system for the entire frequency range of interest in this work and beyond. The results lay below the noise floor except at the rigid-body motion level.
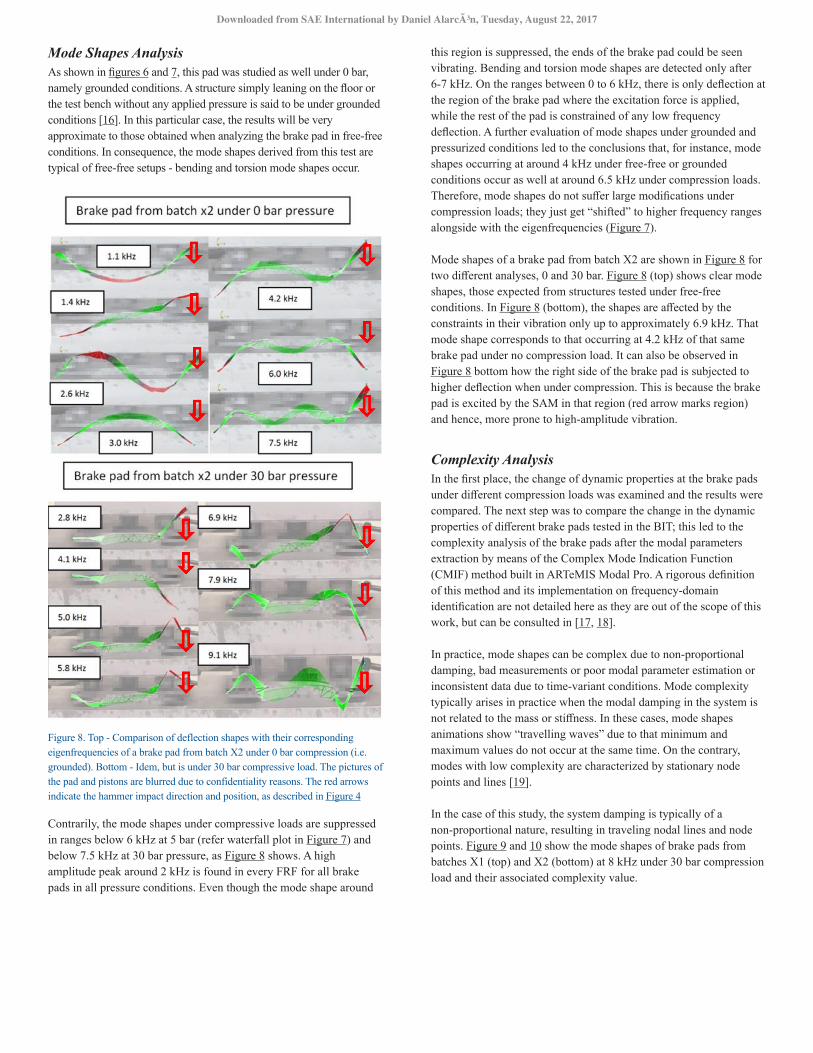
Frequency Response Functions AnalysisFigure 6 shows a comparison of the FRFs obtained from a brake pad tested under different compression loads from 0 to 30 bar. These kinds of plots were obtained for all tested brake pads. Due to the impossibility to present all datasets in this paper, results from a few selective measurements are displayed in Figure 6. The FRFs show peaks progressively shifting to higher frequencies as the compression loads increase. This was an expected behavior on the light of the results presented already in [15]. Some eigenfrequencies present a slight or no amplitude variation and eigenfrequency shifts are clearly observed for all pads of all batches. In this case, the region between 5-8 kHz presents a strongly non-linear behavior and no shifts are detected.
Figure 7 displays some waterfall plots derived from FRF plots, obtained using MATLAB, from the same brake pad. The FRFs have been placed one after another in one waterfall plot for each compression load level. The Y axis represents the geometry point where this FRF is derived from, the Z axis represents the motion amplitude at that given frequency range. The blue/green regions indicate node lines, or regions with lower deflection amplitudes, while the red regions indicate deflection maxima. These waterfall plots are an evidence of deflection shape patterns progressively shifting to higher frequencies as compression loads increase, but mostly maintaining the mode shape. In these waterfall plots it can be observed how low frequency mode shapes (0-4 kHz) are suppressed.
Figure 6. FRFs comparison of a X2-batch brake pad tested under compression loads ranging between 0 bar (no contact of the pistons on the pad) to 30 bar. Growing shades of blue mean FRFs obtained at growing compression loads. Note the eigenfrequency shifts to higher frequencies with growing compression loads at different regions of the bandwidth and especially in modes 1 and 2.
Figure 7. Waterfall plots derived from the obtained FRFs for different points of a X2-batch brake pad geometry. Each waterfall plot shows the evolution of the mode shapes with respect to the frequency at growing compression loads. It can be observed how the mode shape patterns keep relatively constant between 5 and 30 bar. The red arrows indicate the hammer impact direction and position, as described in Figure 4
Downloaded from SAE International by Daniel Alarcón, Tuesday, August 22, 2017
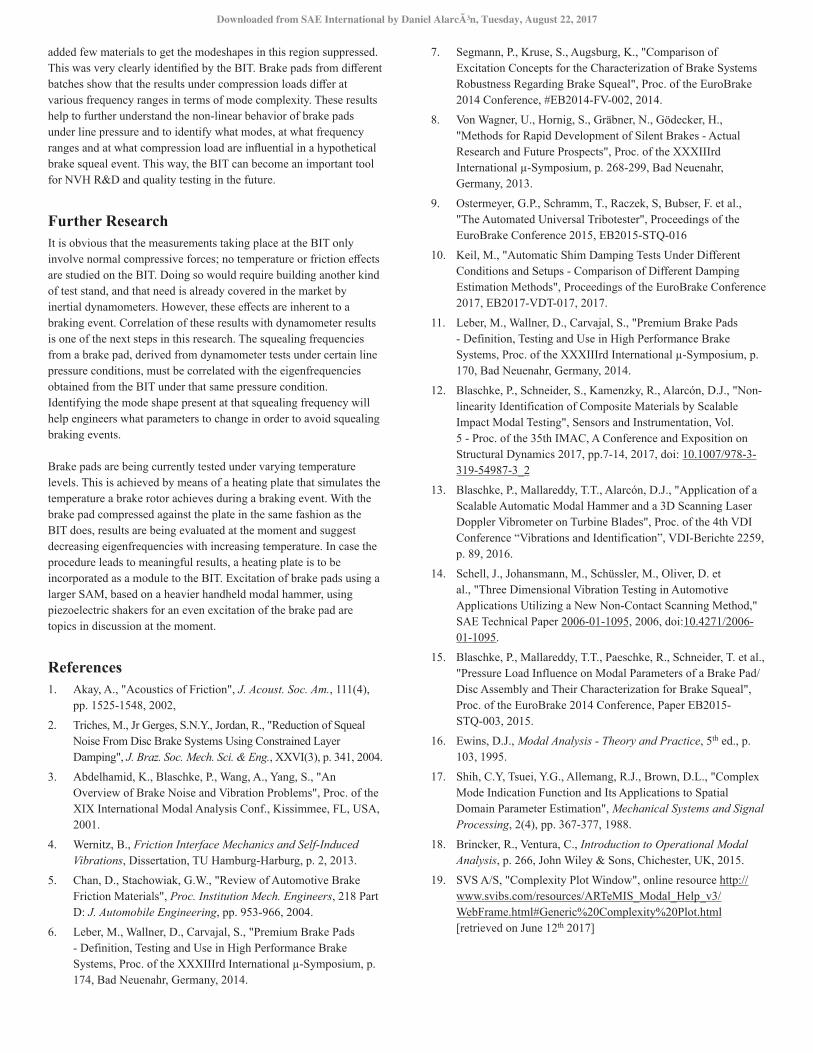
Mode Shapes AnalysisAs shown in figures 6 and 7, this pad was studied as well under 0 bar, namely grounded conditions. A structure simply leaning on the floor or the test bench without any applied pressure is said to be under grounded conditions [16]. In this particular case, the results will be very approximate to those obtained when analyzing the brake pad in free-free conditions. In consequence, the mode shapes derived from this test are typical of free-free setups - bending and torsion mode shapes occur.
Figure 8. Top - Comparison of deflection shapes with their corresponding eigenfrequencies of a brake pad from batch X2 under 0 bar compression (i.e. grounded). Bottom - Idem, but is under 30 bar compressive load. The pictures of the pad and pistons are blurred due to confidentiality reasons. The red arrows indicate the hammer impact direction and position, as described in Figure 4
Contrarily, the mode shapes under compressive loads are suppressed in ranges below 6 kHz at 5 bar (refer waterfall plot in Figure 7) and below 7.5 kHz at 30 bar pressure, as Figure 8 shows. A high amplitude peak around 2 kHz is found in every FRF for all brake pads in all pressure conditions. Even though the mode shape around
this region is suppressed, the ends of the brake pad could be seen vibrating. Bending and torsion mode shapes are detected only after 6-7 kHz. On the ranges between 0 to 6 kHz, there is only deflection at the region of the brake pad where the excitation force is applied, while the rest of the pad is constrained of any low frequency deflection. A further evaluation of mode shapes under grounded and pressurized conditions led to the conclusions that, for instance, mode shapes occurring at around 4 kHz under free-free or grounded conditions occur as well at around 6.5 kHz under compression loads. Therefore, mode shapes do not suffer large modifications under compression loads; they just get “shifted” to higher frequency ranges alongside with the eigenfrequencies (Figure 7).
Mode shapes of a brake pad from batch X2 are shown in Figure 8 for two different analyses, 0 and 30 bar. Figure 8 (top) shows clear mode shapes, those expected from structures tested under free-free conditions. In Figure 8 (bottom), the shapes are affected by the constraints in their vibration only up to approximately 6.9 kHz. That mode shape corresponds to that occurring at 4.2 kHz of that same brake pad under no compression load. It can also be observed in Figure 8 bottom how the right side of the brake pad is subjected to higher deflection when under compression. This is because the brake pad is excited by the SAM in that region (red arrow marks region) and hence, more prone to high-amplitude vibration.
Complexity AnalysisIn the first place, the change of dynamic properties at the brake pads under different compression loads was examined and the results were compared. The next step was to compare the change in the dynamic properties of different brake pads tested in the BIT; this led to the complexity analysis of the brake pads after the modal parameters extraction by means of the Complex Mode Indication Function (CMIF) method built in ARTeMIS Modal Pro. A rigorous definition of this method and its implementation on frequency-domain identification are not detailed here as they are out of the scope of this work, but can be consulted in [17, 18].
In practice, mode shapes can be complex due to non-proportional damping, bad measurements or poor modal parameter estimation or inconsistent data due to time-variant conditions. Mode complexity typically arises in practice when the modal damping in the system is not related to the mass or stiffness. In these cases, mode shapes animations show “travelling waves” due to that minimum and maximum values do not occur at the same time. On the contrary, modes with low complexity are characterized by stationary node points and lines [19].
In the case of this study, the system damping is typically of a non-proportional nature, resulting in traveling nodal lines and node points. Figure 9 and 10 show the mode shapes of brake pads from batches X1 (top) and X2 (bottom) at 8 kHz under 30 bar compression load and their associated complexity value.
Downloaded from SAE International by Daniel Alarcón, Tuesday, August 22, 2017
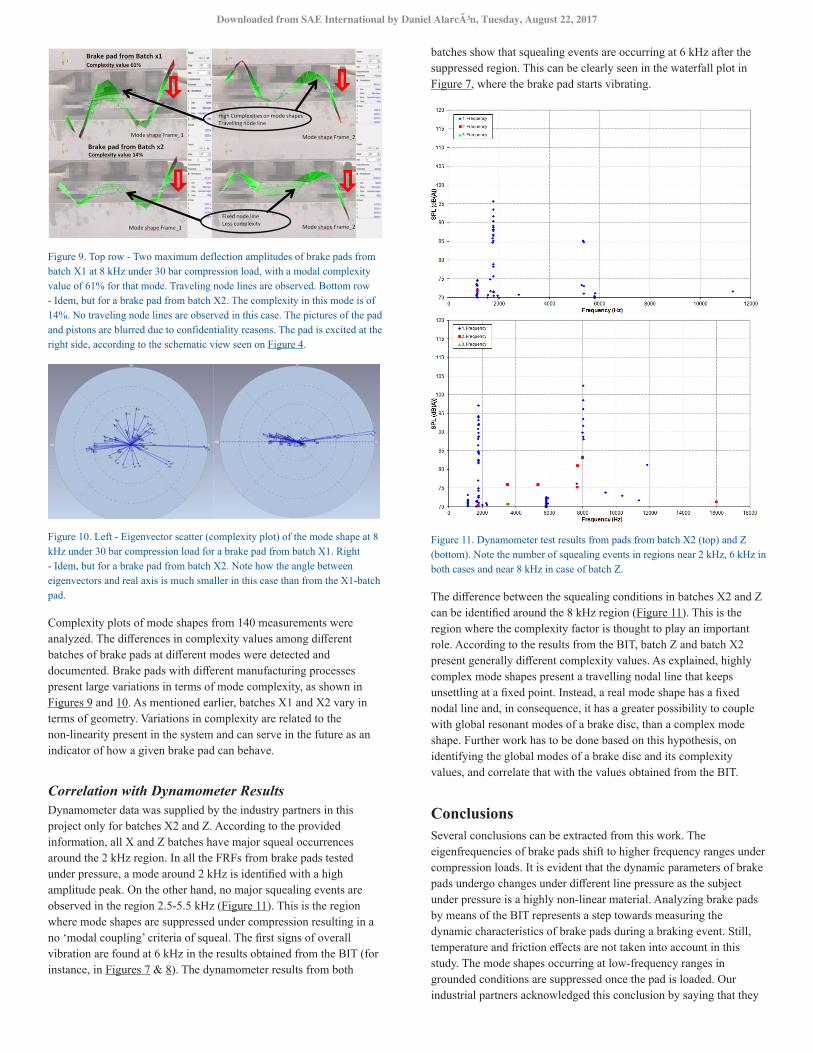
Figure 9. Top row - Two maximum deflection amplitudes of brake pads from batch X1 at 8 kHz under 30 bar compression load, with a modal complexity value of 61% for that mode. Traveling node lines are observed. Bottom row - Idem, but for a brake pad from batch X2. The complexity in this mode is of 14%. No traveling node lines are observed in this case. The pictures of the pad and pistons are blurred due to confidentiality reasons. The pad is excited at the right side, according to the schematic view seen on Figure 4.
Figure 10. Left - Eigenvector scatter (complexity plot) of the mode shape at 8 kHz under 30 bar compression load for a brake pad from batch X1. Right - Idem, but for a brake pad from batch X2. Note how the angle between eigenvectors and real axis is much smaller in this case than from the X1-batch pad.
Complexity plots of mode shapes from 140 measurements were analyzed. The differences in complexity values among different batches of brake pads at different modes were detected and documented. Brake pads with different manufacturing processes present large variations in terms of mode complexity, as shown in Figures 9 and 10. As mentioned earlier, batches X1 and X2 vary in terms of geometry. Variations in complexity are related to the non-linearity present in the system and can serve in the future as an indicator of how a given brake pad can behave.
Correlation with Dynamometer ResultsDynamometer data was supplied by the industry partners in this project only for batches X2 and Z. According to the provided information, all X and Z batches have major squeal occurrences around the 2 kHz region. In all the FRFs from brake pads tested under pressure, a mode around 2 kHz is identified with a high amplitude peak. On the other hand, no major squealing events are observed in the region 2.5-5.5 kHz (Figure 11). This is the region where mode shapes are suppressed under compression resulting in a no ‘modal coupling’ criteria of squeal. The first signs of overall vibration are found at 6 kHz in the results obtained from the BIT (for instance, in Figures 7 & 8). The dynamometer results from both
batches show that squealing events are occurring at 6 kHz after the suppressed region. This can be clearly seen in the waterfall plot in Figure 7, where the brake pad starts vibrating.
Figure 11. Dynamometer test results from pads from batch X2 (top) and Z (bottom). Note the number of squealing events in regions near 2 kHz, 6 kHz in both cases and near 8 kHz in case of batch Z.
The difference between the squealing conditions in batches X2 and Z can be identified around the 8 kHz region (Figure 11). This is the region where the complexity factor is thought to play an important role. According to the results from the BIT, batch Z and batch X2 present generally different complexity values. As explained, highly complex mode shapes present a travelling nodal line that keeps unsettling at a fixed point. Instead, a real mode shape has a fixed nodal line and, in consequence, it has a greater possibility to couple with global resonant modes of a brake disc, than a complex mode shape. Further work has to be done based on this hypothesis, on identifying the global modes of a brake disc and its complexity values, and correlate that with the values obtained from the BIT.
ConclusionsSeveral conclusions can be extracted from this work. The eigenfrequencies of brake pads shift to higher frequency ranges under compression loads. It is evident that the dynamic parameters of brake pads undergo changes under different line pressure as the subject under pressure is a highly non-linear material. Analyzing brake pads by means of the BIT represents a step towards measuring the dynamic characteristics of brake pads during a braking event. Still, temperature and friction effects are not taken into account in this study. The mode shapes occurring at low-frequency ranges in grounded conditions are suppressed once the pad is loaded. Our industrial partners acknowledged this conclusion by saying that they
Downloaded from SAE International by Daniel Alarcón, Tuesday, August 22, 2017
added few materials to get the modeshapes in this region suppressed. This was very clearly identified by the BIT. Brake pads from different batches show that the results under compression loads differ at various frequency ranges in terms of mode complexity. These results help to further understand the non-linear behavior of brake pads under line pressure and to identify what modes, at what frequency ranges and at what compression load are influential in a hypothetical brake squeal event. This way, the BIT can become an important tool for NVH R&D and quality testing in the future.
Further ResearchIt is obvious that the measurements taking place at the BIT only involve normal compressive forces; no temperature or friction effects are studied on the BIT. Doing so would require building another kind of test stand, and that need is already covered in the market by inertial dynamometers. However, these effects are inherent to a braking event. Correlation of these results with dynamometer results is one of the next steps in this research. The squealing frequencies from a brake pad, derived from dynamometer tests under certain line pressure conditions, must be correlated with the eigenfrequencies obtained from the BIT under that same pressure condition. Identifying the mode shape present at that squealing frequency will help engineers what parameters to change in order to avoid squealing braking events.
Brake pads are being currently tested under varying temperature levels. This is achieved by means of a heating plate that simulates the temperature a brake rotor achieves during a braking event. With the brake pad compressed against the plate in the same fashion as the BIT does, results are being evaluated at the moment and suggest decreasing eigenfrequencies with increasing temperature. In case the procedure leads to meaningful results, a heating plate is to be incorporated as a module to the BIT. Excitation of brake pads using a larger SAM, based on a heavier handheld modal hammer, using piezoelectric shakers for an even excitation of the brake pad are topics in discussion at the moment.
References1. Akay, A., "Acoustics of Friction", J. Acoust. Soc. Am., 111(4),
pp. 1525-1548, 2002,2. Triches, M., Jr Gerges, S.N.Y., Jordan, R., "Reduction of Squeal
Noise From Disc Brake Systems Using Constrained Layer Damping", J. Braz. Soc. Mech. Sci. & Eng., XXVI(3), p. 341, 2004.
3. Abdelhamid, K., Blaschke, P., Wang, A., Yang, S., "An Overview of Brake Noise and Vibration Problems", Proc. of the XIX International Modal Analysis Conf., Kissimmee, FL, USA, 2001.
4. Wernitz, B., Friction Interface Mechanics and Self-Induced Vibrations, Dissertation, TU Hamburg-Harburg, p. 2, 2013.
5. Chan, D., Stachowiak, G.W., "Review of Automotive Brake Friction Materials", Proc. Institution Mech. Engineers, 218 Part D: J. Automobile Engineering, pp. 953-966, 2004.
6. Leber, M., Wallner, D., Carvajal, S., "Premium Brake Pads - Definition, Testing and Use in High Performance Brake Systems, Proc. of the XXXIIIrd International µ-Symposium, p. 174, Bad Neuenahr, Germany, 2014.
7. Segmann, P., Kruse, S., Augsburg, K., "Comparison of Excitation Concepts for the Characterization of Brake Systems Robustness Regarding Brake Squeal", Proc. of the EuroBrake 2014 Conference, #EB2014-FV-002, 2014.
8. Von Wagner, U., Hornig, S., Gräbner, N., Gödecker, H., "Methods for Rapid Development of Silent Brakes - Actual Research and Future Prospects", Proc. of the XXXIIIrd International µ-Symposium, p. 268-299, Bad Neuenahr, Germany, 2013.
9. Ostermeyer, G.P., Schramm, T., Raczek, S, Bubser, F. et al., "The Automated Universal Tribotester", Proceedings of the EuroBrake Conference 2015, EB2015-STQ-016
10. Keil, M., "Automatic Shim Damping Tests Under Different Conditions and Setups - Comparison of Different Damping Estimation Methods", Proceedings of the EuroBrake Conference 2017, EB2017-VDT-017, 2017.
11. Leber, M., Wallner, D., Carvajal, S., "Premium Brake Pads - Definition, Testing and Use in High Performance Brake Systems, Proc. of the XXXIIIrd International µ-Symposium, p. 170, Bad Neuenahr, Germany, 2014.
12. Blaschke, P., Schneider, S., Kamenzky, R., Alarcón, D.J., "Non-linearity Identification of Composite Materials by Scalable Impact Modal Testing", Sensors and Instrumentation, Vol. 5 - Proc. of the 35th IMAC, A Conference and Exposition on Structural Dynamics 2017, pp.7-14, 2017, doi: 10.1007/978-3-319-54987-3_2
13. Blaschke, P., Mallareddy, T.T., Alarcón, D.J., "Application of a Scalable Automatic Modal Hammer and a 3D Scanning Laser Doppler Vibrometer on Turbine Blades", Proc. of the 4th VDI Conference “Vibrations and Identification”, VDI-Berichte 2259, p. 89, 2016.
14. Schell, J., Johansmann, M., Schüssler, M., Oliver, D. et al., "Three Dimensional Vibration Testing in Automotive Applications Utilizing a New Non-Contact Scanning Method," SAE Technical Paper 2006-01-1095, 2006, doi:10.4271/2006-01-1095.
15. Blaschke, P., Mallareddy, T.T., Paeschke, R., Schneider, T. et al., "Pressure Load Influence on Modal Parameters of a Brake Pad/Disc Assembly and Their Characterization for Brake Squeal", Proc. of the EuroBrake 2014 Conference, Paper EB2015-STQ-003, 2015.
16. Ewins, D.J., Modal Analysis - Theory and Practice, 5th ed., p. 103, 1995.
17. Shih, C.Y, Tsuei, Y.G., Allemang, R.J., Brown, D.L., "Complex Mode Indication Function and Its Applications to Spatial Domain Parameter Estimation", Mechanical Systems and Signal Processing, 2(4), pp. 367-377, 1988.
18. Brincker, R., Ventura, C., Introduction to Operational Modal Analysis, p. 266, John Wiley & Sons, Chichester, UK, 2015.
19. SVS A/S, "Complexity Plot Window", online resource http://www.svibs.com/resources/ARTeMIS_Modal_Help_v3/WebFrame.html#Generic%20Complexity%20Plot.html [retrieved on June 12th 2017]
Downloaded from SAE International by Daniel Alarcón, Tuesday, August 22, 2017
Contact InformationProf. Dr. Peter BlaschkeTH Wildau, Hochschulring 1, 15745 Wildau, [email protected]. +49(0)3375 508 358
AcknowledgmentsThis research has been funded by the program Zentrales Innovationsprogramm Mittelstand from the Federal Ministry of Economy and Energy of Germany on the grounds of a decision of the German Parliament; with the research grant number KF2014172ED4.
The authors would like to express their utmost gratitude to Mr. Dipl.-Ing. Carl-Heinz Edel for his assistance and interesting discussions in regards to the traction/compression test stand and throughout this project. The authors are very grateful to Prof. Dr. rer. nat. Andreas Foitzik and Prof. Dr. rer. nat. Michael Herzog for providing the traction/compression test stand and the temperature press to carry out this work, respectively. The authors thank the assistance as well of Prof. Dr. Roberto Montanari from the Università degli Studi di Roma II “Tor Vergata” for his guidance of Mr. Mallareddy’s doctoral research.
Definitions/Abbreviations3D SLDV - 3 Dimensional Scanning Laser Doppler Vibrometer
BIT - Brake Pad Impedance Test Stand
CMIF - Complex Mode Indicator Function
DOF - Degree of Freedom
EMA - Experimental Modal Analysis
FEA - Finite Element Analysis
FDD - Frequency-Domain Decomposition
FRF - Frequency Response Function
ODS - Operational Deflection Shape
SAM - Scalable Automatic Modal Hammer
The Engineering Meetings Board has approved this paper for publication. It has successfully completed SAE’s peer review process under the supervision of the session organizer. The process requires a minimum of three (3) reviews by industry experts.
All rights reserved. No part of this publication may be reproduced, stored in a retrieval system, or transmitted, in any form or by any means, electronic, mechanical, photocopying, recording, or otherwise, without the prior written permission of SAE International.
Positions and opinions advanced in this paper are those of the author(s) and not necessarily those of SAE International. The author is solely responsible for the content of the paper.
ISSN 0148-7191
http://papers.sae.org/2017-01-2485
Downloaded from SAE International by Daniel Alarcón, Tuesday, August 22, 2017


![RACING BRAKE PADS 2016 - Home - PAGID Racing BRAKE PADS 2016. 3 ... brake pads for optimal system performance and wear characteristics. ... DB 9 [ceramic brakes] 4941 4943](https://img.pdfslide.net/doc/110x75/5aae64e77f8b9a190d8c1a54/racing-brake-pads-2016-home-pagid-brake-pads-2016-3-brake-pads-for-optimal.jpg)