Embed Size (px)
Citation preview

*Rajeev Batra is S.S. Kresge Professor of Marketing (e-mail: [email protected]), and Peter Lenk is Professor of Operations Management Sci-ence and Marketing (e-mail: [email protected]), Ross School of Business,University of Michigan. Michel Wedel is PepsiCo Professor of ConsumerScience, Smith School of Business, University of Maryland (e-mail:[email protected]). The authors gratefully acknowledge the datacollection support of GfK and the Marketing Science Institute. They givespecial thanks to Raimund Wildner of GfK for his interest in this project.Helpful comments by Fred Feinberg and Zeynep Gurhan are also gratefullyacknowledged. All authors contributed equally; the order of names isalphabetical. Greg Allenby served as associate editor for this article.
RAJEEV BATRA, PETER LENK, and MICHEL WEDEL*
The majority of brand extensions reportedly fail, suggesting the needfor methodologies that allow for better strategic prediction of categoriesinto which a brand should extend or license. Prior literature suggests thatbrand extensions are likely to be more successful if a brand extends intoanother category into which its existing brand associations and imagery“fit” better and if the extending brand is “atypical” (if it possesses asso-ciations and imagery that are broad and abstract rather than tied tooclosely to the brand’s original product category). The authors develop amethodology in this study to estimate brand and category personalitystructures, using a Bayesian factor model that separates the two bymeans of brand-level and category-level random effects. This method-ology leads to measures of a brand’s fit and atypicality. The authorsillustrate and validate the model on two nationally representative datasets on brand personalities in three categories (jeans, magazines, andcars) and investigate the brand extension and licensing implications ofthe results obtained with the model.
Keywords: brand extensions, marketing strategy, brand personality,category personality, marketing research, brand management
Brand Extension Strategy Planning: EmpiricalEstimation of Brand–Category PersonalityFit and Atypicality
© 2010, American Marketing AssociationISSN: 0022-2437 (print), 1547-7193 (electronic) 335
Journal of Marketing ResearchVol. XLVII (April 2010), 335–347
Brand extensions—the use of an existing brand name ona new product in a new category to benefit from the existingbrand name’s awareness and associations—leverage theinvestments a company makes in its existing brand namesand hedge against the risk of new product failures. Thepopularity of this strategy is due to the belief that it leads tohigher consumer trial than the use of a new brand namebecause of the awareness levels and association (imagery)equities of the brand name being leveraged (Keller 2003, p.582). Many companies today also seek to leverage theirexisting brand assets through licensing deals to other manu-facturers in other categories (e.g., the Caterpillar brand on
boots, made by Wolverine footwear) or through cobrandingarrangements (e.g., Harley-Davidson with Ford trucks).These “extendibility” advantages significantly contribute toa brand’s financial value because they raise the estimate ofits future revenues (Keller 2003, p. 499).However, not all brand extensions succeed, and there is a
risk that failure will backfire on the image of the parentbrand (Martinez and Pina 2003). In the United States, newproducts experience failure rates between 80% and 90%,and brand extensions fail at a somewhat lower rate (Keller2003, pp. 581–82). Thus, there has been a burgeoning aca-demic research stream on the factors that promote or reducethe success of brand extensions. This academic research hashighlighted the contributing role of the breadth and abstract-ness of the extending brand’s associations and imagery andthe fit of these with the target category. This article fills avoid in the literature by proposing a methodology to esti-mate these constructs by separately measuring the associa-tion imagery of the extending brand, its “parent category,”and that of the product category into which it is beingextended. Using a Bayesian factor-analytic model (Ansariand Jedidi 2000; Ansari, Jedidi, and Dube 2002) for brandand category personality, we derive measures of a brand’s

336 JOURNAL OF MARKETING RESEARCH, APRIL 2010
Klink and Smith (2001) show, consumers’ answers to suchdirect questions are necessarily based on preconceived ideasof brand extendibility and may be confounded with priorattitudes, yielding problematic estimates of fit. Second,these “overall fit” estimates do not offer any diagnosticinsight into the “basis” of these fit assessments; understand-ing the specific associations that contribute to or detractfrom fit judgments could be important for the identificationof brand extension opportunities and strategy planning.Third, the prevalent “concept-testing” approach does notallow for the generation of new brand extensions or licens-ing or cobranding ideas; it simply allows for the testing of alimited number of already-generated concepts.Addressing these limitations, we present a nonattitudinal
method for empirically generating information about abrand extension’s fit without asking for direct consumerjudgments of fit and similarity between the extended brandand the new category, thus addressing some of the weak-nesses of such approaches (see Klink and Smith 2001). Weshow through two validation studies from an independentsample of consumers that our approach, which does not relyon typically used attitudinal measures of extension poten-tial, can nonetheless predict them well. Our approach alsoenables strategic insights into the contributing sources ofextension fit for a particular brand because it explores whichof many candidate brands and categories represents thehighest potential extension, licensing, or cobranding oppor-tunities by studying their attribute and imagery associations.Importantly, our approach can be applied to generate, notmerely to test, brand extension concepts, thus making it ofmuch greater strategic use than current methods.
Atypicality
In addition to possessing a high degree of fit with thecategory being extended into, brands with high extensionpotential also benefit from other qualities, according to priorliterature. An important finding from brand extensionresearch is that abstract associations are easier to extendthan concrete associations and that a brand name that is toostrongly identified with only its parent category, relative toan abstract quality that spans multiple categories, can bemore difficult to extend outside the category (Aaker andKeller 1990; Farquhar et al. 1992). This finding is consis-tent with prior research (Johnson 1984; Rosch et al. 1976)that abstract associations (e.g., entertainment) are inherentlymore inclusive and superordinate (or broader, and thus fitinto more product/service categories) than concrete associa-tions (e.g., television sets). Therefore, brands that are mar-keted on the basis of inherently more abstract “lifestyle”associations (e.g., Ralph Lauren) have historically proved tobe extendible into many other seemingly disparate productcategories (e.g., table linen, sunglasses, paint). For example,Heineken’s strong association with the concrete “beer” cate-gory might make it less extendible than another beer, suchas Corona, which also has a broader lifestyle association ofa partygoer or beach relaxation. Another example isClorox’s failure to extend successfully into the detergentcategory in the late 1980s, apparently limited by its too-strong association with the “bleachness” quality of its par-ent bleach category. The literature suggests that the degreeto which a particular brand’s associations and imagery areatypical of (and thus allow it to go beyond) the associations
atypicality with respect to its parent category and fit withthe target category. In the empirical study, we estimate thebrand personality model and brand atypicality and fit meas-ures with a nationally representative sample. We then vali-date these measures by predictively testing proposed brandextensions with a second, independent, nationally represen-tative sample. The methodology provides key strategicinsights for generating and assessing successful brandextension, licensing, and cobranding opportunities.
THE BRAND EXTENSION LITERATURE
A brand extension uses an existing brand name on a newproduct in a new category to benefit from the existing brandname’s attribute and imagery awareness and associations togain consumer trial, retailer distribution, and so forth, in thenew category. For example, a cross-category brand exten-sion could be one in which a car brand, such as Porsche,extends into categories such as pens or eyeglasses. Presum-ably, consumers’ favorable disposition toward Porsche andits associations with prestige and exciting style wouldextend to the new entries. Consequently, the literatureargues that the extending brand name must first possesshigh awareness and associations that are salient, strong,positive, relevant, and unique (Keller 2003, pp. 600–601).These brand associations must then also fit the categorybeing extended into and be “broad and abstract” enough toaccommodate the needs of that new category.
Fit
Extensions of a brand into a new category face the par-ticular challenge of needing to fit (be perceived as close to)the new product category being entered. Thus, while theimagery surrounding the National Geographic brand namemay fit the category requirements for travel clothing, travelshoes, or binoculars, the fit would likely be poorer if Moneymagazine were to launch these same brand extensions. Thenecessity and basis for this fit have been the primary sub-jects of most academic research on brand extensions in thelast 15 years (Aaker and Keller 1990; for a review, seeKeller 2003, pp. 608–623). An existing brand name fromanother category fits a new product category if there appearsto be a match at the level of concrete attributes (e.g., micro-processors, for Intel) or based on abstract imagery or per-sonality attributes (e.g., prestige and exciting style, forPorsche) (Batra, Lehmann, and Singh 1993; John andLoken 1993; Park, Milburg, and Lawson 1991). The moresalient, shared associations there are between the brandname and the new extension category, the greater is the per-ception of fit. The greater the perceived fit, the greater is thedegree to which consumers will view the perceptions andpreference of the extending brand to “carry over” to its newproduct category. Fit at the level of imagery is often agreater determinant of brand extension success than thedegree of favorable overall attitudes toward the extendingbrand or the degree of physical similarity between the par-ent and the entered-into product categories (Broniarczykand Alba 1994).Current methods of measuring fit simply ask consumers
for their overall perceptual assessments, using direct ratingscales such as “how well does the proposed extension fitwith the parent brand” (Keller 2003, p. 604). There are atleast three issues with the use of such measures. First, as

Brand Extension Strategy Planning 337
personality associations at both the brand and the categorylevels.
Brand Personality
Almost 50 years of research in marketing (Levy 1959;Martineau 1958) has shown that consumers’ perceptions ofand associations with brands go beyond their functionalattributes and benefits and include nonfunctional, symbolicqualities, often referred to as “brand image.” Among theseaspects of brand image are perceptions and associationsabout the brand’s personality, or the “set of humanlike char-acteristics associated with a brand” (Aaker 1997, p. 347).For example, among soft drinks, consumers often perceivePepsi as more “young,” Coke as more “real and honest,” andDr Pepper as more “nonconformist and fun” (Aaker 1997,p. 348). As we discussed previously, these personalityaspects of a brand extension often play a major role in con-sumer judgments of its fit and leverage in the new categoryinto which it extends (Batra, Lehmann, and Singh 1993;Park, Milburg, and Lawson 1991).
Measuring Brand Personality
The appropriate measurement of existing brand personal-ity imagery has been studied for approximately 25 years(Plummer 1984). Researchers have attempted to develop avalid and reliable measurement (survey) instrument ofbrand personality that is usable across various product cate-gories and consumer segments, drawing on the extensive lit-erature on human personality (Digman 1990; McCrae andCosta 1987) but also going beyond it when necessary(Batra, Lehmann, and Singh 1993). The measurementinstrument used most often is that developed by Aaker(1997).In her extensive development of this instrument, Aaker
(1997, p. 348) attempted to develop scales that would be“generalizable across product categories.” She asked 631respondents to rate each of 37 brands on 114 personalitytraits; these brands were carefully selected to represent abroad array of product/service categories, and a few brandsappeared per category. She factor-analyzed the between-brand variance after averaging the scores of each brand oneach personality trait across multiple respondents. (In otherwords, her data matrix was based on pooled data from 37brands across multiple product categories.) Using thisaggregated category–brand matrix, she found five factors:“sincerity” (sample item: honest), “excitement” (daring),“competence” (reliable), “sophistication” (upper-class), and“ruggedness” (tough) (we describe her scale in greaterdetail subsequently). Although “most of the research paperson brand personality are now based on Aaker’s scale”(Azoulay and Kapferer 2003, p. 144), there has been criti-cism of her scale both on conceptual grounds (Azoulay andKapferer 2003; Caprara, Barbaranelli, and Guido 2001) andfor its generalizability (Austin, Siguaw, and Mattila 2003).
Category Personality
Prior literature also suggests that entire product cate-gories (e.g., beverages) or subcategories (e.g., beer, wine,milk), not only brands within them, possess a “personality.”As Levy (1986, pp. 216–17) writes, “a primary source ofmeaning is the product (category) itself”; he notes thatwithin the beverage category, liquor connotes discrimina-
and imagery of its parent product category affects thedegree to which the brand possesses a quality of abstract-ness that enhances its ability to extend into other categories.However, although this line of reasoning suggests that a
brand whose imagery is just the standard, default imageryof its parent product category should be limited in its exten-sion potential beyond that category, this may not always bethe case. As Tauber (1988) points out, for a brand extensionto succeed, its existing brand associations must also give thenew entrant perceptions of being different and better thanthe existing brands in that new category, which he calls“competitive leverage” (powerful, unique, and stronglylinked associations). Therefore, an expanding brand couldsometimes benefit from, rather than be hurt by, its strongidentification with the imagery of its parent product cate-gory. Thus, while the concrete, category-linked bleachnessassociation of Clorox may limit its extendability into cate-gories in which “strong cleaning power” is not valued, thissame association may provide leverage in an extended-intocategory in which this association is highly valued.As a result of these two competing ideas, it is not entirely
clear whether an extending brand will benefit from or behurt by strong identification with the imagery of its parentproduct category. Nonetheless, it appears that the degree ofsuch identification may play an important role in determin-ing a brand’s extension ability and power. As such, it wouldbe useful to obtain an empirical quantification of the degreeto which an individual brand’s imagery overlaps with or dif-fers from the imagery of the parent product category withwhich it is strongly identified. The assessment of such“deviance from category baselines” will depend on how theproduct category itself is defined—all cars, just sports cars,or just family sedans. The Porsche brand may display someatypicality in a broader set of cars, but not if only sports carsare being studied. Despite these caveats, to our knowledge,no study in the literature has empirically assessed the quan-titative degree of atypicality.Our approach employs a factor-analytic approach to mod-
eling a consumer’s “net” brand associations as being shapedby both the overall associations of the category of which itis a part and its own idiosyncratic brand aspects. This studyattempts to provide an answer to the following questions:To what extent, and for what reasons, is the parent brandviewed as being too similar to and, thus, possibly limited byits parent category associations (atypicality)? To whatextent, and for what reasons, is the personality of its parentcategory congruent with the imagery of the product cate-gories into which it is potentially being extended (fit)?To empirically assess the degree and type of fit and atypi-
cality for a brand extension, we chose to work in the domainof “brand personality” brand associations, instead of asso-ciations with regard to concrete brand attributes or benefits(though our approach is applicable to these as well),because these personality associations are inherently moreabstract and therefore may be considered more relevantacross a wide set of product categories (Keller 2003, p.614). Indeed, the recent growth of “lifestyle megabrands”(e.g., Ralph Lauren, Martha Stewart, Nike) into multiplephysically unrelated product categories testifies to theextension power of these abstract brand personality associa-tions. We now turn to a discussion of the literature on these
338 JOURNAL OF MARKETING RESEARCH, APRIL 2010
and magazines, with ten brands in each category. Weselected these categories because we believed that theywould each involve considerations of the user’s values andlifestyle and because they would vary meaningfully onRatchford’s (1987) think-versus-feel dimensions (i.e., in theutilitarian, symbolic, and emotional benefits they provide).The collected data showed that they indeed varied meaning-fully on these dimensions; cars were the highest on the utili-tarian (useful, beneficial, practical) and highest on the sym-bolic (tells others about me, self-image) benefits, jeans werethe second-highest on the utilitarian and symbolic ones, andmagazines were the highest on the hedonic (fun, pleasura-ble, enjoyable) attributes and lowest on the utilitarian andsymbolic ones.A major challenge in developing the questionnaire was
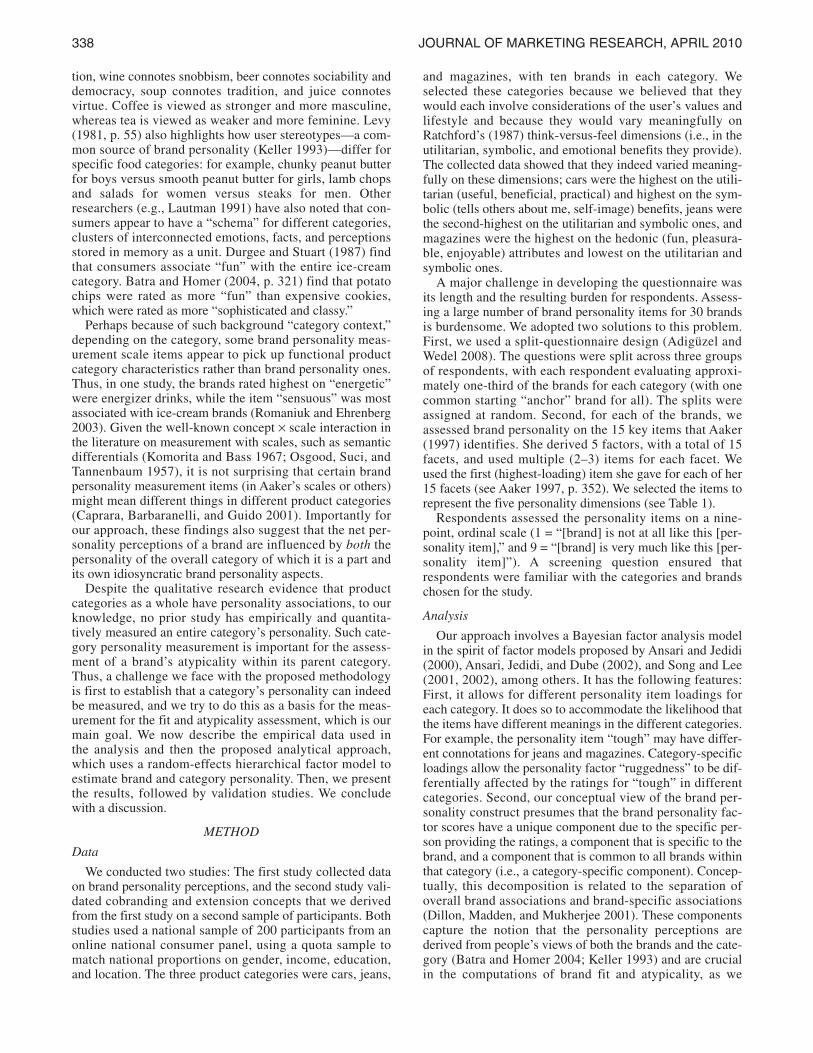
its length and the resulting burden for respondents. Assess-ing a large number of brand personality items for 30 brandsis burdensome. We adopted two solutions to this problem.First, we used a split-questionnaire design (Adigüzel andWedel 2008). The questions were split across three groupsof respondents, with each respondent evaluating approxi-mately one-third of the brands for each category (with onecommon starting “anchor” brand for all). The splits wereassigned at random. Second, for each of the brands, weassessed brand personality on the 15 key items that Aaker(1997) identifies. She derived 5 factors, with a total of 15facets, and used multiple (2–3) items for each facet. Weused the first (highest-loading) item she gave for each of her15 facets (see Aaker 1997, p. 352). We selected the items torepresent the five personality dimensions (see Table 1).Respondents assessed the personality items on a nine-
point, ordinal scale (1 = “[brand] is not at all like this [per-sonality item],” and 9 = “[brand] is very much like this [per-sonality item]”). A screening question ensured thatrespondents were familiar with the categories and brandschosen for the study.
Analysis
Our approach involves a Bayesian factor analysis modelin the spirit of factor models proposed by Ansari and Jedidi(2000), Ansari, Jedidi, and Dube (2002), and Song and Lee(2001, 2002), among others. It has the following features:First, it allows for different personality item loadings foreach category. It does so to accommodate the likelihood thatthe items have different meanings in the different categories.For example, the personality item “tough” may have differ-ent connotations for jeans and magazines. Category-specificloadings allow the personality factor “ruggedness” to be dif-ferentially affected by the ratings for “tough” in differentcategories. Second, our conceptual view of the brand per-sonality construct presumes that the brand personality fac-tor scores have a unique component due to the specific per-son providing the ratings, a component that is specific to thebrand, and a component that is common to all brands withinthat category (i.e., a category-specific component). Concep-tually, this decomposition is related to the separation ofoverall brand associations and brand-specific associations(Dillon, Madden, and Mukherjee 2001). These componentscapture the notion that the personality perceptions arederived from people’s views of both the brands and the cate-gory (Batra and Homer 2004; Keller 1993) and are crucialin the computations of brand fit and atypicality, as we
tion, wine connotes snobbism, beer connotes sociability anddemocracy, soup connotes tradition, and juice connotesvirtue. Coffee is viewed as stronger and more masculine,whereas tea is viewed as weaker and more feminine. Levy(1981, p. 55) also highlights how user stereotypes—a com-mon source of brand personality (Keller 1993)—differ forspecific food categories: for example, chunky peanut butterfor boys versus smooth peanut butter for girls, lamb chopsand salads for women versus steaks for men. Otherresearchers (e.g., Lautman 1991) have also noted that con-sumers appear to have a “schema” for different categories,clusters of interconnected emotions, facts, and perceptionsstored in memory as a unit. Durgee and Stuart (1987) findthat consumers associate “fun” with the entire ice-creamcategory. Batra and Homer (2004, p. 321) find that potatochips were rated as more “fun” than expensive cookies,which were rated as more “sophisticated and classy.”Perhaps because of such background “category context,”
depending on the category, some brand personality meas-urement scale items appear to pick up functional productcategory characteristics rather than brand personality ones.Thus, in one study, the brands rated highest on “energetic”were energizer drinks, while the item “sensuous” was mostassociated with ice-cream brands (Romaniuk and Ehrenberg2003). Given the well-known concept × scale interaction inthe literature on measurement with scales, such as semanticdifferentials (Komorita and Bass 1967; Osgood, Suci, andTannenbaum 1957), it is not surprising that certain brandpersonality measurement items (in Aaker’s scales or others)might mean different things in different product categories(Caprara, Barbaranelli, and Guido 2001). Importantly forour approach, these findings also suggest that the net per-sonality perceptions of a brand are influenced by both thepersonality of the overall category of which it is a part andits own idiosyncratic brand personality aspects.Despite the qualitative research evidence that product
categories as a whole have personality associations, to ourknowledge, no prior study has empirically and quantita-tively measured an entire category’s personality. Such cate-gory personality measurement is important for the assess-ment of a brand’s atypicality within its parent category.Thus, a challenge we face with the proposed methodologyis first to establish that a category’s personality can indeedbe measured, and we try to do this as a basis for the meas-urement for the fit and atypicality assessment, which is ourmain goal. We now describe the empirical data used inthe analysis and then the proposed analytical approach,which uses a random-effects hierarchical factor model toestimate brand and category personality. Then, we presentthe results, followed by validation studies. We concludewith a discussion.
METHOD
Data
We conducted two studies: The first study collected dataon brand personality perceptions, and the second study vali-dated cobranding and extension concepts that we derivedfrom the first study on a second sample of participants. Bothstudies used a national sample of 200 participants from anonline national consumer panel, using a quota sample tomatch national proportions on gender, income, education,and location. The three product categories were cars, jeans,
Brand Extension Strategy Planning 339
explain subsequently. Thus, the model captures both possi-ble mechanisms—measurement and category/brandschemata—for brand personality and category personalitystructures. Third, the model is a confirmatory factor model,based on Aaker’s (1997) brand personality measurementinstrument. Fourth, we accommodate the rank- order natureof the brand personality scales and respondents’ idiosyn-cratic usage of those scales, which Rossi, Gilula, andAllenby (2001) show to be important. Fifth, we impute thedata missing as a result of the split-questionnaire design ofthe brand personality survey at the same time as we estimatethe model. Such imputation has been previously proposedby Ragunathan and Grizzle (1995), Lenk, Wedel, and Bock-enholt (2006), and Adigüzel and Wedel (2008); here, weextend their approach to an ordinal data factor model. Thus,all these features are integrated into a single model for theanalysis of brand personality.We use a confirmatory factor analysis (CFA) for Aaker’s
(1997) brand personality scales. For our data, brands areunique to categories, and “b|c” indicates that brand b isnested in category c. The P-dimensional personality factorscores βi,b|c for respondent i and brand b nested within cate-gory c express respondent, brand, and category influenceson the latent personality dimensions. We represent the struc-ture of the personality data through a random-effectsdecomposition of the factor scores:
(1) βi,b|c = αi + αi,c + αi,b|c for i = 1, …, n;
b = 1, ..., B; and c = 1, …, C.
The αi are personality random effects that are unique to theperson i and common across the product categories andbrands. The αi,c are random effects that reflect personalitytraits common to all brands within category c, varyingacross categories—that is, these are the category personalityscores. Finally, αi,b|c reflect personality traits that are spe-cific to the brand b in product category c after we adjust forcategory-specific personality traits—that is, these are the(“pure”) brand personality scores. The random effects inEquation 1 are mutually independent and normally distrib-uted with mean of zero and the following standard (P × P)covariance matrices:
(2) Var(αi) = Λ; Var(αi,c) = Λc, and Var(αi,b|c) = Λb|c.
The off-diagonal elements of all three matrices are zero, sothese personality random effects are uncorrelated. Thisassumption is standard in factor analysis, and we adopt ithere for parsimony. The random-effects decompositioninduces a correlation structure on the personality scores: (1)The covariance among brands in different categories is dueto the common person effect; (2) the covariance among dif-ferent brands in the same category is due to common personand category effects; and (3) the variance of a brand is dueto person, category, and brand effects. Unlike traditionalfactor analysis, which assumes that the factor variances areone, we allow them to vary freely. (We set the variance ofthe first subject-level effect to a constant for identification.)The brand personality factor scores {βi,b|c} determine the
level for personality item j:
(3) Ui,j,b|c = ϕi + µj + L′j,cβi,b|c + εi,j,b|c for j = 1, …, J,
where ϕi is a random effect that captures individual-levelscale usage effects, µj is the grand mean for item j across allbrands and respondent, Lj,c is a vector of category-specificloadings, and εi,j,b|c are normally distributed errors. In CFA,each loading vector has only one free parameter, and the restare zeros. If the loadings are not equal to one, ϕi and αi areidentified. The category-specific loadings capture the possi-bly differential meaning of the items in every category,based on the theories of concept × scale interaction(Caprara, Barbaranelli, and Guido 2001; Osgood, Suci, andTannenbaum 1957) we outlined previously. Thus, the for-mulation extends Aaker’s (1997) original work because thepersonality structure in terms of the factor loadings isassumed to be invariant across categories.We can summarize the model as
for respondent i, personality item j, and brand b nestedwithin category c. Furthermore, respondent i selects scalepoint k for item j if the latent variable Ui,j,b|c falls between
( )4 U � =� � +� � +� L + + +�i,j,b|c i j j,c i i,c i,b|cϕ µ α α α′ ( ) εεϕ τ ε σ
i,j,b|c
Var and Var
Vari i j b c j b c( ) ;, , | , |= ( ) =2 2
αα αα
i f i c f c
i
diag Var diag and
Var( ) = ( ) ( ) = ( )k k2 2; ;, ,
,bb c f b cdiag| , | ,( ) = ( )k2
Table 1VARIATIONS IN CFA LOADINGS BY CATEGORY FOR THE FIVE-FACTOR PERSONALITY MODEL
Posterior Means Posterior Standard Deviations
Dimension Item Cars Jeans Magazines Pooled Cars Jeans Magazines Pooled
Sincerity Down-to-earth 1.925 2.068 1.837 1.907 .236 .221 .225 .132Honest 1.050 1.511 1.318 1.290 .143 .177 .172 .093
Wholesome 1.760 1.901 1.960 1.777 .214 .208 .230 .128Cheerful .992 .924 .754 .821 .148 .118 .118 .067
Exciting Daring 1.544 1.662 1.637 1.570 .185 .189 .184 .109Spirited 1.393 1.531 1.661 1.449 .171 .177 .184 .107
Imaginative 1.491 1.854 1.869 1.679 .177 .208 .209 .118Up-to-date 1.182 1.675 1.022 1.323 .159 .199 .144 .101
Competence Reliable 1.603 1.318 1.887 1.642 .190 .166 .212 .119Intelligent 1.521 1.179 2.270 1.666 .185 .176 .268 .116Successful 2.208 1.421 1.930 1.879 .246 .182 .232 .144
Sophistication Upper-class 1.522 1.011 .258 1.930 .241 .235 .173 .175Charming .395 .969 1.049 .421 .087 .183 .240 .053
Ruggedness Outdoorsy 2.582 2.596 2.374 2.239 .291 .262 .281 .164Tough 1.142 1.763 .865 1.276 .152 .184 .120 .088
340 JOURNAL OF MARKETING RESEARCH, APRIL 2010
two consecutive cut-points (Rossi, Gilula, and Allenby2001):
(5) Qi,j,b|c = k if and only if ηi(k – 1) < Ui,j,b|c ≤ ηi(k),
where there are K scale categories, ηi(k) are cut-pointparameters, and Qi,j,b|c is the observed data. To identify themodel, we set the cut-point parameters ηi(1) and ηi(K – 1)to –1 and 1, respectively. There are K – 3 unknown cut-points per respondent to be estimated from the data. WebAppendix A summarizes the model and provides detailsabout the cut-point model, distributional assumptions, iden-tification constraints, the covariance structure of the model,and data imputation. Table WA1 details the induced covari-ances for {Ui,j,b|c}. Web Appendix B provides a summary ofthe Markov chain Monte Carlo (MCMC) algorithm(Gelfand and Smith 1990) (for Web Appendixes A and B,see http://www.marketingpower.com/jmrapril10).
Fit and Atypicality Measures
At each iteration of the MCMC sampler, we computebrand locations and fit and atypicality measures. Fromthese, we then compute means and standard deviationsacross iterations. We computed both the fit and the atypical-ity measures from each brand’s location in brand perceptualspace using the factor scores βi,b|c = αi + αi,c + αi,b|c. Thecomputations include only factor scores for observedbrands. To obtain the brand locations at each iteration of theMCMC, we first standardize {βi,b|c} within respondent iacross all brands in the study by subtracting the means anddividing by the standard deviations:
where χ is the indicator function. Then, for brand b incategory c, we averaged these scores to obtain the brandlocations:
The brand personality space is five dimensional. The categorypersonality ξc is the average of the brands in the category:
The measure of fit of brand b in category c to category c′ isthe root square error (RSE) between ξb|c and ξc′:
( ) .|81
1
ξ ξc c� =�B b
b
B
=∑
( )
|
7 1ξ
ψ χ
χb|c
i,b|c
� =� i
n
i evaluated b c
i evaluate
=∑ ( )
dd b ci
n
|
.
( )=∑
1
( ),
, |
6
1
11
ψβ β
β β χ
βi,b|c
i,b|c� =−
===∑∑
i
i
ii
i b c
b
B
c
C
s
nii evaluated b c
sn
i evaii
i b cb
B
c
C
|
, , |
( )
===∑∑β β χ2 2
11
1lluated b c n
n i evaluated b c
i i
i
b
| –
|
( )
= ( )=
β
χ
2
111
B
c
C
∑∑=
,
The smaller the RSE, the better the fit is between brand b|cand category c′. The atypicality measure is the percentageof variation in the brand personality that is not due to thecategory personality:
Atypicality ranges from zero to one. If the brand personalityis completely inherited from the category personality, atypi-cality is zero. Atypicality is one if the brand personalitylocations become infinitely far from the category locations.1
Model Comparisons
We estimated the confirmatory, hierarchical factor modelon our data, which used Aaker’s (1997) brand personalitymeasurement instrument. In addition, to investigate theimportance of the category-specific factor structure and thecut-point specification, we estimated two other models:
1. A model without the category-specific factor structure—thatis, with one set of “pooled” loadings across the three cate-gories. This model is comparable to Aaker’s (1997) factoranalysis but goes beyond it to also accommodate heterogene-ity across respondents, scale usage, and missing data.
2. A model without the cut-point-specification that accommo-dates the ordered nature of the scales (the personality itemswere standardized within subjects to remove scale usage in asimpler way). This model has a confirmatory factor structureand a category-specific factor structure, and it accommodatesheterogeneity across respondents and missing data.
The R-square (correlation squared) between the observedratings and those fit by the model was 61.3%. Although it isnot our purpose to compare our procedure directly withAaker’s—because our data are based on only a subset of herpersonality items—we believe that the model with thepooled-categories factor structure is a strong benchmarkagainst which to test our model. The model with a category-specific factor structure has better fit (larger log-marginaldensity) than the pooled-categories model: –53,776 for thecategory-specific structure versus –53,941 for the commonstructure. Thus, there is evidence of a category influence onthe structure of brand personality, which we explore ingreater detail subsequently. Finally, the correlation betweenthe factor scores for the models with and without cut-pointsranged from .92 to .98 (note that the log-marginal densitiesare not comparable for these models because of a differentdata distribution). This shows that the cut-point modelresults are robust and that similar results would be obtainedwith a simpler formulation. Yet the cut-point model hasbeen well established and is more appealing on theoreticalgrounds (Aitchison and Silvey 1957; Gelfand, Smith, andLee 1992; Johnson 2003; McCullagh 1980; Rossi, Gilula,and Allenby 2001).Thus, we believe that the most critical components of our
model are the confirmatory factor specification based on
( ) | , .| |9 Fit b c c b c c b c c′( ) = −( )′ −( )′ ′ξ ξ ξ ξ
( )10 Atypicality c c
c c
b|c � =� b|c b|c( ) −( )′ −( )′
ξ ξ ξ ξ
ξ ξ ++ −( )′ −( )ξ ξ ξ ξb|c b|cc c
.
1We also tested two other measures of atypicality, brand-to-categoryRSE (distances) and the cosine between brand and category vectors, withbroadly similar results.

Brand Extension Strategy Planning 341
Aaker’s (1997) scales and the category-specific factor struc-ture; the MCMC algorithm makes it feasible to bring thesemodel specifications to the data. Other aspects, includingthe imputation of missing data due to the split-questionnairedesign and the cut-point specification, are theoretically ele-gant and accommodate the data-generating mechanism inthe context of our application but are perhaps less critical.
Brand and Category Personality Results
Table 1 displays the posterior means of the category-specific loadings for the brand personality items and, forcomparison, those from the analysis pooled across cate-gories. The magnitudes of the loadings are differentbetween categories, indicating that many of these items mayhave different meanings in different categories, consistentwith prior research (e.g., Austin, Sigauw, and Mattila 2003).For example, the loadings for the cheerful item—an indica-tor of the sincerity brand personality dimension—varydepending on the product category. Its loading is largest forcars, followed by jeans and then magazines. As anotherexample, up-to-date—an indicator of the excitement dimen-sion in Aaker’s (1997) model—loads highest on jeans, fol-lowed by cars and then magazines. Although these differ-ences are not large, the results suggest that the dimensionsof brand personality vary in their markers and measurementin different product categories and that part of Aaker’spooled solution potentially confounds differences between
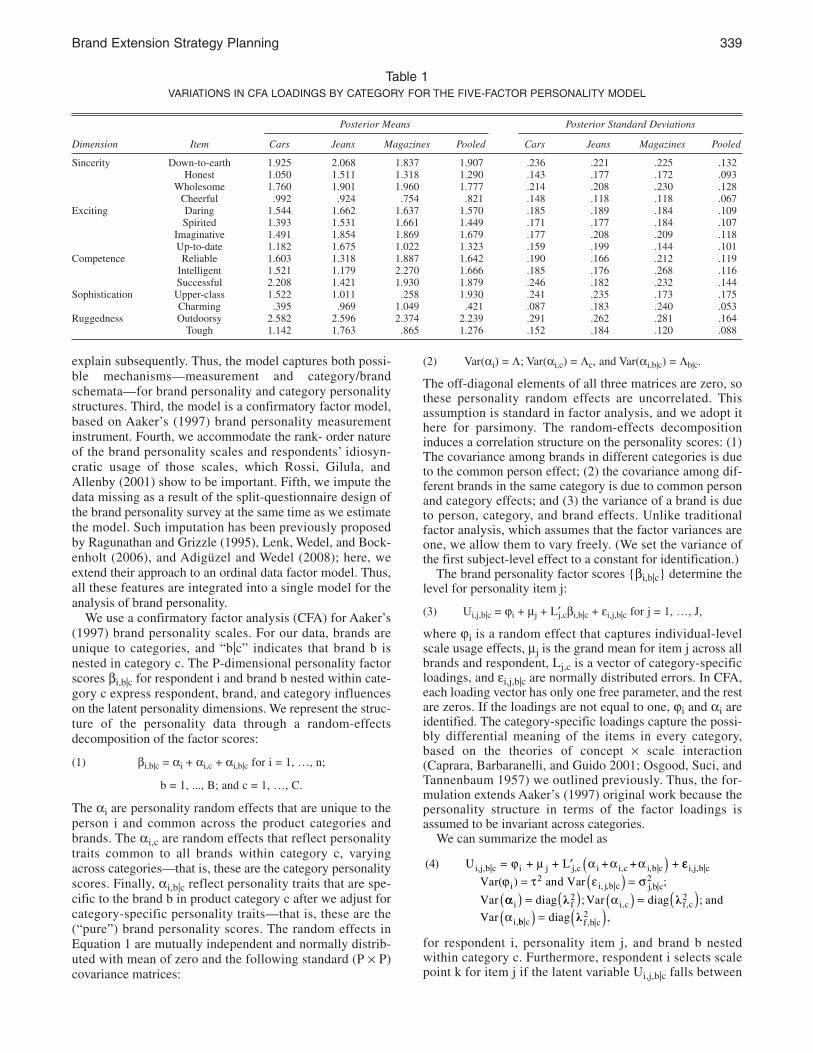
categories. There are marked differences between thepooled analysis and those of the proposed approach. Forexample, the sophistication factor is measured differentlyby the category-specific loadings than by the pooled load-ings: The loadings for upper-class are much lower for eachof the categories than for the pooled solution, and the load-ings for charming are higher for jeans and magazines thanfor the pooled solution, revealing that sophistication has adifferent meaning in each of the three categories. Further-more, tough loads much higher on ruggedness for jeans thanfor the pooled solution, while intelligent loads much higheron competence for magazines than for the pooled solution,showing that the connotation of these variables is differentfor these categories. Given the previously cited literature onconcept × scale interactions (Komorita and Bass 1967),such findings, though expected, are important. Table 2shows the mean personality factor scores of the 30 brandson these five personality factors; these factor scores reflectboth the brand and the category personality determinants.We do not discuss the table in detail but provide a few keyexamples to illustrate what we believe reflects the facevalidity of these results. Among cars, Porsche stands out forexciting and sophisticated, while it scores low on sincereand rugged. Chevy and Volkswagen are the most sincere,and Chevy is rugged, while Volkswagen is not. In the jeanscategory, on the sincerity factor, Levi’s and Lee score rela-tively high, while other brands, especially FUBU and
Table 2ESTIMATED BRAND-SPECIFIC PERSONALITY FACTOR SCORES
Posterior Means Posterior Standard Deviations
Brand Sincere Exciting Competent Sophisticated Rugged Sincere Exciting Competent Sophisticated Rugged
Car average –.024 .169 .140 .552 –.028 .019 .021 .026 .040 .023Honda .262 –.015 .187 –.151 .045 .049 .043 .044 .049 .036Porsche –.534 1.036 .300 1.651 –.171 .073 .091 .072 .175 .055Chevy .475 .005 .082 –.076 .651 .074 .070 .066 .081 .081Lexus –.229 .206 .305 1.226 –.282 .060 .066 .064 .161 .045Saturn .187 –.172 –.143 –.126 –.006 .067 .075 .066 .084 .049Volkswagen .421 .047 .040 –.123 .005 .075 .071 .066 .085 .049Pontiac –.096 –.327 –.416 –.246 .117 .058 .083 .078 .088 .059Mercedes –.241 .393 .682 1.575 –.366 .068 .074 .097 .171 .062Volvo .109 –.162 .192 .417 .058 .063 .067 .063 .153 .059Jaguar –.597 .674 .169 1.375 –.329 .080 .082 .067 .157 .063
Jeans average –.247 –.294 –.520 –.174 .146 .018 .026 .029 .034 .017Levi’s .916 –.029 .418 –.115 1.491 .087 .035 .099 .046 .092Lee .325 –.659 –.440 –.358 .951 .070 .076 .088 .083 .077Guess –.508 –.373 –.664 –.123 –.184 .065 .062 .089 .088 .054FUBU –.841 –.654 –1.342 –.748 –.485 .073 .072 .097 .133 .052Polo –.279 –.182 –.401 .058 –.047 .054 .060 .077 .086 .045Tommy Hilfiger –.515 –.099 –.360 .052 –.053 .065 .061 .074 .093 .049Calvin Klein –.383 –.131 –.235 .057 –.164 .057 .057 .071 .097 .052Gap –.028 –.130 –.403 –.206 .063 .057 .060 .072 .071 .054Diesel –.623 –.596 –1.186 –.277 .011 .070 .074 .094 .108 .053Abercrombie & Fitch –.535 –.088 –.588 –.074 –.129 .067 .059 .091 .078 .049
Magazines average .031 .110 .149 –.267 –.334 .020 .020 .024 .035 .017Time .044 .126 .550 –.287 –.439 .037 .035 .066 .047 .031Reader’s Digest .760 –.159 .222 –.212 –.245 .092 .067 .064 .078 .060Cosmopolitan –.539 .338 –.152 –.168 –.861 .077 .066 .069 .093 .080National Geographic .809 .825 .583 –.193 1.602 .093 .083 .080 .078 .129Money –.341 –.471 .154 –.434 –.772 .057 .080 .062 .119 .067People –.462 .089 –.270 –.307 –.763 .064 .065 .069 .086 .072Parent .793 –.028 .116 –.121 –.638 .103 .064 .064 .107 .058GQ –.566 .007 –.173 –.181 –.305 .075 .064 .067 .089 .056Rolling Stone –.411 .687 –.090 –.339 –.482 .069 .077 .061 .099 .056Consumer Reports .223 –.315 .549 –.426 –.433 .064 .073 .083 .084 .052

342 JOURNAL OF MARKETING RESEARCH, APRIL 2010
Table 3. We observe that the Porsche, Mercedes, and Jaguarbrands are considered the most atypical in the cars category,and Volvo is considered the least; Levi’s and FUBU are themost atypical (idiosyncratic) jeans brands, and Gap is theleast; and National Geographic is considered the most atyp-ical magazine brand, and Time is the least. In other words,given our sample of respondents and brands, relativelyspeaking, Volvo most strongly evokes car category imagery,Gap most strongly evokes jeans category imagery, and Timemost strongly evokes magazine category imagery. As wediscussed previously, brands for which the brand perceptionis too closely linked to a category perception (e.g.,Heineken, Clorox) tend not to possess broad extendibilitybeyond that category (though they could benefit from theirstrong association with it in fewer, narrower, well-targetedextensions through parent-category leverage). Thus, thehigh parent-category influence on their brand personalitiesmay make broad expansion relatively more difficult for theVolvo, Gap, and Time brands. In contrast, the Porsche,Levi’s, and National Geographic brands are relatively moreatypical of their categories and thus are more abstract inmeaning and, as a result, potentially more broadlyextendible into other categories. It testifies to the validity ofthese results that among these brands, the Porsche brand hasindeed extended into many other nonautomotive categories,including eyewear, briefcases, watches, and even computer
Diesel, score low. Levi’s and Lee are more rugged than thecars, yet National Geographic scores even higher. Amongmagazines, Time, National Geographic, and ConsumerReports are the most competent, while People, GQ, Cosmo-politan, and Rolling Stone are least competent. RollingStone is judged to be exciting but not very sophisticated.These personality perceptions are intuitively appealing andseem consistent with the widely held perceptions and com-munications of these brands.These results enable us to calculate one of the two key
indexes we seek—namely, overall brand atypicality. Asdescribed previously, we define atypicality as the percent-age of a brand’s total personality score on each factor that isnot attributable to the category average for that factor. Thatis, as in an analysis of variance, the variation in the factorscore is decomposed into the category variation and thebrand/person variation, and the results are expressed as per-centages. Thus, this score represents the “uniqueness” ofeach brand for each factor (i.e., the part of its overall per-sonality that is “idiosyncratic” to the brand and not attribut-able to the category that it happens to be in presently). Theatypicality index enables us to observe the percentage of abrand’s score on each factor that is “idiosyncratic” and notattributable to the category average (i.e., sum of squares dueto brand, divided by sum of squares due to category plusbrand). These statistics appear in the second column of
Table 3ESTIMATES OF BRAND-SPECIFIC ATYPICALITY FROM OWN CATEGORY AND FIT WITH POTENTIAL EXTENSION CATEGORIES
Posterior Means Posterior Standard Deviations
Fit Fit
Atypicality Cars Jeans Magazines Atypicality Cars Jeans Magazines
Honda .636 .791 .928 .490 .030 .064 .057 .049Porsche .864 1.515 2.447 2.221 .022 .131 .151 .167Chevy .763 1.075 1.125 1.115 .029 .078 .082 .084Lexus .622 .779 1.761 1.533 .078 .129 .140 .168Saturn .665 .846 .629 .583 .044 .083 .071 .070Volkswagen .658 .834 .961 .573 .046 .085 .076 .073Pontiac .775 1.112 .265 .869 .030 .086 .070 .077Mercedes .812 1.256 2.296 1.964 .034 .135 .154 .172Volvo .340 .429 1.021 .853 .082 .076 .112 .135Jaguar .792 1.174 2.048 1.854 .034 .115 .139 .153
Levi’s .897 1.944 2.034 2.063 .011 .111 .102 .105Lee .711 1.721 1.082 1.648 .031 .091 .073 .082Guess .322 1.295 .475 1.119 .057 .090 .060 .084FUBU .801 2.339 1.383 1.964 .023 .109 .089 .098Polo .221 .864 .365 .833 .059 .087 .063 .079Tommy Hilfiger .338 .915 .492 .898 .060 .088 .066 .077Calvin Klein .380 .804 .540 .731 .058 .088 .065 .078Gap .193 .994 .334 .740 .052 .086 .057 .071Diesel .604 1.850 .852 1.691 .046 .100 .080 .091Abercrombie & Fitch .330 1.132 .483 1.001 .055 .092 .059 .087
Time .445 1.029 1.331 .423 .076 .069 .063 .061Reader’s Digest .739 1.176 1.328 .798 .045 .092 .083 .081Cosmopolitan .777 1.273 1.290 .882 .036 .095 .081 .078National Geographic .958 2.138 2.396 2.254 .006 .112 .110 .118Money .763 1.436 1.199 .848 .038 .107 .078 .074People .736 1.292 1.062 .790 .040 .088 .075 .071Parent .766 1.250 1.486 .858 .043 .099 .086 .091GQ .689 1.027 .737 .705 .052 .090 .070 .077Rolling Stone .739 1.222 1.274 .795 .042 .097 .076 .074Consumer Reports .658 1.268 1.337 .656 .055 .089 .082 .072
Notes: A higher atypicality index means that the brand possesses more brand-specific personality imagery, not attributable to its parent category. A lowerfit index between a brand and a new category indicates a smaller brand-to-category distance and, thus, higher fit.

Brand Extension Strategy Planning 343
hard drives, all (we presume) because of its reputation forstyle and design, not merely sports-car expertise (seewww.porsche-design.com). Similarly, National Geographichas used its travel and explorer associations (very differentfrom just magazine imagery) to extend into travel clothing,travel shoes, binoculars, explorer boats and compasses, roadatlases and globes, and many more product categories (seewww.nationalgeographic.com/shop). (It is possible thatthese existing extensions influenced the perceived extend-ability of these two brands, but this is of no consequence inour procedure, because we did not explicitly assess suchextendability.)A complementary perspective on a brand’s extendibility
is that provided by the “fit” statistics (see Table 3). Thesemeasures of fit of each brand with each of the three cate-gories are computed as RSE (or distances) of a brand’s ownpersonality scores relative to those of the category in ques-tion. Thus, in reading these fit statistics, a lower numberindicates a smaller brand-to-category distance and, thus, acloser fit. We illustrate some insights that can potentially begleaned from these statistics. For example, if a jeans brandwere to extend into the car category (through a cobrandingdeal, as has been done, for example, by Eddie Bauer,Harley-Davidson, L.L. Bean, and Coach, among others),Calvin Klein, Polo, and Tommy Hilfiger would be viablebrands (lowest distances of .804, .864, and .915). Amongthe magazines that might want to enter the car market, GQhas the smallest distance (1.027). For an outside-categorybrand entering the jeans category, the Pontiac automotivebrand has the smallest distance (.265), as does the GQ brand(.737) for the magazine category. A new magazine brand, ifcoming from the car or jeans category, would be a good fitif it came from Honda, Volkswagen, or Saturn (.490, .573,and .583, respectively) or Gap (.740). Post hoc reflectionsuggests that these particular automotive and clothing brandscome closest to being “lifestyle” brands, representing par-ticular attitudes toward life: GQ representing stylishness,Pontiac representing excitement, Saturn and Honda repre-senting sobriety and moderation, Volkswagen representing amore youthful and engaged “drivers-wanted” attitude to life,and Gap representing an attitude of classic casualness.A few brands (Honda, Saturn, Volkswagen, Pontiac,
Levi’s, and National Geographic) actually have lower dis-tances in this five-dimensional personality space with cate-gories other than their own. This means that in our data(given our sample of brands for each category), their loca-tion in this space is closer to the centroid of another cate-gory than to their own. There are two explanations for thisresult. First, from a substantive point of view, it shows, forexample, that the magazine category is (directionally) lessexciting, sophisticated, and rugged than cars (see Table 2),though it is more competent. Honda’s personality profilebetter matches magazines than cars: It is perceived as lessexciting and sophisticated than the average car but morecompetent. Recall that we analyze ratings in a personalityspace, not in a functional attribute space, so this does notmean that Honda is viewed as making better magazines thancars, only that its personality is closer to an average maga-zine personality rather than to an average car personality.The second explanation is statistical: Perfect discriminationrequires complete separation of the brands in personalityspace. In actuality, perfect discrimination does not occur,
and there is overlap among brands in the personality spacein our application, even though category personalities aredifferent. Furthermore, an extending brand will only need tolook at its distances from categories other than its own, sothese own-category distances are not the ones of primaryinterest.In a further analysis, we computed the distance (RSE)
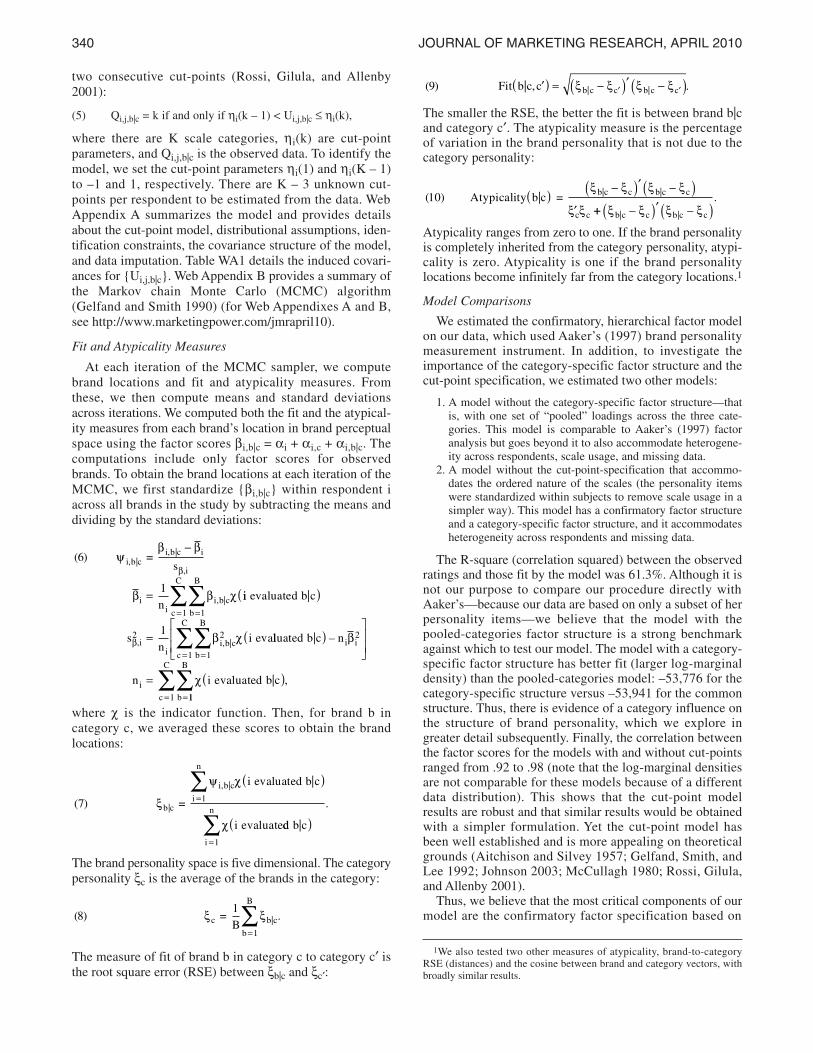
between every pair of these 30 brands to allow strategicideation on partners for licensing or cobranding deals. Lowdistances (high cobranding potential) emerged for thesecross-category pairs of brands: Porsche and Jaguar cars withAbercrombie & Fitch jeans and Cosmopolitan and Peoplemagazines, Mercedes and Lexus cars with Polo or CalvinKlein jeans, Chevy or Pontiac cars with Lee or Levi’s jeans,Volvo cars with Consumer Reports and Parenting maga-zines, Rolling Stone magazine with FUBU jeans, and GQmagazine with Diesel jeans, among many others. Figure 1shows these distances graphically in a clustering dendro-gram obtained with a hierarchical average linkage algo-rithm. Although any explanation of these is necessarily posthoc and subjective, the groupings in the tree appear to bereasonable and revealing of the strategic, idea-generatingpower of the empirical and analytical approach we present
Figure 1BRAND PROXIMITY IN CLUSTER ANALYSIS SHOWS
OPPORTUNITIES FOR CROSS-CATEGORY BRAND LICENSING
AND COBRANDING DEALSa
aClustering using brand–category means, standardization within brands.
Porsche
Jaguar
Abercrombie & Fitch
Cosmopolitan
People
Lexus
Mercedes
Guess
Polo
Tommy Hilfiger
Calvin Klein
FUBU
Rolling Stone
Diesel
GQ
Time
Money
Saturn
Volkswagen
Honda
Chevy
Pontiac
Levi’s
Lee
National Geographic
Reader’s Digest
Parent
Volvo
Consumer Reports
Gap
344 JOURNAL OF MARKETING RESEARCH, APRIL 2010
here. We test these results in two follow-up validationexperiments, the results of which we present next.
VALIDATION TESTS
In the follow-up study, we asked respondents to indicate,for each of the 30 brands in the previous study, which of thebrands in one of the other categories they believed wouldmake “a good partner,” in the same way that Ford Explorerpartnered with Eddie Bauer and Disney partnered withDelta Airlines. As in the main study, respondents werenationally representative adults who were familiar with thebrands used in the brand extension ideas they were asked torate. However, the sample was different from the sample inthe main study. Each respondent filled in three tables, thefirst for our ten jeans brands (rows) potentially partneringwith our car brands (columns), the second for our ten maga-zine brands (rows) partnering with our ten jeans brands(columns), and the third for our ten magazine brands part-nering with our ten car brands (columns). In each table,respondents were asked to think about each brand listed inthe ten rows and to put as few or as many check marks forthe ten brands listed in the columns, with each check markindicating a good partner. We deliberately used the word“partner” because it left the mode of partnership ambigu-ous, thus potentially encompassing both licensing andcobranding deals.Our hypothesis was that the data from this first validation
study would show respondents indicating higher brand part-nership potential in pairs for which our previous (main)study estimated higher fit for the across-category pair ofbrands being rated and for brands estimated in the mainstudy as having higher atypicality (regardless of the brandwith which it was being paired). We analyzed the results ofthe frequency tables with log-linear models for the threecombinations: magazines–jeans, magazines–cars, andjeans–cars, explaining the frequencies of partnering fromthe main effects of atypicality and fit. We controlled for theeffects of prior attitudes toward the brands in both cate-gories using average ratings of the attitudes toward thesebrands as covariates in the log-linear model. Note that wederived the measures of atypicality and fit from our pro-posed model and the first data set and then applied themhere to data on brand partnering evaluations in an independ-ent sample of respondents. We used atypicality in the modelso that higher values of atypicality and lower values of fit(distance) indicate brands that should be more abstract andbrand pairs that have better fit.The analyses reveal the following: Atypicality has no sig-
nificant main effects in two of the three category pairs, butit does have a significant effect for magazines–jeans (coeffi-cient = –.662, SE = .252, p < .05). The fit measure is highlypredictive of partnering appeal in each of the three cate-gories: Increasing the fit (by decreasing the RSE) by .1increases the odds of partnering by a factor of 1.47 forjeans–cars (b = .385, SE = .106, p < .01), 1.35 for magazines–jeans (b = .300, SE = .101, p < .01), and 1.44 for magazines–cars (b = .362, SE = .093, p < .01). These are substantialeffects, which underscore the impressive predictive per-formance of our model, especially given that it is obtainedon an independent sample of respondents and that entirelydifferent measures were collected in these two samples (i.e.,brand personality ratings in the first and pick-any cobrand-
ing data in the second). Thus, we conclude that the predic-tive performance of atypicality is less strong than that of fit,but that of fit is truly impressive.We also validated the fit and atypicality measures from
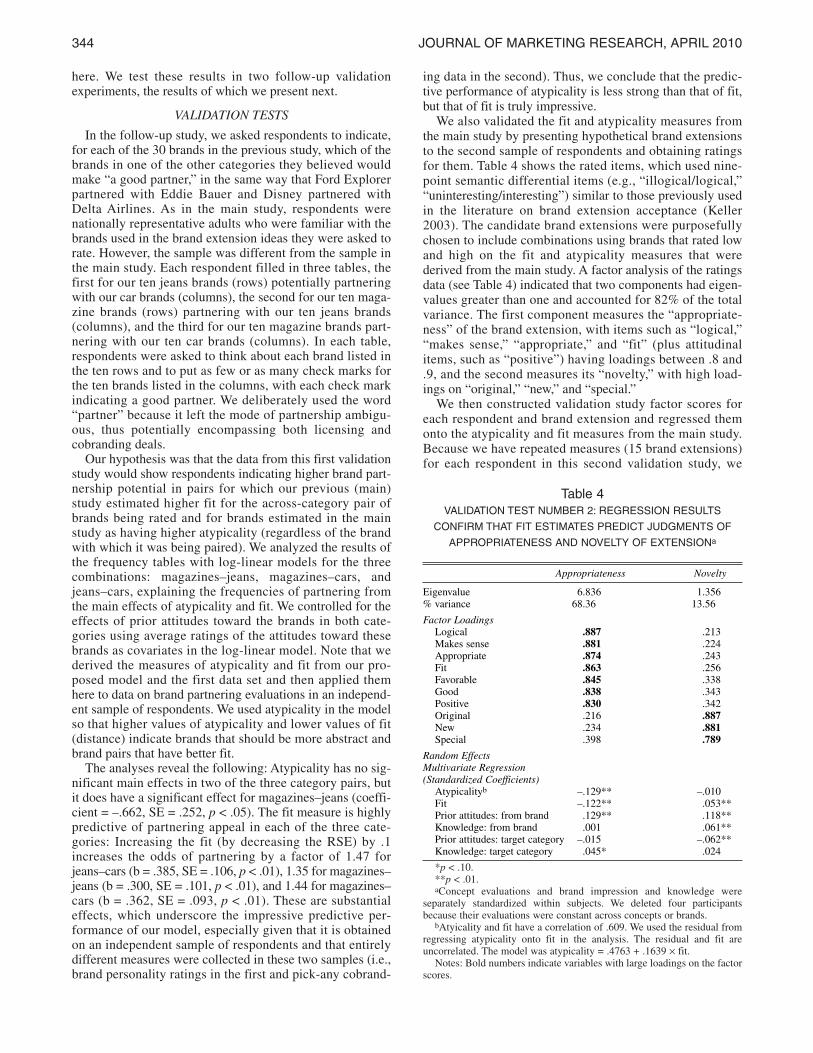
the main study by presenting hypothetical brand extensionsto the second sample of respondents and obtaining ratingsfor them. Table 4 shows the rated items, which used nine-point semantic differential items (e.g., “illogical/logical,”“uninteresting/interesting”) similar to those previously usedin the literature on brand extension acceptance (Keller2003). The candidate brand extensions were purposefullychosen to include combinations using brands that rated lowand high on the fit and atypicality measures that werederived from the main study. A factor analysis of the ratingsdata (see Table 4) indicated that two components had eigen-values greater than one and accounted for 82% of the totalvariance. The first component measures the “appropriate-ness” of the brand extension, with items such as “logical,”“makes sense,” “appropriate,” and “fit” (plus attitudinalitems, such as “positive”) having loadings between .8 and.9, and the second measures its “novelty,” with high load-ings on “original,” “new,” and “special.”We then constructed validation study factor scores for
each respondent and brand extension and regressed themonto the atypicality and fit measures from the main study.Because we have repeated measures (15 brand extensions)for each respondent in this second validation study, we
Table 4VALIDATION TEST NUMBER 2: REGRESSION RESULTS
CONFIRM THAT FIT ESTIMATES PREDICT JUDGMENTS OF
APPROPRIATENESS AND NOVELTY OF EXTENSIONa
Appropriateness Novelty
Eigenvalue 6.836 1.356% variance 68.36 13.56
Factor LoadingsLogical .887 .213Makes sense .881 .224Appropriate .874 .243Fit .863 .256Favorable .845 .338Good .838 .343Positive .830 .342Original .216 .887New .234 .881Special .398 .789
Random EffectsMultivariate Regression(Standardized Coefficients)Atypicalityb –.129** –.010Fit –.122** .053**Prior attitudes: from brand .129** .118**Knowledge: from brand .001 .061**Prior attitudes: target category –.015 –.062**Knowledge: target category .045* .024
*p < .10.**p < .01.aConcept evaluations and brand impression and knowledge were
separately standardized within subjects. We deleted four participantsbecause their evaluations were constant across concepts or brands.
bAtyicality and fit have a correlation of .609. We used the residual fromregressing atypicality onto fit in the analysis. The residual and fit areuncorrelated. The model was atypicality = .4763 + .1639 × fit.Notes: Bold numbers indicate variables with large loadings on the factor
scores.

Brand Extension Strategy Planning 345
included a subject-level random effect for each respondent.We used control variables for prior brand attitudes towardand knowledge of the extending brand and the new category(averaged over its brands) collected in this validation study.Both the atypicality and the fit measures from our mainstudy have a significant relationship to the first ratings fac-tor, appropriateness, from this validation study. (Similarresults hold without the control variables.) In these regres-sion results, brand extensions judged to be more appropriatetend to possess imagery that fits well with the category per-sonality of the targeted category (our fit measure; a negativesign for a smaller distance) and have imagery that is lessatypical (more typical) of the parent category (the negativesign for atypicality). Because standard attitudinal items(positive, favorable, good) also load highly on this appropri-ate ratings factor, these results suggest that consumers rate abrand extension more positively if the imagery of theextending brand (1) fits that of the extended-into categoryand (2) is highly typical of the parent category. This latterresult does not support the notion that category-atypicalbrands should be more successful extenders; instead, it sug-gests that extensions are more favored if the extendingbrand seems to be operating within its parent-category com-petency, implying that such extensions may have more“leverage” (see our previous theoretical discussion of thisatypicality construct). The former result again provides evi-dence of the external validity and value of the proposed fitmeasure from our main study.For the second ratings factor, novelty, the effect of the
atypicality measure from our main study was not signifi-cant, but that of fit was again significant and in a positivedirection. Because in our fit statistics a lower number indi-cates a smaller brand-to-category distance and, thus, acloser fit, the positive sign means that for a brand extensionto be viewed as novel, it must be viewed as different fromthe category it is entering. This makes intuitive sense. Thus,the results suggest a challenge for marketing managers inthat an appropriate (high-fit) extension may lack novelty,which could lead to an extension without a distinctive per-sonality in the target category. Conversely, if the fit (appro-priateness) with the target category is low, there is a risk thata novel/distinctive extension will be viewed as inappropri-ate. Note that our attitudinal items (favorable, positive,good) load much more on appropriateness than on novelty,suggesting that (for our sample) appropriateness is moreimportant than novelty in shaping overall attitudes towardthe brand extension.
DISCUSSION AND IMPLICATIONS
In this article, we developed and estimated a random-effects, hierarchical factor model using consumer perceptiondata on brand personality ratings that (1) separates “cate-gory personality” from the brand’s own “unique personal-ity”; (2) computes the contribution of the latter to its totalbrand personality imagery, and thus the degree to which it isatypical of its original product category; and (3) quantifiesthe extent to which its unique brand personality imagery fitsthe personality imagery of several “candidate” product cate-gories for purposes of extension, licensing, or cobranding.Our model accommodates separate brand and category per-sonality effects using a confirmatory model based onAaker’s (1997) brand personality measurement instrument
and allows for the ordered nature of the rating scales andmissing data due to the split nature of the questionnaire.The success of our validation studies in confirming the
estimates of our main study, more for fit than for atypicality(first validation test), and in showing their impact on per-ceived extension appropriateness (second validation test)supports our model and the metrics derived from it, espe-cially those of fit. Although the results for our measure ofthe extending brand’s atypicality from its parent category donot provide strong support for the theoretical notion thatatypical brands possess more abstract and, thus, moreextendible imagery, it may well be that these results are lim-ited by our focus on personality attributes, our small sampleof categories, or our modeling of only linear (but not quad-ratic) effects of atypicality. Such a relationship may yet existon more functional attribute dimensions or in other cate-gories; indeed, finding support for it may even depend onthe specific categories being considered. Alternatively, theremay be imperfections in our conceptualization or measure-ment of atypicality, which further research should examine.Despite the need for more work on atypicality, our modelshould provide marketers with an enhanced ability to strate-gically generate ideas about which brands could potentiallyextend into which categories or could partner with otherbrands in those categories (see Figure 1), based only on col-lected brand imagery data rather than needing to obtainexplicit consumer reactions in advance to every possibleconcept or combination. Given the high failure rates inexisting brand extensions, the burgeoning business in brandlicensing deals, and the acknowledged limitations of exist-ing academic methodologies to identify successful brandextension possibilities (Klink and Smith 2001), these areimportant contributions.Although the attribute domain of our illustration per-
tained only to brand personality imagery and associations,the method we present here is more general and potentiallyextendible into the domain of more physical attribute andbenefit associations as well. Our model may even allowcross-cultural market researchers to tease out the influenceof culture (Aaker, Benet-Martinez, and Gariolera 2001) andculture-specific response scale usage (Ter Hofstede,Steenkamp, and Wedel 1999) on consumer perceptions ofglobally marketed brands (Steenkamp, Batra, and Alden2003). In the brand personality domain, the results demon-strate that the meaning of brand personality descriptors canbe influenced by the category context. For example, a “reli-able” magazine may have a different connotation than a“reliable” car. A criticism of existing inventories of brandpersonality descriptors and dimensions (such as Aaker’s[1997]) is that they are often used and interpreted uniformlyacross different products and categories. Our approach givesus a way to assess which particular brand personality traitsmay differ in meaning across categories. Furthermore,although differences in “category personalities” have previ-ously been qualitatively discussed (e.g., Levy 1959), ourmethod enables a level of empirical quantification previ-ously missing from that literature.An additional benefit of the proposed methodology is that
it accounts for two important features of many brand per-sonality data sets. The first is the rank-order nature of thepersonality scales and idiosyncratic scale usage (Rossi,Gilula, and Allenby 2001). This disentangles respondents’

346 JOURNAL OF MARKETING RESEARCH, APRIL 2010
behavior with respect to the measurement scales and theirunderlying brand personality perceptions. The second is theabsence of entire blocks of data due to the use of split ques-tionnaires (Adigüzel and Wedel 2008; Ragunathan andGrizzle 1995), which tends to be common or even desirablein large questionnaires on brand personality to reducerespondent fatigue and boredom. Without (proper) dataimputation, it would be almost impossible to analyze such ahighly fractionated data set. The method we developed heredoes all this simultaneously.It might be argued that by allowing the measurement
items to have category-specific factor loadings, factor scoresacross brands in different categories are noncomparable. Weacknowledge this concern but believe that our comparisonsare still useful. If a model that forced identical loadings forall categories (not those in Table 1) were specified, the esti-mated brand personality factor scores would be confoundedwith (biased by) the different connotations of the items indifferent categories, muddying the across-category compari-sons of the brands on the latent, abstract, underlying dimen-sions. When consumers judge the appropriateness of abrand in one category extending into another, they mustmake comparisons on abstract dimensions (e.g., sophistica-tion) that span categories (Johnson 1984). Our model meas-ures these abstract dimensions with latent factors. By speci-fying category-specific loadings, we allow the observeditem responses to affect the latent brand factor scores incategory-specific ways, thus enabling (we believe) moreaccurate comparisons of the brand associations across cate-gories on these latent factors (abstract constructs). Note thatin our CFA model, the latent factor scores determine theitem ratings through the loadings, not conversely. That is,the confirmatory factor model is a “reflective model.” Insuch a reflective model, respondents’ brand latent factorscores are the primitive construct. These scores are thenexpressed in the item ratings, which are the manifestation ofthe latent construct. We allow for the possibility that themanifest rating items are differentially affected by the latentfactor scores across categories; thus, the same latent factorsare being estimated across categories, while their manifest,observed items are being computed with differential loadingsacross categories. This enables the latent factor scores to becompared across categories (as consumers will try to do),even if their factor loadings are different across categories.Several limitations remain beyond those pertaining to
atypicality discussed previously, suggesting other avenuesfor further research. The data used in our application camefrom just three product categories and 30 brands. Any cate-gory personality estimates obtained will depend on the spe-cific sample of brands and respondents included and willreflect the category personality better (as is the case with allsamples) if the sample is a random sample of all brands inthat category and as that sample gets larger.
REFERENCES
Aaker, David A. and Kevin L. Keller (1990), “Consumer Evalua-tions of Brand Extensions,” Journal of Marketing, 54 (January),27–41.
Aaker, Jennifer L. (1997), “Dimensions of Brand Personality,”Journal of Marketing Research, 34 (August), 347–56.
———, Veronica Benet-Martinez, and Jordi Gariolera (2001),“Consumption Symbols as Carriers of Culture: A Study ofJapanese and Spanish Brand Personality Constructs,” Journal ofPersonality and Social Psychology, 81 (September), 492–508.
Adigüzel, Feray and Michel Wedel (2008), “Split QuestionnaireDesign,” Journal of Marketing Research, 25 (October),608–617.
Aitchison, J. and S.D. Silvey (1957), “The Generalization of ProbitAnalysis to the Case of Multiple Responses,” Biometrika, 44(June), 131–50.
Ansari, Asim and Kamel Jedidi (2000), “Bayesian Factor Analysisfor Multilevel Binary Observations,” Psychometrika, 65(December), 475–96.
———, ———, and Laurette Dube (2002), “Heterogeneous Fac-tor Analysis Models: A Bayesian Approach,” Psychometrika, 67(March), 49–78.
Austin, Jon R., Judy A. Siguaw, and Anna S. Mattila (2003), “ARe-Examination of the Generalizability of the Aaker Brand Per-sonality Measurement Framework,” Journal of Strategic Mar-keting, 11 (June), 77–92.
Azoulay, Audrey and Jean-Noel Kapferer (2003), “Do Brand Per-sonality Scales Really Measure Brand Personality?” Journal ofBrand Management, 11 (November), 143–55.
Batra, Rajeev and Pamela Miles Homer (2004), “The SituationalImpact of Brand Image Beliefs,” Journal of Consumer Psychol-ogy, 14 (3), 318–30.
———, Donald R. Lehmann, and Dipinder Singh (1993), “TheBrand Personality Component of Brand Goodwill: SomeAntecedents and Consequences,” in Brand Equity and Advertis-ing, David A. Aaker and Alexander Biel, eds. Hillsdale, NJ:Lawrence ErlbaumAssociates, 83–96.
Broniarczyk, Susan and Joseph W. Alba (1994), “The Importanceof the Brand in Brand Extension,” Journal of MarketingResearch, 31 (May), 214–28.
Caprara, Gian Vittorio, Claudio Barbaranelli, and Gianluigi Guido(2001), “Brand Personality: How to Make the Metaphor Fit?”Journal of Economic Psychology, 22 (June), 377–95.
Digman, John M. (1990), “Personality Structure: Emergence of theFive-Factor Model,” Annual Review of Psychology, 41 (1),417–40.
Dillon, William R., Thomas J. Madden, and Soumen Mukherjee(2001), “Understanding What’s in a Brand Rating: A Model forAssessing Brand and Attribute Effects and Their Relationship toBrand Equity,” Journal of Marketing Research, 38 (November),415–29.
Durgee, Jeffrey F. and Robert W. Stuart (1987), “Advertising Sym-bols and Brand Names That Best Represent Key Product Mean-ings,” Journal of Consumer Marketing, 4 (Summer), 15–24.
Farquhar, Peter, Julia Y. Han, Paul M. Herr, and Yuji Ijiri (1992),“Strategies for Leveraging Master Brands,” MarketingResearch, 4 (September), 32–43.
Gelfand, Alan E. and Adrian F.M. Smith (1990), “Sampling-BasedApproaches to Calculating Marginal Densities,” Journal of theAmerican Statistical Association, 85 (410), 398–409.
———, ———, and T.M. Lee (1992), “Bayesian Analysis ofConstrained Parameter and Truncated Data Problems UsingGibbs Sampling,” Journal of the American Statistical Associa-tion, 87 (418), 523–32.
John, Deborah Roedder and Barbara Loken (1993), “DilutingBrand Equity: The Impact of Brand Extensions,” Journal ofMarketing, 57 (July), 71–84.
Johnson, Michael D. (1984), “Consumer Choice Strategies forComparing Noncomparable Alternatives,” Journal of ConsumerResearch, 11 (December), 741–53.
Brand Extension Strategy Planning 347
Johnson, Timothy R. (2003), “On the Use of HeterogeneousThresholds Ordinal Regression Models to Account for Individ-ual Differences in Response Style,” Psychometrika, 68 (4),563–83.
Keller, Kevin L. (1993), “Conceptualizing, Measuring, and Man-aging Customer-Based Brand Equity,” Journal of Marketing, 57(January), 1–22.
——— (2003), Strategic Brand Management, 2d ed. Upper Sad-dle River, NJ: Prentice Hall.
Klink, Richard R. and Daniel C. Smith (2001), “Threats to theExternal Validity of Brand Extension Research,” Journal ofMarketing Research, 38 (August), 326–35.
Komorita, S.S. and Alan R. Bass (1967), “Attitude Differentiationand Evaluative Scales of the Semantic Differential,” Journal ofPersonality and Social Psychology, 6 (2), 241–44.
Lautman, Martin R. (1991), “End-Benefit Segmentation and Pro-totypical Bonding,” Journal of Advertising Research, 31(June–July), 9–18.
Lenk, Peter, Michel Wedel, and Ulf Bockenholt (2006), “BayesianEstimation of Circumplex Models Subject to Prior Theory Con-straints and Scale-Usage Bias,” Psychometrika, 71 (1), 33–55.
Levy, Sidney J. (1959), “Symbols for Sale,” Harvard BusinessReview, 37 (July–August), 117–24.
——— (1981), “Interpreting Consumer Mythology: A StructuralApproach to Consumer Behavior,” Journal of Marketing, 45(Summer), 49–61.
——— (1986), “Meanings in Advertising Stimuli,” in Advertisingand Consumer Psychology, Jerry Olson and Keith Sentis, eds.Westport, CT: Praeger, 214–26.
Martineau, Pierre (1958), “The Personality of the Retail Store,”Harvard Business Review, 36 (January–February), 47–55.
Martinez, Eva and Jose M. Pina (2003), “The Negative Impact ofBrand Extensions on Parent Brand Image,” Journal of Productand Brand Management, 12 (7), 432–48.
McCrae, Robert R. and Paul T. Costa (1987), “Validation of theFive-Factor Model of Personality Across Instruments andObservers,” Journal of Personality and Social Psychology, 52(January), 81–90.
McCullagh, Peter (1980), “Regression Models for Ordinal Data(with Discussion),” Journal of the Royal Statistical Society:Series B, 42 (2), 109–142.
Osgood, Charles E., George J. Suci, and Percy H. Tannenbaum(1957), The Measurement of Meaning. Urbana: University ofIllinois Press.
Park, C. Whan, Sandra Milburg, and Robert Lawson (1991),“Evaluation of Brand Extensions: The Role of Product FeatureSimilarity and Brand Concept Consistency,” Journal of Con-sumer Research, 18 (September), 185–93.
Plummer, Joseph T. (1984), “How Personality Makes a Differ-ence,” Journal of Advertising Research, 24 (6), 27–31.
Raghunathan, Trivellore E. and James E. Grizzle (1995), “A SplitQuestionnaire Survey Design,” Journal of American StatisticalAssociation, 90 (March), 54–63.
Ratchford, Brian (1987), “New Insights About the FCB Grid,”Journal of Advertising Research, 27 (August–September),24–26.
Romaniuk, J. and Andrew Ehrenberg (2003), “Do Brands LackPersonality?” Marketing Science Centre Research Report No.14, University of South Australia.
Rosch, Eleanor, Carolyn B. Mervis, Wayne D. Gray, David M.Johnson, and Penny Boyes-Braem (1976), “Basic Objects inNatural Categories,” Cognitive Psychology, 8 (3), 382–439.
Rossi, Peter. E., Zvi Gilula, and Greg M. Allenby (2001), “Over-coming Scale Usage Heterogeneity: A Bayesian HierarchicalApproach,” Journal of the American Statistical Association, 96(March), 20–31.
Song, Xin-Yuan and Sik-Yum Lee (2001), “Bayesian Estimationand Test for Factor Analysis Model with Continuous and Poly-tomous Data in Several Populations,” British Journal of Mathe-matical and Statistical Psychology, 54, 237–63.
——— and ——— (2002), “Bayesian Estimation and ModelSelection of Multivariate Linear Model with PolytomousVariables,” Multivariate Behavioral Research, 37 (4), 453–77.
Steenkamp, Jan-Benedict E.M., Rajeev Batra, and Dana L. Alden(2003), “How Perceived Brand Globalness Creates BrandValue,” Journal of International Business Studies, 34 (1), 53–65.
Tauber, Edward M. (1988), “Brand Leverage: Strategy for Growthin a Cost Controlled World,” Journal of Advertising Research,28 (August–September), 26–30.
Ter Hofstede, Frenkel, Jan-Benedict E.M. Steenkamp, and MichelWedel (1999), “International Market Segmentation Based onConsumer-Product Relations,” Journal of Marketing Research,36 (February), 1–17.

Copyright of Journal of Marketing Research (JMR) is the property of American Marketing Association and its
content may not be copied or emailed to multiple sites or posted to a listserv without the copyright holder's
express written permission. However, users may print, download, or email articles for individual use.