Embed Size (px)
Citation preview

BRANDSMILLIONS RELY
ON DAILYTHIRD QUARTERLY REPORT FOR THE NINE MONTHS
ENDED SEPTEMBER 30, 2013
DOREL INDUSTRIES INC.
Management’s Discussion and Analysis
of Financial Conditions and Results of Operations
For the third quarter and nine months ended September 30, 2013 All figures in US dollars
DOREL INDUSTRIES INC. – MANAGEMENT’S DISCUSSION AND ANALYSIS for the third quarter and nine months ended September 30, 2013 1
This Interim Management’s Discussion and Analysis of Financial Conditions and Results of Operations (“MD & A”) should be read in conjunction with the unaudited condensed consolidated interim financial statements as at and for the third quarter and nine months ended September 30, 2013 and the audited consolidated financial statements and MD & A as at and for the year ended December 30, 2012. This MD & A is based on reported earnings prepared in accordance with International Financial Reporting Standards (“IFRS”), using the US dollar as the reporting currency.
The Company’s condensed consolidated interim financial statements have been prepared using the same accounting policies as described in Note 3 of the Company’s audited consolidated financial statements for the year ended December 30, 2012, except for the changes in the accounting policies noted within this MD & A. Please refer to Note 2 of the condensed consolidated interim financial statements for the third quarter and nine months ended September 30, 2013 for further information. The condensed consolidated interim financial statements do not include all of the information required for full annual financial statements. Certain information and footnote disclosures normally included in annual financial statements prepared in accordance with IFRS were omitted or condensed where such information is not considered material to the understanding of the Company’s condensed consolidated interim financial statements. Quarterly reports, the annual report and supplementary information filed with the Canadian securities regulatory authorities can be found on-line at www.sedar.com, as well as on the Company’s corporate Web site at www.dorel.com.
Note that there have been no significant changes with regards to the “Corporate Overview”, “Operating Segments”, “Contractual Obligations”, “Off-Balance Sheet Arrangements”, “Derivative Financial Instruments”, “Critical Accounting Estimates” or “Market Risks and Uncertainties” to those outlined in the Company’s 2012 annual MD & A as filed with Canadian securities regulatory authorities on March 6, 2013. As such, they are not repeated herein. The information in this MD & A is current as of November 6, 2013.
SIGNIFICANT EVENTS IN 2013 On April 30, 2013, the Company announced that it had decided to implement a new normal course issuer bid (“2013 NCIB”). Under the 2013 NCIB, the Company is entitled to repurchase for cancellation up to 850,000 Class “B” Subordinate Voting Shares over a twelve-month period commencing May 2, 2013 and ending May 1, 2014, representing 3.07% of the Company’s issued and outstanding Class “B” Subordinate Voting Shares. The purchases by the Company are being effected through the facilities of the TSX and are made at the market price of the Class “B” Subordinate Voting Shares at the time of the purchase. As at the time the 2013 NCIB was announced, there were 27,662,103 Class “B” Subordinate Voting Shares issued and outstanding. The Board of Directors considers that the underlying value of the Company may not be reflected in the market price of its Class “B” Subordinate Voting Shares at certain times during the term of the 2013 NCIB. The Board has therefore concluded that the repurchase of shares at certain market prices may constitute an appropriate use of financial resources and be beneficial to the Company and its shareholders.
DOREL INDUSTRIES INC. – MANAGEMENT’S DISCUSSION AND ANALYSIS for the third quarter and nine months ended September 30, 2013 2
During the six-month period prior to the implementation of the 2013 NCIB, the average daily trading volume for the Class “B” Subordinate Voting Shares of the Company on the TSX was 41,375 shares. Consequently, under the policies of the TSX, the Company has the right to repurchase during any one trading day a maximum of 10,343 Class “B” Subordinate Voting Shares, representing 25% of the average daily trading volume. In addition, the Company may make, once per calendar week, a block purchase (a term defined in the TSX Company Manual) of Class “B” Subordinate Voting Shares not directly or indirectly owned by insiders of the Company, in accordance with the policies of the TSX.
Any purchases made pursuant to the 2013 NCIB are made in accordance with the requirements of the TSX. The Company is not making purchases of Class “B” Subordinate Voting Shares other than open market purchases during the period of the 2013 NCIB. To the knowledge of the Company, no director or officer of the Company intends to sell shares of the Company while the 2013 NCIB is in effect.
In addition, the Company has entered into an automatic share purchase agreement with CIBC World Markets Inc. (“CIBC”) in connection with the 2013 NCIB. Under the agreement, CIBC may acquire, at its discretion, Class “B” Subordinate Voting Shares during certain pre-determined quarterly black-out periods, on the Company’s behalf, subject to certain parameters as to price and number of shares. The agreement with CIBC is cancellable at any time by the Company.
On August 22, 2013 the Company announced that it had acquired a 70% interest in Caloi, a major Brazilian manufacturer of bicycles and bicycle equipment. This acquisition will expand the Company’s market share in Latin America as Caloi is the largest bicycle brand in that region and is the leader in the Brazilian market. The amount disbursed in the quarter related to this acquisition, was $71.9 million. The fair value of the identifiable assets acquired and liabilities assumed as at the date of acquisition and recorded in the third quarter is preliminary, and is subject to change upon the final values being determined.
Though initially acquiring a 70% interest as part of the acquisition, the Company has entered into a put and call agreement with the minority interest holder for the future purchase of its 30% stake. The put and call agreement is considered to have been fully executed at the time of acquisition, which results in the assumption that the Company will purchase the remaining 30% interest in Caloi. As a result, for accounting purposes, the Company has consolidated 100% of the acquired company at the time of acquisition. As part of this accounting treatment the Company has recognized a financial liability, measured as the present value of the estimated future acquisition price of the remaining 30% stake. The initial estimate of this financial liability has been established as $54.6 million.
RESULTS OF OPERATIONS (All tabular figures are in thousands except per share amounts)
Overview For the third quarter of 2013, revenue decreased by $6.0 million, or 1.0%, to $607.3 million. This compares to $613.3 million posted a year ago. The organic revenue decrease, removing the impact of foreign exchange rate variations and new business acquisitions was approximately 4%. Pre-tax earnings decreased by 58.1% to $10.2 million from $24.4 million in 2012. Net income for the quarter was $11.1 million, a decrease of 44.4% from the $20.0 million recorded in 2012. On a diluted earnings-per-share (“EPS”) basis, this equates to $0.34 for the third quarter of 2013 compared to $0.63 in 2012. For the nine months ended September 30 2013, revenue decreased by $66.2 million, or 3.5%, to $1,801.9 million. This compares to $1,868.1 million posted a year ago. The organic revenue decrease, removing the impact of foreign exchange rate variations and new business acquisitions was approximately 5%. Pre-tax earnings decreased by 45.4% to $51.7 million from $94.6 million in 2012. Net income for the nine months was $46.6 million, a decrease of 41.2% from the $79.4 million recorded in 2012. On a diluted EPS basis, this equates to $1.45 for the nine months of 2013 compared to $2.48 in 2012. Included in general and administrative expenses, an amount of $8.0 million ($4.9 million after tax) was recorded in the third quarter ended September 30, 2013 relating to a US car seat case judgment following a split jury verdict which awarded $26.0 million in damages as the Company’s portion in the case. The Company will file an appeal related to the jury’s verdict. Even if the Company’s efforts on appeal are unsuccessful, the Company’s exposure should not exceed the amount recorded in the third quarter.
DOREL INDUSTRIES INC. – MANAGEMENT’S DISCUSSION AND ANALYSIS for the third quarter and nine months ended September 30, 2013 3
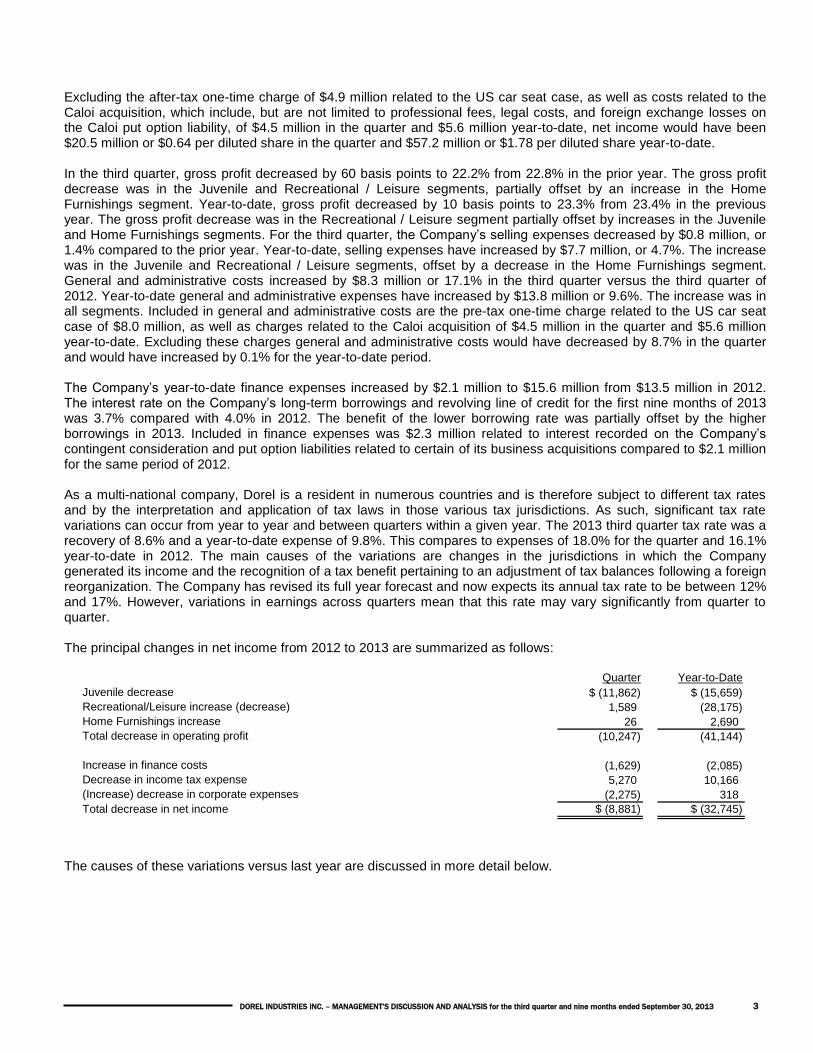
Excluding the after-tax one-time charge of $4.9 million related to the US car seat case, as well as costs related to the Caloi acquisition, which include, but are not limited to professional fees, legal costs, and foreign exchange losses on the Caloi put option liability, of $4.5 million in the quarter and $5.6 million year-to-date, net income would have been $20.5 million or $0.64 per diluted share in the quarter and $57.2 million or $1.78 per diluted share year-to-date. In the third quarter, gross profit decreased by 60 basis points to 22.2% from 22.8% in the prior year. The gross profit decrease was in the Juvenile and Recreational / Leisure segments, partially offset by an increase in the Home Furnishings segment. Year-to-date, gross profit decreased by 10 basis points to 23.3% from 23.4% in the previous year. The gross profit decrease was in the Recreational / Leisure segment partially offset by increases in the Juvenile and Home Furnishings segments. For the third quarter, the Company’s selling expenses decreased by $0.8 million, or 1.4% compared to the prior year. Year-to-date, selling expenses have increased by $7.7 million, or 4.7%. The increase was in the Juvenile and Recreational / Leisure segments, offset by a decrease in the Home Furnishings segment. General and administrative costs increased by $8.3 million or 17.1% in the third quarter versus the third quarter of 2012. Year-to-date general and administrative expenses have increased by $13.8 million or 9.6%. The increase was in all segments. Included in general and administrative costs are the pre-tax one-time charge related to the US car seat case of $8.0 million, as well as charges related to the Caloi acquisition of $4.5 million in the quarter and $5.6 million year-to-date. Excluding these charges general and administrative costs would have decreased by 8.7% in the quarter and would have increased by 0.1% for the year-to-date period. The Company’s year-to-date finance expenses increased by $2.1 million to $15.6 million from $13.5 million in 2012. The interest rate on the Company’s long-term borrowings and revolving line of credit for the first nine months of 2013 was 3.7% compared with 4.0% in 2012. The benefit of the lower borrowing rate was partially offset by the higher borrowings in 2013. Included in finance expenses was $2.3 million related to interest recorded on the Company’s contingent consideration and put option liabilities related to certain of its business acquisitions compared to $2.1 million for the same period of 2012. As a multi-national company, Dorel is a resident in numerous countries and is therefore subject to different tax rates and by the interpretation and application of tax laws in those various tax jurisdictions. As such, significant tax rate variations can occur from year to year and between quarters within a given year. The 2013 third quarter tax rate was a recovery of 8.6% and a year-to-date expense of 9.8%. This compares to expenses of 18.0% for the quarter and 16.1% year-to-date in 2012. The main causes of the variations are changes in the jurisdictions in which the Company generated its income and the recognition of a tax benefit pertaining to an adjustment of tax balances following a foreign reorganization. The Company has revised its full year forecast and now expects its annual tax rate to be between 12% and 17%. However, variations in earnings across quarters mean that this rate may vary significantly from quarter to quarter. The principal changes in net income from 2012 to 2013 are summarized as follows:
Quarter Year-to-Date
Juvenile decrease $ (11,862) $ (15,659)
Recreational/Leisure increase (decrease) 1,589 (28,175)
Home Furnishings increase 26 2,690
Total decrease in operating profit (10,247) (41,144)
Increase in finance costs (1,629) (2,085)
Decrease in income tax expense 5,270 10,166
(Increase) decrease in corporate expenses (2,275) 318
Total decrease in net income $ (8,881) $ (32,745)
The causes of these variations versus last year are discussed in more detail below.
DOREL INDUSTRIES INC. – MANAGEMENT’S DISCUSSION AND ANALYSIS for the third quarter and nine months ended September 30, 2013 4
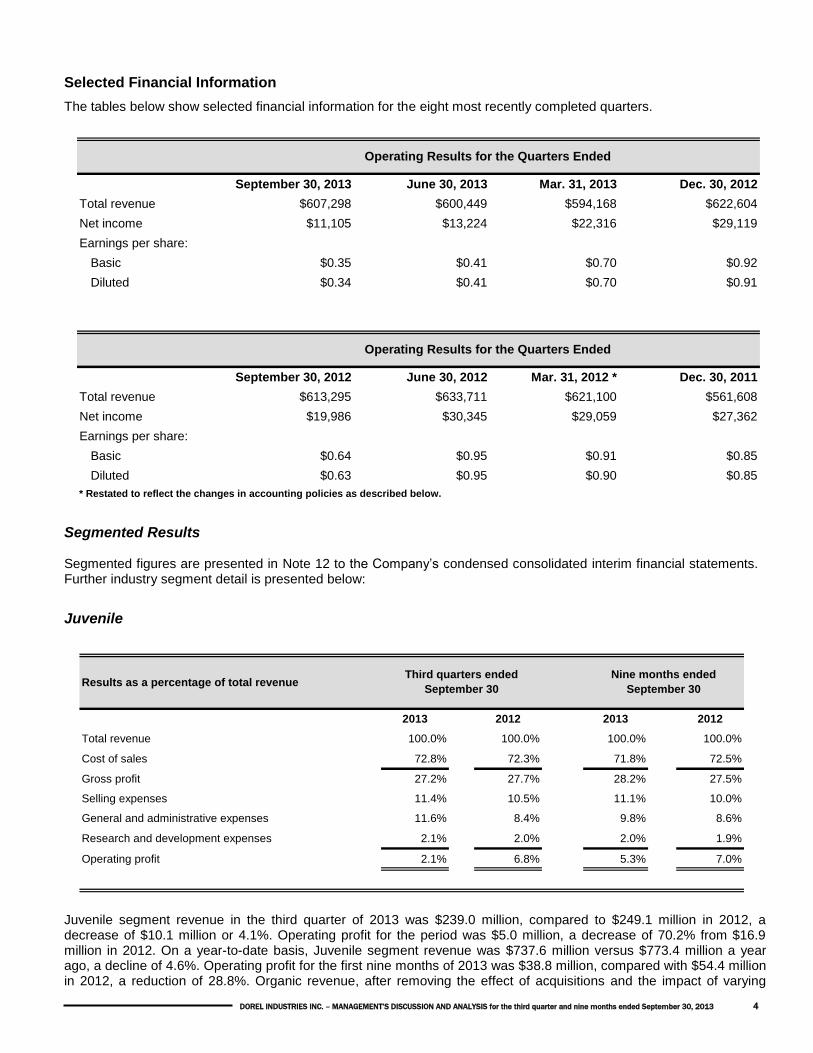
Selected Financial Information
The tables below show selected financial information for the eight most recently completed quarters.
September 30, 2013 June 30, 2013 Mar. 31, 2013 Dec. 30, 2012
Total revenue $607,298 $600,449 $594,168 $622,604
Net income $11,105 $13,224 $22,316 $29,119
Earnings per share:
Basic $0.35 $0.41 $0.70 $0.92
Diluted $0.34 $0.41 $0.70 $0.91
September 30, 2012 June 30, 2012 Mar. 31, 2012 * Dec. 30, 2011
Total revenue $613,295 $633,711 $621,100 $561,608
Net income $19,986 $30,345 $29,059 $27,362
Earnings per share:
Basic $0.64 $0.95 $0.91 $0.85
Diluted $0.63 $0.95 $0.90 $0.85
Operating Results for the Quarters Ended
Operating Results for the Quarters Ended
* Restated to reflect the changes in accounting policies as described below.
Segmented Results Segmented figures are presented in Note 12 to the Company’s condensed consolidated interim financial statements. Further industry segment detail is presented below:
Juvenile
Results as a percentage of total revenue
2013 2012 2013 2012
Total revenue 100.0% 100.0% 100.0% 100.0%
Cost of sales 72.8% 72.3% 71.8% 72.5%
Gross profit 27.2% 27.7% 28.2% 27.5%
Selling expenses 11.4% 10.5% 11.1% 10.0%
General and administrative expenses 11.6% 8.4% 9.8% 8.6%
Research and development expenses 2.1% 2.0% 2.0% 1.9%
Operating profit 2.1% 6.8% 5.3% 7.0%
Nine months ended
September 30
Third quarters ended
September 30
Juvenile segment revenue in the third quarter of 2013 was $239.0 million, compared to $249.1 million in 2012, a decrease of $10.1 million or 4.1%. Operating profit for the period was $5.0 million, a decrease of 70.2% from $16.9 million in 2012. On a year-to-date basis, Juvenile segment revenue was $737.6 million versus $773.4 million a year ago, a decline of 4.6%. Operating profit for the first nine months of 2013 was $38.8 million, compared with $54.4 million in 2012, a reduction of 28.8%. Organic revenue, after removing the effect of acquisitions and the impact of varying
DOREL INDUSTRIES INC. – MANAGEMENT’S DISCUSSION AND ANALYSIS for the third quarter and nine months ended September 30, 2013 5
exchange rates year-over-year, declined by approximately 6% in the quarter and year-to-date. The operating profit in the quarter and year to date includes an expense of $8.0 million related to the US car seat judgment as described previously. The revenue decline for the quarter and year-to-date was in Europe and North America principally due to difficult economies and a slower retail environment in certain markets. Partially offsetting this is growth in Latin America where sales continue to improve in all markets. Operating profit declines were in most markets. In Europe, this was caused by lower sales combined with a less profitable sales mix. Excluding costs related to the US car seat case discussed above, operating profit in North America for the quarter improved moderately over the prior year. In Latin America, operating profit for the quarter was slightly lower than the prior year. This was mostly due to the timing of sales and operating profit for the region remains on track to exceed the prior year. For the third quarter of 2013 gross profit decreased by 50 basis points to 27.2% compared to 27.7% in 2012, due mainly to decreases in Europe. Year-to-date gross profit has increased by 70 basis points to 28.2% in 2013 from 27.5% in 2012 as slight declines in Europe are being more than offset by DJG USA and Latin America. For the segment as a whole, selling expenses increased by $1.1 million in the quarter and have increased $4.7 million year-to-date. General and administrative expenses increased by $6.5 million in both the quarter and on a year-to-date basis compared to the prior year. The majority of the increases in selling expenses can be attributed to increases associated to new retail store openings since the third quarter of 2012 in Chile and Peru, and the impact of Dorel Colombia, while the general and administrative expense increase for the quarter and year-to-date is attributed to the one-time charge related to the US car seat case discussed above. Excluding this charge, general and administrative costs would have decreased by $1.5 million in both the quarter and year-to-date versus the prior year. These reductions are mainly driven by cost reductions in North America and Europe.
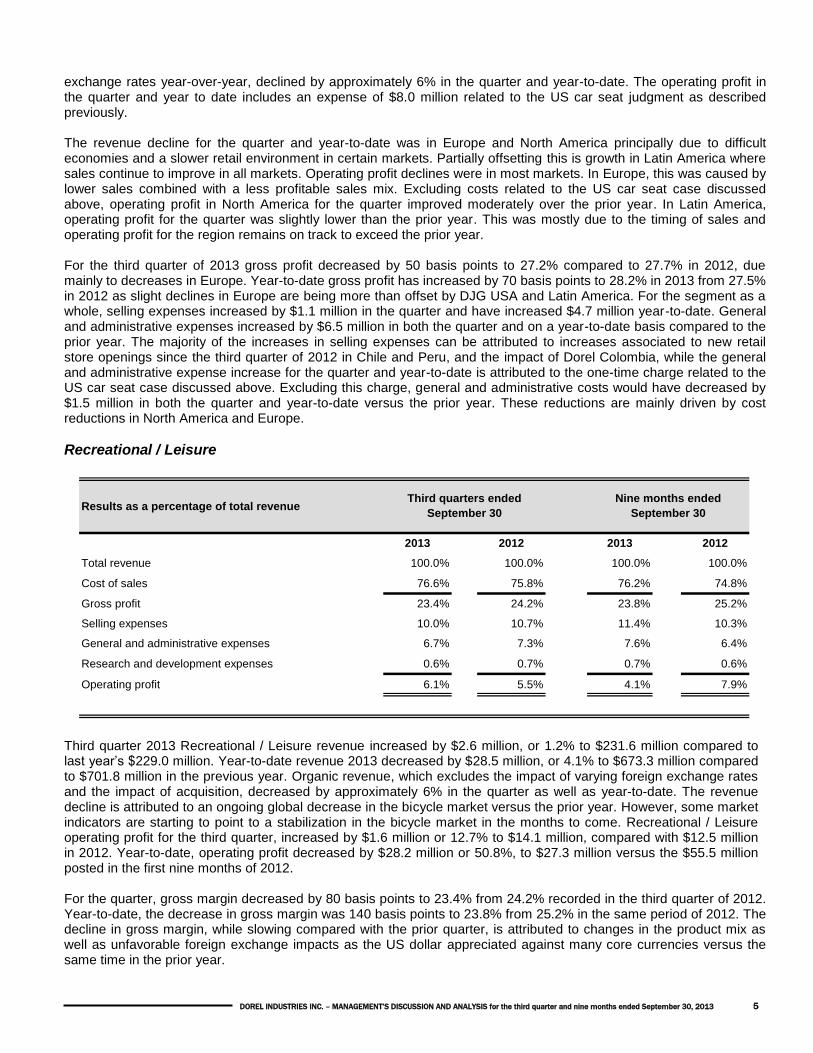
Recreational / Leisure
Results as a percentage of total revenue
2013 2012 2013 2012
Total revenue 100.0% 100.0% 100.0% 100.0%
Cost of sales 76.6% 75.8% 76.2% 74.8%
Gross profit 23.4% 24.2% 23.8% 25.2%
Selling expenses 10.0% 10.7% 11.4% 10.3%
General and administrative expenses 6.7% 7.3% 7.6% 6.4%
Research and development expenses 0.6% 0.7% 0.7% 0.6%
Operating profit 6.1% 5.5% 4.1% 7.9%
Nine months ended
September 30
Third quarters ended
September 30
Third quarter 2013 Recreational / Leisure revenue increased by $2.6 million, or 1.2% to $231.6 million compared to last year’s $229.0 million. Year-to-date revenue 2013 decreased by $28.5 million, or 4.1% to $673.3 million compared to $701.8 million in the previous year. Organic revenue, which excludes the impact of varying foreign exchange rates and the impact of acquisition, decreased by approximately 6% in the quarter as well as year-to-date. The revenue decline is attributed to an ongoing global decrease in the bicycle market versus the prior year. However, some market indicators are starting to point to a stabilization in the bicycle market in the months to come. Recreational / Leisure operating profit for the third quarter, increased by $1.6 million or 12.7% to $14.1 million, compared with $12.5 million in 2012. Year-to-date, operating profit decreased by $28.2 million or 50.8%, to $27.3 million versus the $55.5 million posted in the first nine months of 2012. For the quarter, gross margin decreased by 80 basis points to 23.4% from 24.2% recorded in the third quarter of 2012. Year-to-date, the decrease in gross margin was 140 basis points to 23.8% from 25.2% in the same period of 2012. The decline in gross margin, while slowing compared with the prior quarter, is attributed to changes in the product mix as well as unfavorable foreign exchange impacts as the US dollar appreciated against many core currencies versus the same time in the prior year.
DOREL INDUSTRIES INC. – MANAGEMENT’S DISCUSSION AND ANALYSIS for the third quarter and nine months ended September 30, 2013 6
For the quarter, selling expenses declined by 5.9%, indicating that the cost containment program that began in Q2 is on track, while on a year-to-date basis selling expenses increased by 5.9%. General and administrative expenses decreased 6.5% for the quarter while they increased by 13.7% on a year-to-date basis. Included in the year-to-date increase is the one-time charge of approximately $2.0 million related to severance as a result of the restructuring activities in the Recreational / Leisure segment as previously reported in the press release published on June 13, 2013. Excluding the one-time restructuring charge taken in Q2, general and administrative expenses would have increased 9.3% year-to-date.
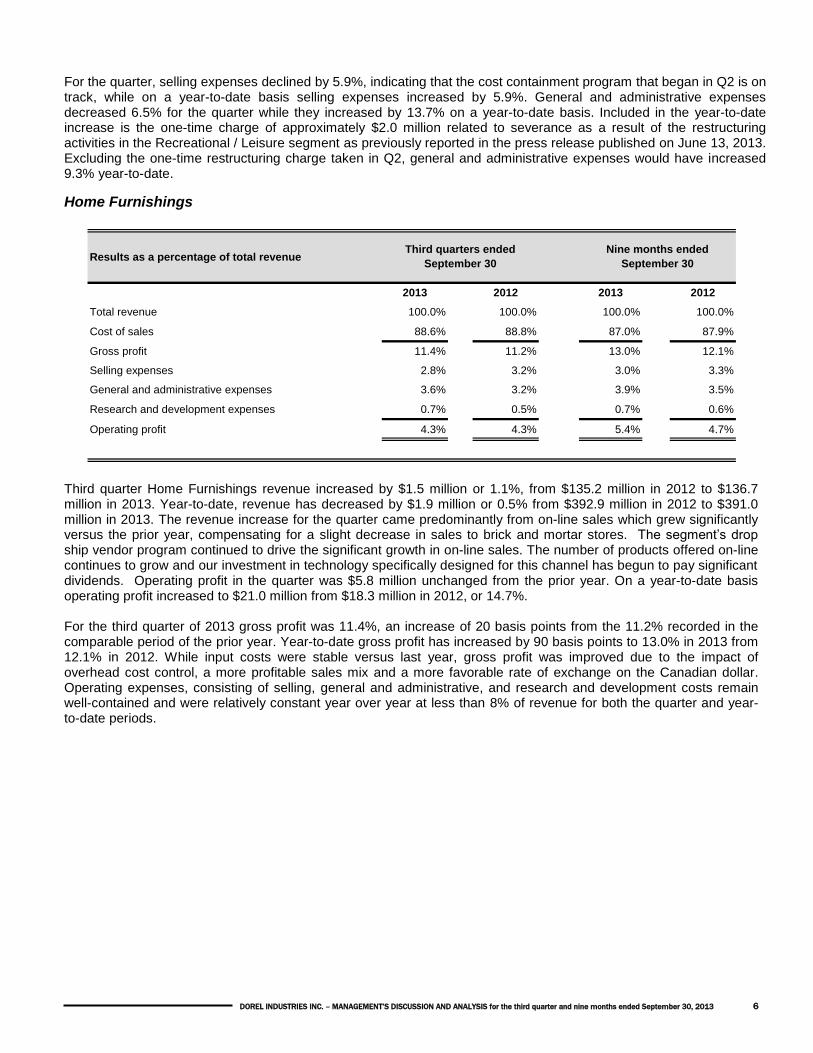
Home Furnishings
Results as a percentage of total revenue
2013 2012 2013 2012
Total revenue 100.0% 100.0% 100.0% 100.0%
Cost of sales 88.6% 88.8% 87.0% 87.9%
Gross profit 11.4% 11.2% 13.0% 12.1%
Selling expenses 2.8% 3.2% 3.0% 3.3%
General and administrative expenses 3.6% 3.2% 3.9% 3.5%
Research and development expenses 0.7% 0.5% 0.7% 0.6%
Operating profit 4.3% 4.3% 5.4% 4.7%
Nine months ended
September 30
Third quarters ended
September 30
Third quarter Home Furnishings revenue increased by $1.5 million or 1.1%, from $135.2 million in 2012 to $136.7 million in 2013. Year-to-date, revenue has decreased by $1.9 million or 0.5% from $392.9 million in 2012 to $391.0 million in 2013. The revenue increase for the quarter came predominantly from on-line sales which grew significantly versus the prior year, compensating for a slight decrease in sales to brick and mortar stores. The segment’s drop ship vendor program continued to drive the significant growth in on-line sales. The number of products offered on-line continues to grow and our investment in technology specifically designed for this channel has begun to pay significant dividends. Operating profit in the quarter was $5.8 million unchanged from the prior year. On a year-to-date basis operating profit increased to $21.0 million from $18.3 million in 2012, or 14.7%. For the third quarter of 2013 gross profit was 11.4%, an increase of 20 basis points from the 11.2% recorded in the comparable period of the prior year. Year-to-date gross profit has increased by 90 basis points to 13.0% in 2013 from 12.1% in 2012. While input costs were stable versus last year, gross profit was improved due to the impact of overhead cost control, a more profitable sales mix and a more favorable rate of exchange on the Canadian dollar. Operating expenses, consisting of selling, general and administrative, and research and development costs remain well-contained and were relatively constant year over year at less than 8% of revenue for both the quarter and year-to-date periods.
DOREL INDUSTRIES INC. – MANAGEMENT’S DISCUSSION AND ANALYSIS for the third quarter and nine months ended September 30, 2013 7
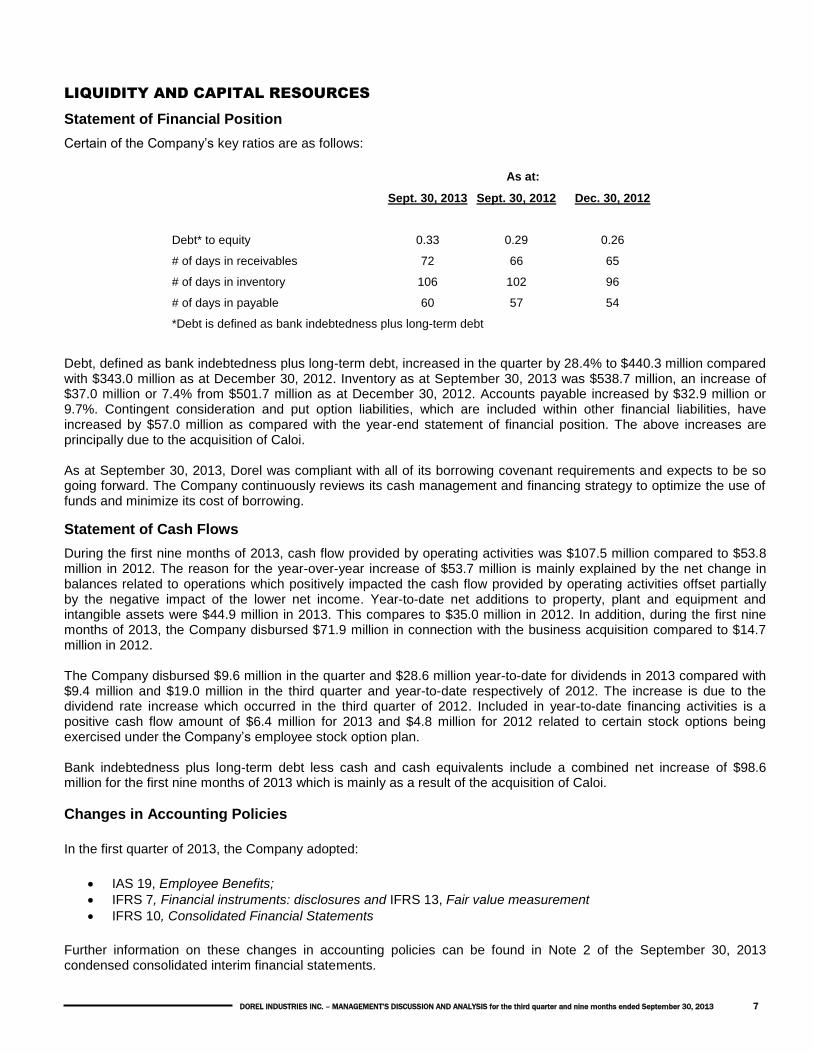
LIQUIDITY AND CAPITAL RESOURCES
Statement of Financial Position
Certain of the Company’s key ratios are as follows:
Sept. 30, 2013 Sept. 30, 2012 Dec. 30, 2012
Debt* to equity 0.33 0.29 0.26
# of days in receivables 72 66 65
# of days in inventory 106 102 96
# of days in payable 60 57 54
*Debt is defined as bank indebtedness plus long-term debt
As at:
Debt, defined as bank indebtedness plus long-term debt, increased in the quarter by 28.4% to $440.3 million compared with $343.0 million as at December 30, 2012. Inventory as at September 30, 2013 was $538.7 million, an increase of $37.0 million or 7.4% from $501.7 million as at December 30, 2012. Accounts payable increased by $32.9 million or 9.7%. Contingent consideration and put option liabilities, which are included within other financial liabilities, have increased by $57.0 million as compared with the year-end statement of financial position. The above increases are principally due to the acquisition of Caloi. As at September 30, 2013, Dorel was compliant with all of its borrowing covenant requirements and expects to be so going forward. The Company continuously reviews its cash management and financing strategy to optimize the use of funds and minimize its cost of borrowing.
Statement of Cash Flows
During the first nine months of 2013, cash flow provided by operating activities was $107.5 million compared to $53.8 million in 2012. The reason for the year-over-year increase of $53.7 million is mainly explained by the net change in balances related to operations which positively impacted the cash flow provided by operating activities offset partially by the negative impact of the lower net income. Year-to-date net additions to property, plant and equipment and intangible assets were $44.9 million in 2013. This compares to $35.0 million in 2012. In addition, during the first nine months of 2013, the Company disbursed $71.9 million in connection with the business acquisition compared to $14.7 million in 2012. The Company disbursed $9.6 million in the quarter and $28.6 million year-to-date for dividends in 2013 compared with $9.4 million and $19.0 million in the third quarter and year-to-date respectively of 2012. The increase is due to the dividend rate increase which occurred in the third quarter of 2012. Included in year-to-date financing activities is a positive cash flow amount of $6.4 million for 2013 and $4.8 million for 2012 related to certain stock options being exercised under the Company’s employee stock option plan. Bank indebtedness plus long-term debt less cash and cash equivalents include a combined net increase of $98.6 million for the first nine months of 2013 which is mainly as a result of the acquisition of Caloi.
Changes in Accounting Policies
In the first quarter of 2013, the Company adopted:
IAS 19, Employee Benefits;
IFRS 7, Financial instruments: disclosures and IFRS 13, Fair value measurement
IFRS 10, Consolidated Financial Statements
Further information on these changes in accounting policies can be found in Note 2 of the September 30, 2013 condensed consolidated interim financial statements.
DOREL INDUSTRIES INC. – MANAGEMENT’S DISCUSSION AND ANALYSIS for the third quarter and nine months ended September 30, 2013 8
Future Accounting Changes The following new standard was issued by the International Accounting Standards Board (“IASB”) and is mandatory but not yet effective for the nine months ended September 30, 2013 and has not been applied in preparing the condensed consolidated interim financial statements:
IFRS 9 – Financial Instruments
Further information on this modification can be found in Note 3 of the September 30, 2013 condensed consolidated interim financial statements.
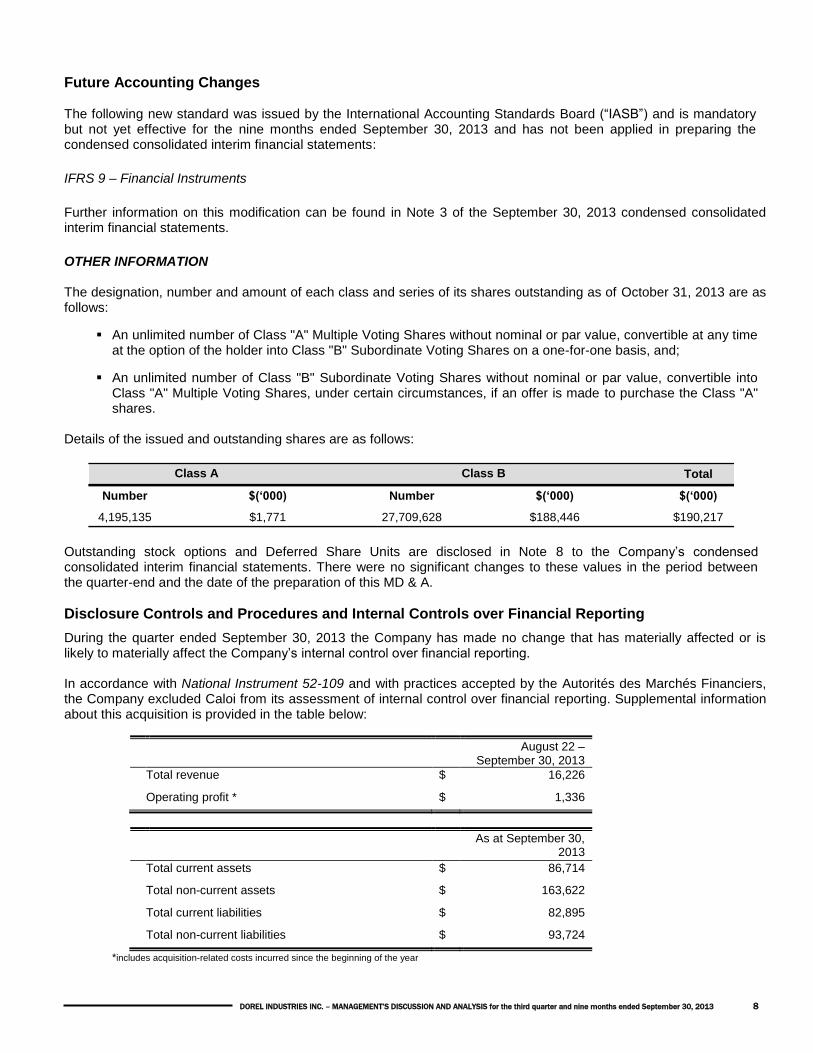
OTHER INFORMATION The designation, number and amount of each class and series of its shares outstanding as of October 31, 2013 are as follows:
An unlimited number of Class "A" Multiple Voting Shares without nominal or par value, convertible at any time at the option of the holder into Class "B" Subordinate Voting Shares on a one-for-one basis, and;
An unlimited number of Class "B" Subordinate Voting Shares without nominal or par value, convertible into Class "A" Multiple Voting Shares, under certain circumstances, if an offer is made to purchase the Class "A" shares.
Details of the issued and outstanding shares are as follows:
Total
Number $(‘000) Number $(‘000) $(‘000)
4,195,135 $1,771 27,709,628 $188,446 $190,217
Class A Class B
Outstanding stock options and Deferred Share Units are disclosed in Note 8 to the Company’s condensed consolidated interim financial statements. There were no significant changes to these values in the period between the quarter-end and the date of the preparation of this MD & A.
Disclosure Controls and Procedures and Internal Controls over Financial Reporting
During the quarter ended September 30, 2013 the Company has made no change that has materially affected or is likely to materially affect the Company’s internal control over financial reporting. In accordance with National Instrument 52-109 and with practices accepted by the Autorités des Marchés Financiers, the Company excluded Caloi from its assessment of internal control over financial reporting. Supplemental information about this acquisition is provided in the table below:
August 22 – September 30, 2013
Total revenue $ 16,226
Operating profit * $ 1,336
As at September 30, 2013
Total current assets $ 86,714
Total non-current assets $ 163,622
Total current liabilities $ 82,895
Total non-current liabilities $ 93,724
*includes acquisition-related costs incurred since the beginning of the year
DOREL INDUSTRIES INC. – MANAGEMENT’S DISCUSSION AND ANALYSIS for the third quarter and nine months ended September 30, 2013 9
Note that, given the short period between the date of acquisition and the end of the quarter, the Company did not obtain all the information to complete the initial accounting for business combinations, and therefore it is preliminary and subject to change following a final assessment of the fair value of the assets acquired, the liabilit ies assumed and the consideration transferred. See Note 5 of the September 30, 2013 condensed consolidated interim financial statements for additional information about the acquisition of Caloi.
Caution Regarding Forward Looking Information
Certain statements included in this MD&A may constitute “forward-looking statements” within the meaning of applicable Canadian securities legislation. Except as may be required by Canadian securities laws, the Company does not undertake any obligation to update or revise any forward-looking statements, whether as a result of new information, future events or otherwise. Forward-looking statements, by their very nature, are subject to numerous risks and uncertainties and are based on several assumptions which give rise to the possibility that actual results could differ materially from the Company’s expectations expressed in or implied by such forward-looking statements and that the objectives, plans, strategic priorities and business outlook may not be achieved. As a result, the Company cannot guarantee that any forward-looking statement will materialize. Forward-looking statements are provided in this MD&A for the purpose of giving information about Management’s current expectations and plans and allowing investors and others to get a better understanding of the Company’s operating environment. However, readers are cautioned that it may not be appropriate to use such forward-looking statements for any other purpose. Forward-looking statements made in this MD&A are based on a number of assumptions that the Company believed were reasonable on the day it made the forward-looking statements. Factors that could cause actual results to differ materially from the Company’s expectations expressed in or implied by the forward-looking statements include: general economic conditions; changes in product costs and supply channel; foreign currency fluctuations; customer and credit risk including the concentration of revenues with few customers; costs associated with product liability; changes in income tax legislation or the interpretation or application of those rules; the continued ability to develop products and support brand names; changes in the regulatory environment; continued access to capital resources and the related costs of borrowing; changes in assumptions in the valuation of goodwill and other intangible assets and subject to dividends being declared by the Board of Directors, there can be no certainty that Dorel Industries Inc.’s Dividend Policy will be maintained. These and other risk factors that could cause actual results to differ materially from expectations expressed in or implied by the forward-looking statements are discussed in the Company’s annual MD&A and Annual Information Form filed with the applicable Canadian securities regulatory authorities. The risk factors outlined in the previously mentioned documents are specifically incorporated herein by reference. The Company cautions readers that the risks described above are not the only ones that could impact it. Additional risks and uncertainties not currently known to the Company or that the Company currently deems to be immaterial may also have a material adverse effect on the business, financial condition or results of operations. Given these risks and uncertainties, investors should not place undue reliance on forward-looking statements as a prediction of actual results. Except as otherwise indicated, forward-looking statements do not reflect the potential impact of any non-recurring or other unusual items or of any dispositions, mergers, acquisitions, other business combinations or other transactions that may be announced or that may occur after the date hereof. The financial impact of these transactions and non-recurring and other unusual items can be complex and depends on the facts particular to each of them. The Company therefore cannot describe the expected impact in a meaningful way or in the same way the Company presents known risks affecting the business.
DOREL INDUSTRIES INC. – CONDENSED CONSOLIDATED INTERIM FINANCIAL STATEMENTS for the third quarter and nine months ended September 30, 2013 10
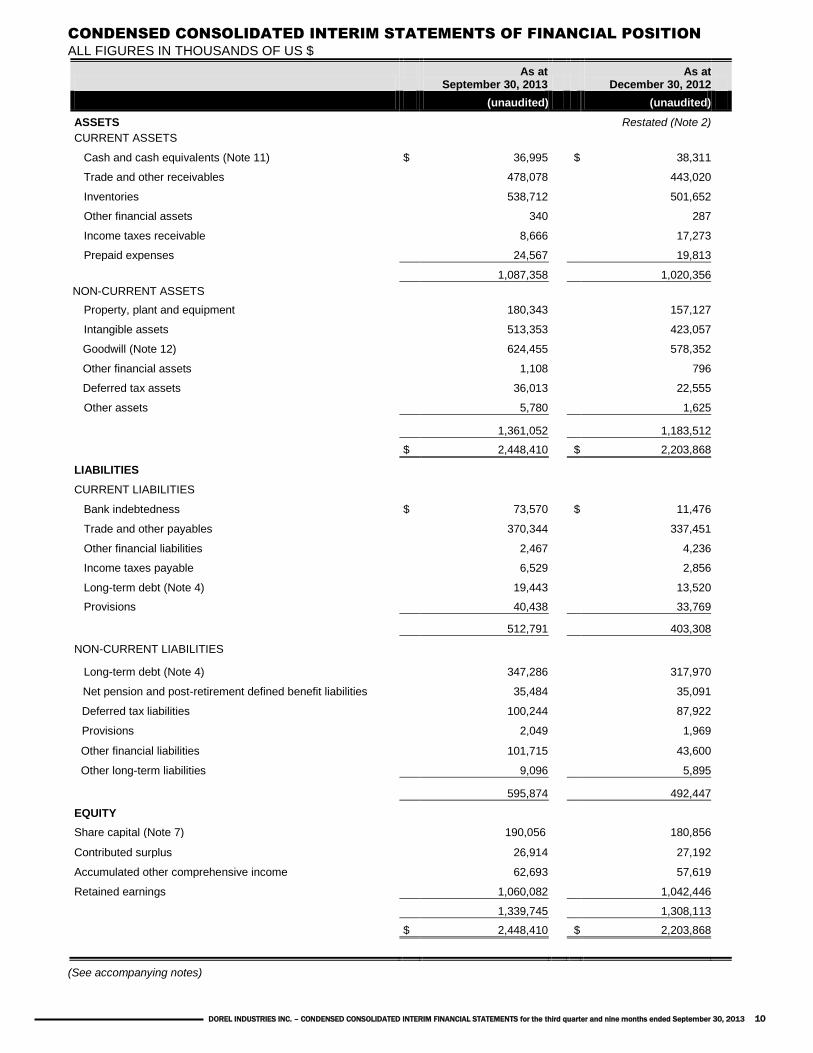
CONDENSED CONSOLIDATED INTERIM STATEMENTS OF FINANCIAL POSITION
ALL FIGURES IN THOUSANDS OF US $
As at
September 30, 2013 As at
December 30, 2012
(unaudited) (unaudited)
ASSETS Restated (Note 2)
CURRENT ASSETS
Cash and cash equivalents (Note 11) $ 36,995 $ 38,311
Trade and other receivables 478,078 443,020
Inventories 538,712 501,652
Other financial assets 340 287
Income taxes receivable 8,666 17,273
Prepaid expenses 24,567 19,813
1,087,358 1,020,356
NON-CURRENT ASSETS
Property, plant and equipment 180,343 157,127
Intangible assets 513,353 423,057
Goodwill (Note 12) 624,455 578,352
Other financial assets 1,108 796
Deferred tax assets 36,013 22,555
Other assets 5,780 1,625
1,361,052 1,183,512
$ 2,448,410 $ 2,203,868
LIABILITIES
CURRENT LIABILITIES
Bank indebtedness $ 73,570 $ 11,476
Trade and other payables 370,344 337,451
Other financial liabilities 2,467 4,236
Income taxes payable 6,529 2,856
Long-term debt (Note 4) 19,443 13,520
Provisions 40,438 33,769
512,791 403,308
NON-CURRENT LIABILITIES
Long-term debt (Note 4) 347,286 317,970
Net pension and post-retirement defined benefit liabilities 35,484 35,091
Deferred tax liabilities 100,244 87,922
Provisions 2,049 1,969
Other financial liabilities 101,715 43,600
Other long-term liabilities 9,096 5,895
595,874 492,447
EQUITY
Share capital (Note 7) 190,056 180,856
Contributed surplus 26,914 27,192
Accumulated other comprehensive income 62,693 57,619
Retained earnings 1,060,082 1,042,446
1,339,745 1,308,113
$ 2,448,410 $ 2,203,868
(See accompanying notes)
DOREL INDUSTRIES INC. – CONDENSED CONSOLIDATED INTERIM FINANCIAL STATEMENTS for the third quarter and nine months ended September 30, 2013 11
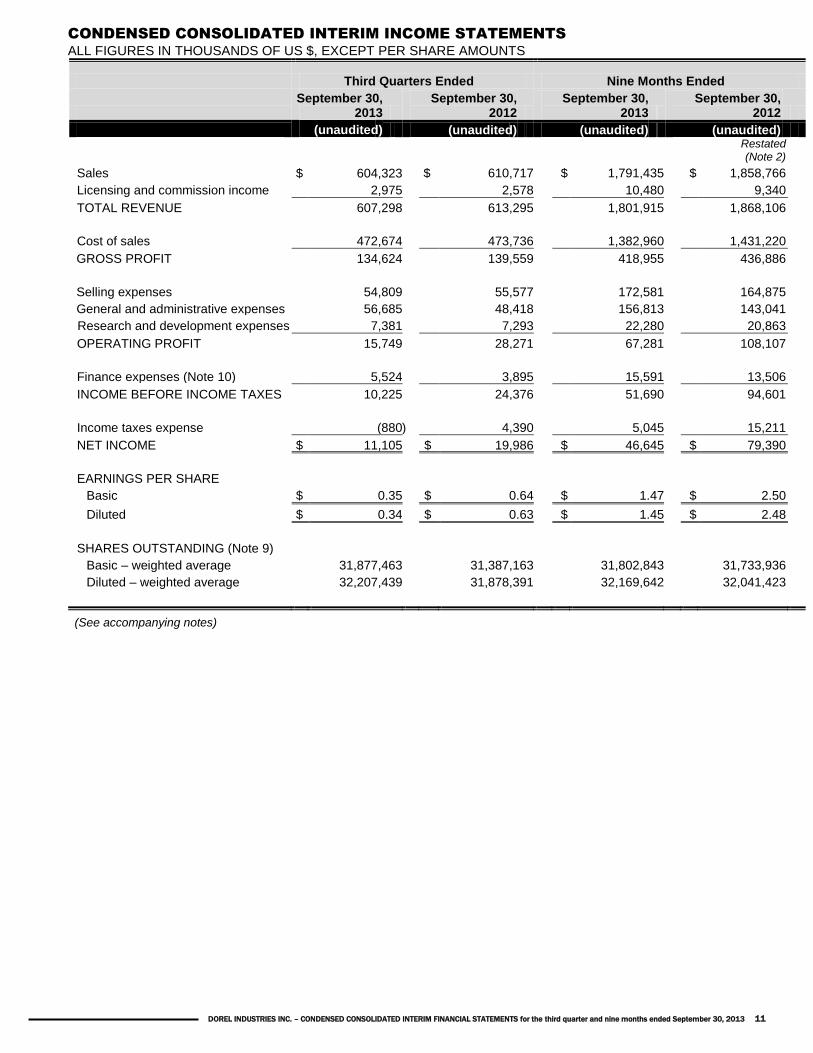
CONDENSED CONSOLIDATED INTERIM INCOME STATEMENTS
ALL FIGURES IN THOUSANDS OF US $, EXCEPT PER SHARE AMOUNTS
Third Quarters Ended Nine Months Ended
September 30,
2013 September 30,
2012 September 30,
2013 September 30,
2012
(unaudited) (unaudited) (unaudited) (unaudited)
Restated (Note 2)
Sales $ 604,323 $ 610,717 $ 1,791,435 $ 1,858,766
Licensing and commission income 2,975 2,578 10,480 9,340
TOTAL REVENUE 607,298 613,295 1,801,915 1,868,106
Cost of sales 472,674 473,736 1,382,960 1,431,220
GROSS PROFIT 134,624 139,559 418,955 436,886
Selling expenses 54,809 55,577 172,581 164,875
General and administrative expenses 56,685 48,418 156,813 143,041
Research and development expenses 7,381 7,293 22,280 20,863
OPERATING PROFIT 15,749 28,271 67,281 108,107
Finance expenses (Note 10) 5,524 3,895 15,591 13,506
INCOME BEFORE INCOME TAXES 10,225 24,376 51,690 94,601
Income taxes expense (880 ) 4,390 5,045 15,211
NET INCOME $ 11,105 $ 19,986 $ 46,645 $ 79,390
EARNINGS PER SHARE
Basic $ 0.35 $ 0.64 $ 1.47 $ 2.50
Diluted $ 0.34 $ 0.63 $ 1.45 $ 2.48
SHARES OUTSTANDING (Note 9)
Basic – weighted average 31,877,463 31,387,163 31,802,843 31,733,936
Diluted – weighted average 32,207,439 31,878,391 32,169,642 32,041,423
(See accompanying notes)
DOREL INDUSTRIES INC. – CONDENSED CONSOLIDATED INTERIM FINANCIAL STATEMENTS for the third quarter and nine months ended September 30, 2013 12
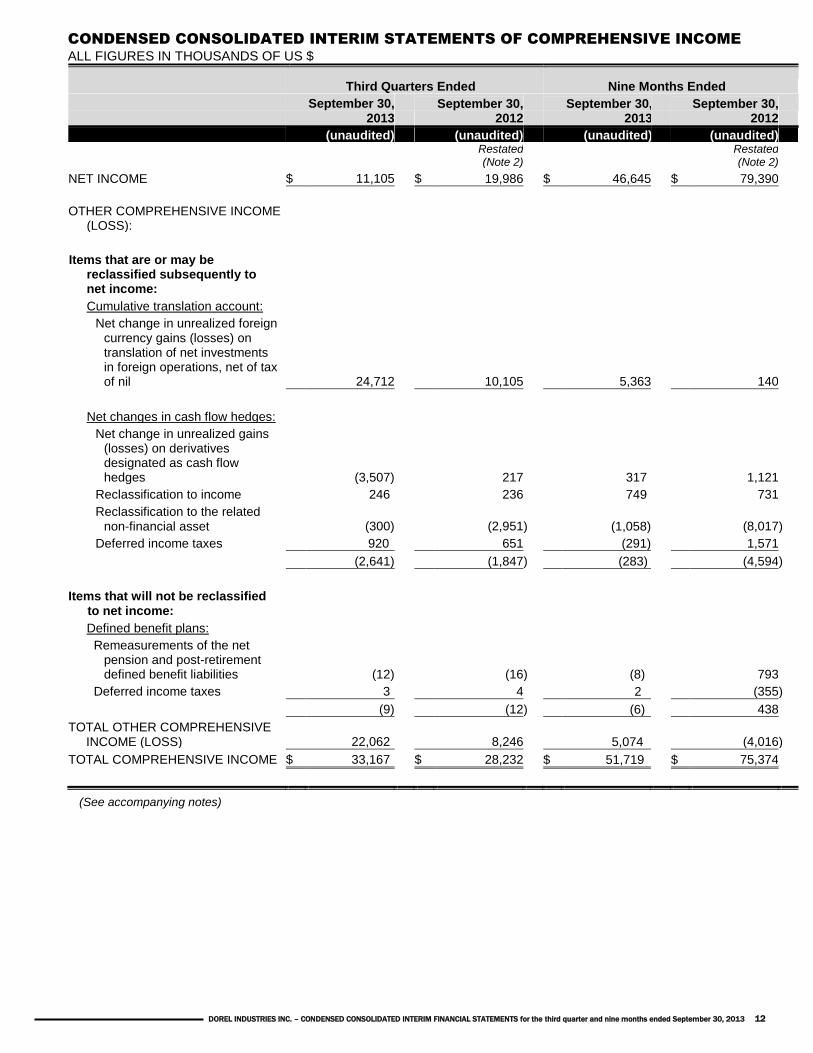
CONDENSED CONSOLIDATED INTERIM STATEMENTS OF COMPREHENSIVE INCOME
ALL FIGURES IN THOUSANDS OF US $
Third Quarters Ended Nine Months Ended
September 30, 2013
September 30, 2012
September 30, 2013
September 30, 2012
(unaudited) (unaudited) (unaudited) (unaudited)
Restated (Note 2)
Restated (Note 2)
NET INCOME $ 11,105 $ 19,986 $ 46,645 $ 79,390
OTHER COMPREHENSIVE INCOME
(LOSS):
Items that are or may be reclassified subsequently to net income:
Cumulative translation account:
Net change in unrealized foreign currency gains (losses) on translation of net investments in foreign operations, net of tax of nil 24,712 10,105 5,363 140
Net changes in cash flow hedges:
Net change in unrealized gains (losses) on derivatives designated as cash flow hedges (3,507) 217 317 1,121
Reclassification to income 246 236 749 731
Reclassification to the related non-financial asset (300) (2,951 ) (1,058) (8,017 )
Deferred income taxes 920 651 (291) 1,571
(2,641) (1,847 ) (283) (4,594 )
Items that will not be reclassified to net income:
Defined benefit plans:
Remeasurements of the net pension and post-retirement defined benefit liabilities (12) (16 ) (8) 793
Deferred income taxes 3 4 2 (355 )
(9) (12 ) (6) 438
TOTAL OTHER COMPREHENSIVE INCOME (LOSS) 22,062 8,246 5,074 (4,016 )
TOTAL COMPREHENSIVE INCOME $ 33,167 $ 28,232 $ 51,719 $ 75,374
(See accompanying notes)
DOREL INDUSTRIES INC. – CONDENSED CONSOLIDATED INTERIM FINANCIAL STATEMENTS for the third quarter and nine months ended September 30, 2013 13
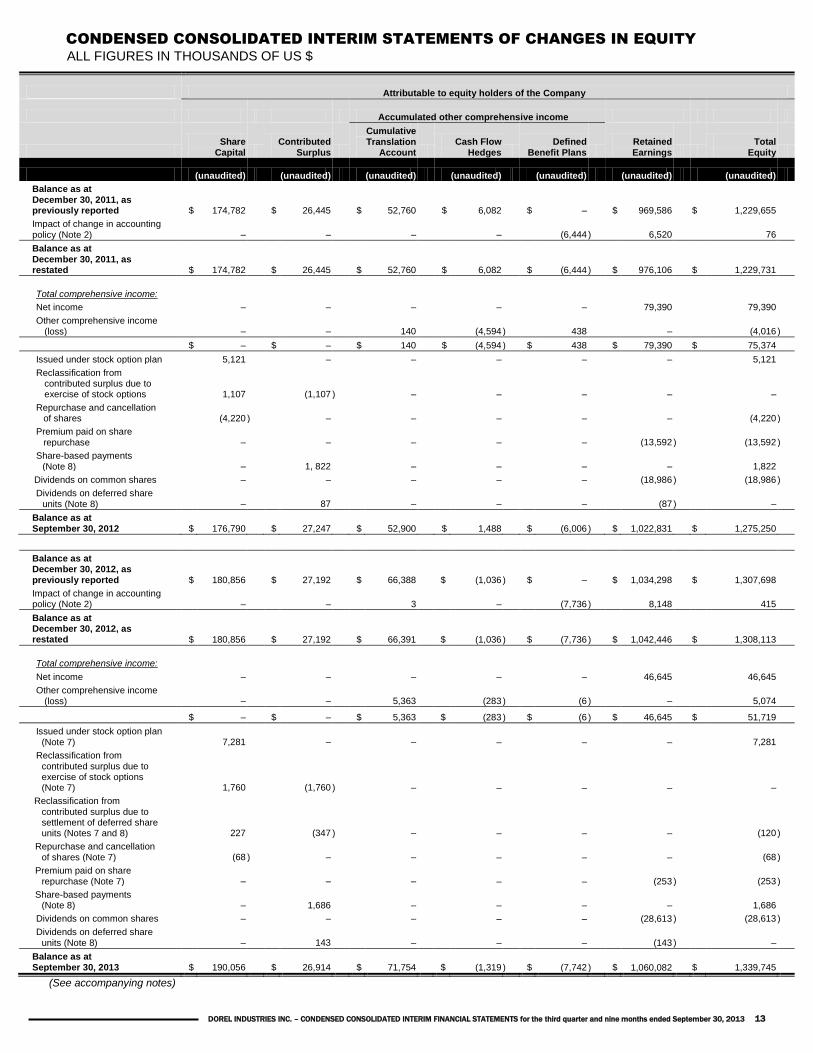
CONDENSED CONSOLIDATED INTERIM STATEMENTS OF CHANGES IN EQUITY
ALL FIGURES IN THOUSANDS OF US $
Attributable to equity holders of the Company
Accumulated other comprehensive income
Share
Capital
Contributed Surplus
Cumulative Translation
Account
Cash Flow Hedges
Defined Benefit Plans
Retained Earnings
Total Equity
(unaudited) (unaudited) (unaudited) (unaudited) (unaudited) (unaudited) (unaudited)
Balance as at December 30, 2011, as previously reported $ 174,782 $ 26,445 $ 52,760 $ 6,082 $ – $ 969,586 $ 1,229,655
Impact of change in accounting policy (Note 2) – – – – (6,444 ) 6,520 76
Balance as at December 30, 2011, as restated $ 174,782 $ 26,445 $ 52,760 $ 6,082 $ (6,444 ) $ 976,106 $ 1,229,731
Total comprehensive income:
Net income – – – – – 79,390 79,390
Other comprehensive income (loss) – – 140 (4,594 ) 438 – (4,016 )
$ – $ – $ 140 $ (4,594 ) $ 438 $ 79,390 $ 75,374
Issued under stock option plan 5,121 – – – – – 5,121
Reclassification from contributed surplus due to exercise of stock options 1,107 (1,107 ) – – – – –
Repurchase and cancellation of shares (4,220 ) – – – – – (4,220 )
Premium paid on share repurchase – – – – – (13,592 ) (13,592 )
Share-based payments (Note 8) – 1, 822 – – – – 1,822
Dividends on common shares – – – – – (18,986 ) (18,986 )
Dividends on deferred share units (Note 8) – 87 – – – (87 ) –
Balance as at September 30, 2012 $ 176,790 $ 27,247 $ 52,900 $ 1,488 $ (6,006 ) $ 1,022,831 $ 1,275,250
Balance as at December 30, 2012, as
previously reported $ 180,856 $ 27,192 $ 66,388 $ (1,036 ) $ – $ 1,034,298 $ 1,307,698
Impact of change in accounting policy (Note 2) – – 3 – (7,736 ) 8,148 415
Balance as at December 30, 2012, as restated $ 180,856 $ 27,192 $ 66,391 $ (1,036 ) $ (7,736 ) $ 1,042,446 $ 1,308,113
Total comprehensive income:
Net income – – – – – 46,645 46,645
Other comprehensive income (loss) – – 5,363 (283 ) (6 ) – 5,074
$ – $ – $ 5,363 $ (283 ) $ (6 ) $ 46,645 $ 51,719
Issued under stock option plan (Note 7) 7,281 – – – – – 7,281
Reclassification from contributed surplus due to exercise of stock options (Note 7) 1,760 (1,760 ) – – – – –
Reclassification from
contributed surplus due to settlement of deferred share units (Notes 7 and 8) 227 (347 ) – – – – (120 )
Repurchase and cancellation of shares (Note 7) (68 ) – – – – – (68 )
Premium paid on share repurchase (Note 7) – – – – – (253 ) (253 )
Share-based payments (Note 8) – 1,686 – – – – 1,686
Dividends on common shares – – – – – (28,613 ) (28,613 )
Dividends on deferred share units (Note 8) – 143 – – – (143 ) –
Balance as at September 30, 2013 $ 190,056 $ 26,914 $ 71,754 $ (1,319 ) $ (7,742 ) $ 1,060,082 $ 1,339,745
(See accompanying notes)
DOREL INDUSTRIES INC. – CONDENSED CONSOLIDATED INTERIM FINANCIAL STATEMENTS for the third quarter and nine months ended September 30, 2013 14
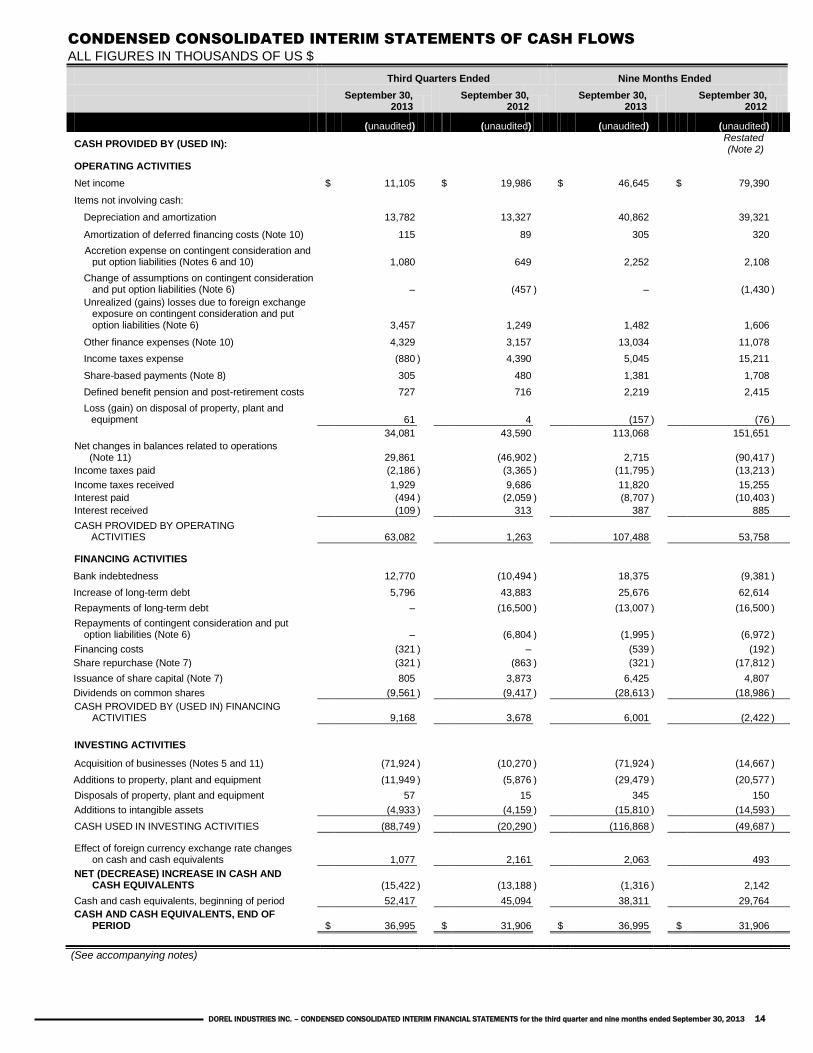
CONDENSED CONSOLIDATED INTERIM STATEMENTS OF CASH FLOWS
ALL FIGURES IN THOUSANDS OF US $
Third Quarters Ended Nine Months Ended
September 30,
2013 September 30,
2012 September 30,
2013 September 30,
2012
(unaudited) (unaudited) (unaudited) (unaudited)
CASH PROVIDED BY (USED IN): Restated (Note 2)
OPERATING ACTIVITIES
Net income $ 11,105 $ 19,986 $ 46,645 $ 79,390
Items not involving cash:
Depreciation and amortization 13,782 13,327 40,862 39,321
Amortization of deferred financing costs (Note 10) 115 89 305 320
Accretion expense on contingent consideration and put option liabilities (Notes 6 and 10) 1,080 649 2,252 2,108
Change of assumptions on contingent consideration and put option liabilities (Note 6) –
(457 ) – (1,430 )
Unrealized (gains) losses due to foreign exchange exposure on contingent consideration and put option liabilities (Note 6) 3,457 1,249 1,482 1,606
Other finance expenses (Note 10) 4,329 3,157 13,034 11,078
Income taxes expense (880 ) 4,390 5,045 15,211
Share-based payments (Note 8) 305 480 1,381 1,708
Defined benefit pension and post-retirement costs 727 716 2,219 2,415
Loss (gain) on disposal of property, plant and equipment 61 4 (157 ) (76 )
34,081 43,590 113,068 151,651
Net changes in balances related to operations (Note 11) 29,861 (46,902 ) 2,715 (90,417 )
Income taxes paid (2,186 ) (3,365 ) (11,795 ) (13,213 )
Income taxes received 1,929 9,686 11,820 15,255
Interest paid (494 ) (2,059 ) (8,707 ) (10,403 )
Interest received (109 ) 313 387 885
CASH PROVIDED BY OPERATING ACTIVITIES 63,082 1,263 107,488 53,758
FINANCING ACTIVITIES
Bank indebtedness 12,770 (10,494 ) 18,375 (9,381 )
Increase of long-term debt 5,796 43,883 25,676 62,614
Repayments of long-term debt – (16,500 ) (13,007 ) (16,500 )
Repayments of contingent consideration and put option liabilities (Note 6) – (6,804 ) (1,995 ) (6,972 )
Financing costs (321 ) – (539 ) (192 )
Share repurchase (Note 7) (321 ) (863 ) (321 ) (17,812 )
Issuance of share capital (Note 7) 805 3,873 6,425 4,807
Dividends on common shares (9,561 ) (9,417 ) (28,613 ) (18,986 )
CASH PROVIDED BY (USED IN) FINANCING ACTIVITIES 9,168 3,678 6,001 (2,422 )
INVESTING ACTIVITIES
Acquisition of businesses (Notes 5 and 11) (71,924 ) (10,270 ) (71,924 ) (14,667 )
Additions to property, plant and equipment (11,949 ) (5,876 ) (29,479 ) (20,577 )
Disposals of property, plant and equipment 57 15 345 150
Additions to intangible assets (4,933 ) (4,159 ) (15,810 ) (14,593 )
CASH USED IN INVESTING ACTIVITIES (88,749 ) (20,290 ) (116,868 ) (49,687 )
Effect of foreign currency exchange rate changes
on cash and cash equivalents 1,077 2,161 2,063 493
NET (DECREASE) INCREASE IN CASH AND CASH EQUIVALENTS (15,422 ) (13,188 ) (1,316 ) 2,142
Cash and cash equivalents, beginning of period 52,417 45,094 38,311 29,764
CASH AND CASH EQUIVALENTS, END OF PERIOD $ 36,995 $ 31,906 $ 36,995 $ 31,906
(See accompanying notes)
DOREL INDUSTRIES INC. – CONDENSED CONSOLIDATED INTERIM FINANCIAL STATEMENTS for the third quarter and nine months ended September 30, 2013 15
Notes to the Condensed Consolidated Interim Financial Statements
For the periods ended September 30, 2013 and 2012 All figures in thousands of US$, except per share amounts (unaudited)
1. Nature of operations
Dorel Industries Inc. (the “Company”) is a global consumer products company which designs, manufactures or sources, markets and distributes a diverse portfolio of powerful product brands, marketed through its Juvenile, Recreational/Leisure and Home Furnishings segments. The principal markets for the Company’s products are the United States, Canada, Europe and Latin America.
2. Statement of compliance and basis of preparation and measurement
The condensed consolidated interim financial statements have been prepared in accordance with IAS 34, Interim Financial Reporting as adopted by the International Accounting Standards Board (“IASB”), using the U.S. dollar as the reporting currency. The U.S. dollar is the functional currency of the Canadian parent company. All financial information presented in U.S. dollars has been rounded to the nearest thousand. These condensed consolidated interim financial statements are prepared in accordance with International Financial Reporting Standards (“IFRS”) and with the same accounting policies and methods of computation followed in the most recent audited consolidated annual financial statements as at and for the year ended December 30, 2012, except for the changes in accounting policies below. The condensed consolidated interim financial statements do not include all of the information required for full consolidated annual financial statements. Certain information and footnote disclosures normally included in consolidated annual financial statements prepared in accordance with IFRS were omitted or condensed where such information is not considered material to the understanding of the Company’s condensed consolidated interim financial information.
These condensed consolidated interim financial statements should be read in conjunction with the Company’s 2012 audited consolidated annual financial statements. Certain comparative accounts have been reclassified in order to conform to the 2013 financial statement presentation.
The condensed consolidated interim financial statements have been prepared on a historical basis except for:
derivative financial instruments which are measured at fair value;
contingent consideration and put option liabilities which are measured at fair value;
share-based compensation arrangements which are measured at fair value at grant date;
identifiable assets acquired and liabilities assumed in connection with a business combination which are measured at fair value at acquisition date;
the net pension and post-retirement defined benefit liabilities which are measured as the net total of plan assets measured at fair value less the discounted present value of the defined benefit obligations; and
product liability which is measured at its discounted present value.
These condensed consolidated interim financial statements were authorized by the Company’s Board of Directors for issue on November 6th, 2013.
The results of operations for the interim period are not necessarily indicative of the results of operations for the full year. The Company does not expect seasonality to be a material factor in quarterly results, though operating segments within the Company may vary more significantly. Changes in accounting policies IAS 19 – Employee benefits
In the first quarter of 2013, the Company early adopted the amendments to IAS 19, Employee Benefits. The revised standard requires immediate recognition of remeasurements of the net pension and post-retirement defined benefit liabilities in other comprehensive income. This eliminates the previous options that were available, and enhances the guidance concerning the measurement of plan assets and defined benefit obligations. It also streamlines the presentation of changes in assets and liabilities arising from defined benefit plans and the introduction of enhanced disclosures for defined benefit plans.
DOREL INDUSTRIES INC. – CONDENSED CONSOLIDATED INTERIM FINANCIAL STATEMENTS for the third quarter and nine months ended September 30, 2013 16
2. Statement of compliance and basis of preparation and measurement (continued)
Changes in accounting policies (continued)
IAS 19 – Employee benefits (continued)
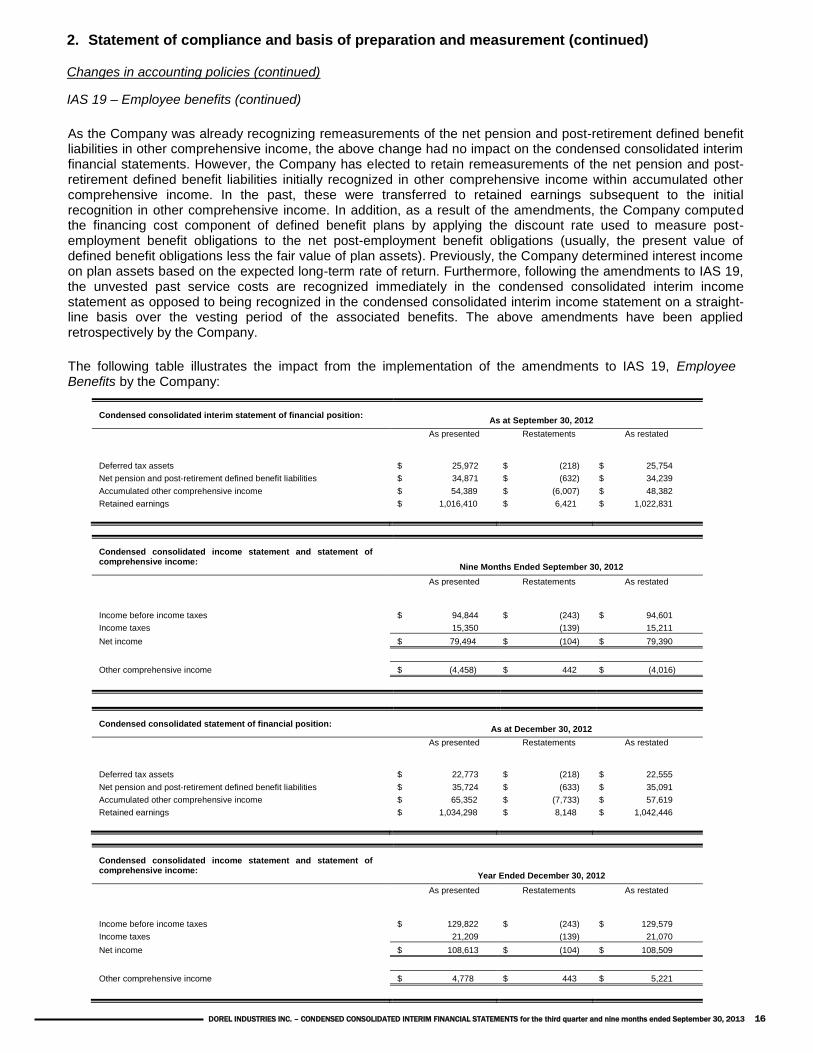
As the Company was already recognizing remeasurements of the net pension and post-retirement defined benefit liabilities in other comprehensive income, the above change had no impact on the condensed consolidated interim financial statements. However, the Company has elected to retain remeasurements of the net pension and post-retirement defined benefit liabilities initially recognized in other comprehensive income within accumulated other comprehensive income. In the past, these were transferred to retained earnings subsequent to the initial recognition in other comprehensive income. In addition, as a result of the amendments, the Company computed the financing cost component of defined benefit plans by applying the discount rate used to measure post-employment benefit obligations to the net post-employment benefit obligations (usually, the present value of defined benefit obligations less the fair value of plan assets). Previously, the Company determined interest income on plan assets based on the expected long-term rate of return. Furthermore, following the amendments to IAS 19, the unvested past service costs are recognized immediately in the condensed consolidated interim income statement as opposed to being recognized in the condensed consolidated interim income statement on a straight-line basis over the vesting period of the associated benefits. The above amendments have been applied retrospectively by the Company.
The following table illustrates the impact from the implementation of the amendments to IAS 19, Employee Benefits by the Company:
Condensed consolidated interim statement of financial position: As at September 30, 2012
As presented Restatements As restated
Deferred tax assets $ 25,972 $ (218) $ 25,754
Net pension and post-retirement defined benefit liabilities $ 34,871 $ (632) $ 34,239
Accumulated other comprehensive income $ 54,389 $ (6,007) $ 48,382
Retained earnings $ 1,016,410 $ 6,421 $ 1,022,831
Condensed consolidated income statement and statement of comprehensive income:
Nine Months Ended September 30, 2012
As presented Restatements As restated
Income before income taxes $ 94,844 $ (243) $ 94,601
Income taxes 15,350 (139) 15,211
Net income $ 79,494 $ (104) $ 79,390
Other comprehensive income $ (4,458) $ 442 $ (4,016)
Condensed consolidated statement of financial position: As at December 30, 2012
As presented Restatements As restated
Deferred tax assets $ 22,773 $ (218) $ 22,555
Net pension and post-retirement defined benefit liabilities $ 35,724 $ (633) $ 35,091
Accumulated other comprehensive income $ 65,352 $ (7,733) $ 57,619
Retained earnings $ 1,034,298 $ 8,148 $ 1,042,446
Condensed consolidated income statement and statement of comprehensive income:
Year Ended December 30, 2012
As presented Restatements As restated
Income before income taxes $ 129,822 $ (243) $ 129,579
Income taxes 21,209 (139) 21,070
Net income $ 108,613 $ (104) $ 108,509
Other comprehensive income $ 4,778 $ 443 $ 5,221
DOREL INDUSTRIES INC. – CONDENSED CONSOLIDATED INTERIM FINANCIAL STATEMENTS for the third quarter and nine months ended September 30, 2013 17
2. Statement of compliance and basis of preparation and measurement (continued)
Changes in accounting policies (continued) IAS 19 – Employee benefits (continued)
This new accounting policy did not have a material impact on the condensed consolidated interim statement of cash flows and on the earnings per share.
IFRS 7 – Financial instruments: disclosures and IFRS 13 – Fair value measurement In the first quarter of 2013, the Company early adopted the additional disclosure requirements of IFRS 7, Financial instruments: disclosures and IFRS 13, Fair value measurement prospectively. As the additional requirements pertain mainly to disclosures in the condensed consolidated interim financial statements, they have been reflected in Note 6 on a prospective basis. IFRS 10 – Consolidated Financial Statements IFRS 10, Consolidated Financial Statements, replaces the guidance in IAS 27, Consolidated and Separate Financial Statements and SIC-12, Consolidation – Special Purpose Entities. The consolidation procedures are carried forward substantially unmodified from IAS 27. The adoption of IFRS 10 did not have a material impact on the Company’s condensed consolidated interim financial statements.
3. Future accounting changes
The following new standard was issued by the IASB and is mandatory but not yet effective for the nine months ended September 30, 2013 and has not been applied in preparing these condensed consolidated interim financial statements:
IFRS 9 – Financial Instruments
As part of the initial phase to replace IAS 39, Financial Instruments: Recognition and Measurement, this standard retains but simplifies the mixed measurement model and establishes two primary measurement categories for financial assets. This first phase only covers classification and measurement of financial assets and financial liabilities, with impairment of financial assets and hedge accounting being addressed in the other two phases. More specifically, the standard:
- Deals with classification and measurement of financial assets; - Establishes two primary measurement categories for financial assets: amortized cost and fair value; - Prescribes that classification depends on the entity’s business model and the contractual cash flow
characteristics of the financial asset; and - Eliminates the following existing categories: held to maturity, available for sale, and loans and receivables.
Most of the requirements in IAS 39 for classification and measurement of financial liabilities were carried forward in IFRS 9. However, certain changes were also made regarding the fair value option for financial liabilities and accounting for certain derivatives linked to unquoted equity instruments.
This standard will be effective for annual periods beginning on or after January 1, 2015, with earlier adoption permitted. The Company has not yet assessed the impact of the adoption of this standard on its consolidated financial statements.
4. Long-term debt
Effective May 31, 2013 the Company amended the terms of its revolving bank loans in order to extend the maturity from July 1, 2015 to July 1, 2016. In addition, effective August 21, 2013, the total availability of its revolving bank loans has been increased from $260,000 to $360,000 and the accordion feature allowing the Company to have access to an additional amount has been reduced from $200,000 to $100,000.
DOREL INDUSTRIES INC. – CONDENSED CONSOLIDATED INTERIM FINANCIAL STATEMENTS for the third quarter and nine months ended September 30, 2013 18
5. Business acquisitions
Best Brands Group SA and Baby Universe SAS
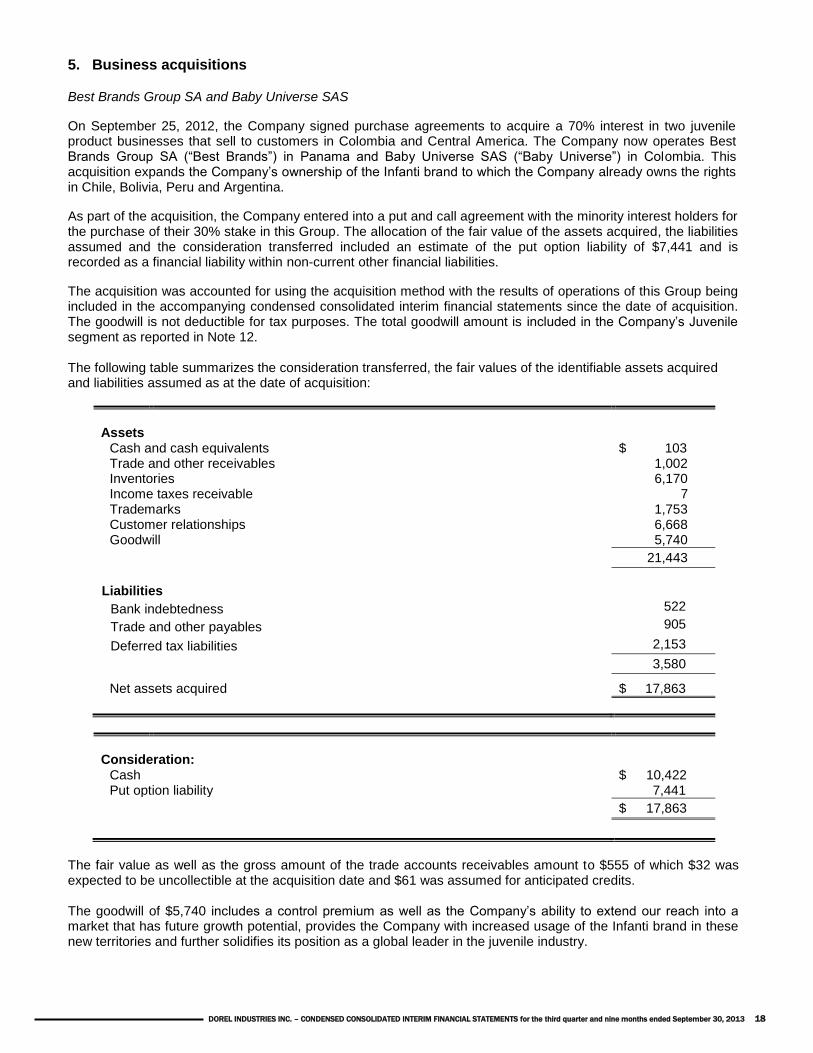
On September 25, 2012, the Company signed purchase agreements to acquire a 70% interest in two juvenile product businesses that sell to customers in Colombia and Central America. The Company now operates Best Brands Group SA (“Best Brands”) in Panama and Baby Universe SAS (“Baby Universe”) in Colombia. This acquisition expands the Company’s ownership of the Infanti brand to which the Company already owns the rights in Chile, Bolivia, Peru and Argentina.
As part of the acquisition, the Company entered into a put and call agreement with the minority interest holders for the purchase of their 30% stake in this Group. The allocation of the fair value of the assets acquired, the liabilities assumed and the consideration transferred included an estimate of the put option liability of $7,441 and is recorded as a financial liability within non-current other financial liabilities.
The acquisition was accounted for using the acquisition method with the results of operations of this Group being included in the accompanying condensed consolidated interim financial statements since the date of acquisition. The goodwill is not deductible for tax purposes. The total goodwill amount is included in the Company’s Juvenile segment as reported in Note 12. The following table summarizes the consideration transferred, the fair values of the identifiable assets acquired and liabilities assumed as at the date of acquisition:
Assets
Cash and cash equivalents $ 103 Trade and other receivables 1,002 Inventories 6,170 Income taxes receivable 7 Trademarks 1,753 Customer relationships 6,668 Goodwill 5,740 21,443
Liabilities
Bank indebtedness 522
Trade and other payables 905
Deferred tax liabilities 2,153
3,580 xxx xxx
Net assets acquired $ 17,863
Consideration:
Cash $ 10,422 Put option liability 7,441
$ 17,863
The fair value as well as the gross amount of the trade accounts receivables amount to $555 of which $32 was expected to be uncollectible at the acquisition date and $61 was assumed for anticipated credits. The goodwill of $5,740 includes a control premium as well as the Company’s ability to extend our reach into a market that has future growth potential, provides the Company with increased usage of the Infanti brand in these new territories and further solidifies its position as a global leader in the juvenile industry.
DOREL INDUSTRIES INC. – CONDENSED CONSOLIDATED INTERIM FINANCIAL STATEMENTS for the third quarter and nine months ended September 30, 2013 19
5. Business acquisitions (continued)
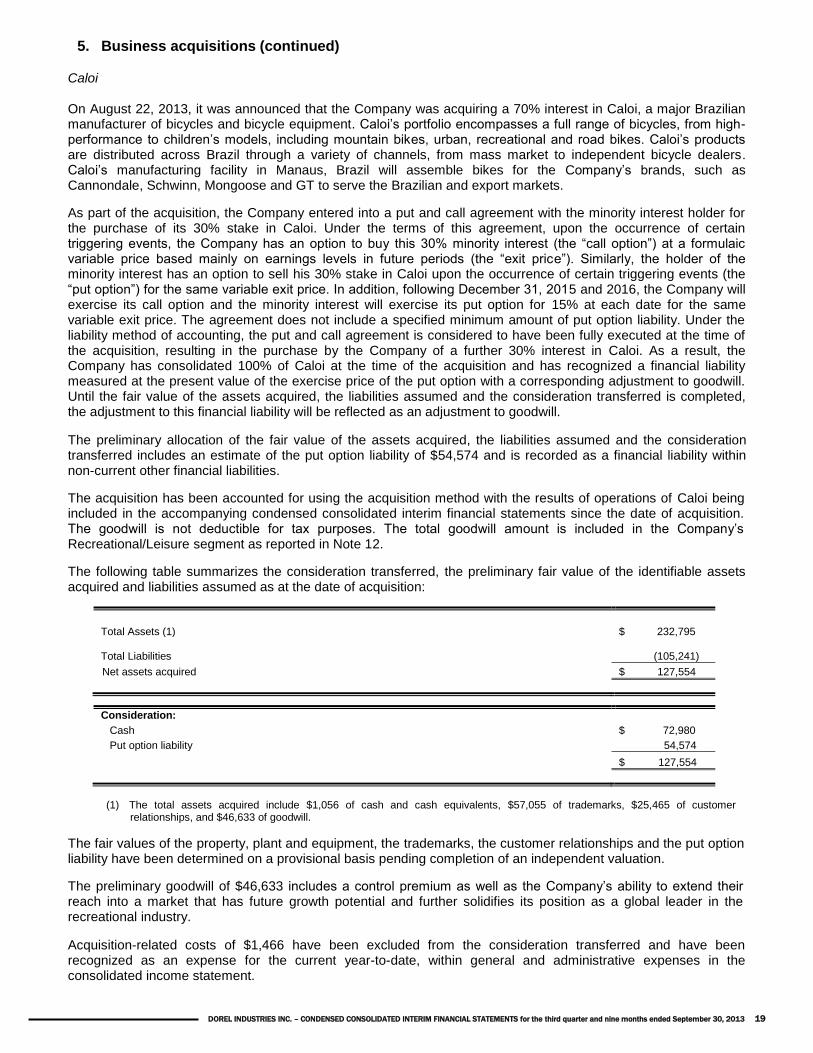
Caloi On August 22, 2013, it was announced that the Company was acquiring a 70% interest in Caloi, a major Brazilian manufacturer of bicycles and bicycle equipment. Caloi’s portfolio encompasses a full range of bicycles, from high-performance to children’s models, including mountain bikes, urban, recreational and road bikes. Caloi’s products are distributed across Brazil through a variety of channels, from mass market to independent bicycle dealers. Caloi’s manufacturing facility in Manaus, Brazil will assemble bikes for the Company’s brands, such as Cannondale, Schwinn, Mongoose and GT to serve the Brazilian and export markets.
As part of the acquisition, the Company entered into a put and call agreement with the minority interest holder for the purchase of its 30% stake in Caloi. Under the terms of this agreement, upon the occurrence of certain triggering events, the Company has an option to buy this 30% minority interest (the “call option”) at a formulaic variable price based mainly on earnings levels in future periods (the “exit price”). Similarly, the holder of the minority interest has an option to sell his 30% stake in Caloi upon the occurrence of certain triggering events (the “put option”) for the same variable exit price. In addition, following December 31, 2015 and 2016, the Company will exercise its call option and the minority interest will exercise its put option for 15% at each date for the same variable exit price. The agreement does not include a specified minimum amount of put option liability. Under the liability method of accounting, the put and call agreement is considered to have been fully executed at the time of the acquisition, resulting in the purchase by the Company of a further 30% interest in Caloi. As a result, the Company has consolidated 100% of Caloi at the time of the acquisition and has recognized a financial liability measured at the present value of the exercise price of the put option with a corresponding adjustment to goodwill. Until the fair value of the assets acquired, the liabilities assumed and the consideration transferred is completed, the adjustment to this financial liability will be reflected as an adjustment to goodwill.
The preliminary allocation of the fair value of the assets acquired, the liabilities assumed and the consideration transferred includes an estimate of the put option liability of $54,574 and is recorded as a financial liability within non-current other financial liabilities.
The acquisition has been accounted for using the acquisition method with the results of operations of Caloi being included in the accompanying condensed consolidated interim financial statements since the date of acquisition. The goodwill is not deductible for tax purposes. The total goodwill amount is included in the Company’s Recreational/Leisure segment as reported in Note 12.
The following table summarizes the consideration transferred, the preliminary fair value of the identifiable assets acquired and liabilities assumed as at the date of acquisition:
Total Assets (1) $ 232,795 Total Liabilities (105,241)
Net assets acquired $ 127,554
Consideration:
Cash $ 72,980
Put option liability 54,574
$ 127,554
(1) The total assets acquired include $1,056 of cash and cash equivalents, $57,055 of trademarks, $25,465 of customer
relationships, and $46,633 of goodwill.
The fair values of the property, plant and equipment, the trademarks, the customer relationships and the put option liability have been determined on a provisional basis pending completion of an independent valuation.
The preliminary goodwill of $46,633 includes a control premium as well as the Company’s ability to extend their reach into a market that has future growth potential and further solidifies its position as a global leader in the recreational industry.
Acquisition-related costs of $1,466 have been excluded from the consideration transferred and have been recognized as an expense for the current year-to-date, within general and administrative expenses in the consolidated income statement.
DOREL INDUSTRIES INC. – CONDENSED CONSOLIDATED INTERIM FINANCIAL STATEMENTS for the third quarter and nine months ended September 30, 2013 20
6. Fair value of financial instruments
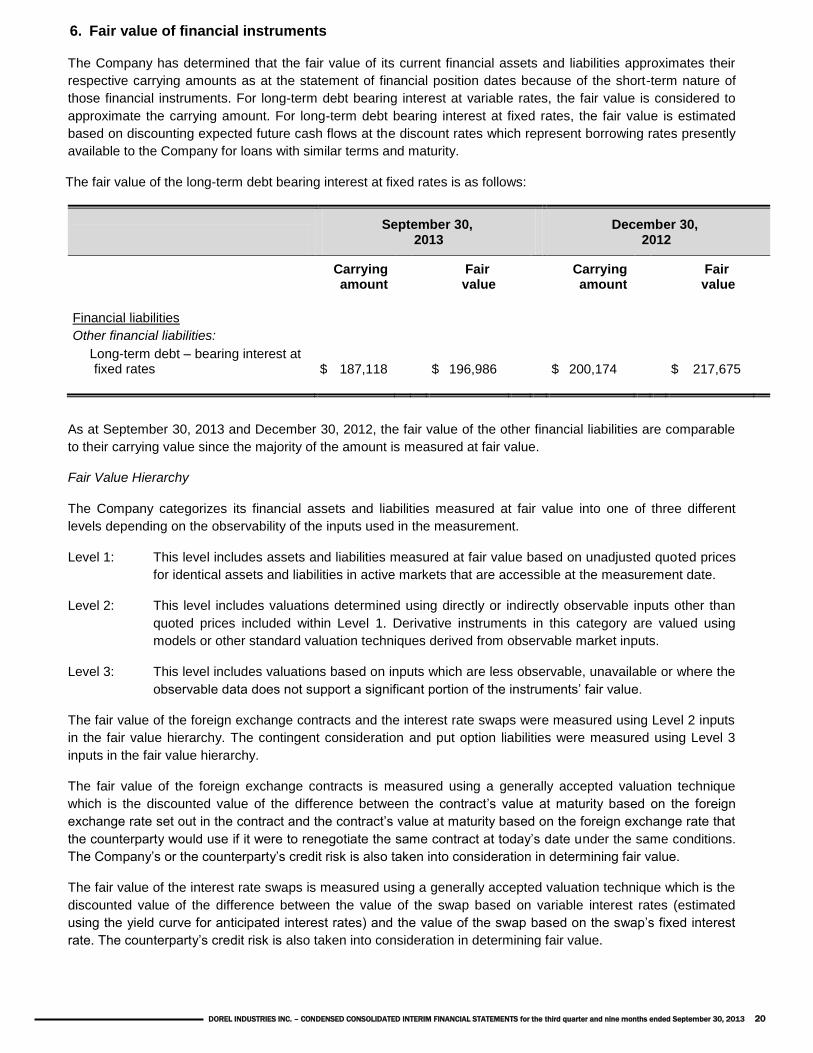
The Company has determined that the fair value of its current financial assets and liabilities approximates their
respective carrying amounts as at the statement of financial position dates because of the short-term nature of
those financial instruments. For long-term debt bearing interest at variable rates, the fair value is considered to
approximate the carrying amount. For long-term debt bearing interest at fixed rates, the fair value is estimated
based on discounting expected future cash flows at the discount rates which represent borrowing rates presently
available to the Company for loans with similar terms and maturity.
The fair value of the long-term debt bearing interest at fixed rates is as follows:
September 30,
2013 December 30,
2012
Carrying amount
Fair value
Carrying amount
Fair value
Financial liabilities
Other financial liabilities:
Long-term debt – bearing interest at fixed rates $ 187,118 $ 196,986 $ 200,174 $ 217,675
As at September 30, 2013 and December 30, 2012, the fair value of the other financial liabilities are comparable
to their carrying value since the majority of the amount is measured at fair value.
Fair Value Hierarchy
The Company categorizes its financial assets and liabilities measured at fair value into one of three different
levels depending on the observability of the inputs used in the measurement.
Level 1: This level includes assets and liabilities measured at fair value based on unadjusted quoted prices
for identical assets and liabilities in active markets that are accessible at the measurement date.
Level 2: This level includes valuations determined using directly or indirectly observable inputs other than
quoted prices included within Level 1. Derivative instruments in this category are valued using
models or other standard valuation techniques derived from observable market inputs.
Level 3: This level includes valuations based on inputs which are less observable, unavailable or where the
observable data does not support a significant portion of the instruments’ fair value.
The fair value of the foreign exchange contracts and the interest rate swaps were measured using Level 2 inputs
in the fair value hierarchy. The contingent consideration and put option liabilities were measured using Level 3
inputs in the fair value hierarchy.
The fair value of the foreign exchange contracts is measured using a generally accepted valuation technique
which is the discounted value of the difference between the contract’s value at maturity based on the foreign
exchange rate set out in the contract and the contract’s value at maturity based on the foreign exchange rate that
the counterparty would use if it were to renegotiate the same contract at today’s date under the same conditions.
The Company’s or the counterparty’s credit risk is also taken into consideration in determining fair value.
The fair value of the interest rate swaps is measured using a generally accepted valuation technique which is the
discounted value of the difference between the value of the swap based on variable interest rates (estimated
using the yield curve for anticipated interest rates) and the value of the swap based on the swap’s fixed interest
rate. The counterparty’s credit risk is also taken into consideration in determining fair value.
DOREL INDUSTRIES INC. – CONDENSED CONSOLIDATED INTERIM FINANCIAL STATEMENTS for the third quarter and nine months ended September 30, 2013 21
6. Fair value of financial instruments (continued)
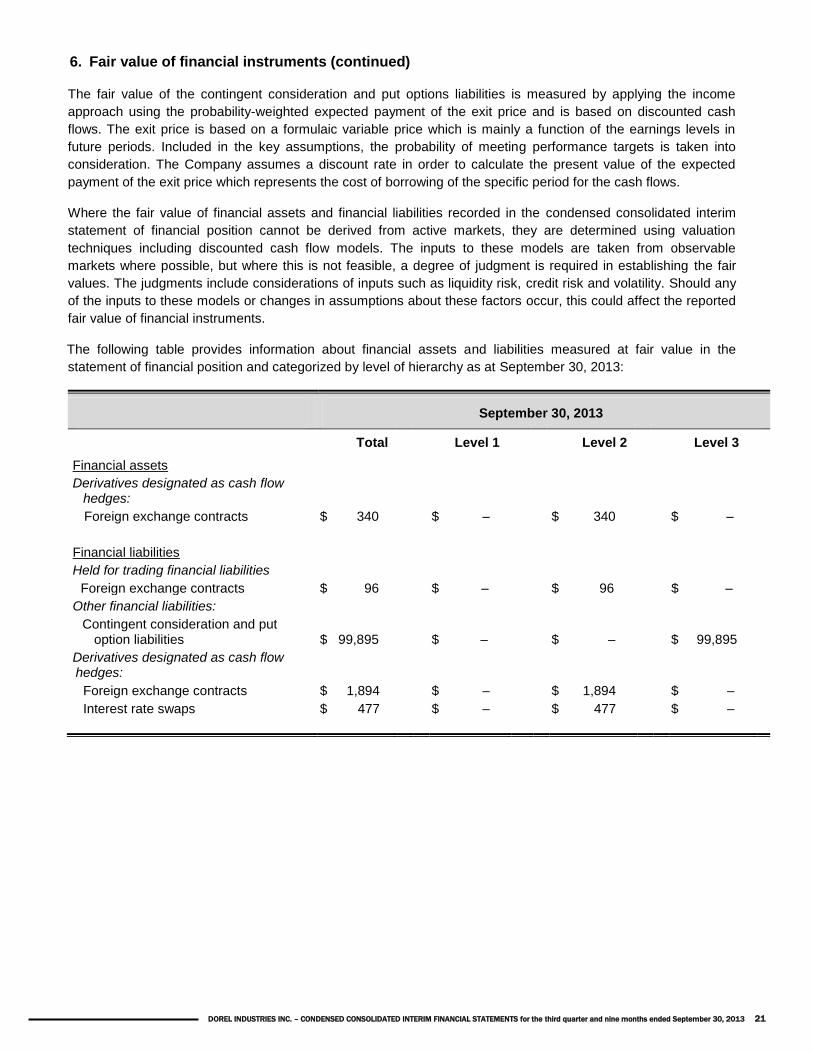
The fair value of the contingent consideration and put options liabilities is measured by applying the income
approach using the probability-weighted expected payment of the exit price and is based on discounted cash
flows. The exit price is based on a formulaic variable price which is mainly a function of the earnings levels in
future periods. Included in the key assumptions, the probability of meeting performance targets is taken into
consideration. The Company assumes a discount rate in order to calculate the present value of the expected
payment of the exit price which represents the cost of borrowing of the specific period for the cash flows.
Where the fair value of financial assets and financial liabilities recorded in the condensed consolidated interim
statement of financial position cannot be derived from active markets, they are determined using valuation
techniques including discounted cash flow models. The inputs to these models are taken from observable
markets where possible, but where this is not feasible, a degree of judgment is required in establishing the fair
values. The judgments include considerations of inputs such as liquidity risk, credit risk and volatility. Should any
of the inputs to these models or changes in assumptions about these factors occur, this could affect the reported
fair value of financial instruments.
The following table provides information about financial assets and liabilities measured at fair value in the
statement of financial position and categorized by level of hierarchy as at September 30, 2013:
September 30, 2013
Total Level 1 Level 2 Level 3
Financial assets
Derivatives designated as cash flow hedges:
Foreign exchange contracts $ 340 $ – $ 340 $ –
Financial liabilities
Held for trading financial liabilities
Foreign exchange contracts $ 96 $ – $ 96 $ –
Other financial liabilities:
Contingent consideration and put option liabilities $ 99,895 $ – $ – $ 99,895
Derivatives designated as cash flow hedges:
Foreign exchange contracts $ 1,894 $ – $ 1,894 $ –
Interest rate swaps $ 477 $ – $ 477 $ –
DOREL INDUSTRIES INC. – CONDENSED CONSOLIDATED INTERIM FINANCIAL STATEMENTS for the third quarter and nine months ended September 30, 2013 22
6. Fair value of financial instruments (continued)
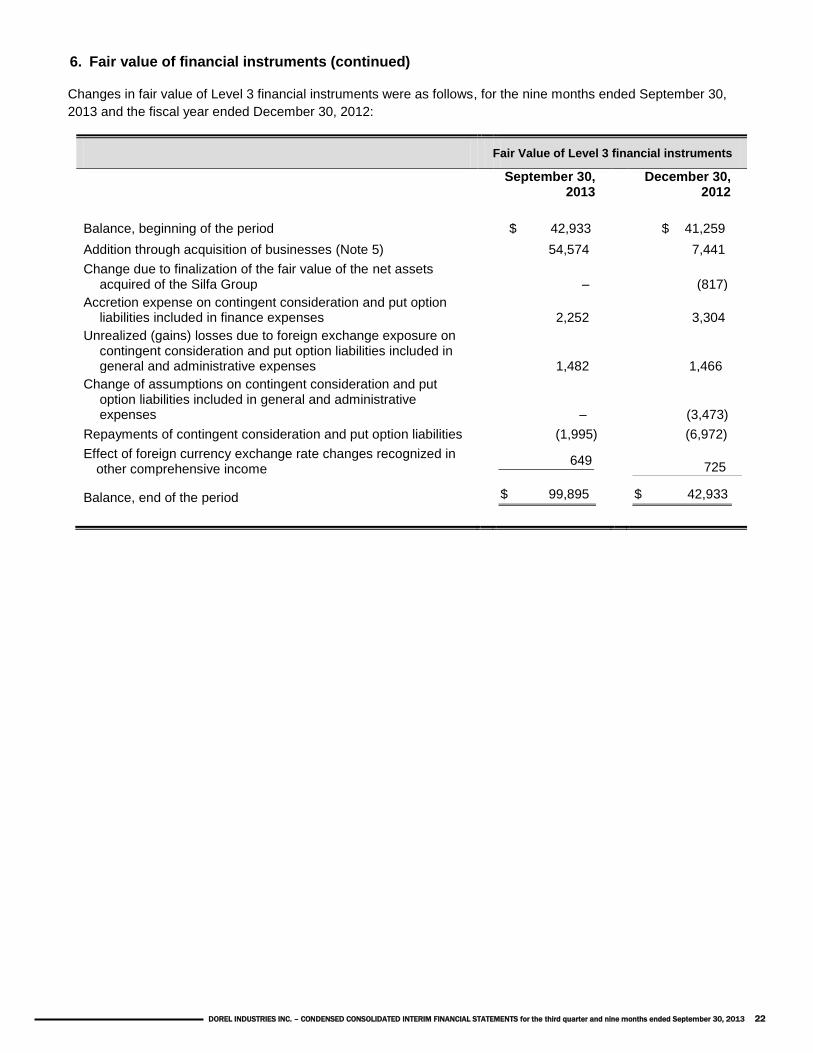
Changes in fair value of Level 3 financial instruments were as follows, for the nine months ended September 30,
2013 and the fiscal year ended December 30, 2012:
Fair Value of Level 3 financial instruments
September 30,
2013 December 30,
2012
Balance, beginning of the period $ 42,933 $ 41,259
Addition through acquisition of businesses (Note 5) 54,574 7,441
Change due to finalization of the fair value of the net assets acquired of the Silfa Group
–
(817)
Accretion expense on contingent consideration and put option liabilities included in finance expenses
2,252
3,304
Unrealized (gains) losses due to foreign exchange exposure on contingent consideration and put option liabilities included in general and administrative expenses
1,482
1,466
Change of assumptions on contingent consideration and put option liabilities included in general and administrative expenses
–
(3,473)
Repayments of contingent consideration and put option liabilities (1,995) (6,972)
Effect of foreign currency exchange rate changes recognized in other comprehensive income
649 725
Balance, end of the period $ 99,895 $ 42,933
DOREL INDUSTRIES INC. – CONDENSED CONSOLIDATED INTERIM FINANCIAL STATEMENTS for the third quarter and nine months ended September 30, 2013 23
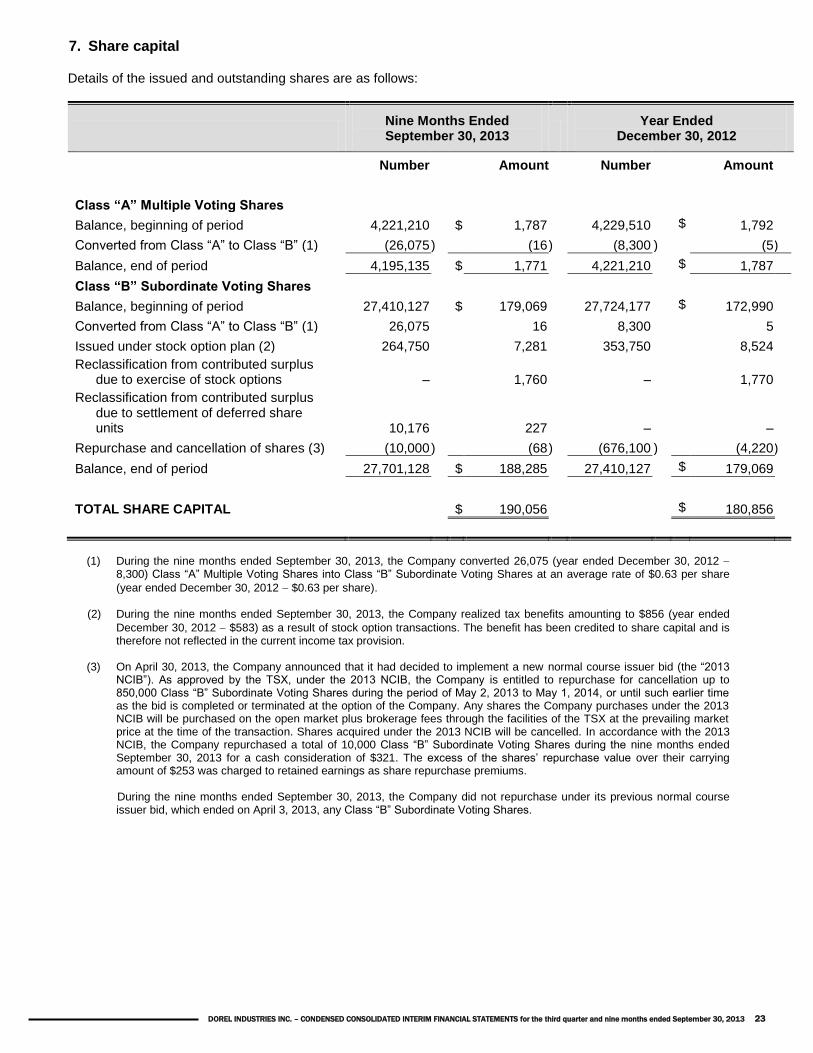
7. Share capital
Details of the issued and outstanding shares are as follows:
Nine Months Ended September 30, 2013
Year Ended December 30, 2012
Number Amount Number Amount
Class “A” Multiple Voting Shares
Balance, beginning of period 4,221,210 $ 1,787 4,229,510 $ 1,792
Converted from Class “A” to Class “B” (1) (26,075 ) (16 ) (8,300 ) (5 )
Balance, end of period 4,195,135 $ 1,771 4,221,210 $ 1,787
Class “B” Subordinate Voting Shares
Balance, beginning of period 27,410,127 $ 179,069 27,724,177 $ 172,990
Converted from Class “A” to Class “B” (1) 26,075 16 8,300 5
Issued under stock option plan (2) 264,750 7,281 353,750 8,524
Reclassification from contributed surplus due to exercise of stock options – 1,760 –
1,770
Reclassification from contributed surplus due to settlement of deferred share units 10,176 227 –
–
Repurchase and cancellation of shares (3) (10,000 ) (68 ) (676,100 ) (4,220 )
Balance, end of period 27,701,128 $ 188,285 27,410,127 $ 179,069
TOTAL SHARE CAPITAL $ 190,056 $ 180,856
(1) During the nine months ended September 30, 2013, the Company converted 26,075 (year ended December 30, 2012 8,300) Class “A” Multiple Voting Shares into Class “B” Subordinate Voting Shares at an average rate of $0.63 per share
(year ended December 30, 2012 $0.63 per share).
(2) During the nine months ended September 30, 2013, the Company realized tax benefits amounting to $856 (year ended
December 30, 2012 $583) as a result of stock option transactions. The benefit has been credited to share capital and is therefore not reflected in the current income tax provision.
(3) On April 30, 2013, the Company announced that it had decided to implement a new normal course issuer bid (the “2013 NCIB”). As approved by the TSX, under the 2013 NCIB, the Company is entitled to repurchase for cancellation up to 850,000 Class “B” Subordinate Voting Shares during the period of May 2, 2013 to May 1, 2014, or until such earlier time as the bid is completed or terminated at the option of the Company. Any shares the Company purchases under the 2013 NCIB will be purchased on the open market plus brokerage fees through the facilities of the TSX at the prevailing market price at the time of the transaction. Shares acquired under the 2013 NCIB will be cancelled. In accordance with the 2013 NCIB, the Company repurchased a total of 10,000 Class “B” Subordinate Voting Shares during the nine months ended September 30, 2013 for a cash consideration of $321. The excess of the shares’ repurchase value over their carrying amount of $253 was charged to retained earnings as share repurchase premiums. During the nine months ended September 30, 2013, the Company did not repurchase under its previous normal course issuer bid, which ended on April 3, 2013, any Class “B” Subordinate Voting Shares.
DOREL INDUSTRIES INC. – CONDENSED CONSOLIDATED INTERIM FINANCIAL STATEMENTS for the third quarter and nine months ended September 30, 2013 24
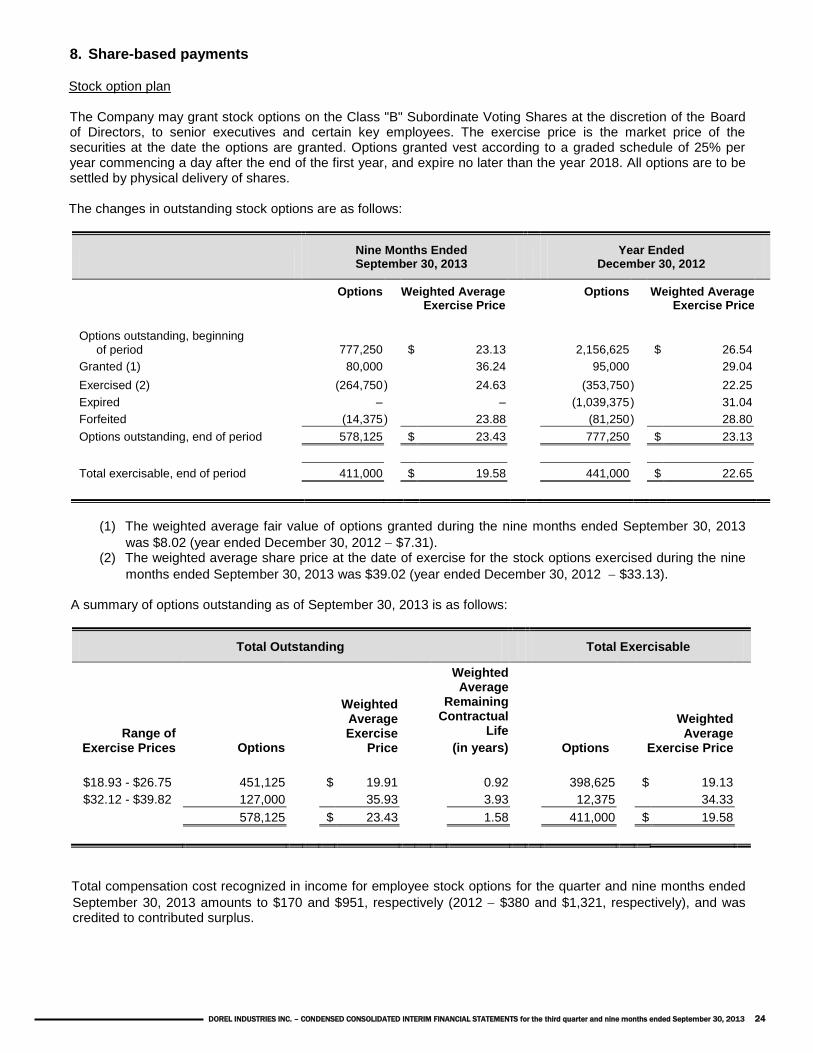
8. Share-based payments
Stock option plan
The Company may grant stock options on the Class "B" Subordinate Voting Shares at the discretion of the Board of Directors, to senior executives and certain key employees. The exercise price is the market price of the securities at the date the options are granted. Options granted vest according to a graded schedule of 25% per year commencing a day after the end of the first year, and expire no later than the year 2018. All options are to be settled by physical delivery of shares. The changes in outstanding stock options are as follows:
Nine Months Ended September 30, 2013
Year Ended December 30, 2012
Options Weighted Average Exercise Price
Options Weighted Average Exercise Price
Options outstanding, beginning of period 777,250 $ 23.13 2,156,625 $ 26.54
Granted (1) 80,000 36.24 95,000 29.04
Exercised (2) (264,750 ) 24.63 (353,750 ) 22.25
Expired – – (1,039,375 ) 31.04
Forfeited (14,375 ) 23.88 (81,250 ) 28.80
Options outstanding, end of period 578,125 $ 23.43 777,250 $ 23.13
Total exercisable, end of period 411,000 $ 19.58 441,000 $ 22.65
(1) The weighted average fair value of options granted during the nine months ended September 30, 2013
was $8.02 (year ended December 30, 2012 $7.31). (2) The weighted average share price at the date of exercise for the stock options exercised during the nine
months ended September 30, 2013 was $39.02 (year ended December 30, 2012 $33.13).
A summary of options outstanding as of September 30, 2013 is as follows:
Total Outstanding Total Exercisable
Range of Exercise Prices Options
Weighted Average Exercise
Price
Weighted Average
Remaining Contractual
Life
(in years) Options
Weighted Average
Exercise Price
$18.93 - $26.75 451,125 $ 19.91 0.92 398,625 $ 19.13
$32.12 - $39.82 127,000 35.93 3.93 12,375 34.33
578,125 $ 23.43 1.58 411,000 $ 19.58
Total compensation cost recognized in income for employee stock options for the quarter and nine months ended
September 30, 2013 amounts to $170 and $951, respectively (2012 $380 and $1,321, respectively), and was credited to contributed surplus.
DOREL INDUSTRIES INC. – CONDENSED CONSOLIDATED INTERIM FINANCIAL STATEMENTS for the third quarter and nine months ended September 30, 2013 25
8. Share-based payments (continued)
Directors’ Deferred Share Unit Plan
The Company has a Deferred Share Unit plan under which external directors of the Company may elect annually to have their director’s fees and fees for attending meetings of the Board of Directors or committees thereof paid in the form of deferred share units (“DSU’s”). A plan participant may also receive dividend equivalents paid in the form of DSU’s. During the third quarters ended September 30, 2013 and 2012, 3,649 and 2,948 DSU’s were
issued respectively for fees forfeited and $135 (2012 $100) was expensed and credited to contributed surplus. During the third quarters ended September 30, 2013 and 2012, 978 and 921 DSU’s were issued respectively for dividend equivalents and $33 (2012 – $29) was charged to retained earnings and credited to contributed surplus. During the nine months ended September 30, 2013 and 2012, 11,559 and 12,489 DSU’s were issued respectively
for fees forfeited and $430 (2012 $360) was expensed and credited to contributed surplus. During the nine months ended September 30, 2013 and 2012, 2,565 and 1,935 DSU’s were issued respectively for dividend equivalents and $94 (2012 – $56) was charged to retained earnings and credited to contributed surplus. In addition, during the nine months ended September 30, 2013, 7,994 DSU’s were settled for which $215 was debited to contributed surplus and $194 credited to share capital; the difference representing the withholding taxes the Company was required by law to withhold upon settlement. As at September 30, 2013, there were 111,557 DSU’s outstanding with related contributed surplus amounting to $3,262.
Executive Deferred Share Unit Plan
The Company has an Executive Deferred Share Unit plan under which executive officers of the Company may elect annually to have a portion of their annual salary and bonus paid in the form of deferred share units (“DSU’s”). A plan participant may also receive dividend equivalents paid in the form of DSU’s. During the third quarters ended September 30, 2013 and 2012, no DSU’s were issued respectively for bonus and salary paid and no amounts were credited to contributed surplus. During the third quarters ended September 30, 2013 and 2012, 524 and 511 DSU’s were issued respectively for dividend equivalents and $17 (2012 – $16) was charged to retained earnings and credited to contributed surplus. During the nine months ended September 30, 2013 and 2012, 7,370 and 5,044 DSU’s were issued respectively for bonus and salary paid and $305 (2012 – $141) was credited to contributed surplus. During the nine months ended September 30, 2013 and 2012, 1,363 and 1,093
DSU’s were issued respectively for dividend equivalents and $49 (2012 $31) was charged to retained earnings and credited to contributed surplus. In addition, during the nine months ended September 30, 2013, 6,262 DSU’s were settled for which $132 was debited to contributed surplus and $33 credited to share capital; the difference representing the withholding taxes the Company was required by law to withhold upon settlement. As at September 30, 2013, there were 57,791 DSU’s outstanding with related contributed surplus amounting to $1,536.
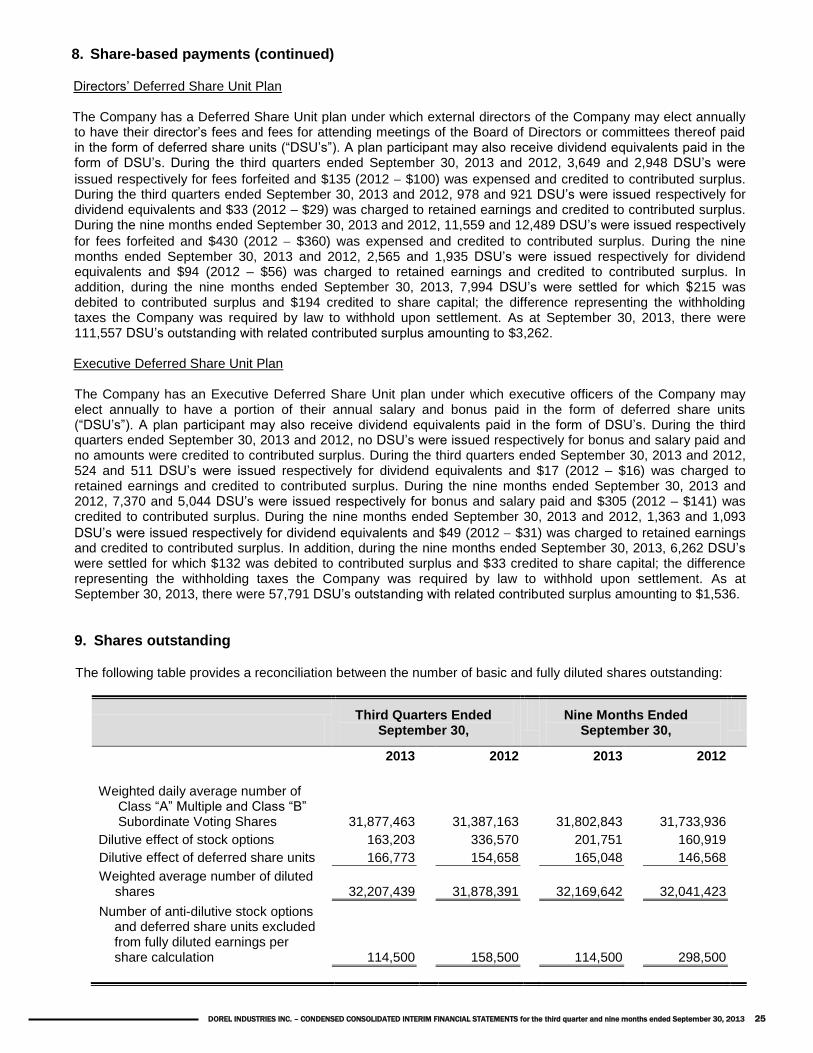
9. Shares outstanding
The following table provides a reconciliation between the number of basic and fully diluted shares outstanding:
Third Quarters Ended
September 30, Nine Months Ended
September 30,
2013 2012 2013 2012
Weighted daily average number of Class “A” Multiple and Class “B” Subordinate Voting Shares 31,877,463 31,387,163 31,802,843 31,733,936
Dilutive effect of stock options 163,203 336,570 201,751 160,919
Dilutive effect of deferred share units 166,773 154,658 165,048 146,568
Weighted average number of diluted shares 32,207,439 31,878,391 32,169,642 32,041,423
Number of anti-dilutive stock options and deferred share units excluded from fully diluted earnings per share calculation 114,500 158,500 114,500 298,500
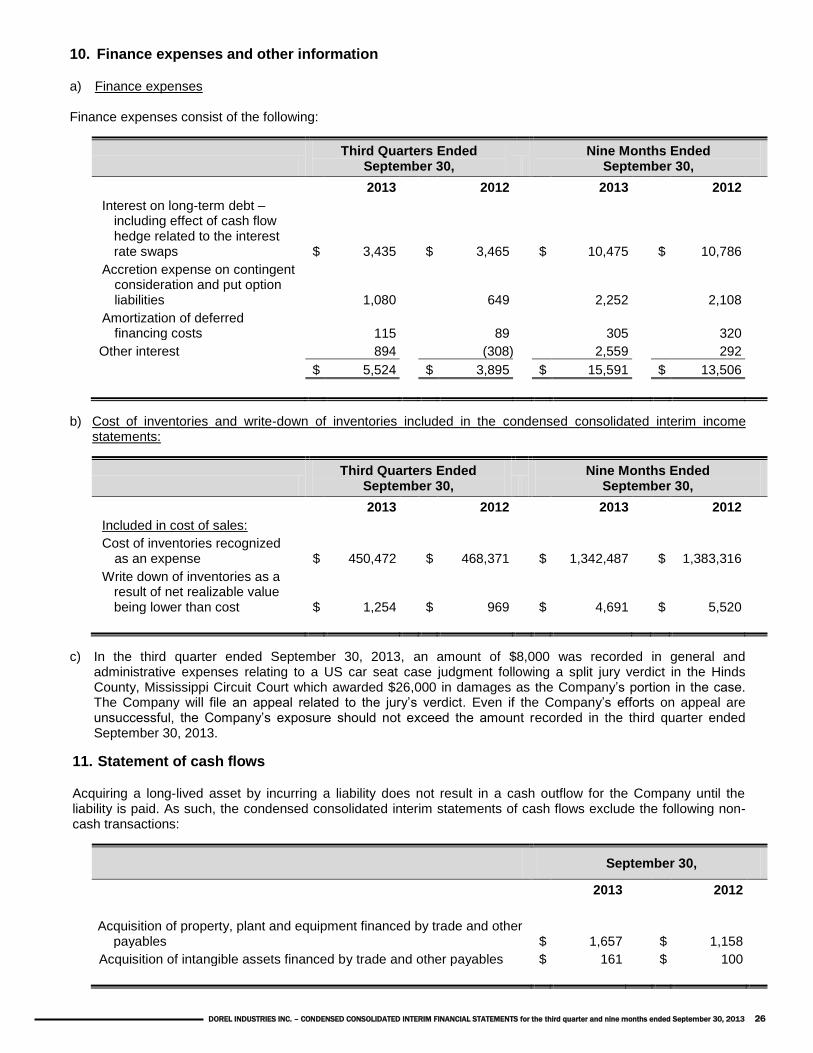
DOREL INDUSTRIES INC. – CONDENSED CONSOLIDATED INTERIM FINANCIAL STATEMENTS for the third quarter and nine months ended September 30, 2013 26
10. Finance expenses and other information
a) Finance expenses
Finance expenses consist of the following:
Third Quarters Ended
September 30, Nine Months Ended
September 30,
2013 2012 2013 2012
Interest on long-term debt – including effect of cash flow hedge related to the interest rate swaps $ 3,435 $ 3,465 $ 10,475 $ 10,786
Accretion expense on contingent consideration and put option liabilities 1,080 649 2,252 2,108
Amortization of deferred financing costs 115 89 305 320
Other interest 894 (308) 2,559 292
$ 5,524 $ 3,895 $ 15,591 $ 13,506
b) Cost of inventories and write-down of inventories included in the condensed consolidated interim income statements:
Third Quarters Ended
September 30, Nine Months Ended
September 30,
2013 2012 2013 2012
Included in cost of sales:
Cost of inventories recognized as an expense $ 450,472 $ 468,371 $ 1,342,487 $ 1,383,316
Write down of inventories as a result of net realizable value being lower than cost $ 1,254 $ 969 $ 4,691 $ 5,520
c) In the third quarter ended September 30, 2013, an amount of $8,000 was recorded in general and administrative expenses relating to a US car seat case judgment following a split jury verdict in the Hinds County, Mississippi Circuit Court which awarded $26,000 in damages as the Company’s portion in the case. The Company will file an appeal related to the jury’s verdict. Even if the Company’s efforts on appeal are unsuccessful, the Company’s exposure should not exceed the amount recorded in the third quarter ended September 30, 2013.
11. Statement of cash flows
Acquiring a long-lived asset by incurring a liability does not result in a cash outflow for the Company until the liability is paid. As such, the condensed consolidated interim statements of cash flows exclude the following non-cash transactions:
September 30,
2013 2012
Acquisition of property, plant and equipment financed by trade and other payables $ 1,657 $ 1,158
Acquisition of intangible assets financed by trade and other payables $ 161 $ 100
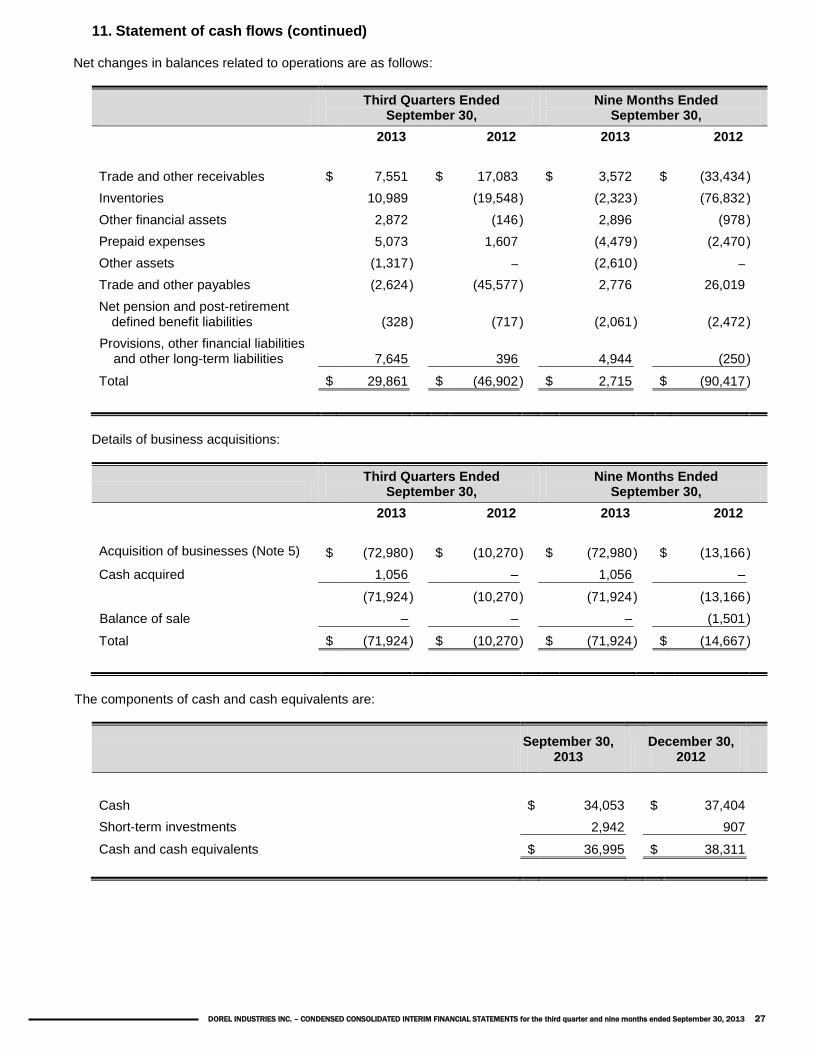
DOREL INDUSTRIES INC. – CONDENSED CONSOLIDATED INTERIM FINANCIAL STATEMENTS for the third quarter and nine months ended September 30, 2013 27
11. Statement of cash flows (continued)
Net changes in balances related to operations are as follows:
Third Quarters Ended
September 30, Nine Months Ended
September 30,
2013 2012 2013 2012
Trade and other receivables $ 7,551 $ 17,083 $ 3,572 $ (33,434 )
Inventories 10,989 (19,548 ) (2,323 ) (76,832 )
Other financial assets 2,872 (146 ) 2,896 (978 )
Prepaid expenses 5,073 1,607 (4,479 ) (2,470 )
Other assets (1,317 ) – (2,610 ) –
Trade and other payables (2,624 ) (45,577 ) 2,776 26,019
Net pension and post-retirement defined benefit liabilities (328 ) (717 ) (2,061 ) (2,472 )
Provisions, other financial liabilities and other long-term liabilities 7,645 396 4,944 (250 )
Total $ 29,861 $ (46,902 ) $ 2,715 $ (90,417 )
Details of business acquisitions:
Third Quarters Ended
September 30, Nine Months Ended
September 30,
2013 2012 2013 2012
Acquisition of businesses (Note 5) $ (72,980 ) $ (10,270 ) $ (72,980 ) $ (13,166 )
Cash acquired 1,056 – 1,056 –
(71,924 ) (10,270 ) (71,924 ) (13,166 )
Balance of sale – – – (1,501 )
Total $ (71,924 ) $ (10,270 ) $ (71,924 ) $ (14,667 )
The components of cash and cash equivalents are:
September 30,
2013 December 30,
2012
Cash $ 34,053 $ 37,404
Short-term investments 2,942 907
Cash and cash equivalents $ 36,995 $ 38,311
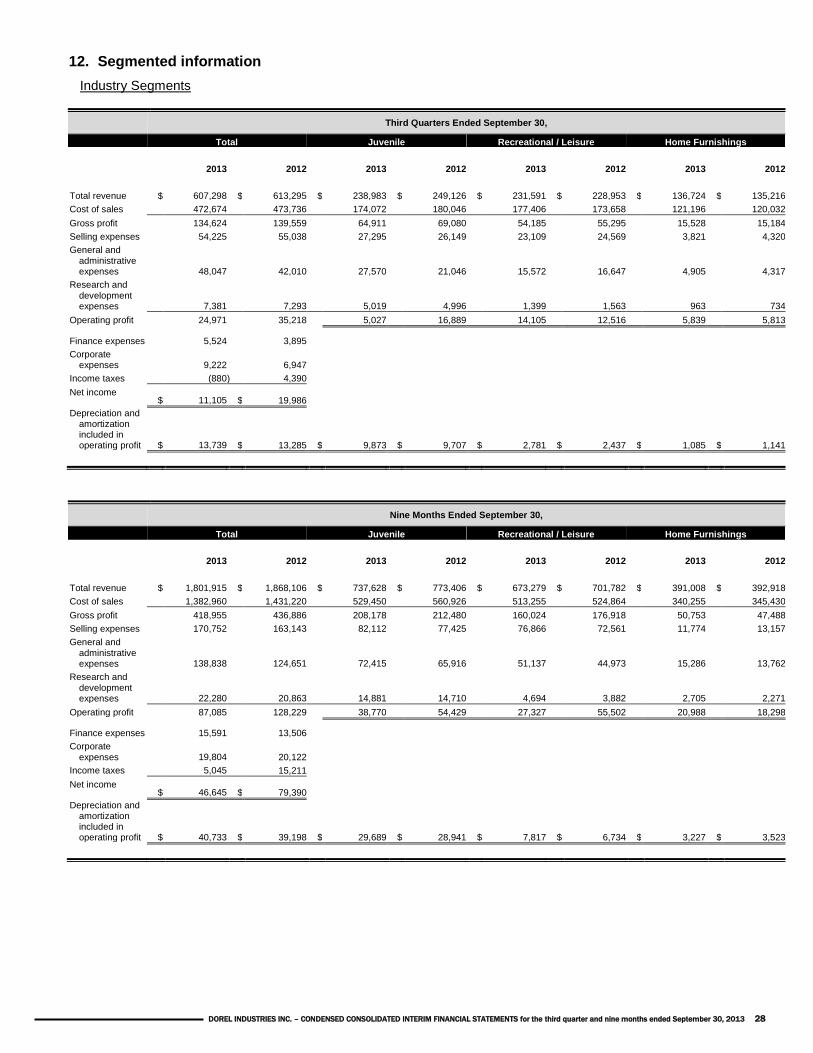
DOREL INDUSTRIES INC. – CONDENSED CONSOLIDATED INTERIM FINANCIAL STATEMENTS for the third quarter and nine months ended September 30, 2013 28
12. Segmented information
Industry Segments
Third Quarters Ended September 30,
Total Juvenile Recreational / Leisure Home Furnishings
2013 2012 2013 2012 2013 2012 2013 2012
Total revenue $ 607,298 $ 613,295 $ 238,983 $ 249,126 $ 231,591 $ 228,953 $ 136,724 $ 135,216
Cost of sales 472,674 473,736 174,072 180,046 177,406 173,658 121,196 120,032
Gross profit 134,624 139,559 64,911 69,080 54,185 55,295 15,528 15,184
Selling expenses 54,225 55,038 27,295 26,149 23,109 24,569 3,821 4,320
General and administrative expenses 48,047 42,010 27,570 21,046 15,572 16,647 4,905 4,317
Research and development expenses 7,381 7,293 5,019 4,996 1,399 1,563 963 734
Operating profit 24,971 35,218 5,027 16,889 14,105 12,516 5,839 5,813
Finance expenses 5,524 3,895
Corporate expenses 9,222 6,947
Income taxes (880 ) 4,390
Net income $ 11,105 $ 19,986
Depreciation and amortization included in operating profit $ 13,739 $ 13,285 $ 9,873 $ 9,707 $ 2,781 $ 2,437 $ 1,085 $ 1,141
Nine Months Ended September 30,
Total Juvenile Recreational / Leisure Home Furnishings
2013 2012 2013 2012 2013 2012 2013 2012
Total revenue $ 1,801,915 $ 1,868,106 $ 737,628 $ 773,406 $ 673,279 $ 701,782 $ 391,008 $ 392,918
Cost of sales 1,382,960 1,431,220 529,450 560,926 513,255 524,864 340,255 345,430
Gross profit 418,955 436,886 208,178 212,480 160,024 176,918 50,753 47,488
Selling expenses 170,752 163,143 82,112 77,425 76,866 72,561 11,774 13,157
General and administrative expenses 138,838 124,651 72,415 65,916 51,137 44,973 15,286 13,762
Research and development expenses 22,280 20,863 14,881 14,710 4,694 3,882 2,705 2,271
Operating profit 87,085 128,229 38,770 54,429 27,327 55,502 20,988 18,298
Finance expenses 15,591 13,506
Corporate expenses 19,804 20,122
Income taxes 5,045 15,211
Net income $ 46,645 $ 79,390
Depreciation and amortization included in operating profit $ 40,733 $ 39,198 $ 29,689 $ 28,941 $ 7,817 $ 6,734 $ 3,227 $ 3,523
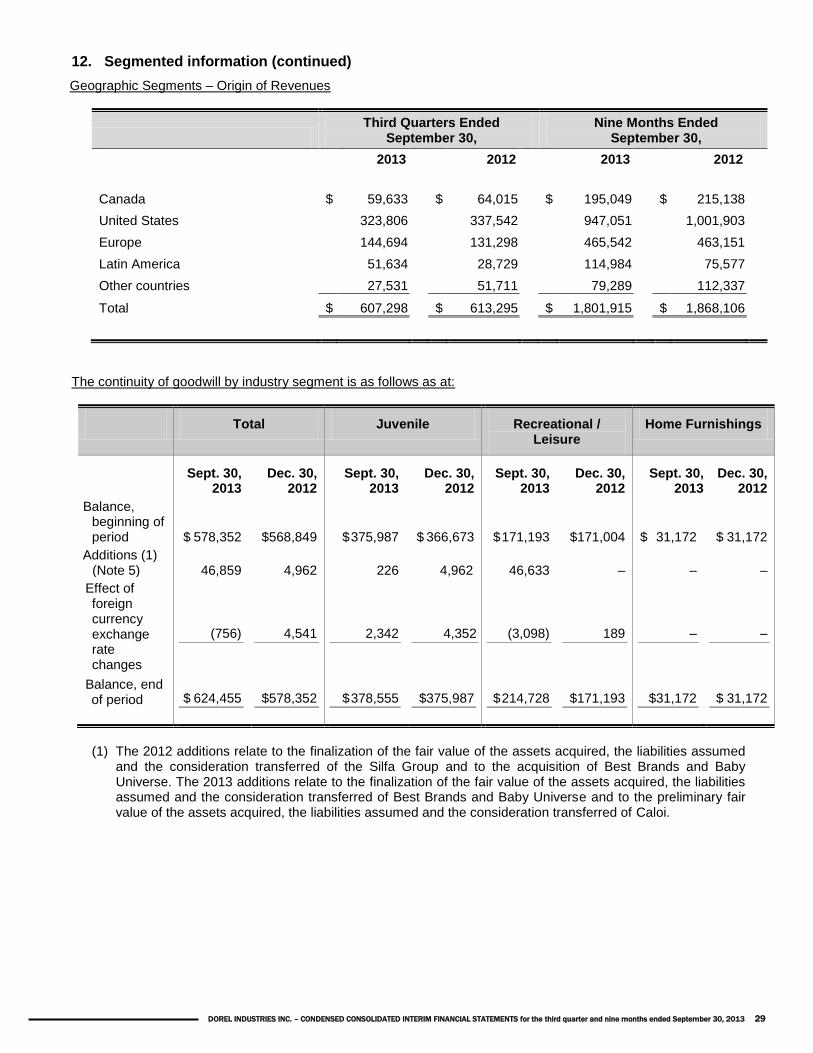
DOREL INDUSTRIES INC. – CONDENSED CONSOLIDATED INTERIM FINANCIAL STATEMENTS for the third quarter and nine months ended September 30, 2013 29
12. Segmented information (continued)
Geographic Segments – Origin of Revenues
Third Quarters Ended
September 30, Nine Months Ended
September 30,
2013 2012 2013 2012
Canada $ 59,633 $ 64,015 $ 195,049 $ 215,138
United States 323,806 337,542 947,051 1,001,903
Europe 144,694 131,298 465,542 463,151
Latin America 51,634 28,729 114,984 75,577
Other countries 27,531 51,711 79,289 112,337
Total $ 607,298 $ 613,295 $ 1,801,915 $ 1,868,106
The continuity of goodwill by industry segment is as follows as at:
Total Juvenile Recreational / Leisure
Home Furnishings
Sept. 30,
2013 Dec. 30,
2012 Sept. 30,
2013 Dec. 30,
2012 Sept. 30,
2013 Dec. 30,
2012 Sept. 30,
2013 Dec. 30,
2012
Balance, beginning of period
$ 578,352
$568,849
$ 375,987
$ 366,673
$ 171,193
$171,004
$ 31,172
$ 31,172
Additions (1) (Note 5) 46,859 4,962 226 4,962 46,633 – – –
Effect of foreign currency exchange rate changes
(756)
4,541
2,342
4,352
(3,098)
189
–
–
Balance, end of period
$ 624,455
$578,352
$ 378,555
$375,987
$ 214,728
$171,193
$31,172
$ 31,172
(1) The 2012 additions relate to the finalization of the fair value of the assets acquired, the liabilities assumed
and the consideration transferred of the Silfa Group and to the acquisition of Best Brands and Baby Universe. The 2013 additions relate to the finalization of the fair value of the assets acquired, the liabilities assumed and the consideration transferred of Best Brands and Baby Universe and to the preliminary fair value of the assets acquired, the liabilities assumed and the consideration transferred of Caloi.