Embed Size (px)
Citation preview
wwwtheicctorg
OCTOBER 2015whiTE papER
communicationstheicctorg
Beijing | Berlin | Brussels | san Francisco | Washington
Brazil Passenger Vehicle Market statistics international coMParatiVe assessMent of
technology adoPtion and energy consuMPtion
Francisco Posada cristiano Faccedilanha
ACKNOWLEDGEMENTS
Funding for this work was generously provided by the William and Flora hewlett Foundation and the climateWorks Foundation the authors would like to thank the icct staff who contributed to the accuracy of this report through careful review including anup Bandivadekar Fanta Kamakateacute john german and Peter Mock additionally the authors thank josh Miller for assistance with the database and data visualization and Bruna januaacuterio Zeisloft with data collection and database development
copy 2015 international council on clean transportation
international council on clean transportation
1225 i street nW suite 900 Washington Dc 20005
communicationstheicctorg | wwwtheicctorg
i
TAbLE Of CONTENTS
Executive Summary v
1 Market Overview1
2 Vehicle Fleet Characteristics 6
3 Vehicle Technology adoption 12
Fuel type 13
number of cylinders 15
transmission 17
number of gear ratios 19
Drivetrain 21
Valve camshaft configuration (Dohc vs sohc)23
Valve actuation 25
Fuel systems for gasoline Vehicles 27
turbocharging 29
4 Vehicle Energy Consumption 31
References 40
List of acronyms 42
appendix a Segment Definitions 44
appendix B international Market Data 45
appendix C New Vehicle Characteristics and Technology adoption Data in Brazil 47
appendix D Data Sources and Completeness 51
ii
ICCT white paper
LiST Of TAbLES
Table 1‑1 ndash Market characteristics of new Brazilian passenger vehicles5
Table 2‑1 ndash Fleet characteristics of new Brazilian passenger vehicles 7
Table 3‑1 ndash technology adoption in new Brazilian passenger vehicles 12
Table a‑1 ndash segment definitions 44
Table B‑1 ndash international market comparison of new fleet characteristics 45
Table B‑2 ndash international market comparison of technology adoption in new vehicles 46
Table C‑1 ndash Fleet characteristics of new Brazilian passenger vehicles by segment (2013) 47
Table C‑2 ndash Fleet characteristics of new Brazilian passenger vehicles by manufacturer (2013) 48
Table C‑3 ndash Fleet characteristics of new Brazilian passenger vehicles by origin (2013) 49
Table C‑4 ndash technology adoption in new Brazilian passenger vehicles by segment (2013) 50
Table C‑5 ndash technology adoption in new Brazilian passenger vehicles by manufacturer (2013) 51
Table D‑1 ndash Brazilian data sources 52
Table D‑2 ndash energy consumption data sources 52
iii
Brazil Passenger Vehicle Market statistics
LiST Of fiGurES
Figure ES‑1 ndash international comparison of technology penetration in passenger vehicles vi
Figure ES‑2 ndash international comparison of passenger fleet-average energy consumption vii
Figure 1‑1 ndash top 15 passenger vehicle markets worldwide 1
Figure 1‑2 ndash comparison of passenger vehicle sales and economic growth in Brazil 2
Figure 1‑3 ndash new registrations of one-liter engine vehicles 3
Figure 1‑4 ndash registrations of new passenger vehicles by fuel type 4
Figure 1‑5 ndash Market share of new passenger vehicles by manufacturer and segment (2013) 4
Figure 2‑1 ndash Fleet characteristics of new Brazilian passenger vehicles by segment (2013) 8
Figure 2‑2 ndash Fleet characteristics of new Brazilian passenger vehicles by manufacturer (2013) 9
Figure 2‑3 ndash Fleet characteristics of new Brazilian passenger vehicles by origin (2013) 10
Figure 2‑4 ndash international comparison of key new passenger vehicle characteristics 11
Figure 3‑1 ndash Fuel type by segment 14
Figure 3‑2 ndash Fuel type by manufacturer 14
Figure 3‑3 ndash Fuel type international comparison 14
Figure 3‑4 ndash number of cylinders by segment 16
Figure 3‑5 ndash number of cylinders by manufacturer 16
Figure 3‑6 ndash number of cylinders international comparison 16
Figure 3‑7 ndash transmission by segment 18
Figure 3‑8 ndash transmission by manufacturer 18
Figure 3‑9 ndash transmission international comparison 18
Figure 3‑10 ndash number of gear ratios by segment 20
Figure 3‑11 ndash number of gear ratios by manufacturer 20
Figure 3‑12 ndash number of gear ratios international comparison 20
Figure 3‑13 ndash Drivetrain by segment 22
Figure 3‑14 ndash Drivetrain by manufacturer 22
Figure 3‑15 ndash Drivetrain international comparison 22
Figure 3‑16 ndash Valve camshaft configuration by segment 24
Figure 3‑17 ndash Valve camshaft configuration by manufacturer 24
iv
ICCT white paper
Figure 3‑18 ndash Valve camshaft configuration international comparison 24
Figure 3‑19 ndash Valve actuation by segment 26
Figure 3‑20 ndash Valve actuation by manufacturer 26
Figure 3‑21 ndash Valve actuation international comparison 26
Figure 3‑22 ndash gasolineflex fuel system by segment 28
Figure 3‑23 ndash gasolineflex fuel system by manufacturer 28
Figure 3‑24 ndash gasolineflex fuel system international comparison28
Figure 3‑25 ndash turbocharging for gasolineflex fuel vehicles by segment 30
Figure 3‑26 ndash turbocharging for gasolineflex fuel vehicles by manufacturer 30
Figure 3‑27 ndash turbocharging for gasolineflex fuel vehicles international comparison 30
Figure 4‑1 ndash new vehicle sales-weighted average energy consumption by segment (2013) 32
Figure 4‑2 ndash new vehicle energy consumption by vehicle weight (2013) 33
Figure 4‑3 ndash new vehicle energy consumption by vehicle footprint (2013) 34
Figure 4‑4 ndashaverage new vehicle sales-weighted energy consumption by manufacturer (2013) 35
Figure 4‑5 ndash international comparison of passenger car energy consumption 36
Figure 4‑6 ndash international comparison of average vehicle energy consumption by vehicle weight 37
Figure 4‑7 ndash Distribution of new Brazilian passenger vehicle energy consumption data by vehicle weight and segment (2013)38
Figure D‑1 ndash conversion of emission to energy consumption data 53
Figure D‑2 ndash comparison between energy consumption data from inMetro and iBaMa 54
v
Brazil Passenger Vehicle Market statistics
ExECuTivE SuMMAry
Brazil has been one of the worldrsquos top five vehicle markets for six consecutive years and accounts for over half of all vehicles sold in latin america the Brazil Passenger Vehicle Market statistics report provides detailed information about vehicle characteristics technology adoption and energy consumption for passenger vehicles ndash automobiles sport utility vehicles (suVs) pick-up trucks and minivans ndash sold in Brazil in 2013 this study examines the adoption of vehicle efficiency technologies and their aggregate impact on vehicle energy consumption
Many countries have been investing heavily in vehicle technology development some of which have a direct impact on improvements in energy consumption this study provides a better understanding of how the Brazilian fleet compares to international fleets in the worldrsquos major vehicle markets ndash the european union (eu) china india japan south Korea and the united states (us) ndash in terms of technology adoption and energy consumption
there is currently a lack of vehicle data and analyses to support the adequate evaluation of public policies to encourage investments in vehicle technology and reductions in energy consumption in Brazil the inovar-auto policy adopted in 2012 aims at fostering industrial competitiveness through technology development and improvements in vehicle efficiency this study not only supports the strengthening of vehicle energy consumption targets set by inovar-auto but it also recommends further investments in technology deployment and energy consumption improvements and highlights the need for better data quality and availability
chapter 1 provides an overview of the Brazilian passenger vehicle market Brazil was the worldrsquos fifth largest market of passenger car sales in 2013 after china eu us and japan and ahead of india and south Korea similarly to many developing countries vehicle sales in Brazil decreased in 2014 (by 7) due to the economic downturn but Brazil continues to be amongst the top five passenger vehicle markets worldwide
Brazilrsquos passenger fleet is unique in many aspects through a combination of national investment and fiscal incentives Brazilrsquos new fleet consists primarily of flex-fuel cars that can be powered by either ethanol or gasoline in addition Brazil has long incentivized sales of one-liter engine cars which became the symbol of the Brazilian automotive industry in the 1990s reaching over 70 of sales in 2001 since then the share of one-liter engine cars has been dropping consistently (ie 36 in 2013) in favor of medium-sized vehicles with larger engines
chapter 2 includes key characteristics of the Brazilian passenger vehicle fleet including a comparison with other countries and regions including the eu china india japan south Korea and the us the report provides vehicle characteristics by segment and by the 20 largest manufacturers in Brazil on average the Brazilian fleet is smaller in size lighter and less powerful than all countries evaluated with the exception of india
chapter 3 examines the adoption of energy-saving technologies by segment and manufacturer comparing it to other countries this analysis concludes that Brazil lags behind most other vehicle markets in the adoption of such technologies (Figure ES‑1) although its penetration appears to be increasing over time these technologies which have a large potential to reduce vehicle energy consumption include hybrid
vi
ICCT white paper
engines downsized engines (eg three cylinders) continuously variable transmissions (cVt) dual-clutch transmissions (Dct) higher gear ratio transmissions (eg six and above) dual overhead camshafts (Dohc) variable valve actuation (VVa) technologies turbocharging and gasoline direction injection (gDi) the combination of gDi technology turbocharging and downsizing can result in up to 15 savings in energy consumption over the more predominant technologies commercialized in Brazil today hybrid systems can achieve substantially larger savings in energy consumption between 20 and 50 with respect to similar-sized vehicles
0 10 20 30 40 50 60 70 80 90 100
Technology Penetration ()
Europe 2013 Japan 2011 US 2013 S Korea 2011 China 2012 India 2012 Brazil 2013
3-Cylinder Eng
Transmission (DCT CVT)
Hybrids
+6 gears
DOHC
Turbocharging
GDI
VVA
Figure ES‑1 ndash international comparison of technology penetration in passenger vehicles
Country labels indicate the dataset year
chapter 4 examines vehicle energy consumption in new passenger cars Brazilrsquos fleet is on average more efficient than fleets in the us china and south Korea When compared to countries with vehicles of similar and even higher average weight Brazil has relatively inefficient vehicles (Figure ES‑2) Because of lower adoption rates of energyfuel efficiency technologies the average Brazilian vehicle consumes about 18 more energy than the average vehicle in japan even though Brazilian vehicles are on average 8 lighter than the average japanese car the japanese fleet has a large penetration of fuel-efficiency technologies such as three-cylinder engines variable valve actuation dual overhead camshafts and advanced transmissions as well as a large market of gasoline hybrids european vehicles also perform better despite weighing more than vehicles in the majority of other countries with the exception of the us and south Korea the adoption of fuel-efficiency technologies (eg Dct 6-speed transmissions gDi turbocharging) contributes to europersquos above average performance
vii
Brazil Passenger Vehicle Market statistics
it is also important to note that this comparison is limited to type-approval and certification data and does not include off-cycle or real-world adjustments
China2012
SKorea2011
Europe2013
US2013
Japan2011
India2012
Brazil2013
Sales5 MM10 MM
14
16
18
20
22
24
26
28
1000 1100 1200 1300 1400 1500 1600 1700
Ene
rgy
cons
ump
tio
n ndash
CA
FE
(M
Jkm
)
Curb weight (kg)
Type-approval and certification energy consumption data only (does not include o-cycle or real-world driving data)
Figure ES‑2 ndash international comparison of passenger fleet-average energy consumption
Country labels indicate the dataset year
this analysis suggests that there are potential reductions in vehicle energy consumption for the Brazilian fleet For similar vehicles in terms of weight class footprint or engine rating there is a significant range in energy consumption indicating that there are vehicles performing much worse than the average there is also a clear trend of some manufacturers performing much better than the average while others have a lot more room for improvement the international comparison clearly shows that Brazilian vehicles perform much worse in terms of energy consumption than vehicles of similar weight elsewhere indicating a delay in the adoption of energy-efficient technologies among Brazilian vehicle manufacturers Finally a more detailed analysis of vehicle versions clearly illustrates a considerable number above the average energy consumption this indicates potential improvements that would place those versions on par with the best performing vehicles with similar characteristics in Brazil
Because of the wide gap between Brazil and other major vehicle markets there is much potential for the introduction of energy-saving technologies Future analyses will need to evaluate the potential of these energy-saving technologies to reduce fuel consumption and emissions in Brazil together with a cost-benefit (payback) analysis of such technologies and a better understanding of barriers to technology penetration in addition improvements in data quality and completeness will be essential to improve the accuracy of these analyses
1
ICCT white paper
1 MArKET OvErviEW
Brazil was the fifth largest market worldwide for sales of new passenger vehicles in 2013 after china us eu and japan (Figure 1‑1) although the Brazilian passenger vehicle market contracted by 8 in 2014 (with sales of 28 million new passenger vehicles) its relative ranking remained unaltered since other developing countries also experienced a decrease in sales annual average market growth rates during the last nine years for the group of Bric countries remained strong led by china (21) and followed by india (15) Brazil (10) and russia (10) although vehicle sales in developed markets ie eu us and japan increased from 2013 to 2014 these three markets have also experienced an overall contraction of around 2 between 2005 and 2013
40
170
153
50
14 1309
1609 05
11 0802 0 0
179
156
118
48
30 28 2617
13 12 11 09 07 07 07
0
20
40
60
80
100
120
140
160
180
200
China
US
EU
Japan
Brazil
Russia
India
Canad
a
S Kore
a
Indone
sia
Mexico
Austra
lia
Thaila
nd
Argen
tina
Turk
ey
Veh
icle
sal
es (
mill
ion)
2005 2013
Figure 1‑1 ndash top 15 passenger vehicle markets worldwide
US Canada and Mexico data include cars and light-duty trucks Source MarkLines vehicle databases
the growth in passenger vehicle sales in Brazil over the past decade was driven by a combination of national economic growth more favorable consumer credit policies and fiscal incentives from the government While gross domestic product (gDP) and vehicle sales have gone hand-in-hand from 1990 until the mid-2000s vehicle sales growth remained robust even in 2009 and after 2011 when economic growth faltered (Figure 1‑2) slower economic growth following the international financial crisis was offset by credit expansion and fiscal incentives to encourage vehicle sales although there is much debate regarding the effects of such fiscal incentives on vehicle sales and gDP (alves 2014 antP 2014 Mendonccedila 2014) it is widely acknowledged that fiscal incentives contributed to part of the recent growth in vehicle sales
2
Brazil Passenger Vehicle Market statistics
0
500
1000
1500
2000
2500
3000
00
05
10
15
20
25
30
35
199
0
199
1
199
2
199
3
199
4
199
5
199
6
199
7
199
8
199
9
200
0
200
1
200
2
200
3
200
4
200
5
200
6
200
7
200
8
200
9
2010
2011
2012
2013
GD
P (
bill
ion
curr
ent
US$
)
Veh
icle
sal
es (
mill
ion)
Figure 1‑2 ndash comparison of passenger vehicle sales and economic growth in Brazil
Sources ANFAVEA 2015 World Bank databases
one-liter engine vehicles have consistently lost market share since 2001 Brazil has historically encouraged the sales of small-engine vehicles through lower sales taxes From 1990 to 2001 one-liter engine automobiles became the symbol of the national automotive industry and their share in total sales increased from 4 to over 70 (anfavea 2015) in the 2000s the number of vehicle manufacturers in Brazil increased from 15 to 46 and the government started to provide tax incentives to flex-fuel cars independently of engine size Because of increasing competition amongst automakers a narrower gap between taxes for one-liter engine cars and flex-fuel cars and increasing consumer preference for more comfort and powerful engines the share of one-liter engine cars decreased to 36 in 2013 While the relative participation of one-liter engine cars has decreased total one-liter vehicle sales have increased continuously in the same period from 780000 units sold in 2001 to over 11 million in 2013 (Figure 1‑3)
3
ICCT white paper
0
10
20
30
40
50
60
70
80
90
100
00
02
04
06
08
10
12
14
16
18
20
199
0
199
1
199
2
199
3
199
4
199
5
199
6
199
7
199
8
199
9
200
0
200
1
200
2
200
3
200
4
200
5
200
6
200
7
200
8
200
9
2010
2011
2012
2013
10
L S
hare
New
10
L e
ngin
e ve
hicl
e re
gis
trat
ions
(m
illio
n)
Figure 1‑3 ndash new registrations of one-liter engine vehicles
Source ANFAVEA 2015
Due to a long-standing national program to stimulate ethanol consumption ethanol is sold as e100 (100 ethanol by volume) as well as being blended in gasoline the government sets the ethanol blend in commercial gasoline ranging from 20 to 27 ethanol depending on the current blend mandate (e20-e25 since 2011 and e27 in 2015) as a result biofuels in Brazil account for about 25 of road transport fuel demand compared to less than 35 globally (iea 2015)
ethanol availability at different blend levels has had a strong impact over consumer choices and technologies offered in the market by manufacturers until the 2000s sales of gasoline or ethanol vehicles were driven primarily by fuel prices with ethanol vehicles dominating sales in the 1980s and very strong sales of gasoline engines in the 1990s today flex-fuel engines those that can run on any combination of ethanol and gasoline are currently ubiquitous in new passenger vehicles since their introduction in 2003 flex-fuel engines now dominate the passenger vehicle market accounting for 94 of new sales in 2013 (Figure 1‑4) sales of new diesel passenger cars have been below 1 of total sales since 2005 (anFaVea 2015)
4
Brazil Passenger Vehicle Market statistics
0
10
20
30
40
50
60
70
80
90
100
198
019
81
198
219
83
198
419
85
198
619
87
198
819
89
199
019
91
199
219
93
199
419
95
199
619
97
199
819
99
200
020
01
200
220
03
200
420
05
200
620
07
200
820
09
2010
2011
2012
2013
Pas
seng
er c
ar f
uel m
arke
t sh
are
Gasoline Ethanol Flex
Figure 1‑4 ndash registrations of new passenger vehicles by fuel type
Source ANFAVEA 2015
the top seven manufacturers ndash Fiat general Motors (gM) Volkswagen Ford renault hyundai and honda ndash commanded a vast majority (83) of the entire market in 2013 with the remaining manufacturers accounting for less than 4 of market sales each (Figure 1‑5) the Volkswagen gol is the most popular vehicle in Brazil accounting for about 45 of all sales in 2013 Medium-sized vehicles dominate the market with 39 of all sales followed by compact and subcompact vehicles which together make up 84 of the entire market in addition domestically manufactured vehicles accounted for more than 83 of sales in 2013 which represented a small increase with respect to the previous year
FIAT20
GM18
VOLKSWAGEN18
FORD10
RENAULT7
HYUNDAI7
HONDA5
TOYOTA 4
PSA 4
NISSAN 2
Others 5
2013 market shareby manufacturer
Subcompact22
Compact22Medium
39
Large6
Sport1
O-Road3
SUV7
Minivan01
2013 market shareby segment
Figure 1‑5 ndash Market share of new passenger vehicles by manufacturer and segment (2013)
Source ADK
5
ICCT white paper
Table 1‑1 summarizes key indicators for the Brazilian passenger vehicle market in 2012 and 2013 Fiat remained the market leader in 2013 although with a small loss and gM overtook Volkswagen in 2013 amongst the companies that gained the most market share are hyundai and toyota both of which doubled their market share between 2012 and 2013 on the other hand Psa and nissan lost market shares in this period the market dominance of medium-sized vehicles in 2013 marks a significant shift in consumer preferences Between 2012 and 2013 the subcompact segment lost the majority share (from 33 to 22) and the larger compact and medium segments gained sizable shares
Table 1‑1 ndash Market characteristics of new Brazilian passenger vehicles
parameter 2012 2013
Sales (million) 311 304
price (R$) $47203 $47446
Domestic market share 800 834
Engine 10 L share 386 363
Fuel share
Flex 914 936
Gasoline 82 59
hybrid 0004 0014
Diesel 04 05
Segment market share
Subcompact 332 223
Compact 162 225
Medium 335 388
Large 79 63
Sport 07 09
Off‑road 23 25
SUV 61 66
Minivan 01 01
Manufacturer market share
Fiat 221 200
GM 176 180
Volkswagen 211 179
Ford 96 101
Renault 73 73
hyundai 32 68
honda 43 46
Toyota 24 44
pSa 44 38
Nissan 28 20
Mitsubishi 13 12
Kia 11 08
JaC 06 05
BMw 03 05
Land Rover 03 03
Mercedes‑Benz 02 03
Others 02 14
sales-weighted average
6
Brazil Passenger Vehicle Market statistics
2 vEhiCLE fLEET ChArACTEriSTiCS
this chapter provides an overview of key vehicle fleet characteristics in Brazil number of cylinders engine displacement curb weight1 length footprint2 engine power and power-to-weight ratio (PtWr)3 are relevant indicators to characterize a vehicle fleet and understand individual vehicle and fleet-average energy consumption4
these key characteristics of passenger vehicles in Brazil experienced a small change in 2013 compared to 2012 (Table 2‑1) With the exception of number of cylinders all parameters increased in 2013 consistent with a trend of increasing market shares for larger and more powerful vehicles the evaluation of minimum and maximum parameters also provides important insights While the smallest vehicles continue to be sold in Brazil (since the minimum values did not change with the exception of footprint) it is evident that much larger vehicles started being sold in 2013 represented by the large variation in the maximum values of each parameter Because sales of these recently introduced larger vehicles are relatively small their effect on weighted average parameters is also modest
Figure 2‑1 illustrates key vehicle fleet characteristics by vehicle segment (see appendix a for segment definition) not surprisingly most parameters get larger between the subcompact and large segments off-road vehicles sports cars and minivans tend to be the largest and most powerful vehicles across the fleet while sport utility vehicles (suVs) tend to be comparable with vehicles in the ldquolargerdquo segment Because of their high performance (absolute and relative to vehicle size) sports cars have significantly larger engine power and PtWr compared to all other segments sports vehicles primarily imported are not sold in a flex-fuel configuration and consume strictly gasoline Flex-fuel vehicles have slightly higher engine power and PtWr than their gasoline counterparts in most segments Detailed sales-weighted average data by segment are presented in Table C‑1 in appendix c
1 Based on norm aBnt nBr iso 1176 2006 curb weight is the total weight of a vehicle with standard equipment all necessary operating consumables (eg motor oil and coolant) a full tank of fuel but not loaded with passengers or cargo
2 Footprint (m2) is the product of the distance between the axles of a vehicle (wheelbase) and the distance between the centerline of the tires (average trackwidth)
3 Power to weight ratio (PtWr) is defined as the rated power of the engine (kW) divided by the vehicle weight (kg) PtWr is a metric that describes vehicle acceleration and handling and it is thus used in Brazil as a criterion to classify sports vehicles (PtWr gt 0075 kWkg)
4 Vehicle energy consumption is presented in megajoules per kilometer (Mjkm) for consistency with the vehicle energy consumption targets established by inovar-auto although e27 is currently being used flex-fuel vehicles are tested with e22 fuel
7
ICCT white paper
Table 2‑1 ndash Fleet characteristics of new Brazilian passenger vehicles
Vehicle characteristic 2012 2013 Variation
Number of cylinders weighted average 402 400 ‑06
Displacement (cc)
Min 970 970
Max 6498 6749
weighted average 1418 1430 08
Curb weight (kg)
Min 800 800
Max 2940 2710
weighted average 1102 1106 04
Length (mm)
Min 2695 2695
Max 5290 5842
weighted average 4089 4100 03
Footprint (m2)
Min 217 241
Max 523 874
weighted average 364 367 09
Engine power ndash gasoline (kw)
Min 33 33
Max 153 545
weighted average 743 757 18
Engine power ndash ethanol (kw)
49 49
Max 114 153
weighted average 715 740 34
pTwR ‑ gasoline (kwkg)
00455 00455
Max 04482 03344
weighted average 00658 00671 20
pTwR ‑ ethanol (kwkg)
00476 00477
Max 00935 01033
weighted average 00667 00683 24
Energy consumption ndash US CaFE (MJkm) na 202
8
Brazil Passenger Vehicle Market statistics
0
500
1000
1500
2000
2500
3000
Subco
mpac
t
Compac
t
Medium
Larg
eSport
O-road SUV
Miniva
n
Fleet-a
vera
ge
Dis
pla
cem
ent
(cc)
0200400600800
10001200140016001800
2000
Subco
mpac
t
Compac
t
Medium
Larg
eSport
O-road SUV
Miniva
n
Fleet-a
vera
ge
Cur
b w
eig
ht (
kg)
0500
10001500
2000250030003500400045005000
Subco
mpac
t
Compac
t
Medium
Larg
eSport
O-road SUV
Miniva
n
Fleet-a
vera
ge
Leng
th (
mm
)
000050100150
200250300350400450
Subco
mpac
t
Compac
t
Medium
Larg
eSport
O-road SUV
Miniva
n
Fleet-a
vera
ge
Fo
otp
rint
(m
2 )
020406080
100120140160180
200
Subco
mpac
t
Compac
t
Medium
Larg
eSport
O-road SUV
Miniva
n
Fleet-a
vera
ge
Po
wer
(kW
)
Gasoline EthanolGasoline and Ethanol
000
002
004
006
008
010
012
014
Subco
mpac
t
Compac
t
Medium
Larg
eSport
O-road
SUV
Miniva
n
Fleet-a
vera
gePo
wer
-to
-wei
ght
rat
io (
kWk
g)
Figure 2‑1 ndash Fleet characteristics of new Brazilian passenger vehicles by segment (2013)
Fleet characteristics for the top 20 vehicle manufacturers responsible for more than 99 of passenger vehicle sales in 2013 are presented in Figure 2‑2 the four top-selling manufacturers (Fiat gM Volkswagen and Ford) produce on average lighter vehicles with smaller and less powerful engines average engine rated power is below 80 kW for the 10 largest manufacturers except for toyota and honda since each has a large share of off-road and suV sales respectively luxury manufacturers and off-road dominant manufacturers (jeep and Mitsubishi) show the largest values of engine power PtWr values seem evenly distributed below 0070 kWkg across the five largest manufacturers plus Psa and chery and climb following the power trend for luxury and off-road oriented manufacturers Most vehicles are rated with higher engine power and PtWr under ethanol (e100) than under gasoline (e22) Detailed sales-weighted average data by manufacturer are presented in Table C‑2 in appendix c
9
ICCT white paper
Gasoline Ethanol
0
500
1000
1500
2000
2500
3000
3500
Fiat GM
Volkswag
enFord
Renau
lt
Hyund
ai
Honda
Toyo
taPSA
Nissan
Mitsub
ishiKIA
JACBMW
Land
Rove
r
Merce
des-B
enz
Chery
Audi
Suzuk
iJe
ep
Fleet-a
vera
geFiat GM
Volkswag
enFord
Renau
lt
Hyund
ai
Honda
Toyo
taPSA
Nissan
Mitsub
ishiKIA
JACBMW
Land
Rove
r
Merce
des-B
enz
Chery
Audi
Suzuk
iJe
ep
Fleet-a
vera
ge
Dis
pla
cem
ent
(cc)
0200400600800
10001200140016001800
2000
Cur
b w
eig
ht (
kg)
Fiat GM
Volkswag
enFord
Renau
lt
Hyund
ai
Honda
Toyo
taPSA
Nissan
Mitsub
ishiKIA
JACBMW
Land
Rove
r
Merce
des-B
enz
Chery
Audi
Suzuk
iJe
ep
Fleet-a
vera
geFiat GM
Volkswag
enFord
Renau
lt
Hyund
ai
Honda
Toyo
taPSA
Nissan
Mitsub
ishiKIA
JACBMW
Land
Rove
r
Merce
des-B
enz
Chery
Audi
Suzuk
iJe
ep
Fleet-a
vera
ge000050100150
200250300350400450
Fo
otp
rint
(m
2 )
3400
3600
3800
4000
4200
4400
4600
4800
Leng
th (
mm
)
Fiat GM
Volkswag
enFord
Renau
lt
Hyund
ai
Honda
Toyo
taPSA
Nissan
Mitsub
ishiKIA
JACBMW
Land
Rove
r
Merce
des-B
enz
Chery
Audi
Suzuk
iJe
ep
Fleet-a
vera
geFiat GM
Volkswag
enFord
Renau
lt
Hyund
ai
Honda
Toyo
taPSA
Nissan
Mitsub
ishiKIA
JACBMW
Land
Rove
r
Merce
des-B
enz
Chery
Audi
Suzuk
iJe
ep
Fleet-a
vera
ge0
20406080
100120140160180
200
Po
wer
(kw
)
00000010002000300040005000600070008000900100
Po
wer
-to
-wei
ght
rat
io (
kWk
g)
Gasoline and Ethanol
Figure 2‑2 ndash Fleet characteristics of new Brazilian passenger vehicles by manufacturer (2013)
Manufacturers are organized by total sales in descending order
Figure 2‑3 illustrates vehicle fleet characteristics for domestic and imported vehicles in general imported vehicles are bigger and heavier than those nationally produced the most remarkable contrast lies on engine power and PtWr imported vehicles are more powerful and have higher PtWr but while domestic vehicles exhibit higher engine power and PtWr for ethanol than for gasoline the opposite occurs for imported ones a closer examination of available data on engine compression ratios shows that domestic producers are leveraging ethanolrsquos higher octane rating and designing flex-fuel engines with much higher compression ratios (~1251) than gasoline-only engines (around 1051)5 this confirms the special engine designcalibration for operation with high ethanol gasoline blends from manufacturers with local production Detailed sales-weighted average data by origin are presented in Table C‑3 in appendix c
5 More information on the effect of ethanol on vehicle design characteristics can be found in stein et al (2013)
10
Brazil Passenger Vehicle Market statistics
Gasoline Ethanol
0
200
400
600
800
1000
1200
1400
1600
1800
2000
Domestic Imported Fleet-average
Dis
pla
cem
ent
(cc)
0
200
400
600
800
1000
1200
1400
Domestic Imported Fleet-average
Cur
b w
eig
ht (
kg)
345
350
355
360
365
370
375
380
385
390
395
Domestic Imported Fleet-average
Fo
otp
rint
(m
2 )
3950
4000
4050
4100
4150
4200
4250
4300
4350
Domestic Imported Fleet-average
Leng
th (
mm
)
0
20
40
60
80
100
120
Domestic Imported Fleet-average
Po
wer
(kW
)
0050
0055
0060
0065
0070
0075
0080
Domestic Imported Fleet-average
Po
wer
-to
-wei
ght
rat
io (
kWk
g)
Gasoline and Ethanol
Figure 2‑3 ndash Fleet characteristics of new Brazilian passenger vehicles by origin (2013)
Figure 2‑4 compares Brazilrsquos passenger vehicle fleet with those in china the us eu japan india and south Korea For the energy consumption comparison this analysis considers the us corporate average fuel economy (caFe) test cycle6 average engine displacement curb weight footprint and engine power in Brazil are the smallest with the exception of india (and japan in the case of engine displacement) With respect to PtWr the average Brazilian passenger car breaks the trend set by the power category ie Brazilian cars are less powerful than those in china japan and eu due to their lower average weight which drives the PtWr value above chinese japanese and european cars this suggests that the average Brazilian cars share the driving performance characteristics (eg acceleration times) of the us and Korean vehicles despite their relative smaller engines Detailed international data are presented in appendix B
6 Details on icctrsquos methodology for comparing new vehicle fuel efficiency can be found at the global PV standards section in the icctrsquos website httpwwwtheicctorginfo-toolsglobal-passenger-vehicle-standards
11
ICCT white paper
Despite having the smallest lightest and least powerful vehicles on average (with the exception of india) Brazilrsquos average energy consumption ranks fourth amongst the markets analyzed in this study the japanese fleet had the lowest energy consumption given the small and light vehicle characteristics of japanese cars and their relatively higher adoption of efficiency technologies (eg hybrids) followed by the eu (medium sizeweight fleet with high technology penetration) and india (smaller and lighter fleet overall) the us has the highest energy consumption on average due to the fleetrsquos larger size weight and power requirements china and south Korea trail the us as the most energy-consuming fleet and these countries have fleets with large and heavy vehicles but relatively lower penetration of efficiency technologies a detailed evaluation of energy consumption in Brazil and other markets is presented in chapter 4
0
500
1000
1500
2000
2500
3000
US S Korea EU China Brazil Japan India
Dis
pla
cem
ent
(cc)
0
200
400
600
800
1000
1200
1400
1600
1800
US S Korea EU China Japan Brazil India
Cur
b w
eig
ht (
kg)
000
050
100
150
200
250
300
350
400
450
US S Korea EU China Japan Brazil India
Fo
otp
rint
(m
2)
0
20
40
60
80
100
120
140
160
US S Korea EU China Japan Brazil India
Po
wer
(kW
)
00000
00100
00200
00300
00400
00500
00600
00700
00800
00900
01000
US S Korea Brazil China Japan EU India
Po
wer
-to
-wei
ght
rat
io (
kWk
g)
100
120
140
160
180
200
220
240
260
US China S Korea Brazil India Japan EU
Ene
rgy
cons
ump
tio
n ndash
US
CA
FE
(M
Jkm
)
Figure 2‑4 ndash international comparison of key new passenger vehicle characteristics
12
Brazil Passenger Vehicle Market statistics
3 vEhiCLE TEChNOLOGy ADOpTiON
this chapter provides an overview of current technology adoption including fuel engine and transmission technologies that affect vehicle energy consumption the type and complexity of technologies vary across vehicle segments to a large extent this is a function of vehicle size and weight and its intended performance and ultimately cost Fleet-average parameters presented in Table 3‑1 correspond to sales-weighted fleet-average values this chapter is divided by technology type with supporting information in appendix c an international comparison for each technology is also presented in this chapter the data for this technology adoption analysis came from a diversity of sources listed in appendix D also note that for comparisons at the international level it was required to use information from different years the most recent according to data availability
Table 3‑1 ndash technology adoption in new Brazilian passenger vehicles
Year 2012 2013
Fuel type
Flex 914 936
Gasoline 82 59
hybrid 0004 0014
Diesel 04 049
No of cylinders
Three 03 25
Four 986 966
Five 00 00
Six 09 08
Eight or more 01 01
Transmission
Manual 870 833
automatic 112 147
CVT 14 15
DCT 04 05
No of gear ratios
Four or fewer 61 59
Five 849 831
Six 84 98
Seven 03 07
Eight or more 02 05
Drivetrain
FwD 950 944
RwD 27 29
4wD and awD 23 27
No of valves per cylinder
Two 664 596
Multi valve 336 404
Valve camshaft configuration
Single overhead camshaft 696 630
Dual overhead camshaft 176 245
Valve actuation
Fixed 822 783
VVT 124 159
VVT+VVL 54 58
Fuel systems for gasoline vehicles
Multi‑point fuel injection 982 976
Gasoline direct injection 18 24
air induction systems for gasoline vehicles
Naturally aspirated 984 973
Supercharger turbocharger or twin‑turbo 16 27
13
ICCT white paper
FUEL TYpEFlex-fuel vehicles (FFVs) are designed to run on gasoline (e22) ethanol (e100) or any combination of both fuels except for a few engine and fuel system modifications FFVs are identical to gasoline-only models7 FFVs experience no loss in performance when operating on e100 however since ethanol contains less energy per volume than gasoline FFVs typically get about 25 fewer kilometers per liter when fuelled with e100
Flex-fuel is the dominant technology across all vehicle segments with the exception of sports cars off-road vehicles and minivans (Figure 3‑1) all top 10 manufacturers produce primarily flex-fuel engines and those manufacturers with a larger share of gasoline and diesel engines typically import most of their vehicles (Figure 3‑2) the predominance of FFVs responsible for almost 94 of vehicle sales in 2013 is unique to Brazil (Figure 3‑3)
hybrid-gasoline vehicles achieve reduced fuel consumption by incorporating in the drivetrain a battery and an electric motor in addition to an internal combustion (ic) engine this technology permits the ic engine to shut down when the vehicle is decelerating and is stopped braking energy to be recovered and the ic engine to be downsized and operated at more efficient operating points Depending on the level of complexity hybrid systems can achieve 15 to 35 reductions in fuel consumption with respect to similar-sized vehicles
Despite having very limited penetration sales of new hybrid vehicles have increased three-fold from 131 units in 2012 to 432 in 2013 primarily in the medium and sports segments two manufacturers sell the most gasoline hybrid models (not flex-fuel) in Brazil including the toyota Prius and the Ford Fusion hybrid
Diesel engines offer 20 to 25 reduction in fuel consumption over traditional gasoline multi-point fuel injection (MPFi) engines due to higher compression ratios reduced pumping losses and 12 higher energy content per liter of fuel the challenge for further commercialization is twofold the complexity and additional cost of advanced exhaust after-treatment technologies that reduce emissions of particulate matter and oxides of nitrogen to levels comparable to those of gasoline and FFV engines
sales of diesel passenger vehicles are not allowed in Brazil with the exception of vehicles with some off-road characteristics Despite having a small penetration (around 05) sales of diesel passenger vehicles increased by 16 in 2013 toyota sells the most diesel passenger vehicles followed by Mitsubishi land rover gM and Mercedes-Benz the light-duty diesel market in Brazil is equivalent to the us and china in terms of market penetration and much below the penetration in europe and south Korea although air quality concerns in europe might trigger lower sales of diesel vehicles in coming years
7 Most of the modifications with respect to a gasoline-only vehicle (e00) include changes to fuel systemrsquos materials that are compatible with the oxygen content of ethanol blends and changes to air and fuel ratio management systems (mainly software based)
14
Brazil Passenger Vehicle Market statistics
0
10
20
30
40
50
60
70
80
90
100
Subco
mpac
t
Compac
t
Medium
Larg
eSport
O-Road SUV
Miniva
nTo
tal
Mar
ket
shar
e
Diesel Hybrid Gasoline Flex
Figure 3‑1 ndash Fuel type by segment
0102030405060708090
100
Fiat GM
Volkswag
enFord
Renau
lt
Hyund
ai
Honda
Toyo
taPSA
Nissan
Mitsub
ishi
KIAJA
CBMW
Land
Rove
r
Merce
des-B
enz
Chery
Audi
Suzuk
iJe
epTo
tal
Tech
nolo
gy
shar
e
Diesel Hybrid Gasoline Flex
Figure 3‑2 ndash Fuel type by manufacturer
0
10
20
30
40
50
60
70
80
90
100
China2010
Korea2011
EU-272013
US2013
Japan2011
India2012
Brazil2013
Tech
nolo
gy
shar
e
Diesel Hybrid Gasoline CNGLPGFlex
Figure 3‑3 ndash Fuel type international comparison
15
ICCT white paper
NUMBER OF CYLiNDERSacross all vehicle markets 4-cylinder engines are the most common design in automobile engines with displacements below 25 liters this engine configuration presents the right balance between complexity and performance for the target vehicle segments (small to mid-size sedans suVs and some off-road vehicles) engines with six and more cylinders are designed to provide a smoother vehicle driving experience with lower vibration and noise than 4-cylinder engines can provide and with higher power output this better overall performance comes at a higher cost driving their widespread use in large and luxury vehicles and heavier suVs and off-road vehicles
the need to attain better energy consumption has resulted in a recent wave of 3-cylinder engines from a handful of manufacturers in vehicles that typically used 4-cylinder engines achieving similar or better performance this practice is known as engine downsizing Downsizing can also be applied to larger engines from V-8s to V-6s and from V-6s to i-4s in most cases engine downsizing is accompanied with turbocharging and changes to the fuel delivery system
Four-cylinder engines dominate the passenger vehicle market in Brazil and are sold in more than 90 of new vehicles among all segments except the sports off-road and minivan segments (Figure 3‑4) Despite its predominance sales of 4-cylinder engines fell from over 307 to 293 million units between 2012 and 2013 equivalent to a 4 reduction 4-cylinder vehicles represent the majority of sales among the 20 top manufacturers except for hyundai and jeep (Figure 3‑5) although 4-cylinder engines represent the dominant technology in all countries analyzed Brazil still has the largest market share (Figure 3‑6)
the most significant shift in market preferences in Brazil occurred with 3-cylinder engines this technology is becoming more popular with almost eight times more vehicles sold in 2013 compared to 2012 reaching almost 75000 units in 2013 almost all 3-cylinder engines are being sold as compact vehicles instead of the smaller subcompact segment hyundai is the technology leader in sales of 3-cylinder high-efficiency Kappa engines8 japan and india have relatively high penetration of 3-cylinder engine technology in india the popularity of 2- and 3-cylinder vehicles is primarily driven by lower price tags (lt usD $8000)
six-cylinder engines are third in sales after 4- and 3-cylinder engines with absolute numbers close to 25000 units sold in 2013 its market share reduced by 13 with respect to 2012 six-plus cylinder engines are being sold mostly in the sports off-road and minivan segments Manufacturers that cater to the most expensive models and segments dominate the market of vehicles with six-plus cylinder engines such as land rover BMW and Mercedes-Benz the penetration of 6-plus-cylinder engines in Brazil is very low compared to other countries
Five-cylinder engines are not very common in Brazil or other countries and are losing market with respect to 2012 sales by 56 Volkswagen audi and Volvo are the only manufacturers that offered 5-cylinder engines in Brazil in 2013
8 hyundairsquos 3-cylinder Kappa engine httpworldwidehyundaicomWWshowroomcarshB20PiPindexhtml
16
Brazil Passenger Vehicle Market statistics
0
10
20
30
40
50
60
70
80
90
100
Subco
mpac
t
Compac
t
Medium
Larg
eSport
O-Road SUV
Miniva
nTo
tal
Tech
nolo
gy
shar
e
8+ 6 5 4 3
Figure 3‑4 ndash number of cylinders by segment
0102030405060708090
100
Fiat GM
Volkswag
enFord
Renau
lt
Hyund
ai
Honda
Toyo
taPSA
Nissan
Mitsub
ishi
KIAJA
CBMW
Land
Rove
r
Merce
des-B
enz
Chery
Audi
Suzuk
iJe
epTo
tal
Tech
nolo
gy
shar
e
8+ 6 5 4 3
Figure 3‑5 ndash number of cylinders by manufacturer
0
10
20
30
40
50
60
70
80
90
100
China2010
Korea2011
EU-272013
US2013
Japan2011
India2012
Brazil2013
Tec
hno
log
y sh
are
8+ 6 5 4 3 2
Figure 3‑6 ndash number of cylinders international comparison
17
ICCT white paper
TRaNSMiSSiONtransmission technologies can reduce energy consumption in two ways First by allowing engine operation on a more efficient region of the engine map and second by reducing the mechanical losses within transmissions traditionally manual transmissions have offered better energy consumption than traditional automatic transmissions (with 4 or 5 speeds) due to lower friction losses however new generation of automatic transmissions with higher number of gears lower friction better materials and computer-controlled shift points have not just closed the gap between manual and automatic transmission performance but even exceed manual transmission performance
new technologies such as dual-clutch transmissions (Dcts) and continually variable transmissions (cVts) are gaining market share due to the need for lower vehicle energy consumption Dcts can be defined as manual transmissions with electro-hydraulically operated dual-clutch systems allowing for faster shifting times and selective automatic or ldquomanualrdquo operation as opposed to manual automatic and Dct transmissions which have a discrete number of gear ratios cVts have a theoretically infinite choice of ratios between fixed limits which allows engines to be further optimized for minimizing energy consumption cVt technology has been used in lower-horsepower vehicles because of maximum-torque limitations with the most common metal-belt design (nas 2011) these advanced transmission technologies offer significant benefits in energy consumption compared to traditional manual or automatic technologies according to the us national academy of sciences a 6-speed Dct provides 6 to 9 lower energy consumption than a 4-speed automatic transmission note that a traditional 6-speed automatic transmission provides an estimated 3 to 5 benefit the energy consumption benefit of cVt depends on the application and is estimated to be 1 to 7 (nas 2011)
although vehicle sales with manual transmissions are predominant in Brazil the penetration of automatic transmissions cVts and Dcts is increasing resulting in a market share loss for manual transmissions of about 6 between 2012 and 2013 (Table 3‑1) With the exception of sports and off-road segments manual transmission technology has the largest market share in all segments but it tends to become less predominant as vehicles grow in size and comfort level (Figure 3‑7) the top five manufacturers sell most of their vehicles with manual transmissions but their market share is somewhat smaller for other high-selling manufacturers that cater to a more affluent market (Figures 3‑8)
automatic transmissions are becoming increasingly popular in Brazil experiencing an increase of 28 in sales between 2012 and 2013 automatic transmissions dominate the sports and off-road segments Kia BMW land rover Mercedes-Benz and jeep adopt this type of transmission technology for most of their vehicle sales
Dct transmissions are entering the Brazilian market mostly through the sports segment via imported models the sales of Dct equipped vehicles increased in 2013 by 22 with respect to 2012 Dct technology is being offered mainly by manufacturers that sell sports vehicles such as audi in more than 67 of their vehicles and Mercedes-Benz in more than 15 of their vehicles the global leader in Dct adoption is europe followed by the us (Figure 3‑9)
cVt technology market is still relatively small being sold by small volume manufacturers like jeep audi and Mitsubishi with more than 25 of new vehicle sales each nissan renault honda and toyota also sell vehicles with cVt technology cVt penetration in Brazil is similar to europersquos cVt is the leading transmission technology in japan with more than 65 of the market
18
Brazil Passenger Vehicle Market statistics
0
10
20
30
40
50
60
70
80
90
100
Subco
mpac
t
Compac
t
Medium
Larg
eSport
O-Road SUV
Miniva
nTo
tal
Tech
nolo
gy
shar
e
DCT CVT Automatic Manual
Figure 3‑7 ndash transmission by segment
0
10
20
30
40
50
60
70
80
90
100
Fiat GM
Volkswag
enFord
Renau
lt
Hyund
ai
Honda
Toyo
taPSA
Nissan
Mitsub
ishi
KIAJA
CBMW
Land
Rove
r
Merce
des-B
enz
Chery
Audi
Suzuk
iJe
epTo
tal
Tech
nolo
gy
shar
e
DCT CVT Automatic Manual
Figure 3‑8 ndash transmission by manufacturer
0
10
20
30
40
50
60
70
80
90
100
China2010
Korea2011
EU-272013
US2013
Japan2011
India2012
Brazil2013
Tech
nolo
gy
shar
e
DCT CVT Automatic Manual
Figure 3‑9 ndash transmission international comparison
19
ICCT white paper
NUMBER OF GEaR RaTiOS as mentioned in the previous section increasing the number of gear ratios (whether manual automatic dual-clutch or continuously variable) allows the engine to be operated in the best efficiency region resulting in energy consumption benefits compared to an automatic four-gear ratio transmission (also known as 4-speed transmission) higher ratio automatic transmissions could reduce energy consumption from 2 to 3 (for a five-gear ratio) to 6 to 8 (for an eight-gear ratio) (ePanhtsa 2010)
Four-gear ratio transmissions are losing market share in Brazil by more than 5 between 2012 and 2013 (Table 3‑1) these transmissions are particularly high sellers in the suV and minivan segments which suggest that some models in these more expensive segments are being sold with outdated technologies (Figure 3‑10) Most manufacturers are phasing out this type of transmission (Figure 3‑11) although jeep suzuki and toyota are lagging behind other manufacturers the four-gear ratio transmission technology has been losing market share in most countries even in india where smaller and inexpensive cars dominate the market 4-speed transmissions have the smallest market share (Figure 3‑12)
Five- and six-gear ratio transmissions were predominant in the Brazilian market in 2013 Five-gear ratio transmissions are dominant in all segments except for the off-road and sports segments which have adopted six-gear ratio transmissions in most sales the significant market share of five- and six-gear ratio transmissions is similar to most countries although the us europe and south Korea show higher shares of six and more gear ratios
seven- and eight-gear ratio transmissions which are considered emerging technologies have experienced an increase in sales in Brazil with over twice as many sales in 2013 compared to 2012 seven- and eight-gear ratio transmissions are popular among the large sports and off-road segments all of which are imported models luxury manufacturers such as Mercedes-Benz and audi are selling the most seven-gear vehicles as a share of their sales Volkswagen and toyota are also selling similar numbers of seven-gear ratio vehicles although for Volkswagen and toyota it represented less than 3 of their brand sales BMW and land rover are the leaders in eight-gear ratio vehicles
20
Brazil Passenger Vehicle Market statistics
0
10
20
30
40
50
60
70
80
90
100
Subco
mpac
t
Compac
t
Medium
Larg
eSport
O-Road
SUV
Miniva
nTo
tal
Tech
nolo
gy
shar
e
8 7 6 5 4
Figure 3‑10 ndash number of gear ratios by segment
0
10
20
30
40
50
60
70
80
90
100
Fiat GM
Volkswag
enFord
Renau
lt
Hyund
ai
Honda
Toyo
taPSA
Nissan
Mitsub
ishi
KIAJA
CBMW
Land
Rove
r
Merce
des-B
enz
Chery
Audi
Suzuk
iJe
epTo
tal
Tech
nolo
gy
shar
e
8 7 6 5 4
Figure 3‑11 ndash number of gear ratios by manufacturer
0
10
20
30
40
50
60
70
80
90
100
Tech
nolo
gy
shar
e
Six or more Five Four or fewer
China2010
Korea2011
EU-272013
US2013
India2012
Brazil2013
Figure 3‑12 ndash number of gear ratios international comparison
21
ICCT white paper
DRiVETRaiNDrivetrain technology includes front-wheel drive (FWD) rear-wheel drive (rWD) and all-wheel drive (aWD) vehicles For the same vehicle size FWD vehicles provide more interior space and better energy consumption than rWDs due to lower weight as it avoids the added weight of and space for the driveshaft and differential that rWD requires Because the weight of the engine and transmission is located close to the wheels FWD vehicles have better traction than rWDs rWDs however show better handling as the weight distribution between the front and rear wheels is more uniform and the tasks of turning and acceleration are split between the front and rear wheels also directing large amounts of power through the front wheels can create ldquotorque steerrdquo thus rWD is the adequate technology for the sports segment aWD drivetrains are intended for specific driving applications that imply loss of traction such as off-road terrains snow or towing
FWD vehicles dominate all segments of the Brazilian passenger car market (Table 3‑1) with the exception of the off-road segment (Figure 3‑13) among the 20 largest manufacturer sellers most except for BMW land rover Mercedes-Benz and suzuki offer FWD technology (Figure 3‑14) Brazil has the highest market share of FWD vehicles of all countries analyzed (944) although FWD has at least 50 market share in all seven countries (Figure 3‑15)
aWD market share increased by 15 between 2012 and 2013 due to a tri-fold increase in the sports segment sales off-road vehicle sales with aWD also increased to more than 76000 units in 2013 amongst the largest ten manufacturers toyota is the aWD market leader followed by Ford and Volkswagen note that land rover sells only aWD vehicles in Brazil among non-luxury manufacturers Mitsubishi and suzuki are selling more than 50 of their vehicles with aWD technology
rWD technology is offered mostly in large and sports vehicles and in suVs among the 10 largest manufacturers rWD is offered mainly by gM and toyota while an extended examination of the 20 largest manufacturers by sales show that aWD and rWD is focused among the more expensive brands (Figure 3‑14) Mercedes-Benz and BMW sell close to 90 of their vehicles with rWD technology traditionally associated with engine performance and responsiveness
22
Brazil Passenger Vehicle Market statistics
0
10
20
30
40
50
60
70
80
90
100
Subco
mpac
t
Compac
t
Medium
Larg
eSport
O-Road SUV
Miniva
nTo
tal
Tehn
olo
gy
shar
e
AWD RWD FWD
Figure 3‑13 ndash Drivetrain by segment
0
10
20
30
40
50
60
70
80
90
100
Fiat GM
Volkswag
enFord
Renau
lt
Hyund
ai
Honda
Toyo
taPSA
Nissan
Mitsub
ishi
KIAJA
CBMW
Land
Rove
r
Merce
des-B
enz
Chery
Audi
Suzuk
iJe
epTo
tal
Tech
nolo
gy
shar
e
AWD RWD FWD
Figure 3‑14 ndash Drivetrain by manufacturer
0
10
20
30
40
50
60
70
80
90
100
China2010
Korea2011
EU-272013
US2013
Japan2011
India2012
Brazil2013
Tech
nolo
gy
shar
e
AWD RWD FWD
Figure 3‑15 ndash Drivetrain international comparison
23
ICCT white paper
VaLVE CaMShaFT CONFiGURaTiON (DOhC VS SOhC)the engine camshaft governs the timing duration and lift of valve operation controlling the intake of air and the exhaust of combustion gases this report focuses on single overhead camshafts (sohc) and dual overhead camshafts (Dohc) as these configurations have almost completely replaced the older overhead valve configuration (ohV) sohc design places a single camshaft above the cylinder head that governs all the valves intake and exhaust in the case of sohc V-engines there is one single camshaft per head Dohc designs use separate camshafts for intake valves and exhaust valves Dohc engines achieve increased airflow at high-engine speeds improve volumetric efficiency and reduce the valvetrainrsquos moving mass such engines typically develop higher power at high-engine speeds the us environmental Protection agency (ePa) and national highway traffic safety administration (nhtsa) estimate the effectiveness of Dohc over sohc to be between 1 and 25 (ePanhtsa 2010)
although Dohc produce more power and provide lower fuel consumption the Brazilian fleet is still mostly composed of sohcs vehicles (Table 3‑1) sohc technology is predominant among the subcompact compact and medium segments (Figure 3‑16) among manufacturers sohc technology is predominant among the five largest least expensive brands (Figure 3‑17) sales of vehicles with more advanced Dohc technology grew in 2013 by almost 36 with respect to 2012 albeit from a relatively smaller base this increase was experienced in all vehicle segments but in different magnitudes
although global data on this technology are scarce Figure 3‑18 indicates that most countries are moving away from sohc with Brazil being the only country analyzed where sohc is still predominant no data were available for the us or europe
24
Brazil Passenger Vehicle Market statistics
0
10
20
30
40
50
60
70
80
90
100
Subco
mpac
t
Compac
t
Medium
Larg
eSport
O-Road SUV
Miniva
nTo
tal
Tech
nolo
gy
shar
e
nd DOHC SOHC
Figure 3‑16 ndash Valve camshaft configuration by segment (nd no data)
0
10
20
30
40
50
60
70
80
90
100
Fiat GM
Volkswag
enFord
Renau
lt
Hyund
ai
Honda
Toyo
taPSA
Nissan
Mitsub
ishi
KIAJA
CBMW
Land
Rove
r
Merce
des-B
enz
Chery
Audi
Suzuk
iJe
epTo
tal
Tech
nolo
gy
shar
e
nd DOHC SOHC
Figure 3‑17 ndash Valve camshaft configuration by manufacturer (nd no data)
0
10
20
30
40
50
60
70
80
90
100
China2010
Korea2011
Japan2011
India2012
Brazil2013
Tech
nolo
gy
shar
e
nd OVC DOHC SOHC
Figure 3‑18 ndash Valve camshaft configuration international comparison (nd no data)
25
ICCT white paper
VaLVE aCTUaTiON improved valvetrain systems with variable valve actuation (VVa) technology either variable valve timing (VVt) or variable valve timing and lift (VVt+VVl) improves the enginersquos volumetric and thermodynamic efficiency they also enable further engine improvements such as internal exhaust gas recirculation and cylinder deactivation VVt alters the timing of the intake valve exhaust valve or both primarily to reduce pumping losses increase specific power and control residual exhaust gases VVl increases efficiency by optimizing airflow over a broader range of engine operation which reduces pumping losses and increases specific power VVl is accomplished by controlled switching between two or more cam profile lobe heights the most advanced technology VVt+VVl yields a wide range of performance optimization and volumetric efficiency including enabling the engine to be valve-throttled (no need for intake throttle) VVt provides energy consumption gains of 3 to 5 while the more flexible and complex VVt+VVl system can reach 4 to 8 (ePa amp nhtsa 2010)
VVa technology either VVt or VVt+VVl are emerging technologies in Brazil where most vehicles still have fixed-valve timing designs (Table 3‑1) Fixed technology is predominant among the smaller vehicle segments as well as suVs and minivans (Figure 3‑19) the five largest manufacturers sold more than 90 of their vehicles with fixed-valve technology in 2013 (Figure 3‑20) the international comparison indicates that only Brazil and india have not yet adopted VVa technologies for most of their light-duty fleet (Figure 3‑21)
VVt and VVt+VVl are being adopted across all segments including the subcompact segment but tend to be more predominant in high-end manufacturers a closer examination by manufacturer shows that most are offering some vehicles with either one of the VVa systems while honda and hyundai offer this technology in almost all vehicles (Figure 3‑20) honda is the technology leader in variable valve actuation with the adoption in the early 1990s of the Vtec system (Valve timing electronic control) VVt technologyrsquos market share grew by about 25 in 2013 primarily due to hyundairsquos sales from 80000 units in 2012 to almost 200000 units in 2013 hyundai offered the continuously variable valve technology (cVVt) in the large majority of vehicle sold in 2013 the sports segment is the one where VVt dominates the market Mitsubishi BMW and audi are also selling a large share of their vehicles with the VVt+VVl technology
26
Brazil Passenger Vehicle Market statistics
0
10
20
30
40
50
60
70
80
90
100
Subco
mpac
t
Compac
t
Medium
Larg
eSport
O-Road SUV
Miniva
nTo
tal
Tech
nolo
gy
shar
e
VVT+VVL VVT Fixed
Figure 3‑19 ndash Valve actuation by segment
0
10
20
30
40
50
60
70
80
90
100
Fiat GM
Volkswag
enFord
Renau
lt
Hyund
ai
Honda
Toyo
taPSA
Nissan
Mitsub
ishi
KIAJA
CBMW
Land
Rove
r
Merce
des-B
enz
Chery
Audi
Suzuk
iJe
epTo
tal
Tech
nolo
gy
shar
e
VVT+VVL VVT Fixed
Figure 3‑20 ndash Valve actuation by manufacturer
VVT+VVL VVT Fixed
0
10
20
30
40
50
60
70
80
90
100
China2010
Korea2011
US2013
Japan2011
India2012
Brazil2013
Tech
nolo
gy
shar
e
Figure 3‑21 ndash Valve actuation international comparison
27
ICCT white paper
FUEL SYSTEMS FOR GaSOLiNE VEhiCLESVehicle fuel systems describe the technology required to deliver fuel into the engine combustion chamber this section examines two gasolineflex technologies namely multi-point fuel injection (MPFi) and gasoline direct injection (gDi) MPFi is now the most common fuel-delivery system for gasoline engines used in passenger vehicles worldwide in sequential MPFi engines fuel is injected into the air stream next to the intake valve port while the intake valve is open to draw the air-fuel mixture into the cylinder some of the fuel is vaporized on the surface of the hot intake valve expanding and thus reduces the volumetric efficiency on gDi engines fuel is injected at high pressure directly into the combustion chamber improving volumetric efficiency and providing cooling of the airfuel charge within the cylinder which allows for higher compression ratios and increased thermodynamic efficiency gDi technology alone offers benefits of 2 to 5 with respect to MPFi engines but bigger benefits rely on the synergy between gDi turbocharging and downsizing which can reach 12 to 15 energy consumption reduction with respect to a MPFi naturally aspirated engine (ePa 2012)
Table 3‑1 illustrates that MPFi is still the most common fuel injection technology for gasolineflex vehicles in Brazil which is reflected in its dominant share across most segments except for sports and off-road vehicles in Brazil gDi has found a niche market in the sports and off-road segments with more than 90 of sport vehicles fitted with gDi technology (Figure 3‑22) Within the overall gasoline market the gDi technology is still an emerging technology representing just 24 of new sales gDirsquos market share increased by 31 in 2013 with all but 4000 units being imported among the 10 largest manufacturers the adoption of gDi is extremely low below 5 for Volkswagen Ford hyundai and Psa (Figure 3‑23) high-end european brands (audi land rover Mercedes-Benz and BMW) are the technology leaders in terms of gDi adoption rates echoing the trend of turbocharging technology sales Volkswagen vehicles with gDi systems account for less than 35 of their sales in 2013 but their absolute numbers (around 19000 vehicles) place the company as one of the leaders in gDi technology in the Brazilian market
From a global market perspective the penetration of gDi technology in Brazil is low compared to all other markets in Figure 3‑24 except for india and japan it should be noted that the later has the largest share of hybrid vehicles around the globe
28
Brazil Passenger Vehicle Market statistics
0
10
20
30
40
50
60
70
80
90
100
Compac
t
Subco
mpac
t
Medium
Larg
eSport
O-Road SUV
Miniva
nTo
tal
Tech
nolo
gy
shar
e
GDI MPFI
Figure 3‑22 ndash gasolineflex fuel system by segment
GDI MPFI
0102030405060708090
100
Fiat GM
Volkswag
enFord
Renau
lt
Hyund
ai
Honda
Toyo
taPSA
Nissan
Mitsub
ishi
KIAJA
CBMW
Land
Rove
r
Merce
des-B
enz
Chery
Audi
Suzuk
iJe
epTo
tal
Tech
nolo
gy
shar
e
Figure 3‑23 ndash gasolineflex fuel system by manufacturer
GDI MPFI
0
10
20
30
40
50
60
70
80
90
100
China2010
Korea2011
EU-272013
US2013
Japan2011
India2012
Brazil2013
Tech
nolo
gy
shar
e (n
on-
die
sel)
Figure 3‑24 ndash gasolineflex fuel system international comparison
29
ICCT white paper
TURBOChaRGiNGengine power is primarily limited by the rate at which the engine is able to draw air into the combustion chamber turbocharging and supercharging are two methods to increase the amount of air drawn into the engine above the level of what is possible with the naturally aspirated process (through the expansion of the cylinders) By increasing the amount of air into the engine the amount of fuel can be proportionally increased resulting in increased power output level and with it the ability to reduce engine displacement while maintaining performance the combination of turbocharging and downsizing in spark ignited (gasoline and flex-fuel) vehicles can provide energy consumption improvements between 2 to 6 with respect to a direct-injected gDi engine (ePa amp nhtsa 2010) turbocharging technology is the cornerstone for achieving better energy consumption in vehicles as the basis for downsizing and reducing the engine weight while keeping the same or better vehicle performance (ie acceleration or time to reach certain speed) although turbochargers are used in diesel and gasolineflex vehicles the analysis in this report focuses on turbocharging for spark-ignited gasolineflex vehicles only
turbocharging is one of the most important emerging technologies in Brazil where most vehicles are still naturally aspirated (na) (Table 3‑1) turbocharging technology has increased the market share significantly between 2012 and 2013 by more than 65 albeit from a small base (from about 49000 to 81000 vehicles)
Most vehicles with turbocharging are sold in the sports and off-road segments as this technology also produces superior engine power output (Figure 3‑25) among the 10 largest manufacturers turbocharging is still below 10 of their sales (Figure 3‑26) Volkswagen and Ford despite having small relative sales of vehicles with turbocharging (less than 35) are the manufacturers with the highest total sales of vehicles with turbocharging audi land rover Mercedes-Benz and BMW are the technology leaders with more than 90 of vehicle sales in 2013
the penetration of turbo and supercharging technologies in Brazil is lower than in other countries with a larger gasoline fleet such as the us china and japan (Figure 3‑27) in Brazil 95 of diesel passenger vehicle sales have turbocharging technology
30
Brazil Passenger Vehicle Market statistics
0
10
20
30
40
50
60
70
80
90
100
Compac
t
Subco
mpac
t
Medium
Larg
eSport
O-Road SUV
Miniva
nTo
tal
Tech
nolo
gy
shar
e (n
on-
Die
sel)
Turbo NA
Figure 3‑25 ndash turbocharging for gasolineflex fuel vehicles by segment (NA naturally aspirated)
0102030405060708090
100
Fiat GM
Volkswag
enFord
Renau
lt
Hyund
ai
Honda
Toyo
taPSA
Nissan
Mitsub
ishiKIA
JACBMW
Land
Rove
r
Merce
des-B
enz
Chery
Audi
Suzuk
iJe
epTo
tal
Tech
nolo
gy
shar
e (n
on-
Die
sel)
Turbo NA
Figure 3‑26 ndash turbocharging for gasolineflex fuel vehicles by manufacturer (NA naturally aspirated)
0
10
20
30
40
50
60
70
80
90
100
China2010
Korea2011
EU-272013
US2013
Japan2011
India2012
Brazil2013
Tech
nolo
gy
shar
e (n
on-
die
sel)
Turbo NA
Figure 3‑27 ndash turbocharging for gasolineflex fuel vehicles international comparison (NA naturally aspirated)
31
ICCT white paper
4 vEhiCLE ENErGy CONSuMpTiON
this section analyzes the Brazilian new passenger vehicle energy consumption in 2013 although other metrics are more common (see box) vehicle energy consumption is presented in megajoules per kilometer (Mjkm) for consistency with Brazilrsquos inovar-auto policy in 2012 Brazilrsquos Ministry of Development industry and Foreign trade (MDic) adopted the inovar-auto policy with the aim of fostering industrial competitiveness through technology investments the policy includes a target for corporate average energy consumption (in Mjkm with vehicle curb weight as the attribute parameter) for vehicles sold in 2017
in the us canada Mexico and saudi arabia fleet-average fuel economy standards are defined as a function of vehicle footprint in the eu china japan south Korea and india vehicle weight is the attribute for the calculation of fleet-average targets in Brazil inovar-auto has defined its fiscal targets for vehicle energy consumption measured in megajoules per kilometer (Mjkm) as a function of vehicle weight
VEhiCLE ENERGY MEaSUREMENT UNiTS
Many metrics can be used to describe the amount of fuel energy or emissions generated by unit of distance traveled
Fuel economy measures distance traveled per unit of fuel consumed in Brazil kilometers per liter (kml) is the most common metric to describe vehicle efficiency but other units are used in different countries such as miles per gallon (mpg) in the us
Fuel consumption is the reciprocal of fuel economy and measures fuel consumed per distance traveled it is usually expressed in liters per 100 kilometers (l100 km) and it is used in europe for example
GhGCO2 emissions measures ghg or co2 emissions per distance traveled expressed as grams of pollutant per kilometer or mile
Energy consumption (EC) measures the energy consumed per distance traveled for example in megajoules per kilometer Despite being a less common metric it is sometimes preferred for being a fuel-neutral metric across different types of fuel and vehicle technologies Vehicle energy consumption in Mjkm is the metric used in Brazilrsquos inovar-auto policy to quantify the corporate average energy consumption target for each manufacturer Values for energy consumption in Brazilian spark-ignited vehicles are provided for e22 since that is the fuel mixture used in vehicle tests
Vehicle energy consumption in this report is calculated from co2 emissions data in the Brazilian institute of environment and renewable natural resources (iBaMa) nota Verde program (iBaMa 2014) which reports official emissions data from homologation tests Data are limited to passenger cars sold by the top 10 manufacturers with light commercial vehicles being excluded appendix D presents a description of data sources
32
Brazil Passenger Vehicle Market statistics
and calculation methodologies as well as a discussion of vehicle energy consumption data quality and completeness in Brazil
not surprisingly vehicle energy consumption increases with vehicle footprint and engine rated power the two parameters that define vehicle segments in Brazil (Figure 4‑1) subcompact and compact vehicles which accounted for about 45 of new sales in 2013 have average energy consumption below the fleet average while medium-sized vehicles which hold the largest market share (388) have energy consumption just above the fleet average larger more powerful vehicles consume more energy than the fleet average but have a considerably smaller market share (combined share of 163) Data availability for these segments is not as extensive as the data available for the subcompact compact and medium segments which could affect the relative rankings of each segment
Ene
rgy
cons
ump
tio
n (M
Jkm
)
Subco
mpac
t
Compac
t
Medium
Larg
e
O-road SUV
4000
200000
400000
600000
850000
35
30
25
20
15
10
05
0
Sales
Total 202
Figure 4‑1 ndash new vehicle sales-weighted average energy consumption by segment (2013)
33
ICCT white paper
Figures 4‑2 and 4‑3 illustrate new vehicle energy consumption for multiple weight and footprint bins For each weight bin (in 100 kg increments) and footprint bin (in 01 m2 increments) sales-weighted averages of energy consumption for each vehicle version are presented (dashes) generating energy consumption ranges for each bin (cream areas) Vehicle sales by bin are presented for reference in the lower charts
the strong correlation between vehicle energy consumption and weight follows from the strong physical relationship between the weight of the vehicle and the energy required to accelerate it and overcome resistances9 (Figure 4‑2) Data dispersion within each bin suggests that energy consumption varies due to other vehicle characteristics that affect vehicle aerodynamics and rolling resistance as well as the adoption of technologies that affect engine and transmission efficiency (eg friction reduction technologies gDi VVt)
Curb weight (kg)
SubcompactCompactMediumLargeO-roadSUV
Ene
rgy
cons
ump
tio
n (M
Jkm
)Sa
les
5
6
4
3
2
1
600k
800k
400k
200k
0k800 900 1000 1100 1200 1300 1400 1500 1600 1700 1800 1900 2000 2100
Figure 4‑2 ndash new vehicle energy consumption by vehicle weight (2013)
9 on a plain surface the sum of resistances of a vehicle is acceleration resistance + rolling resistance + aerodynamic resistance = c1 m a + c2 frr m + c3 cw a v2 with mass (m) as an integral part of both acceleration and rolling resistance which are most relevant for inner-city driving situations other factors are acceleration (a) rolling resistance of tires (frr) aerodynamic coefficient of the vehicle (cw) frontal area of vehicle (a) velocity (v) and constants (cx)
34
Brazil Passenger Vehicle Market statistics
Footprint has a reasonable correlation with energy consumption (Figure 4‑3) ie larger vehicles tend to consume more fuel than smaller vehicles however the correlation is not as strong as with vehicle weight similar to the previous figure the broad spread of energy consumption values suggests a combination of different vehicle characteristics (eg weight engine displacement rated power) and technologies (eg transmissions fuel systems) as well as the presence of suVs and off-road vehicles among the medium- and large-sized footprint values respectively
Footprint (m2)
SubcompactCompactMediumLargeO-roadSUV
Ene
rgy
cons
ump
tio
n (M
Jkm
)Sa
les
5
6
4
3
2
1
400k
500k
300k
200k
100k
0k31 32 33 34 35 36 37 38 39 40 41 42 43 44 45 46 48 49
Figure 4‑3 ndash new vehicle energy consumption by vehicle footprint (2013)
35
ICCT white paper
Figure 4‑4 illustrates sales weighted average for new vehicle energy consumption by mass for the top 10 manufacturers in Brazil in 2013 Bubble sizes are proportional to total vehicle sales Manufacturers in the lower-left quadrant produce the lightest and most efficient vehicles with hyundai presenting the best overall average energy consumption renault in the upper-left quadrant produces vehicles that are equivalent in weight but on average with higher energy consumption in the lower-right quadrant are manufacturers that produce relatively heavier vehicles but with lower energy consumption in their weight class Despite producing heavier vehicles on average than many manufacturers honda achieves lower energy consumption on average in the upper-right quadrant are manufacturers that produce on average the heavier and least efficient vehicles with Psa (citroen and Peugeot) producing the heaviest and least efficient cars on average a regression line correlating vehicle energy consumption and mass highlights the best performers (hyundai honda and nissan) average performers (Fiat Volkswagen gM and toyota) and those performing worse than average (renault Ford and Psa)
FIA
GMVW
FORREN
HYU
HON
TOY
PSA
NIS
160
170
180
190
200
210
220
230
240
250
950 1000 1050 1100 1150 1200 1250 1300 1350
Ene
rgy
cons
ump
tio
n (M
Jkm
)
Curb weight (kg)
Fleet Ave
Figure 4‑4 ndashaverage new vehicle sales-weighted energy consumption by manufacturer (2013)
36
Brazil Passenger Vehicle Market statistics
Figure 4‑5 shows fleet-average energy consumption based on certification and type approval data for new vehicles in multiple countries converted to the us caFe combined driving cycle Bubble sizes represent total sales of new passenger cars Because of data availability in different countries the country comparison is based on different calendars years for different countries 2011 for south Korea and japan 2012 for china and india and 2013 for europe the us and Brazil given annual improvements in vehicle energy consumption triggered by regulatory efficiency standards and fiscal incentives those countries with older data could be at a slight disadvantage in this comparison
With the heaviest vehicles on average the us fleet is also the most energy consuming of all countries china and south Korea have similar average energy consumption but since south Korean vehicles are heavier on average they are relatively more efficient than chinese vehicles although Brazilrsquos fleet consumes less fuel on average than those from the us china and south Korea its fleet is relatively inefficient when compared to countries with vehicles of similar weight (japan and india) the average Brazilian vehicle consumes about 34 more energy than the average vehicle in japan whose fleet has a large penetration of gasoline hybrid and advanced fuel-efficiency technologies such as three-cylinder engines VVa Dohc and 6-plus speed transmissions european vehicles are the best performing on average despite being heavier than all countries with the exception of the us and south Korea the adoption of fuel-efficiency technologies (eg Dct 6-plus-speed transmissions gDi turbocharging) contributes to europersquos better than average performance
China2012
SKorea2011
Europe2013
US2013
Japan2011
India2012
Brazil2013
Sales5 MM10 MM
14
16
18
20
22
24
26
28
1000 1100 1200 1300 1400 1500 1600 1700
Ene
rgy
cons
ump
tio
n ndash
CA
FE
(M
Jkm
)
Curb weight (kg)
Type-approval and certification energy consumption data only (does not include o-cycle or real-world driving data)
Figure 4‑5 ndash international comparison of passenger car energy consumption
Country labels indicate the dataset year
Figure 4‑6 provides a more detailed country comparison by illustrating average vehicle energy consumption by vehicle (curb) weight bin Vehicle sales in each bin are shown for reference the us is not shown due to lack of detailed model-by-model data Brazilrsquos vehicles on average have the highest energy consumption in most weight
37
ICCT white paper
bins with china being the second highest in most bins Because china has higher fuel consumption than Brazil on the 1000 bin which represents the highest share of vehicle sales fleet-average energy consumption in china is still higher than in Brazil as illustrated in the previous figure europe consistently performs best in terms of vehicle energy consumption in most weight bins with japan also performing relatively well
Curb weight (kg)
BrazilChinaEuropeIndiaJapanSouth Korea
Ene
rgy
cons
ump
tio
n C
AF
E (
MJ
km)
Sale
s
40
35
25
20
15
10
6M
8M
4M
2M
0M600 800 1000 1200 1400 1600 1800 2000 2200 2400
Figure 4‑6 ndash international comparison of average vehicle energy consumption by vehicle weight
Type-approval and certification energy consumption data only (does not include off-cycle or real-world driving data)
38
Brazil Passenger Vehicle Market statistics
Figure 4‑7 illustrates the distribution of energy consumption data in Brazil for each vehicle version by mass and segment Bubble sizes represent total sales of each version Data were limited to flex-fuel vehicles in the subcompact compact medium and large segments due to its relatively better data quality and representativeness (ie they represented over 87 of sales in 2013) While most vehicles follow a predictable trend that correlates energy consumption and vehicle mass there are a large number of versions with energy consumption substantially higher than the trend line this suggests there is substantial room for improvements in their energy consumption since there are vehicles in similar weight classes with substantially superior energy consumption performance
Sales1000050000
140
160
180
200
220
240
260
280
700 800 900 1000 1100 1200 1300 1400 1500 1600
Ene
rgy
cons
ump
tio
n (M
Jkm
)
Curb weight (kg)
Subcompact Compact Medium Large Fleet average
Figure 4‑7 ndash Distribution of new Brazilian passenger vehicle energy consumption data by vehicle weight and segment (2013)
this chapter suggests that there are potential improvements in vehicle energy consumption for the Brazilian fleet For similar vehicles in terms of weight class footprint or engine rating there is substantial dispersion in energy consumption indicating that there are vehicles performing much worse than the average across manufacturers there is also a clear trend of some manufacturers performing much better than the average while others have a lot more room for improvement the international comparison clearly shows that Brazilian vehicles perform much worse in terms of energy consumption than vehicles of similar weight suggesting a delay in the adoption of energy efficient technologies among Brazilian vehicle manufacturers
Finally a more detailed analysis of vehicle versions clearly illustrates a considerable number of vehicle versions significantly above average thus indicating potential improvements in energy consumption that would place them on par with better performing vehicles with similar characteristics
39
ICCT white paper
Deficiencies in data quality and completeness prevent more definite conclusions about vehicle energy consumption gasoline-only vehicles in particular have poor energy consumption data quality although they represent a relatively small fraction (6) of total vehicles sold in 2013 Because some vehicle segments are primarily composed of gasoline-only vehicles (eg sports minivans) this chapter excludes these segments from the analysis there are also concerns about the gap between energy consumption data reported by iBaMarsquos nota Verde and Brazilrsquos national institute of Metrology standardization and industrial Qualityrsquos (inMetro) labeling program (PBeV using its acronym in Portuguese) with the latter reporting consistently lower values of vehicle energy consumption
Finally the availability of energy consumption data was not adequate for many manufacturers beyond the top 10 sales group which prevented their inclusion in this analysis Despite the data quality and lack of completeness the energy consumption data in this chapter include data that are reasonably accurate and representative thus supporting its interpretation
40
Brazil Passenger Vehicle Market statistics
rEfErENCES
aDK automotive consultoria de Marketing (2013) relatoacuterios de volumes de vendas do mercado brasileiro para veiacuteculos de passeio e comerciais leves referentes a 2013
alves l Wilbert M (2014) reduccedilatildeo do imposto sobre Produto industrializado e a Venda de automoacuteveis Xi congresso usP iniciaccedilatildeo cientiacutefica em contabilidade
associaccedilatildeo nacional de transportes Puacuteblicos (antP 2014) estudo mostra baixo efeito do desconto no iPi de veiacuteculos sobre PiB e emprego available at httpwwwantporgbrwebsitenoticiasshowaspnpgcode=a4DeeFe8-a7BF-48D3-B1F5-8eDe1447BF10
associaccedilatildeo nacional dos Fabricantes de Veiacuteculos automotores (anFaVea 2015) anuaacuterio da induacutestria automobiliacutestica Brasileira 2015 Brazilian automotive industry Yearbook 2015 satildeo Paulo available at wwwanfaveacombr
european environment agency (2014) Monitoring co2 emissions from new passenger cars in the eu summary of data for 2013 april 2014
instituto Brasileiro do Meio ambiente e dos recursos naturais renovaacuteveis (iBaMa 2014) consulta dos niacuteveis de emissatildeo dos veiacuteculos novos brasileiros available at httpsservicosibamagovbrctfpublicosel_marca_modelo_rvepphp
international council on clean transportation (icct 2015) global passenger vehicle standards available at httpwwwtheicctorginfo-toolsglobal-passenger-vehicle-standards
international energy agency (iea 2015) renewables Bioenergy available at httpswwwieaorgtopicsrenewablessubtopicsbioenergy
Korea energy Management corporation (KeMco 2014) Fuel economy regulation available at httpwwwkemcoorkrnew_engmainmainasp
Marklines (2015) Marklines automotive industry Portal available at httpwwwmarklinescomen
Mendonccedila M sachsida a (2014) Modelando a demanda de creacutedito para veiacuteculos no Brasil uma abordagem com mudanccedila de regime iPea
Ministeacuterio do Desenvolvimento induacutestria e comeacutercio exterior (MDic 2013) Programa de incentivo agrave inovaccedilatildeo tecnoloacutegica e adensamento da cadeia Produtiva de Veiacuteculos automotores mdash inovar-auto httpwwwplanaltogov brccivil_03_ato2011-20142012DecretoD7819htm
stein r anderson j and Wallington t (2013) an overview of the effects of ethanol-gasoline Blends on si engine Performance Fuel efficiency and emissions SAE Int J Engines 6(1)470-487 2013 doi1042712013-01-1635
us environmental Protection agency and national highway traffic safety administration (ePanhtsa 2010) Final rulemaking to establish light-Duty Vehicle greenhouse gas emission standards and corporate average Fuel economy standards ePa-420-r-10-901
us environmental Protection agency (ePa 2012) regulatory impact analysis Final rulemaking for 2017-2025 light-Duty Vehicle greenhouse gas emission standards and corporate average Fuel economy standards ePa-420-r-12-016
41
ICCT white paper
us national academy of sciences (nas 2011) assessment of Fuel economy technologies for light-Duty Vehicles available at httpwwwnapeducatalog12924assessment-of-fuel-economy-technologies-for-light-duty-vehicles
World Bank group (2015) World Development indicators available at httpdataworldbankorgdata-catalogworld-development-indicators
42
Brazil Passenger Vehicle Market statistics
LiST Of ACrONyMS
4wD Four-wheel drive
aNFaVEa Brazilian association of automobile Manufacturers
awD all-wheel drive
BRiC Brazil russia india china
CaFE corporate average fuel economy
CBG compressed biogas
CO2 carbon dioxide
CVT continuously variable transmission
CVVT continuously variable valve technology
DCT Dual-clutch transmission
DOhC Dual overhead camshaft
EC energy consumption
Epa us environmental Protection agency
EU european union
FFV Flex-fuel vehicle
FTp Federal test procedure
FwD Front-wheel drive
GDi gasoline direct injection
GDp gross domestic product
GhG greenhouse gas
GM general Motors
iBaMa Brazilian institute of the environment and renewable natural resources
iC internal combustion
iCCT international council on clean transportation
iNMETRO national institute of Metrology standardization and industrial Quality
Kg Kilogram
Km Kilometer
Kw Kilowatt
LDV light-duty vehicle
LpG liquified petroleum gas
MDiC Ministry of Development industry and Foreign trade
MJ Megajoule
MpFi Multi-point fuel injection
Mpg Miles per gallon
NaS us national academy of sciences
43
ICCT white paper
NhTSa us national highway transportation safety administration
OhV overhead valve
pBEV Brazilian Vehicle labeling Program
pSa Psa Peugeot citroeumln
pTwR Power-to-weight ratio
pV Passenger vehicle
RwD rear-wheel drive
SOhC single overhead camshaft
SUV sport utility vehicle
US united states
USD us dollar
VTEC Valve timing electronic control
VVa Variable valve actuation
VVL Variable valve lift
44
Brazil Passenger Vehicle Market statistics
AppENDix A SEGMENT DEfiNiTiONS
Table a‑1 ndash segment definitions
Segmentpower (kw)
pTwR (kwkg) area (m2)
Other characteristics Examples
Subcompact lt 140 lt 0075 le 65 mdash Mini cooper chevrolet celta smart Fortwo
Compact lt 140 lt 0075 65 lt area le 70 mdash honda Fit hyundai hB20 Volkswagen Polo
Medium lt 140 lt 0075 70 lt area le 80 mdash honda civic nissan tiida Peugeot 308
Large lt 140 lt 0075 gt 80 mdash audi a4 BMW 3 series Mercedes c-class
Sports gt 140 gt 0075 mdash 4 seats maxjaguar XF lamborghini gallardo Ferrari california
Off‑road mdash mdash lt 80 traction = 4WDjeep cherokee honda cr-V BMW X3 hyundai santa Fe
SUV mdash mdash lt 80Based on aDKrsquos default classification
BMW X1 Ford ecosport hyundai tucson
Minivan mdash mdash Passengers 6-12
citroen grand Picasso Kia carnival
45
ICCT white paper
AppENDix b iNTErNATiONAL MArKET DATA
Table B‑1 ndash international market comparison of new fleet characteristics
parameters China S Korea EU US Japan india Brazil
Year 2012 2011 2013 2013 2011 2012 2013
Sales (million) 155 13 118 156 352 256 304
price (USD) $21008 $21383 $24439 mdash $20637 $11717 $22015
No of cylinders mdash 43 40 47 38 36 40
Displacement (cc) 1605 1960 1613 2606 1425 1294 1430
Curb weight (kg) 1296 1421 1391 1623 1193 1059 1106
Length (mm) 4323 4531 4263 mdash 4013 3859 4100
Footprint (m2) 38 420 40 425 371 341 367
Engine power (kw) 86 120 89 148 78 55 76
pTwR (kwkg) 00664 00844 00640 00912 00654 00519 00671
Energy consumption ndash US CaFE (MJKm)[1] 235 206 169 250 171 183 202
[1] energy consumption data presented here for countries other than Brazil were obtained from local official sources in its original metric and drive cycle and then converted to Mjkm under the us caFe drive cycle using the methodology described in Yang (2015) Mode details and historical fuel consumption data on their original metrics is presented in the icctrsquos global PV standard website httpwwwtheicctorginfo-toolsglobal-passenger-vehicle-standards
Data Sources
China Ministry of industry and information technology (Miit 2014) corporate average Fuel efficiency accounting Method for Passenger cars available at httpwwwgovcngzdt2013-0320content_2358627htm
Baseline performance china automotive research and technology center through internal communication and icct internal 2010 database for chinese light-duty vehicles
S Korea internal communication with s Korean official and from greencarcongress available at httpwwwgreencarcongresscom200906korea-20090604html
EU european environment agency (2014) Monitoring co2 emissions from new passenger cars in the eu summary of data for 2013 april 2014
US us ePa (2014) light-duty automotive technology carbon dioxide emissions and fuel economy trends1975 through 2014 table 91 page 110 available at http httpwwwepagovfueleconomyfetrends1975-2014420r14023apdf
Japan jaMa (2010) the Motor industry of japan available at httpwwwjama-englishjppublicationsMVs2010pdf Mlit httpwwwmlitgojpcommon000990330pdf
india Bureau of energy efficiency white paper 2010-2012 calculation based on icct database
Brazil icct Brazil Vehicle Database (2013)
46
Brazil Passenger Vehicle Market statistics
Table B‑2 ndash international market comparison of technology adoption in new vehicles
Technology adoption China S Korea EU US Japan india Brazil
Year 2010 2011 2013 2013 2011 2012 2013
Fuel type
CBGLpGFlex 0 11 2 0 0 4 94
Gasoline 99 65 44 93 86 56 6
hybrid 0 1 1 5 13 0 0
Diesel 1 23 53 1 0 40 0
No of cylinders
Two 0 0 0 0 0 6 0
Three 4 0 7 0 36 28 3
Four 90 84 87 56 57 65 97
Five 0 0 1 0 0 0
Six 6 15 4 32 5 0 1
Eight or more 0 0 0 12 1 0 0
Transmission
Manual 60 3 83 5 1 98 83
automatic 34 90 9 75 34 2 15
CVT 5 7 2 18 65 0 1
DCT 1 0 6 2 mdash 0 1
Number of gear ratios
Four or fewer 13 16 1 7 mdash 10 6
Five 68 9 45 11 mdash 85 83
Six or more 19 75 54 82 mdash 5 11
Drivetrain
FwD 74 86 81 83 59 76 0
RwD 21 7 7 10 5 22 0
4wD and awD 5 7 12 7 36 2 100
No of valves per cylinder
Two 17 mdash mdash 2 4 25 60
Multi valve 83 mdash mdash 98 95 75 40
Valve camshaft configuration
Single overhead camshaft 26 1 mdash mdash 16 41 63
Dual overhead camshaft 74 84 mdash mdash 82 53 25
Overhead camshaft mdash 15 mdash mdash 0 6 mdash
Valve actuation
Fixed 50 16 mdash 2 11 86 78
VVT 44 84 mdash 98 89 12 16
VVL 6 mdash mdash mdash mdash 2 6
Fuel systems for gasoline vehicles
Multi‑point fuel injection 94 72 68 62 95 100 98
Gasoline direct injection 6 28 32 37 5 0 2
air induction systems for gasoline vehicles
Naturally aspirated 93 75 41 85 92 64 97
Supercharger turbocharger or twin‑turbo 7 25 59 15 8 36 3
47
ICCT white paper
AppENDix C NEW vEhiCLE ChArACTEriSTiCS AND TEChNOLOGy ADOpTiON DATA iN brAziL
Table C‑1 ndash Fleet characteristics of new Brazilian passenger vehicles by segment (2013)
parameters Subcompact Compact Medium Large Sports Off‑road SUV Minivan
Sales (thousands) 6785 6843 11790 1920 273 768 1997 23
Market share () 223 225 38 8 63 09 25 65 01
price (R$) $30103 $38732 $45496 $66508 $148834 $151284 $75164 $82284
No of cylinders 400 391 399 400 462 448 404 433
Displacement (cc) 1128 1293 1447 1794 2430 2586 1884 2244
Curb weight (kg) 940 1037 1102 1329 1561 1772 1395 1604
Length (mm) 3804 4026 4163 4499 4711 4516 4352 4658
Footprint (m2) 339 361 371 402 418 409 402 427
Engine power ndash gasoline (kw) 58 68 75 99 183 146 103 120
Engine power ndash ethanol (kw) 59 70 77 98 mdash 109 101 mdash
pTwR ndash gasoline (kwkg) 00614 00655 00671 00742 01173 00828 00731 00732
pTwR ndash ethanol (kwkg) 00630 00678 00697 00757 mdash 00766 00745 mdash
48
Brazil Passenger Vehicle Market statistics
Table C‑2 ndash Fleet characteristics of new Brazilian passenger vehicles by manufacturer (2013)
parameters Fiat
GM
Vo
lksw
agen
Ford
Ren
ault
hyu
ndai
ho
nda
Toyo
ta
pSa
Nis
san
Mit
sub
ishi
Kia
JaC
BM
w
Land
Rov
er
Mer
ced
es‑B
enz
Che
ry
aud
i
Suzu
ki
Jeep
Sales (thousands) 6087 5486 5448 3074 2207 2055 1392 1334 1163 621 368 255 158 141 106 94 80 67 63 36
Market share () 2002 1804 1792 1011 726 676 458 439 383 204 121 084 052 046 035 031 026 022 021 012
price (R$) $35017 $42259 $38701 $46174 $43447 $50112 $67078 $68922 $103001 $44035 $100696 $87009 $37654 $165111 $221943 $153281 $30821 $142799 $74769 $139039
No of cylinders 400 401 400 402 400 370 400 400 400 400 408 416 400 424 448 431 400 411 400 552
Displacement (cc) 1250 1340 1287 1497 1423 1495 1691 1808 1575 1579 2262 1856 1411 2095 2281 1934 1398 1912 1831 3182
Curb weight (kg) 1033 1060 1020 1156 1102 1122 1210 1201 1231 1069 1556 1377 1079 1624 1868 1598 1097 1551 1444 1945
Length (mm) 3965 4155 3993 4120 4127 4078 4319 4299 4116 4171 4401 4357 3956 4574 4487 4527 3896 4454 4234 4584
Footprint (m2) 345 370 354 368 378 383 397 387 376 379 395 407 351 429 433 429 349 417 323 420
Engine power ndash gasoline (kw) 64 71 65 79 73 86 96 90 80 82 120 112 83 151 179 138 71 136 94 162
Engine power ndash ethanol (kw) 65 72 65 79 76 85 97 90 81 82 107 106 95 mdash mdash mdash 75 mdash mdash mdash
pTwR ndash gasoline (kwkg)
00613 00662 00631 00674 00657 00739 00788 00745 00646 00766 00779 00792 00784 00921 00977 00856 00638 00870 00649 00835
pTwR ndash ethanol (kwkg) 00629 00681 00642 00693 00685 00781 00800 00795 00660 00768 00710 00798 00896 mdash mdash mdash 00659 mdash mdash mdash
49
ICCT white paper
Table C‑3 ndash Fleet characteristics of new Brazilian passenger vehicles by origin (2013)
parameters Domestic imported
Sales (thousands) 2537 504
Market share () 834 166
price (R$) $41739 $76049
No of cylinders 397 412
Displacement (cc) 1359 1791
Curb weight (kg) 1070 1289
Length (mm) 4063 4285
Footprint (m2) 362 390
Engine power ndash gasoline (kw) 70 102
Engine power ndash ethanol (kw) 73 84
pTwR ndash gasoline (kwkg) 0065 0076
pTwR ndash ethanol (kwkg) 0068 0074
50
Brazil Passenger Vehicle Market statistics
Table C‑4 ndash technology adoption in new Brazilian passenger vehicles by segment (2013)
Technology adoption Subcompact Compact Medium Large SportOff‑road SUV Minivan
Fuel type
Flex 982 988 982 837 00 134 826 00
Gasoline 18 12 17 163 996 540 174 1000
hybrid 0000 0000 0028 0000 0396 0001 0000 0000
Diesel 00 00 00 00 00 326 00 00
No of cylinders
Three 01 91 10 00 00 00 00 00
Four 999 909 990 998 758 775 979 833
Five 00 00 00 02 03 00 00 00
Six 00 00 00 00 175 211 21 167
Eight or more 00 00 00 00 63 13 00 00
Transmission
Manual 993 944 826 622 62 174 505 641
automatic 07 55 161 283 629 707 451 359
CVT 00 00 12 89 09 93 34 00
DCT 00 01 02 06 299 25 10 00
No of gear ratios
Four or fewer 04 47 72 51 00 34 247 193
Five 984 943 848 378 15 392 516 641
Six 12 09 73 515 796 462 225 167
Seven 00 01 06 23 87 53 12 00
Eight or more 00 00 01 32 102 59 00 00
Drivetrain
FwD 998 1000 997 688 550 00 916 1000
RwD 02 00 03 311 221 00 84 00
awD 00 00 00 01 229 1000 00 00
No of valves per cylinder
Two 806 694 584 195 00 00 258 00
Multi valve 194 306 416 805 1000 1000 742 1000
Valve camshaft configuration
Single overhead camshaft 839 786 709 309 00 212 375 00
Dual overhead camshaft 24 158 161 546 880 517 446 255
Valve actuation
Fixed 982 729 807 461 49 493 664 868
VVT 18 211 115 470 827 367 252 132
VVT+VVL 00 61 78 68 124 140 84 00
Fuel systems for gasoline vehicles
Multi‑point fuel injection 999 998 997 949 979 143 766 1000
Gasoline direct injection 01 02 03 51 21 857 234 00
air induction systems for gasoline vehicles
Naturally aspirated 999 997 995 943 974 369 543 1000
Supercharger turbocharger or twin‑turbo 01 03 05 57 26 631 457 00
51
ICCT white paper
Table C‑5 ndash technology adoption in new Brazilian passenger vehicles by manufacturer (2013)
Technology adoption Fi
aT
GM
VO
LKSw
aG
EN
FOR
D
REN
aU
LT
hY
UN
Da
i
hO
ND
a
TOYO
Ta
pSa
NiS
SaN
MiT
SUB
iSh
i
Kia
JaC
BM
w
LaN
D R
OV
ER
MER
CED
ES
Fuel type
Flex 990 987 965 966 997 921 999 886 928 998 283 739 31 42 00 00
Gasoline 10 09 35 34 03 79 01 35 72 02 557 255 969 957 663 950
hybrid 00 00 00 00 00 00 00 02 00 00 00 00 00 00 00 00
Diesel 00 04 00 00 00 00 00 77 00 00 160 06 00 00 337 50
No of cylinders
Three 00 00 05 00 00 348 00 00 00 00 00 00 00 00 00 00
Four 1000 996 994 989 1000 626 999 998 1000 1000 958 922 1000 906 787 878
Five 00 00 00 00 00 00 00 00 00 00 00 00 00 00 00 00
Six 00 02 01 11 00 26 01 02 00 00 42 78 00 68 185 87
Eight or more 00 02 00 00 00 00 00 00 00 00 00 00 00 26 28 35
Transmission
Manual 992 878 985 846 853 632 566 565 703 785 493 120 1000 02 00 151
automatic 08 103 00 137 62 285 355 160 297 121 118 793 00 575 18 14
CVT 00 19 15 16 41 70 01 246 00 00 139 87 00 423 982 836
DCT 00 00 00 00 43 13 78 30 00 94 251 00 00 00 00 00
No of gear ratios
Four or fewer 02 04 00 55 104 237 00 323 249 132 17 133 00 00 00 00
Five 981 811 963 839 797 623 861 643 684 828 530 107 1000 00 00 64
Six 17 185 29 106 99 140 139 07 67 40 453 754 00 217 800 00
Seven 00 00 07 00 00 00 00 27 00 00 00 00 00 08 00 936
Eight or more 00 00 00 00 00 00 00 00 00 00 00 06 00 775 200 00
Drivetrain
FwD 1000 902 989 972 987 985 990 892 1000 1000 496 623 1000 00 00 00
RwD 00 91 00 00 00 00 00 16 00 00 00 370 00 882 00 900
awD 00 06 11 28 13 15 10 92 00 00 504 07 00 118 1000 100
No of valves per cylinder
Two 811 864 988 745 220 00 00 00 00 00 00 00 00 00 00 00
Multi Valve 189 136 12 255 780 1000 1000 1000 1000 1000 1000 1000 1000 1000 1000 1000
Valve camshaft configuration
SOhC 836 755 914 675 832 00 04 00 497 398 331 00 00 00 00 00
DOhC 07 108 56 50 168 992 786 875 352 428 477 1000 907 810 860 453
Valve actuation
Fixed 1000 898 965 966 940 29 00 574 736 573 435 76 124 187 18 55
VVT 00 102 35 34 60 971 00 426 264 427 00 924 876 00 982 945
VVT+VVL 00 00 00 00 00 00 1000 00 00 00 565 00 00 813 00 00
air induction System
Naturally aspirated 997 994 966 977 997 988 1000 923 922 1000 835 936 1000 97 37 101
Supercharger turbocharger or twin‑turbo
03 06 34 23 03 12 00 77 78 00 165 64 00 903 963 899
Fuel systems for gasoline vehicles
Multipoint fuel injection 1000 995 965 972 1000 989 1000 1000 967 1000 994 1000 1000 78 15 158
Gasoline Direct injection 00 05 35 28 00 11 00 00 33 00 06 00 00 922 985 842
note Difference between 100 and summation of sohc and Dohc market share values corresponds to data not available
52
Brazil Passenger Vehicle Market statistics
AppENDix D DATA SOurCES AND COMpLETENESS
the basis of the statistics shown in this report is a database compiled by the icct with vehicle sales technical information (eg fleet characteristics technology content) and energy consumption (converted from either co2 emissions or fuel economy) from various data sources outlined in table D-1
Table D‑1 ndash Brazilian data sources
parameters Sales TechnicalEnergy
consumption
aDK (2014 2015) x x
MarkLines (2015) x
iBaMa (2014) x
iNMETRO (2014) x
UOL (2014) x
icarroscom (2014) x
this analysis examined energy consumption data from two public sources the nota Verde Program by the Brazilian institute of the environment and renewable natural resources (iBaMa) and the Brazilian Vehicle labeling Program (PBeV) by the national institute of Metrology standardization and industrial Quality (inMetro) table D-2 summarizes key differences between these two data sources
Table D‑2 ndash energy consumption data sources
iBaMa iNMETRO
program nota Verde1 Brazilian Vehicle labeling Program (PBeV)2
program description
Mandatory program that reports emissions of co2 co nox and nMhc as part of emissions certification program
Voluntary program since 2009 that allows the comparison of fuel economy across vehicle models
Unit gco2 km kml
Test cycle chassis testing under urban (FtP) driving cycle based on nBr 66012005
chassis testing under urban (FtP) and highway (hWYFe) driving cycles based on nBr 702420103
adjustment
no adjustment for real-world driving conditions Because reported co2 emissions are assumed to be zero for ethanol adjustments were made to account for tailpipe co2 emissions for vehicles running on ethanol
since 2010 published values include real-world adjustment factors to chassis test data a method adopted by the us ePa in 2008
Conversion to MJkm
iBaMarsquos data are reported as FtP (city test) co2 data in gco2 km conversion to caFe test cycle and to a different metric (Mjkm) involves four steps as presented in Figure D-1
inMetrorsquos data in kml are presented separately by fuel type (e22 e100) and driving cycle (urban highway) conversion to Mjkm was done by applying a conversion factor (2167 gco2 l for e22 and 1428gco2l for e00) caFe values are obtained by using a 5545 weighting for the urban (FtP) and highway cycles respectively
1 iBaMa (2014) nota Verde program available at httpwwwmmagovbrcidades-sustentaveisqualidade-do-arcontrole-de-emissoes-veicularesnota-verde
2 inMetro (2014) Programa Brasileiro de etiquetagem Veicular (PBeV) available at httpwwwinmetrogovbrconsumidortabelas_pbe_veicularasp
3 inMetro (2014) Metodologia Para Divulgaccedilatildeo De Dados De consumo Veicular available at httpwwwinmetrogovbrconsumidorpbeMetodologia_consumo_Veicularpdf
53
ICCT white paper
Step 1 Correcting the original IBAMA CO2 reported data ndash FTP CO2 gkm
IBAMArsquos CO2 reported values are corrected to account for tailpipe emissions from ethanol (tailpipe CO2 emissions are reported as zero in IBAMArsquos data)
bull E22 FTP reported CO2 data are reduced by 177bull E100 FTP reported CO2 data are reduced by 100
Flex fuel vehicles are tested with E22 and E00 the final values is calculated as the average of both fuelsCO2 IBAMA_Flex_FTP= 05(1-0177)CO2_E22_test_FTP + 050E100_FTP = 050823CO2_E22_FTPFor Gasoline only vehicles the tests are carried out only with Gasoline E22CO2 IBAMA_Gasoline_FTP = (1-0177) CO2_E22_Test_FTP
Where in the previous equations CO2_E22_FTP means CO2 emissions values obtained under FTP testingCO2 IBAMA_Flex_FTP means IBAMArsquos Corrected FTP values for flex vehiclesCO2 IBAMA_Gasoline_FTP means IBAMArsquos Corrected FTP values for gasoline only (E22) vehicles
INNOVAR AUTO is based on energy consumption data obtained as the combined CAFE test cycle This requires a weighted average of energy consumption data obtained from FTP testing (city driving ) and Highway fuel economy testing (HWFET) In mathematical form CAFE=f(FTPHWFET)
Given that IBAMA data is provided for only the first aprt the FTP testing then it is required to find a way to calculate CAFE combined values through FTP -75 only data A linear function was thus developed from data with FTP and HWY values (INMETRO data) is used to convert FTP only values to CAFE CO2 values ie CAFE=f(FTP) The function used for this conversion is
CO2_CAFE= (CO2_FTP+44756)11572
Step 2Convert FTP CO2 values to CAFE CO2 values
Converting CO2 values to MJkm values is done by using the energy density of E22 Note that all the previous calculations for CO2 come from E22-based data
bull The energy density of E22 is 2894 MJLE22bull E22 emits 2167gCO2LE22bull CAFE (MJkm) = CAFE (gCO2km) (2894 MJLE22 2167 gCO2LE22)
Step 3 Convert US CAFE CO2 values to MJkm values
Figure D‑1 ndash conversion of emission to energy consumption data
energy consumption values calculated from iBaMa and inMetro data differ greatly Figure D-1 illustrates energy consumption data for those models in both databases iBaMa data are on average 126 higher than inMetro data with a standard deviation of 89 and a maximum deviation of 39
54
Brazil Passenger Vehicle Market statistics
0
05
1
15
2
25
3
0 05 1 15 2 25 3
Ene
rgy
cons
ump
tio
n IB
AM
A (
MJ
km)
Energy consumption INMETRO (MJkm)
n=151
Figure D‑2 ndash comparison between energy consumption data from inMetro and iBaMa
151 vehicles tested under both programs
although inMetro data are more transparent as it breaks down fuel economy by fuel and test cycle it is still a voluntary program that allows manufacturers to select which models will participate in addition not all manufacturers participate in the program in turn iBaMa data only include co2 data for the urban cycle and thus energy consumption in the combined cycle had to be estimated from correlations using international data in addition corrections had to be made for gasoline-only engines since it seems that a co2 discount in theory only applicable to flex-fuel engines was also applied to gasoline-only engines Despite these data quality issues iBaMa data were considered the most adequate data source for energy consumption because it is a mandatory program that requires data reporting by all vehicle models and manufacturers
i
TAbLE Of CONTENTS
Executive Summary v
1 Market Overview1
2 Vehicle Fleet Characteristics 6
3 Vehicle Technology adoption 12
Fuel type 13
number of cylinders 15
transmission 17
number of gear ratios 19
Drivetrain 21
Valve camshaft configuration (Dohc vs sohc)23
Valve actuation 25
Fuel systems for gasoline Vehicles 27
turbocharging 29
4 Vehicle Energy Consumption 31
References 40
List of acronyms 42
appendix a Segment Definitions 44
appendix B international Market Data 45
appendix C New Vehicle Characteristics and Technology adoption Data in Brazil 47
appendix D Data Sources and Completeness 51
ii
ICCT white paper
LiST Of TAbLES
Table 1‑1 ndash Market characteristics of new Brazilian passenger vehicles5
Table 2‑1 ndash Fleet characteristics of new Brazilian passenger vehicles 7
Table 3‑1 ndash technology adoption in new Brazilian passenger vehicles 12
Table a‑1 ndash segment definitions 44
Table B‑1 ndash international market comparison of new fleet characteristics 45
Table B‑2 ndash international market comparison of technology adoption in new vehicles 46
Table C‑1 ndash Fleet characteristics of new Brazilian passenger vehicles by segment (2013) 47
Table C‑2 ndash Fleet characteristics of new Brazilian passenger vehicles by manufacturer (2013) 48
Table C‑3 ndash Fleet characteristics of new Brazilian passenger vehicles by origin (2013) 49
Table C‑4 ndash technology adoption in new Brazilian passenger vehicles by segment (2013) 50
Table C‑5 ndash technology adoption in new Brazilian passenger vehicles by manufacturer (2013) 51
Table D‑1 ndash Brazilian data sources 52
Table D‑2 ndash energy consumption data sources 52
iii
Brazil Passenger Vehicle Market statistics
LiST Of fiGurES
Figure ES‑1 ndash international comparison of technology penetration in passenger vehicles vi
Figure ES‑2 ndash international comparison of passenger fleet-average energy consumption vii
Figure 1‑1 ndash top 15 passenger vehicle markets worldwide 1
Figure 1‑2 ndash comparison of passenger vehicle sales and economic growth in Brazil 2
Figure 1‑3 ndash new registrations of one-liter engine vehicles 3
Figure 1‑4 ndash registrations of new passenger vehicles by fuel type 4
Figure 1‑5 ndash Market share of new passenger vehicles by manufacturer and segment (2013) 4
Figure 2‑1 ndash Fleet characteristics of new Brazilian passenger vehicles by segment (2013) 8
Figure 2‑2 ndash Fleet characteristics of new Brazilian passenger vehicles by manufacturer (2013) 9
Figure 2‑3 ndash Fleet characteristics of new Brazilian passenger vehicles by origin (2013) 10
Figure 2‑4 ndash international comparison of key new passenger vehicle characteristics 11
Figure 3‑1 ndash Fuel type by segment 14
Figure 3‑2 ndash Fuel type by manufacturer 14
Figure 3‑3 ndash Fuel type international comparison 14
Figure 3‑4 ndash number of cylinders by segment 16
Figure 3‑5 ndash number of cylinders by manufacturer 16
Figure 3‑6 ndash number of cylinders international comparison 16
Figure 3‑7 ndash transmission by segment 18
Figure 3‑8 ndash transmission by manufacturer 18
Figure 3‑9 ndash transmission international comparison 18
Figure 3‑10 ndash number of gear ratios by segment 20
Figure 3‑11 ndash number of gear ratios by manufacturer 20
Figure 3‑12 ndash number of gear ratios international comparison 20
Figure 3‑13 ndash Drivetrain by segment 22
Figure 3‑14 ndash Drivetrain by manufacturer 22
Figure 3‑15 ndash Drivetrain international comparison 22
Figure 3‑16 ndash Valve camshaft configuration by segment 24
Figure 3‑17 ndash Valve camshaft configuration by manufacturer 24
iv
ICCT white paper
Figure 3‑18 ndash Valve camshaft configuration international comparison 24
Figure 3‑19 ndash Valve actuation by segment 26
Figure 3‑20 ndash Valve actuation by manufacturer 26
Figure 3‑21 ndash Valve actuation international comparison 26
Figure 3‑22 ndash gasolineflex fuel system by segment 28
Figure 3‑23 ndash gasolineflex fuel system by manufacturer 28
Figure 3‑24 ndash gasolineflex fuel system international comparison28
Figure 3‑25 ndash turbocharging for gasolineflex fuel vehicles by segment 30
Figure 3‑26 ndash turbocharging for gasolineflex fuel vehicles by manufacturer 30
Figure 3‑27 ndash turbocharging for gasolineflex fuel vehicles international comparison 30
Figure 4‑1 ndash new vehicle sales-weighted average energy consumption by segment (2013) 32
Figure 4‑2 ndash new vehicle energy consumption by vehicle weight (2013) 33
Figure 4‑3 ndash new vehicle energy consumption by vehicle footprint (2013) 34
Figure 4‑4 ndashaverage new vehicle sales-weighted energy consumption by manufacturer (2013) 35
Figure 4‑5 ndash international comparison of passenger car energy consumption 36
Figure 4‑6 ndash international comparison of average vehicle energy consumption by vehicle weight 37
Figure 4‑7 ndash Distribution of new Brazilian passenger vehicle energy consumption data by vehicle weight and segment (2013)38
Figure D‑1 ndash conversion of emission to energy consumption data 53
Figure D‑2 ndash comparison between energy consumption data from inMetro and iBaMa 54
v
Brazil Passenger Vehicle Market statistics
ExECuTivE SuMMAry
Brazil has been one of the worldrsquos top five vehicle markets for six consecutive years and accounts for over half of all vehicles sold in latin america the Brazil Passenger Vehicle Market statistics report provides detailed information about vehicle characteristics technology adoption and energy consumption for passenger vehicles ndash automobiles sport utility vehicles (suVs) pick-up trucks and minivans ndash sold in Brazil in 2013 this study examines the adoption of vehicle efficiency technologies and their aggregate impact on vehicle energy consumption
Many countries have been investing heavily in vehicle technology development some of which have a direct impact on improvements in energy consumption this study provides a better understanding of how the Brazilian fleet compares to international fleets in the worldrsquos major vehicle markets ndash the european union (eu) china india japan south Korea and the united states (us) ndash in terms of technology adoption and energy consumption
there is currently a lack of vehicle data and analyses to support the adequate evaluation of public policies to encourage investments in vehicle technology and reductions in energy consumption in Brazil the inovar-auto policy adopted in 2012 aims at fostering industrial competitiveness through technology development and improvements in vehicle efficiency this study not only supports the strengthening of vehicle energy consumption targets set by inovar-auto but it also recommends further investments in technology deployment and energy consumption improvements and highlights the need for better data quality and availability
chapter 1 provides an overview of the Brazilian passenger vehicle market Brazil was the worldrsquos fifth largest market of passenger car sales in 2013 after china eu us and japan and ahead of india and south Korea similarly to many developing countries vehicle sales in Brazil decreased in 2014 (by 7) due to the economic downturn but Brazil continues to be amongst the top five passenger vehicle markets worldwide
Brazilrsquos passenger fleet is unique in many aspects through a combination of national investment and fiscal incentives Brazilrsquos new fleet consists primarily of flex-fuel cars that can be powered by either ethanol or gasoline in addition Brazil has long incentivized sales of one-liter engine cars which became the symbol of the Brazilian automotive industry in the 1990s reaching over 70 of sales in 2001 since then the share of one-liter engine cars has been dropping consistently (ie 36 in 2013) in favor of medium-sized vehicles with larger engines
chapter 2 includes key characteristics of the Brazilian passenger vehicle fleet including a comparison with other countries and regions including the eu china india japan south Korea and the us the report provides vehicle characteristics by segment and by the 20 largest manufacturers in Brazil on average the Brazilian fleet is smaller in size lighter and less powerful than all countries evaluated with the exception of india
chapter 3 examines the adoption of energy-saving technologies by segment and manufacturer comparing it to other countries this analysis concludes that Brazil lags behind most other vehicle markets in the adoption of such technologies (Figure ES‑1) although its penetration appears to be increasing over time these technologies which have a large potential to reduce vehicle energy consumption include hybrid
vi
ICCT white paper
engines downsized engines (eg three cylinders) continuously variable transmissions (cVt) dual-clutch transmissions (Dct) higher gear ratio transmissions (eg six and above) dual overhead camshafts (Dohc) variable valve actuation (VVa) technologies turbocharging and gasoline direction injection (gDi) the combination of gDi technology turbocharging and downsizing can result in up to 15 savings in energy consumption over the more predominant technologies commercialized in Brazil today hybrid systems can achieve substantially larger savings in energy consumption between 20 and 50 with respect to similar-sized vehicles
0 10 20 30 40 50 60 70 80 90 100
Technology Penetration ()
Europe 2013 Japan 2011 US 2013 S Korea 2011 China 2012 India 2012 Brazil 2013
3-Cylinder Eng
Transmission (DCT CVT)
Hybrids
+6 gears
DOHC
Turbocharging
GDI
VVA
Figure ES‑1 ndash international comparison of technology penetration in passenger vehicles
Country labels indicate the dataset year
chapter 4 examines vehicle energy consumption in new passenger cars Brazilrsquos fleet is on average more efficient than fleets in the us china and south Korea When compared to countries with vehicles of similar and even higher average weight Brazil has relatively inefficient vehicles (Figure ES‑2) Because of lower adoption rates of energyfuel efficiency technologies the average Brazilian vehicle consumes about 18 more energy than the average vehicle in japan even though Brazilian vehicles are on average 8 lighter than the average japanese car the japanese fleet has a large penetration of fuel-efficiency technologies such as three-cylinder engines variable valve actuation dual overhead camshafts and advanced transmissions as well as a large market of gasoline hybrids european vehicles also perform better despite weighing more than vehicles in the majority of other countries with the exception of the us and south Korea the adoption of fuel-efficiency technologies (eg Dct 6-speed transmissions gDi turbocharging) contributes to europersquos above average performance
vii
Brazil Passenger Vehicle Market statistics
it is also important to note that this comparison is limited to type-approval and certification data and does not include off-cycle or real-world adjustments
China2012
SKorea2011
Europe2013
US2013
Japan2011
India2012
Brazil2013
Sales5 MM10 MM
14
16
18
20
22
24
26
28
1000 1100 1200 1300 1400 1500 1600 1700
Ene
rgy
cons
ump
tio
n ndash
CA
FE
(M
Jkm
)
Curb weight (kg)
Type-approval and certification energy consumption data only (does not include o-cycle or real-world driving data)
Figure ES‑2 ndash international comparison of passenger fleet-average energy consumption
Country labels indicate the dataset year
this analysis suggests that there are potential reductions in vehicle energy consumption for the Brazilian fleet For similar vehicles in terms of weight class footprint or engine rating there is a significant range in energy consumption indicating that there are vehicles performing much worse than the average there is also a clear trend of some manufacturers performing much better than the average while others have a lot more room for improvement the international comparison clearly shows that Brazilian vehicles perform much worse in terms of energy consumption than vehicles of similar weight elsewhere indicating a delay in the adoption of energy-efficient technologies among Brazilian vehicle manufacturers Finally a more detailed analysis of vehicle versions clearly illustrates a considerable number above the average energy consumption this indicates potential improvements that would place those versions on par with the best performing vehicles with similar characteristics in Brazil
Because of the wide gap between Brazil and other major vehicle markets there is much potential for the introduction of energy-saving technologies Future analyses will need to evaluate the potential of these energy-saving technologies to reduce fuel consumption and emissions in Brazil together with a cost-benefit (payback) analysis of such technologies and a better understanding of barriers to technology penetration in addition improvements in data quality and completeness will be essential to improve the accuracy of these analyses
1
ICCT white paper
1 MArKET OvErviEW
Brazil was the fifth largest market worldwide for sales of new passenger vehicles in 2013 after china us eu and japan (Figure 1‑1) although the Brazilian passenger vehicle market contracted by 8 in 2014 (with sales of 28 million new passenger vehicles) its relative ranking remained unaltered since other developing countries also experienced a decrease in sales annual average market growth rates during the last nine years for the group of Bric countries remained strong led by china (21) and followed by india (15) Brazil (10) and russia (10) although vehicle sales in developed markets ie eu us and japan increased from 2013 to 2014 these three markets have also experienced an overall contraction of around 2 between 2005 and 2013
40
170
153
50
14 1309
1609 05
11 0802 0 0
179
156
118
48
30 28 2617
13 12 11 09 07 07 07
0
20
40
60
80
100
120
140
160
180
200
China
US
EU
Japan
Brazil
Russia
India
Canad
a
S Kore
a
Indone
sia
Mexico
Austra
lia
Thaila
nd
Argen
tina
Turk
ey
Veh
icle
sal
es (
mill
ion)
2005 2013
Figure 1‑1 ndash top 15 passenger vehicle markets worldwide
US Canada and Mexico data include cars and light-duty trucks Source MarkLines vehicle databases
the growth in passenger vehicle sales in Brazil over the past decade was driven by a combination of national economic growth more favorable consumer credit policies and fiscal incentives from the government While gross domestic product (gDP) and vehicle sales have gone hand-in-hand from 1990 until the mid-2000s vehicle sales growth remained robust even in 2009 and after 2011 when economic growth faltered (Figure 1‑2) slower economic growth following the international financial crisis was offset by credit expansion and fiscal incentives to encourage vehicle sales although there is much debate regarding the effects of such fiscal incentives on vehicle sales and gDP (alves 2014 antP 2014 Mendonccedila 2014) it is widely acknowledged that fiscal incentives contributed to part of the recent growth in vehicle sales
2
Brazil Passenger Vehicle Market statistics
0
500
1000
1500
2000
2500
3000
00
05
10
15
20
25
30
35
199
0
199
1
199
2
199
3
199
4
199
5
199
6
199
7
199
8
199
9
200
0
200
1
200
2
200
3
200
4
200
5
200
6
200
7
200
8
200
9
2010
2011
2012
2013
GD
P (
bill
ion
curr
ent
US$
)
Veh
icle
sal
es (
mill
ion)
Figure 1‑2 ndash comparison of passenger vehicle sales and economic growth in Brazil
Sources ANFAVEA 2015 World Bank databases
one-liter engine vehicles have consistently lost market share since 2001 Brazil has historically encouraged the sales of small-engine vehicles through lower sales taxes From 1990 to 2001 one-liter engine automobiles became the symbol of the national automotive industry and their share in total sales increased from 4 to over 70 (anfavea 2015) in the 2000s the number of vehicle manufacturers in Brazil increased from 15 to 46 and the government started to provide tax incentives to flex-fuel cars independently of engine size Because of increasing competition amongst automakers a narrower gap between taxes for one-liter engine cars and flex-fuel cars and increasing consumer preference for more comfort and powerful engines the share of one-liter engine cars decreased to 36 in 2013 While the relative participation of one-liter engine cars has decreased total one-liter vehicle sales have increased continuously in the same period from 780000 units sold in 2001 to over 11 million in 2013 (Figure 1‑3)
3
ICCT white paper
0
10
20
30
40
50
60
70
80
90
100
00
02
04
06
08
10
12
14
16
18
20
199
0
199
1
199
2
199
3
199
4
199
5
199
6
199
7
199
8
199
9
200
0
200
1
200
2
200
3
200
4
200
5
200
6
200
7
200
8
200
9
2010
2011
2012
2013
10
L S
hare
New
10
L e
ngin
e ve
hicl
e re
gis
trat
ions
(m
illio
n)
Figure 1‑3 ndash new registrations of one-liter engine vehicles
Source ANFAVEA 2015
Due to a long-standing national program to stimulate ethanol consumption ethanol is sold as e100 (100 ethanol by volume) as well as being blended in gasoline the government sets the ethanol blend in commercial gasoline ranging from 20 to 27 ethanol depending on the current blend mandate (e20-e25 since 2011 and e27 in 2015) as a result biofuels in Brazil account for about 25 of road transport fuel demand compared to less than 35 globally (iea 2015)
ethanol availability at different blend levels has had a strong impact over consumer choices and technologies offered in the market by manufacturers until the 2000s sales of gasoline or ethanol vehicles were driven primarily by fuel prices with ethanol vehicles dominating sales in the 1980s and very strong sales of gasoline engines in the 1990s today flex-fuel engines those that can run on any combination of ethanol and gasoline are currently ubiquitous in new passenger vehicles since their introduction in 2003 flex-fuel engines now dominate the passenger vehicle market accounting for 94 of new sales in 2013 (Figure 1‑4) sales of new diesel passenger cars have been below 1 of total sales since 2005 (anFaVea 2015)
4
Brazil Passenger Vehicle Market statistics
0
10
20
30
40
50
60
70
80
90
100
198
019
81
198
219
83
198
419
85
198
619
87
198
819
89
199
019
91
199
219
93
199
419
95
199
619
97
199
819
99
200
020
01
200
220
03
200
420
05
200
620
07
200
820
09
2010
2011
2012
2013
Pas
seng
er c
ar f
uel m
arke
t sh
are
Gasoline Ethanol Flex
Figure 1‑4 ndash registrations of new passenger vehicles by fuel type
Source ANFAVEA 2015
the top seven manufacturers ndash Fiat general Motors (gM) Volkswagen Ford renault hyundai and honda ndash commanded a vast majority (83) of the entire market in 2013 with the remaining manufacturers accounting for less than 4 of market sales each (Figure 1‑5) the Volkswagen gol is the most popular vehicle in Brazil accounting for about 45 of all sales in 2013 Medium-sized vehicles dominate the market with 39 of all sales followed by compact and subcompact vehicles which together make up 84 of the entire market in addition domestically manufactured vehicles accounted for more than 83 of sales in 2013 which represented a small increase with respect to the previous year
FIAT20
GM18
VOLKSWAGEN18
FORD10
RENAULT7
HYUNDAI7
HONDA5
TOYOTA 4
PSA 4
NISSAN 2
Others 5
2013 market shareby manufacturer
Subcompact22
Compact22Medium
39
Large6
Sport1
O-Road3
SUV7
Minivan01
2013 market shareby segment
Figure 1‑5 ndash Market share of new passenger vehicles by manufacturer and segment (2013)
Source ADK
5
ICCT white paper
Table 1‑1 summarizes key indicators for the Brazilian passenger vehicle market in 2012 and 2013 Fiat remained the market leader in 2013 although with a small loss and gM overtook Volkswagen in 2013 amongst the companies that gained the most market share are hyundai and toyota both of which doubled their market share between 2012 and 2013 on the other hand Psa and nissan lost market shares in this period the market dominance of medium-sized vehicles in 2013 marks a significant shift in consumer preferences Between 2012 and 2013 the subcompact segment lost the majority share (from 33 to 22) and the larger compact and medium segments gained sizable shares
Table 1‑1 ndash Market characteristics of new Brazilian passenger vehicles
parameter 2012 2013
Sales (million) 311 304
price (R$) $47203 $47446
Domestic market share 800 834
Engine 10 L share 386 363
Fuel share
Flex 914 936
Gasoline 82 59
hybrid 0004 0014
Diesel 04 05
Segment market share
Subcompact 332 223
Compact 162 225
Medium 335 388
Large 79 63
Sport 07 09
Off‑road 23 25
SUV 61 66
Minivan 01 01
Manufacturer market share
Fiat 221 200
GM 176 180
Volkswagen 211 179
Ford 96 101
Renault 73 73
hyundai 32 68
honda 43 46
Toyota 24 44
pSa 44 38
Nissan 28 20
Mitsubishi 13 12
Kia 11 08
JaC 06 05
BMw 03 05
Land Rover 03 03
Mercedes‑Benz 02 03
Others 02 14
sales-weighted average
6
Brazil Passenger Vehicle Market statistics
2 vEhiCLE fLEET ChArACTEriSTiCS
this chapter provides an overview of key vehicle fleet characteristics in Brazil number of cylinders engine displacement curb weight1 length footprint2 engine power and power-to-weight ratio (PtWr)3 are relevant indicators to characterize a vehicle fleet and understand individual vehicle and fleet-average energy consumption4
these key characteristics of passenger vehicles in Brazil experienced a small change in 2013 compared to 2012 (Table 2‑1) With the exception of number of cylinders all parameters increased in 2013 consistent with a trend of increasing market shares for larger and more powerful vehicles the evaluation of minimum and maximum parameters also provides important insights While the smallest vehicles continue to be sold in Brazil (since the minimum values did not change with the exception of footprint) it is evident that much larger vehicles started being sold in 2013 represented by the large variation in the maximum values of each parameter Because sales of these recently introduced larger vehicles are relatively small their effect on weighted average parameters is also modest
Figure 2‑1 illustrates key vehicle fleet characteristics by vehicle segment (see appendix a for segment definition) not surprisingly most parameters get larger between the subcompact and large segments off-road vehicles sports cars and minivans tend to be the largest and most powerful vehicles across the fleet while sport utility vehicles (suVs) tend to be comparable with vehicles in the ldquolargerdquo segment Because of their high performance (absolute and relative to vehicle size) sports cars have significantly larger engine power and PtWr compared to all other segments sports vehicles primarily imported are not sold in a flex-fuel configuration and consume strictly gasoline Flex-fuel vehicles have slightly higher engine power and PtWr than their gasoline counterparts in most segments Detailed sales-weighted average data by segment are presented in Table C‑1 in appendix c
1 Based on norm aBnt nBr iso 1176 2006 curb weight is the total weight of a vehicle with standard equipment all necessary operating consumables (eg motor oil and coolant) a full tank of fuel but not loaded with passengers or cargo
2 Footprint (m2) is the product of the distance between the axles of a vehicle (wheelbase) and the distance between the centerline of the tires (average trackwidth)
3 Power to weight ratio (PtWr) is defined as the rated power of the engine (kW) divided by the vehicle weight (kg) PtWr is a metric that describes vehicle acceleration and handling and it is thus used in Brazil as a criterion to classify sports vehicles (PtWr gt 0075 kWkg)
4 Vehicle energy consumption is presented in megajoules per kilometer (Mjkm) for consistency with the vehicle energy consumption targets established by inovar-auto although e27 is currently being used flex-fuel vehicles are tested with e22 fuel
7
ICCT white paper
Table 2‑1 ndash Fleet characteristics of new Brazilian passenger vehicles
Vehicle characteristic 2012 2013 Variation
Number of cylinders weighted average 402 400 ‑06
Displacement (cc)
Min 970 970
Max 6498 6749
weighted average 1418 1430 08
Curb weight (kg)
Min 800 800
Max 2940 2710
weighted average 1102 1106 04
Length (mm)
Min 2695 2695
Max 5290 5842
weighted average 4089 4100 03
Footprint (m2)
Min 217 241
Max 523 874
weighted average 364 367 09
Engine power ndash gasoline (kw)
Min 33 33
Max 153 545
weighted average 743 757 18
Engine power ndash ethanol (kw)
49 49
Max 114 153
weighted average 715 740 34
pTwR ‑ gasoline (kwkg)
00455 00455
Max 04482 03344
weighted average 00658 00671 20
pTwR ‑ ethanol (kwkg)
00476 00477
Max 00935 01033
weighted average 00667 00683 24
Energy consumption ndash US CaFE (MJkm) na 202
8
Brazil Passenger Vehicle Market statistics
0
500
1000
1500
2000
2500
3000
Subco
mpac
t
Compac
t
Medium
Larg
eSport
O-road SUV
Miniva
n
Fleet-a
vera
ge
Dis
pla
cem
ent
(cc)
0200400600800
10001200140016001800
2000
Subco
mpac
t
Compac
t
Medium
Larg
eSport
O-road SUV
Miniva
n
Fleet-a
vera
ge
Cur
b w
eig
ht (
kg)
0500
10001500
2000250030003500400045005000
Subco
mpac
t
Compac
t
Medium
Larg
eSport
O-road SUV
Miniva
n
Fleet-a
vera
ge
Leng
th (
mm
)
000050100150
200250300350400450
Subco
mpac
t
Compac
t
Medium
Larg
eSport
O-road SUV
Miniva
n
Fleet-a
vera
ge
Fo
otp
rint
(m
2 )
020406080
100120140160180
200
Subco
mpac
t
Compac
t
Medium
Larg
eSport
O-road SUV
Miniva
n
Fleet-a
vera
ge
Po
wer
(kW
)
Gasoline EthanolGasoline and Ethanol
000
002
004
006
008
010
012
014
Subco
mpac
t
Compac
t
Medium
Larg
eSport
O-road
SUV
Miniva
n
Fleet-a
vera
gePo
wer
-to
-wei
ght
rat
io (
kWk
g)
Figure 2‑1 ndash Fleet characteristics of new Brazilian passenger vehicles by segment (2013)
Fleet characteristics for the top 20 vehicle manufacturers responsible for more than 99 of passenger vehicle sales in 2013 are presented in Figure 2‑2 the four top-selling manufacturers (Fiat gM Volkswagen and Ford) produce on average lighter vehicles with smaller and less powerful engines average engine rated power is below 80 kW for the 10 largest manufacturers except for toyota and honda since each has a large share of off-road and suV sales respectively luxury manufacturers and off-road dominant manufacturers (jeep and Mitsubishi) show the largest values of engine power PtWr values seem evenly distributed below 0070 kWkg across the five largest manufacturers plus Psa and chery and climb following the power trend for luxury and off-road oriented manufacturers Most vehicles are rated with higher engine power and PtWr under ethanol (e100) than under gasoline (e22) Detailed sales-weighted average data by manufacturer are presented in Table C‑2 in appendix c
9
ICCT white paper
Gasoline Ethanol
0
500
1000
1500
2000
2500
3000
3500
Fiat GM
Volkswag
enFord
Renau
lt
Hyund
ai
Honda
Toyo
taPSA
Nissan
Mitsub
ishiKIA
JACBMW
Land
Rove
r
Merce
des-B
enz
Chery
Audi
Suzuk
iJe
ep
Fleet-a
vera
geFiat GM
Volkswag
enFord
Renau
lt
Hyund
ai
Honda
Toyo
taPSA
Nissan
Mitsub
ishiKIA
JACBMW
Land
Rove
r
Merce
des-B
enz
Chery
Audi
Suzuk
iJe
ep
Fleet-a
vera
ge
Dis
pla
cem
ent
(cc)
0200400600800
10001200140016001800
2000
Cur
b w
eig
ht (
kg)
Fiat GM
Volkswag
enFord
Renau
lt
Hyund
ai
Honda
Toyo
taPSA
Nissan
Mitsub
ishiKIA
JACBMW
Land
Rove
r
Merce
des-B
enz
Chery
Audi
Suzuk
iJe
ep
Fleet-a
vera
geFiat GM
Volkswag
enFord
Renau
lt
Hyund
ai
Honda
Toyo
taPSA
Nissan
Mitsub
ishiKIA
JACBMW
Land
Rove
r
Merce
des-B
enz
Chery
Audi
Suzuk
iJe
ep
Fleet-a
vera
ge000050100150
200250300350400450
Fo
otp
rint
(m
2 )
3400
3600
3800
4000
4200
4400
4600
4800
Leng
th (
mm
)
Fiat GM
Volkswag
enFord
Renau
lt
Hyund
ai
Honda
Toyo
taPSA
Nissan
Mitsub
ishiKIA
JACBMW
Land
Rove
r
Merce
des-B
enz
Chery
Audi
Suzuk
iJe
ep
Fleet-a
vera
geFiat GM
Volkswag
enFord
Renau
lt
Hyund
ai
Honda
Toyo
taPSA
Nissan
Mitsub
ishiKIA
JACBMW
Land
Rove
r
Merce
des-B
enz
Chery
Audi
Suzuk
iJe
ep
Fleet-a
vera
ge0
20406080
100120140160180
200
Po
wer
(kw
)
00000010002000300040005000600070008000900100
Po
wer
-to
-wei
ght
rat
io (
kWk
g)
Gasoline and Ethanol
Figure 2‑2 ndash Fleet characteristics of new Brazilian passenger vehicles by manufacturer (2013)
Manufacturers are organized by total sales in descending order
Figure 2‑3 illustrates vehicle fleet characteristics for domestic and imported vehicles in general imported vehicles are bigger and heavier than those nationally produced the most remarkable contrast lies on engine power and PtWr imported vehicles are more powerful and have higher PtWr but while domestic vehicles exhibit higher engine power and PtWr for ethanol than for gasoline the opposite occurs for imported ones a closer examination of available data on engine compression ratios shows that domestic producers are leveraging ethanolrsquos higher octane rating and designing flex-fuel engines with much higher compression ratios (~1251) than gasoline-only engines (around 1051)5 this confirms the special engine designcalibration for operation with high ethanol gasoline blends from manufacturers with local production Detailed sales-weighted average data by origin are presented in Table C‑3 in appendix c
5 More information on the effect of ethanol on vehicle design characteristics can be found in stein et al (2013)
10
Brazil Passenger Vehicle Market statistics
Gasoline Ethanol
0
200
400
600
800
1000
1200
1400
1600
1800
2000
Domestic Imported Fleet-average
Dis
pla
cem
ent
(cc)
0
200
400
600
800
1000
1200
1400
Domestic Imported Fleet-average
Cur
b w
eig
ht (
kg)
345
350
355
360
365
370
375
380
385
390
395
Domestic Imported Fleet-average
Fo
otp
rint
(m
2 )
3950
4000
4050
4100
4150
4200
4250
4300
4350
Domestic Imported Fleet-average
Leng
th (
mm
)
0
20
40
60
80
100
120
Domestic Imported Fleet-average
Po
wer
(kW
)
0050
0055
0060
0065
0070
0075
0080
Domestic Imported Fleet-average
Po
wer
-to
-wei
ght
rat
io (
kWk
g)
Gasoline and Ethanol
Figure 2‑3 ndash Fleet characteristics of new Brazilian passenger vehicles by origin (2013)
Figure 2‑4 compares Brazilrsquos passenger vehicle fleet with those in china the us eu japan india and south Korea For the energy consumption comparison this analysis considers the us corporate average fuel economy (caFe) test cycle6 average engine displacement curb weight footprint and engine power in Brazil are the smallest with the exception of india (and japan in the case of engine displacement) With respect to PtWr the average Brazilian passenger car breaks the trend set by the power category ie Brazilian cars are less powerful than those in china japan and eu due to their lower average weight which drives the PtWr value above chinese japanese and european cars this suggests that the average Brazilian cars share the driving performance characteristics (eg acceleration times) of the us and Korean vehicles despite their relative smaller engines Detailed international data are presented in appendix B
6 Details on icctrsquos methodology for comparing new vehicle fuel efficiency can be found at the global PV standards section in the icctrsquos website httpwwwtheicctorginfo-toolsglobal-passenger-vehicle-standards
11
ICCT white paper
Despite having the smallest lightest and least powerful vehicles on average (with the exception of india) Brazilrsquos average energy consumption ranks fourth amongst the markets analyzed in this study the japanese fleet had the lowest energy consumption given the small and light vehicle characteristics of japanese cars and their relatively higher adoption of efficiency technologies (eg hybrids) followed by the eu (medium sizeweight fleet with high technology penetration) and india (smaller and lighter fleet overall) the us has the highest energy consumption on average due to the fleetrsquos larger size weight and power requirements china and south Korea trail the us as the most energy-consuming fleet and these countries have fleets with large and heavy vehicles but relatively lower penetration of efficiency technologies a detailed evaluation of energy consumption in Brazil and other markets is presented in chapter 4
0
500
1000
1500
2000
2500
3000
US S Korea EU China Brazil Japan India
Dis
pla
cem
ent
(cc)
0
200
400
600
800
1000
1200
1400
1600
1800
US S Korea EU China Japan Brazil India
Cur
b w
eig
ht (
kg)
000
050
100
150
200
250
300
350
400
450
US S Korea EU China Japan Brazil India
Fo
otp
rint
(m
2)
0
20
40
60
80
100
120
140
160
US S Korea EU China Japan Brazil India
Po
wer
(kW
)
00000
00100
00200
00300
00400
00500
00600
00700
00800
00900
01000
US S Korea Brazil China Japan EU India
Po
wer
-to
-wei
ght
rat
io (
kWk
g)
100
120
140
160
180
200
220
240
260
US China S Korea Brazil India Japan EU
Ene
rgy
cons
ump
tio
n ndash
US
CA
FE
(M
Jkm
)
Figure 2‑4 ndash international comparison of key new passenger vehicle characteristics
12
Brazil Passenger Vehicle Market statistics
3 vEhiCLE TEChNOLOGy ADOpTiON
this chapter provides an overview of current technology adoption including fuel engine and transmission technologies that affect vehicle energy consumption the type and complexity of technologies vary across vehicle segments to a large extent this is a function of vehicle size and weight and its intended performance and ultimately cost Fleet-average parameters presented in Table 3‑1 correspond to sales-weighted fleet-average values this chapter is divided by technology type with supporting information in appendix c an international comparison for each technology is also presented in this chapter the data for this technology adoption analysis came from a diversity of sources listed in appendix D also note that for comparisons at the international level it was required to use information from different years the most recent according to data availability
Table 3‑1 ndash technology adoption in new Brazilian passenger vehicles
Year 2012 2013
Fuel type
Flex 914 936
Gasoline 82 59
hybrid 0004 0014
Diesel 04 049
No of cylinders
Three 03 25
Four 986 966
Five 00 00
Six 09 08
Eight or more 01 01
Transmission
Manual 870 833
automatic 112 147
CVT 14 15
DCT 04 05
No of gear ratios
Four or fewer 61 59
Five 849 831
Six 84 98
Seven 03 07
Eight or more 02 05
Drivetrain
FwD 950 944
RwD 27 29
4wD and awD 23 27
No of valves per cylinder
Two 664 596
Multi valve 336 404
Valve camshaft configuration
Single overhead camshaft 696 630
Dual overhead camshaft 176 245
Valve actuation
Fixed 822 783
VVT 124 159
VVT+VVL 54 58
Fuel systems for gasoline vehicles
Multi‑point fuel injection 982 976
Gasoline direct injection 18 24
air induction systems for gasoline vehicles
Naturally aspirated 984 973
Supercharger turbocharger or twin‑turbo 16 27
13
ICCT white paper
FUEL TYpEFlex-fuel vehicles (FFVs) are designed to run on gasoline (e22) ethanol (e100) or any combination of both fuels except for a few engine and fuel system modifications FFVs are identical to gasoline-only models7 FFVs experience no loss in performance when operating on e100 however since ethanol contains less energy per volume than gasoline FFVs typically get about 25 fewer kilometers per liter when fuelled with e100
Flex-fuel is the dominant technology across all vehicle segments with the exception of sports cars off-road vehicles and minivans (Figure 3‑1) all top 10 manufacturers produce primarily flex-fuel engines and those manufacturers with a larger share of gasoline and diesel engines typically import most of their vehicles (Figure 3‑2) the predominance of FFVs responsible for almost 94 of vehicle sales in 2013 is unique to Brazil (Figure 3‑3)
hybrid-gasoline vehicles achieve reduced fuel consumption by incorporating in the drivetrain a battery and an electric motor in addition to an internal combustion (ic) engine this technology permits the ic engine to shut down when the vehicle is decelerating and is stopped braking energy to be recovered and the ic engine to be downsized and operated at more efficient operating points Depending on the level of complexity hybrid systems can achieve 15 to 35 reductions in fuel consumption with respect to similar-sized vehicles
Despite having very limited penetration sales of new hybrid vehicles have increased three-fold from 131 units in 2012 to 432 in 2013 primarily in the medium and sports segments two manufacturers sell the most gasoline hybrid models (not flex-fuel) in Brazil including the toyota Prius and the Ford Fusion hybrid
Diesel engines offer 20 to 25 reduction in fuel consumption over traditional gasoline multi-point fuel injection (MPFi) engines due to higher compression ratios reduced pumping losses and 12 higher energy content per liter of fuel the challenge for further commercialization is twofold the complexity and additional cost of advanced exhaust after-treatment technologies that reduce emissions of particulate matter and oxides of nitrogen to levels comparable to those of gasoline and FFV engines
sales of diesel passenger vehicles are not allowed in Brazil with the exception of vehicles with some off-road characteristics Despite having a small penetration (around 05) sales of diesel passenger vehicles increased by 16 in 2013 toyota sells the most diesel passenger vehicles followed by Mitsubishi land rover gM and Mercedes-Benz the light-duty diesel market in Brazil is equivalent to the us and china in terms of market penetration and much below the penetration in europe and south Korea although air quality concerns in europe might trigger lower sales of diesel vehicles in coming years
7 Most of the modifications with respect to a gasoline-only vehicle (e00) include changes to fuel systemrsquos materials that are compatible with the oxygen content of ethanol blends and changes to air and fuel ratio management systems (mainly software based)
14
Brazil Passenger Vehicle Market statistics
0
10
20
30
40
50
60
70
80
90
100
Subco
mpac
t
Compac
t
Medium
Larg
eSport
O-Road SUV
Miniva
nTo
tal
Mar
ket
shar
e
Diesel Hybrid Gasoline Flex
Figure 3‑1 ndash Fuel type by segment
0102030405060708090
100
Fiat GM
Volkswag
enFord
Renau
lt
Hyund
ai
Honda
Toyo
taPSA
Nissan
Mitsub
ishi
KIAJA
CBMW
Land
Rove
r
Merce
des-B
enz
Chery
Audi
Suzuk
iJe
epTo
tal
Tech
nolo
gy
shar
e
Diesel Hybrid Gasoline Flex
Figure 3‑2 ndash Fuel type by manufacturer
0
10
20
30
40
50
60
70
80
90
100
China2010
Korea2011
EU-272013
US2013
Japan2011
India2012
Brazil2013
Tech
nolo
gy
shar
e
Diesel Hybrid Gasoline CNGLPGFlex
Figure 3‑3 ndash Fuel type international comparison
15
ICCT white paper
NUMBER OF CYLiNDERSacross all vehicle markets 4-cylinder engines are the most common design in automobile engines with displacements below 25 liters this engine configuration presents the right balance between complexity and performance for the target vehicle segments (small to mid-size sedans suVs and some off-road vehicles) engines with six and more cylinders are designed to provide a smoother vehicle driving experience with lower vibration and noise than 4-cylinder engines can provide and with higher power output this better overall performance comes at a higher cost driving their widespread use in large and luxury vehicles and heavier suVs and off-road vehicles
the need to attain better energy consumption has resulted in a recent wave of 3-cylinder engines from a handful of manufacturers in vehicles that typically used 4-cylinder engines achieving similar or better performance this practice is known as engine downsizing Downsizing can also be applied to larger engines from V-8s to V-6s and from V-6s to i-4s in most cases engine downsizing is accompanied with turbocharging and changes to the fuel delivery system
Four-cylinder engines dominate the passenger vehicle market in Brazil and are sold in more than 90 of new vehicles among all segments except the sports off-road and minivan segments (Figure 3‑4) Despite its predominance sales of 4-cylinder engines fell from over 307 to 293 million units between 2012 and 2013 equivalent to a 4 reduction 4-cylinder vehicles represent the majority of sales among the 20 top manufacturers except for hyundai and jeep (Figure 3‑5) although 4-cylinder engines represent the dominant technology in all countries analyzed Brazil still has the largest market share (Figure 3‑6)
the most significant shift in market preferences in Brazil occurred with 3-cylinder engines this technology is becoming more popular with almost eight times more vehicles sold in 2013 compared to 2012 reaching almost 75000 units in 2013 almost all 3-cylinder engines are being sold as compact vehicles instead of the smaller subcompact segment hyundai is the technology leader in sales of 3-cylinder high-efficiency Kappa engines8 japan and india have relatively high penetration of 3-cylinder engine technology in india the popularity of 2- and 3-cylinder vehicles is primarily driven by lower price tags (lt usD $8000)
six-cylinder engines are third in sales after 4- and 3-cylinder engines with absolute numbers close to 25000 units sold in 2013 its market share reduced by 13 with respect to 2012 six-plus cylinder engines are being sold mostly in the sports off-road and minivan segments Manufacturers that cater to the most expensive models and segments dominate the market of vehicles with six-plus cylinder engines such as land rover BMW and Mercedes-Benz the penetration of 6-plus-cylinder engines in Brazil is very low compared to other countries
Five-cylinder engines are not very common in Brazil or other countries and are losing market with respect to 2012 sales by 56 Volkswagen audi and Volvo are the only manufacturers that offered 5-cylinder engines in Brazil in 2013
8 hyundairsquos 3-cylinder Kappa engine httpworldwidehyundaicomWWshowroomcarshB20PiPindexhtml
16
Brazil Passenger Vehicle Market statistics
0
10
20
30
40
50
60
70
80
90
100
Subco
mpac
t
Compac
t
Medium
Larg
eSport
O-Road SUV
Miniva
nTo
tal
Tech
nolo
gy
shar
e
8+ 6 5 4 3
Figure 3‑4 ndash number of cylinders by segment
0102030405060708090
100
Fiat GM
Volkswag
enFord
Renau
lt
Hyund
ai
Honda
Toyo
taPSA
Nissan
Mitsub
ishi
KIAJA
CBMW
Land
Rove
r
Merce
des-B
enz
Chery
Audi
Suzuk
iJe
epTo
tal
Tech
nolo
gy
shar
e
8+ 6 5 4 3
Figure 3‑5 ndash number of cylinders by manufacturer
0
10
20
30
40
50
60
70
80
90
100
China2010
Korea2011
EU-272013
US2013
Japan2011
India2012
Brazil2013
Tec
hno
log
y sh
are
8+ 6 5 4 3 2
Figure 3‑6 ndash number of cylinders international comparison
17
ICCT white paper
TRaNSMiSSiONtransmission technologies can reduce energy consumption in two ways First by allowing engine operation on a more efficient region of the engine map and second by reducing the mechanical losses within transmissions traditionally manual transmissions have offered better energy consumption than traditional automatic transmissions (with 4 or 5 speeds) due to lower friction losses however new generation of automatic transmissions with higher number of gears lower friction better materials and computer-controlled shift points have not just closed the gap between manual and automatic transmission performance but even exceed manual transmission performance
new technologies such as dual-clutch transmissions (Dcts) and continually variable transmissions (cVts) are gaining market share due to the need for lower vehicle energy consumption Dcts can be defined as manual transmissions with electro-hydraulically operated dual-clutch systems allowing for faster shifting times and selective automatic or ldquomanualrdquo operation as opposed to manual automatic and Dct transmissions which have a discrete number of gear ratios cVts have a theoretically infinite choice of ratios between fixed limits which allows engines to be further optimized for minimizing energy consumption cVt technology has been used in lower-horsepower vehicles because of maximum-torque limitations with the most common metal-belt design (nas 2011) these advanced transmission technologies offer significant benefits in energy consumption compared to traditional manual or automatic technologies according to the us national academy of sciences a 6-speed Dct provides 6 to 9 lower energy consumption than a 4-speed automatic transmission note that a traditional 6-speed automatic transmission provides an estimated 3 to 5 benefit the energy consumption benefit of cVt depends on the application and is estimated to be 1 to 7 (nas 2011)
although vehicle sales with manual transmissions are predominant in Brazil the penetration of automatic transmissions cVts and Dcts is increasing resulting in a market share loss for manual transmissions of about 6 between 2012 and 2013 (Table 3‑1) With the exception of sports and off-road segments manual transmission technology has the largest market share in all segments but it tends to become less predominant as vehicles grow in size and comfort level (Figure 3‑7) the top five manufacturers sell most of their vehicles with manual transmissions but their market share is somewhat smaller for other high-selling manufacturers that cater to a more affluent market (Figures 3‑8)
automatic transmissions are becoming increasingly popular in Brazil experiencing an increase of 28 in sales between 2012 and 2013 automatic transmissions dominate the sports and off-road segments Kia BMW land rover Mercedes-Benz and jeep adopt this type of transmission technology for most of their vehicle sales
Dct transmissions are entering the Brazilian market mostly through the sports segment via imported models the sales of Dct equipped vehicles increased in 2013 by 22 with respect to 2012 Dct technology is being offered mainly by manufacturers that sell sports vehicles such as audi in more than 67 of their vehicles and Mercedes-Benz in more than 15 of their vehicles the global leader in Dct adoption is europe followed by the us (Figure 3‑9)
cVt technology market is still relatively small being sold by small volume manufacturers like jeep audi and Mitsubishi with more than 25 of new vehicle sales each nissan renault honda and toyota also sell vehicles with cVt technology cVt penetration in Brazil is similar to europersquos cVt is the leading transmission technology in japan with more than 65 of the market
18
Brazil Passenger Vehicle Market statistics
0
10
20
30
40
50
60
70
80
90
100
Subco
mpac
t
Compac
t
Medium
Larg
eSport
O-Road SUV
Miniva
nTo
tal
Tech
nolo
gy
shar
e
DCT CVT Automatic Manual
Figure 3‑7 ndash transmission by segment
0
10
20
30
40
50
60
70
80
90
100
Fiat GM
Volkswag
enFord
Renau
lt
Hyund
ai
Honda
Toyo
taPSA
Nissan
Mitsub
ishi
KIAJA
CBMW
Land
Rove
r
Merce
des-B
enz
Chery
Audi
Suzuk
iJe
epTo
tal
Tech
nolo
gy
shar
e
DCT CVT Automatic Manual
Figure 3‑8 ndash transmission by manufacturer
0
10
20
30
40
50
60
70
80
90
100
China2010
Korea2011
EU-272013
US2013
Japan2011
India2012
Brazil2013
Tech
nolo
gy
shar
e
DCT CVT Automatic Manual
Figure 3‑9 ndash transmission international comparison
19
ICCT white paper
NUMBER OF GEaR RaTiOS as mentioned in the previous section increasing the number of gear ratios (whether manual automatic dual-clutch or continuously variable) allows the engine to be operated in the best efficiency region resulting in energy consumption benefits compared to an automatic four-gear ratio transmission (also known as 4-speed transmission) higher ratio automatic transmissions could reduce energy consumption from 2 to 3 (for a five-gear ratio) to 6 to 8 (for an eight-gear ratio) (ePanhtsa 2010)
Four-gear ratio transmissions are losing market share in Brazil by more than 5 between 2012 and 2013 (Table 3‑1) these transmissions are particularly high sellers in the suV and minivan segments which suggest that some models in these more expensive segments are being sold with outdated technologies (Figure 3‑10) Most manufacturers are phasing out this type of transmission (Figure 3‑11) although jeep suzuki and toyota are lagging behind other manufacturers the four-gear ratio transmission technology has been losing market share in most countries even in india where smaller and inexpensive cars dominate the market 4-speed transmissions have the smallest market share (Figure 3‑12)
Five- and six-gear ratio transmissions were predominant in the Brazilian market in 2013 Five-gear ratio transmissions are dominant in all segments except for the off-road and sports segments which have adopted six-gear ratio transmissions in most sales the significant market share of five- and six-gear ratio transmissions is similar to most countries although the us europe and south Korea show higher shares of six and more gear ratios
seven- and eight-gear ratio transmissions which are considered emerging technologies have experienced an increase in sales in Brazil with over twice as many sales in 2013 compared to 2012 seven- and eight-gear ratio transmissions are popular among the large sports and off-road segments all of which are imported models luxury manufacturers such as Mercedes-Benz and audi are selling the most seven-gear vehicles as a share of their sales Volkswagen and toyota are also selling similar numbers of seven-gear ratio vehicles although for Volkswagen and toyota it represented less than 3 of their brand sales BMW and land rover are the leaders in eight-gear ratio vehicles
20
Brazil Passenger Vehicle Market statistics
0
10
20
30
40
50
60
70
80
90
100
Subco
mpac
t
Compac
t
Medium
Larg
eSport
O-Road
SUV
Miniva
nTo
tal
Tech
nolo
gy
shar
e
8 7 6 5 4
Figure 3‑10 ndash number of gear ratios by segment
0
10
20
30
40
50
60
70
80
90
100
Fiat GM
Volkswag
enFord
Renau
lt
Hyund
ai
Honda
Toyo
taPSA
Nissan
Mitsub
ishi
KIAJA
CBMW
Land
Rove
r
Merce
des-B
enz
Chery
Audi
Suzuk
iJe
epTo
tal
Tech
nolo
gy
shar
e
8 7 6 5 4
Figure 3‑11 ndash number of gear ratios by manufacturer
0
10
20
30
40
50
60
70
80
90
100
Tech
nolo
gy
shar
e
Six or more Five Four or fewer
China2010
Korea2011
EU-272013
US2013
India2012
Brazil2013
Figure 3‑12 ndash number of gear ratios international comparison
21
ICCT white paper
DRiVETRaiNDrivetrain technology includes front-wheel drive (FWD) rear-wheel drive (rWD) and all-wheel drive (aWD) vehicles For the same vehicle size FWD vehicles provide more interior space and better energy consumption than rWDs due to lower weight as it avoids the added weight of and space for the driveshaft and differential that rWD requires Because the weight of the engine and transmission is located close to the wheels FWD vehicles have better traction than rWDs rWDs however show better handling as the weight distribution between the front and rear wheels is more uniform and the tasks of turning and acceleration are split between the front and rear wheels also directing large amounts of power through the front wheels can create ldquotorque steerrdquo thus rWD is the adequate technology for the sports segment aWD drivetrains are intended for specific driving applications that imply loss of traction such as off-road terrains snow or towing
FWD vehicles dominate all segments of the Brazilian passenger car market (Table 3‑1) with the exception of the off-road segment (Figure 3‑13) among the 20 largest manufacturer sellers most except for BMW land rover Mercedes-Benz and suzuki offer FWD technology (Figure 3‑14) Brazil has the highest market share of FWD vehicles of all countries analyzed (944) although FWD has at least 50 market share in all seven countries (Figure 3‑15)
aWD market share increased by 15 between 2012 and 2013 due to a tri-fold increase in the sports segment sales off-road vehicle sales with aWD also increased to more than 76000 units in 2013 amongst the largest ten manufacturers toyota is the aWD market leader followed by Ford and Volkswagen note that land rover sells only aWD vehicles in Brazil among non-luxury manufacturers Mitsubishi and suzuki are selling more than 50 of their vehicles with aWD technology
rWD technology is offered mostly in large and sports vehicles and in suVs among the 10 largest manufacturers rWD is offered mainly by gM and toyota while an extended examination of the 20 largest manufacturers by sales show that aWD and rWD is focused among the more expensive brands (Figure 3‑14) Mercedes-Benz and BMW sell close to 90 of their vehicles with rWD technology traditionally associated with engine performance and responsiveness
22
Brazil Passenger Vehicle Market statistics
0
10
20
30
40
50
60
70
80
90
100
Subco
mpac
t
Compac
t
Medium
Larg
eSport
O-Road SUV
Miniva
nTo
tal
Tehn
olo
gy
shar
e
AWD RWD FWD
Figure 3‑13 ndash Drivetrain by segment
0
10
20
30
40
50
60
70
80
90
100
Fiat GM
Volkswag
enFord
Renau
lt
Hyund
ai
Honda
Toyo
taPSA
Nissan
Mitsub
ishi
KIAJA
CBMW
Land
Rove
r
Merce
des-B
enz
Chery
Audi
Suzuk
iJe
epTo
tal
Tech
nolo
gy
shar
e
AWD RWD FWD
Figure 3‑14 ndash Drivetrain by manufacturer
0
10
20
30
40
50
60
70
80
90
100
China2010
Korea2011
EU-272013
US2013
Japan2011
India2012
Brazil2013
Tech
nolo
gy
shar
e
AWD RWD FWD
Figure 3‑15 ndash Drivetrain international comparison
23
ICCT white paper
VaLVE CaMShaFT CONFiGURaTiON (DOhC VS SOhC)the engine camshaft governs the timing duration and lift of valve operation controlling the intake of air and the exhaust of combustion gases this report focuses on single overhead camshafts (sohc) and dual overhead camshafts (Dohc) as these configurations have almost completely replaced the older overhead valve configuration (ohV) sohc design places a single camshaft above the cylinder head that governs all the valves intake and exhaust in the case of sohc V-engines there is one single camshaft per head Dohc designs use separate camshafts for intake valves and exhaust valves Dohc engines achieve increased airflow at high-engine speeds improve volumetric efficiency and reduce the valvetrainrsquos moving mass such engines typically develop higher power at high-engine speeds the us environmental Protection agency (ePa) and national highway traffic safety administration (nhtsa) estimate the effectiveness of Dohc over sohc to be between 1 and 25 (ePanhtsa 2010)
although Dohc produce more power and provide lower fuel consumption the Brazilian fleet is still mostly composed of sohcs vehicles (Table 3‑1) sohc technology is predominant among the subcompact compact and medium segments (Figure 3‑16) among manufacturers sohc technology is predominant among the five largest least expensive brands (Figure 3‑17) sales of vehicles with more advanced Dohc technology grew in 2013 by almost 36 with respect to 2012 albeit from a relatively smaller base this increase was experienced in all vehicle segments but in different magnitudes
although global data on this technology are scarce Figure 3‑18 indicates that most countries are moving away from sohc with Brazil being the only country analyzed where sohc is still predominant no data were available for the us or europe
24
Brazil Passenger Vehicle Market statistics
0
10
20
30
40
50
60
70
80
90
100
Subco
mpac
t
Compac
t
Medium
Larg
eSport
O-Road SUV
Miniva
nTo
tal
Tech
nolo
gy
shar
e
nd DOHC SOHC
Figure 3‑16 ndash Valve camshaft configuration by segment (nd no data)
0
10
20
30
40
50
60
70
80
90
100
Fiat GM
Volkswag
enFord
Renau
lt
Hyund
ai
Honda
Toyo
taPSA
Nissan
Mitsub
ishi
KIAJA
CBMW
Land
Rove
r
Merce
des-B
enz
Chery
Audi
Suzuk
iJe
epTo
tal
Tech
nolo
gy
shar
e
nd DOHC SOHC
Figure 3‑17 ndash Valve camshaft configuration by manufacturer (nd no data)
0
10
20
30
40
50
60
70
80
90
100
China2010
Korea2011
Japan2011
India2012
Brazil2013
Tech
nolo
gy
shar
e
nd OVC DOHC SOHC
Figure 3‑18 ndash Valve camshaft configuration international comparison (nd no data)
25
ICCT white paper
VaLVE aCTUaTiON improved valvetrain systems with variable valve actuation (VVa) technology either variable valve timing (VVt) or variable valve timing and lift (VVt+VVl) improves the enginersquos volumetric and thermodynamic efficiency they also enable further engine improvements such as internal exhaust gas recirculation and cylinder deactivation VVt alters the timing of the intake valve exhaust valve or both primarily to reduce pumping losses increase specific power and control residual exhaust gases VVl increases efficiency by optimizing airflow over a broader range of engine operation which reduces pumping losses and increases specific power VVl is accomplished by controlled switching between two or more cam profile lobe heights the most advanced technology VVt+VVl yields a wide range of performance optimization and volumetric efficiency including enabling the engine to be valve-throttled (no need for intake throttle) VVt provides energy consumption gains of 3 to 5 while the more flexible and complex VVt+VVl system can reach 4 to 8 (ePa amp nhtsa 2010)
VVa technology either VVt or VVt+VVl are emerging technologies in Brazil where most vehicles still have fixed-valve timing designs (Table 3‑1) Fixed technology is predominant among the smaller vehicle segments as well as suVs and minivans (Figure 3‑19) the five largest manufacturers sold more than 90 of their vehicles with fixed-valve technology in 2013 (Figure 3‑20) the international comparison indicates that only Brazil and india have not yet adopted VVa technologies for most of their light-duty fleet (Figure 3‑21)
VVt and VVt+VVl are being adopted across all segments including the subcompact segment but tend to be more predominant in high-end manufacturers a closer examination by manufacturer shows that most are offering some vehicles with either one of the VVa systems while honda and hyundai offer this technology in almost all vehicles (Figure 3‑20) honda is the technology leader in variable valve actuation with the adoption in the early 1990s of the Vtec system (Valve timing electronic control) VVt technologyrsquos market share grew by about 25 in 2013 primarily due to hyundairsquos sales from 80000 units in 2012 to almost 200000 units in 2013 hyundai offered the continuously variable valve technology (cVVt) in the large majority of vehicle sold in 2013 the sports segment is the one where VVt dominates the market Mitsubishi BMW and audi are also selling a large share of their vehicles with the VVt+VVl technology
26
Brazil Passenger Vehicle Market statistics
0
10
20
30
40
50
60
70
80
90
100
Subco
mpac
t
Compac
t
Medium
Larg
eSport
O-Road SUV
Miniva
nTo
tal
Tech
nolo
gy
shar
e
VVT+VVL VVT Fixed
Figure 3‑19 ndash Valve actuation by segment
0
10
20
30
40
50
60
70
80
90
100
Fiat GM
Volkswag
enFord
Renau
lt
Hyund
ai
Honda
Toyo
taPSA
Nissan
Mitsub
ishi
KIAJA
CBMW
Land
Rove
r
Merce
des-B
enz
Chery
Audi
Suzuk
iJe
epTo
tal
Tech
nolo
gy
shar
e
VVT+VVL VVT Fixed
Figure 3‑20 ndash Valve actuation by manufacturer
VVT+VVL VVT Fixed
0
10
20
30
40
50
60
70
80
90
100
China2010
Korea2011
US2013
Japan2011
India2012
Brazil2013
Tech
nolo
gy
shar
e
Figure 3‑21 ndash Valve actuation international comparison
27
ICCT white paper
FUEL SYSTEMS FOR GaSOLiNE VEhiCLESVehicle fuel systems describe the technology required to deliver fuel into the engine combustion chamber this section examines two gasolineflex technologies namely multi-point fuel injection (MPFi) and gasoline direct injection (gDi) MPFi is now the most common fuel-delivery system for gasoline engines used in passenger vehicles worldwide in sequential MPFi engines fuel is injected into the air stream next to the intake valve port while the intake valve is open to draw the air-fuel mixture into the cylinder some of the fuel is vaporized on the surface of the hot intake valve expanding and thus reduces the volumetric efficiency on gDi engines fuel is injected at high pressure directly into the combustion chamber improving volumetric efficiency and providing cooling of the airfuel charge within the cylinder which allows for higher compression ratios and increased thermodynamic efficiency gDi technology alone offers benefits of 2 to 5 with respect to MPFi engines but bigger benefits rely on the synergy between gDi turbocharging and downsizing which can reach 12 to 15 energy consumption reduction with respect to a MPFi naturally aspirated engine (ePa 2012)
Table 3‑1 illustrates that MPFi is still the most common fuel injection technology for gasolineflex vehicles in Brazil which is reflected in its dominant share across most segments except for sports and off-road vehicles in Brazil gDi has found a niche market in the sports and off-road segments with more than 90 of sport vehicles fitted with gDi technology (Figure 3‑22) Within the overall gasoline market the gDi technology is still an emerging technology representing just 24 of new sales gDirsquos market share increased by 31 in 2013 with all but 4000 units being imported among the 10 largest manufacturers the adoption of gDi is extremely low below 5 for Volkswagen Ford hyundai and Psa (Figure 3‑23) high-end european brands (audi land rover Mercedes-Benz and BMW) are the technology leaders in terms of gDi adoption rates echoing the trend of turbocharging technology sales Volkswagen vehicles with gDi systems account for less than 35 of their sales in 2013 but their absolute numbers (around 19000 vehicles) place the company as one of the leaders in gDi technology in the Brazilian market
From a global market perspective the penetration of gDi technology in Brazil is low compared to all other markets in Figure 3‑24 except for india and japan it should be noted that the later has the largest share of hybrid vehicles around the globe
28
Brazil Passenger Vehicle Market statistics
0
10
20
30
40
50
60
70
80
90
100
Compac
t
Subco
mpac
t
Medium
Larg
eSport
O-Road SUV
Miniva
nTo
tal
Tech
nolo
gy
shar
e
GDI MPFI
Figure 3‑22 ndash gasolineflex fuel system by segment
GDI MPFI
0102030405060708090
100
Fiat GM
Volkswag
enFord
Renau
lt
Hyund
ai
Honda
Toyo
taPSA
Nissan
Mitsub
ishi
KIAJA
CBMW
Land
Rove
r
Merce
des-B
enz
Chery
Audi
Suzuk
iJe
epTo
tal
Tech
nolo
gy
shar
e
Figure 3‑23 ndash gasolineflex fuel system by manufacturer
GDI MPFI
0
10
20
30
40
50
60
70
80
90
100
China2010
Korea2011
EU-272013
US2013
Japan2011
India2012
Brazil2013
Tech
nolo
gy
shar
e (n
on-
die
sel)
Figure 3‑24 ndash gasolineflex fuel system international comparison
29
ICCT white paper
TURBOChaRGiNGengine power is primarily limited by the rate at which the engine is able to draw air into the combustion chamber turbocharging and supercharging are two methods to increase the amount of air drawn into the engine above the level of what is possible with the naturally aspirated process (through the expansion of the cylinders) By increasing the amount of air into the engine the amount of fuel can be proportionally increased resulting in increased power output level and with it the ability to reduce engine displacement while maintaining performance the combination of turbocharging and downsizing in spark ignited (gasoline and flex-fuel) vehicles can provide energy consumption improvements between 2 to 6 with respect to a direct-injected gDi engine (ePa amp nhtsa 2010) turbocharging technology is the cornerstone for achieving better energy consumption in vehicles as the basis for downsizing and reducing the engine weight while keeping the same or better vehicle performance (ie acceleration or time to reach certain speed) although turbochargers are used in diesel and gasolineflex vehicles the analysis in this report focuses on turbocharging for spark-ignited gasolineflex vehicles only
turbocharging is one of the most important emerging technologies in Brazil where most vehicles are still naturally aspirated (na) (Table 3‑1) turbocharging technology has increased the market share significantly between 2012 and 2013 by more than 65 albeit from a small base (from about 49000 to 81000 vehicles)
Most vehicles with turbocharging are sold in the sports and off-road segments as this technology also produces superior engine power output (Figure 3‑25) among the 10 largest manufacturers turbocharging is still below 10 of their sales (Figure 3‑26) Volkswagen and Ford despite having small relative sales of vehicles with turbocharging (less than 35) are the manufacturers with the highest total sales of vehicles with turbocharging audi land rover Mercedes-Benz and BMW are the technology leaders with more than 90 of vehicle sales in 2013
the penetration of turbo and supercharging technologies in Brazil is lower than in other countries with a larger gasoline fleet such as the us china and japan (Figure 3‑27) in Brazil 95 of diesel passenger vehicle sales have turbocharging technology
30
Brazil Passenger Vehicle Market statistics
0
10
20
30
40
50
60
70
80
90
100
Compac
t
Subco
mpac
t
Medium
Larg
eSport
O-Road SUV
Miniva
nTo
tal
Tech
nolo
gy
shar
e (n
on-
Die
sel)
Turbo NA
Figure 3‑25 ndash turbocharging for gasolineflex fuel vehicles by segment (NA naturally aspirated)
0102030405060708090
100
Fiat GM
Volkswag
enFord
Renau
lt
Hyund
ai
Honda
Toyo
taPSA
Nissan
Mitsub
ishiKIA
JACBMW
Land
Rove
r
Merce
des-B
enz
Chery
Audi
Suzuk
iJe
epTo
tal
Tech
nolo
gy
shar
e (n
on-
Die
sel)
Turbo NA
Figure 3‑26 ndash turbocharging for gasolineflex fuel vehicles by manufacturer (NA naturally aspirated)
0
10
20
30
40
50
60
70
80
90
100
China2010
Korea2011
EU-272013
US2013
Japan2011
India2012
Brazil2013
Tech
nolo
gy
shar
e (n
on-
die
sel)
Turbo NA
Figure 3‑27 ndash turbocharging for gasolineflex fuel vehicles international comparison (NA naturally aspirated)
31
ICCT white paper
4 vEhiCLE ENErGy CONSuMpTiON
this section analyzes the Brazilian new passenger vehicle energy consumption in 2013 although other metrics are more common (see box) vehicle energy consumption is presented in megajoules per kilometer (Mjkm) for consistency with Brazilrsquos inovar-auto policy in 2012 Brazilrsquos Ministry of Development industry and Foreign trade (MDic) adopted the inovar-auto policy with the aim of fostering industrial competitiveness through technology investments the policy includes a target for corporate average energy consumption (in Mjkm with vehicle curb weight as the attribute parameter) for vehicles sold in 2017
in the us canada Mexico and saudi arabia fleet-average fuel economy standards are defined as a function of vehicle footprint in the eu china japan south Korea and india vehicle weight is the attribute for the calculation of fleet-average targets in Brazil inovar-auto has defined its fiscal targets for vehicle energy consumption measured in megajoules per kilometer (Mjkm) as a function of vehicle weight
VEhiCLE ENERGY MEaSUREMENT UNiTS
Many metrics can be used to describe the amount of fuel energy or emissions generated by unit of distance traveled
Fuel economy measures distance traveled per unit of fuel consumed in Brazil kilometers per liter (kml) is the most common metric to describe vehicle efficiency but other units are used in different countries such as miles per gallon (mpg) in the us
Fuel consumption is the reciprocal of fuel economy and measures fuel consumed per distance traveled it is usually expressed in liters per 100 kilometers (l100 km) and it is used in europe for example
GhGCO2 emissions measures ghg or co2 emissions per distance traveled expressed as grams of pollutant per kilometer or mile
Energy consumption (EC) measures the energy consumed per distance traveled for example in megajoules per kilometer Despite being a less common metric it is sometimes preferred for being a fuel-neutral metric across different types of fuel and vehicle technologies Vehicle energy consumption in Mjkm is the metric used in Brazilrsquos inovar-auto policy to quantify the corporate average energy consumption target for each manufacturer Values for energy consumption in Brazilian spark-ignited vehicles are provided for e22 since that is the fuel mixture used in vehicle tests
Vehicle energy consumption in this report is calculated from co2 emissions data in the Brazilian institute of environment and renewable natural resources (iBaMa) nota Verde program (iBaMa 2014) which reports official emissions data from homologation tests Data are limited to passenger cars sold by the top 10 manufacturers with light commercial vehicles being excluded appendix D presents a description of data sources
32
Brazil Passenger Vehicle Market statistics
and calculation methodologies as well as a discussion of vehicle energy consumption data quality and completeness in Brazil
not surprisingly vehicle energy consumption increases with vehicle footprint and engine rated power the two parameters that define vehicle segments in Brazil (Figure 4‑1) subcompact and compact vehicles which accounted for about 45 of new sales in 2013 have average energy consumption below the fleet average while medium-sized vehicles which hold the largest market share (388) have energy consumption just above the fleet average larger more powerful vehicles consume more energy than the fleet average but have a considerably smaller market share (combined share of 163) Data availability for these segments is not as extensive as the data available for the subcompact compact and medium segments which could affect the relative rankings of each segment
Ene
rgy
cons
ump
tio
n (M
Jkm
)
Subco
mpac
t
Compac
t
Medium
Larg
e
O-road SUV
4000
200000
400000
600000
850000
35
30
25
20
15
10
05
0
Sales
Total 202
Figure 4‑1 ndash new vehicle sales-weighted average energy consumption by segment (2013)
33
ICCT white paper
Figures 4‑2 and 4‑3 illustrate new vehicle energy consumption for multiple weight and footprint bins For each weight bin (in 100 kg increments) and footprint bin (in 01 m2 increments) sales-weighted averages of energy consumption for each vehicle version are presented (dashes) generating energy consumption ranges for each bin (cream areas) Vehicle sales by bin are presented for reference in the lower charts
the strong correlation between vehicle energy consumption and weight follows from the strong physical relationship between the weight of the vehicle and the energy required to accelerate it and overcome resistances9 (Figure 4‑2) Data dispersion within each bin suggests that energy consumption varies due to other vehicle characteristics that affect vehicle aerodynamics and rolling resistance as well as the adoption of technologies that affect engine and transmission efficiency (eg friction reduction technologies gDi VVt)
Curb weight (kg)
SubcompactCompactMediumLargeO-roadSUV
Ene
rgy
cons
ump
tio
n (M
Jkm
)Sa
les
5
6
4
3
2
1
600k
800k
400k
200k
0k800 900 1000 1100 1200 1300 1400 1500 1600 1700 1800 1900 2000 2100
Figure 4‑2 ndash new vehicle energy consumption by vehicle weight (2013)
9 on a plain surface the sum of resistances of a vehicle is acceleration resistance + rolling resistance + aerodynamic resistance = c1 m a + c2 frr m + c3 cw a v2 with mass (m) as an integral part of both acceleration and rolling resistance which are most relevant for inner-city driving situations other factors are acceleration (a) rolling resistance of tires (frr) aerodynamic coefficient of the vehicle (cw) frontal area of vehicle (a) velocity (v) and constants (cx)
34
Brazil Passenger Vehicle Market statistics
Footprint has a reasonable correlation with energy consumption (Figure 4‑3) ie larger vehicles tend to consume more fuel than smaller vehicles however the correlation is not as strong as with vehicle weight similar to the previous figure the broad spread of energy consumption values suggests a combination of different vehicle characteristics (eg weight engine displacement rated power) and technologies (eg transmissions fuel systems) as well as the presence of suVs and off-road vehicles among the medium- and large-sized footprint values respectively
Footprint (m2)
SubcompactCompactMediumLargeO-roadSUV
Ene
rgy
cons
ump
tio
n (M
Jkm
)Sa
les
5
6
4
3
2
1
400k
500k
300k
200k
100k
0k31 32 33 34 35 36 37 38 39 40 41 42 43 44 45 46 48 49
Figure 4‑3 ndash new vehicle energy consumption by vehicle footprint (2013)
35
ICCT white paper
Figure 4‑4 illustrates sales weighted average for new vehicle energy consumption by mass for the top 10 manufacturers in Brazil in 2013 Bubble sizes are proportional to total vehicle sales Manufacturers in the lower-left quadrant produce the lightest and most efficient vehicles with hyundai presenting the best overall average energy consumption renault in the upper-left quadrant produces vehicles that are equivalent in weight but on average with higher energy consumption in the lower-right quadrant are manufacturers that produce relatively heavier vehicles but with lower energy consumption in their weight class Despite producing heavier vehicles on average than many manufacturers honda achieves lower energy consumption on average in the upper-right quadrant are manufacturers that produce on average the heavier and least efficient vehicles with Psa (citroen and Peugeot) producing the heaviest and least efficient cars on average a regression line correlating vehicle energy consumption and mass highlights the best performers (hyundai honda and nissan) average performers (Fiat Volkswagen gM and toyota) and those performing worse than average (renault Ford and Psa)
FIA
GMVW
FORREN
HYU
HON
TOY
PSA
NIS
160
170
180
190
200
210
220
230
240
250
950 1000 1050 1100 1150 1200 1250 1300 1350
Ene
rgy
cons
ump
tio
n (M
Jkm
)
Curb weight (kg)
Fleet Ave
Figure 4‑4 ndashaverage new vehicle sales-weighted energy consumption by manufacturer (2013)
36
Brazil Passenger Vehicle Market statistics
Figure 4‑5 shows fleet-average energy consumption based on certification and type approval data for new vehicles in multiple countries converted to the us caFe combined driving cycle Bubble sizes represent total sales of new passenger cars Because of data availability in different countries the country comparison is based on different calendars years for different countries 2011 for south Korea and japan 2012 for china and india and 2013 for europe the us and Brazil given annual improvements in vehicle energy consumption triggered by regulatory efficiency standards and fiscal incentives those countries with older data could be at a slight disadvantage in this comparison
With the heaviest vehicles on average the us fleet is also the most energy consuming of all countries china and south Korea have similar average energy consumption but since south Korean vehicles are heavier on average they are relatively more efficient than chinese vehicles although Brazilrsquos fleet consumes less fuel on average than those from the us china and south Korea its fleet is relatively inefficient when compared to countries with vehicles of similar weight (japan and india) the average Brazilian vehicle consumes about 34 more energy than the average vehicle in japan whose fleet has a large penetration of gasoline hybrid and advanced fuel-efficiency technologies such as three-cylinder engines VVa Dohc and 6-plus speed transmissions european vehicles are the best performing on average despite being heavier than all countries with the exception of the us and south Korea the adoption of fuel-efficiency technologies (eg Dct 6-plus-speed transmissions gDi turbocharging) contributes to europersquos better than average performance
China2012
SKorea2011
Europe2013
US2013
Japan2011
India2012
Brazil2013
Sales5 MM10 MM
14
16
18
20
22
24
26
28
1000 1100 1200 1300 1400 1500 1600 1700
Ene
rgy
cons
ump
tio
n ndash
CA
FE
(M
Jkm
)
Curb weight (kg)
Type-approval and certification energy consumption data only (does not include o-cycle or real-world driving data)
Figure 4‑5 ndash international comparison of passenger car energy consumption
Country labels indicate the dataset year
Figure 4‑6 provides a more detailed country comparison by illustrating average vehicle energy consumption by vehicle (curb) weight bin Vehicle sales in each bin are shown for reference the us is not shown due to lack of detailed model-by-model data Brazilrsquos vehicles on average have the highest energy consumption in most weight
37
ICCT white paper
bins with china being the second highest in most bins Because china has higher fuel consumption than Brazil on the 1000 bin which represents the highest share of vehicle sales fleet-average energy consumption in china is still higher than in Brazil as illustrated in the previous figure europe consistently performs best in terms of vehicle energy consumption in most weight bins with japan also performing relatively well
Curb weight (kg)
BrazilChinaEuropeIndiaJapanSouth Korea
Ene
rgy
cons
ump
tio
n C
AF
E (
MJ
km)
Sale
s
40
35
25
20
15
10
6M
8M
4M
2M
0M600 800 1000 1200 1400 1600 1800 2000 2200 2400
Figure 4‑6 ndash international comparison of average vehicle energy consumption by vehicle weight
Type-approval and certification energy consumption data only (does not include off-cycle or real-world driving data)
38
Brazil Passenger Vehicle Market statistics
Figure 4‑7 illustrates the distribution of energy consumption data in Brazil for each vehicle version by mass and segment Bubble sizes represent total sales of each version Data were limited to flex-fuel vehicles in the subcompact compact medium and large segments due to its relatively better data quality and representativeness (ie they represented over 87 of sales in 2013) While most vehicles follow a predictable trend that correlates energy consumption and vehicle mass there are a large number of versions with energy consumption substantially higher than the trend line this suggests there is substantial room for improvements in their energy consumption since there are vehicles in similar weight classes with substantially superior energy consumption performance
Sales1000050000
140
160
180
200
220
240
260
280
700 800 900 1000 1100 1200 1300 1400 1500 1600
Ene
rgy
cons
ump
tio
n (M
Jkm
)
Curb weight (kg)
Subcompact Compact Medium Large Fleet average
Figure 4‑7 ndash Distribution of new Brazilian passenger vehicle energy consumption data by vehicle weight and segment (2013)
this chapter suggests that there are potential improvements in vehicle energy consumption for the Brazilian fleet For similar vehicles in terms of weight class footprint or engine rating there is substantial dispersion in energy consumption indicating that there are vehicles performing much worse than the average across manufacturers there is also a clear trend of some manufacturers performing much better than the average while others have a lot more room for improvement the international comparison clearly shows that Brazilian vehicles perform much worse in terms of energy consumption than vehicles of similar weight suggesting a delay in the adoption of energy efficient technologies among Brazilian vehicle manufacturers
Finally a more detailed analysis of vehicle versions clearly illustrates a considerable number of vehicle versions significantly above average thus indicating potential improvements in energy consumption that would place them on par with better performing vehicles with similar characteristics
39
ICCT white paper
Deficiencies in data quality and completeness prevent more definite conclusions about vehicle energy consumption gasoline-only vehicles in particular have poor energy consumption data quality although they represent a relatively small fraction (6) of total vehicles sold in 2013 Because some vehicle segments are primarily composed of gasoline-only vehicles (eg sports minivans) this chapter excludes these segments from the analysis there are also concerns about the gap between energy consumption data reported by iBaMarsquos nota Verde and Brazilrsquos national institute of Metrology standardization and industrial Qualityrsquos (inMetro) labeling program (PBeV using its acronym in Portuguese) with the latter reporting consistently lower values of vehicle energy consumption
Finally the availability of energy consumption data was not adequate for many manufacturers beyond the top 10 sales group which prevented their inclusion in this analysis Despite the data quality and lack of completeness the energy consumption data in this chapter include data that are reasonably accurate and representative thus supporting its interpretation
40
Brazil Passenger Vehicle Market statistics
rEfErENCES
aDK automotive consultoria de Marketing (2013) relatoacuterios de volumes de vendas do mercado brasileiro para veiacuteculos de passeio e comerciais leves referentes a 2013
alves l Wilbert M (2014) reduccedilatildeo do imposto sobre Produto industrializado e a Venda de automoacuteveis Xi congresso usP iniciaccedilatildeo cientiacutefica em contabilidade
associaccedilatildeo nacional de transportes Puacuteblicos (antP 2014) estudo mostra baixo efeito do desconto no iPi de veiacuteculos sobre PiB e emprego available at httpwwwantporgbrwebsitenoticiasshowaspnpgcode=a4DeeFe8-a7BF-48D3-B1F5-8eDe1447BF10
associaccedilatildeo nacional dos Fabricantes de Veiacuteculos automotores (anFaVea 2015) anuaacuterio da induacutestria automobiliacutestica Brasileira 2015 Brazilian automotive industry Yearbook 2015 satildeo Paulo available at wwwanfaveacombr
european environment agency (2014) Monitoring co2 emissions from new passenger cars in the eu summary of data for 2013 april 2014
instituto Brasileiro do Meio ambiente e dos recursos naturais renovaacuteveis (iBaMa 2014) consulta dos niacuteveis de emissatildeo dos veiacuteculos novos brasileiros available at httpsservicosibamagovbrctfpublicosel_marca_modelo_rvepphp
international council on clean transportation (icct 2015) global passenger vehicle standards available at httpwwwtheicctorginfo-toolsglobal-passenger-vehicle-standards
international energy agency (iea 2015) renewables Bioenergy available at httpswwwieaorgtopicsrenewablessubtopicsbioenergy
Korea energy Management corporation (KeMco 2014) Fuel economy regulation available at httpwwwkemcoorkrnew_engmainmainasp
Marklines (2015) Marklines automotive industry Portal available at httpwwwmarklinescomen
Mendonccedila M sachsida a (2014) Modelando a demanda de creacutedito para veiacuteculos no Brasil uma abordagem com mudanccedila de regime iPea
Ministeacuterio do Desenvolvimento induacutestria e comeacutercio exterior (MDic 2013) Programa de incentivo agrave inovaccedilatildeo tecnoloacutegica e adensamento da cadeia Produtiva de Veiacuteculos automotores mdash inovar-auto httpwwwplanaltogov brccivil_03_ato2011-20142012DecretoD7819htm
stein r anderson j and Wallington t (2013) an overview of the effects of ethanol-gasoline Blends on si engine Performance Fuel efficiency and emissions SAE Int J Engines 6(1)470-487 2013 doi1042712013-01-1635
us environmental Protection agency and national highway traffic safety administration (ePanhtsa 2010) Final rulemaking to establish light-Duty Vehicle greenhouse gas emission standards and corporate average Fuel economy standards ePa-420-r-10-901
us environmental Protection agency (ePa 2012) regulatory impact analysis Final rulemaking for 2017-2025 light-Duty Vehicle greenhouse gas emission standards and corporate average Fuel economy standards ePa-420-r-12-016
41
ICCT white paper
us national academy of sciences (nas 2011) assessment of Fuel economy technologies for light-Duty Vehicles available at httpwwwnapeducatalog12924assessment-of-fuel-economy-technologies-for-light-duty-vehicles
World Bank group (2015) World Development indicators available at httpdataworldbankorgdata-catalogworld-development-indicators
42
Brazil Passenger Vehicle Market statistics
LiST Of ACrONyMS
4wD Four-wheel drive
aNFaVEa Brazilian association of automobile Manufacturers
awD all-wheel drive
BRiC Brazil russia india china
CaFE corporate average fuel economy
CBG compressed biogas
CO2 carbon dioxide
CVT continuously variable transmission
CVVT continuously variable valve technology
DCT Dual-clutch transmission
DOhC Dual overhead camshaft
EC energy consumption
Epa us environmental Protection agency
EU european union
FFV Flex-fuel vehicle
FTp Federal test procedure
FwD Front-wheel drive
GDi gasoline direct injection
GDp gross domestic product
GhG greenhouse gas
GM general Motors
iBaMa Brazilian institute of the environment and renewable natural resources
iC internal combustion
iCCT international council on clean transportation
iNMETRO national institute of Metrology standardization and industrial Quality
Kg Kilogram
Km Kilometer
Kw Kilowatt
LDV light-duty vehicle
LpG liquified petroleum gas
MDiC Ministry of Development industry and Foreign trade
MJ Megajoule
MpFi Multi-point fuel injection
Mpg Miles per gallon
NaS us national academy of sciences
43
ICCT white paper
NhTSa us national highway transportation safety administration
OhV overhead valve
pBEV Brazilian Vehicle labeling Program
pSa Psa Peugeot citroeumln
pTwR Power-to-weight ratio
pV Passenger vehicle
RwD rear-wheel drive
SOhC single overhead camshaft
SUV sport utility vehicle
US united states
USD us dollar
VTEC Valve timing electronic control
VVa Variable valve actuation
VVL Variable valve lift
44
Brazil Passenger Vehicle Market statistics
AppENDix A SEGMENT DEfiNiTiONS
Table a‑1 ndash segment definitions
Segmentpower (kw)
pTwR (kwkg) area (m2)
Other characteristics Examples
Subcompact lt 140 lt 0075 le 65 mdash Mini cooper chevrolet celta smart Fortwo
Compact lt 140 lt 0075 65 lt area le 70 mdash honda Fit hyundai hB20 Volkswagen Polo
Medium lt 140 lt 0075 70 lt area le 80 mdash honda civic nissan tiida Peugeot 308
Large lt 140 lt 0075 gt 80 mdash audi a4 BMW 3 series Mercedes c-class
Sports gt 140 gt 0075 mdash 4 seats maxjaguar XF lamborghini gallardo Ferrari california
Off‑road mdash mdash lt 80 traction = 4WDjeep cherokee honda cr-V BMW X3 hyundai santa Fe
SUV mdash mdash lt 80Based on aDKrsquos default classification
BMW X1 Ford ecosport hyundai tucson
Minivan mdash mdash Passengers 6-12
citroen grand Picasso Kia carnival
45
ICCT white paper
AppENDix b iNTErNATiONAL MArKET DATA
Table B‑1 ndash international market comparison of new fleet characteristics
parameters China S Korea EU US Japan india Brazil
Year 2012 2011 2013 2013 2011 2012 2013
Sales (million) 155 13 118 156 352 256 304
price (USD) $21008 $21383 $24439 mdash $20637 $11717 $22015
No of cylinders mdash 43 40 47 38 36 40
Displacement (cc) 1605 1960 1613 2606 1425 1294 1430
Curb weight (kg) 1296 1421 1391 1623 1193 1059 1106
Length (mm) 4323 4531 4263 mdash 4013 3859 4100
Footprint (m2) 38 420 40 425 371 341 367
Engine power (kw) 86 120 89 148 78 55 76
pTwR (kwkg) 00664 00844 00640 00912 00654 00519 00671
Energy consumption ndash US CaFE (MJKm)[1] 235 206 169 250 171 183 202
[1] energy consumption data presented here for countries other than Brazil were obtained from local official sources in its original metric and drive cycle and then converted to Mjkm under the us caFe drive cycle using the methodology described in Yang (2015) Mode details and historical fuel consumption data on their original metrics is presented in the icctrsquos global PV standard website httpwwwtheicctorginfo-toolsglobal-passenger-vehicle-standards
Data Sources
China Ministry of industry and information technology (Miit 2014) corporate average Fuel efficiency accounting Method for Passenger cars available at httpwwwgovcngzdt2013-0320content_2358627htm
Baseline performance china automotive research and technology center through internal communication and icct internal 2010 database for chinese light-duty vehicles
S Korea internal communication with s Korean official and from greencarcongress available at httpwwwgreencarcongresscom200906korea-20090604html
EU european environment agency (2014) Monitoring co2 emissions from new passenger cars in the eu summary of data for 2013 april 2014
US us ePa (2014) light-duty automotive technology carbon dioxide emissions and fuel economy trends1975 through 2014 table 91 page 110 available at http httpwwwepagovfueleconomyfetrends1975-2014420r14023apdf
Japan jaMa (2010) the Motor industry of japan available at httpwwwjama-englishjppublicationsMVs2010pdf Mlit httpwwwmlitgojpcommon000990330pdf
india Bureau of energy efficiency white paper 2010-2012 calculation based on icct database
Brazil icct Brazil Vehicle Database (2013)
46
Brazil Passenger Vehicle Market statistics
Table B‑2 ndash international market comparison of technology adoption in new vehicles
Technology adoption China S Korea EU US Japan india Brazil
Year 2010 2011 2013 2013 2011 2012 2013
Fuel type
CBGLpGFlex 0 11 2 0 0 4 94
Gasoline 99 65 44 93 86 56 6
hybrid 0 1 1 5 13 0 0
Diesel 1 23 53 1 0 40 0
No of cylinders
Two 0 0 0 0 0 6 0
Three 4 0 7 0 36 28 3
Four 90 84 87 56 57 65 97
Five 0 0 1 0 0 0
Six 6 15 4 32 5 0 1
Eight or more 0 0 0 12 1 0 0
Transmission
Manual 60 3 83 5 1 98 83
automatic 34 90 9 75 34 2 15
CVT 5 7 2 18 65 0 1
DCT 1 0 6 2 mdash 0 1
Number of gear ratios
Four or fewer 13 16 1 7 mdash 10 6
Five 68 9 45 11 mdash 85 83
Six or more 19 75 54 82 mdash 5 11
Drivetrain
FwD 74 86 81 83 59 76 0
RwD 21 7 7 10 5 22 0
4wD and awD 5 7 12 7 36 2 100
No of valves per cylinder
Two 17 mdash mdash 2 4 25 60
Multi valve 83 mdash mdash 98 95 75 40
Valve camshaft configuration
Single overhead camshaft 26 1 mdash mdash 16 41 63
Dual overhead camshaft 74 84 mdash mdash 82 53 25
Overhead camshaft mdash 15 mdash mdash 0 6 mdash
Valve actuation
Fixed 50 16 mdash 2 11 86 78
VVT 44 84 mdash 98 89 12 16
VVL 6 mdash mdash mdash mdash 2 6
Fuel systems for gasoline vehicles
Multi‑point fuel injection 94 72 68 62 95 100 98
Gasoline direct injection 6 28 32 37 5 0 2
air induction systems for gasoline vehicles
Naturally aspirated 93 75 41 85 92 64 97
Supercharger turbocharger or twin‑turbo 7 25 59 15 8 36 3
47
ICCT white paper
AppENDix C NEW vEhiCLE ChArACTEriSTiCS AND TEChNOLOGy ADOpTiON DATA iN brAziL
Table C‑1 ndash Fleet characteristics of new Brazilian passenger vehicles by segment (2013)
parameters Subcompact Compact Medium Large Sports Off‑road SUV Minivan
Sales (thousands) 6785 6843 11790 1920 273 768 1997 23
Market share () 223 225 38 8 63 09 25 65 01
price (R$) $30103 $38732 $45496 $66508 $148834 $151284 $75164 $82284
No of cylinders 400 391 399 400 462 448 404 433
Displacement (cc) 1128 1293 1447 1794 2430 2586 1884 2244
Curb weight (kg) 940 1037 1102 1329 1561 1772 1395 1604
Length (mm) 3804 4026 4163 4499 4711 4516 4352 4658
Footprint (m2) 339 361 371 402 418 409 402 427
Engine power ndash gasoline (kw) 58 68 75 99 183 146 103 120
Engine power ndash ethanol (kw) 59 70 77 98 mdash 109 101 mdash
pTwR ndash gasoline (kwkg) 00614 00655 00671 00742 01173 00828 00731 00732
pTwR ndash ethanol (kwkg) 00630 00678 00697 00757 mdash 00766 00745 mdash
48
Brazil Passenger Vehicle Market statistics
Table C‑2 ndash Fleet characteristics of new Brazilian passenger vehicles by manufacturer (2013)
parameters Fiat
GM
Vo
lksw
agen
Ford
Ren
ault
hyu
ndai
ho
nda
Toyo
ta
pSa
Nis
san
Mit
sub
ishi
Kia
JaC
BM
w
Land
Rov
er
Mer
ced
es‑B
enz
Che
ry
aud
i
Suzu
ki
Jeep
Sales (thousands) 6087 5486 5448 3074 2207 2055 1392 1334 1163 621 368 255 158 141 106 94 80 67 63 36
Market share () 2002 1804 1792 1011 726 676 458 439 383 204 121 084 052 046 035 031 026 022 021 012
price (R$) $35017 $42259 $38701 $46174 $43447 $50112 $67078 $68922 $103001 $44035 $100696 $87009 $37654 $165111 $221943 $153281 $30821 $142799 $74769 $139039
No of cylinders 400 401 400 402 400 370 400 400 400 400 408 416 400 424 448 431 400 411 400 552
Displacement (cc) 1250 1340 1287 1497 1423 1495 1691 1808 1575 1579 2262 1856 1411 2095 2281 1934 1398 1912 1831 3182
Curb weight (kg) 1033 1060 1020 1156 1102 1122 1210 1201 1231 1069 1556 1377 1079 1624 1868 1598 1097 1551 1444 1945
Length (mm) 3965 4155 3993 4120 4127 4078 4319 4299 4116 4171 4401 4357 3956 4574 4487 4527 3896 4454 4234 4584
Footprint (m2) 345 370 354 368 378 383 397 387 376 379 395 407 351 429 433 429 349 417 323 420
Engine power ndash gasoline (kw) 64 71 65 79 73 86 96 90 80 82 120 112 83 151 179 138 71 136 94 162
Engine power ndash ethanol (kw) 65 72 65 79 76 85 97 90 81 82 107 106 95 mdash mdash mdash 75 mdash mdash mdash
pTwR ndash gasoline (kwkg)
00613 00662 00631 00674 00657 00739 00788 00745 00646 00766 00779 00792 00784 00921 00977 00856 00638 00870 00649 00835
pTwR ndash ethanol (kwkg) 00629 00681 00642 00693 00685 00781 00800 00795 00660 00768 00710 00798 00896 mdash mdash mdash 00659 mdash mdash mdash
49
ICCT white paper
Table C‑3 ndash Fleet characteristics of new Brazilian passenger vehicles by origin (2013)
parameters Domestic imported
Sales (thousands) 2537 504
Market share () 834 166
price (R$) $41739 $76049
No of cylinders 397 412
Displacement (cc) 1359 1791
Curb weight (kg) 1070 1289
Length (mm) 4063 4285
Footprint (m2) 362 390
Engine power ndash gasoline (kw) 70 102
Engine power ndash ethanol (kw) 73 84
pTwR ndash gasoline (kwkg) 0065 0076
pTwR ndash ethanol (kwkg) 0068 0074
50
Brazil Passenger Vehicle Market statistics
Table C‑4 ndash technology adoption in new Brazilian passenger vehicles by segment (2013)
Technology adoption Subcompact Compact Medium Large SportOff‑road SUV Minivan
Fuel type
Flex 982 988 982 837 00 134 826 00
Gasoline 18 12 17 163 996 540 174 1000
hybrid 0000 0000 0028 0000 0396 0001 0000 0000
Diesel 00 00 00 00 00 326 00 00
No of cylinders
Three 01 91 10 00 00 00 00 00
Four 999 909 990 998 758 775 979 833
Five 00 00 00 02 03 00 00 00
Six 00 00 00 00 175 211 21 167
Eight or more 00 00 00 00 63 13 00 00
Transmission
Manual 993 944 826 622 62 174 505 641
automatic 07 55 161 283 629 707 451 359
CVT 00 00 12 89 09 93 34 00
DCT 00 01 02 06 299 25 10 00
No of gear ratios
Four or fewer 04 47 72 51 00 34 247 193
Five 984 943 848 378 15 392 516 641
Six 12 09 73 515 796 462 225 167
Seven 00 01 06 23 87 53 12 00
Eight or more 00 00 01 32 102 59 00 00
Drivetrain
FwD 998 1000 997 688 550 00 916 1000
RwD 02 00 03 311 221 00 84 00
awD 00 00 00 01 229 1000 00 00
No of valves per cylinder
Two 806 694 584 195 00 00 258 00
Multi valve 194 306 416 805 1000 1000 742 1000
Valve camshaft configuration
Single overhead camshaft 839 786 709 309 00 212 375 00
Dual overhead camshaft 24 158 161 546 880 517 446 255
Valve actuation
Fixed 982 729 807 461 49 493 664 868
VVT 18 211 115 470 827 367 252 132
VVT+VVL 00 61 78 68 124 140 84 00
Fuel systems for gasoline vehicles
Multi‑point fuel injection 999 998 997 949 979 143 766 1000
Gasoline direct injection 01 02 03 51 21 857 234 00
air induction systems for gasoline vehicles
Naturally aspirated 999 997 995 943 974 369 543 1000
Supercharger turbocharger or twin‑turbo 01 03 05 57 26 631 457 00
51
ICCT white paper
Table C‑5 ndash technology adoption in new Brazilian passenger vehicles by manufacturer (2013)
Technology adoption Fi
aT
GM
VO
LKSw
aG
EN
FOR
D
REN
aU
LT
hY
UN
Da
i
hO
ND
a
TOYO
Ta
pSa
NiS
SaN
MiT
SUB
iSh
i
Kia
JaC
BM
w
LaN
D R
OV
ER
MER
CED
ES
Fuel type
Flex 990 987 965 966 997 921 999 886 928 998 283 739 31 42 00 00
Gasoline 10 09 35 34 03 79 01 35 72 02 557 255 969 957 663 950
hybrid 00 00 00 00 00 00 00 02 00 00 00 00 00 00 00 00
Diesel 00 04 00 00 00 00 00 77 00 00 160 06 00 00 337 50
No of cylinders
Three 00 00 05 00 00 348 00 00 00 00 00 00 00 00 00 00
Four 1000 996 994 989 1000 626 999 998 1000 1000 958 922 1000 906 787 878
Five 00 00 00 00 00 00 00 00 00 00 00 00 00 00 00 00
Six 00 02 01 11 00 26 01 02 00 00 42 78 00 68 185 87
Eight or more 00 02 00 00 00 00 00 00 00 00 00 00 00 26 28 35
Transmission
Manual 992 878 985 846 853 632 566 565 703 785 493 120 1000 02 00 151
automatic 08 103 00 137 62 285 355 160 297 121 118 793 00 575 18 14
CVT 00 19 15 16 41 70 01 246 00 00 139 87 00 423 982 836
DCT 00 00 00 00 43 13 78 30 00 94 251 00 00 00 00 00
No of gear ratios
Four or fewer 02 04 00 55 104 237 00 323 249 132 17 133 00 00 00 00
Five 981 811 963 839 797 623 861 643 684 828 530 107 1000 00 00 64
Six 17 185 29 106 99 140 139 07 67 40 453 754 00 217 800 00
Seven 00 00 07 00 00 00 00 27 00 00 00 00 00 08 00 936
Eight or more 00 00 00 00 00 00 00 00 00 00 00 06 00 775 200 00
Drivetrain
FwD 1000 902 989 972 987 985 990 892 1000 1000 496 623 1000 00 00 00
RwD 00 91 00 00 00 00 00 16 00 00 00 370 00 882 00 900
awD 00 06 11 28 13 15 10 92 00 00 504 07 00 118 1000 100
No of valves per cylinder
Two 811 864 988 745 220 00 00 00 00 00 00 00 00 00 00 00
Multi Valve 189 136 12 255 780 1000 1000 1000 1000 1000 1000 1000 1000 1000 1000 1000
Valve camshaft configuration
SOhC 836 755 914 675 832 00 04 00 497 398 331 00 00 00 00 00
DOhC 07 108 56 50 168 992 786 875 352 428 477 1000 907 810 860 453
Valve actuation
Fixed 1000 898 965 966 940 29 00 574 736 573 435 76 124 187 18 55
VVT 00 102 35 34 60 971 00 426 264 427 00 924 876 00 982 945
VVT+VVL 00 00 00 00 00 00 1000 00 00 00 565 00 00 813 00 00
air induction System
Naturally aspirated 997 994 966 977 997 988 1000 923 922 1000 835 936 1000 97 37 101
Supercharger turbocharger or twin‑turbo
03 06 34 23 03 12 00 77 78 00 165 64 00 903 963 899
Fuel systems for gasoline vehicles
Multipoint fuel injection 1000 995 965 972 1000 989 1000 1000 967 1000 994 1000 1000 78 15 158
Gasoline Direct injection 00 05 35 28 00 11 00 00 33 00 06 00 00 922 985 842
note Difference between 100 and summation of sohc and Dohc market share values corresponds to data not available
52
Brazil Passenger Vehicle Market statistics
AppENDix D DATA SOurCES AND COMpLETENESS
the basis of the statistics shown in this report is a database compiled by the icct with vehicle sales technical information (eg fleet characteristics technology content) and energy consumption (converted from either co2 emissions or fuel economy) from various data sources outlined in table D-1
Table D‑1 ndash Brazilian data sources
parameters Sales TechnicalEnergy
consumption
aDK (2014 2015) x x
MarkLines (2015) x
iBaMa (2014) x
iNMETRO (2014) x
UOL (2014) x
icarroscom (2014) x
this analysis examined energy consumption data from two public sources the nota Verde Program by the Brazilian institute of the environment and renewable natural resources (iBaMa) and the Brazilian Vehicle labeling Program (PBeV) by the national institute of Metrology standardization and industrial Quality (inMetro) table D-2 summarizes key differences between these two data sources
Table D‑2 ndash energy consumption data sources
iBaMa iNMETRO
program nota Verde1 Brazilian Vehicle labeling Program (PBeV)2
program description
Mandatory program that reports emissions of co2 co nox and nMhc as part of emissions certification program
Voluntary program since 2009 that allows the comparison of fuel economy across vehicle models
Unit gco2 km kml
Test cycle chassis testing under urban (FtP) driving cycle based on nBr 66012005
chassis testing under urban (FtP) and highway (hWYFe) driving cycles based on nBr 702420103
adjustment
no adjustment for real-world driving conditions Because reported co2 emissions are assumed to be zero for ethanol adjustments were made to account for tailpipe co2 emissions for vehicles running on ethanol
since 2010 published values include real-world adjustment factors to chassis test data a method adopted by the us ePa in 2008
Conversion to MJkm
iBaMarsquos data are reported as FtP (city test) co2 data in gco2 km conversion to caFe test cycle and to a different metric (Mjkm) involves four steps as presented in Figure D-1
inMetrorsquos data in kml are presented separately by fuel type (e22 e100) and driving cycle (urban highway) conversion to Mjkm was done by applying a conversion factor (2167 gco2 l for e22 and 1428gco2l for e00) caFe values are obtained by using a 5545 weighting for the urban (FtP) and highway cycles respectively
1 iBaMa (2014) nota Verde program available at httpwwwmmagovbrcidades-sustentaveisqualidade-do-arcontrole-de-emissoes-veicularesnota-verde
2 inMetro (2014) Programa Brasileiro de etiquetagem Veicular (PBeV) available at httpwwwinmetrogovbrconsumidortabelas_pbe_veicularasp
3 inMetro (2014) Metodologia Para Divulgaccedilatildeo De Dados De consumo Veicular available at httpwwwinmetrogovbrconsumidorpbeMetodologia_consumo_Veicularpdf
53
ICCT white paper
Step 1 Correcting the original IBAMA CO2 reported data ndash FTP CO2 gkm
IBAMArsquos CO2 reported values are corrected to account for tailpipe emissions from ethanol (tailpipe CO2 emissions are reported as zero in IBAMArsquos data)
bull E22 FTP reported CO2 data are reduced by 177bull E100 FTP reported CO2 data are reduced by 100
Flex fuel vehicles are tested with E22 and E00 the final values is calculated as the average of both fuelsCO2 IBAMA_Flex_FTP= 05(1-0177)CO2_E22_test_FTP + 050E100_FTP = 050823CO2_E22_FTPFor Gasoline only vehicles the tests are carried out only with Gasoline E22CO2 IBAMA_Gasoline_FTP = (1-0177) CO2_E22_Test_FTP
Where in the previous equations CO2_E22_FTP means CO2 emissions values obtained under FTP testingCO2 IBAMA_Flex_FTP means IBAMArsquos Corrected FTP values for flex vehiclesCO2 IBAMA_Gasoline_FTP means IBAMArsquos Corrected FTP values for gasoline only (E22) vehicles
INNOVAR AUTO is based on energy consumption data obtained as the combined CAFE test cycle This requires a weighted average of energy consumption data obtained from FTP testing (city driving ) and Highway fuel economy testing (HWFET) In mathematical form CAFE=f(FTPHWFET)
Given that IBAMA data is provided for only the first aprt the FTP testing then it is required to find a way to calculate CAFE combined values through FTP -75 only data A linear function was thus developed from data with FTP and HWY values (INMETRO data) is used to convert FTP only values to CAFE CO2 values ie CAFE=f(FTP) The function used for this conversion is
CO2_CAFE= (CO2_FTP+44756)11572
Step 2Convert FTP CO2 values to CAFE CO2 values
Converting CO2 values to MJkm values is done by using the energy density of E22 Note that all the previous calculations for CO2 come from E22-based data
bull The energy density of E22 is 2894 MJLE22bull E22 emits 2167gCO2LE22bull CAFE (MJkm) = CAFE (gCO2km) (2894 MJLE22 2167 gCO2LE22)
Step 3 Convert US CAFE CO2 values to MJkm values
Figure D‑1 ndash conversion of emission to energy consumption data
energy consumption values calculated from iBaMa and inMetro data differ greatly Figure D-1 illustrates energy consumption data for those models in both databases iBaMa data are on average 126 higher than inMetro data with a standard deviation of 89 and a maximum deviation of 39
54
Brazil Passenger Vehicle Market statistics
0
05
1
15
2
25
3
0 05 1 15 2 25 3
Ene
rgy
cons
ump
tio
n IB
AM
A (
MJ
km)
Energy consumption INMETRO (MJkm)
n=151
Figure D‑2 ndash comparison between energy consumption data from inMetro and iBaMa
151 vehicles tested under both programs
although inMetro data are more transparent as it breaks down fuel economy by fuel and test cycle it is still a voluntary program that allows manufacturers to select which models will participate in addition not all manufacturers participate in the program in turn iBaMa data only include co2 data for the urban cycle and thus energy consumption in the combined cycle had to be estimated from correlations using international data in addition corrections had to be made for gasoline-only engines since it seems that a co2 discount in theory only applicable to flex-fuel engines was also applied to gasoline-only engines Despite these data quality issues iBaMa data were considered the most adequate data source for energy consumption because it is a mandatory program that requires data reporting by all vehicle models and manufacturers
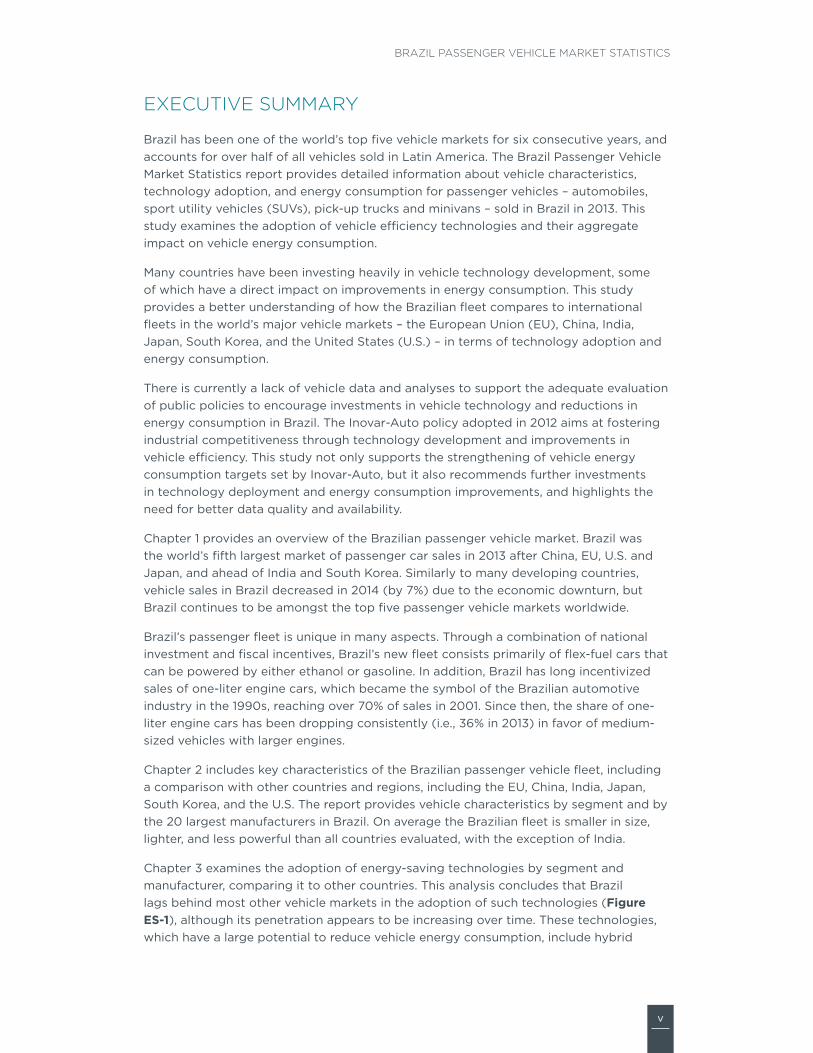
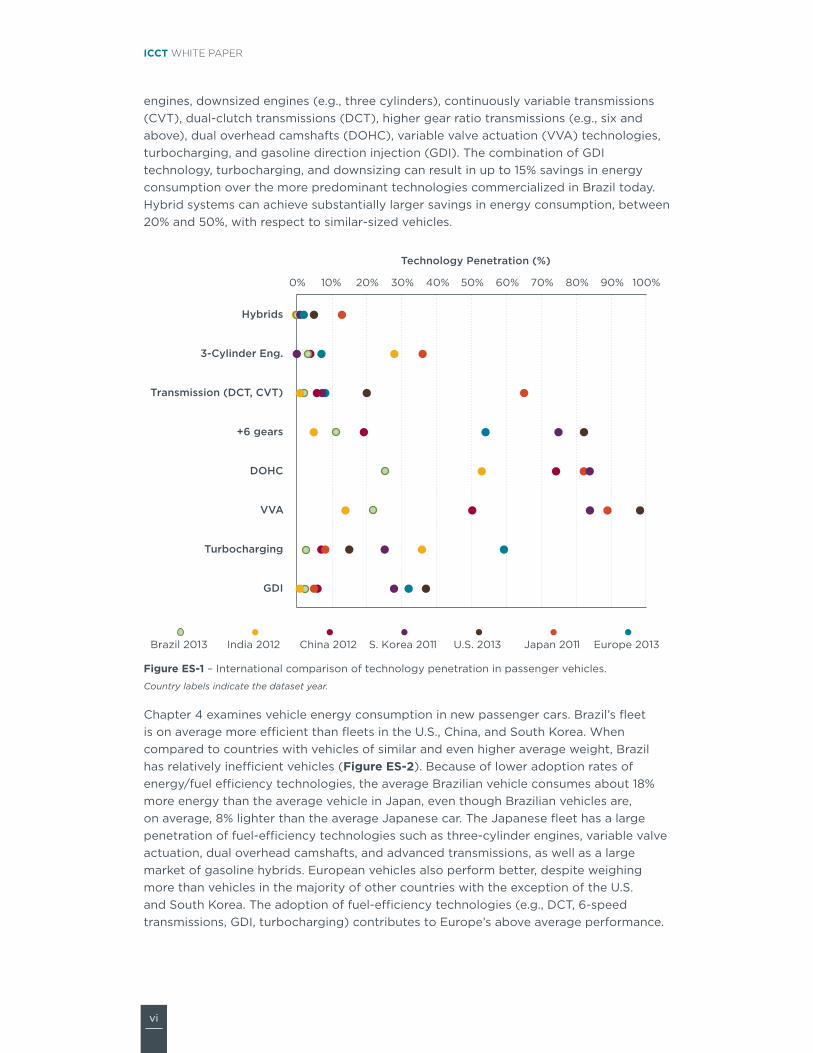
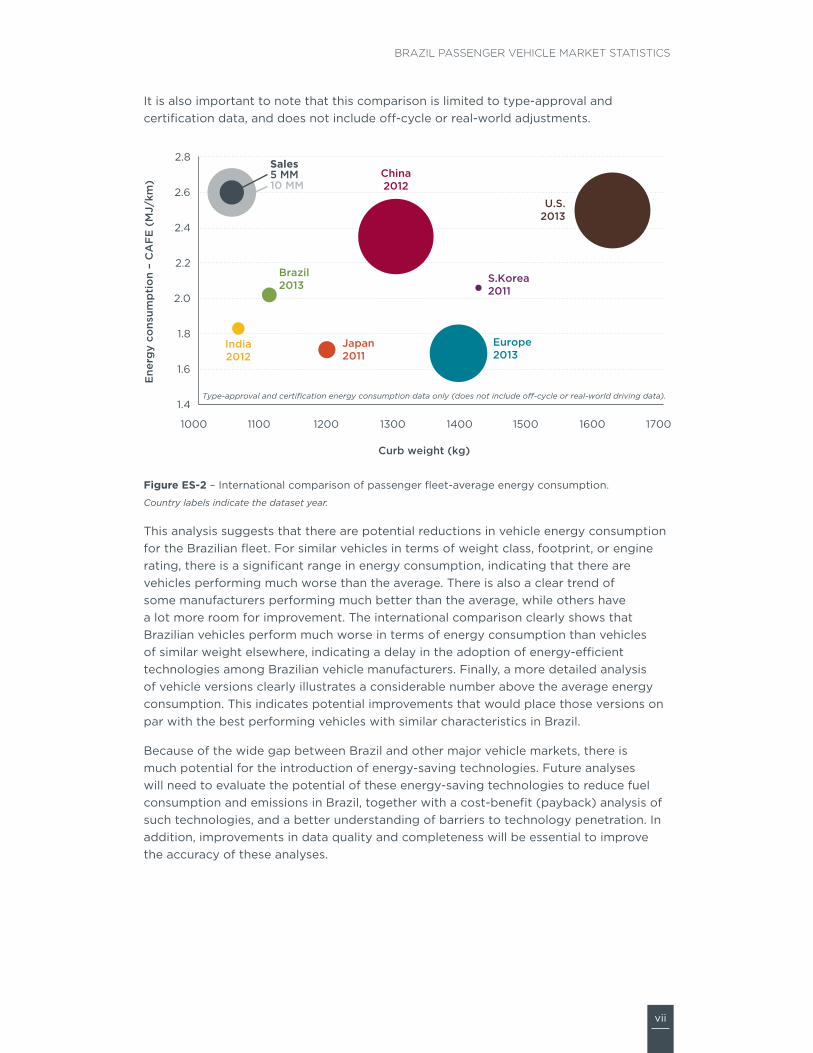
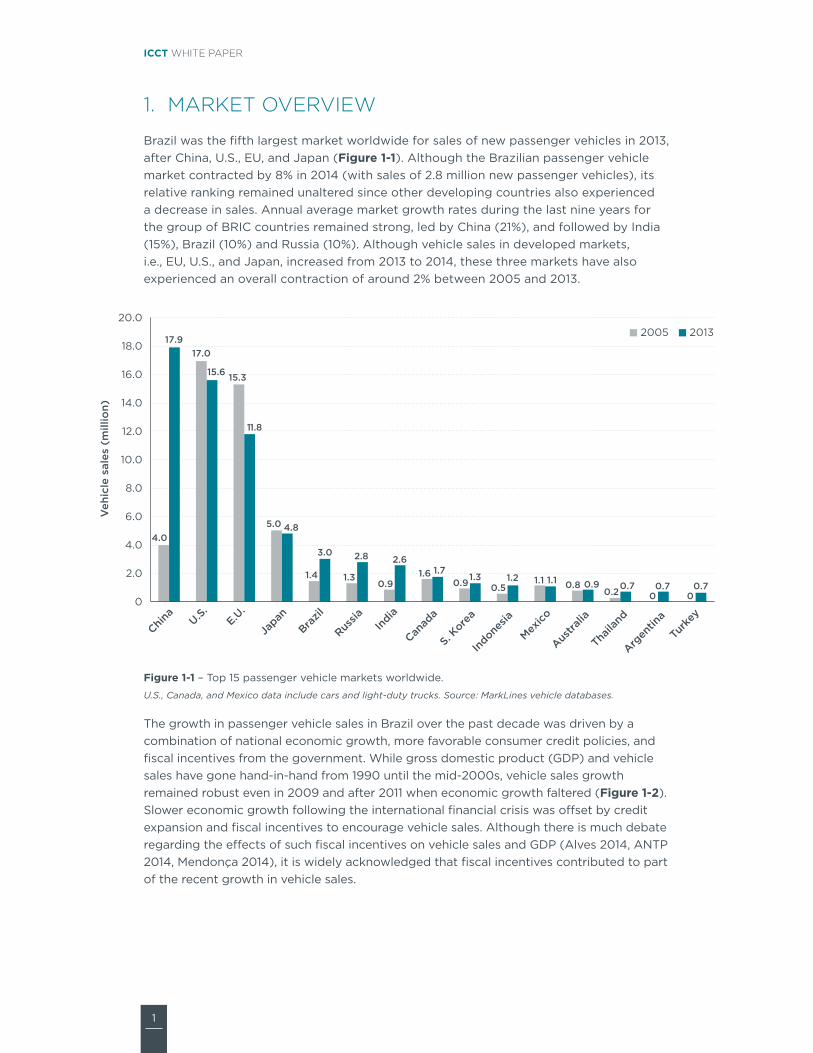
1
ICCT white paper
1 MArKET OvErviEW
Brazil was the fifth largest market worldwide for sales of new passenger vehicles in 2013 after china us eu and japan (Figure 1‑1) although the Brazilian passenger vehicle market contracted by 8 in 2014 (with sales of 28 million new passenger vehicles) its relative ranking remained unaltered since other developing countries also experienced a decrease in sales annual average market growth rates during the last nine years for the group of Bric countries remained strong led by china (21) and followed by india (15) Brazil (10) and russia (10) although vehicle sales in developed markets ie eu us and japan increased from 2013 to 2014 these three markets have also experienced an overall contraction of around 2 between 2005 and 2013
40
170
153
50
14 1309
1609 05
11 0802 0 0
179
156
118
48
30 28 2617
13 12 11 09 07 07 07
0
20
40
60
80
100
120
140
160
180
200
China
US
EU
Japan
Brazil
Russia
India
Canad
a
S Kore
a
Indone
sia
Mexico
Austra
lia
Thaila
nd
Argen
tina
Turk
ey
Veh
icle
sal
es (
mill
ion)
2005 2013
Figure 1‑1 ndash top 15 passenger vehicle markets worldwide
US Canada and Mexico data include cars and light-duty trucks Source MarkLines vehicle databases
the growth in passenger vehicle sales in Brazil over the past decade was driven by a combination of national economic growth more favorable consumer credit policies and fiscal incentives from the government While gross domestic product (gDP) and vehicle sales have gone hand-in-hand from 1990 until the mid-2000s vehicle sales growth remained robust even in 2009 and after 2011 when economic growth faltered (Figure 1‑2) slower economic growth following the international financial crisis was offset by credit expansion and fiscal incentives to encourage vehicle sales although there is much debate regarding the effects of such fiscal incentives on vehicle sales and gDP (alves 2014 antP 2014 Mendonccedila 2014) it is widely acknowledged that fiscal incentives contributed to part of the recent growth in vehicle sales
2
Brazil Passenger Vehicle Market statistics
0
500
1000
1500
2000
2500
3000
00
05
10
15
20
25
30
35
199
0
199
1
199
2
199
3
199
4
199
5
199
6
199
7
199
8
199
9
200
0
200
1
200
2
200
3
200
4
200
5
200
6
200
7
200
8
200
9
2010
2011
2012
2013
GD
P (
bill
ion
curr
ent
US$
)
Veh
icle
sal
es (
mill
ion)
Figure 1‑2 ndash comparison of passenger vehicle sales and economic growth in Brazil
Sources ANFAVEA 2015 World Bank databases
one-liter engine vehicles have consistently lost market share since 2001 Brazil has historically encouraged the sales of small-engine vehicles through lower sales taxes From 1990 to 2001 one-liter engine automobiles became the symbol of the national automotive industry and their share in total sales increased from 4 to over 70 (anfavea 2015) in the 2000s the number of vehicle manufacturers in Brazil increased from 15 to 46 and the government started to provide tax incentives to flex-fuel cars independently of engine size Because of increasing competition amongst automakers a narrower gap between taxes for one-liter engine cars and flex-fuel cars and increasing consumer preference for more comfort and powerful engines the share of one-liter engine cars decreased to 36 in 2013 While the relative participation of one-liter engine cars has decreased total one-liter vehicle sales have increased continuously in the same period from 780000 units sold in 2001 to over 11 million in 2013 (Figure 1‑3)
3
ICCT white paper
0
10
20
30
40
50
60
70
80
90
100
00
02
04
06
08
10
12
14
16
18
20
199
0
199
1
199
2
199
3
199
4
199
5
199
6
199
7
199
8
199
9
200
0
200
1
200
2
200
3
200
4
200
5
200
6
200
7
200
8
200
9
2010
2011
2012
2013
10
L S
hare
New
10
L e
ngin
e ve
hicl
e re
gis
trat
ions
(m
illio
n)
Figure 1‑3 ndash new registrations of one-liter engine vehicles
Source ANFAVEA 2015
Due to a long-standing national program to stimulate ethanol consumption ethanol is sold as e100 (100 ethanol by volume) as well as being blended in gasoline the government sets the ethanol blend in commercial gasoline ranging from 20 to 27 ethanol depending on the current blend mandate (e20-e25 since 2011 and e27 in 2015) as a result biofuels in Brazil account for about 25 of road transport fuel demand compared to less than 35 globally (iea 2015)
ethanol availability at different blend levels has had a strong impact over consumer choices and technologies offered in the market by manufacturers until the 2000s sales of gasoline or ethanol vehicles were driven primarily by fuel prices with ethanol vehicles dominating sales in the 1980s and very strong sales of gasoline engines in the 1990s today flex-fuel engines those that can run on any combination of ethanol and gasoline are currently ubiquitous in new passenger vehicles since their introduction in 2003 flex-fuel engines now dominate the passenger vehicle market accounting for 94 of new sales in 2013 (Figure 1‑4) sales of new diesel passenger cars have been below 1 of total sales since 2005 (anFaVea 2015)
4
Brazil Passenger Vehicle Market statistics
0
10
20
30
40
50
60
70
80
90
100
198
019
81
198
219
83
198
419
85
198
619
87
198
819
89
199
019
91
199
219
93
199
419
95
199
619
97
199
819
99
200
020
01
200
220
03
200
420
05
200
620
07
200
820
09
2010
2011
2012
2013
Pas
seng
er c
ar f
uel m
arke
t sh
are
Gasoline Ethanol Flex
Figure 1‑4 ndash registrations of new passenger vehicles by fuel type
Source ANFAVEA 2015
the top seven manufacturers ndash Fiat general Motors (gM) Volkswagen Ford renault hyundai and honda ndash commanded a vast majority (83) of the entire market in 2013 with the remaining manufacturers accounting for less than 4 of market sales each (Figure 1‑5) the Volkswagen gol is the most popular vehicle in Brazil accounting for about 45 of all sales in 2013 Medium-sized vehicles dominate the market with 39 of all sales followed by compact and subcompact vehicles which together make up 84 of the entire market in addition domestically manufactured vehicles accounted for more than 83 of sales in 2013 which represented a small increase with respect to the previous year
FIAT20
GM18
VOLKSWAGEN18
FORD10
RENAULT7
HYUNDAI7
HONDA5
TOYOTA 4
PSA 4
NISSAN 2
Others 5
2013 market shareby manufacturer
Subcompact22
Compact22Medium
39
Large6
Sport1
O-Road3
SUV7
Minivan01
2013 market shareby segment
Figure 1‑5 ndash Market share of new passenger vehicles by manufacturer and segment (2013)
Source ADK
5
ICCT white paper
Table 1‑1 summarizes key indicators for the Brazilian passenger vehicle market in 2012 and 2013 Fiat remained the market leader in 2013 although with a small loss and gM overtook Volkswagen in 2013 amongst the companies that gained the most market share are hyundai and toyota both of which doubled their market share between 2012 and 2013 on the other hand Psa and nissan lost market shares in this period the market dominance of medium-sized vehicles in 2013 marks a significant shift in consumer preferences Between 2012 and 2013 the subcompact segment lost the majority share (from 33 to 22) and the larger compact and medium segments gained sizable shares
Table 1‑1 ndash Market characteristics of new Brazilian passenger vehicles
parameter 2012 2013
Sales (million) 311 304
price (R$) $47203 $47446
Domestic market share 800 834
Engine 10 L share 386 363
Fuel share
Flex 914 936
Gasoline 82 59
hybrid 0004 0014
Diesel 04 05
Segment market share
Subcompact 332 223
Compact 162 225
Medium 335 388
Large 79 63
Sport 07 09
Off‑road 23 25
SUV 61 66
Minivan 01 01
Manufacturer market share
Fiat 221 200
GM 176 180
Volkswagen 211 179
Ford 96 101
Renault 73 73
hyundai 32 68
honda 43 46
Toyota 24 44
pSa 44 38
Nissan 28 20
Mitsubishi 13 12
Kia 11 08
JaC 06 05
BMw 03 05
Land Rover 03 03
Mercedes‑Benz 02 03
Others 02 14
sales-weighted average
6
Brazil Passenger Vehicle Market statistics
2 vEhiCLE fLEET ChArACTEriSTiCS
this chapter provides an overview of key vehicle fleet characteristics in Brazil number of cylinders engine displacement curb weight1 length footprint2 engine power and power-to-weight ratio (PtWr)3 are relevant indicators to characterize a vehicle fleet and understand individual vehicle and fleet-average energy consumption4
these key characteristics of passenger vehicles in Brazil experienced a small change in 2013 compared to 2012 (Table 2‑1) With the exception of number of cylinders all parameters increased in 2013 consistent with a trend of increasing market shares for larger and more powerful vehicles the evaluation of minimum and maximum parameters also provides important insights While the smallest vehicles continue to be sold in Brazil (since the minimum values did not change with the exception of footprint) it is evident that much larger vehicles started being sold in 2013 represented by the large variation in the maximum values of each parameter Because sales of these recently introduced larger vehicles are relatively small their effect on weighted average parameters is also modest
Figure 2‑1 illustrates key vehicle fleet characteristics by vehicle segment (see appendix a for segment definition) not surprisingly most parameters get larger between the subcompact and large segments off-road vehicles sports cars and minivans tend to be the largest and most powerful vehicles across the fleet while sport utility vehicles (suVs) tend to be comparable with vehicles in the ldquolargerdquo segment Because of their high performance (absolute and relative to vehicle size) sports cars have significantly larger engine power and PtWr compared to all other segments sports vehicles primarily imported are not sold in a flex-fuel configuration and consume strictly gasoline Flex-fuel vehicles have slightly higher engine power and PtWr than their gasoline counterparts in most segments Detailed sales-weighted average data by segment are presented in Table C‑1 in appendix c
1 Based on norm aBnt nBr iso 1176 2006 curb weight is the total weight of a vehicle with standard equipment all necessary operating consumables (eg motor oil and coolant) a full tank of fuel but not loaded with passengers or cargo
2 Footprint (m2) is the product of the distance between the axles of a vehicle (wheelbase) and the distance between the centerline of the tires (average trackwidth)
3 Power to weight ratio (PtWr) is defined as the rated power of the engine (kW) divided by the vehicle weight (kg) PtWr is a metric that describes vehicle acceleration and handling and it is thus used in Brazil as a criterion to classify sports vehicles (PtWr gt 0075 kWkg)
4 Vehicle energy consumption is presented in megajoules per kilometer (Mjkm) for consistency with the vehicle energy consumption targets established by inovar-auto although e27 is currently being used flex-fuel vehicles are tested with e22 fuel
7
ICCT white paper
Table 2‑1 ndash Fleet characteristics of new Brazilian passenger vehicles
Vehicle characteristic 2012 2013 Variation
Number of cylinders weighted average 402 400 ‑06
Displacement (cc)
Min 970 970
Max 6498 6749
weighted average 1418 1430 08
Curb weight (kg)
Min 800 800
Max 2940 2710
weighted average 1102 1106 04
Length (mm)
Min 2695 2695
Max 5290 5842
weighted average 4089 4100 03
Footprint (m2)
Min 217 241
Max 523 874
weighted average 364 367 09
Engine power ndash gasoline (kw)
Min 33 33
Max 153 545
weighted average 743 757 18
Engine power ndash ethanol (kw)
49 49
Max 114 153
weighted average 715 740 34
pTwR ‑ gasoline (kwkg)
00455 00455
Max 04482 03344
weighted average 00658 00671 20
pTwR ‑ ethanol (kwkg)
00476 00477
Max 00935 01033
weighted average 00667 00683 24
Energy consumption ndash US CaFE (MJkm) na 202
8
Brazil Passenger Vehicle Market statistics
0
500
1000
1500
2000
2500
3000
Subco
mpac
t
Compac
t
Medium
Larg
eSport
O-road SUV
Miniva
n
Fleet-a
vera
ge
Dis
pla
cem
ent
(cc)
0200400600800
10001200140016001800
2000
Subco
mpac
t
Compac
t
Medium
Larg
eSport
O-road SUV
Miniva
n
Fleet-a
vera
ge
Cur
b w
eig
ht (
kg)
0500
10001500
2000250030003500400045005000
Subco
mpac
t
Compac
t
Medium
Larg
eSport
O-road SUV
Miniva
n
Fleet-a
vera
ge
Leng
th (
mm
)
000050100150
200250300350400450
Subco
mpac
t
Compac
t
Medium
Larg
eSport
O-road SUV
Miniva
n
Fleet-a
vera
ge
Fo
otp
rint
(m
2 )
020406080
100120140160180
200
Subco
mpac
t
Compac
t
Medium
Larg
eSport
O-road SUV
Miniva
n
Fleet-a
vera
ge
Po
wer
(kW
)
Gasoline EthanolGasoline and Ethanol
000
002
004
006
008
010
012
014
Subco
mpac
t
Compac
t
Medium
Larg
eSport
O-road
SUV
Miniva
n
Fleet-a
vera
gePo
wer
-to
-wei
ght
rat
io (
kWk
g)
Figure 2‑1 ndash Fleet characteristics of new Brazilian passenger vehicles by segment (2013)
Fleet characteristics for the top 20 vehicle manufacturers responsible for more than 99 of passenger vehicle sales in 2013 are presented in Figure 2‑2 the four top-selling manufacturers (Fiat gM Volkswagen and Ford) produce on average lighter vehicles with smaller and less powerful engines average engine rated power is below 80 kW for the 10 largest manufacturers except for toyota and honda since each has a large share of off-road and suV sales respectively luxury manufacturers and off-road dominant manufacturers (jeep and Mitsubishi) show the largest values of engine power PtWr values seem evenly distributed below 0070 kWkg across the five largest manufacturers plus Psa and chery and climb following the power trend for luxury and off-road oriented manufacturers Most vehicles are rated with higher engine power and PtWr under ethanol (e100) than under gasoline (e22) Detailed sales-weighted average data by manufacturer are presented in Table C‑2 in appendix c
9
ICCT white paper
Gasoline Ethanol
0
500
1000
1500
2000
2500
3000
3500
Fiat GM
Volkswag
enFord
Renau
lt
Hyund
ai
Honda
Toyo
taPSA
Nissan
Mitsub
ishiKIA
JACBMW
Land
Rove
r
Merce
des-B
enz
Chery
Audi
Suzuk
iJe
ep
Fleet-a
vera
geFiat GM
Volkswag
enFord
Renau
lt
Hyund
ai
Honda
Toyo
taPSA
Nissan
Mitsub
ishiKIA
JACBMW
Land
Rove
r
Merce
des-B
enz
Chery
Audi
Suzuk
iJe
ep
Fleet-a
vera
ge
Dis
pla
cem
ent
(cc)
0200400600800
10001200140016001800
2000
Cur
b w
eig
ht (
kg)
Fiat GM
Volkswag
enFord
Renau
lt
Hyund
ai
Honda
Toyo
taPSA
Nissan
Mitsub
ishiKIA
JACBMW
Land
Rove
r
Merce
des-B
enz
Chery
Audi
Suzuk
iJe
ep
Fleet-a
vera
geFiat GM
Volkswag
enFord
Renau
lt
Hyund
ai
Honda
Toyo
taPSA
Nissan
Mitsub
ishiKIA
JACBMW
Land
Rove
r
Merce
des-B
enz
Chery
Audi
Suzuk
iJe
ep
Fleet-a
vera
ge000050100150
200250300350400450
Fo
otp
rint
(m
2 )
3400
3600
3800
4000
4200
4400
4600
4800
Leng
th (
mm
)
Fiat GM
Volkswag
enFord
Renau
lt
Hyund
ai
Honda
Toyo
taPSA
Nissan
Mitsub
ishiKIA
JACBMW
Land
Rove
r
Merce
des-B
enz
Chery
Audi
Suzuk
iJe
ep
Fleet-a
vera
geFiat GM
Volkswag
enFord
Renau
lt
Hyund
ai
Honda
Toyo
taPSA
Nissan
Mitsub
ishiKIA
JACBMW
Land
Rove
r
Merce
des-B
enz
Chery
Audi
Suzuk
iJe
ep
Fleet-a
vera
ge0
20406080
100120140160180
200
Po
wer
(kw
)
00000010002000300040005000600070008000900100
Po
wer
-to
-wei
ght
rat
io (
kWk
g)
Gasoline and Ethanol
Figure 2‑2 ndash Fleet characteristics of new Brazilian passenger vehicles by manufacturer (2013)
Manufacturers are organized by total sales in descending order
Figure 2‑3 illustrates vehicle fleet characteristics for domestic and imported vehicles in general imported vehicles are bigger and heavier than those nationally produced the most remarkable contrast lies on engine power and PtWr imported vehicles are more powerful and have higher PtWr but while domestic vehicles exhibit higher engine power and PtWr for ethanol than for gasoline the opposite occurs for imported ones a closer examination of available data on engine compression ratios shows that domestic producers are leveraging ethanolrsquos higher octane rating and designing flex-fuel engines with much higher compression ratios (~1251) than gasoline-only engines (around 1051)5 this confirms the special engine designcalibration for operation with high ethanol gasoline blends from manufacturers with local production Detailed sales-weighted average data by origin are presented in Table C‑3 in appendix c
5 More information on the effect of ethanol on vehicle design characteristics can be found in stein et al (2013)
10
Brazil Passenger Vehicle Market statistics
Gasoline Ethanol
0
200
400
600
800
1000
1200
1400
1600
1800
2000
Domestic Imported Fleet-average
Dis
pla
cem
ent
(cc)
0
200
400
600
800
1000
1200
1400
Domestic Imported Fleet-average
Cur
b w
eig
ht (
kg)
345
350
355
360
365
370
375
380
385
390
395
Domestic Imported Fleet-average
Fo
otp
rint
(m
2 )
3950
4000
4050
4100
4150
4200
4250
4300
4350
Domestic Imported Fleet-average
Leng
th (
mm
)
0
20
40
60
80
100
120
Domestic Imported Fleet-average
Po
wer
(kW
)
0050
0055
0060
0065
0070
0075
0080
Domestic Imported Fleet-average
Po
wer
-to
-wei
ght
rat
io (
kWk
g)
Gasoline and Ethanol
Figure 2‑3 ndash Fleet characteristics of new Brazilian passenger vehicles by origin (2013)
Figure 2‑4 compares Brazilrsquos passenger vehicle fleet with those in china the us eu japan india and south Korea For the energy consumption comparison this analysis considers the us corporate average fuel economy (caFe) test cycle6 average engine displacement curb weight footprint and engine power in Brazil are the smallest with the exception of india (and japan in the case of engine displacement) With respect to PtWr the average Brazilian passenger car breaks the trend set by the power category ie Brazilian cars are less powerful than those in china japan and eu due to their lower average weight which drives the PtWr value above chinese japanese and european cars this suggests that the average Brazilian cars share the driving performance characteristics (eg acceleration times) of the us and Korean vehicles despite their relative smaller engines Detailed international data are presented in appendix B
6 Details on icctrsquos methodology for comparing new vehicle fuel efficiency can be found at the global PV standards section in the icctrsquos website httpwwwtheicctorginfo-toolsglobal-passenger-vehicle-standards
11
ICCT white paper
Despite having the smallest lightest and least powerful vehicles on average (with the exception of india) Brazilrsquos average energy consumption ranks fourth amongst the markets analyzed in this study the japanese fleet had the lowest energy consumption given the small and light vehicle characteristics of japanese cars and their relatively higher adoption of efficiency technologies (eg hybrids) followed by the eu (medium sizeweight fleet with high technology penetration) and india (smaller and lighter fleet overall) the us has the highest energy consumption on average due to the fleetrsquos larger size weight and power requirements china and south Korea trail the us as the most energy-consuming fleet and these countries have fleets with large and heavy vehicles but relatively lower penetration of efficiency technologies a detailed evaluation of energy consumption in Brazil and other markets is presented in chapter 4
0
500
1000
1500
2000
2500
3000
US S Korea EU China Brazil Japan India
Dis
pla
cem
ent
(cc)
0
200
400
600
800
1000
1200
1400
1600
1800
US S Korea EU China Japan Brazil India
Cur
b w
eig
ht (
kg)
000
050
100
150
200
250
300
350
400
450
US S Korea EU China Japan Brazil India
Fo
otp
rint
(m
2)
0
20
40
60
80
100
120
140
160
US S Korea EU China Japan Brazil India
Po
wer
(kW
)
00000
00100
00200
00300
00400
00500
00600
00700
00800
00900
01000
US S Korea Brazil China Japan EU India
Po
wer
-to
-wei
ght
rat
io (
kWk
g)
100
120
140
160
180
200
220
240
260
US China S Korea Brazil India Japan EU
Ene
rgy
cons
ump
tio
n ndash
US
CA
FE
(M
Jkm
)
Figure 2‑4 ndash international comparison of key new passenger vehicle characteristics
12
Brazil Passenger Vehicle Market statistics
3 vEhiCLE TEChNOLOGy ADOpTiON
this chapter provides an overview of current technology adoption including fuel engine and transmission technologies that affect vehicle energy consumption the type and complexity of technologies vary across vehicle segments to a large extent this is a function of vehicle size and weight and its intended performance and ultimately cost Fleet-average parameters presented in Table 3‑1 correspond to sales-weighted fleet-average values this chapter is divided by technology type with supporting information in appendix c an international comparison for each technology is also presented in this chapter the data for this technology adoption analysis came from a diversity of sources listed in appendix D also note that for comparisons at the international level it was required to use information from different years the most recent according to data availability
Table 3‑1 ndash technology adoption in new Brazilian passenger vehicles
Year 2012 2013
Fuel type
Flex 914 936
Gasoline 82 59
hybrid 0004 0014
Diesel 04 049
No of cylinders
Three 03 25
Four 986 966
Five 00 00
Six 09 08
Eight or more 01 01
Transmission
Manual 870 833
automatic 112 147
CVT 14 15
DCT 04 05
No of gear ratios
Four or fewer 61 59
Five 849 831
Six 84 98
Seven 03 07
Eight or more 02 05
Drivetrain
FwD 950 944
RwD 27 29
4wD and awD 23 27
No of valves per cylinder
Two 664 596
Multi valve 336 404
Valve camshaft configuration
Single overhead camshaft 696 630
Dual overhead camshaft 176 245
Valve actuation
Fixed 822 783
VVT 124 159
VVT+VVL 54 58
Fuel systems for gasoline vehicles
Multi‑point fuel injection 982 976
Gasoline direct injection 18 24
air induction systems for gasoline vehicles
Naturally aspirated 984 973
Supercharger turbocharger or twin‑turbo 16 27
13
ICCT white paper
FUEL TYpEFlex-fuel vehicles (FFVs) are designed to run on gasoline (e22) ethanol (e100) or any combination of both fuels except for a few engine and fuel system modifications FFVs are identical to gasoline-only models7 FFVs experience no loss in performance when operating on e100 however since ethanol contains less energy per volume than gasoline FFVs typically get about 25 fewer kilometers per liter when fuelled with e100
Flex-fuel is the dominant technology across all vehicle segments with the exception of sports cars off-road vehicles and minivans (Figure 3‑1) all top 10 manufacturers produce primarily flex-fuel engines and those manufacturers with a larger share of gasoline and diesel engines typically import most of their vehicles (Figure 3‑2) the predominance of FFVs responsible for almost 94 of vehicle sales in 2013 is unique to Brazil (Figure 3‑3)
hybrid-gasoline vehicles achieve reduced fuel consumption by incorporating in the drivetrain a battery and an electric motor in addition to an internal combustion (ic) engine this technology permits the ic engine to shut down when the vehicle is decelerating and is stopped braking energy to be recovered and the ic engine to be downsized and operated at more efficient operating points Depending on the level of complexity hybrid systems can achieve 15 to 35 reductions in fuel consumption with respect to similar-sized vehicles
Despite having very limited penetration sales of new hybrid vehicles have increased three-fold from 131 units in 2012 to 432 in 2013 primarily in the medium and sports segments two manufacturers sell the most gasoline hybrid models (not flex-fuel) in Brazil including the toyota Prius and the Ford Fusion hybrid
Diesel engines offer 20 to 25 reduction in fuel consumption over traditional gasoline multi-point fuel injection (MPFi) engines due to higher compression ratios reduced pumping losses and 12 higher energy content per liter of fuel the challenge for further commercialization is twofold the complexity and additional cost of advanced exhaust after-treatment technologies that reduce emissions of particulate matter and oxides of nitrogen to levels comparable to those of gasoline and FFV engines
sales of diesel passenger vehicles are not allowed in Brazil with the exception of vehicles with some off-road characteristics Despite having a small penetration (around 05) sales of diesel passenger vehicles increased by 16 in 2013 toyota sells the most diesel passenger vehicles followed by Mitsubishi land rover gM and Mercedes-Benz the light-duty diesel market in Brazil is equivalent to the us and china in terms of market penetration and much below the penetration in europe and south Korea although air quality concerns in europe might trigger lower sales of diesel vehicles in coming years
7 Most of the modifications with respect to a gasoline-only vehicle (e00) include changes to fuel systemrsquos materials that are compatible with the oxygen content of ethanol blends and changes to air and fuel ratio management systems (mainly software based)
14
Brazil Passenger Vehicle Market statistics
0
10
20
30
40
50
60
70
80
90
100
Subco
mpac
t
Compac
t
Medium
Larg
eSport
O-Road SUV
Miniva
nTo
tal
Mar
ket
shar
e
Diesel Hybrid Gasoline Flex
Figure 3‑1 ndash Fuel type by segment
0102030405060708090
100
Fiat GM
Volkswag
enFord
Renau
lt
Hyund
ai
Honda
Toyo
taPSA
Nissan
Mitsub
ishi
KIAJA
CBMW
Land
Rove
r
Merce
des-B
enz
Chery
Audi
Suzuk
iJe
epTo
tal
Tech
nolo
gy
shar
e
Diesel Hybrid Gasoline Flex
Figure 3‑2 ndash Fuel type by manufacturer
0
10
20
30
40
50
60
70
80
90
100
China2010
Korea2011
EU-272013
US2013
Japan2011
India2012
Brazil2013
Tech
nolo
gy
shar
e
Diesel Hybrid Gasoline CNGLPGFlex
Figure 3‑3 ndash Fuel type international comparison
15
ICCT white paper
NUMBER OF CYLiNDERSacross all vehicle markets 4-cylinder engines are the most common design in automobile engines with displacements below 25 liters this engine configuration presents the right balance between complexity and performance for the target vehicle segments (small to mid-size sedans suVs and some off-road vehicles) engines with six and more cylinders are designed to provide a smoother vehicle driving experience with lower vibration and noise than 4-cylinder engines can provide and with higher power output this better overall performance comes at a higher cost driving their widespread use in large and luxury vehicles and heavier suVs and off-road vehicles
the need to attain better energy consumption has resulted in a recent wave of 3-cylinder engines from a handful of manufacturers in vehicles that typically used 4-cylinder engines achieving similar or better performance this practice is known as engine downsizing Downsizing can also be applied to larger engines from V-8s to V-6s and from V-6s to i-4s in most cases engine downsizing is accompanied with turbocharging and changes to the fuel delivery system
Four-cylinder engines dominate the passenger vehicle market in Brazil and are sold in more than 90 of new vehicles among all segments except the sports off-road and minivan segments (Figure 3‑4) Despite its predominance sales of 4-cylinder engines fell from over 307 to 293 million units between 2012 and 2013 equivalent to a 4 reduction 4-cylinder vehicles represent the majority of sales among the 20 top manufacturers except for hyundai and jeep (Figure 3‑5) although 4-cylinder engines represent the dominant technology in all countries analyzed Brazil still has the largest market share (Figure 3‑6)
the most significant shift in market preferences in Brazil occurred with 3-cylinder engines this technology is becoming more popular with almost eight times more vehicles sold in 2013 compared to 2012 reaching almost 75000 units in 2013 almost all 3-cylinder engines are being sold as compact vehicles instead of the smaller subcompact segment hyundai is the technology leader in sales of 3-cylinder high-efficiency Kappa engines8 japan and india have relatively high penetration of 3-cylinder engine technology in india the popularity of 2- and 3-cylinder vehicles is primarily driven by lower price tags (lt usD $8000)
six-cylinder engines are third in sales after 4- and 3-cylinder engines with absolute numbers close to 25000 units sold in 2013 its market share reduced by 13 with respect to 2012 six-plus cylinder engines are being sold mostly in the sports off-road and minivan segments Manufacturers that cater to the most expensive models and segments dominate the market of vehicles with six-plus cylinder engines such as land rover BMW and Mercedes-Benz the penetration of 6-plus-cylinder engines in Brazil is very low compared to other countries
Five-cylinder engines are not very common in Brazil or other countries and are losing market with respect to 2012 sales by 56 Volkswagen audi and Volvo are the only manufacturers that offered 5-cylinder engines in Brazil in 2013
8 hyundairsquos 3-cylinder Kappa engine httpworldwidehyundaicomWWshowroomcarshB20PiPindexhtml
16
Brazil Passenger Vehicle Market statistics
0
10
20
30
40
50
60
70
80
90
100
Subco
mpac
t
Compac
t
Medium
Larg
eSport
O-Road SUV
Miniva
nTo
tal
Tech
nolo
gy
shar
e
8+ 6 5 4 3
Figure 3‑4 ndash number of cylinders by segment
0102030405060708090
100
Fiat GM
Volkswag
enFord
Renau
lt
Hyund
ai
Honda
Toyo
taPSA
Nissan
Mitsub
ishi
KIAJA
CBMW
Land
Rove
r
Merce
des-B
enz
Chery
Audi
Suzuk
iJe
epTo
tal
Tech
nolo
gy
shar
e
8+ 6 5 4 3
Figure 3‑5 ndash number of cylinders by manufacturer
0
10
20
30
40
50
60
70
80
90
100
China2010
Korea2011
EU-272013
US2013
Japan2011
India2012
Brazil2013
Tec
hno
log
y sh
are
8+ 6 5 4 3 2
Figure 3‑6 ndash number of cylinders international comparison
17
ICCT white paper
TRaNSMiSSiONtransmission technologies can reduce energy consumption in two ways First by allowing engine operation on a more efficient region of the engine map and second by reducing the mechanical losses within transmissions traditionally manual transmissions have offered better energy consumption than traditional automatic transmissions (with 4 or 5 speeds) due to lower friction losses however new generation of automatic transmissions with higher number of gears lower friction better materials and computer-controlled shift points have not just closed the gap between manual and automatic transmission performance but even exceed manual transmission performance
new technologies such as dual-clutch transmissions (Dcts) and continually variable transmissions (cVts) are gaining market share due to the need for lower vehicle energy consumption Dcts can be defined as manual transmissions with electro-hydraulically operated dual-clutch systems allowing for faster shifting times and selective automatic or ldquomanualrdquo operation as opposed to manual automatic and Dct transmissions which have a discrete number of gear ratios cVts have a theoretically infinite choice of ratios between fixed limits which allows engines to be further optimized for minimizing energy consumption cVt technology has been used in lower-horsepower vehicles because of maximum-torque limitations with the most common metal-belt design (nas 2011) these advanced transmission technologies offer significant benefits in energy consumption compared to traditional manual or automatic technologies according to the us national academy of sciences a 6-speed Dct provides 6 to 9 lower energy consumption than a 4-speed automatic transmission note that a traditional 6-speed automatic transmission provides an estimated 3 to 5 benefit the energy consumption benefit of cVt depends on the application and is estimated to be 1 to 7 (nas 2011)
although vehicle sales with manual transmissions are predominant in Brazil the penetration of automatic transmissions cVts and Dcts is increasing resulting in a market share loss for manual transmissions of about 6 between 2012 and 2013 (Table 3‑1) With the exception of sports and off-road segments manual transmission technology has the largest market share in all segments but it tends to become less predominant as vehicles grow in size and comfort level (Figure 3‑7) the top five manufacturers sell most of their vehicles with manual transmissions but their market share is somewhat smaller for other high-selling manufacturers that cater to a more affluent market (Figures 3‑8)
automatic transmissions are becoming increasingly popular in Brazil experiencing an increase of 28 in sales between 2012 and 2013 automatic transmissions dominate the sports and off-road segments Kia BMW land rover Mercedes-Benz and jeep adopt this type of transmission technology for most of their vehicle sales
Dct transmissions are entering the Brazilian market mostly through the sports segment via imported models the sales of Dct equipped vehicles increased in 2013 by 22 with respect to 2012 Dct technology is being offered mainly by manufacturers that sell sports vehicles such as audi in more than 67 of their vehicles and Mercedes-Benz in more than 15 of their vehicles the global leader in Dct adoption is europe followed by the us (Figure 3‑9)
cVt technology market is still relatively small being sold by small volume manufacturers like jeep audi and Mitsubishi with more than 25 of new vehicle sales each nissan renault honda and toyota also sell vehicles with cVt technology cVt penetration in Brazil is similar to europersquos cVt is the leading transmission technology in japan with more than 65 of the market
18
Brazil Passenger Vehicle Market statistics
0
10
20
30
40
50
60
70
80
90
100
Subco
mpac
t
Compac
t
Medium
Larg
eSport
O-Road SUV
Miniva
nTo
tal
Tech
nolo
gy
shar
e
DCT CVT Automatic Manual
Figure 3‑7 ndash transmission by segment
0
10
20
30
40
50
60
70
80
90
100
Fiat GM
Volkswag
enFord
Renau
lt
Hyund
ai
Honda
Toyo
taPSA
Nissan
Mitsub
ishi
KIAJA
CBMW
Land
Rove
r
Merce
des-B
enz
Chery
Audi
Suzuk
iJe
epTo
tal
Tech
nolo
gy
shar
e
DCT CVT Automatic Manual
Figure 3‑8 ndash transmission by manufacturer
0
10
20
30
40
50
60
70
80
90
100
China2010
Korea2011
EU-272013
US2013
Japan2011
India2012
Brazil2013
Tech
nolo
gy
shar
e
DCT CVT Automatic Manual
Figure 3‑9 ndash transmission international comparison
19
ICCT white paper
NUMBER OF GEaR RaTiOS as mentioned in the previous section increasing the number of gear ratios (whether manual automatic dual-clutch or continuously variable) allows the engine to be operated in the best efficiency region resulting in energy consumption benefits compared to an automatic four-gear ratio transmission (also known as 4-speed transmission) higher ratio automatic transmissions could reduce energy consumption from 2 to 3 (for a five-gear ratio) to 6 to 8 (for an eight-gear ratio) (ePanhtsa 2010)
Four-gear ratio transmissions are losing market share in Brazil by more than 5 between 2012 and 2013 (Table 3‑1) these transmissions are particularly high sellers in the suV and minivan segments which suggest that some models in these more expensive segments are being sold with outdated technologies (Figure 3‑10) Most manufacturers are phasing out this type of transmission (Figure 3‑11) although jeep suzuki and toyota are lagging behind other manufacturers the four-gear ratio transmission technology has been losing market share in most countries even in india where smaller and inexpensive cars dominate the market 4-speed transmissions have the smallest market share (Figure 3‑12)
Five- and six-gear ratio transmissions were predominant in the Brazilian market in 2013 Five-gear ratio transmissions are dominant in all segments except for the off-road and sports segments which have adopted six-gear ratio transmissions in most sales the significant market share of five- and six-gear ratio transmissions is similar to most countries although the us europe and south Korea show higher shares of six and more gear ratios
seven- and eight-gear ratio transmissions which are considered emerging technologies have experienced an increase in sales in Brazil with over twice as many sales in 2013 compared to 2012 seven- and eight-gear ratio transmissions are popular among the large sports and off-road segments all of which are imported models luxury manufacturers such as Mercedes-Benz and audi are selling the most seven-gear vehicles as a share of their sales Volkswagen and toyota are also selling similar numbers of seven-gear ratio vehicles although for Volkswagen and toyota it represented less than 3 of their brand sales BMW and land rover are the leaders in eight-gear ratio vehicles
20
Brazil Passenger Vehicle Market statistics
0
10
20
30
40
50
60
70
80
90
100
Subco
mpac
t
Compac
t
Medium
Larg
eSport
O-Road
SUV
Miniva
nTo
tal
Tech
nolo
gy
shar
e
8 7 6 5 4
Figure 3‑10 ndash number of gear ratios by segment
0
10
20
30
40
50
60
70
80
90
100
Fiat GM
Volkswag
enFord
Renau
lt
Hyund
ai
Honda
Toyo
taPSA
Nissan
Mitsub
ishi
KIAJA
CBMW
Land
Rove
r
Merce
des-B
enz
Chery
Audi
Suzuk
iJe
epTo
tal
Tech
nolo
gy
shar
e
8 7 6 5 4
Figure 3‑11 ndash number of gear ratios by manufacturer
0
10
20
30
40
50
60
70
80
90
100
Tech
nolo
gy
shar
e
Six or more Five Four or fewer
China2010
Korea2011
EU-272013
US2013
India2012
Brazil2013
Figure 3‑12 ndash number of gear ratios international comparison
21
ICCT white paper
DRiVETRaiNDrivetrain technology includes front-wheel drive (FWD) rear-wheel drive (rWD) and all-wheel drive (aWD) vehicles For the same vehicle size FWD vehicles provide more interior space and better energy consumption than rWDs due to lower weight as it avoids the added weight of and space for the driveshaft and differential that rWD requires Because the weight of the engine and transmission is located close to the wheels FWD vehicles have better traction than rWDs rWDs however show better handling as the weight distribution between the front and rear wheels is more uniform and the tasks of turning and acceleration are split between the front and rear wheels also directing large amounts of power through the front wheels can create ldquotorque steerrdquo thus rWD is the adequate technology for the sports segment aWD drivetrains are intended for specific driving applications that imply loss of traction such as off-road terrains snow or towing
FWD vehicles dominate all segments of the Brazilian passenger car market (Table 3‑1) with the exception of the off-road segment (Figure 3‑13) among the 20 largest manufacturer sellers most except for BMW land rover Mercedes-Benz and suzuki offer FWD technology (Figure 3‑14) Brazil has the highest market share of FWD vehicles of all countries analyzed (944) although FWD has at least 50 market share in all seven countries (Figure 3‑15)
aWD market share increased by 15 between 2012 and 2013 due to a tri-fold increase in the sports segment sales off-road vehicle sales with aWD also increased to more than 76000 units in 2013 amongst the largest ten manufacturers toyota is the aWD market leader followed by Ford and Volkswagen note that land rover sells only aWD vehicles in Brazil among non-luxury manufacturers Mitsubishi and suzuki are selling more than 50 of their vehicles with aWD technology
rWD technology is offered mostly in large and sports vehicles and in suVs among the 10 largest manufacturers rWD is offered mainly by gM and toyota while an extended examination of the 20 largest manufacturers by sales show that aWD and rWD is focused among the more expensive brands (Figure 3‑14) Mercedes-Benz and BMW sell close to 90 of their vehicles with rWD technology traditionally associated with engine performance and responsiveness
22
Brazil Passenger Vehicle Market statistics
0
10
20
30
40
50
60
70
80
90
100
Subco
mpac
t
Compac
t
Medium
Larg
eSport
O-Road SUV
Miniva
nTo
tal
Tehn
olo
gy
shar
e
AWD RWD FWD
Figure 3‑13 ndash Drivetrain by segment
0
10
20
30
40
50
60
70
80
90
100
Fiat GM
Volkswag
enFord
Renau
lt
Hyund
ai
Honda
Toyo
taPSA
Nissan
Mitsub
ishi
KIAJA
CBMW
Land
Rove
r
Merce
des-B
enz
Chery
Audi
Suzuk
iJe
epTo
tal
Tech
nolo
gy
shar
e
AWD RWD FWD
Figure 3‑14 ndash Drivetrain by manufacturer
0
10
20
30
40
50
60
70
80
90
100
China2010
Korea2011
EU-272013
US2013
Japan2011
India2012
Brazil2013
Tech
nolo
gy
shar
e
AWD RWD FWD
Figure 3‑15 ndash Drivetrain international comparison
23
ICCT white paper
VaLVE CaMShaFT CONFiGURaTiON (DOhC VS SOhC)the engine camshaft governs the timing duration and lift of valve operation controlling the intake of air and the exhaust of combustion gases this report focuses on single overhead camshafts (sohc) and dual overhead camshafts (Dohc) as these configurations have almost completely replaced the older overhead valve configuration (ohV) sohc design places a single camshaft above the cylinder head that governs all the valves intake and exhaust in the case of sohc V-engines there is one single camshaft per head Dohc designs use separate camshafts for intake valves and exhaust valves Dohc engines achieve increased airflow at high-engine speeds improve volumetric efficiency and reduce the valvetrainrsquos moving mass such engines typically develop higher power at high-engine speeds the us environmental Protection agency (ePa) and national highway traffic safety administration (nhtsa) estimate the effectiveness of Dohc over sohc to be between 1 and 25 (ePanhtsa 2010)
although Dohc produce more power and provide lower fuel consumption the Brazilian fleet is still mostly composed of sohcs vehicles (Table 3‑1) sohc technology is predominant among the subcompact compact and medium segments (Figure 3‑16) among manufacturers sohc technology is predominant among the five largest least expensive brands (Figure 3‑17) sales of vehicles with more advanced Dohc technology grew in 2013 by almost 36 with respect to 2012 albeit from a relatively smaller base this increase was experienced in all vehicle segments but in different magnitudes
although global data on this technology are scarce Figure 3‑18 indicates that most countries are moving away from sohc with Brazil being the only country analyzed where sohc is still predominant no data were available for the us or europe
24
Brazil Passenger Vehicle Market statistics
0
10
20
30
40
50
60
70
80
90
100
Subco
mpac
t
Compac
t
Medium
Larg
eSport
O-Road SUV
Miniva
nTo
tal
Tech
nolo
gy
shar
e
nd DOHC SOHC
Figure 3‑16 ndash Valve camshaft configuration by segment (nd no data)
0
10
20
30
40
50
60
70
80
90
100
Fiat GM
Volkswag
enFord
Renau
lt
Hyund
ai
Honda
Toyo
taPSA
Nissan
Mitsub
ishi
KIAJA
CBMW
Land
Rove
r
Merce
des-B
enz
Chery
Audi
Suzuk
iJe
epTo
tal
Tech
nolo
gy
shar
e
nd DOHC SOHC
Figure 3‑17 ndash Valve camshaft configuration by manufacturer (nd no data)
0
10
20
30
40
50
60
70
80
90
100
China2010
Korea2011
Japan2011
India2012
Brazil2013
Tech
nolo
gy
shar
e
nd OVC DOHC SOHC
Figure 3‑18 ndash Valve camshaft configuration international comparison (nd no data)
25
ICCT white paper
VaLVE aCTUaTiON improved valvetrain systems with variable valve actuation (VVa) technology either variable valve timing (VVt) or variable valve timing and lift (VVt+VVl) improves the enginersquos volumetric and thermodynamic efficiency they also enable further engine improvements such as internal exhaust gas recirculation and cylinder deactivation VVt alters the timing of the intake valve exhaust valve or both primarily to reduce pumping losses increase specific power and control residual exhaust gases VVl increases efficiency by optimizing airflow over a broader range of engine operation which reduces pumping losses and increases specific power VVl is accomplished by controlled switching between two or more cam profile lobe heights the most advanced technology VVt+VVl yields a wide range of performance optimization and volumetric efficiency including enabling the engine to be valve-throttled (no need for intake throttle) VVt provides energy consumption gains of 3 to 5 while the more flexible and complex VVt+VVl system can reach 4 to 8 (ePa amp nhtsa 2010)
VVa technology either VVt or VVt+VVl are emerging technologies in Brazil where most vehicles still have fixed-valve timing designs (Table 3‑1) Fixed technology is predominant among the smaller vehicle segments as well as suVs and minivans (Figure 3‑19) the five largest manufacturers sold more than 90 of their vehicles with fixed-valve technology in 2013 (Figure 3‑20) the international comparison indicates that only Brazil and india have not yet adopted VVa technologies for most of their light-duty fleet (Figure 3‑21)
VVt and VVt+VVl are being adopted across all segments including the subcompact segment but tend to be more predominant in high-end manufacturers a closer examination by manufacturer shows that most are offering some vehicles with either one of the VVa systems while honda and hyundai offer this technology in almost all vehicles (Figure 3‑20) honda is the technology leader in variable valve actuation with the adoption in the early 1990s of the Vtec system (Valve timing electronic control) VVt technologyrsquos market share grew by about 25 in 2013 primarily due to hyundairsquos sales from 80000 units in 2012 to almost 200000 units in 2013 hyundai offered the continuously variable valve technology (cVVt) in the large majority of vehicle sold in 2013 the sports segment is the one where VVt dominates the market Mitsubishi BMW and audi are also selling a large share of their vehicles with the VVt+VVl technology
26
Brazil Passenger Vehicle Market statistics
0
10
20
30
40
50
60
70
80
90
100
Subco
mpac
t
Compac
t
Medium
Larg
eSport
O-Road SUV
Miniva
nTo
tal
Tech
nolo
gy
shar
e
VVT+VVL VVT Fixed
Figure 3‑19 ndash Valve actuation by segment
0
10
20
30
40
50
60
70
80
90
100
Fiat GM
Volkswag
enFord
Renau
lt
Hyund
ai
Honda
Toyo
taPSA
Nissan
Mitsub
ishi
KIAJA
CBMW
Land
Rove
r
Merce
des-B
enz
Chery
Audi
Suzuk
iJe
epTo
tal
Tech
nolo
gy
shar
e
VVT+VVL VVT Fixed
Figure 3‑20 ndash Valve actuation by manufacturer
VVT+VVL VVT Fixed
0
10
20
30
40
50
60
70
80
90
100
China2010
Korea2011
US2013
Japan2011
India2012
Brazil2013
Tech
nolo
gy
shar
e
Figure 3‑21 ndash Valve actuation international comparison
27
ICCT white paper
FUEL SYSTEMS FOR GaSOLiNE VEhiCLESVehicle fuel systems describe the technology required to deliver fuel into the engine combustion chamber this section examines two gasolineflex technologies namely multi-point fuel injection (MPFi) and gasoline direct injection (gDi) MPFi is now the most common fuel-delivery system for gasoline engines used in passenger vehicles worldwide in sequential MPFi engines fuel is injected into the air stream next to the intake valve port while the intake valve is open to draw the air-fuel mixture into the cylinder some of the fuel is vaporized on the surface of the hot intake valve expanding and thus reduces the volumetric efficiency on gDi engines fuel is injected at high pressure directly into the combustion chamber improving volumetric efficiency and providing cooling of the airfuel charge within the cylinder which allows for higher compression ratios and increased thermodynamic efficiency gDi technology alone offers benefits of 2 to 5 with respect to MPFi engines but bigger benefits rely on the synergy between gDi turbocharging and downsizing which can reach 12 to 15 energy consumption reduction with respect to a MPFi naturally aspirated engine (ePa 2012)
Table 3‑1 illustrates that MPFi is still the most common fuel injection technology for gasolineflex vehicles in Brazil which is reflected in its dominant share across most segments except for sports and off-road vehicles in Brazil gDi has found a niche market in the sports and off-road segments with more than 90 of sport vehicles fitted with gDi technology (Figure 3‑22) Within the overall gasoline market the gDi technology is still an emerging technology representing just 24 of new sales gDirsquos market share increased by 31 in 2013 with all but 4000 units being imported among the 10 largest manufacturers the adoption of gDi is extremely low below 5 for Volkswagen Ford hyundai and Psa (Figure 3‑23) high-end european brands (audi land rover Mercedes-Benz and BMW) are the technology leaders in terms of gDi adoption rates echoing the trend of turbocharging technology sales Volkswagen vehicles with gDi systems account for less than 35 of their sales in 2013 but their absolute numbers (around 19000 vehicles) place the company as one of the leaders in gDi technology in the Brazilian market
From a global market perspective the penetration of gDi technology in Brazil is low compared to all other markets in Figure 3‑24 except for india and japan it should be noted that the later has the largest share of hybrid vehicles around the globe
28
Brazil Passenger Vehicle Market statistics
0
10
20
30
40
50
60
70
80
90
100
Compac
t
Subco
mpac
t
Medium
Larg
eSport
O-Road SUV
Miniva
nTo
tal
Tech
nolo
gy
shar
e
GDI MPFI
Figure 3‑22 ndash gasolineflex fuel system by segment
GDI MPFI
0102030405060708090
100
Fiat GM
Volkswag
enFord
Renau
lt
Hyund
ai
Honda
Toyo
taPSA
Nissan
Mitsub
ishi
KIAJA
CBMW
Land
Rove
r
Merce
des-B
enz
Chery
Audi
Suzuk
iJe
epTo
tal
Tech
nolo
gy
shar
e
Figure 3‑23 ndash gasolineflex fuel system by manufacturer
GDI MPFI
0
10
20
30
40
50
60
70
80
90
100
China2010
Korea2011
EU-272013
US2013
Japan2011
India2012
Brazil2013
Tech
nolo
gy
shar
e (n
on-
die
sel)
Figure 3‑24 ndash gasolineflex fuel system international comparison
29
ICCT white paper
TURBOChaRGiNGengine power is primarily limited by the rate at which the engine is able to draw air into the combustion chamber turbocharging and supercharging are two methods to increase the amount of air drawn into the engine above the level of what is possible with the naturally aspirated process (through the expansion of the cylinders) By increasing the amount of air into the engine the amount of fuel can be proportionally increased resulting in increased power output level and with it the ability to reduce engine displacement while maintaining performance the combination of turbocharging and downsizing in spark ignited (gasoline and flex-fuel) vehicles can provide energy consumption improvements between 2 to 6 with respect to a direct-injected gDi engine (ePa amp nhtsa 2010) turbocharging technology is the cornerstone for achieving better energy consumption in vehicles as the basis for downsizing and reducing the engine weight while keeping the same or better vehicle performance (ie acceleration or time to reach certain speed) although turbochargers are used in diesel and gasolineflex vehicles the analysis in this report focuses on turbocharging for spark-ignited gasolineflex vehicles only
turbocharging is one of the most important emerging technologies in Brazil where most vehicles are still naturally aspirated (na) (Table 3‑1) turbocharging technology has increased the market share significantly between 2012 and 2013 by more than 65 albeit from a small base (from about 49000 to 81000 vehicles)
Most vehicles with turbocharging are sold in the sports and off-road segments as this technology also produces superior engine power output (Figure 3‑25) among the 10 largest manufacturers turbocharging is still below 10 of their sales (Figure 3‑26) Volkswagen and Ford despite having small relative sales of vehicles with turbocharging (less than 35) are the manufacturers with the highest total sales of vehicles with turbocharging audi land rover Mercedes-Benz and BMW are the technology leaders with more than 90 of vehicle sales in 2013
the penetration of turbo and supercharging technologies in Brazil is lower than in other countries with a larger gasoline fleet such as the us china and japan (Figure 3‑27) in Brazil 95 of diesel passenger vehicle sales have turbocharging technology
30
Brazil Passenger Vehicle Market statistics
0
10
20
30
40
50
60
70
80
90
100
Compac
t
Subco
mpac
t
Medium
Larg
eSport
O-Road SUV
Miniva
nTo
tal
Tech
nolo
gy
shar
e (n
on-
Die
sel)
Turbo NA
Figure 3‑25 ndash turbocharging for gasolineflex fuel vehicles by segment (NA naturally aspirated)
0102030405060708090
100
Fiat GM
Volkswag
enFord
Renau
lt
Hyund
ai
Honda
Toyo
taPSA
Nissan
Mitsub
ishiKIA
JACBMW
Land
Rove
r
Merce
des-B
enz
Chery
Audi
Suzuk
iJe
epTo
tal
Tech
nolo
gy
shar
e (n
on-
Die
sel)
Turbo NA
Figure 3‑26 ndash turbocharging for gasolineflex fuel vehicles by manufacturer (NA naturally aspirated)
0
10
20
30
40
50
60
70
80
90
100
China2010
Korea2011
EU-272013
US2013
Japan2011
India2012
Brazil2013
Tech
nolo
gy
shar
e (n
on-
die
sel)
Turbo NA
Figure 3‑27 ndash turbocharging for gasolineflex fuel vehicles international comparison (NA naturally aspirated)
31
ICCT white paper
4 vEhiCLE ENErGy CONSuMpTiON
this section analyzes the Brazilian new passenger vehicle energy consumption in 2013 although other metrics are more common (see box) vehicle energy consumption is presented in megajoules per kilometer (Mjkm) for consistency with Brazilrsquos inovar-auto policy in 2012 Brazilrsquos Ministry of Development industry and Foreign trade (MDic) adopted the inovar-auto policy with the aim of fostering industrial competitiveness through technology investments the policy includes a target for corporate average energy consumption (in Mjkm with vehicle curb weight as the attribute parameter) for vehicles sold in 2017
in the us canada Mexico and saudi arabia fleet-average fuel economy standards are defined as a function of vehicle footprint in the eu china japan south Korea and india vehicle weight is the attribute for the calculation of fleet-average targets in Brazil inovar-auto has defined its fiscal targets for vehicle energy consumption measured in megajoules per kilometer (Mjkm) as a function of vehicle weight
VEhiCLE ENERGY MEaSUREMENT UNiTS
Many metrics can be used to describe the amount of fuel energy or emissions generated by unit of distance traveled
Fuel economy measures distance traveled per unit of fuel consumed in Brazil kilometers per liter (kml) is the most common metric to describe vehicle efficiency but other units are used in different countries such as miles per gallon (mpg) in the us
Fuel consumption is the reciprocal of fuel economy and measures fuel consumed per distance traveled it is usually expressed in liters per 100 kilometers (l100 km) and it is used in europe for example
GhGCO2 emissions measures ghg or co2 emissions per distance traveled expressed as grams of pollutant per kilometer or mile
Energy consumption (EC) measures the energy consumed per distance traveled for example in megajoules per kilometer Despite being a less common metric it is sometimes preferred for being a fuel-neutral metric across different types of fuel and vehicle technologies Vehicle energy consumption in Mjkm is the metric used in Brazilrsquos inovar-auto policy to quantify the corporate average energy consumption target for each manufacturer Values for energy consumption in Brazilian spark-ignited vehicles are provided for e22 since that is the fuel mixture used in vehicle tests
Vehicle energy consumption in this report is calculated from co2 emissions data in the Brazilian institute of environment and renewable natural resources (iBaMa) nota Verde program (iBaMa 2014) which reports official emissions data from homologation tests Data are limited to passenger cars sold by the top 10 manufacturers with light commercial vehicles being excluded appendix D presents a description of data sources
32
Brazil Passenger Vehicle Market statistics
and calculation methodologies as well as a discussion of vehicle energy consumption data quality and completeness in Brazil
not surprisingly vehicle energy consumption increases with vehicle footprint and engine rated power the two parameters that define vehicle segments in Brazil (Figure 4‑1) subcompact and compact vehicles which accounted for about 45 of new sales in 2013 have average energy consumption below the fleet average while medium-sized vehicles which hold the largest market share (388) have energy consumption just above the fleet average larger more powerful vehicles consume more energy than the fleet average but have a considerably smaller market share (combined share of 163) Data availability for these segments is not as extensive as the data available for the subcompact compact and medium segments which could affect the relative rankings of each segment
Ene
rgy
cons
ump
tio
n (M
Jkm
)
Subco
mpac
t
Compac
t
Medium
Larg
e
O-road SUV
4000
200000
400000
600000
850000
35
30
25
20
15
10
05
0
Sales
Total 202
Figure 4‑1 ndash new vehicle sales-weighted average energy consumption by segment (2013)
33
ICCT white paper
Figures 4‑2 and 4‑3 illustrate new vehicle energy consumption for multiple weight and footprint bins For each weight bin (in 100 kg increments) and footprint bin (in 01 m2 increments) sales-weighted averages of energy consumption for each vehicle version are presented (dashes) generating energy consumption ranges for each bin (cream areas) Vehicle sales by bin are presented for reference in the lower charts
the strong correlation between vehicle energy consumption and weight follows from the strong physical relationship between the weight of the vehicle and the energy required to accelerate it and overcome resistances9 (Figure 4‑2) Data dispersion within each bin suggests that energy consumption varies due to other vehicle characteristics that affect vehicle aerodynamics and rolling resistance as well as the adoption of technologies that affect engine and transmission efficiency (eg friction reduction technologies gDi VVt)
Curb weight (kg)
SubcompactCompactMediumLargeO-roadSUV
Ene
rgy
cons
ump
tio
n (M
Jkm
)Sa
les
5
6
4
3
2
1
600k
800k
400k
200k
0k800 900 1000 1100 1200 1300 1400 1500 1600 1700 1800 1900 2000 2100
Figure 4‑2 ndash new vehicle energy consumption by vehicle weight (2013)
9 on a plain surface the sum of resistances of a vehicle is acceleration resistance + rolling resistance + aerodynamic resistance = c1 m a + c2 frr m + c3 cw a v2 with mass (m) as an integral part of both acceleration and rolling resistance which are most relevant for inner-city driving situations other factors are acceleration (a) rolling resistance of tires (frr) aerodynamic coefficient of the vehicle (cw) frontal area of vehicle (a) velocity (v) and constants (cx)
34
Brazil Passenger Vehicle Market statistics
Footprint has a reasonable correlation with energy consumption (Figure 4‑3) ie larger vehicles tend to consume more fuel than smaller vehicles however the correlation is not as strong as with vehicle weight similar to the previous figure the broad spread of energy consumption values suggests a combination of different vehicle characteristics (eg weight engine displacement rated power) and technologies (eg transmissions fuel systems) as well as the presence of suVs and off-road vehicles among the medium- and large-sized footprint values respectively
Footprint (m2)
SubcompactCompactMediumLargeO-roadSUV
Ene
rgy
cons
ump
tio
n (M
Jkm
)Sa
les
5
6
4
3
2
1
400k
500k
300k
200k
100k
0k31 32 33 34 35 36 37 38 39 40 41 42 43 44 45 46 48 49
Figure 4‑3 ndash new vehicle energy consumption by vehicle footprint (2013)
35
ICCT white paper
Figure 4‑4 illustrates sales weighted average for new vehicle energy consumption by mass for the top 10 manufacturers in Brazil in 2013 Bubble sizes are proportional to total vehicle sales Manufacturers in the lower-left quadrant produce the lightest and most efficient vehicles with hyundai presenting the best overall average energy consumption renault in the upper-left quadrant produces vehicles that are equivalent in weight but on average with higher energy consumption in the lower-right quadrant are manufacturers that produce relatively heavier vehicles but with lower energy consumption in their weight class Despite producing heavier vehicles on average than many manufacturers honda achieves lower energy consumption on average in the upper-right quadrant are manufacturers that produce on average the heavier and least efficient vehicles with Psa (citroen and Peugeot) producing the heaviest and least efficient cars on average a regression line correlating vehicle energy consumption and mass highlights the best performers (hyundai honda and nissan) average performers (Fiat Volkswagen gM and toyota) and those performing worse than average (renault Ford and Psa)
FIA
GMVW
FORREN
HYU
HON
TOY
PSA
NIS
160
170
180
190
200
210
220
230
240
250
950 1000 1050 1100 1150 1200 1250 1300 1350
Ene
rgy
cons
ump
tio
n (M
Jkm
)
Curb weight (kg)
Fleet Ave
Figure 4‑4 ndashaverage new vehicle sales-weighted energy consumption by manufacturer (2013)
36
Brazil Passenger Vehicle Market statistics
Figure 4‑5 shows fleet-average energy consumption based on certification and type approval data for new vehicles in multiple countries converted to the us caFe combined driving cycle Bubble sizes represent total sales of new passenger cars Because of data availability in different countries the country comparison is based on different calendars years for different countries 2011 for south Korea and japan 2012 for china and india and 2013 for europe the us and Brazil given annual improvements in vehicle energy consumption triggered by regulatory efficiency standards and fiscal incentives those countries with older data could be at a slight disadvantage in this comparison
With the heaviest vehicles on average the us fleet is also the most energy consuming of all countries china and south Korea have similar average energy consumption but since south Korean vehicles are heavier on average they are relatively more efficient than chinese vehicles although Brazilrsquos fleet consumes less fuel on average than those from the us china and south Korea its fleet is relatively inefficient when compared to countries with vehicles of similar weight (japan and india) the average Brazilian vehicle consumes about 34 more energy than the average vehicle in japan whose fleet has a large penetration of gasoline hybrid and advanced fuel-efficiency technologies such as three-cylinder engines VVa Dohc and 6-plus speed transmissions european vehicles are the best performing on average despite being heavier than all countries with the exception of the us and south Korea the adoption of fuel-efficiency technologies (eg Dct 6-plus-speed transmissions gDi turbocharging) contributes to europersquos better than average performance
China2012
SKorea2011
Europe2013
US2013
Japan2011
India2012
Brazil2013
Sales5 MM10 MM
14
16
18
20
22
24
26
28
1000 1100 1200 1300 1400 1500 1600 1700
Ene
rgy
cons
ump
tio
n ndash
CA
FE
(M
Jkm
)
Curb weight (kg)
Type-approval and certification energy consumption data only (does not include o-cycle or real-world driving data)
Figure 4‑5 ndash international comparison of passenger car energy consumption
Country labels indicate the dataset year
Figure 4‑6 provides a more detailed country comparison by illustrating average vehicle energy consumption by vehicle (curb) weight bin Vehicle sales in each bin are shown for reference the us is not shown due to lack of detailed model-by-model data Brazilrsquos vehicles on average have the highest energy consumption in most weight
37
ICCT white paper
bins with china being the second highest in most bins Because china has higher fuel consumption than Brazil on the 1000 bin which represents the highest share of vehicle sales fleet-average energy consumption in china is still higher than in Brazil as illustrated in the previous figure europe consistently performs best in terms of vehicle energy consumption in most weight bins with japan also performing relatively well
Curb weight (kg)
BrazilChinaEuropeIndiaJapanSouth Korea
Ene
rgy
cons
ump
tio
n C
AF
E (
MJ
km)
Sale
s
40
35
25
20
15
10
6M
8M
4M
2M
0M600 800 1000 1200 1400 1600 1800 2000 2200 2400
Figure 4‑6 ndash international comparison of average vehicle energy consumption by vehicle weight
Type-approval and certification energy consumption data only (does not include off-cycle or real-world driving data)
38
Brazil Passenger Vehicle Market statistics
Figure 4‑7 illustrates the distribution of energy consumption data in Brazil for each vehicle version by mass and segment Bubble sizes represent total sales of each version Data were limited to flex-fuel vehicles in the subcompact compact medium and large segments due to its relatively better data quality and representativeness (ie they represented over 87 of sales in 2013) While most vehicles follow a predictable trend that correlates energy consumption and vehicle mass there are a large number of versions with energy consumption substantially higher than the trend line this suggests there is substantial room for improvements in their energy consumption since there are vehicles in similar weight classes with substantially superior energy consumption performance
Sales1000050000
140
160
180
200
220
240
260
280
700 800 900 1000 1100 1200 1300 1400 1500 1600
Ene
rgy
cons
ump
tio
n (M
Jkm
)
Curb weight (kg)
Subcompact Compact Medium Large Fleet average
Figure 4‑7 ndash Distribution of new Brazilian passenger vehicle energy consumption data by vehicle weight and segment (2013)
this chapter suggests that there are potential improvements in vehicle energy consumption for the Brazilian fleet For similar vehicles in terms of weight class footprint or engine rating there is substantial dispersion in energy consumption indicating that there are vehicles performing much worse than the average across manufacturers there is also a clear trend of some manufacturers performing much better than the average while others have a lot more room for improvement the international comparison clearly shows that Brazilian vehicles perform much worse in terms of energy consumption than vehicles of similar weight suggesting a delay in the adoption of energy efficient technologies among Brazilian vehicle manufacturers
Finally a more detailed analysis of vehicle versions clearly illustrates a considerable number of vehicle versions significantly above average thus indicating potential improvements in energy consumption that would place them on par with better performing vehicles with similar characteristics
39
ICCT white paper
Deficiencies in data quality and completeness prevent more definite conclusions about vehicle energy consumption gasoline-only vehicles in particular have poor energy consumption data quality although they represent a relatively small fraction (6) of total vehicles sold in 2013 Because some vehicle segments are primarily composed of gasoline-only vehicles (eg sports minivans) this chapter excludes these segments from the analysis there are also concerns about the gap between energy consumption data reported by iBaMarsquos nota Verde and Brazilrsquos national institute of Metrology standardization and industrial Qualityrsquos (inMetro) labeling program (PBeV using its acronym in Portuguese) with the latter reporting consistently lower values of vehicle energy consumption
Finally the availability of energy consumption data was not adequate for many manufacturers beyond the top 10 sales group which prevented their inclusion in this analysis Despite the data quality and lack of completeness the energy consumption data in this chapter include data that are reasonably accurate and representative thus supporting its interpretation
40
Brazil Passenger Vehicle Market statistics
rEfErENCES
aDK automotive consultoria de Marketing (2013) relatoacuterios de volumes de vendas do mercado brasileiro para veiacuteculos de passeio e comerciais leves referentes a 2013
alves l Wilbert M (2014) reduccedilatildeo do imposto sobre Produto industrializado e a Venda de automoacuteveis Xi congresso usP iniciaccedilatildeo cientiacutefica em contabilidade
associaccedilatildeo nacional de transportes Puacuteblicos (antP 2014) estudo mostra baixo efeito do desconto no iPi de veiacuteculos sobre PiB e emprego available at httpwwwantporgbrwebsitenoticiasshowaspnpgcode=a4DeeFe8-a7BF-48D3-B1F5-8eDe1447BF10
associaccedilatildeo nacional dos Fabricantes de Veiacuteculos automotores (anFaVea 2015) anuaacuterio da induacutestria automobiliacutestica Brasileira 2015 Brazilian automotive industry Yearbook 2015 satildeo Paulo available at wwwanfaveacombr
european environment agency (2014) Monitoring co2 emissions from new passenger cars in the eu summary of data for 2013 april 2014
instituto Brasileiro do Meio ambiente e dos recursos naturais renovaacuteveis (iBaMa 2014) consulta dos niacuteveis de emissatildeo dos veiacuteculos novos brasileiros available at httpsservicosibamagovbrctfpublicosel_marca_modelo_rvepphp
international council on clean transportation (icct 2015) global passenger vehicle standards available at httpwwwtheicctorginfo-toolsglobal-passenger-vehicle-standards
international energy agency (iea 2015) renewables Bioenergy available at httpswwwieaorgtopicsrenewablessubtopicsbioenergy
Korea energy Management corporation (KeMco 2014) Fuel economy regulation available at httpwwwkemcoorkrnew_engmainmainasp
Marklines (2015) Marklines automotive industry Portal available at httpwwwmarklinescomen
Mendonccedila M sachsida a (2014) Modelando a demanda de creacutedito para veiacuteculos no Brasil uma abordagem com mudanccedila de regime iPea
Ministeacuterio do Desenvolvimento induacutestria e comeacutercio exterior (MDic 2013) Programa de incentivo agrave inovaccedilatildeo tecnoloacutegica e adensamento da cadeia Produtiva de Veiacuteculos automotores mdash inovar-auto httpwwwplanaltogov brccivil_03_ato2011-20142012DecretoD7819htm
stein r anderson j and Wallington t (2013) an overview of the effects of ethanol-gasoline Blends on si engine Performance Fuel efficiency and emissions SAE Int J Engines 6(1)470-487 2013 doi1042712013-01-1635
us environmental Protection agency and national highway traffic safety administration (ePanhtsa 2010) Final rulemaking to establish light-Duty Vehicle greenhouse gas emission standards and corporate average Fuel economy standards ePa-420-r-10-901
us environmental Protection agency (ePa 2012) regulatory impact analysis Final rulemaking for 2017-2025 light-Duty Vehicle greenhouse gas emission standards and corporate average Fuel economy standards ePa-420-r-12-016
41
ICCT white paper
us national academy of sciences (nas 2011) assessment of Fuel economy technologies for light-Duty Vehicles available at httpwwwnapeducatalog12924assessment-of-fuel-economy-technologies-for-light-duty-vehicles
World Bank group (2015) World Development indicators available at httpdataworldbankorgdata-catalogworld-development-indicators
42
Brazil Passenger Vehicle Market statistics
LiST Of ACrONyMS
4wD Four-wheel drive
aNFaVEa Brazilian association of automobile Manufacturers
awD all-wheel drive
BRiC Brazil russia india china
CaFE corporate average fuel economy
CBG compressed biogas
CO2 carbon dioxide
CVT continuously variable transmission
CVVT continuously variable valve technology
DCT Dual-clutch transmission
DOhC Dual overhead camshaft
EC energy consumption
Epa us environmental Protection agency
EU european union
FFV Flex-fuel vehicle
FTp Federal test procedure
FwD Front-wheel drive
GDi gasoline direct injection
GDp gross domestic product
GhG greenhouse gas
GM general Motors
iBaMa Brazilian institute of the environment and renewable natural resources
iC internal combustion
iCCT international council on clean transportation
iNMETRO national institute of Metrology standardization and industrial Quality
Kg Kilogram
Km Kilometer
Kw Kilowatt
LDV light-duty vehicle
LpG liquified petroleum gas
MDiC Ministry of Development industry and Foreign trade
MJ Megajoule
MpFi Multi-point fuel injection
Mpg Miles per gallon
NaS us national academy of sciences
43
ICCT white paper
NhTSa us national highway transportation safety administration
OhV overhead valve
pBEV Brazilian Vehicle labeling Program
pSa Psa Peugeot citroeumln
pTwR Power-to-weight ratio
pV Passenger vehicle
RwD rear-wheel drive
SOhC single overhead camshaft
SUV sport utility vehicle
US united states
USD us dollar
VTEC Valve timing electronic control
VVa Variable valve actuation
VVL Variable valve lift
44
Brazil Passenger Vehicle Market statistics
AppENDix A SEGMENT DEfiNiTiONS
Table a‑1 ndash segment definitions
Segmentpower (kw)
pTwR (kwkg) area (m2)
Other characteristics Examples
Subcompact lt 140 lt 0075 le 65 mdash Mini cooper chevrolet celta smart Fortwo
Compact lt 140 lt 0075 65 lt area le 70 mdash honda Fit hyundai hB20 Volkswagen Polo
Medium lt 140 lt 0075 70 lt area le 80 mdash honda civic nissan tiida Peugeot 308
Large lt 140 lt 0075 gt 80 mdash audi a4 BMW 3 series Mercedes c-class
Sports gt 140 gt 0075 mdash 4 seats maxjaguar XF lamborghini gallardo Ferrari california
Off‑road mdash mdash lt 80 traction = 4WDjeep cherokee honda cr-V BMW X3 hyundai santa Fe
SUV mdash mdash lt 80Based on aDKrsquos default classification
BMW X1 Ford ecosport hyundai tucson
Minivan mdash mdash Passengers 6-12
citroen grand Picasso Kia carnival
45
ICCT white paper
AppENDix b iNTErNATiONAL MArKET DATA
Table B‑1 ndash international market comparison of new fleet characteristics
parameters China S Korea EU US Japan india Brazil
Year 2012 2011 2013 2013 2011 2012 2013
Sales (million) 155 13 118 156 352 256 304
price (USD) $21008 $21383 $24439 mdash $20637 $11717 $22015
No of cylinders mdash 43 40 47 38 36 40
Displacement (cc) 1605 1960 1613 2606 1425 1294 1430
Curb weight (kg) 1296 1421 1391 1623 1193 1059 1106
Length (mm) 4323 4531 4263 mdash 4013 3859 4100
Footprint (m2) 38 420 40 425 371 341 367
Engine power (kw) 86 120 89 148 78 55 76
pTwR (kwkg) 00664 00844 00640 00912 00654 00519 00671
Energy consumption ndash US CaFE (MJKm)[1] 235 206 169 250 171 183 202
[1] energy consumption data presented here for countries other than Brazil were obtained from local official sources in its original metric and drive cycle and then converted to Mjkm under the us caFe drive cycle using the methodology described in Yang (2015) Mode details and historical fuel consumption data on their original metrics is presented in the icctrsquos global PV standard website httpwwwtheicctorginfo-toolsglobal-passenger-vehicle-standards
Data Sources
China Ministry of industry and information technology (Miit 2014) corporate average Fuel efficiency accounting Method for Passenger cars available at httpwwwgovcngzdt2013-0320content_2358627htm
Baseline performance china automotive research and technology center through internal communication and icct internal 2010 database for chinese light-duty vehicles
S Korea internal communication with s Korean official and from greencarcongress available at httpwwwgreencarcongresscom200906korea-20090604html
EU european environment agency (2014) Monitoring co2 emissions from new passenger cars in the eu summary of data for 2013 april 2014
US us ePa (2014) light-duty automotive technology carbon dioxide emissions and fuel economy trends1975 through 2014 table 91 page 110 available at http httpwwwepagovfueleconomyfetrends1975-2014420r14023apdf
Japan jaMa (2010) the Motor industry of japan available at httpwwwjama-englishjppublicationsMVs2010pdf Mlit httpwwwmlitgojpcommon000990330pdf
india Bureau of energy efficiency white paper 2010-2012 calculation based on icct database
Brazil icct Brazil Vehicle Database (2013)
46
Brazil Passenger Vehicle Market statistics
Table B‑2 ndash international market comparison of technology adoption in new vehicles
Technology adoption China S Korea EU US Japan india Brazil
Year 2010 2011 2013 2013 2011 2012 2013
Fuel type
CBGLpGFlex 0 11 2 0 0 4 94
Gasoline 99 65 44 93 86 56 6
hybrid 0 1 1 5 13 0 0
Diesel 1 23 53 1 0 40 0
No of cylinders
Two 0 0 0 0 0 6 0
Three 4 0 7 0 36 28 3
Four 90 84 87 56 57 65 97
Five 0 0 1 0 0 0
Six 6 15 4 32 5 0 1
Eight or more 0 0 0 12 1 0 0
Transmission
Manual 60 3 83 5 1 98 83
automatic 34 90 9 75 34 2 15
CVT 5 7 2 18 65 0 1
DCT 1 0 6 2 mdash 0 1
Number of gear ratios
Four or fewer 13 16 1 7 mdash 10 6
Five 68 9 45 11 mdash 85 83
Six or more 19 75 54 82 mdash 5 11
Drivetrain
FwD 74 86 81 83 59 76 0
RwD 21 7 7 10 5 22 0
4wD and awD 5 7 12 7 36 2 100
No of valves per cylinder
Two 17 mdash mdash 2 4 25 60
Multi valve 83 mdash mdash 98 95 75 40
Valve camshaft configuration
Single overhead camshaft 26 1 mdash mdash 16 41 63
Dual overhead camshaft 74 84 mdash mdash 82 53 25
Overhead camshaft mdash 15 mdash mdash 0 6 mdash
Valve actuation
Fixed 50 16 mdash 2 11 86 78
VVT 44 84 mdash 98 89 12 16
VVL 6 mdash mdash mdash mdash 2 6
Fuel systems for gasoline vehicles
Multi‑point fuel injection 94 72 68 62 95 100 98
Gasoline direct injection 6 28 32 37 5 0 2
air induction systems for gasoline vehicles
Naturally aspirated 93 75 41 85 92 64 97
Supercharger turbocharger or twin‑turbo 7 25 59 15 8 36 3
47
ICCT white paper
AppENDix C NEW vEhiCLE ChArACTEriSTiCS AND TEChNOLOGy ADOpTiON DATA iN brAziL
Table C‑1 ndash Fleet characteristics of new Brazilian passenger vehicles by segment (2013)
parameters Subcompact Compact Medium Large Sports Off‑road SUV Minivan
Sales (thousands) 6785 6843 11790 1920 273 768 1997 23
Market share () 223 225 38 8 63 09 25 65 01
price (R$) $30103 $38732 $45496 $66508 $148834 $151284 $75164 $82284
No of cylinders 400 391 399 400 462 448 404 433
Displacement (cc) 1128 1293 1447 1794 2430 2586 1884 2244
Curb weight (kg) 940 1037 1102 1329 1561 1772 1395 1604
Length (mm) 3804 4026 4163 4499 4711 4516 4352 4658
Footprint (m2) 339 361 371 402 418 409 402 427
Engine power ndash gasoline (kw) 58 68 75 99 183 146 103 120
Engine power ndash ethanol (kw) 59 70 77 98 mdash 109 101 mdash
pTwR ndash gasoline (kwkg) 00614 00655 00671 00742 01173 00828 00731 00732
pTwR ndash ethanol (kwkg) 00630 00678 00697 00757 mdash 00766 00745 mdash
48
Brazil Passenger Vehicle Market statistics
Table C‑2 ndash Fleet characteristics of new Brazilian passenger vehicles by manufacturer (2013)
parameters Fiat
GM
Vo
lksw
agen
Ford
Ren
ault
hyu
ndai
ho
nda
Toyo
ta
pSa
Nis
san
Mit
sub
ishi
Kia
JaC
BM
w
Land
Rov
er
Mer
ced
es‑B
enz
Che
ry
aud
i
Suzu
ki
Jeep
Sales (thousands) 6087 5486 5448 3074 2207 2055 1392 1334 1163 621 368 255 158 141 106 94 80 67 63 36
Market share () 2002 1804 1792 1011 726 676 458 439 383 204 121 084 052 046 035 031 026 022 021 012
price (R$) $35017 $42259 $38701 $46174 $43447 $50112 $67078 $68922 $103001 $44035 $100696 $87009 $37654 $165111 $221943 $153281 $30821 $142799 $74769 $139039
No of cylinders 400 401 400 402 400 370 400 400 400 400 408 416 400 424 448 431 400 411 400 552
Displacement (cc) 1250 1340 1287 1497 1423 1495 1691 1808 1575 1579 2262 1856 1411 2095 2281 1934 1398 1912 1831 3182
Curb weight (kg) 1033 1060 1020 1156 1102 1122 1210 1201 1231 1069 1556 1377 1079 1624 1868 1598 1097 1551 1444 1945
Length (mm) 3965 4155 3993 4120 4127 4078 4319 4299 4116 4171 4401 4357 3956 4574 4487 4527 3896 4454 4234 4584
Footprint (m2) 345 370 354 368 378 383 397 387 376 379 395 407 351 429 433 429 349 417 323 420
Engine power ndash gasoline (kw) 64 71 65 79 73 86 96 90 80 82 120 112 83 151 179 138 71 136 94 162
Engine power ndash ethanol (kw) 65 72 65 79 76 85 97 90 81 82 107 106 95 mdash mdash mdash 75 mdash mdash mdash
pTwR ndash gasoline (kwkg)
00613 00662 00631 00674 00657 00739 00788 00745 00646 00766 00779 00792 00784 00921 00977 00856 00638 00870 00649 00835
pTwR ndash ethanol (kwkg) 00629 00681 00642 00693 00685 00781 00800 00795 00660 00768 00710 00798 00896 mdash mdash mdash 00659 mdash mdash mdash
49
ICCT white paper
Table C‑3 ndash Fleet characteristics of new Brazilian passenger vehicles by origin (2013)
parameters Domestic imported
Sales (thousands) 2537 504
Market share () 834 166
price (R$) $41739 $76049
No of cylinders 397 412
Displacement (cc) 1359 1791
Curb weight (kg) 1070 1289
Length (mm) 4063 4285
Footprint (m2) 362 390
Engine power ndash gasoline (kw) 70 102
Engine power ndash ethanol (kw) 73 84
pTwR ndash gasoline (kwkg) 0065 0076
pTwR ndash ethanol (kwkg) 0068 0074
50
Brazil Passenger Vehicle Market statistics
Table C‑4 ndash technology adoption in new Brazilian passenger vehicles by segment (2013)
Technology adoption Subcompact Compact Medium Large SportOff‑road SUV Minivan
Fuel type
Flex 982 988 982 837 00 134 826 00
Gasoline 18 12 17 163 996 540 174 1000
hybrid 0000 0000 0028 0000 0396 0001 0000 0000
Diesel 00 00 00 00 00 326 00 00
No of cylinders
Three 01 91 10 00 00 00 00 00
Four 999 909 990 998 758 775 979 833
Five 00 00 00 02 03 00 00 00
Six 00 00 00 00 175 211 21 167
Eight or more 00 00 00 00 63 13 00 00
Transmission
Manual 993 944 826 622 62 174 505 641
automatic 07 55 161 283 629 707 451 359
CVT 00 00 12 89 09 93 34 00
DCT 00 01 02 06 299 25 10 00
No of gear ratios
Four or fewer 04 47 72 51 00 34 247 193
Five 984 943 848 378 15 392 516 641
Six 12 09 73 515 796 462 225 167
Seven 00 01 06 23 87 53 12 00
Eight or more 00 00 01 32 102 59 00 00
Drivetrain
FwD 998 1000 997 688 550 00 916 1000
RwD 02 00 03 311 221 00 84 00
awD 00 00 00 01 229 1000 00 00
No of valves per cylinder
Two 806 694 584 195 00 00 258 00
Multi valve 194 306 416 805 1000 1000 742 1000
Valve camshaft configuration
Single overhead camshaft 839 786 709 309 00 212 375 00
Dual overhead camshaft 24 158 161 546 880 517 446 255
Valve actuation
Fixed 982 729 807 461 49 493 664 868
VVT 18 211 115 470 827 367 252 132
VVT+VVL 00 61 78 68 124 140 84 00
Fuel systems for gasoline vehicles
Multi‑point fuel injection 999 998 997 949 979 143 766 1000
Gasoline direct injection 01 02 03 51 21 857 234 00
air induction systems for gasoline vehicles
Naturally aspirated 999 997 995 943 974 369 543 1000
Supercharger turbocharger or twin‑turbo 01 03 05 57 26 631 457 00
51
ICCT white paper
Table C‑5 ndash technology adoption in new Brazilian passenger vehicles by manufacturer (2013)
Technology adoption Fi
aT
GM
VO
LKSw
aG
EN
FOR
D
REN
aU
LT
hY
UN
Da
i
hO
ND
a
TOYO
Ta
pSa
NiS
SaN
MiT
SUB
iSh
i
Kia
JaC
BM
w
LaN
D R
OV
ER
MER
CED
ES
Fuel type
Flex 990 987 965 966 997 921 999 886 928 998 283 739 31 42 00 00
Gasoline 10 09 35 34 03 79 01 35 72 02 557 255 969 957 663 950
hybrid 00 00 00 00 00 00 00 02 00 00 00 00 00 00 00 00
Diesel 00 04 00 00 00 00 00 77 00 00 160 06 00 00 337 50
No of cylinders
Three 00 00 05 00 00 348 00 00 00 00 00 00 00 00 00 00
Four 1000 996 994 989 1000 626 999 998 1000 1000 958 922 1000 906 787 878
Five 00 00 00 00 00 00 00 00 00 00 00 00 00 00 00 00
Six 00 02 01 11 00 26 01 02 00 00 42 78 00 68 185 87
Eight or more 00 02 00 00 00 00 00 00 00 00 00 00 00 26 28 35
Transmission
Manual 992 878 985 846 853 632 566 565 703 785 493 120 1000 02 00 151
automatic 08 103 00 137 62 285 355 160 297 121 118 793 00 575 18 14
CVT 00 19 15 16 41 70 01 246 00 00 139 87 00 423 982 836
DCT 00 00 00 00 43 13 78 30 00 94 251 00 00 00 00 00
No of gear ratios
Four or fewer 02 04 00 55 104 237 00 323 249 132 17 133 00 00 00 00
Five 981 811 963 839 797 623 861 643 684 828 530 107 1000 00 00 64
Six 17 185 29 106 99 140 139 07 67 40 453 754 00 217 800 00
Seven 00 00 07 00 00 00 00 27 00 00 00 00 00 08 00 936
Eight or more 00 00 00 00 00 00 00 00 00 00 00 06 00 775 200 00
Drivetrain
FwD 1000 902 989 972 987 985 990 892 1000 1000 496 623 1000 00 00 00
RwD 00 91 00 00 00 00 00 16 00 00 00 370 00 882 00 900
awD 00 06 11 28 13 15 10 92 00 00 504 07 00 118 1000 100
No of valves per cylinder
Two 811 864 988 745 220 00 00 00 00 00 00 00 00 00 00 00
Multi Valve 189 136 12 255 780 1000 1000 1000 1000 1000 1000 1000 1000 1000 1000 1000
Valve camshaft configuration
SOhC 836 755 914 675 832 00 04 00 497 398 331 00 00 00 00 00
DOhC 07 108 56 50 168 992 786 875 352 428 477 1000 907 810 860 453
Valve actuation
Fixed 1000 898 965 966 940 29 00 574 736 573 435 76 124 187 18 55
VVT 00 102 35 34 60 971 00 426 264 427 00 924 876 00 982 945
VVT+VVL 00 00 00 00 00 00 1000 00 00 00 565 00 00 813 00 00
air induction System
Naturally aspirated 997 994 966 977 997 988 1000 923 922 1000 835 936 1000 97 37 101
Supercharger turbocharger or twin‑turbo
03 06 34 23 03 12 00 77 78 00 165 64 00 903 963 899
Fuel systems for gasoline vehicles
Multipoint fuel injection 1000 995 965 972 1000 989 1000 1000 967 1000 994 1000 1000 78 15 158
Gasoline Direct injection 00 05 35 28 00 11 00 00 33 00 06 00 00 922 985 842
note Difference between 100 and summation of sohc and Dohc market share values corresponds to data not available
52
Brazil Passenger Vehicle Market statistics
AppENDix D DATA SOurCES AND COMpLETENESS
the basis of the statistics shown in this report is a database compiled by the icct with vehicle sales technical information (eg fleet characteristics technology content) and energy consumption (converted from either co2 emissions or fuel economy) from various data sources outlined in table D-1
Table D‑1 ndash Brazilian data sources
parameters Sales TechnicalEnergy
consumption
aDK (2014 2015) x x
MarkLines (2015) x
iBaMa (2014) x
iNMETRO (2014) x
UOL (2014) x
icarroscom (2014) x
this analysis examined energy consumption data from two public sources the nota Verde Program by the Brazilian institute of the environment and renewable natural resources (iBaMa) and the Brazilian Vehicle labeling Program (PBeV) by the national institute of Metrology standardization and industrial Quality (inMetro) table D-2 summarizes key differences between these two data sources
Table D‑2 ndash energy consumption data sources
iBaMa iNMETRO
program nota Verde1 Brazilian Vehicle labeling Program (PBeV)2
program description
Mandatory program that reports emissions of co2 co nox and nMhc as part of emissions certification program
Voluntary program since 2009 that allows the comparison of fuel economy across vehicle models
Unit gco2 km kml
Test cycle chassis testing under urban (FtP) driving cycle based on nBr 66012005
chassis testing under urban (FtP) and highway (hWYFe) driving cycles based on nBr 702420103
adjustment
no adjustment for real-world driving conditions Because reported co2 emissions are assumed to be zero for ethanol adjustments were made to account for tailpipe co2 emissions for vehicles running on ethanol
since 2010 published values include real-world adjustment factors to chassis test data a method adopted by the us ePa in 2008
Conversion to MJkm
iBaMarsquos data are reported as FtP (city test) co2 data in gco2 km conversion to caFe test cycle and to a different metric (Mjkm) involves four steps as presented in Figure D-1
inMetrorsquos data in kml are presented separately by fuel type (e22 e100) and driving cycle (urban highway) conversion to Mjkm was done by applying a conversion factor (2167 gco2 l for e22 and 1428gco2l for e00) caFe values are obtained by using a 5545 weighting for the urban (FtP) and highway cycles respectively
1 iBaMa (2014) nota Verde program available at httpwwwmmagovbrcidades-sustentaveisqualidade-do-arcontrole-de-emissoes-veicularesnota-verde
2 inMetro (2014) Programa Brasileiro de etiquetagem Veicular (PBeV) available at httpwwwinmetrogovbrconsumidortabelas_pbe_veicularasp
3 inMetro (2014) Metodologia Para Divulgaccedilatildeo De Dados De consumo Veicular available at httpwwwinmetrogovbrconsumidorpbeMetodologia_consumo_Veicularpdf
53
ICCT white paper
Step 1 Correcting the original IBAMA CO2 reported data ndash FTP CO2 gkm
IBAMArsquos CO2 reported values are corrected to account for tailpipe emissions from ethanol (tailpipe CO2 emissions are reported as zero in IBAMArsquos data)
bull E22 FTP reported CO2 data are reduced by 177bull E100 FTP reported CO2 data are reduced by 100
Flex fuel vehicles are tested with E22 and E00 the final values is calculated as the average of both fuelsCO2 IBAMA_Flex_FTP= 05(1-0177)CO2_E22_test_FTP + 050E100_FTP = 050823CO2_E22_FTPFor Gasoline only vehicles the tests are carried out only with Gasoline E22CO2 IBAMA_Gasoline_FTP = (1-0177) CO2_E22_Test_FTP
Where in the previous equations CO2_E22_FTP means CO2 emissions values obtained under FTP testingCO2 IBAMA_Flex_FTP means IBAMArsquos Corrected FTP values for flex vehiclesCO2 IBAMA_Gasoline_FTP means IBAMArsquos Corrected FTP values for gasoline only (E22) vehicles
INNOVAR AUTO is based on energy consumption data obtained as the combined CAFE test cycle This requires a weighted average of energy consumption data obtained from FTP testing (city driving ) and Highway fuel economy testing (HWFET) In mathematical form CAFE=f(FTPHWFET)
Given that IBAMA data is provided for only the first aprt the FTP testing then it is required to find a way to calculate CAFE combined values through FTP -75 only data A linear function was thus developed from data with FTP and HWY values (INMETRO data) is used to convert FTP only values to CAFE CO2 values ie CAFE=f(FTP) The function used for this conversion is
CO2_CAFE= (CO2_FTP+44756)11572
Step 2Convert FTP CO2 values to CAFE CO2 values
Converting CO2 values to MJkm values is done by using the energy density of E22 Note that all the previous calculations for CO2 come from E22-based data
bull The energy density of E22 is 2894 MJLE22bull E22 emits 2167gCO2LE22bull CAFE (MJkm) = CAFE (gCO2km) (2894 MJLE22 2167 gCO2LE22)
Step 3 Convert US CAFE CO2 values to MJkm values
Figure D‑1 ndash conversion of emission to energy consumption data
energy consumption values calculated from iBaMa and inMetro data differ greatly Figure D-1 illustrates energy consumption data for those models in both databases iBaMa data are on average 126 higher than inMetro data with a standard deviation of 89 and a maximum deviation of 39
54
Brazil Passenger Vehicle Market statistics
0
05
1
15
2
25
3
0 05 1 15 2 25 3
Ene
rgy
cons
ump
tio
n IB
AM
A (
MJ
km)
Energy consumption INMETRO (MJkm)
n=151
Figure D‑2 ndash comparison between energy consumption data from inMetro and iBaMa
151 vehicles tested under both programs
although inMetro data are more transparent as it breaks down fuel economy by fuel and test cycle it is still a voluntary program that allows manufacturers to select which models will participate in addition not all manufacturers participate in the program in turn iBaMa data only include co2 data for the urban cycle and thus energy consumption in the combined cycle had to be estimated from correlations using international data in addition corrections had to be made for gasoline-only engines since it seems that a co2 discount in theory only applicable to flex-fuel engines was also applied to gasoline-only engines Despite these data quality issues iBaMa data were considered the most adequate data source for energy consumption because it is a mandatory program that requires data reporting by all vehicle models and manufacturers
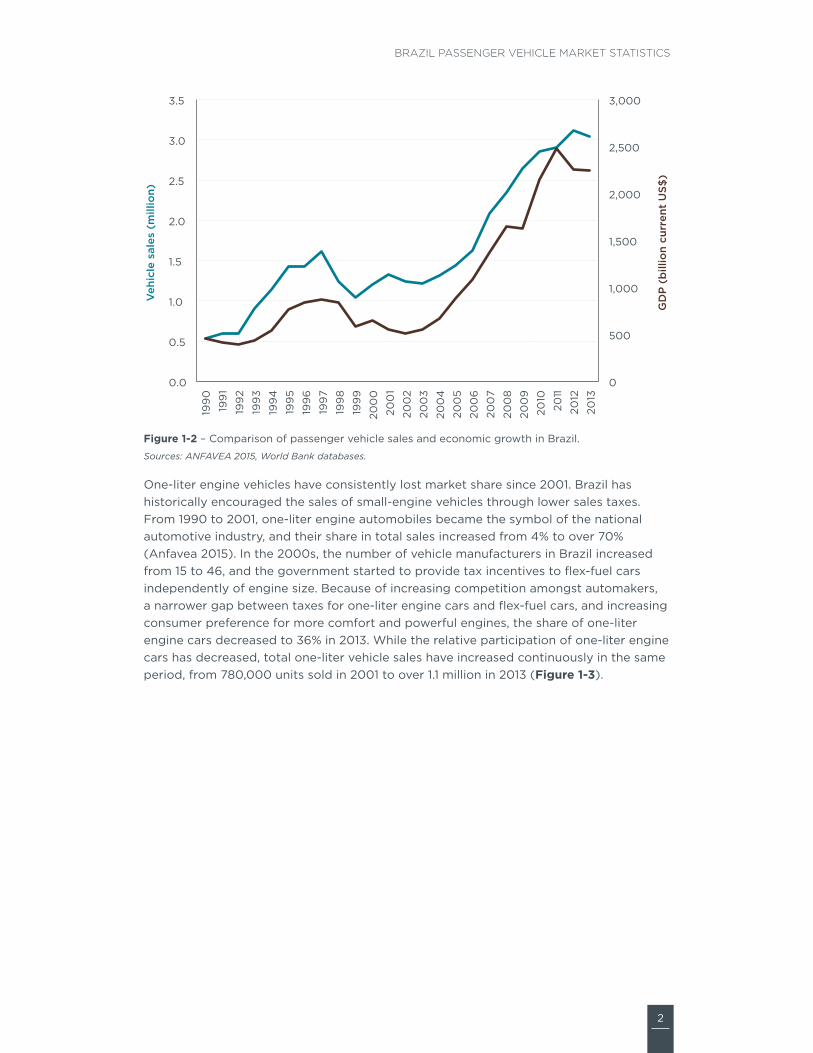
2
Brazil Passenger Vehicle Market statistics
0
500
1000
1500
2000
2500
3000
00
05
10
15
20
25
30
35
199
0
199
1
199
2
199
3
199
4
199
5
199
6
199
7
199
8
199
9
200
0
200
1
200
2
200
3
200
4
200
5
200
6
200
7
200
8
200
9
2010
2011
2012
2013
GD
P (
bill
ion
curr
ent
US$
)
Veh
icle
sal
es (
mill
ion)
Figure 1‑2 ndash comparison of passenger vehicle sales and economic growth in Brazil
Sources ANFAVEA 2015 World Bank databases
one-liter engine vehicles have consistently lost market share since 2001 Brazil has historically encouraged the sales of small-engine vehicles through lower sales taxes From 1990 to 2001 one-liter engine automobiles became the symbol of the national automotive industry and their share in total sales increased from 4 to over 70 (anfavea 2015) in the 2000s the number of vehicle manufacturers in Brazil increased from 15 to 46 and the government started to provide tax incentives to flex-fuel cars independently of engine size Because of increasing competition amongst automakers a narrower gap between taxes for one-liter engine cars and flex-fuel cars and increasing consumer preference for more comfort and powerful engines the share of one-liter engine cars decreased to 36 in 2013 While the relative participation of one-liter engine cars has decreased total one-liter vehicle sales have increased continuously in the same period from 780000 units sold in 2001 to over 11 million in 2013 (Figure 1‑3)
3
ICCT white paper
0
10
20
30
40
50
60
70
80
90
100
00
02
04
06
08
10
12
14
16
18
20
199
0
199
1
199
2
199
3
199
4
199
5
199
6
199
7
199
8
199
9
200
0
200
1
200
2
200
3
200
4
200
5
200
6
200
7
200
8
200
9
2010
2011
2012
2013
10
L S
hare
New
10
L e
ngin
e ve
hicl
e re
gis
trat
ions
(m
illio
n)
Figure 1‑3 ndash new registrations of one-liter engine vehicles
Source ANFAVEA 2015
Due to a long-standing national program to stimulate ethanol consumption ethanol is sold as e100 (100 ethanol by volume) as well as being blended in gasoline the government sets the ethanol blend in commercial gasoline ranging from 20 to 27 ethanol depending on the current blend mandate (e20-e25 since 2011 and e27 in 2015) as a result biofuels in Brazil account for about 25 of road transport fuel demand compared to less than 35 globally (iea 2015)
ethanol availability at different blend levels has had a strong impact over consumer choices and technologies offered in the market by manufacturers until the 2000s sales of gasoline or ethanol vehicles were driven primarily by fuel prices with ethanol vehicles dominating sales in the 1980s and very strong sales of gasoline engines in the 1990s today flex-fuel engines those that can run on any combination of ethanol and gasoline are currently ubiquitous in new passenger vehicles since their introduction in 2003 flex-fuel engines now dominate the passenger vehicle market accounting for 94 of new sales in 2013 (Figure 1‑4) sales of new diesel passenger cars have been below 1 of total sales since 2005 (anFaVea 2015)
4
Brazil Passenger Vehicle Market statistics
0
10
20
30
40
50
60
70
80
90
100
198
019
81
198
219
83
198
419
85
198
619
87
198
819
89
199
019
91
199
219
93
199
419
95
199
619
97
199
819
99
200
020
01
200
220
03
200
420
05
200
620
07
200
820
09
2010
2011
2012
2013
Pas
seng
er c
ar f
uel m
arke
t sh
are
Gasoline Ethanol Flex
Figure 1‑4 ndash registrations of new passenger vehicles by fuel type
Source ANFAVEA 2015
the top seven manufacturers ndash Fiat general Motors (gM) Volkswagen Ford renault hyundai and honda ndash commanded a vast majority (83) of the entire market in 2013 with the remaining manufacturers accounting for less than 4 of market sales each (Figure 1‑5) the Volkswagen gol is the most popular vehicle in Brazil accounting for about 45 of all sales in 2013 Medium-sized vehicles dominate the market with 39 of all sales followed by compact and subcompact vehicles which together make up 84 of the entire market in addition domestically manufactured vehicles accounted for more than 83 of sales in 2013 which represented a small increase with respect to the previous year
FIAT20
GM18
VOLKSWAGEN18
FORD10
RENAULT7
HYUNDAI7
HONDA5
TOYOTA 4
PSA 4
NISSAN 2
Others 5
2013 market shareby manufacturer
Subcompact22
Compact22Medium
39
Large6
Sport1
O-Road3
SUV7
Minivan01
2013 market shareby segment
Figure 1‑5 ndash Market share of new passenger vehicles by manufacturer and segment (2013)
Source ADK
5
ICCT white paper
Table 1‑1 summarizes key indicators for the Brazilian passenger vehicle market in 2012 and 2013 Fiat remained the market leader in 2013 although with a small loss and gM overtook Volkswagen in 2013 amongst the companies that gained the most market share are hyundai and toyota both of which doubled their market share between 2012 and 2013 on the other hand Psa and nissan lost market shares in this period the market dominance of medium-sized vehicles in 2013 marks a significant shift in consumer preferences Between 2012 and 2013 the subcompact segment lost the majority share (from 33 to 22) and the larger compact and medium segments gained sizable shares
Table 1‑1 ndash Market characteristics of new Brazilian passenger vehicles
parameter 2012 2013
Sales (million) 311 304
price (R$) $47203 $47446
Domestic market share 800 834
Engine 10 L share 386 363
Fuel share
Flex 914 936
Gasoline 82 59
hybrid 0004 0014
Diesel 04 05
Segment market share
Subcompact 332 223
Compact 162 225
Medium 335 388
Large 79 63
Sport 07 09
Off‑road 23 25
SUV 61 66
Minivan 01 01
Manufacturer market share
Fiat 221 200
GM 176 180
Volkswagen 211 179
Ford 96 101
Renault 73 73
hyundai 32 68
honda 43 46
Toyota 24 44
pSa 44 38
Nissan 28 20
Mitsubishi 13 12
Kia 11 08
JaC 06 05
BMw 03 05
Land Rover 03 03
Mercedes‑Benz 02 03
Others 02 14
sales-weighted average
6
Brazil Passenger Vehicle Market statistics
2 vEhiCLE fLEET ChArACTEriSTiCS
this chapter provides an overview of key vehicle fleet characteristics in Brazil number of cylinders engine displacement curb weight1 length footprint2 engine power and power-to-weight ratio (PtWr)3 are relevant indicators to characterize a vehicle fleet and understand individual vehicle and fleet-average energy consumption4
these key characteristics of passenger vehicles in Brazil experienced a small change in 2013 compared to 2012 (Table 2‑1) With the exception of number of cylinders all parameters increased in 2013 consistent with a trend of increasing market shares for larger and more powerful vehicles the evaluation of minimum and maximum parameters also provides important insights While the smallest vehicles continue to be sold in Brazil (since the minimum values did not change with the exception of footprint) it is evident that much larger vehicles started being sold in 2013 represented by the large variation in the maximum values of each parameter Because sales of these recently introduced larger vehicles are relatively small their effect on weighted average parameters is also modest
Figure 2‑1 illustrates key vehicle fleet characteristics by vehicle segment (see appendix a for segment definition) not surprisingly most parameters get larger between the subcompact and large segments off-road vehicles sports cars and minivans tend to be the largest and most powerful vehicles across the fleet while sport utility vehicles (suVs) tend to be comparable with vehicles in the ldquolargerdquo segment Because of their high performance (absolute and relative to vehicle size) sports cars have significantly larger engine power and PtWr compared to all other segments sports vehicles primarily imported are not sold in a flex-fuel configuration and consume strictly gasoline Flex-fuel vehicles have slightly higher engine power and PtWr than their gasoline counterparts in most segments Detailed sales-weighted average data by segment are presented in Table C‑1 in appendix c
1 Based on norm aBnt nBr iso 1176 2006 curb weight is the total weight of a vehicle with standard equipment all necessary operating consumables (eg motor oil and coolant) a full tank of fuel but not loaded with passengers or cargo
2 Footprint (m2) is the product of the distance between the axles of a vehicle (wheelbase) and the distance between the centerline of the tires (average trackwidth)
3 Power to weight ratio (PtWr) is defined as the rated power of the engine (kW) divided by the vehicle weight (kg) PtWr is a metric that describes vehicle acceleration and handling and it is thus used in Brazil as a criterion to classify sports vehicles (PtWr gt 0075 kWkg)
4 Vehicle energy consumption is presented in megajoules per kilometer (Mjkm) for consistency with the vehicle energy consumption targets established by inovar-auto although e27 is currently being used flex-fuel vehicles are tested with e22 fuel
7
ICCT white paper
Table 2‑1 ndash Fleet characteristics of new Brazilian passenger vehicles
Vehicle characteristic 2012 2013 Variation
Number of cylinders weighted average 402 400 ‑06
Displacement (cc)
Min 970 970
Max 6498 6749
weighted average 1418 1430 08
Curb weight (kg)
Min 800 800
Max 2940 2710
weighted average 1102 1106 04
Length (mm)
Min 2695 2695
Max 5290 5842
weighted average 4089 4100 03
Footprint (m2)
Min 217 241
Max 523 874
weighted average 364 367 09
Engine power ndash gasoline (kw)
Min 33 33
Max 153 545
weighted average 743 757 18
Engine power ndash ethanol (kw)
49 49
Max 114 153
weighted average 715 740 34
pTwR ‑ gasoline (kwkg)
00455 00455
Max 04482 03344
weighted average 00658 00671 20
pTwR ‑ ethanol (kwkg)
00476 00477
Max 00935 01033
weighted average 00667 00683 24
Energy consumption ndash US CaFE (MJkm) na 202
8
Brazil Passenger Vehicle Market statistics
0
500
1000
1500
2000
2500
3000
Subco
mpac
t
Compac
t
Medium
Larg
eSport
O-road SUV
Miniva
n
Fleet-a
vera
ge
Dis
pla
cem
ent
(cc)
0200400600800
10001200140016001800
2000
Subco
mpac
t
Compac
t
Medium
Larg
eSport
O-road SUV
Miniva
n
Fleet-a
vera
ge
Cur
b w
eig
ht (
kg)
0500
10001500
2000250030003500400045005000
Subco
mpac
t
Compac
t
Medium
Larg
eSport
O-road SUV
Miniva
n
Fleet-a
vera
ge
Leng
th (
mm
)
000050100150
200250300350400450
Subco
mpac
t
Compac
t
Medium
Larg
eSport
O-road SUV
Miniva
n
Fleet-a
vera
ge
Fo
otp
rint
(m
2 )
020406080
100120140160180
200
Subco
mpac
t
Compac
t
Medium
Larg
eSport
O-road SUV
Miniva
n
Fleet-a
vera
ge
Po
wer
(kW
)
Gasoline EthanolGasoline and Ethanol
000
002
004
006
008
010
012
014
Subco
mpac
t
Compac
t
Medium
Larg
eSport
O-road
SUV
Miniva
n
Fleet-a
vera
gePo
wer
-to
-wei
ght
rat
io (
kWk
g)
Figure 2‑1 ndash Fleet characteristics of new Brazilian passenger vehicles by segment (2013)
Fleet characteristics for the top 20 vehicle manufacturers responsible for more than 99 of passenger vehicle sales in 2013 are presented in Figure 2‑2 the four top-selling manufacturers (Fiat gM Volkswagen and Ford) produce on average lighter vehicles with smaller and less powerful engines average engine rated power is below 80 kW for the 10 largest manufacturers except for toyota and honda since each has a large share of off-road and suV sales respectively luxury manufacturers and off-road dominant manufacturers (jeep and Mitsubishi) show the largest values of engine power PtWr values seem evenly distributed below 0070 kWkg across the five largest manufacturers plus Psa and chery and climb following the power trend for luxury and off-road oriented manufacturers Most vehicles are rated with higher engine power and PtWr under ethanol (e100) than under gasoline (e22) Detailed sales-weighted average data by manufacturer are presented in Table C‑2 in appendix c
9
ICCT white paper
Gasoline Ethanol
0
500
1000
1500
2000
2500
3000
3500
Fiat GM
Volkswag
enFord
Renau
lt
Hyund
ai
Honda
Toyo
taPSA
Nissan
Mitsub
ishiKIA
JACBMW
Land
Rove
r
Merce
des-B
enz
Chery
Audi
Suzuk
iJe
ep
Fleet-a
vera
geFiat GM
Volkswag
enFord
Renau
lt
Hyund
ai
Honda
Toyo
taPSA
Nissan
Mitsub
ishiKIA
JACBMW
Land
Rove
r
Merce
des-B
enz
Chery
Audi
Suzuk
iJe
ep
Fleet-a
vera
ge
Dis
pla
cem
ent
(cc)
0200400600800
10001200140016001800
2000
Cur
b w
eig
ht (
kg)
Fiat GM
Volkswag
enFord
Renau
lt
Hyund
ai
Honda
Toyo
taPSA
Nissan
Mitsub
ishiKIA
JACBMW
Land
Rove
r
Merce
des-B
enz
Chery
Audi
Suzuk
iJe
ep
Fleet-a
vera
geFiat GM
Volkswag
enFord
Renau
lt
Hyund
ai
Honda
Toyo
taPSA
Nissan
Mitsub
ishiKIA
JACBMW
Land
Rove
r
Merce
des-B
enz
Chery
Audi
Suzuk
iJe
ep
Fleet-a
vera
ge000050100150
200250300350400450
Fo
otp
rint
(m
2 )
3400
3600
3800
4000
4200
4400
4600
4800
Leng
th (
mm
)
Fiat GM
Volkswag
enFord
Renau
lt
Hyund
ai
Honda
Toyo
taPSA
Nissan
Mitsub
ishiKIA
JACBMW
Land
Rove
r
Merce
des-B
enz
Chery
Audi
Suzuk
iJe
ep
Fleet-a
vera
geFiat GM
Volkswag
enFord
Renau
lt
Hyund
ai
Honda
Toyo
taPSA
Nissan
Mitsub
ishiKIA
JACBMW
Land
Rove
r
Merce
des-B
enz
Chery
Audi
Suzuk
iJe
ep
Fleet-a
vera
ge0
20406080
100120140160180
200
Po
wer
(kw
)
00000010002000300040005000600070008000900100
Po
wer
-to
-wei
ght
rat
io (
kWk
g)
Gasoline and Ethanol
Figure 2‑2 ndash Fleet characteristics of new Brazilian passenger vehicles by manufacturer (2013)
Manufacturers are organized by total sales in descending order
Figure 2‑3 illustrates vehicle fleet characteristics for domestic and imported vehicles in general imported vehicles are bigger and heavier than those nationally produced the most remarkable contrast lies on engine power and PtWr imported vehicles are more powerful and have higher PtWr but while domestic vehicles exhibit higher engine power and PtWr for ethanol than for gasoline the opposite occurs for imported ones a closer examination of available data on engine compression ratios shows that domestic producers are leveraging ethanolrsquos higher octane rating and designing flex-fuel engines with much higher compression ratios (~1251) than gasoline-only engines (around 1051)5 this confirms the special engine designcalibration for operation with high ethanol gasoline blends from manufacturers with local production Detailed sales-weighted average data by origin are presented in Table C‑3 in appendix c
5 More information on the effect of ethanol on vehicle design characteristics can be found in stein et al (2013)
10
Brazil Passenger Vehicle Market statistics
Gasoline Ethanol
0
200
400
600
800
1000
1200
1400
1600
1800
2000
Domestic Imported Fleet-average
Dis
pla
cem
ent
(cc)
0
200
400
600
800
1000
1200
1400
Domestic Imported Fleet-average
Cur
b w
eig
ht (
kg)
345
350
355
360
365
370
375
380
385
390
395
Domestic Imported Fleet-average
Fo
otp
rint
(m
2 )
3950
4000
4050
4100
4150
4200
4250
4300
4350
Domestic Imported Fleet-average
Leng
th (
mm
)
0
20
40
60
80
100
120
Domestic Imported Fleet-average
Po
wer
(kW
)
0050
0055
0060
0065
0070
0075
0080
Domestic Imported Fleet-average
Po
wer
-to
-wei
ght
rat
io (
kWk
g)
Gasoline and Ethanol
Figure 2‑3 ndash Fleet characteristics of new Brazilian passenger vehicles by origin (2013)
Figure 2‑4 compares Brazilrsquos passenger vehicle fleet with those in china the us eu japan india and south Korea For the energy consumption comparison this analysis considers the us corporate average fuel economy (caFe) test cycle6 average engine displacement curb weight footprint and engine power in Brazil are the smallest with the exception of india (and japan in the case of engine displacement) With respect to PtWr the average Brazilian passenger car breaks the trend set by the power category ie Brazilian cars are less powerful than those in china japan and eu due to their lower average weight which drives the PtWr value above chinese japanese and european cars this suggests that the average Brazilian cars share the driving performance characteristics (eg acceleration times) of the us and Korean vehicles despite their relative smaller engines Detailed international data are presented in appendix B
6 Details on icctrsquos methodology for comparing new vehicle fuel efficiency can be found at the global PV standards section in the icctrsquos website httpwwwtheicctorginfo-toolsglobal-passenger-vehicle-standards
11
ICCT white paper
Despite having the smallest lightest and least powerful vehicles on average (with the exception of india) Brazilrsquos average energy consumption ranks fourth amongst the markets analyzed in this study the japanese fleet had the lowest energy consumption given the small and light vehicle characteristics of japanese cars and their relatively higher adoption of efficiency technologies (eg hybrids) followed by the eu (medium sizeweight fleet with high technology penetration) and india (smaller and lighter fleet overall) the us has the highest energy consumption on average due to the fleetrsquos larger size weight and power requirements china and south Korea trail the us as the most energy-consuming fleet and these countries have fleets with large and heavy vehicles but relatively lower penetration of efficiency technologies a detailed evaluation of energy consumption in Brazil and other markets is presented in chapter 4
0
500
1000
1500
2000
2500
3000
US S Korea EU China Brazil Japan India
Dis
pla
cem
ent
(cc)
0
200
400
600
800
1000
1200
1400
1600
1800
US S Korea EU China Japan Brazil India
Cur
b w
eig
ht (
kg)
000
050
100
150
200
250
300
350
400
450
US S Korea EU China Japan Brazil India
Fo
otp
rint
(m
2)
0
20
40
60
80
100
120
140
160
US S Korea EU China Japan Brazil India
Po
wer
(kW
)
00000
00100
00200
00300
00400
00500
00600
00700
00800
00900
01000
US S Korea Brazil China Japan EU India
Po
wer
-to
-wei
ght
rat
io (
kWk
g)
100
120
140
160
180
200
220
240
260
US China S Korea Brazil India Japan EU
Ene
rgy
cons
ump
tio
n ndash
US
CA
FE
(M
Jkm
)
Figure 2‑4 ndash international comparison of key new passenger vehicle characteristics
12
Brazil Passenger Vehicle Market statistics
3 vEhiCLE TEChNOLOGy ADOpTiON
this chapter provides an overview of current technology adoption including fuel engine and transmission technologies that affect vehicle energy consumption the type and complexity of technologies vary across vehicle segments to a large extent this is a function of vehicle size and weight and its intended performance and ultimately cost Fleet-average parameters presented in Table 3‑1 correspond to sales-weighted fleet-average values this chapter is divided by technology type with supporting information in appendix c an international comparison for each technology is also presented in this chapter the data for this technology adoption analysis came from a diversity of sources listed in appendix D also note that for comparisons at the international level it was required to use information from different years the most recent according to data availability
Table 3‑1 ndash technology adoption in new Brazilian passenger vehicles
Year 2012 2013
Fuel type
Flex 914 936
Gasoline 82 59
hybrid 0004 0014
Diesel 04 049
No of cylinders
Three 03 25
Four 986 966
Five 00 00
Six 09 08
Eight or more 01 01
Transmission
Manual 870 833
automatic 112 147
CVT 14 15
DCT 04 05
No of gear ratios
Four or fewer 61 59
Five 849 831
Six 84 98
Seven 03 07
Eight or more 02 05
Drivetrain
FwD 950 944
RwD 27 29
4wD and awD 23 27
No of valves per cylinder
Two 664 596
Multi valve 336 404
Valve camshaft configuration
Single overhead camshaft 696 630
Dual overhead camshaft 176 245
Valve actuation
Fixed 822 783
VVT 124 159
VVT+VVL 54 58
Fuel systems for gasoline vehicles
Multi‑point fuel injection 982 976
Gasoline direct injection 18 24
air induction systems for gasoline vehicles
Naturally aspirated 984 973
Supercharger turbocharger or twin‑turbo 16 27
13
ICCT white paper
FUEL TYpEFlex-fuel vehicles (FFVs) are designed to run on gasoline (e22) ethanol (e100) or any combination of both fuels except for a few engine and fuel system modifications FFVs are identical to gasoline-only models7 FFVs experience no loss in performance when operating on e100 however since ethanol contains less energy per volume than gasoline FFVs typically get about 25 fewer kilometers per liter when fuelled with e100
Flex-fuel is the dominant technology across all vehicle segments with the exception of sports cars off-road vehicles and minivans (Figure 3‑1) all top 10 manufacturers produce primarily flex-fuel engines and those manufacturers with a larger share of gasoline and diesel engines typically import most of their vehicles (Figure 3‑2) the predominance of FFVs responsible for almost 94 of vehicle sales in 2013 is unique to Brazil (Figure 3‑3)
hybrid-gasoline vehicles achieve reduced fuel consumption by incorporating in the drivetrain a battery and an electric motor in addition to an internal combustion (ic) engine this technology permits the ic engine to shut down when the vehicle is decelerating and is stopped braking energy to be recovered and the ic engine to be downsized and operated at more efficient operating points Depending on the level of complexity hybrid systems can achieve 15 to 35 reductions in fuel consumption with respect to similar-sized vehicles
Despite having very limited penetration sales of new hybrid vehicles have increased three-fold from 131 units in 2012 to 432 in 2013 primarily in the medium and sports segments two manufacturers sell the most gasoline hybrid models (not flex-fuel) in Brazil including the toyota Prius and the Ford Fusion hybrid
Diesel engines offer 20 to 25 reduction in fuel consumption over traditional gasoline multi-point fuel injection (MPFi) engines due to higher compression ratios reduced pumping losses and 12 higher energy content per liter of fuel the challenge for further commercialization is twofold the complexity and additional cost of advanced exhaust after-treatment technologies that reduce emissions of particulate matter and oxides of nitrogen to levels comparable to those of gasoline and FFV engines
sales of diesel passenger vehicles are not allowed in Brazil with the exception of vehicles with some off-road characteristics Despite having a small penetration (around 05) sales of diesel passenger vehicles increased by 16 in 2013 toyota sells the most diesel passenger vehicles followed by Mitsubishi land rover gM and Mercedes-Benz the light-duty diesel market in Brazil is equivalent to the us and china in terms of market penetration and much below the penetration in europe and south Korea although air quality concerns in europe might trigger lower sales of diesel vehicles in coming years
7 Most of the modifications with respect to a gasoline-only vehicle (e00) include changes to fuel systemrsquos materials that are compatible with the oxygen content of ethanol blends and changes to air and fuel ratio management systems (mainly software based)
14
Brazil Passenger Vehicle Market statistics
0
10
20
30
40
50
60
70
80
90
100
Subco
mpac
t
Compac
t
Medium
Larg
eSport
O-Road SUV
Miniva
nTo
tal
Mar
ket
shar
e
Diesel Hybrid Gasoline Flex
Figure 3‑1 ndash Fuel type by segment
0102030405060708090
100
Fiat GM
Volkswag
enFord
Renau
lt
Hyund
ai
Honda
Toyo
taPSA
Nissan
Mitsub
ishi
KIAJA
CBMW
Land
Rove
r
Merce
des-B
enz
Chery
Audi
Suzuk
iJe
epTo
tal
Tech
nolo
gy
shar
e
Diesel Hybrid Gasoline Flex
Figure 3‑2 ndash Fuel type by manufacturer
0
10
20
30
40
50
60
70
80
90
100
China2010
Korea2011
EU-272013
US2013
Japan2011
India2012
Brazil2013
Tech
nolo
gy
shar
e
Diesel Hybrid Gasoline CNGLPGFlex
Figure 3‑3 ndash Fuel type international comparison
15
ICCT white paper
NUMBER OF CYLiNDERSacross all vehicle markets 4-cylinder engines are the most common design in automobile engines with displacements below 25 liters this engine configuration presents the right balance between complexity and performance for the target vehicle segments (small to mid-size sedans suVs and some off-road vehicles) engines with six and more cylinders are designed to provide a smoother vehicle driving experience with lower vibration and noise than 4-cylinder engines can provide and with higher power output this better overall performance comes at a higher cost driving their widespread use in large and luxury vehicles and heavier suVs and off-road vehicles
the need to attain better energy consumption has resulted in a recent wave of 3-cylinder engines from a handful of manufacturers in vehicles that typically used 4-cylinder engines achieving similar or better performance this practice is known as engine downsizing Downsizing can also be applied to larger engines from V-8s to V-6s and from V-6s to i-4s in most cases engine downsizing is accompanied with turbocharging and changes to the fuel delivery system
Four-cylinder engines dominate the passenger vehicle market in Brazil and are sold in more than 90 of new vehicles among all segments except the sports off-road and minivan segments (Figure 3‑4) Despite its predominance sales of 4-cylinder engines fell from over 307 to 293 million units between 2012 and 2013 equivalent to a 4 reduction 4-cylinder vehicles represent the majority of sales among the 20 top manufacturers except for hyundai and jeep (Figure 3‑5) although 4-cylinder engines represent the dominant technology in all countries analyzed Brazil still has the largest market share (Figure 3‑6)
the most significant shift in market preferences in Brazil occurred with 3-cylinder engines this technology is becoming more popular with almost eight times more vehicles sold in 2013 compared to 2012 reaching almost 75000 units in 2013 almost all 3-cylinder engines are being sold as compact vehicles instead of the smaller subcompact segment hyundai is the technology leader in sales of 3-cylinder high-efficiency Kappa engines8 japan and india have relatively high penetration of 3-cylinder engine technology in india the popularity of 2- and 3-cylinder vehicles is primarily driven by lower price tags (lt usD $8000)
six-cylinder engines are third in sales after 4- and 3-cylinder engines with absolute numbers close to 25000 units sold in 2013 its market share reduced by 13 with respect to 2012 six-plus cylinder engines are being sold mostly in the sports off-road and minivan segments Manufacturers that cater to the most expensive models and segments dominate the market of vehicles with six-plus cylinder engines such as land rover BMW and Mercedes-Benz the penetration of 6-plus-cylinder engines in Brazil is very low compared to other countries
Five-cylinder engines are not very common in Brazil or other countries and are losing market with respect to 2012 sales by 56 Volkswagen audi and Volvo are the only manufacturers that offered 5-cylinder engines in Brazil in 2013
8 hyundairsquos 3-cylinder Kappa engine httpworldwidehyundaicomWWshowroomcarshB20PiPindexhtml
16
Brazil Passenger Vehicle Market statistics
0
10
20
30
40
50
60
70
80
90
100
Subco
mpac
t
Compac
t
Medium
Larg
eSport
O-Road SUV
Miniva
nTo
tal
Tech
nolo
gy
shar
e
8+ 6 5 4 3
Figure 3‑4 ndash number of cylinders by segment
0102030405060708090
100
Fiat GM
Volkswag
enFord
Renau
lt
Hyund
ai
Honda
Toyo
taPSA
Nissan
Mitsub
ishi
KIAJA
CBMW
Land
Rove
r
Merce
des-B
enz
Chery
Audi
Suzuk
iJe
epTo
tal
Tech
nolo
gy
shar
e
8+ 6 5 4 3
Figure 3‑5 ndash number of cylinders by manufacturer
0
10
20
30
40
50
60
70
80
90
100
China2010
Korea2011
EU-272013
US2013
Japan2011
India2012
Brazil2013
Tec
hno
log
y sh
are
8+ 6 5 4 3 2
Figure 3‑6 ndash number of cylinders international comparison
17
ICCT white paper
TRaNSMiSSiONtransmission technologies can reduce energy consumption in two ways First by allowing engine operation on a more efficient region of the engine map and second by reducing the mechanical losses within transmissions traditionally manual transmissions have offered better energy consumption than traditional automatic transmissions (with 4 or 5 speeds) due to lower friction losses however new generation of automatic transmissions with higher number of gears lower friction better materials and computer-controlled shift points have not just closed the gap between manual and automatic transmission performance but even exceed manual transmission performance
new technologies such as dual-clutch transmissions (Dcts) and continually variable transmissions (cVts) are gaining market share due to the need for lower vehicle energy consumption Dcts can be defined as manual transmissions with electro-hydraulically operated dual-clutch systems allowing for faster shifting times and selective automatic or ldquomanualrdquo operation as opposed to manual automatic and Dct transmissions which have a discrete number of gear ratios cVts have a theoretically infinite choice of ratios between fixed limits which allows engines to be further optimized for minimizing energy consumption cVt technology has been used in lower-horsepower vehicles because of maximum-torque limitations with the most common metal-belt design (nas 2011) these advanced transmission technologies offer significant benefits in energy consumption compared to traditional manual or automatic technologies according to the us national academy of sciences a 6-speed Dct provides 6 to 9 lower energy consumption than a 4-speed automatic transmission note that a traditional 6-speed automatic transmission provides an estimated 3 to 5 benefit the energy consumption benefit of cVt depends on the application and is estimated to be 1 to 7 (nas 2011)
although vehicle sales with manual transmissions are predominant in Brazil the penetration of automatic transmissions cVts and Dcts is increasing resulting in a market share loss for manual transmissions of about 6 between 2012 and 2013 (Table 3‑1) With the exception of sports and off-road segments manual transmission technology has the largest market share in all segments but it tends to become less predominant as vehicles grow in size and comfort level (Figure 3‑7) the top five manufacturers sell most of their vehicles with manual transmissions but their market share is somewhat smaller for other high-selling manufacturers that cater to a more affluent market (Figures 3‑8)
automatic transmissions are becoming increasingly popular in Brazil experiencing an increase of 28 in sales between 2012 and 2013 automatic transmissions dominate the sports and off-road segments Kia BMW land rover Mercedes-Benz and jeep adopt this type of transmission technology for most of their vehicle sales
Dct transmissions are entering the Brazilian market mostly through the sports segment via imported models the sales of Dct equipped vehicles increased in 2013 by 22 with respect to 2012 Dct technology is being offered mainly by manufacturers that sell sports vehicles such as audi in more than 67 of their vehicles and Mercedes-Benz in more than 15 of their vehicles the global leader in Dct adoption is europe followed by the us (Figure 3‑9)
cVt technology market is still relatively small being sold by small volume manufacturers like jeep audi and Mitsubishi with more than 25 of new vehicle sales each nissan renault honda and toyota also sell vehicles with cVt technology cVt penetration in Brazil is similar to europersquos cVt is the leading transmission technology in japan with more than 65 of the market
18
Brazil Passenger Vehicle Market statistics
0
10
20
30
40
50
60
70
80
90
100
Subco
mpac
t
Compac
t
Medium
Larg
eSport
O-Road SUV
Miniva
nTo
tal
Tech
nolo
gy
shar
e
DCT CVT Automatic Manual
Figure 3‑7 ndash transmission by segment
0
10
20
30
40
50
60
70
80
90
100
Fiat GM
Volkswag
enFord
Renau
lt
Hyund
ai
Honda
Toyo
taPSA
Nissan
Mitsub
ishi
KIAJA
CBMW
Land
Rove
r
Merce
des-B
enz
Chery
Audi
Suzuk
iJe
epTo
tal
Tech
nolo
gy
shar
e
DCT CVT Automatic Manual
Figure 3‑8 ndash transmission by manufacturer
0
10
20
30
40
50
60
70
80
90
100
China2010
Korea2011
EU-272013
US2013
Japan2011
India2012
Brazil2013
Tech
nolo
gy
shar
e
DCT CVT Automatic Manual
Figure 3‑9 ndash transmission international comparison
19
ICCT white paper
NUMBER OF GEaR RaTiOS as mentioned in the previous section increasing the number of gear ratios (whether manual automatic dual-clutch or continuously variable) allows the engine to be operated in the best efficiency region resulting in energy consumption benefits compared to an automatic four-gear ratio transmission (also known as 4-speed transmission) higher ratio automatic transmissions could reduce energy consumption from 2 to 3 (for a five-gear ratio) to 6 to 8 (for an eight-gear ratio) (ePanhtsa 2010)
Four-gear ratio transmissions are losing market share in Brazil by more than 5 between 2012 and 2013 (Table 3‑1) these transmissions are particularly high sellers in the suV and minivan segments which suggest that some models in these more expensive segments are being sold with outdated technologies (Figure 3‑10) Most manufacturers are phasing out this type of transmission (Figure 3‑11) although jeep suzuki and toyota are lagging behind other manufacturers the four-gear ratio transmission technology has been losing market share in most countries even in india where smaller and inexpensive cars dominate the market 4-speed transmissions have the smallest market share (Figure 3‑12)
Five- and six-gear ratio transmissions were predominant in the Brazilian market in 2013 Five-gear ratio transmissions are dominant in all segments except for the off-road and sports segments which have adopted six-gear ratio transmissions in most sales the significant market share of five- and six-gear ratio transmissions is similar to most countries although the us europe and south Korea show higher shares of six and more gear ratios
seven- and eight-gear ratio transmissions which are considered emerging technologies have experienced an increase in sales in Brazil with over twice as many sales in 2013 compared to 2012 seven- and eight-gear ratio transmissions are popular among the large sports and off-road segments all of which are imported models luxury manufacturers such as Mercedes-Benz and audi are selling the most seven-gear vehicles as a share of their sales Volkswagen and toyota are also selling similar numbers of seven-gear ratio vehicles although for Volkswagen and toyota it represented less than 3 of their brand sales BMW and land rover are the leaders in eight-gear ratio vehicles
20
Brazil Passenger Vehicle Market statistics
0
10
20
30
40
50
60
70
80
90
100
Subco
mpac
t
Compac
t
Medium
Larg
eSport
O-Road
SUV
Miniva
nTo
tal
Tech
nolo
gy
shar
e
8 7 6 5 4
Figure 3‑10 ndash number of gear ratios by segment
0
10
20
30
40
50
60
70
80
90
100
Fiat GM
Volkswag
enFord
Renau
lt
Hyund
ai
Honda
Toyo
taPSA
Nissan
Mitsub
ishi
KIAJA
CBMW
Land
Rove
r
Merce
des-B
enz
Chery
Audi
Suzuk
iJe
epTo
tal
Tech
nolo
gy
shar
e
8 7 6 5 4
Figure 3‑11 ndash number of gear ratios by manufacturer
0
10
20
30
40
50
60
70
80
90
100
Tech
nolo
gy
shar
e
Six or more Five Four or fewer
China2010
Korea2011
EU-272013
US2013
India2012
Brazil2013
Figure 3‑12 ndash number of gear ratios international comparison
21
ICCT white paper
DRiVETRaiNDrivetrain technology includes front-wheel drive (FWD) rear-wheel drive (rWD) and all-wheel drive (aWD) vehicles For the same vehicle size FWD vehicles provide more interior space and better energy consumption than rWDs due to lower weight as it avoids the added weight of and space for the driveshaft and differential that rWD requires Because the weight of the engine and transmission is located close to the wheels FWD vehicles have better traction than rWDs rWDs however show better handling as the weight distribution between the front and rear wheels is more uniform and the tasks of turning and acceleration are split between the front and rear wheels also directing large amounts of power through the front wheels can create ldquotorque steerrdquo thus rWD is the adequate technology for the sports segment aWD drivetrains are intended for specific driving applications that imply loss of traction such as off-road terrains snow or towing
FWD vehicles dominate all segments of the Brazilian passenger car market (Table 3‑1) with the exception of the off-road segment (Figure 3‑13) among the 20 largest manufacturer sellers most except for BMW land rover Mercedes-Benz and suzuki offer FWD technology (Figure 3‑14) Brazil has the highest market share of FWD vehicles of all countries analyzed (944) although FWD has at least 50 market share in all seven countries (Figure 3‑15)
aWD market share increased by 15 between 2012 and 2013 due to a tri-fold increase in the sports segment sales off-road vehicle sales with aWD also increased to more than 76000 units in 2013 amongst the largest ten manufacturers toyota is the aWD market leader followed by Ford and Volkswagen note that land rover sells only aWD vehicles in Brazil among non-luxury manufacturers Mitsubishi and suzuki are selling more than 50 of their vehicles with aWD technology
rWD technology is offered mostly in large and sports vehicles and in suVs among the 10 largest manufacturers rWD is offered mainly by gM and toyota while an extended examination of the 20 largest manufacturers by sales show that aWD and rWD is focused among the more expensive brands (Figure 3‑14) Mercedes-Benz and BMW sell close to 90 of their vehicles with rWD technology traditionally associated with engine performance and responsiveness
22
Brazil Passenger Vehicle Market statistics
0
10
20
30
40
50
60
70
80
90
100
Subco
mpac
t
Compac
t
Medium
Larg
eSport
O-Road SUV
Miniva
nTo
tal
Tehn
olo
gy
shar
e
AWD RWD FWD
Figure 3‑13 ndash Drivetrain by segment
0
10
20
30
40
50
60
70
80
90
100
Fiat GM
Volkswag
enFord
Renau
lt
Hyund
ai
Honda
Toyo
taPSA
Nissan
Mitsub
ishi
KIAJA
CBMW
Land
Rove
r
Merce
des-B
enz
Chery
Audi
Suzuk
iJe
epTo
tal
Tech
nolo
gy
shar
e
AWD RWD FWD
Figure 3‑14 ndash Drivetrain by manufacturer
0
10
20
30
40
50
60
70
80
90
100
China2010
Korea2011
EU-272013
US2013
Japan2011
India2012
Brazil2013
Tech
nolo
gy
shar
e
AWD RWD FWD
Figure 3‑15 ndash Drivetrain international comparison
23
ICCT white paper
VaLVE CaMShaFT CONFiGURaTiON (DOhC VS SOhC)the engine camshaft governs the timing duration and lift of valve operation controlling the intake of air and the exhaust of combustion gases this report focuses on single overhead camshafts (sohc) and dual overhead camshafts (Dohc) as these configurations have almost completely replaced the older overhead valve configuration (ohV) sohc design places a single camshaft above the cylinder head that governs all the valves intake and exhaust in the case of sohc V-engines there is one single camshaft per head Dohc designs use separate camshafts for intake valves and exhaust valves Dohc engines achieve increased airflow at high-engine speeds improve volumetric efficiency and reduce the valvetrainrsquos moving mass such engines typically develop higher power at high-engine speeds the us environmental Protection agency (ePa) and national highway traffic safety administration (nhtsa) estimate the effectiveness of Dohc over sohc to be between 1 and 25 (ePanhtsa 2010)
although Dohc produce more power and provide lower fuel consumption the Brazilian fleet is still mostly composed of sohcs vehicles (Table 3‑1) sohc technology is predominant among the subcompact compact and medium segments (Figure 3‑16) among manufacturers sohc technology is predominant among the five largest least expensive brands (Figure 3‑17) sales of vehicles with more advanced Dohc technology grew in 2013 by almost 36 with respect to 2012 albeit from a relatively smaller base this increase was experienced in all vehicle segments but in different magnitudes
although global data on this technology are scarce Figure 3‑18 indicates that most countries are moving away from sohc with Brazil being the only country analyzed where sohc is still predominant no data were available for the us or europe
24
Brazil Passenger Vehicle Market statistics
0
10
20
30
40
50
60
70
80
90
100
Subco
mpac
t
Compac
t
Medium
Larg
eSport
O-Road SUV
Miniva
nTo
tal
Tech
nolo
gy
shar
e
nd DOHC SOHC
Figure 3‑16 ndash Valve camshaft configuration by segment (nd no data)
0
10
20
30
40
50
60
70
80
90
100
Fiat GM
Volkswag
enFord
Renau
lt
Hyund
ai
Honda
Toyo
taPSA
Nissan
Mitsub
ishi
KIAJA
CBMW
Land
Rove
r
Merce
des-B
enz
Chery
Audi
Suzuk
iJe
epTo
tal
Tech
nolo
gy
shar
e
nd DOHC SOHC
Figure 3‑17 ndash Valve camshaft configuration by manufacturer (nd no data)
0
10
20
30
40
50
60
70
80
90
100
China2010
Korea2011
Japan2011
India2012
Brazil2013
Tech
nolo
gy
shar
e
nd OVC DOHC SOHC
Figure 3‑18 ndash Valve camshaft configuration international comparison (nd no data)
25
ICCT white paper
VaLVE aCTUaTiON improved valvetrain systems with variable valve actuation (VVa) technology either variable valve timing (VVt) or variable valve timing and lift (VVt+VVl) improves the enginersquos volumetric and thermodynamic efficiency they also enable further engine improvements such as internal exhaust gas recirculation and cylinder deactivation VVt alters the timing of the intake valve exhaust valve or both primarily to reduce pumping losses increase specific power and control residual exhaust gases VVl increases efficiency by optimizing airflow over a broader range of engine operation which reduces pumping losses and increases specific power VVl is accomplished by controlled switching between two or more cam profile lobe heights the most advanced technology VVt+VVl yields a wide range of performance optimization and volumetric efficiency including enabling the engine to be valve-throttled (no need for intake throttle) VVt provides energy consumption gains of 3 to 5 while the more flexible and complex VVt+VVl system can reach 4 to 8 (ePa amp nhtsa 2010)
VVa technology either VVt or VVt+VVl are emerging technologies in Brazil where most vehicles still have fixed-valve timing designs (Table 3‑1) Fixed technology is predominant among the smaller vehicle segments as well as suVs and minivans (Figure 3‑19) the five largest manufacturers sold more than 90 of their vehicles with fixed-valve technology in 2013 (Figure 3‑20) the international comparison indicates that only Brazil and india have not yet adopted VVa technologies for most of their light-duty fleet (Figure 3‑21)
VVt and VVt+VVl are being adopted across all segments including the subcompact segment but tend to be more predominant in high-end manufacturers a closer examination by manufacturer shows that most are offering some vehicles with either one of the VVa systems while honda and hyundai offer this technology in almost all vehicles (Figure 3‑20) honda is the technology leader in variable valve actuation with the adoption in the early 1990s of the Vtec system (Valve timing electronic control) VVt technologyrsquos market share grew by about 25 in 2013 primarily due to hyundairsquos sales from 80000 units in 2012 to almost 200000 units in 2013 hyundai offered the continuously variable valve technology (cVVt) in the large majority of vehicle sold in 2013 the sports segment is the one where VVt dominates the market Mitsubishi BMW and audi are also selling a large share of their vehicles with the VVt+VVl technology
26
Brazil Passenger Vehicle Market statistics
0
10
20
30
40
50
60
70
80
90
100
Subco
mpac
t
Compac
t
Medium
Larg
eSport
O-Road SUV
Miniva
nTo
tal
Tech
nolo
gy
shar
e
VVT+VVL VVT Fixed
Figure 3‑19 ndash Valve actuation by segment
0
10
20
30
40
50
60
70
80
90
100
Fiat GM
Volkswag
enFord
Renau
lt
Hyund
ai
Honda
Toyo
taPSA
Nissan
Mitsub
ishi
KIAJA
CBMW
Land
Rove
r
Merce
des-B
enz
Chery
Audi
Suzuk
iJe
epTo
tal
Tech
nolo
gy
shar
e
VVT+VVL VVT Fixed
Figure 3‑20 ndash Valve actuation by manufacturer
VVT+VVL VVT Fixed
0
10
20
30
40
50
60
70
80
90
100
China2010
Korea2011
US2013
Japan2011
India2012
Brazil2013
Tech
nolo
gy
shar
e
Figure 3‑21 ndash Valve actuation international comparison
27
ICCT white paper
FUEL SYSTEMS FOR GaSOLiNE VEhiCLESVehicle fuel systems describe the technology required to deliver fuel into the engine combustion chamber this section examines two gasolineflex technologies namely multi-point fuel injection (MPFi) and gasoline direct injection (gDi) MPFi is now the most common fuel-delivery system for gasoline engines used in passenger vehicles worldwide in sequential MPFi engines fuel is injected into the air stream next to the intake valve port while the intake valve is open to draw the air-fuel mixture into the cylinder some of the fuel is vaporized on the surface of the hot intake valve expanding and thus reduces the volumetric efficiency on gDi engines fuel is injected at high pressure directly into the combustion chamber improving volumetric efficiency and providing cooling of the airfuel charge within the cylinder which allows for higher compression ratios and increased thermodynamic efficiency gDi technology alone offers benefits of 2 to 5 with respect to MPFi engines but bigger benefits rely on the synergy between gDi turbocharging and downsizing which can reach 12 to 15 energy consumption reduction with respect to a MPFi naturally aspirated engine (ePa 2012)
Table 3‑1 illustrates that MPFi is still the most common fuel injection technology for gasolineflex vehicles in Brazil which is reflected in its dominant share across most segments except for sports and off-road vehicles in Brazil gDi has found a niche market in the sports and off-road segments with more than 90 of sport vehicles fitted with gDi technology (Figure 3‑22) Within the overall gasoline market the gDi technology is still an emerging technology representing just 24 of new sales gDirsquos market share increased by 31 in 2013 with all but 4000 units being imported among the 10 largest manufacturers the adoption of gDi is extremely low below 5 for Volkswagen Ford hyundai and Psa (Figure 3‑23) high-end european brands (audi land rover Mercedes-Benz and BMW) are the technology leaders in terms of gDi adoption rates echoing the trend of turbocharging technology sales Volkswagen vehicles with gDi systems account for less than 35 of their sales in 2013 but their absolute numbers (around 19000 vehicles) place the company as one of the leaders in gDi technology in the Brazilian market
From a global market perspective the penetration of gDi technology in Brazil is low compared to all other markets in Figure 3‑24 except for india and japan it should be noted that the later has the largest share of hybrid vehicles around the globe
28
Brazil Passenger Vehicle Market statistics
0
10
20
30
40
50
60
70
80
90
100
Compac
t
Subco
mpac
t
Medium
Larg
eSport
O-Road SUV
Miniva
nTo
tal
Tech
nolo
gy
shar
e
GDI MPFI
Figure 3‑22 ndash gasolineflex fuel system by segment
GDI MPFI
0102030405060708090
100
Fiat GM
Volkswag
enFord
Renau
lt
Hyund
ai
Honda
Toyo
taPSA
Nissan
Mitsub
ishi
KIAJA
CBMW
Land
Rove
r
Merce
des-B
enz
Chery
Audi
Suzuk
iJe
epTo
tal
Tech
nolo
gy
shar
e
Figure 3‑23 ndash gasolineflex fuel system by manufacturer
GDI MPFI
0
10
20
30
40
50
60
70
80
90
100
China2010
Korea2011
EU-272013
US2013
Japan2011
India2012
Brazil2013
Tech
nolo
gy
shar
e (n
on-
die
sel)
Figure 3‑24 ndash gasolineflex fuel system international comparison
29
ICCT white paper
TURBOChaRGiNGengine power is primarily limited by the rate at which the engine is able to draw air into the combustion chamber turbocharging and supercharging are two methods to increase the amount of air drawn into the engine above the level of what is possible with the naturally aspirated process (through the expansion of the cylinders) By increasing the amount of air into the engine the amount of fuel can be proportionally increased resulting in increased power output level and with it the ability to reduce engine displacement while maintaining performance the combination of turbocharging and downsizing in spark ignited (gasoline and flex-fuel) vehicles can provide energy consumption improvements between 2 to 6 with respect to a direct-injected gDi engine (ePa amp nhtsa 2010) turbocharging technology is the cornerstone for achieving better energy consumption in vehicles as the basis for downsizing and reducing the engine weight while keeping the same or better vehicle performance (ie acceleration or time to reach certain speed) although turbochargers are used in diesel and gasolineflex vehicles the analysis in this report focuses on turbocharging for spark-ignited gasolineflex vehicles only
turbocharging is one of the most important emerging technologies in Brazil where most vehicles are still naturally aspirated (na) (Table 3‑1) turbocharging technology has increased the market share significantly between 2012 and 2013 by more than 65 albeit from a small base (from about 49000 to 81000 vehicles)
Most vehicles with turbocharging are sold in the sports and off-road segments as this technology also produces superior engine power output (Figure 3‑25) among the 10 largest manufacturers turbocharging is still below 10 of their sales (Figure 3‑26) Volkswagen and Ford despite having small relative sales of vehicles with turbocharging (less than 35) are the manufacturers with the highest total sales of vehicles with turbocharging audi land rover Mercedes-Benz and BMW are the technology leaders with more than 90 of vehicle sales in 2013
the penetration of turbo and supercharging technologies in Brazil is lower than in other countries with a larger gasoline fleet such as the us china and japan (Figure 3‑27) in Brazil 95 of diesel passenger vehicle sales have turbocharging technology
30
Brazil Passenger Vehicle Market statistics
0
10
20
30
40
50
60
70
80
90
100
Compac
t
Subco
mpac
t
Medium
Larg
eSport
O-Road SUV
Miniva
nTo
tal
Tech
nolo
gy
shar
e (n
on-
Die
sel)
Turbo NA
Figure 3‑25 ndash turbocharging for gasolineflex fuel vehicles by segment (NA naturally aspirated)
0102030405060708090
100
Fiat GM
Volkswag
enFord
Renau
lt
Hyund
ai
Honda
Toyo
taPSA
Nissan
Mitsub
ishiKIA
JACBMW
Land
Rove
r
Merce
des-B
enz
Chery
Audi
Suzuk
iJe
epTo
tal
Tech
nolo
gy
shar
e (n
on-
Die
sel)
Turbo NA
Figure 3‑26 ndash turbocharging for gasolineflex fuel vehicles by manufacturer (NA naturally aspirated)
0
10
20
30
40
50
60
70
80
90
100
China2010
Korea2011
EU-272013
US2013
Japan2011
India2012
Brazil2013
Tech
nolo
gy
shar
e (n
on-
die
sel)
Turbo NA
Figure 3‑27 ndash turbocharging for gasolineflex fuel vehicles international comparison (NA naturally aspirated)
31
ICCT white paper
4 vEhiCLE ENErGy CONSuMpTiON
this section analyzes the Brazilian new passenger vehicle energy consumption in 2013 although other metrics are more common (see box) vehicle energy consumption is presented in megajoules per kilometer (Mjkm) for consistency with Brazilrsquos inovar-auto policy in 2012 Brazilrsquos Ministry of Development industry and Foreign trade (MDic) adopted the inovar-auto policy with the aim of fostering industrial competitiveness through technology investments the policy includes a target for corporate average energy consumption (in Mjkm with vehicle curb weight as the attribute parameter) for vehicles sold in 2017
in the us canada Mexico and saudi arabia fleet-average fuel economy standards are defined as a function of vehicle footprint in the eu china japan south Korea and india vehicle weight is the attribute for the calculation of fleet-average targets in Brazil inovar-auto has defined its fiscal targets for vehicle energy consumption measured in megajoules per kilometer (Mjkm) as a function of vehicle weight
VEhiCLE ENERGY MEaSUREMENT UNiTS
Many metrics can be used to describe the amount of fuel energy or emissions generated by unit of distance traveled
Fuel economy measures distance traveled per unit of fuel consumed in Brazil kilometers per liter (kml) is the most common metric to describe vehicle efficiency but other units are used in different countries such as miles per gallon (mpg) in the us
Fuel consumption is the reciprocal of fuel economy and measures fuel consumed per distance traveled it is usually expressed in liters per 100 kilometers (l100 km) and it is used in europe for example
GhGCO2 emissions measures ghg or co2 emissions per distance traveled expressed as grams of pollutant per kilometer or mile
Energy consumption (EC) measures the energy consumed per distance traveled for example in megajoules per kilometer Despite being a less common metric it is sometimes preferred for being a fuel-neutral metric across different types of fuel and vehicle technologies Vehicle energy consumption in Mjkm is the metric used in Brazilrsquos inovar-auto policy to quantify the corporate average energy consumption target for each manufacturer Values for energy consumption in Brazilian spark-ignited vehicles are provided for e22 since that is the fuel mixture used in vehicle tests
Vehicle energy consumption in this report is calculated from co2 emissions data in the Brazilian institute of environment and renewable natural resources (iBaMa) nota Verde program (iBaMa 2014) which reports official emissions data from homologation tests Data are limited to passenger cars sold by the top 10 manufacturers with light commercial vehicles being excluded appendix D presents a description of data sources
32
Brazil Passenger Vehicle Market statistics
and calculation methodologies as well as a discussion of vehicle energy consumption data quality and completeness in Brazil
not surprisingly vehicle energy consumption increases with vehicle footprint and engine rated power the two parameters that define vehicle segments in Brazil (Figure 4‑1) subcompact and compact vehicles which accounted for about 45 of new sales in 2013 have average energy consumption below the fleet average while medium-sized vehicles which hold the largest market share (388) have energy consumption just above the fleet average larger more powerful vehicles consume more energy than the fleet average but have a considerably smaller market share (combined share of 163) Data availability for these segments is not as extensive as the data available for the subcompact compact and medium segments which could affect the relative rankings of each segment
Ene
rgy
cons
ump
tio
n (M
Jkm
)
Subco
mpac
t
Compac
t
Medium
Larg
e
O-road SUV
4000
200000
400000
600000
850000
35
30
25
20
15
10
05
0
Sales
Total 202
Figure 4‑1 ndash new vehicle sales-weighted average energy consumption by segment (2013)
33
ICCT white paper
Figures 4‑2 and 4‑3 illustrate new vehicle energy consumption for multiple weight and footprint bins For each weight bin (in 100 kg increments) and footprint bin (in 01 m2 increments) sales-weighted averages of energy consumption for each vehicle version are presented (dashes) generating energy consumption ranges for each bin (cream areas) Vehicle sales by bin are presented for reference in the lower charts
the strong correlation between vehicle energy consumption and weight follows from the strong physical relationship between the weight of the vehicle and the energy required to accelerate it and overcome resistances9 (Figure 4‑2) Data dispersion within each bin suggests that energy consumption varies due to other vehicle characteristics that affect vehicle aerodynamics and rolling resistance as well as the adoption of technologies that affect engine and transmission efficiency (eg friction reduction technologies gDi VVt)
Curb weight (kg)
SubcompactCompactMediumLargeO-roadSUV
Ene
rgy
cons
ump
tio
n (M
Jkm
)Sa
les
5
6
4
3
2
1
600k
800k
400k
200k
0k800 900 1000 1100 1200 1300 1400 1500 1600 1700 1800 1900 2000 2100
Figure 4‑2 ndash new vehicle energy consumption by vehicle weight (2013)
9 on a plain surface the sum of resistances of a vehicle is acceleration resistance + rolling resistance + aerodynamic resistance = c1 m a + c2 frr m + c3 cw a v2 with mass (m) as an integral part of both acceleration and rolling resistance which are most relevant for inner-city driving situations other factors are acceleration (a) rolling resistance of tires (frr) aerodynamic coefficient of the vehicle (cw) frontal area of vehicle (a) velocity (v) and constants (cx)
34
Brazil Passenger Vehicle Market statistics
Footprint has a reasonable correlation with energy consumption (Figure 4‑3) ie larger vehicles tend to consume more fuel than smaller vehicles however the correlation is not as strong as with vehicle weight similar to the previous figure the broad spread of energy consumption values suggests a combination of different vehicle characteristics (eg weight engine displacement rated power) and technologies (eg transmissions fuel systems) as well as the presence of suVs and off-road vehicles among the medium- and large-sized footprint values respectively
Footprint (m2)
SubcompactCompactMediumLargeO-roadSUV
Ene
rgy
cons
ump
tio
n (M
Jkm
)Sa
les
5
6
4
3
2
1
400k
500k
300k
200k
100k
0k31 32 33 34 35 36 37 38 39 40 41 42 43 44 45 46 48 49
Figure 4‑3 ndash new vehicle energy consumption by vehicle footprint (2013)
35
ICCT white paper
Figure 4‑4 illustrates sales weighted average for new vehicle energy consumption by mass for the top 10 manufacturers in Brazil in 2013 Bubble sizes are proportional to total vehicle sales Manufacturers in the lower-left quadrant produce the lightest and most efficient vehicles with hyundai presenting the best overall average energy consumption renault in the upper-left quadrant produces vehicles that are equivalent in weight but on average with higher energy consumption in the lower-right quadrant are manufacturers that produce relatively heavier vehicles but with lower energy consumption in their weight class Despite producing heavier vehicles on average than many manufacturers honda achieves lower energy consumption on average in the upper-right quadrant are manufacturers that produce on average the heavier and least efficient vehicles with Psa (citroen and Peugeot) producing the heaviest and least efficient cars on average a regression line correlating vehicle energy consumption and mass highlights the best performers (hyundai honda and nissan) average performers (Fiat Volkswagen gM and toyota) and those performing worse than average (renault Ford and Psa)
FIA
GMVW
FORREN
HYU
HON
TOY
PSA
NIS
160
170
180
190
200
210
220
230
240
250
950 1000 1050 1100 1150 1200 1250 1300 1350
Ene
rgy
cons
ump
tio
n (M
Jkm
)
Curb weight (kg)
Fleet Ave
Figure 4‑4 ndashaverage new vehicle sales-weighted energy consumption by manufacturer (2013)
36
Brazil Passenger Vehicle Market statistics
Figure 4‑5 shows fleet-average energy consumption based on certification and type approval data for new vehicles in multiple countries converted to the us caFe combined driving cycle Bubble sizes represent total sales of new passenger cars Because of data availability in different countries the country comparison is based on different calendars years for different countries 2011 for south Korea and japan 2012 for china and india and 2013 for europe the us and Brazil given annual improvements in vehicle energy consumption triggered by regulatory efficiency standards and fiscal incentives those countries with older data could be at a slight disadvantage in this comparison
With the heaviest vehicles on average the us fleet is also the most energy consuming of all countries china and south Korea have similar average energy consumption but since south Korean vehicles are heavier on average they are relatively more efficient than chinese vehicles although Brazilrsquos fleet consumes less fuel on average than those from the us china and south Korea its fleet is relatively inefficient when compared to countries with vehicles of similar weight (japan and india) the average Brazilian vehicle consumes about 34 more energy than the average vehicle in japan whose fleet has a large penetration of gasoline hybrid and advanced fuel-efficiency technologies such as three-cylinder engines VVa Dohc and 6-plus speed transmissions european vehicles are the best performing on average despite being heavier than all countries with the exception of the us and south Korea the adoption of fuel-efficiency technologies (eg Dct 6-plus-speed transmissions gDi turbocharging) contributes to europersquos better than average performance
China2012
SKorea2011
Europe2013
US2013
Japan2011
India2012
Brazil2013
Sales5 MM10 MM
14
16
18
20
22
24
26
28
1000 1100 1200 1300 1400 1500 1600 1700
Ene
rgy
cons
ump
tio
n ndash
CA
FE
(M
Jkm
)
Curb weight (kg)
Type-approval and certification energy consumption data only (does not include o-cycle or real-world driving data)
Figure 4‑5 ndash international comparison of passenger car energy consumption
Country labels indicate the dataset year
Figure 4‑6 provides a more detailed country comparison by illustrating average vehicle energy consumption by vehicle (curb) weight bin Vehicle sales in each bin are shown for reference the us is not shown due to lack of detailed model-by-model data Brazilrsquos vehicles on average have the highest energy consumption in most weight
37
ICCT white paper
bins with china being the second highest in most bins Because china has higher fuel consumption than Brazil on the 1000 bin which represents the highest share of vehicle sales fleet-average energy consumption in china is still higher than in Brazil as illustrated in the previous figure europe consistently performs best in terms of vehicle energy consumption in most weight bins with japan also performing relatively well
Curb weight (kg)
BrazilChinaEuropeIndiaJapanSouth Korea
Ene
rgy
cons
ump
tio
n C
AF
E (
MJ
km)
Sale
s
40
35
25
20
15
10
6M
8M
4M
2M
0M600 800 1000 1200 1400 1600 1800 2000 2200 2400
Figure 4‑6 ndash international comparison of average vehicle energy consumption by vehicle weight
Type-approval and certification energy consumption data only (does not include off-cycle or real-world driving data)
38
Brazil Passenger Vehicle Market statistics
Figure 4‑7 illustrates the distribution of energy consumption data in Brazil for each vehicle version by mass and segment Bubble sizes represent total sales of each version Data were limited to flex-fuel vehicles in the subcompact compact medium and large segments due to its relatively better data quality and representativeness (ie they represented over 87 of sales in 2013) While most vehicles follow a predictable trend that correlates energy consumption and vehicle mass there are a large number of versions with energy consumption substantially higher than the trend line this suggests there is substantial room for improvements in their energy consumption since there are vehicles in similar weight classes with substantially superior energy consumption performance
Sales1000050000
140
160
180
200
220
240
260
280
700 800 900 1000 1100 1200 1300 1400 1500 1600
Ene
rgy
cons
ump
tio
n (M
Jkm
)
Curb weight (kg)
Subcompact Compact Medium Large Fleet average
Figure 4‑7 ndash Distribution of new Brazilian passenger vehicle energy consumption data by vehicle weight and segment (2013)
this chapter suggests that there are potential improvements in vehicle energy consumption for the Brazilian fleet For similar vehicles in terms of weight class footprint or engine rating there is substantial dispersion in energy consumption indicating that there are vehicles performing much worse than the average across manufacturers there is also a clear trend of some manufacturers performing much better than the average while others have a lot more room for improvement the international comparison clearly shows that Brazilian vehicles perform much worse in terms of energy consumption than vehicles of similar weight suggesting a delay in the adoption of energy efficient technologies among Brazilian vehicle manufacturers
Finally a more detailed analysis of vehicle versions clearly illustrates a considerable number of vehicle versions significantly above average thus indicating potential improvements in energy consumption that would place them on par with better performing vehicles with similar characteristics
39
ICCT white paper
Deficiencies in data quality and completeness prevent more definite conclusions about vehicle energy consumption gasoline-only vehicles in particular have poor energy consumption data quality although they represent a relatively small fraction (6) of total vehicles sold in 2013 Because some vehicle segments are primarily composed of gasoline-only vehicles (eg sports minivans) this chapter excludes these segments from the analysis there are also concerns about the gap between energy consumption data reported by iBaMarsquos nota Verde and Brazilrsquos national institute of Metrology standardization and industrial Qualityrsquos (inMetro) labeling program (PBeV using its acronym in Portuguese) with the latter reporting consistently lower values of vehicle energy consumption
Finally the availability of energy consumption data was not adequate for many manufacturers beyond the top 10 sales group which prevented their inclusion in this analysis Despite the data quality and lack of completeness the energy consumption data in this chapter include data that are reasonably accurate and representative thus supporting its interpretation
40
Brazil Passenger Vehicle Market statistics
rEfErENCES
aDK automotive consultoria de Marketing (2013) relatoacuterios de volumes de vendas do mercado brasileiro para veiacuteculos de passeio e comerciais leves referentes a 2013
alves l Wilbert M (2014) reduccedilatildeo do imposto sobre Produto industrializado e a Venda de automoacuteveis Xi congresso usP iniciaccedilatildeo cientiacutefica em contabilidade
associaccedilatildeo nacional de transportes Puacuteblicos (antP 2014) estudo mostra baixo efeito do desconto no iPi de veiacuteculos sobre PiB e emprego available at httpwwwantporgbrwebsitenoticiasshowaspnpgcode=a4DeeFe8-a7BF-48D3-B1F5-8eDe1447BF10
associaccedilatildeo nacional dos Fabricantes de Veiacuteculos automotores (anFaVea 2015) anuaacuterio da induacutestria automobiliacutestica Brasileira 2015 Brazilian automotive industry Yearbook 2015 satildeo Paulo available at wwwanfaveacombr
european environment agency (2014) Monitoring co2 emissions from new passenger cars in the eu summary of data for 2013 april 2014
instituto Brasileiro do Meio ambiente e dos recursos naturais renovaacuteveis (iBaMa 2014) consulta dos niacuteveis de emissatildeo dos veiacuteculos novos brasileiros available at httpsservicosibamagovbrctfpublicosel_marca_modelo_rvepphp
international council on clean transportation (icct 2015) global passenger vehicle standards available at httpwwwtheicctorginfo-toolsglobal-passenger-vehicle-standards
international energy agency (iea 2015) renewables Bioenergy available at httpswwwieaorgtopicsrenewablessubtopicsbioenergy
Korea energy Management corporation (KeMco 2014) Fuel economy regulation available at httpwwwkemcoorkrnew_engmainmainasp
Marklines (2015) Marklines automotive industry Portal available at httpwwwmarklinescomen
Mendonccedila M sachsida a (2014) Modelando a demanda de creacutedito para veiacuteculos no Brasil uma abordagem com mudanccedila de regime iPea
Ministeacuterio do Desenvolvimento induacutestria e comeacutercio exterior (MDic 2013) Programa de incentivo agrave inovaccedilatildeo tecnoloacutegica e adensamento da cadeia Produtiva de Veiacuteculos automotores mdash inovar-auto httpwwwplanaltogov brccivil_03_ato2011-20142012DecretoD7819htm
stein r anderson j and Wallington t (2013) an overview of the effects of ethanol-gasoline Blends on si engine Performance Fuel efficiency and emissions SAE Int J Engines 6(1)470-487 2013 doi1042712013-01-1635
us environmental Protection agency and national highway traffic safety administration (ePanhtsa 2010) Final rulemaking to establish light-Duty Vehicle greenhouse gas emission standards and corporate average Fuel economy standards ePa-420-r-10-901
us environmental Protection agency (ePa 2012) regulatory impact analysis Final rulemaking for 2017-2025 light-Duty Vehicle greenhouse gas emission standards and corporate average Fuel economy standards ePa-420-r-12-016
41
ICCT white paper
us national academy of sciences (nas 2011) assessment of Fuel economy technologies for light-Duty Vehicles available at httpwwwnapeducatalog12924assessment-of-fuel-economy-technologies-for-light-duty-vehicles
World Bank group (2015) World Development indicators available at httpdataworldbankorgdata-catalogworld-development-indicators
42
Brazil Passenger Vehicle Market statistics
LiST Of ACrONyMS
4wD Four-wheel drive
aNFaVEa Brazilian association of automobile Manufacturers
awD all-wheel drive
BRiC Brazil russia india china
CaFE corporate average fuel economy
CBG compressed biogas
CO2 carbon dioxide
CVT continuously variable transmission
CVVT continuously variable valve technology
DCT Dual-clutch transmission
DOhC Dual overhead camshaft
EC energy consumption
Epa us environmental Protection agency
EU european union
FFV Flex-fuel vehicle
FTp Federal test procedure
FwD Front-wheel drive
GDi gasoline direct injection
GDp gross domestic product
GhG greenhouse gas
GM general Motors
iBaMa Brazilian institute of the environment and renewable natural resources
iC internal combustion
iCCT international council on clean transportation
iNMETRO national institute of Metrology standardization and industrial Quality
Kg Kilogram
Km Kilometer
Kw Kilowatt
LDV light-duty vehicle
LpG liquified petroleum gas
MDiC Ministry of Development industry and Foreign trade
MJ Megajoule
MpFi Multi-point fuel injection
Mpg Miles per gallon
NaS us national academy of sciences
43
ICCT white paper
NhTSa us national highway transportation safety administration
OhV overhead valve
pBEV Brazilian Vehicle labeling Program
pSa Psa Peugeot citroeumln
pTwR Power-to-weight ratio
pV Passenger vehicle
RwD rear-wheel drive
SOhC single overhead camshaft
SUV sport utility vehicle
US united states
USD us dollar
VTEC Valve timing electronic control
VVa Variable valve actuation
VVL Variable valve lift
44
Brazil Passenger Vehicle Market statistics
AppENDix A SEGMENT DEfiNiTiONS
Table a‑1 ndash segment definitions
Segmentpower (kw)
pTwR (kwkg) area (m2)
Other characteristics Examples
Subcompact lt 140 lt 0075 le 65 mdash Mini cooper chevrolet celta smart Fortwo
Compact lt 140 lt 0075 65 lt area le 70 mdash honda Fit hyundai hB20 Volkswagen Polo
Medium lt 140 lt 0075 70 lt area le 80 mdash honda civic nissan tiida Peugeot 308
Large lt 140 lt 0075 gt 80 mdash audi a4 BMW 3 series Mercedes c-class
Sports gt 140 gt 0075 mdash 4 seats maxjaguar XF lamborghini gallardo Ferrari california
Off‑road mdash mdash lt 80 traction = 4WDjeep cherokee honda cr-V BMW X3 hyundai santa Fe
SUV mdash mdash lt 80Based on aDKrsquos default classification
BMW X1 Ford ecosport hyundai tucson
Minivan mdash mdash Passengers 6-12
citroen grand Picasso Kia carnival
45
ICCT white paper
AppENDix b iNTErNATiONAL MArKET DATA
Table B‑1 ndash international market comparison of new fleet characteristics
parameters China S Korea EU US Japan india Brazil
Year 2012 2011 2013 2013 2011 2012 2013
Sales (million) 155 13 118 156 352 256 304
price (USD) $21008 $21383 $24439 mdash $20637 $11717 $22015
No of cylinders mdash 43 40 47 38 36 40
Displacement (cc) 1605 1960 1613 2606 1425 1294 1430
Curb weight (kg) 1296 1421 1391 1623 1193 1059 1106
Length (mm) 4323 4531 4263 mdash 4013 3859 4100
Footprint (m2) 38 420 40 425 371 341 367
Engine power (kw) 86 120 89 148 78 55 76
pTwR (kwkg) 00664 00844 00640 00912 00654 00519 00671
Energy consumption ndash US CaFE (MJKm)[1] 235 206 169 250 171 183 202
[1] energy consumption data presented here for countries other than Brazil were obtained from local official sources in its original metric and drive cycle and then converted to Mjkm under the us caFe drive cycle using the methodology described in Yang (2015) Mode details and historical fuel consumption data on their original metrics is presented in the icctrsquos global PV standard website httpwwwtheicctorginfo-toolsglobal-passenger-vehicle-standards
Data Sources
China Ministry of industry and information technology (Miit 2014) corporate average Fuel efficiency accounting Method for Passenger cars available at httpwwwgovcngzdt2013-0320content_2358627htm
Baseline performance china automotive research and technology center through internal communication and icct internal 2010 database for chinese light-duty vehicles
S Korea internal communication with s Korean official and from greencarcongress available at httpwwwgreencarcongresscom200906korea-20090604html
EU european environment agency (2014) Monitoring co2 emissions from new passenger cars in the eu summary of data for 2013 april 2014
US us ePa (2014) light-duty automotive technology carbon dioxide emissions and fuel economy trends1975 through 2014 table 91 page 110 available at http httpwwwepagovfueleconomyfetrends1975-2014420r14023apdf
Japan jaMa (2010) the Motor industry of japan available at httpwwwjama-englishjppublicationsMVs2010pdf Mlit httpwwwmlitgojpcommon000990330pdf
india Bureau of energy efficiency white paper 2010-2012 calculation based on icct database
Brazil icct Brazil Vehicle Database (2013)
46
Brazil Passenger Vehicle Market statistics
Table B‑2 ndash international market comparison of technology adoption in new vehicles
Technology adoption China S Korea EU US Japan india Brazil
Year 2010 2011 2013 2013 2011 2012 2013
Fuel type
CBGLpGFlex 0 11 2 0 0 4 94
Gasoline 99 65 44 93 86 56 6
hybrid 0 1 1 5 13 0 0
Diesel 1 23 53 1 0 40 0
No of cylinders
Two 0 0 0 0 0 6 0
Three 4 0 7 0 36 28 3
Four 90 84 87 56 57 65 97
Five 0 0 1 0 0 0
Six 6 15 4 32 5 0 1
Eight or more 0 0 0 12 1 0 0
Transmission
Manual 60 3 83 5 1 98 83
automatic 34 90 9 75 34 2 15
CVT 5 7 2 18 65 0 1
DCT 1 0 6 2 mdash 0 1
Number of gear ratios
Four or fewer 13 16 1 7 mdash 10 6
Five 68 9 45 11 mdash 85 83
Six or more 19 75 54 82 mdash 5 11
Drivetrain
FwD 74 86 81 83 59 76 0
RwD 21 7 7 10 5 22 0
4wD and awD 5 7 12 7 36 2 100
No of valves per cylinder
Two 17 mdash mdash 2 4 25 60
Multi valve 83 mdash mdash 98 95 75 40
Valve camshaft configuration
Single overhead camshaft 26 1 mdash mdash 16 41 63
Dual overhead camshaft 74 84 mdash mdash 82 53 25
Overhead camshaft mdash 15 mdash mdash 0 6 mdash
Valve actuation
Fixed 50 16 mdash 2 11 86 78
VVT 44 84 mdash 98 89 12 16
VVL 6 mdash mdash mdash mdash 2 6
Fuel systems for gasoline vehicles
Multi‑point fuel injection 94 72 68 62 95 100 98
Gasoline direct injection 6 28 32 37 5 0 2
air induction systems for gasoline vehicles
Naturally aspirated 93 75 41 85 92 64 97
Supercharger turbocharger or twin‑turbo 7 25 59 15 8 36 3
47
ICCT white paper
AppENDix C NEW vEhiCLE ChArACTEriSTiCS AND TEChNOLOGy ADOpTiON DATA iN brAziL
Table C‑1 ndash Fleet characteristics of new Brazilian passenger vehicles by segment (2013)
parameters Subcompact Compact Medium Large Sports Off‑road SUV Minivan
Sales (thousands) 6785 6843 11790 1920 273 768 1997 23
Market share () 223 225 38 8 63 09 25 65 01
price (R$) $30103 $38732 $45496 $66508 $148834 $151284 $75164 $82284
No of cylinders 400 391 399 400 462 448 404 433
Displacement (cc) 1128 1293 1447 1794 2430 2586 1884 2244
Curb weight (kg) 940 1037 1102 1329 1561 1772 1395 1604
Length (mm) 3804 4026 4163 4499 4711 4516 4352 4658
Footprint (m2) 339 361 371 402 418 409 402 427
Engine power ndash gasoline (kw) 58 68 75 99 183 146 103 120
Engine power ndash ethanol (kw) 59 70 77 98 mdash 109 101 mdash
pTwR ndash gasoline (kwkg) 00614 00655 00671 00742 01173 00828 00731 00732
pTwR ndash ethanol (kwkg) 00630 00678 00697 00757 mdash 00766 00745 mdash
48
Brazil Passenger Vehicle Market statistics
Table C‑2 ndash Fleet characteristics of new Brazilian passenger vehicles by manufacturer (2013)
parameters Fiat
GM
Vo
lksw
agen
Ford
Ren
ault
hyu
ndai
ho
nda
Toyo
ta
pSa
Nis
san
Mit
sub
ishi
Kia
JaC
BM
w
Land
Rov
er
Mer
ced
es‑B
enz
Che
ry
aud
i
Suzu
ki
Jeep
Sales (thousands) 6087 5486 5448 3074 2207 2055 1392 1334 1163 621 368 255 158 141 106 94 80 67 63 36
Market share () 2002 1804 1792 1011 726 676 458 439 383 204 121 084 052 046 035 031 026 022 021 012
price (R$) $35017 $42259 $38701 $46174 $43447 $50112 $67078 $68922 $103001 $44035 $100696 $87009 $37654 $165111 $221943 $153281 $30821 $142799 $74769 $139039
No of cylinders 400 401 400 402 400 370 400 400 400 400 408 416 400 424 448 431 400 411 400 552
Displacement (cc) 1250 1340 1287 1497 1423 1495 1691 1808 1575 1579 2262 1856 1411 2095 2281 1934 1398 1912 1831 3182
Curb weight (kg) 1033 1060 1020 1156 1102 1122 1210 1201 1231 1069 1556 1377 1079 1624 1868 1598 1097 1551 1444 1945
Length (mm) 3965 4155 3993 4120 4127 4078 4319 4299 4116 4171 4401 4357 3956 4574 4487 4527 3896 4454 4234 4584
Footprint (m2) 345 370 354 368 378 383 397 387 376 379 395 407 351 429 433 429 349 417 323 420
Engine power ndash gasoline (kw) 64 71 65 79 73 86 96 90 80 82 120 112 83 151 179 138 71 136 94 162
Engine power ndash ethanol (kw) 65 72 65 79 76 85 97 90 81 82 107 106 95 mdash mdash mdash 75 mdash mdash mdash
pTwR ndash gasoline (kwkg)
00613 00662 00631 00674 00657 00739 00788 00745 00646 00766 00779 00792 00784 00921 00977 00856 00638 00870 00649 00835
pTwR ndash ethanol (kwkg) 00629 00681 00642 00693 00685 00781 00800 00795 00660 00768 00710 00798 00896 mdash mdash mdash 00659 mdash mdash mdash
49
ICCT white paper
Table C‑3 ndash Fleet characteristics of new Brazilian passenger vehicles by origin (2013)
parameters Domestic imported
Sales (thousands) 2537 504
Market share () 834 166
price (R$) $41739 $76049
No of cylinders 397 412
Displacement (cc) 1359 1791
Curb weight (kg) 1070 1289
Length (mm) 4063 4285
Footprint (m2) 362 390
Engine power ndash gasoline (kw) 70 102
Engine power ndash ethanol (kw) 73 84
pTwR ndash gasoline (kwkg) 0065 0076
pTwR ndash ethanol (kwkg) 0068 0074
50
Brazil Passenger Vehicle Market statistics
Table C‑4 ndash technology adoption in new Brazilian passenger vehicles by segment (2013)
Technology adoption Subcompact Compact Medium Large SportOff‑road SUV Minivan
Fuel type
Flex 982 988 982 837 00 134 826 00
Gasoline 18 12 17 163 996 540 174 1000
hybrid 0000 0000 0028 0000 0396 0001 0000 0000
Diesel 00 00 00 00 00 326 00 00
No of cylinders
Three 01 91 10 00 00 00 00 00
Four 999 909 990 998 758 775 979 833
Five 00 00 00 02 03 00 00 00
Six 00 00 00 00 175 211 21 167
Eight or more 00 00 00 00 63 13 00 00
Transmission
Manual 993 944 826 622 62 174 505 641
automatic 07 55 161 283 629 707 451 359
CVT 00 00 12 89 09 93 34 00
DCT 00 01 02 06 299 25 10 00
No of gear ratios
Four or fewer 04 47 72 51 00 34 247 193
Five 984 943 848 378 15 392 516 641
Six 12 09 73 515 796 462 225 167
Seven 00 01 06 23 87 53 12 00
Eight or more 00 00 01 32 102 59 00 00
Drivetrain
FwD 998 1000 997 688 550 00 916 1000
RwD 02 00 03 311 221 00 84 00
awD 00 00 00 01 229 1000 00 00
No of valves per cylinder
Two 806 694 584 195 00 00 258 00
Multi valve 194 306 416 805 1000 1000 742 1000
Valve camshaft configuration
Single overhead camshaft 839 786 709 309 00 212 375 00
Dual overhead camshaft 24 158 161 546 880 517 446 255
Valve actuation
Fixed 982 729 807 461 49 493 664 868
VVT 18 211 115 470 827 367 252 132
VVT+VVL 00 61 78 68 124 140 84 00
Fuel systems for gasoline vehicles
Multi‑point fuel injection 999 998 997 949 979 143 766 1000
Gasoline direct injection 01 02 03 51 21 857 234 00
air induction systems for gasoline vehicles
Naturally aspirated 999 997 995 943 974 369 543 1000
Supercharger turbocharger or twin‑turbo 01 03 05 57 26 631 457 00
51
ICCT white paper
Table C‑5 ndash technology adoption in new Brazilian passenger vehicles by manufacturer (2013)
Technology adoption Fi
aT
GM
VO
LKSw
aG
EN
FOR
D
REN
aU
LT
hY
UN
Da
i
hO
ND
a
TOYO
Ta
pSa
NiS
SaN
MiT
SUB
iSh
i
Kia
JaC
BM
w
LaN
D R
OV
ER
MER
CED
ES
Fuel type
Flex 990 987 965 966 997 921 999 886 928 998 283 739 31 42 00 00
Gasoline 10 09 35 34 03 79 01 35 72 02 557 255 969 957 663 950
hybrid 00 00 00 00 00 00 00 02 00 00 00 00 00 00 00 00
Diesel 00 04 00 00 00 00 00 77 00 00 160 06 00 00 337 50
No of cylinders
Three 00 00 05 00 00 348 00 00 00 00 00 00 00 00 00 00
Four 1000 996 994 989 1000 626 999 998 1000 1000 958 922 1000 906 787 878
Five 00 00 00 00 00 00 00 00 00 00 00 00 00 00 00 00
Six 00 02 01 11 00 26 01 02 00 00 42 78 00 68 185 87
Eight or more 00 02 00 00 00 00 00 00 00 00 00 00 00 26 28 35
Transmission
Manual 992 878 985 846 853 632 566 565 703 785 493 120 1000 02 00 151
automatic 08 103 00 137 62 285 355 160 297 121 118 793 00 575 18 14
CVT 00 19 15 16 41 70 01 246 00 00 139 87 00 423 982 836
DCT 00 00 00 00 43 13 78 30 00 94 251 00 00 00 00 00
No of gear ratios
Four or fewer 02 04 00 55 104 237 00 323 249 132 17 133 00 00 00 00
Five 981 811 963 839 797 623 861 643 684 828 530 107 1000 00 00 64
Six 17 185 29 106 99 140 139 07 67 40 453 754 00 217 800 00
Seven 00 00 07 00 00 00 00 27 00 00 00 00 00 08 00 936
Eight or more 00 00 00 00 00 00 00 00 00 00 00 06 00 775 200 00
Drivetrain
FwD 1000 902 989 972 987 985 990 892 1000 1000 496 623 1000 00 00 00
RwD 00 91 00 00 00 00 00 16 00 00 00 370 00 882 00 900
awD 00 06 11 28 13 15 10 92 00 00 504 07 00 118 1000 100
No of valves per cylinder
Two 811 864 988 745 220 00 00 00 00 00 00 00 00 00 00 00
Multi Valve 189 136 12 255 780 1000 1000 1000 1000 1000 1000 1000 1000 1000 1000 1000
Valve camshaft configuration
SOhC 836 755 914 675 832 00 04 00 497 398 331 00 00 00 00 00
DOhC 07 108 56 50 168 992 786 875 352 428 477 1000 907 810 860 453
Valve actuation
Fixed 1000 898 965 966 940 29 00 574 736 573 435 76 124 187 18 55
VVT 00 102 35 34 60 971 00 426 264 427 00 924 876 00 982 945
VVT+VVL 00 00 00 00 00 00 1000 00 00 00 565 00 00 813 00 00
air induction System
Naturally aspirated 997 994 966 977 997 988 1000 923 922 1000 835 936 1000 97 37 101
Supercharger turbocharger or twin‑turbo
03 06 34 23 03 12 00 77 78 00 165 64 00 903 963 899
Fuel systems for gasoline vehicles
Multipoint fuel injection 1000 995 965 972 1000 989 1000 1000 967 1000 994 1000 1000 78 15 158
Gasoline Direct injection 00 05 35 28 00 11 00 00 33 00 06 00 00 922 985 842
note Difference between 100 and summation of sohc and Dohc market share values corresponds to data not available
52
Brazil Passenger Vehicle Market statistics
AppENDix D DATA SOurCES AND COMpLETENESS
the basis of the statistics shown in this report is a database compiled by the icct with vehicle sales technical information (eg fleet characteristics technology content) and energy consumption (converted from either co2 emissions or fuel economy) from various data sources outlined in table D-1
Table D‑1 ndash Brazilian data sources
parameters Sales TechnicalEnergy
consumption
aDK (2014 2015) x x
MarkLines (2015) x
iBaMa (2014) x
iNMETRO (2014) x
UOL (2014) x
icarroscom (2014) x
this analysis examined energy consumption data from two public sources the nota Verde Program by the Brazilian institute of the environment and renewable natural resources (iBaMa) and the Brazilian Vehicle labeling Program (PBeV) by the national institute of Metrology standardization and industrial Quality (inMetro) table D-2 summarizes key differences between these two data sources
Table D‑2 ndash energy consumption data sources
iBaMa iNMETRO
program nota Verde1 Brazilian Vehicle labeling Program (PBeV)2
program description
Mandatory program that reports emissions of co2 co nox and nMhc as part of emissions certification program
Voluntary program since 2009 that allows the comparison of fuel economy across vehicle models
Unit gco2 km kml
Test cycle chassis testing under urban (FtP) driving cycle based on nBr 66012005
chassis testing under urban (FtP) and highway (hWYFe) driving cycles based on nBr 702420103
adjustment
no adjustment for real-world driving conditions Because reported co2 emissions are assumed to be zero for ethanol adjustments were made to account for tailpipe co2 emissions for vehicles running on ethanol
since 2010 published values include real-world adjustment factors to chassis test data a method adopted by the us ePa in 2008
Conversion to MJkm
iBaMarsquos data are reported as FtP (city test) co2 data in gco2 km conversion to caFe test cycle and to a different metric (Mjkm) involves four steps as presented in Figure D-1
inMetrorsquos data in kml are presented separately by fuel type (e22 e100) and driving cycle (urban highway) conversion to Mjkm was done by applying a conversion factor (2167 gco2 l for e22 and 1428gco2l for e00) caFe values are obtained by using a 5545 weighting for the urban (FtP) and highway cycles respectively
1 iBaMa (2014) nota Verde program available at httpwwwmmagovbrcidades-sustentaveisqualidade-do-arcontrole-de-emissoes-veicularesnota-verde
2 inMetro (2014) Programa Brasileiro de etiquetagem Veicular (PBeV) available at httpwwwinmetrogovbrconsumidortabelas_pbe_veicularasp
3 inMetro (2014) Metodologia Para Divulgaccedilatildeo De Dados De consumo Veicular available at httpwwwinmetrogovbrconsumidorpbeMetodologia_consumo_Veicularpdf
53
ICCT white paper
Step 1 Correcting the original IBAMA CO2 reported data ndash FTP CO2 gkm
IBAMArsquos CO2 reported values are corrected to account for tailpipe emissions from ethanol (tailpipe CO2 emissions are reported as zero in IBAMArsquos data)
bull E22 FTP reported CO2 data are reduced by 177bull E100 FTP reported CO2 data are reduced by 100
Flex fuel vehicles are tested with E22 and E00 the final values is calculated as the average of both fuelsCO2 IBAMA_Flex_FTP= 05(1-0177)CO2_E22_test_FTP + 050E100_FTP = 050823CO2_E22_FTPFor Gasoline only vehicles the tests are carried out only with Gasoline E22CO2 IBAMA_Gasoline_FTP = (1-0177) CO2_E22_Test_FTP
Where in the previous equations CO2_E22_FTP means CO2 emissions values obtained under FTP testingCO2 IBAMA_Flex_FTP means IBAMArsquos Corrected FTP values for flex vehiclesCO2 IBAMA_Gasoline_FTP means IBAMArsquos Corrected FTP values for gasoline only (E22) vehicles
INNOVAR AUTO is based on energy consumption data obtained as the combined CAFE test cycle This requires a weighted average of energy consumption data obtained from FTP testing (city driving ) and Highway fuel economy testing (HWFET) In mathematical form CAFE=f(FTPHWFET)
Given that IBAMA data is provided for only the first aprt the FTP testing then it is required to find a way to calculate CAFE combined values through FTP -75 only data A linear function was thus developed from data with FTP and HWY values (INMETRO data) is used to convert FTP only values to CAFE CO2 values ie CAFE=f(FTP) The function used for this conversion is
CO2_CAFE= (CO2_FTP+44756)11572
Step 2Convert FTP CO2 values to CAFE CO2 values
Converting CO2 values to MJkm values is done by using the energy density of E22 Note that all the previous calculations for CO2 come from E22-based data
bull The energy density of E22 is 2894 MJLE22bull E22 emits 2167gCO2LE22bull CAFE (MJkm) = CAFE (gCO2km) (2894 MJLE22 2167 gCO2LE22)
Step 3 Convert US CAFE CO2 values to MJkm values
Figure D‑1 ndash conversion of emission to energy consumption data
energy consumption values calculated from iBaMa and inMetro data differ greatly Figure D-1 illustrates energy consumption data for those models in both databases iBaMa data are on average 126 higher than inMetro data with a standard deviation of 89 and a maximum deviation of 39
54
Brazil Passenger Vehicle Market statistics
0
05
1
15
2
25
3
0 05 1 15 2 25 3
Ene
rgy
cons
ump
tio
n IB
AM
A (
MJ
km)
Energy consumption INMETRO (MJkm)
n=151
Figure D‑2 ndash comparison between energy consumption data from inMetro and iBaMa
151 vehicles tested under both programs
although inMetro data are more transparent as it breaks down fuel economy by fuel and test cycle it is still a voluntary program that allows manufacturers to select which models will participate in addition not all manufacturers participate in the program in turn iBaMa data only include co2 data for the urban cycle and thus energy consumption in the combined cycle had to be estimated from correlations using international data in addition corrections had to be made for gasoline-only engines since it seems that a co2 discount in theory only applicable to flex-fuel engines was also applied to gasoline-only engines Despite these data quality issues iBaMa data were considered the most adequate data source for energy consumption because it is a mandatory program that requires data reporting by all vehicle models and manufacturers
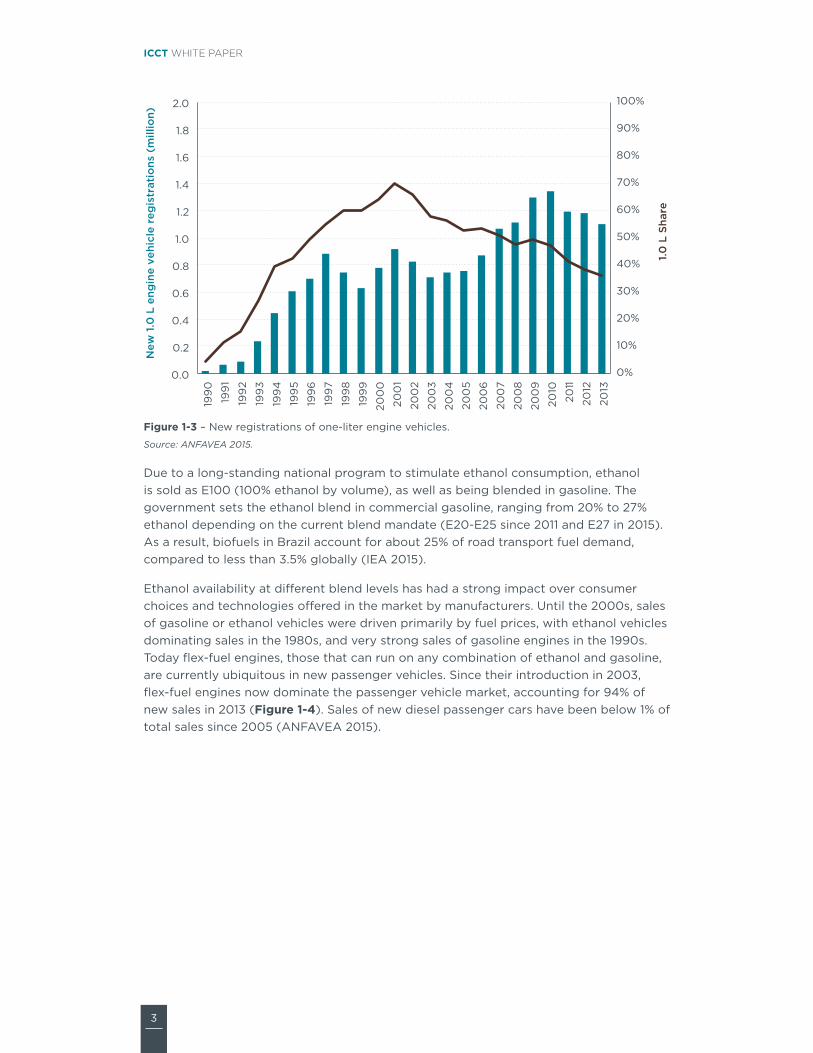
3
ICCT white paper
0
10
20
30
40
50
60
70
80
90
100
00
02
04
06
08
10
12
14
16
18
20
199
0
199
1
199
2
199
3
199
4
199
5
199
6
199
7
199
8
199
9
200
0
200
1
200
2
200
3
200
4
200
5
200
6
200
7
200
8
200
9
2010
2011
2012
2013
10
L S
hare
New
10
L e
ngin
e ve
hicl
e re
gis
trat
ions
(m
illio
n)
Figure 1‑3 ndash new registrations of one-liter engine vehicles
Source ANFAVEA 2015
Due to a long-standing national program to stimulate ethanol consumption ethanol is sold as e100 (100 ethanol by volume) as well as being blended in gasoline the government sets the ethanol blend in commercial gasoline ranging from 20 to 27 ethanol depending on the current blend mandate (e20-e25 since 2011 and e27 in 2015) as a result biofuels in Brazil account for about 25 of road transport fuel demand compared to less than 35 globally (iea 2015)
ethanol availability at different blend levels has had a strong impact over consumer choices and technologies offered in the market by manufacturers until the 2000s sales of gasoline or ethanol vehicles were driven primarily by fuel prices with ethanol vehicles dominating sales in the 1980s and very strong sales of gasoline engines in the 1990s today flex-fuel engines those that can run on any combination of ethanol and gasoline are currently ubiquitous in new passenger vehicles since their introduction in 2003 flex-fuel engines now dominate the passenger vehicle market accounting for 94 of new sales in 2013 (Figure 1‑4) sales of new diesel passenger cars have been below 1 of total sales since 2005 (anFaVea 2015)
4
Brazil Passenger Vehicle Market statistics
0
10
20
30
40
50
60
70
80
90
100
198
019
81
198
219
83
198
419
85
198
619
87
198
819
89
199
019
91
199
219
93
199
419
95
199
619
97
199
819
99
200
020
01
200
220
03
200
420
05
200
620
07
200
820
09
2010
2011
2012
2013
Pas
seng
er c
ar f
uel m
arke
t sh
are
Gasoline Ethanol Flex
Figure 1‑4 ndash registrations of new passenger vehicles by fuel type
Source ANFAVEA 2015
the top seven manufacturers ndash Fiat general Motors (gM) Volkswagen Ford renault hyundai and honda ndash commanded a vast majority (83) of the entire market in 2013 with the remaining manufacturers accounting for less than 4 of market sales each (Figure 1‑5) the Volkswagen gol is the most popular vehicle in Brazil accounting for about 45 of all sales in 2013 Medium-sized vehicles dominate the market with 39 of all sales followed by compact and subcompact vehicles which together make up 84 of the entire market in addition domestically manufactured vehicles accounted for more than 83 of sales in 2013 which represented a small increase with respect to the previous year
FIAT20
GM18
VOLKSWAGEN18
FORD10
RENAULT7
HYUNDAI7
HONDA5
TOYOTA 4
PSA 4
NISSAN 2
Others 5
2013 market shareby manufacturer
Subcompact22
Compact22Medium
39
Large6
Sport1
O-Road3
SUV7
Minivan01
2013 market shareby segment
Figure 1‑5 ndash Market share of new passenger vehicles by manufacturer and segment (2013)
Source ADK
5
ICCT white paper
Table 1‑1 summarizes key indicators for the Brazilian passenger vehicle market in 2012 and 2013 Fiat remained the market leader in 2013 although with a small loss and gM overtook Volkswagen in 2013 amongst the companies that gained the most market share are hyundai and toyota both of which doubled their market share between 2012 and 2013 on the other hand Psa and nissan lost market shares in this period the market dominance of medium-sized vehicles in 2013 marks a significant shift in consumer preferences Between 2012 and 2013 the subcompact segment lost the majority share (from 33 to 22) and the larger compact and medium segments gained sizable shares
Table 1‑1 ndash Market characteristics of new Brazilian passenger vehicles
parameter 2012 2013
Sales (million) 311 304
price (R$) $47203 $47446
Domestic market share 800 834
Engine 10 L share 386 363
Fuel share
Flex 914 936
Gasoline 82 59
hybrid 0004 0014
Diesel 04 05
Segment market share
Subcompact 332 223
Compact 162 225
Medium 335 388
Large 79 63
Sport 07 09
Off‑road 23 25
SUV 61 66
Minivan 01 01
Manufacturer market share
Fiat 221 200
GM 176 180
Volkswagen 211 179
Ford 96 101
Renault 73 73
hyundai 32 68
honda 43 46
Toyota 24 44
pSa 44 38
Nissan 28 20
Mitsubishi 13 12
Kia 11 08
JaC 06 05
BMw 03 05
Land Rover 03 03
Mercedes‑Benz 02 03
Others 02 14
sales-weighted average
6
Brazil Passenger Vehicle Market statistics
2 vEhiCLE fLEET ChArACTEriSTiCS
this chapter provides an overview of key vehicle fleet characteristics in Brazil number of cylinders engine displacement curb weight1 length footprint2 engine power and power-to-weight ratio (PtWr)3 are relevant indicators to characterize a vehicle fleet and understand individual vehicle and fleet-average energy consumption4
these key characteristics of passenger vehicles in Brazil experienced a small change in 2013 compared to 2012 (Table 2‑1) With the exception of number of cylinders all parameters increased in 2013 consistent with a trend of increasing market shares for larger and more powerful vehicles the evaluation of minimum and maximum parameters also provides important insights While the smallest vehicles continue to be sold in Brazil (since the minimum values did not change with the exception of footprint) it is evident that much larger vehicles started being sold in 2013 represented by the large variation in the maximum values of each parameter Because sales of these recently introduced larger vehicles are relatively small their effect on weighted average parameters is also modest
Figure 2‑1 illustrates key vehicle fleet characteristics by vehicle segment (see appendix a for segment definition) not surprisingly most parameters get larger between the subcompact and large segments off-road vehicles sports cars and minivans tend to be the largest and most powerful vehicles across the fleet while sport utility vehicles (suVs) tend to be comparable with vehicles in the ldquolargerdquo segment Because of their high performance (absolute and relative to vehicle size) sports cars have significantly larger engine power and PtWr compared to all other segments sports vehicles primarily imported are not sold in a flex-fuel configuration and consume strictly gasoline Flex-fuel vehicles have slightly higher engine power and PtWr than their gasoline counterparts in most segments Detailed sales-weighted average data by segment are presented in Table C‑1 in appendix c
1 Based on norm aBnt nBr iso 1176 2006 curb weight is the total weight of a vehicle with standard equipment all necessary operating consumables (eg motor oil and coolant) a full tank of fuel but not loaded with passengers or cargo
2 Footprint (m2) is the product of the distance between the axles of a vehicle (wheelbase) and the distance between the centerline of the tires (average trackwidth)
3 Power to weight ratio (PtWr) is defined as the rated power of the engine (kW) divided by the vehicle weight (kg) PtWr is a metric that describes vehicle acceleration and handling and it is thus used in Brazil as a criterion to classify sports vehicles (PtWr gt 0075 kWkg)
4 Vehicle energy consumption is presented in megajoules per kilometer (Mjkm) for consistency with the vehicle energy consumption targets established by inovar-auto although e27 is currently being used flex-fuel vehicles are tested with e22 fuel
7
ICCT white paper
Table 2‑1 ndash Fleet characteristics of new Brazilian passenger vehicles
Vehicle characteristic 2012 2013 Variation
Number of cylinders weighted average 402 400 ‑06
Displacement (cc)
Min 970 970
Max 6498 6749
weighted average 1418 1430 08
Curb weight (kg)
Min 800 800
Max 2940 2710
weighted average 1102 1106 04
Length (mm)
Min 2695 2695
Max 5290 5842
weighted average 4089 4100 03
Footprint (m2)
Min 217 241
Max 523 874
weighted average 364 367 09
Engine power ndash gasoline (kw)
Min 33 33
Max 153 545
weighted average 743 757 18
Engine power ndash ethanol (kw)
49 49
Max 114 153
weighted average 715 740 34
pTwR ‑ gasoline (kwkg)
00455 00455
Max 04482 03344
weighted average 00658 00671 20
pTwR ‑ ethanol (kwkg)
00476 00477
Max 00935 01033
weighted average 00667 00683 24
Energy consumption ndash US CaFE (MJkm) na 202
8
Brazil Passenger Vehicle Market statistics
0
500
1000
1500
2000
2500
3000
Subco
mpac
t
Compac
t
Medium
Larg
eSport
O-road SUV
Miniva
n
Fleet-a
vera
ge
Dis
pla
cem
ent
(cc)
0200400600800
10001200140016001800
2000
Subco
mpac
t
Compac
t
Medium
Larg
eSport
O-road SUV
Miniva
n
Fleet-a
vera
ge
Cur
b w
eig
ht (
kg)
0500
10001500
2000250030003500400045005000
Subco
mpac
t
Compac
t
Medium
Larg
eSport
O-road SUV
Miniva
n
Fleet-a
vera
ge
Leng
th (
mm
)
000050100150
200250300350400450
Subco
mpac
t
Compac
t
Medium
Larg
eSport
O-road SUV
Miniva
n
Fleet-a
vera
ge
Fo
otp
rint
(m
2 )
020406080
100120140160180
200
Subco
mpac
t
Compac
t
Medium
Larg
eSport
O-road SUV
Miniva
n
Fleet-a
vera
ge
Po
wer
(kW
)
Gasoline EthanolGasoline and Ethanol
000
002
004
006
008
010
012
014
Subco
mpac
t
Compac
t
Medium
Larg
eSport
O-road
SUV
Miniva
n
Fleet-a
vera
gePo
wer
-to
-wei
ght
rat
io (
kWk
g)
Figure 2‑1 ndash Fleet characteristics of new Brazilian passenger vehicles by segment (2013)
Fleet characteristics for the top 20 vehicle manufacturers responsible for more than 99 of passenger vehicle sales in 2013 are presented in Figure 2‑2 the four top-selling manufacturers (Fiat gM Volkswagen and Ford) produce on average lighter vehicles with smaller and less powerful engines average engine rated power is below 80 kW for the 10 largest manufacturers except for toyota and honda since each has a large share of off-road and suV sales respectively luxury manufacturers and off-road dominant manufacturers (jeep and Mitsubishi) show the largest values of engine power PtWr values seem evenly distributed below 0070 kWkg across the five largest manufacturers plus Psa and chery and climb following the power trend for luxury and off-road oriented manufacturers Most vehicles are rated with higher engine power and PtWr under ethanol (e100) than under gasoline (e22) Detailed sales-weighted average data by manufacturer are presented in Table C‑2 in appendix c
9
ICCT white paper
Gasoline Ethanol
0
500
1000
1500
2000
2500
3000
3500
Fiat GM
Volkswag
enFord
Renau
lt
Hyund
ai
Honda
Toyo
taPSA
Nissan
Mitsub
ishiKIA
JACBMW
Land
Rove
r
Merce
des-B
enz
Chery
Audi
Suzuk
iJe
ep
Fleet-a
vera
geFiat GM
Volkswag
enFord
Renau
lt
Hyund
ai
Honda
Toyo
taPSA
Nissan
Mitsub
ishiKIA
JACBMW
Land
Rove
r
Merce
des-B
enz
Chery
Audi
Suzuk
iJe
ep
Fleet-a
vera
ge
Dis
pla
cem
ent
(cc)
0200400600800
10001200140016001800
2000
Cur
b w
eig
ht (
kg)
Fiat GM
Volkswag
enFord
Renau
lt
Hyund
ai
Honda
Toyo
taPSA
Nissan
Mitsub
ishiKIA
JACBMW
Land
Rove
r
Merce
des-B
enz
Chery
Audi
Suzuk
iJe
ep
Fleet-a
vera
geFiat GM
Volkswag
enFord
Renau
lt
Hyund
ai
Honda
Toyo
taPSA
Nissan
Mitsub
ishiKIA
JACBMW
Land
Rove
r
Merce
des-B
enz
Chery
Audi
Suzuk
iJe
ep
Fleet-a
vera
ge000050100150
200250300350400450
Fo
otp
rint
(m
2 )
3400
3600
3800
4000
4200
4400
4600
4800
Leng
th (
mm
)
Fiat GM
Volkswag
enFord
Renau
lt
Hyund
ai
Honda
Toyo
taPSA
Nissan
Mitsub
ishiKIA
JACBMW
Land
Rove
r
Merce
des-B
enz
Chery
Audi
Suzuk
iJe
ep
Fleet-a
vera
geFiat GM
Volkswag
enFord
Renau
lt
Hyund
ai
Honda
Toyo
taPSA
Nissan
Mitsub
ishiKIA
JACBMW
Land
Rove
r
Merce
des-B
enz
Chery
Audi
Suzuk
iJe
ep
Fleet-a
vera
ge0
20406080
100120140160180
200
Po
wer
(kw
)
00000010002000300040005000600070008000900100
Po
wer
-to
-wei
ght
rat
io (
kWk
g)
Gasoline and Ethanol
Figure 2‑2 ndash Fleet characteristics of new Brazilian passenger vehicles by manufacturer (2013)
Manufacturers are organized by total sales in descending order
Figure 2‑3 illustrates vehicle fleet characteristics for domestic and imported vehicles in general imported vehicles are bigger and heavier than those nationally produced the most remarkable contrast lies on engine power and PtWr imported vehicles are more powerful and have higher PtWr but while domestic vehicles exhibit higher engine power and PtWr for ethanol than for gasoline the opposite occurs for imported ones a closer examination of available data on engine compression ratios shows that domestic producers are leveraging ethanolrsquos higher octane rating and designing flex-fuel engines with much higher compression ratios (~1251) than gasoline-only engines (around 1051)5 this confirms the special engine designcalibration for operation with high ethanol gasoline blends from manufacturers with local production Detailed sales-weighted average data by origin are presented in Table C‑3 in appendix c
5 More information on the effect of ethanol on vehicle design characteristics can be found in stein et al (2013)
10
Brazil Passenger Vehicle Market statistics
Gasoline Ethanol
0
200
400
600
800
1000
1200
1400
1600
1800
2000
Domestic Imported Fleet-average
Dis
pla
cem
ent
(cc)
0
200
400
600
800
1000
1200
1400
Domestic Imported Fleet-average
Cur
b w
eig
ht (
kg)
345
350
355
360
365
370
375
380
385
390
395
Domestic Imported Fleet-average
Fo
otp
rint
(m
2 )
3950
4000
4050
4100
4150
4200
4250
4300
4350
Domestic Imported Fleet-average
Leng
th (
mm
)
0
20
40
60
80
100
120
Domestic Imported Fleet-average
Po
wer
(kW
)
0050
0055
0060
0065
0070
0075
0080
Domestic Imported Fleet-average
Po
wer
-to
-wei
ght
rat
io (
kWk
g)
Gasoline and Ethanol
Figure 2‑3 ndash Fleet characteristics of new Brazilian passenger vehicles by origin (2013)
Figure 2‑4 compares Brazilrsquos passenger vehicle fleet with those in china the us eu japan india and south Korea For the energy consumption comparison this analysis considers the us corporate average fuel economy (caFe) test cycle6 average engine displacement curb weight footprint and engine power in Brazil are the smallest with the exception of india (and japan in the case of engine displacement) With respect to PtWr the average Brazilian passenger car breaks the trend set by the power category ie Brazilian cars are less powerful than those in china japan and eu due to their lower average weight which drives the PtWr value above chinese japanese and european cars this suggests that the average Brazilian cars share the driving performance characteristics (eg acceleration times) of the us and Korean vehicles despite their relative smaller engines Detailed international data are presented in appendix B
6 Details on icctrsquos methodology for comparing new vehicle fuel efficiency can be found at the global PV standards section in the icctrsquos website httpwwwtheicctorginfo-toolsglobal-passenger-vehicle-standards
11
ICCT white paper
Despite having the smallest lightest and least powerful vehicles on average (with the exception of india) Brazilrsquos average energy consumption ranks fourth amongst the markets analyzed in this study the japanese fleet had the lowest energy consumption given the small and light vehicle characteristics of japanese cars and their relatively higher adoption of efficiency technologies (eg hybrids) followed by the eu (medium sizeweight fleet with high technology penetration) and india (smaller and lighter fleet overall) the us has the highest energy consumption on average due to the fleetrsquos larger size weight and power requirements china and south Korea trail the us as the most energy-consuming fleet and these countries have fleets with large and heavy vehicles but relatively lower penetration of efficiency technologies a detailed evaluation of energy consumption in Brazil and other markets is presented in chapter 4
0
500
1000
1500
2000
2500
3000
US S Korea EU China Brazil Japan India
Dis
pla
cem
ent
(cc)
0
200
400
600
800
1000
1200
1400
1600
1800
US S Korea EU China Japan Brazil India
Cur
b w
eig
ht (
kg)
000
050
100
150
200
250
300
350
400
450
US S Korea EU China Japan Brazil India
Fo
otp
rint
(m
2)
0
20
40
60
80
100
120
140
160
US S Korea EU China Japan Brazil India
Po
wer
(kW
)
00000
00100
00200
00300
00400
00500
00600
00700
00800
00900
01000
US S Korea Brazil China Japan EU India
Po
wer
-to
-wei
ght
rat
io (
kWk
g)
100
120
140
160
180
200
220
240
260
US China S Korea Brazil India Japan EU
Ene
rgy
cons
ump
tio
n ndash
US
CA
FE
(M
Jkm
)
Figure 2‑4 ndash international comparison of key new passenger vehicle characteristics
12
Brazil Passenger Vehicle Market statistics
3 vEhiCLE TEChNOLOGy ADOpTiON
this chapter provides an overview of current technology adoption including fuel engine and transmission technologies that affect vehicle energy consumption the type and complexity of technologies vary across vehicle segments to a large extent this is a function of vehicle size and weight and its intended performance and ultimately cost Fleet-average parameters presented in Table 3‑1 correspond to sales-weighted fleet-average values this chapter is divided by technology type with supporting information in appendix c an international comparison for each technology is also presented in this chapter the data for this technology adoption analysis came from a diversity of sources listed in appendix D also note that for comparisons at the international level it was required to use information from different years the most recent according to data availability
Table 3‑1 ndash technology adoption in new Brazilian passenger vehicles
Year 2012 2013
Fuel type
Flex 914 936
Gasoline 82 59
hybrid 0004 0014
Diesel 04 049
No of cylinders
Three 03 25
Four 986 966
Five 00 00
Six 09 08
Eight or more 01 01
Transmission
Manual 870 833
automatic 112 147
CVT 14 15
DCT 04 05
No of gear ratios
Four or fewer 61 59
Five 849 831
Six 84 98
Seven 03 07
Eight or more 02 05
Drivetrain
FwD 950 944
RwD 27 29
4wD and awD 23 27
No of valves per cylinder
Two 664 596
Multi valve 336 404
Valve camshaft configuration
Single overhead camshaft 696 630
Dual overhead camshaft 176 245
Valve actuation
Fixed 822 783
VVT 124 159
VVT+VVL 54 58
Fuel systems for gasoline vehicles
Multi‑point fuel injection 982 976
Gasoline direct injection 18 24
air induction systems for gasoline vehicles
Naturally aspirated 984 973
Supercharger turbocharger or twin‑turbo 16 27
13
ICCT white paper
FUEL TYpEFlex-fuel vehicles (FFVs) are designed to run on gasoline (e22) ethanol (e100) or any combination of both fuels except for a few engine and fuel system modifications FFVs are identical to gasoline-only models7 FFVs experience no loss in performance when operating on e100 however since ethanol contains less energy per volume than gasoline FFVs typically get about 25 fewer kilometers per liter when fuelled with e100
Flex-fuel is the dominant technology across all vehicle segments with the exception of sports cars off-road vehicles and minivans (Figure 3‑1) all top 10 manufacturers produce primarily flex-fuel engines and those manufacturers with a larger share of gasoline and diesel engines typically import most of their vehicles (Figure 3‑2) the predominance of FFVs responsible for almost 94 of vehicle sales in 2013 is unique to Brazil (Figure 3‑3)
hybrid-gasoline vehicles achieve reduced fuel consumption by incorporating in the drivetrain a battery and an electric motor in addition to an internal combustion (ic) engine this technology permits the ic engine to shut down when the vehicle is decelerating and is stopped braking energy to be recovered and the ic engine to be downsized and operated at more efficient operating points Depending on the level of complexity hybrid systems can achieve 15 to 35 reductions in fuel consumption with respect to similar-sized vehicles
Despite having very limited penetration sales of new hybrid vehicles have increased three-fold from 131 units in 2012 to 432 in 2013 primarily in the medium and sports segments two manufacturers sell the most gasoline hybrid models (not flex-fuel) in Brazil including the toyota Prius and the Ford Fusion hybrid
Diesel engines offer 20 to 25 reduction in fuel consumption over traditional gasoline multi-point fuel injection (MPFi) engines due to higher compression ratios reduced pumping losses and 12 higher energy content per liter of fuel the challenge for further commercialization is twofold the complexity and additional cost of advanced exhaust after-treatment technologies that reduce emissions of particulate matter and oxides of nitrogen to levels comparable to those of gasoline and FFV engines
sales of diesel passenger vehicles are not allowed in Brazil with the exception of vehicles with some off-road characteristics Despite having a small penetration (around 05) sales of diesel passenger vehicles increased by 16 in 2013 toyota sells the most diesel passenger vehicles followed by Mitsubishi land rover gM and Mercedes-Benz the light-duty diesel market in Brazil is equivalent to the us and china in terms of market penetration and much below the penetration in europe and south Korea although air quality concerns in europe might trigger lower sales of diesel vehicles in coming years
7 Most of the modifications with respect to a gasoline-only vehicle (e00) include changes to fuel systemrsquos materials that are compatible with the oxygen content of ethanol blends and changes to air and fuel ratio management systems (mainly software based)
14
Brazil Passenger Vehicle Market statistics
0
10
20
30
40
50
60
70
80
90
100
Subco
mpac
t
Compac
t
Medium
Larg
eSport
O-Road SUV
Miniva
nTo
tal
Mar
ket
shar
e
Diesel Hybrid Gasoline Flex
Figure 3‑1 ndash Fuel type by segment
0102030405060708090
100
Fiat GM
Volkswag
enFord
Renau
lt
Hyund
ai
Honda
Toyo
taPSA
Nissan
Mitsub
ishi
KIAJA
CBMW
Land
Rove
r
Merce
des-B
enz
Chery
Audi
Suzuk
iJe
epTo
tal
Tech
nolo
gy
shar
e
Diesel Hybrid Gasoline Flex
Figure 3‑2 ndash Fuel type by manufacturer
0
10
20
30
40
50
60
70
80
90
100
China2010
Korea2011
EU-272013
US2013
Japan2011
India2012
Brazil2013
Tech
nolo
gy
shar
e
Diesel Hybrid Gasoline CNGLPGFlex
Figure 3‑3 ndash Fuel type international comparison
15
ICCT white paper
NUMBER OF CYLiNDERSacross all vehicle markets 4-cylinder engines are the most common design in automobile engines with displacements below 25 liters this engine configuration presents the right balance between complexity and performance for the target vehicle segments (small to mid-size sedans suVs and some off-road vehicles) engines with six and more cylinders are designed to provide a smoother vehicle driving experience with lower vibration and noise than 4-cylinder engines can provide and with higher power output this better overall performance comes at a higher cost driving their widespread use in large and luxury vehicles and heavier suVs and off-road vehicles
the need to attain better energy consumption has resulted in a recent wave of 3-cylinder engines from a handful of manufacturers in vehicles that typically used 4-cylinder engines achieving similar or better performance this practice is known as engine downsizing Downsizing can also be applied to larger engines from V-8s to V-6s and from V-6s to i-4s in most cases engine downsizing is accompanied with turbocharging and changes to the fuel delivery system
Four-cylinder engines dominate the passenger vehicle market in Brazil and are sold in more than 90 of new vehicles among all segments except the sports off-road and minivan segments (Figure 3‑4) Despite its predominance sales of 4-cylinder engines fell from over 307 to 293 million units between 2012 and 2013 equivalent to a 4 reduction 4-cylinder vehicles represent the majority of sales among the 20 top manufacturers except for hyundai and jeep (Figure 3‑5) although 4-cylinder engines represent the dominant technology in all countries analyzed Brazil still has the largest market share (Figure 3‑6)
the most significant shift in market preferences in Brazil occurred with 3-cylinder engines this technology is becoming more popular with almost eight times more vehicles sold in 2013 compared to 2012 reaching almost 75000 units in 2013 almost all 3-cylinder engines are being sold as compact vehicles instead of the smaller subcompact segment hyundai is the technology leader in sales of 3-cylinder high-efficiency Kappa engines8 japan and india have relatively high penetration of 3-cylinder engine technology in india the popularity of 2- and 3-cylinder vehicles is primarily driven by lower price tags (lt usD $8000)
six-cylinder engines are third in sales after 4- and 3-cylinder engines with absolute numbers close to 25000 units sold in 2013 its market share reduced by 13 with respect to 2012 six-plus cylinder engines are being sold mostly in the sports off-road and minivan segments Manufacturers that cater to the most expensive models and segments dominate the market of vehicles with six-plus cylinder engines such as land rover BMW and Mercedes-Benz the penetration of 6-plus-cylinder engines in Brazil is very low compared to other countries
Five-cylinder engines are not very common in Brazil or other countries and are losing market with respect to 2012 sales by 56 Volkswagen audi and Volvo are the only manufacturers that offered 5-cylinder engines in Brazil in 2013
8 hyundairsquos 3-cylinder Kappa engine httpworldwidehyundaicomWWshowroomcarshB20PiPindexhtml
16
Brazil Passenger Vehicle Market statistics
0
10
20
30
40
50
60
70
80
90
100
Subco
mpac
t
Compac
t
Medium
Larg
eSport
O-Road SUV
Miniva
nTo
tal
Tech
nolo
gy
shar
e
8+ 6 5 4 3
Figure 3‑4 ndash number of cylinders by segment
0102030405060708090
100
Fiat GM
Volkswag
enFord
Renau
lt
Hyund
ai
Honda
Toyo
taPSA
Nissan
Mitsub
ishi
KIAJA
CBMW
Land
Rove
r
Merce
des-B
enz
Chery
Audi
Suzuk
iJe
epTo
tal
Tech
nolo
gy
shar
e
8+ 6 5 4 3
Figure 3‑5 ndash number of cylinders by manufacturer
0
10
20
30
40
50
60
70
80
90
100
China2010
Korea2011
EU-272013
US2013
Japan2011
India2012
Brazil2013
Tec
hno
log
y sh
are
8+ 6 5 4 3 2
Figure 3‑6 ndash number of cylinders international comparison
17
ICCT white paper
TRaNSMiSSiONtransmission technologies can reduce energy consumption in two ways First by allowing engine operation on a more efficient region of the engine map and second by reducing the mechanical losses within transmissions traditionally manual transmissions have offered better energy consumption than traditional automatic transmissions (with 4 or 5 speeds) due to lower friction losses however new generation of automatic transmissions with higher number of gears lower friction better materials and computer-controlled shift points have not just closed the gap between manual and automatic transmission performance but even exceed manual transmission performance
new technologies such as dual-clutch transmissions (Dcts) and continually variable transmissions (cVts) are gaining market share due to the need for lower vehicle energy consumption Dcts can be defined as manual transmissions with electro-hydraulically operated dual-clutch systems allowing for faster shifting times and selective automatic or ldquomanualrdquo operation as opposed to manual automatic and Dct transmissions which have a discrete number of gear ratios cVts have a theoretically infinite choice of ratios between fixed limits which allows engines to be further optimized for minimizing energy consumption cVt technology has been used in lower-horsepower vehicles because of maximum-torque limitations with the most common metal-belt design (nas 2011) these advanced transmission technologies offer significant benefits in energy consumption compared to traditional manual or automatic technologies according to the us national academy of sciences a 6-speed Dct provides 6 to 9 lower energy consumption than a 4-speed automatic transmission note that a traditional 6-speed automatic transmission provides an estimated 3 to 5 benefit the energy consumption benefit of cVt depends on the application and is estimated to be 1 to 7 (nas 2011)
although vehicle sales with manual transmissions are predominant in Brazil the penetration of automatic transmissions cVts and Dcts is increasing resulting in a market share loss for manual transmissions of about 6 between 2012 and 2013 (Table 3‑1) With the exception of sports and off-road segments manual transmission technology has the largest market share in all segments but it tends to become less predominant as vehicles grow in size and comfort level (Figure 3‑7) the top five manufacturers sell most of their vehicles with manual transmissions but their market share is somewhat smaller for other high-selling manufacturers that cater to a more affluent market (Figures 3‑8)
automatic transmissions are becoming increasingly popular in Brazil experiencing an increase of 28 in sales between 2012 and 2013 automatic transmissions dominate the sports and off-road segments Kia BMW land rover Mercedes-Benz and jeep adopt this type of transmission technology for most of their vehicle sales
Dct transmissions are entering the Brazilian market mostly through the sports segment via imported models the sales of Dct equipped vehicles increased in 2013 by 22 with respect to 2012 Dct technology is being offered mainly by manufacturers that sell sports vehicles such as audi in more than 67 of their vehicles and Mercedes-Benz in more than 15 of their vehicles the global leader in Dct adoption is europe followed by the us (Figure 3‑9)
cVt technology market is still relatively small being sold by small volume manufacturers like jeep audi and Mitsubishi with more than 25 of new vehicle sales each nissan renault honda and toyota also sell vehicles with cVt technology cVt penetration in Brazil is similar to europersquos cVt is the leading transmission technology in japan with more than 65 of the market
18
Brazil Passenger Vehicle Market statistics
0
10
20
30
40
50
60
70
80
90
100
Subco
mpac
t
Compac
t
Medium
Larg
eSport
O-Road SUV
Miniva
nTo
tal
Tech
nolo
gy
shar
e
DCT CVT Automatic Manual
Figure 3‑7 ndash transmission by segment
0
10
20
30
40
50
60
70
80
90
100
Fiat GM
Volkswag
enFord
Renau
lt
Hyund
ai
Honda
Toyo
taPSA
Nissan
Mitsub
ishi
KIAJA
CBMW
Land
Rove
r
Merce
des-B
enz
Chery
Audi
Suzuk
iJe
epTo
tal
Tech
nolo
gy
shar
e
DCT CVT Automatic Manual
Figure 3‑8 ndash transmission by manufacturer
0
10
20
30
40
50
60
70
80
90
100
China2010
Korea2011
EU-272013
US2013
Japan2011
India2012
Brazil2013
Tech
nolo
gy
shar
e
DCT CVT Automatic Manual
Figure 3‑9 ndash transmission international comparison
19
ICCT white paper
NUMBER OF GEaR RaTiOS as mentioned in the previous section increasing the number of gear ratios (whether manual automatic dual-clutch or continuously variable) allows the engine to be operated in the best efficiency region resulting in energy consumption benefits compared to an automatic four-gear ratio transmission (also known as 4-speed transmission) higher ratio automatic transmissions could reduce energy consumption from 2 to 3 (for a five-gear ratio) to 6 to 8 (for an eight-gear ratio) (ePanhtsa 2010)
Four-gear ratio transmissions are losing market share in Brazil by more than 5 between 2012 and 2013 (Table 3‑1) these transmissions are particularly high sellers in the suV and minivan segments which suggest that some models in these more expensive segments are being sold with outdated technologies (Figure 3‑10) Most manufacturers are phasing out this type of transmission (Figure 3‑11) although jeep suzuki and toyota are lagging behind other manufacturers the four-gear ratio transmission technology has been losing market share in most countries even in india where smaller and inexpensive cars dominate the market 4-speed transmissions have the smallest market share (Figure 3‑12)
Five- and six-gear ratio transmissions were predominant in the Brazilian market in 2013 Five-gear ratio transmissions are dominant in all segments except for the off-road and sports segments which have adopted six-gear ratio transmissions in most sales the significant market share of five- and six-gear ratio transmissions is similar to most countries although the us europe and south Korea show higher shares of six and more gear ratios
seven- and eight-gear ratio transmissions which are considered emerging technologies have experienced an increase in sales in Brazil with over twice as many sales in 2013 compared to 2012 seven- and eight-gear ratio transmissions are popular among the large sports and off-road segments all of which are imported models luxury manufacturers such as Mercedes-Benz and audi are selling the most seven-gear vehicles as a share of their sales Volkswagen and toyota are also selling similar numbers of seven-gear ratio vehicles although for Volkswagen and toyota it represented less than 3 of their brand sales BMW and land rover are the leaders in eight-gear ratio vehicles
20
Brazil Passenger Vehicle Market statistics
0
10
20
30
40
50
60
70
80
90
100
Subco
mpac
t
Compac
t
Medium
Larg
eSport
O-Road
SUV
Miniva
nTo
tal
Tech
nolo
gy
shar
e
8 7 6 5 4
Figure 3‑10 ndash number of gear ratios by segment
0
10
20
30
40
50
60
70
80
90
100
Fiat GM
Volkswag
enFord
Renau
lt
Hyund
ai
Honda
Toyo
taPSA
Nissan
Mitsub
ishi
KIAJA
CBMW
Land
Rove
r
Merce
des-B
enz
Chery
Audi
Suzuk
iJe
epTo
tal
Tech
nolo
gy
shar
e
8 7 6 5 4
Figure 3‑11 ndash number of gear ratios by manufacturer
0
10
20
30
40
50
60
70
80
90
100
Tech
nolo
gy
shar
e
Six or more Five Four or fewer
China2010
Korea2011
EU-272013
US2013
India2012
Brazil2013
Figure 3‑12 ndash number of gear ratios international comparison
21
ICCT white paper
DRiVETRaiNDrivetrain technology includes front-wheel drive (FWD) rear-wheel drive (rWD) and all-wheel drive (aWD) vehicles For the same vehicle size FWD vehicles provide more interior space and better energy consumption than rWDs due to lower weight as it avoids the added weight of and space for the driveshaft and differential that rWD requires Because the weight of the engine and transmission is located close to the wheels FWD vehicles have better traction than rWDs rWDs however show better handling as the weight distribution between the front and rear wheels is more uniform and the tasks of turning and acceleration are split between the front and rear wheels also directing large amounts of power through the front wheels can create ldquotorque steerrdquo thus rWD is the adequate technology for the sports segment aWD drivetrains are intended for specific driving applications that imply loss of traction such as off-road terrains snow or towing
FWD vehicles dominate all segments of the Brazilian passenger car market (Table 3‑1) with the exception of the off-road segment (Figure 3‑13) among the 20 largest manufacturer sellers most except for BMW land rover Mercedes-Benz and suzuki offer FWD technology (Figure 3‑14) Brazil has the highest market share of FWD vehicles of all countries analyzed (944) although FWD has at least 50 market share in all seven countries (Figure 3‑15)
aWD market share increased by 15 between 2012 and 2013 due to a tri-fold increase in the sports segment sales off-road vehicle sales with aWD also increased to more than 76000 units in 2013 amongst the largest ten manufacturers toyota is the aWD market leader followed by Ford and Volkswagen note that land rover sells only aWD vehicles in Brazil among non-luxury manufacturers Mitsubishi and suzuki are selling more than 50 of their vehicles with aWD technology
rWD technology is offered mostly in large and sports vehicles and in suVs among the 10 largest manufacturers rWD is offered mainly by gM and toyota while an extended examination of the 20 largest manufacturers by sales show that aWD and rWD is focused among the more expensive brands (Figure 3‑14) Mercedes-Benz and BMW sell close to 90 of their vehicles with rWD technology traditionally associated with engine performance and responsiveness
22
Brazil Passenger Vehicle Market statistics
0
10
20
30
40
50
60
70
80
90
100
Subco
mpac
t
Compac
t
Medium
Larg
eSport
O-Road SUV
Miniva
nTo
tal
Tehn
olo
gy
shar
e
AWD RWD FWD
Figure 3‑13 ndash Drivetrain by segment
0
10
20
30
40
50
60
70
80
90
100
Fiat GM
Volkswag
enFord
Renau
lt
Hyund
ai
Honda
Toyo
taPSA
Nissan
Mitsub
ishi
KIAJA
CBMW
Land
Rove
r
Merce
des-B
enz
Chery
Audi
Suzuk
iJe
epTo
tal
Tech
nolo
gy
shar
e
AWD RWD FWD
Figure 3‑14 ndash Drivetrain by manufacturer
0
10
20
30
40
50
60
70
80
90
100
China2010
Korea2011
EU-272013
US2013
Japan2011
India2012
Brazil2013
Tech
nolo
gy
shar
e
AWD RWD FWD
Figure 3‑15 ndash Drivetrain international comparison
23
ICCT white paper
VaLVE CaMShaFT CONFiGURaTiON (DOhC VS SOhC)the engine camshaft governs the timing duration and lift of valve operation controlling the intake of air and the exhaust of combustion gases this report focuses on single overhead camshafts (sohc) and dual overhead camshafts (Dohc) as these configurations have almost completely replaced the older overhead valve configuration (ohV) sohc design places a single camshaft above the cylinder head that governs all the valves intake and exhaust in the case of sohc V-engines there is one single camshaft per head Dohc designs use separate camshafts for intake valves and exhaust valves Dohc engines achieve increased airflow at high-engine speeds improve volumetric efficiency and reduce the valvetrainrsquos moving mass such engines typically develop higher power at high-engine speeds the us environmental Protection agency (ePa) and national highway traffic safety administration (nhtsa) estimate the effectiveness of Dohc over sohc to be between 1 and 25 (ePanhtsa 2010)
although Dohc produce more power and provide lower fuel consumption the Brazilian fleet is still mostly composed of sohcs vehicles (Table 3‑1) sohc technology is predominant among the subcompact compact and medium segments (Figure 3‑16) among manufacturers sohc technology is predominant among the five largest least expensive brands (Figure 3‑17) sales of vehicles with more advanced Dohc technology grew in 2013 by almost 36 with respect to 2012 albeit from a relatively smaller base this increase was experienced in all vehicle segments but in different magnitudes
although global data on this technology are scarce Figure 3‑18 indicates that most countries are moving away from sohc with Brazil being the only country analyzed where sohc is still predominant no data were available for the us or europe
24
Brazil Passenger Vehicle Market statistics
0
10
20
30
40
50
60
70
80
90
100
Subco
mpac
t
Compac
t
Medium
Larg
eSport
O-Road SUV
Miniva
nTo
tal
Tech
nolo
gy
shar
e
nd DOHC SOHC
Figure 3‑16 ndash Valve camshaft configuration by segment (nd no data)
0
10
20
30
40
50
60
70
80
90
100
Fiat GM
Volkswag
enFord
Renau
lt
Hyund
ai
Honda
Toyo
taPSA
Nissan
Mitsub
ishi
KIAJA
CBMW
Land
Rove
r
Merce
des-B
enz
Chery
Audi
Suzuk
iJe
epTo
tal
Tech
nolo
gy
shar
e
nd DOHC SOHC
Figure 3‑17 ndash Valve camshaft configuration by manufacturer (nd no data)
0
10
20
30
40
50
60
70
80
90
100
China2010
Korea2011
Japan2011
India2012
Brazil2013
Tech
nolo
gy
shar
e
nd OVC DOHC SOHC
Figure 3‑18 ndash Valve camshaft configuration international comparison (nd no data)
25
ICCT white paper
VaLVE aCTUaTiON improved valvetrain systems with variable valve actuation (VVa) technology either variable valve timing (VVt) or variable valve timing and lift (VVt+VVl) improves the enginersquos volumetric and thermodynamic efficiency they also enable further engine improvements such as internal exhaust gas recirculation and cylinder deactivation VVt alters the timing of the intake valve exhaust valve or both primarily to reduce pumping losses increase specific power and control residual exhaust gases VVl increases efficiency by optimizing airflow over a broader range of engine operation which reduces pumping losses and increases specific power VVl is accomplished by controlled switching between two or more cam profile lobe heights the most advanced technology VVt+VVl yields a wide range of performance optimization and volumetric efficiency including enabling the engine to be valve-throttled (no need for intake throttle) VVt provides energy consumption gains of 3 to 5 while the more flexible and complex VVt+VVl system can reach 4 to 8 (ePa amp nhtsa 2010)
VVa technology either VVt or VVt+VVl are emerging technologies in Brazil where most vehicles still have fixed-valve timing designs (Table 3‑1) Fixed technology is predominant among the smaller vehicle segments as well as suVs and minivans (Figure 3‑19) the five largest manufacturers sold more than 90 of their vehicles with fixed-valve technology in 2013 (Figure 3‑20) the international comparison indicates that only Brazil and india have not yet adopted VVa technologies for most of their light-duty fleet (Figure 3‑21)
VVt and VVt+VVl are being adopted across all segments including the subcompact segment but tend to be more predominant in high-end manufacturers a closer examination by manufacturer shows that most are offering some vehicles with either one of the VVa systems while honda and hyundai offer this technology in almost all vehicles (Figure 3‑20) honda is the technology leader in variable valve actuation with the adoption in the early 1990s of the Vtec system (Valve timing electronic control) VVt technologyrsquos market share grew by about 25 in 2013 primarily due to hyundairsquos sales from 80000 units in 2012 to almost 200000 units in 2013 hyundai offered the continuously variable valve technology (cVVt) in the large majority of vehicle sold in 2013 the sports segment is the one where VVt dominates the market Mitsubishi BMW and audi are also selling a large share of their vehicles with the VVt+VVl technology
26
Brazil Passenger Vehicle Market statistics
0
10
20
30
40
50
60
70
80
90
100
Subco
mpac
t
Compac
t
Medium
Larg
eSport
O-Road SUV
Miniva
nTo
tal
Tech
nolo
gy
shar
e
VVT+VVL VVT Fixed
Figure 3‑19 ndash Valve actuation by segment
0
10
20
30
40
50
60
70
80
90
100
Fiat GM
Volkswag
enFord
Renau
lt
Hyund
ai
Honda
Toyo
taPSA
Nissan
Mitsub
ishi
KIAJA
CBMW
Land
Rove
r
Merce
des-B
enz
Chery
Audi
Suzuk
iJe
epTo
tal
Tech
nolo
gy
shar
e
VVT+VVL VVT Fixed
Figure 3‑20 ndash Valve actuation by manufacturer
VVT+VVL VVT Fixed
0
10
20
30
40
50
60
70
80
90
100
China2010
Korea2011
US2013
Japan2011
India2012
Brazil2013
Tech
nolo
gy
shar
e
Figure 3‑21 ndash Valve actuation international comparison
27
ICCT white paper
FUEL SYSTEMS FOR GaSOLiNE VEhiCLESVehicle fuel systems describe the technology required to deliver fuel into the engine combustion chamber this section examines two gasolineflex technologies namely multi-point fuel injection (MPFi) and gasoline direct injection (gDi) MPFi is now the most common fuel-delivery system for gasoline engines used in passenger vehicles worldwide in sequential MPFi engines fuel is injected into the air stream next to the intake valve port while the intake valve is open to draw the air-fuel mixture into the cylinder some of the fuel is vaporized on the surface of the hot intake valve expanding and thus reduces the volumetric efficiency on gDi engines fuel is injected at high pressure directly into the combustion chamber improving volumetric efficiency and providing cooling of the airfuel charge within the cylinder which allows for higher compression ratios and increased thermodynamic efficiency gDi technology alone offers benefits of 2 to 5 with respect to MPFi engines but bigger benefits rely on the synergy between gDi turbocharging and downsizing which can reach 12 to 15 energy consumption reduction with respect to a MPFi naturally aspirated engine (ePa 2012)
Table 3‑1 illustrates that MPFi is still the most common fuel injection technology for gasolineflex vehicles in Brazil which is reflected in its dominant share across most segments except for sports and off-road vehicles in Brazil gDi has found a niche market in the sports and off-road segments with more than 90 of sport vehicles fitted with gDi technology (Figure 3‑22) Within the overall gasoline market the gDi technology is still an emerging technology representing just 24 of new sales gDirsquos market share increased by 31 in 2013 with all but 4000 units being imported among the 10 largest manufacturers the adoption of gDi is extremely low below 5 for Volkswagen Ford hyundai and Psa (Figure 3‑23) high-end european brands (audi land rover Mercedes-Benz and BMW) are the technology leaders in terms of gDi adoption rates echoing the trend of turbocharging technology sales Volkswagen vehicles with gDi systems account for less than 35 of their sales in 2013 but their absolute numbers (around 19000 vehicles) place the company as one of the leaders in gDi technology in the Brazilian market
From a global market perspective the penetration of gDi technology in Brazil is low compared to all other markets in Figure 3‑24 except for india and japan it should be noted that the later has the largest share of hybrid vehicles around the globe
28
Brazil Passenger Vehicle Market statistics
0
10
20
30
40
50
60
70
80
90
100
Compac
t
Subco
mpac
t
Medium
Larg
eSport
O-Road SUV
Miniva
nTo
tal
Tech
nolo
gy
shar
e
GDI MPFI
Figure 3‑22 ndash gasolineflex fuel system by segment
GDI MPFI
0102030405060708090
100
Fiat GM
Volkswag
enFord
Renau
lt
Hyund
ai
Honda
Toyo
taPSA
Nissan
Mitsub
ishi
KIAJA
CBMW
Land
Rove
r
Merce
des-B
enz
Chery
Audi
Suzuk
iJe
epTo
tal
Tech
nolo
gy
shar
e
Figure 3‑23 ndash gasolineflex fuel system by manufacturer
GDI MPFI
0
10
20
30
40
50
60
70
80
90
100
China2010
Korea2011
EU-272013
US2013
Japan2011
India2012
Brazil2013
Tech
nolo
gy
shar
e (n
on-
die
sel)
Figure 3‑24 ndash gasolineflex fuel system international comparison
29
ICCT white paper
TURBOChaRGiNGengine power is primarily limited by the rate at which the engine is able to draw air into the combustion chamber turbocharging and supercharging are two methods to increase the amount of air drawn into the engine above the level of what is possible with the naturally aspirated process (through the expansion of the cylinders) By increasing the amount of air into the engine the amount of fuel can be proportionally increased resulting in increased power output level and with it the ability to reduce engine displacement while maintaining performance the combination of turbocharging and downsizing in spark ignited (gasoline and flex-fuel) vehicles can provide energy consumption improvements between 2 to 6 with respect to a direct-injected gDi engine (ePa amp nhtsa 2010) turbocharging technology is the cornerstone for achieving better energy consumption in vehicles as the basis for downsizing and reducing the engine weight while keeping the same or better vehicle performance (ie acceleration or time to reach certain speed) although turbochargers are used in diesel and gasolineflex vehicles the analysis in this report focuses on turbocharging for spark-ignited gasolineflex vehicles only
turbocharging is one of the most important emerging technologies in Brazil where most vehicles are still naturally aspirated (na) (Table 3‑1) turbocharging technology has increased the market share significantly between 2012 and 2013 by more than 65 albeit from a small base (from about 49000 to 81000 vehicles)
Most vehicles with turbocharging are sold in the sports and off-road segments as this technology also produces superior engine power output (Figure 3‑25) among the 10 largest manufacturers turbocharging is still below 10 of their sales (Figure 3‑26) Volkswagen and Ford despite having small relative sales of vehicles with turbocharging (less than 35) are the manufacturers with the highest total sales of vehicles with turbocharging audi land rover Mercedes-Benz and BMW are the technology leaders with more than 90 of vehicle sales in 2013
the penetration of turbo and supercharging technologies in Brazil is lower than in other countries with a larger gasoline fleet such as the us china and japan (Figure 3‑27) in Brazil 95 of diesel passenger vehicle sales have turbocharging technology
30
Brazil Passenger Vehicle Market statistics
0
10
20
30
40
50
60
70
80
90
100
Compac
t
Subco
mpac
t
Medium
Larg
eSport
O-Road SUV
Miniva
nTo
tal
Tech
nolo
gy
shar
e (n
on-
Die
sel)
Turbo NA
Figure 3‑25 ndash turbocharging for gasolineflex fuel vehicles by segment (NA naturally aspirated)
0102030405060708090
100
Fiat GM
Volkswag
enFord
Renau
lt
Hyund
ai
Honda
Toyo
taPSA
Nissan
Mitsub
ishiKIA
JACBMW
Land
Rove
r
Merce
des-B
enz
Chery
Audi
Suzuk
iJe
epTo
tal
Tech
nolo
gy
shar
e (n
on-
Die
sel)
Turbo NA
Figure 3‑26 ndash turbocharging for gasolineflex fuel vehicles by manufacturer (NA naturally aspirated)
0
10
20
30
40
50
60
70
80
90
100
China2010
Korea2011
EU-272013
US2013
Japan2011
India2012
Brazil2013
Tech
nolo
gy
shar
e (n
on-
die
sel)
Turbo NA
Figure 3‑27 ndash turbocharging for gasolineflex fuel vehicles international comparison (NA naturally aspirated)
31
ICCT white paper
4 vEhiCLE ENErGy CONSuMpTiON
this section analyzes the Brazilian new passenger vehicle energy consumption in 2013 although other metrics are more common (see box) vehicle energy consumption is presented in megajoules per kilometer (Mjkm) for consistency with Brazilrsquos inovar-auto policy in 2012 Brazilrsquos Ministry of Development industry and Foreign trade (MDic) adopted the inovar-auto policy with the aim of fostering industrial competitiveness through technology investments the policy includes a target for corporate average energy consumption (in Mjkm with vehicle curb weight as the attribute parameter) for vehicles sold in 2017
in the us canada Mexico and saudi arabia fleet-average fuel economy standards are defined as a function of vehicle footprint in the eu china japan south Korea and india vehicle weight is the attribute for the calculation of fleet-average targets in Brazil inovar-auto has defined its fiscal targets for vehicle energy consumption measured in megajoules per kilometer (Mjkm) as a function of vehicle weight
VEhiCLE ENERGY MEaSUREMENT UNiTS
Many metrics can be used to describe the amount of fuel energy or emissions generated by unit of distance traveled
Fuel economy measures distance traveled per unit of fuel consumed in Brazil kilometers per liter (kml) is the most common metric to describe vehicle efficiency but other units are used in different countries such as miles per gallon (mpg) in the us
Fuel consumption is the reciprocal of fuel economy and measures fuel consumed per distance traveled it is usually expressed in liters per 100 kilometers (l100 km) and it is used in europe for example
GhGCO2 emissions measures ghg or co2 emissions per distance traveled expressed as grams of pollutant per kilometer or mile
Energy consumption (EC) measures the energy consumed per distance traveled for example in megajoules per kilometer Despite being a less common metric it is sometimes preferred for being a fuel-neutral metric across different types of fuel and vehicle technologies Vehicle energy consumption in Mjkm is the metric used in Brazilrsquos inovar-auto policy to quantify the corporate average energy consumption target for each manufacturer Values for energy consumption in Brazilian spark-ignited vehicles are provided for e22 since that is the fuel mixture used in vehicle tests
Vehicle energy consumption in this report is calculated from co2 emissions data in the Brazilian institute of environment and renewable natural resources (iBaMa) nota Verde program (iBaMa 2014) which reports official emissions data from homologation tests Data are limited to passenger cars sold by the top 10 manufacturers with light commercial vehicles being excluded appendix D presents a description of data sources
32
Brazil Passenger Vehicle Market statistics
and calculation methodologies as well as a discussion of vehicle energy consumption data quality and completeness in Brazil
not surprisingly vehicle energy consumption increases with vehicle footprint and engine rated power the two parameters that define vehicle segments in Brazil (Figure 4‑1) subcompact and compact vehicles which accounted for about 45 of new sales in 2013 have average energy consumption below the fleet average while medium-sized vehicles which hold the largest market share (388) have energy consumption just above the fleet average larger more powerful vehicles consume more energy than the fleet average but have a considerably smaller market share (combined share of 163) Data availability for these segments is not as extensive as the data available for the subcompact compact and medium segments which could affect the relative rankings of each segment
Ene
rgy
cons
ump
tio
n (M
Jkm
)
Subco
mpac
t
Compac
t
Medium
Larg
e
O-road SUV
4000
200000
400000
600000
850000
35
30
25
20
15
10
05
0
Sales
Total 202
Figure 4‑1 ndash new vehicle sales-weighted average energy consumption by segment (2013)
33
ICCT white paper
Figures 4‑2 and 4‑3 illustrate new vehicle energy consumption for multiple weight and footprint bins For each weight bin (in 100 kg increments) and footprint bin (in 01 m2 increments) sales-weighted averages of energy consumption for each vehicle version are presented (dashes) generating energy consumption ranges for each bin (cream areas) Vehicle sales by bin are presented for reference in the lower charts
the strong correlation between vehicle energy consumption and weight follows from the strong physical relationship between the weight of the vehicle and the energy required to accelerate it and overcome resistances9 (Figure 4‑2) Data dispersion within each bin suggests that energy consumption varies due to other vehicle characteristics that affect vehicle aerodynamics and rolling resistance as well as the adoption of technologies that affect engine and transmission efficiency (eg friction reduction technologies gDi VVt)
Curb weight (kg)
SubcompactCompactMediumLargeO-roadSUV
Ene
rgy
cons
ump
tio
n (M
Jkm
)Sa
les
5
6
4
3
2
1
600k
800k
400k
200k
0k800 900 1000 1100 1200 1300 1400 1500 1600 1700 1800 1900 2000 2100
Figure 4‑2 ndash new vehicle energy consumption by vehicle weight (2013)
9 on a plain surface the sum of resistances of a vehicle is acceleration resistance + rolling resistance + aerodynamic resistance = c1 m a + c2 frr m + c3 cw a v2 with mass (m) as an integral part of both acceleration and rolling resistance which are most relevant for inner-city driving situations other factors are acceleration (a) rolling resistance of tires (frr) aerodynamic coefficient of the vehicle (cw) frontal area of vehicle (a) velocity (v) and constants (cx)
34
Brazil Passenger Vehicle Market statistics
Footprint has a reasonable correlation with energy consumption (Figure 4‑3) ie larger vehicles tend to consume more fuel than smaller vehicles however the correlation is not as strong as with vehicle weight similar to the previous figure the broad spread of energy consumption values suggests a combination of different vehicle characteristics (eg weight engine displacement rated power) and technologies (eg transmissions fuel systems) as well as the presence of suVs and off-road vehicles among the medium- and large-sized footprint values respectively
Footprint (m2)
SubcompactCompactMediumLargeO-roadSUV
Ene
rgy
cons
ump
tio
n (M
Jkm
)Sa
les
5
6
4
3
2
1
400k
500k
300k
200k
100k
0k31 32 33 34 35 36 37 38 39 40 41 42 43 44 45 46 48 49
Figure 4‑3 ndash new vehicle energy consumption by vehicle footprint (2013)
35
ICCT white paper
Figure 4‑4 illustrates sales weighted average for new vehicle energy consumption by mass for the top 10 manufacturers in Brazil in 2013 Bubble sizes are proportional to total vehicle sales Manufacturers in the lower-left quadrant produce the lightest and most efficient vehicles with hyundai presenting the best overall average energy consumption renault in the upper-left quadrant produces vehicles that are equivalent in weight but on average with higher energy consumption in the lower-right quadrant are manufacturers that produce relatively heavier vehicles but with lower energy consumption in their weight class Despite producing heavier vehicles on average than many manufacturers honda achieves lower energy consumption on average in the upper-right quadrant are manufacturers that produce on average the heavier and least efficient vehicles with Psa (citroen and Peugeot) producing the heaviest and least efficient cars on average a regression line correlating vehicle energy consumption and mass highlights the best performers (hyundai honda and nissan) average performers (Fiat Volkswagen gM and toyota) and those performing worse than average (renault Ford and Psa)
FIA
GMVW
FORREN
HYU
HON
TOY
PSA
NIS
160
170
180
190
200
210
220
230
240
250
950 1000 1050 1100 1150 1200 1250 1300 1350
Ene
rgy
cons
ump
tio
n (M
Jkm
)
Curb weight (kg)
Fleet Ave
Figure 4‑4 ndashaverage new vehicle sales-weighted energy consumption by manufacturer (2013)
36
Brazil Passenger Vehicle Market statistics
Figure 4‑5 shows fleet-average energy consumption based on certification and type approval data for new vehicles in multiple countries converted to the us caFe combined driving cycle Bubble sizes represent total sales of new passenger cars Because of data availability in different countries the country comparison is based on different calendars years for different countries 2011 for south Korea and japan 2012 for china and india and 2013 for europe the us and Brazil given annual improvements in vehicle energy consumption triggered by regulatory efficiency standards and fiscal incentives those countries with older data could be at a slight disadvantage in this comparison
With the heaviest vehicles on average the us fleet is also the most energy consuming of all countries china and south Korea have similar average energy consumption but since south Korean vehicles are heavier on average they are relatively more efficient than chinese vehicles although Brazilrsquos fleet consumes less fuel on average than those from the us china and south Korea its fleet is relatively inefficient when compared to countries with vehicles of similar weight (japan and india) the average Brazilian vehicle consumes about 34 more energy than the average vehicle in japan whose fleet has a large penetration of gasoline hybrid and advanced fuel-efficiency technologies such as three-cylinder engines VVa Dohc and 6-plus speed transmissions european vehicles are the best performing on average despite being heavier than all countries with the exception of the us and south Korea the adoption of fuel-efficiency technologies (eg Dct 6-plus-speed transmissions gDi turbocharging) contributes to europersquos better than average performance
China2012
SKorea2011
Europe2013
US2013
Japan2011
India2012
Brazil2013
Sales5 MM10 MM
14
16
18
20
22
24
26
28
1000 1100 1200 1300 1400 1500 1600 1700
Ene
rgy
cons
ump
tio
n ndash
CA
FE
(M
Jkm
)
Curb weight (kg)
Type-approval and certification energy consumption data only (does not include o-cycle or real-world driving data)
Figure 4‑5 ndash international comparison of passenger car energy consumption
Country labels indicate the dataset year
Figure 4‑6 provides a more detailed country comparison by illustrating average vehicle energy consumption by vehicle (curb) weight bin Vehicle sales in each bin are shown for reference the us is not shown due to lack of detailed model-by-model data Brazilrsquos vehicles on average have the highest energy consumption in most weight
37
ICCT white paper
bins with china being the second highest in most bins Because china has higher fuel consumption than Brazil on the 1000 bin which represents the highest share of vehicle sales fleet-average energy consumption in china is still higher than in Brazil as illustrated in the previous figure europe consistently performs best in terms of vehicle energy consumption in most weight bins with japan also performing relatively well
Curb weight (kg)
BrazilChinaEuropeIndiaJapanSouth Korea
Ene
rgy
cons
ump
tio
n C
AF
E (
MJ
km)
Sale
s
40
35
25
20
15
10
6M
8M
4M
2M
0M600 800 1000 1200 1400 1600 1800 2000 2200 2400
Figure 4‑6 ndash international comparison of average vehicle energy consumption by vehicle weight
Type-approval and certification energy consumption data only (does not include off-cycle or real-world driving data)
38
Brazil Passenger Vehicle Market statistics
Figure 4‑7 illustrates the distribution of energy consumption data in Brazil for each vehicle version by mass and segment Bubble sizes represent total sales of each version Data were limited to flex-fuel vehicles in the subcompact compact medium and large segments due to its relatively better data quality and representativeness (ie they represented over 87 of sales in 2013) While most vehicles follow a predictable trend that correlates energy consumption and vehicle mass there are a large number of versions with energy consumption substantially higher than the trend line this suggests there is substantial room for improvements in their energy consumption since there are vehicles in similar weight classes with substantially superior energy consumption performance
Sales1000050000
140
160
180
200
220
240
260
280
700 800 900 1000 1100 1200 1300 1400 1500 1600
Ene
rgy
cons
ump
tio
n (M
Jkm
)
Curb weight (kg)
Subcompact Compact Medium Large Fleet average
Figure 4‑7 ndash Distribution of new Brazilian passenger vehicle energy consumption data by vehicle weight and segment (2013)
this chapter suggests that there are potential improvements in vehicle energy consumption for the Brazilian fleet For similar vehicles in terms of weight class footprint or engine rating there is substantial dispersion in energy consumption indicating that there are vehicles performing much worse than the average across manufacturers there is also a clear trend of some manufacturers performing much better than the average while others have a lot more room for improvement the international comparison clearly shows that Brazilian vehicles perform much worse in terms of energy consumption than vehicles of similar weight suggesting a delay in the adoption of energy efficient technologies among Brazilian vehicle manufacturers
Finally a more detailed analysis of vehicle versions clearly illustrates a considerable number of vehicle versions significantly above average thus indicating potential improvements in energy consumption that would place them on par with better performing vehicles with similar characteristics
39
ICCT white paper
Deficiencies in data quality and completeness prevent more definite conclusions about vehicle energy consumption gasoline-only vehicles in particular have poor energy consumption data quality although they represent a relatively small fraction (6) of total vehicles sold in 2013 Because some vehicle segments are primarily composed of gasoline-only vehicles (eg sports minivans) this chapter excludes these segments from the analysis there are also concerns about the gap between energy consumption data reported by iBaMarsquos nota Verde and Brazilrsquos national institute of Metrology standardization and industrial Qualityrsquos (inMetro) labeling program (PBeV using its acronym in Portuguese) with the latter reporting consistently lower values of vehicle energy consumption
Finally the availability of energy consumption data was not adequate for many manufacturers beyond the top 10 sales group which prevented their inclusion in this analysis Despite the data quality and lack of completeness the energy consumption data in this chapter include data that are reasonably accurate and representative thus supporting its interpretation
40
Brazil Passenger Vehicle Market statistics
rEfErENCES
aDK automotive consultoria de Marketing (2013) relatoacuterios de volumes de vendas do mercado brasileiro para veiacuteculos de passeio e comerciais leves referentes a 2013
alves l Wilbert M (2014) reduccedilatildeo do imposto sobre Produto industrializado e a Venda de automoacuteveis Xi congresso usP iniciaccedilatildeo cientiacutefica em contabilidade
associaccedilatildeo nacional de transportes Puacuteblicos (antP 2014) estudo mostra baixo efeito do desconto no iPi de veiacuteculos sobre PiB e emprego available at httpwwwantporgbrwebsitenoticiasshowaspnpgcode=a4DeeFe8-a7BF-48D3-B1F5-8eDe1447BF10
associaccedilatildeo nacional dos Fabricantes de Veiacuteculos automotores (anFaVea 2015) anuaacuterio da induacutestria automobiliacutestica Brasileira 2015 Brazilian automotive industry Yearbook 2015 satildeo Paulo available at wwwanfaveacombr
european environment agency (2014) Monitoring co2 emissions from new passenger cars in the eu summary of data for 2013 april 2014
instituto Brasileiro do Meio ambiente e dos recursos naturais renovaacuteveis (iBaMa 2014) consulta dos niacuteveis de emissatildeo dos veiacuteculos novos brasileiros available at httpsservicosibamagovbrctfpublicosel_marca_modelo_rvepphp
international council on clean transportation (icct 2015) global passenger vehicle standards available at httpwwwtheicctorginfo-toolsglobal-passenger-vehicle-standards
international energy agency (iea 2015) renewables Bioenergy available at httpswwwieaorgtopicsrenewablessubtopicsbioenergy
Korea energy Management corporation (KeMco 2014) Fuel economy regulation available at httpwwwkemcoorkrnew_engmainmainasp
Marklines (2015) Marklines automotive industry Portal available at httpwwwmarklinescomen
Mendonccedila M sachsida a (2014) Modelando a demanda de creacutedito para veiacuteculos no Brasil uma abordagem com mudanccedila de regime iPea
Ministeacuterio do Desenvolvimento induacutestria e comeacutercio exterior (MDic 2013) Programa de incentivo agrave inovaccedilatildeo tecnoloacutegica e adensamento da cadeia Produtiva de Veiacuteculos automotores mdash inovar-auto httpwwwplanaltogov brccivil_03_ato2011-20142012DecretoD7819htm
stein r anderson j and Wallington t (2013) an overview of the effects of ethanol-gasoline Blends on si engine Performance Fuel efficiency and emissions SAE Int J Engines 6(1)470-487 2013 doi1042712013-01-1635
us environmental Protection agency and national highway traffic safety administration (ePanhtsa 2010) Final rulemaking to establish light-Duty Vehicle greenhouse gas emission standards and corporate average Fuel economy standards ePa-420-r-10-901
us environmental Protection agency (ePa 2012) regulatory impact analysis Final rulemaking for 2017-2025 light-Duty Vehicle greenhouse gas emission standards and corporate average Fuel economy standards ePa-420-r-12-016
41
ICCT white paper
us national academy of sciences (nas 2011) assessment of Fuel economy technologies for light-Duty Vehicles available at httpwwwnapeducatalog12924assessment-of-fuel-economy-technologies-for-light-duty-vehicles
World Bank group (2015) World Development indicators available at httpdataworldbankorgdata-catalogworld-development-indicators
42
Brazil Passenger Vehicle Market statistics
LiST Of ACrONyMS
4wD Four-wheel drive
aNFaVEa Brazilian association of automobile Manufacturers
awD all-wheel drive
BRiC Brazil russia india china
CaFE corporate average fuel economy
CBG compressed biogas
CO2 carbon dioxide
CVT continuously variable transmission
CVVT continuously variable valve technology
DCT Dual-clutch transmission
DOhC Dual overhead camshaft
EC energy consumption
Epa us environmental Protection agency
EU european union
FFV Flex-fuel vehicle
FTp Federal test procedure
FwD Front-wheel drive
GDi gasoline direct injection
GDp gross domestic product
GhG greenhouse gas
GM general Motors
iBaMa Brazilian institute of the environment and renewable natural resources
iC internal combustion
iCCT international council on clean transportation
iNMETRO national institute of Metrology standardization and industrial Quality
Kg Kilogram
Km Kilometer
Kw Kilowatt
LDV light-duty vehicle
LpG liquified petroleum gas
MDiC Ministry of Development industry and Foreign trade
MJ Megajoule
MpFi Multi-point fuel injection
Mpg Miles per gallon
NaS us national academy of sciences
43
ICCT white paper
NhTSa us national highway transportation safety administration
OhV overhead valve
pBEV Brazilian Vehicle labeling Program
pSa Psa Peugeot citroeumln
pTwR Power-to-weight ratio
pV Passenger vehicle
RwD rear-wheel drive
SOhC single overhead camshaft
SUV sport utility vehicle
US united states
USD us dollar
VTEC Valve timing electronic control
VVa Variable valve actuation
VVL Variable valve lift
44
Brazil Passenger Vehicle Market statistics
AppENDix A SEGMENT DEfiNiTiONS
Table a‑1 ndash segment definitions
Segmentpower (kw)
pTwR (kwkg) area (m2)
Other characteristics Examples
Subcompact lt 140 lt 0075 le 65 mdash Mini cooper chevrolet celta smart Fortwo
Compact lt 140 lt 0075 65 lt area le 70 mdash honda Fit hyundai hB20 Volkswagen Polo
Medium lt 140 lt 0075 70 lt area le 80 mdash honda civic nissan tiida Peugeot 308
Large lt 140 lt 0075 gt 80 mdash audi a4 BMW 3 series Mercedes c-class
Sports gt 140 gt 0075 mdash 4 seats maxjaguar XF lamborghini gallardo Ferrari california
Off‑road mdash mdash lt 80 traction = 4WDjeep cherokee honda cr-V BMW X3 hyundai santa Fe
SUV mdash mdash lt 80Based on aDKrsquos default classification
BMW X1 Ford ecosport hyundai tucson
Minivan mdash mdash Passengers 6-12
citroen grand Picasso Kia carnival
45
ICCT white paper
AppENDix b iNTErNATiONAL MArKET DATA
Table B‑1 ndash international market comparison of new fleet characteristics
parameters China S Korea EU US Japan india Brazil
Year 2012 2011 2013 2013 2011 2012 2013
Sales (million) 155 13 118 156 352 256 304
price (USD) $21008 $21383 $24439 mdash $20637 $11717 $22015
No of cylinders mdash 43 40 47 38 36 40
Displacement (cc) 1605 1960 1613 2606 1425 1294 1430
Curb weight (kg) 1296 1421 1391 1623 1193 1059 1106
Length (mm) 4323 4531 4263 mdash 4013 3859 4100
Footprint (m2) 38 420 40 425 371 341 367
Engine power (kw) 86 120 89 148 78 55 76
pTwR (kwkg) 00664 00844 00640 00912 00654 00519 00671
Energy consumption ndash US CaFE (MJKm)[1] 235 206 169 250 171 183 202
[1] energy consumption data presented here for countries other than Brazil were obtained from local official sources in its original metric and drive cycle and then converted to Mjkm under the us caFe drive cycle using the methodology described in Yang (2015) Mode details and historical fuel consumption data on their original metrics is presented in the icctrsquos global PV standard website httpwwwtheicctorginfo-toolsglobal-passenger-vehicle-standards
Data Sources
China Ministry of industry and information technology (Miit 2014) corporate average Fuel efficiency accounting Method for Passenger cars available at httpwwwgovcngzdt2013-0320content_2358627htm
Baseline performance china automotive research and technology center through internal communication and icct internal 2010 database for chinese light-duty vehicles
S Korea internal communication with s Korean official and from greencarcongress available at httpwwwgreencarcongresscom200906korea-20090604html
EU european environment agency (2014) Monitoring co2 emissions from new passenger cars in the eu summary of data for 2013 april 2014
US us ePa (2014) light-duty automotive technology carbon dioxide emissions and fuel economy trends1975 through 2014 table 91 page 110 available at http httpwwwepagovfueleconomyfetrends1975-2014420r14023apdf
Japan jaMa (2010) the Motor industry of japan available at httpwwwjama-englishjppublicationsMVs2010pdf Mlit httpwwwmlitgojpcommon000990330pdf
india Bureau of energy efficiency white paper 2010-2012 calculation based on icct database
Brazil icct Brazil Vehicle Database (2013)
46
Brazil Passenger Vehicle Market statistics
Table B‑2 ndash international market comparison of technology adoption in new vehicles
Technology adoption China S Korea EU US Japan india Brazil
Year 2010 2011 2013 2013 2011 2012 2013
Fuel type
CBGLpGFlex 0 11 2 0 0 4 94
Gasoline 99 65 44 93 86 56 6
hybrid 0 1 1 5 13 0 0
Diesel 1 23 53 1 0 40 0
No of cylinders
Two 0 0 0 0 0 6 0
Three 4 0 7 0 36 28 3
Four 90 84 87 56 57 65 97
Five 0 0 1 0 0 0
Six 6 15 4 32 5 0 1
Eight or more 0 0 0 12 1 0 0
Transmission
Manual 60 3 83 5 1 98 83
automatic 34 90 9 75 34 2 15
CVT 5 7 2 18 65 0 1
DCT 1 0 6 2 mdash 0 1
Number of gear ratios
Four or fewer 13 16 1 7 mdash 10 6
Five 68 9 45 11 mdash 85 83
Six or more 19 75 54 82 mdash 5 11
Drivetrain
FwD 74 86 81 83 59 76 0
RwD 21 7 7 10 5 22 0
4wD and awD 5 7 12 7 36 2 100
No of valves per cylinder
Two 17 mdash mdash 2 4 25 60
Multi valve 83 mdash mdash 98 95 75 40
Valve camshaft configuration
Single overhead camshaft 26 1 mdash mdash 16 41 63
Dual overhead camshaft 74 84 mdash mdash 82 53 25
Overhead camshaft mdash 15 mdash mdash 0 6 mdash
Valve actuation
Fixed 50 16 mdash 2 11 86 78
VVT 44 84 mdash 98 89 12 16
VVL 6 mdash mdash mdash mdash 2 6
Fuel systems for gasoline vehicles
Multi‑point fuel injection 94 72 68 62 95 100 98
Gasoline direct injection 6 28 32 37 5 0 2
air induction systems for gasoline vehicles
Naturally aspirated 93 75 41 85 92 64 97
Supercharger turbocharger or twin‑turbo 7 25 59 15 8 36 3
47
ICCT white paper
AppENDix C NEW vEhiCLE ChArACTEriSTiCS AND TEChNOLOGy ADOpTiON DATA iN brAziL
Table C‑1 ndash Fleet characteristics of new Brazilian passenger vehicles by segment (2013)
parameters Subcompact Compact Medium Large Sports Off‑road SUV Minivan
Sales (thousands) 6785 6843 11790 1920 273 768 1997 23
Market share () 223 225 38 8 63 09 25 65 01
price (R$) $30103 $38732 $45496 $66508 $148834 $151284 $75164 $82284
No of cylinders 400 391 399 400 462 448 404 433
Displacement (cc) 1128 1293 1447 1794 2430 2586 1884 2244
Curb weight (kg) 940 1037 1102 1329 1561 1772 1395 1604
Length (mm) 3804 4026 4163 4499 4711 4516 4352 4658
Footprint (m2) 339 361 371 402 418 409 402 427
Engine power ndash gasoline (kw) 58 68 75 99 183 146 103 120
Engine power ndash ethanol (kw) 59 70 77 98 mdash 109 101 mdash
pTwR ndash gasoline (kwkg) 00614 00655 00671 00742 01173 00828 00731 00732
pTwR ndash ethanol (kwkg) 00630 00678 00697 00757 mdash 00766 00745 mdash
48
Brazil Passenger Vehicle Market statistics
Table C‑2 ndash Fleet characteristics of new Brazilian passenger vehicles by manufacturer (2013)
parameters Fiat
GM
Vo
lksw
agen
Ford
Ren
ault
hyu
ndai
ho
nda
Toyo
ta
pSa
Nis
san
Mit
sub
ishi
Kia
JaC
BM
w
Land
Rov
er
Mer
ced
es‑B
enz
Che
ry
aud
i
Suzu
ki
Jeep
Sales (thousands) 6087 5486 5448 3074 2207 2055 1392 1334 1163 621 368 255 158 141 106 94 80 67 63 36
Market share () 2002 1804 1792 1011 726 676 458 439 383 204 121 084 052 046 035 031 026 022 021 012
price (R$) $35017 $42259 $38701 $46174 $43447 $50112 $67078 $68922 $103001 $44035 $100696 $87009 $37654 $165111 $221943 $153281 $30821 $142799 $74769 $139039
No of cylinders 400 401 400 402 400 370 400 400 400 400 408 416 400 424 448 431 400 411 400 552
Displacement (cc) 1250 1340 1287 1497 1423 1495 1691 1808 1575 1579 2262 1856 1411 2095 2281 1934 1398 1912 1831 3182
Curb weight (kg) 1033 1060 1020 1156 1102 1122 1210 1201 1231 1069 1556 1377 1079 1624 1868 1598 1097 1551 1444 1945
Length (mm) 3965 4155 3993 4120 4127 4078 4319 4299 4116 4171 4401 4357 3956 4574 4487 4527 3896 4454 4234 4584
Footprint (m2) 345 370 354 368 378 383 397 387 376 379 395 407 351 429 433 429 349 417 323 420
Engine power ndash gasoline (kw) 64 71 65 79 73 86 96 90 80 82 120 112 83 151 179 138 71 136 94 162
Engine power ndash ethanol (kw) 65 72 65 79 76 85 97 90 81 82 107 106 95 mdash mdash mdash 75 mdash mdash mdash
pTwR ndash gasoline (kwkg)
00613 00662 00631 00674 00657 00739 00788 00745 00646 00766 00779 00792 00784 00921 00977 00856 00638 00870 00649 00835
pTwR ndash ethanol (kwkg) 00629 00681 00642 00693 00685 00781 00800 00795 00660 00768 00710 00798 00896 mdash mdash mdash 00659 mdash mdash mdash
49
ICCT white paper
Table C‑3 ndash Fleet characteristics of new Brazilian passenger vehicles by origin (2013)
parameters Domestic imported
Sales (thousands) 2537 504
Market share () 834 166
price (R$) $41739 $76049
No of cylinders 397 412
Displacement (cc) 1359 1791
Curb weight (kg) 1070 1289
Length (mm) 4063 4285
Footprint (m2) 362 390
Engine power ndash gasoline (kw) 70 102
Engine power ndash ethanol (kw) 73 84
pTwR ndash gasoline (kwkg) 0065 0076
pTwR ndash ethanol (kwkg) 0068 0074
50
Brazil Passenger Vehicle Market statistics
Table C‑4 ndash technology adoption in new Brazilian passenger vehicles by segment (2013)
Technology adoption Subcompact Compact Medium Large SportOff‑road SUV Minivan
Fuel type
Flex 982 988 982 837 00 134 826 00
Gasoline 18 12 17 163 996 540 174 1000
hybrid 0000 0000 0028 0000 0396 0001 0000 0000
Diesel 00 00 00 00 00 326 00 00
No of cylinders
Three 01 91 10 00 00 00 00 00
Four 999 909 990 998 758 775 979 833
Five 00 00 00 02 03 00 00 00
Six 00 00 00 00 175 211 21 167
Eight or more 00 00 00 00 63 13 00 00
Transmission
Manual 993 944 826 622 62 174 505 641
automatic 07 55 161 283 629 707 451 359
CVT 00 00 12 89 09 93 34 00
DCT 00 01 02 06 299 25 10 00
No of gear ratios
Four or fewer 04 47 72 51 00 34 247 193
Five 984 943 848 378 15 392 516 641
Six 12 09 73 515 796 462 225 167
Seven 00 01 06 23 87 53 12 00
Eight or more 00 00 01 32 102 59 00 00
Drivetrain
FwD 998 1000 997 688 550 00 916 1000
RwD 02 00 03 311 221 00 84 00
awD 00 00 00 01 229 1000 00 00
No of valves per cylinder
Two 806 694 584 195 00 00 258 00
Multi valve 194 306 416 805 1000 1000 742 1000
Valve camshaft configuration
Single overhead camshaft 839 786 709 309 00 212 375 00
Dual overhead camshaft 24 158 161 546 880 517 446 255
Valve actuation
Fixed 982 729 807 461 49 493 664 868
VVT 18 211 115 470 827 367 252 132
VVT+VVL 00 61 78 68 124 140 84 00
Fuel systems for gasoline vehicles
Multi‑point fuel injection 999 998 997 949 979 143 766 1000
Gasoline direct injection 01 02 03 51 21 857 234 00
air induction systems for gasoline vehicles
Naturally aspirated 999 997 995 943 974 369 543 1000
Supercharger turbocharger or twin‑turbo 01 03 05 57 26 631 457 00
51
ICCT white paper
Table C‑5 ndash technology adoption in new Brazilian passenger vehicles by manufacturer (2013)
Technology adoption Fi
aT
GM
VO
LKSw
aG
EN
FOR
D
REN
aU
LT
hY
UN
Da
i
hO
ND
a
TOYO
Ta
pSa
NiS
SaN
MiT
SUB
iSh
i
Kia
JaC
BM
w
LaN
D R
OV
ER
MER
CED
ES
Fuel type
Flex 990 987 965 966 997 921 999 886 928 998 283 739 31 42 00 00
Gasoline 10 09 35 34 03 79 01 35 72 02 557 255 969 957 663 950
hybrid 00 00 00 00 00 00 00 02 00 00 00 00 00 00 00 00
Diesel 00 04 00 00 00 00 00 77 00 00 160 06 00 00 337 50
No of cylinders
Three 00 00 05 00 00 348 00 00 00 00 00 00 00 00 00 00
Four 1000 996 994 989 1000 626 999 998 1000 1000 958 922 1000 906 787 878
Five 00 00 00 00 00 00 00 00 00 00 00 00 00 00 00 00
Six 00 02 01 11 00 26 01 02 00 00 42 78 00 68 185 87
Eight or more 00 02 00 00 00 00 00 00 00 00 00 00 00 26 28 35
Transmission
Manual 992 878 985 846 853 632 566 565 703 785 493 120 1000 02 00 151
automatic 08 103 00 137 62 285 355 160 297 121 118 793 00 575 18 14
CVT 00 19 15 16 41 70 01 246 00 00 139 87 00 423 982 836
DCT 00 00 00 00 43 13 78 30 00 94 251 00 00 00 00 00
No of gear ratios
Four or fewer 02 04 00 55 104 237 00 323 249 132 17 133 00 00 00 00
Five 981 811 963 839 797 623 861 643 684 828 530 107 1000 00 00 64
Six 17 185 29 106 99 140 139 07 67 40 453 754 00 217 800 00
Seven 00 00 07 00 00 00 00 27 00 00 00 00 00 08 00 936
Eight or more 00 00 00 00 00 00 00 00 00 00 00 06 00 775 200 00
Drivetrain
FwD 1000 902 989 972 987 985 990 892 1000 1000 496 623 1000 00 00 00
RwD 00 91 00 00 00 00 00 16 00 00 00 370 00 882 00 900
awD 00 06 11 28 13 15 10 92 00 00 504 07 00 118 1000 100
No of valves per cylinder
Two 811 864 988 745 220 00 00 00 00 00 00 00 00 00 00 00
Multi Valve 189 136 12 255 780 1000 1000 1000 1000 1000 1000 1000 1000 1000 1000 1000
Valve camshaft configuration
SOhC 836 755 914 675 832 00 04 00 497 398 331 00 00 00 00 00
DOhC 07 108 56 50 168 992 786 875 352 428 477 1000 907 810 860 453
Valve actuation
Fixed 1000 898 965 966 940 29 00 574 736 573 435 76 124 187 18 55
VVT 00 102 35 34 60 971 00 426 264 427 00 924 876 00 982 945
VVT+VVL 00 00 00 00 00 00 1000 00 00 00 565 00 00 813 00 00
air induction System
Naturally aspirated 997 994 966 977 997 988 1000 923 922 1000 835 936 1000 97 37 101
Supercharger turbocharger or twin‑turbo
03 06 34 23 03 12 00 77 78 00 165 64 00 903 963 899
Fuel systems for gasoline vehicles
Multipoint fuel injection 1000 995 965 972 1000 989 1000 1000 967 1000 994 1000 1000 78 15 158
Gasoline Direct injection 00 05 35 28 00 11 00 00 33 00 06 00 00 922 985 842
note Difference between 100 and summation of sohc and Dohc market share values corresponds to data not available
52
Brazil Passenger Vehicle Market statistics
AppENDix D DATA SOurCES AND COMpLETENESS
the basis of the statistics shown in this report is a database compiled by the icct with vehicle sales technical information (eg fleet characteristics technology content) and energy consumption (converted from either co2 emissions or fuel economy) from various data sources outlined in table D-1
Table D‑1 ndash Brazilian data sources
parameters Sales TechnicalEnergy
consumption
aDK (2014 2015) x x
MarkLines (2015) x
iBaMa (2014) x
iNMETRO (2014) x
UOL (2014) x
icarroscom (2014) x
this analysis examined energy consumption data from two public sources the nota Verde Program by the Brazilian institute of the environment and renewable natural resources (iBaMa) and the Brazilian Vehicle labeling Program (PBeV) by the national institute of Metrology standardization and industrial Quality (inMetro) table D-2 summarizes key differences between these two data sources
Table D‑2 ndash energy consumption data sources
iBaMa iNMETRO
program nota Verde1 Brazilian Vehicle labeling Program (PBeV)2
program description
Mandatory program that reports emissions of co2 co nox and nMhc as part of emissions certification program
Voluntary program since 2009 that allows the comparison of fuel economy across vehicle models
Unit gco2 km kml
Test cycle chassis testing under urban (FtP) driving cycle based on nBr 66012005
chassis testing under urban (FtP) and highway (hWYFe) driving cycles based on nBr 702420103
adjustment
no adjustment for real-world driving conditions Because reported co2 emissions are assumed to be zero for ethanol adjustments were made to account for tailpipe co2 emissions for vehicles running on ethanol
since 2010 published values include real-world adjustment factors to chassis test data a method adopted by the us ePa in 2008
Conversion to MJkm
iBaMarsquos data are reported as FtP (city test) co2 data in gco2 km conversion to caFe test cycle and to a different metric (Mjkm) involves four steps as presented in Figure D-1
inMetrorsquos data in kml are presented separately by fuel type (e22 e100) and driving cycle (urban highway) conversion to Mjkm was done by applying a conversion factor (2167 gco2 l for e22 and 1428gco2l for e00) caFe values are obtained by using a 5545 weighting for the urban (FtP) and highway cycles respectively
1 iBaMa (2014) nota Verde program available at httpwwwmmagovbrcidades-sustentaveisqualidade-do-arcontrole-de-emissoes-veicularesnota-verde
2 inMetro (2014) Programa Brasileiro de etiquetagem Veicular (PBeV) available at httpwwwinmetrogovbrconsumidortabelas_pbe_veicularasp
3 inMetro (2014) Metodologia Para Divulgaccedilatildeo De Dados De consumo Veicular available at httpwwwinmetrogovbrconsumidorpbeMetodologia_consumo_Veicularpdf
53
ICCT white paper
Step 1 Correcting the original IBAMA CO2 reported data ndash FTP CO2 gkm
IBAMArsquos CO2 reported values are corrected to account for tailpipe emissions from ethanol (tailpipe CO2 emissions are reported as zero in IBAMArsquos data)
bull E22 FTP reported CO2 data are reduced by 177bull E100 FTP reported CO2 data are reduced by 100
Flex fuel vehicles are tested with E22 and E00 the final values is calculated as the average of both fuelsCO2 IBAMA_Flex_FTP= 05(1-0177)CO2_E22_test_FTP + 050E100_FTP = 050823CO2_E22_FTPFor Gasoline only vehicles the tests are carried out only with Gasoline E22CO2 IBAMA_Gasoline_FTP = (1-0177) CO2_E22_Test_FTP
Where in the previous equations CO2_E22_FTP means CO2 emissions values obtained under FTP testingCO2 IBAMA_Flex_FTP means IBAMArsquos Corrected FTP values for flex vehiclesCO2 IBAMA_Gasoline_FTP means IBAMArsquos Corrected FTP values for gasoline only (E22) vehicles
INNOVAR AUTO is based on energy consumption data obtained as the combined CAFE test cycle This requires a weighted average of energy consumption data obtained from FTP testing (city driving ) and Highway fuel economy testing (HWFET) In mathematical form CAFE=f(FTPHWFET)
Given that IBAMA data is provided for only the first aprt the FTP testing then it is required to find a way to calculate CAFE combined values through FTP -75 only data A linear function was thus developed from data with FTP and HWY values (INMETRO data) is used to convert FTP only values to CAFE CO2 values ie CAFE=f(FTP) The function used for this conversion is
CO2_CAFE= (CO2_FTP+44756)11572
Step 2Convert FTP CO2 values to CAFE CO2 values
Converting CO2 values to MJkm values is done by using the energy density of E22 Note that all the previous calculations for CO2 come from E22-based data
bull The energy density of E22 is 2894 MJLE22bull E22 emits 2167gCO2LE22bull CAFE (MJkm) = CAFE (gCO2km) (2894 MJLE22 2167 gCO2LE22)
Step 3 Convert US CAFE CO2 values to MJkm values
Figure D‑1 ndash conversion of emission to energy consumption data
energy consumption values calculated from iBaMa and inMetro data differ greatly Figure D-1 illustrates energy consumption data for those models in both databases iBaMa data are on average 126 higher than inMetro data with a standard deviation of 89 and a maximum deviation of 39
54
Brazil Passenger Vehicle Market statistics
0
05
1
15
2
25
3
0 05 1 15 2 25 3
Ene
rgy
cons
ump
tio
n IB
AM
A (
MJ
km)
Energy consumption INMETRO (MJkm)
n=151
Figure D‑2 ndash comparison between energy consumption data from inMetro and iBaMa
151 vehicles tested under both programs
although inMetro data are more transparent as it breaks down fuel economy by fuel and test cycle it is still a voluntary program that allows manufacturers to select which models will participate in addition not all manufacturers participate in the program in turn iBaMa data only include co2 data for the urban cycle and thus energy consumption in the combined cycle had to be estimated from correlations using international data in addition corrections had to be made for gasoline-only engines since it seems that a co2 discount in theory only applicable to flex-fuel engines was also applied to gasoline-only engines Despite these data quality issues iBaMa data were considered the most adequate data source for energy consumption because it is a mandatory program that requires data reporting by all vehicle models and manufacturers
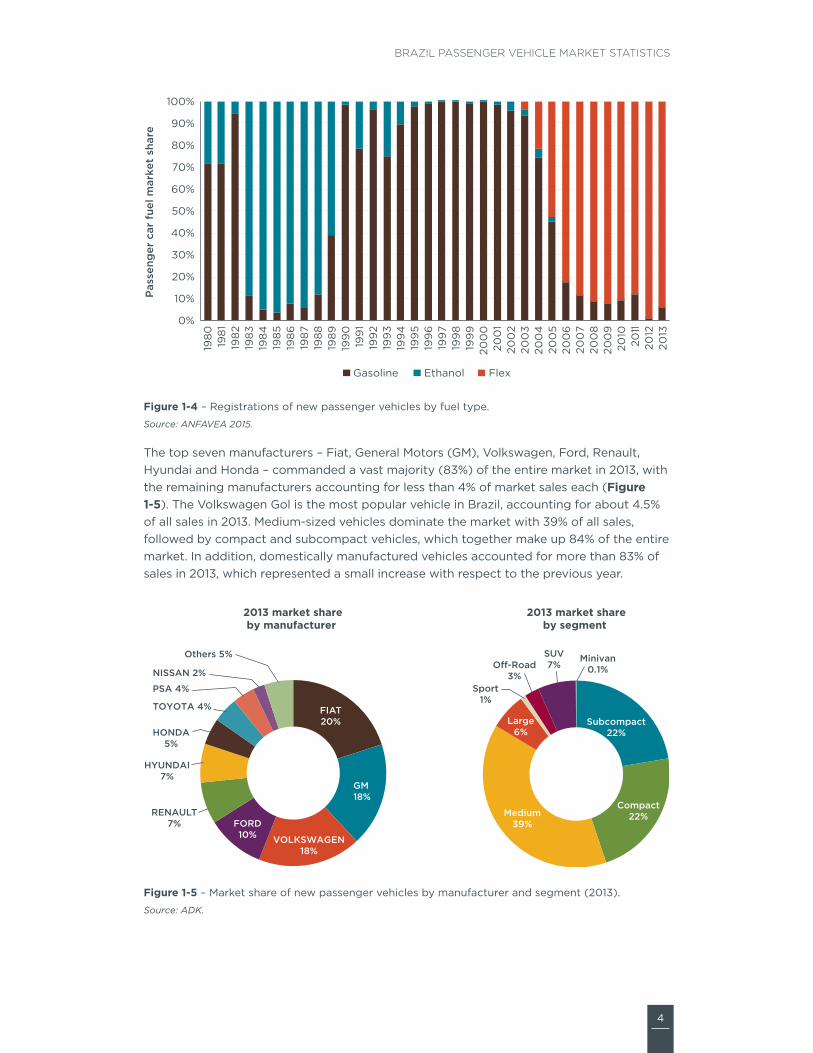
4
Brazil Passenger Vehicle Market statistics
0
10
20
30
40
50
60
70
80
90
100
198
019
81
198
219
83
198
419
85
198
619
87
198
819
89
199
019
91
199
219
93
199
419
95
199
619
97
199
819
99
200
020
01
200
220
03
200
420
05
200
620
07
200
820
09
2010
2011
2012
2013
Pas
seng
er c
ar f
uel m
arke
t sh
are
Gasoline Ethanol Flex
Figure 1‑4 ndash registrations of new passenger vehicles by fuel type
Source ANFAVEA 2015
the top seven manufacturers ndash Fiat general Motors (gM) Volkswagen Ford renault hyundai and honda ndash commanded a vast majority (83) of the entire market in 2013 with the remaining manufacturers accounting for less than 4 of market sales each (Figure 1‑5) the Volkswagen gol is the most popular vehicle in Brazil accounting for about 45 of all sales in 2013 Medium-sized vehicles dominate the market with 39 of all sales followed by compact and subcompact vehicles which together make up 84 of the entire market in addition domestically manufactured vehicles accounted for more than 83 of sales in 2013 which represented a small increase with respect to the previous year
FIAT20
GM18
VOLKSWAGEN18
FORD10
RENAULT7
HYUNDAI7
HONDA5
TOYOTA 4
PSA 4
NISSAN 2
Others 5
2013 market shareby manufacturer
Subcompact22
Compact22Medium
39
Large6
Sport1
O-Road3
SUV7
Minivan01
2013 market shareby segment
Figure 1‑5 ndash Market share of new passenger vehicles by manufacturer and segment (2013)
Source ADK
5
ICCT white paper
Table 1‑1 summarizes key indicators for the Brazilian passenger vehicle market in 2012 and 2013 Fiat remained the market leader in 2013 although with a small loss and gM overtook Volkswagen in 2013 amongst the companies that gained the most market share are hyundai and toyota both of which doubled their market share between 2012 and 2013 on the other hand Psa and nissan lost market shares in this period the market dominance of medium-sized vehicles in 2013 marks a significant shift in consumer preferences Between 2012 and 2013 the subcompact segment lost the majority share (from 33 to 22) and the larger compact and medium segments gained sizable shares
Table 1‑1 ndash Market characteristics of new Brazilian passenger vehicles
parameter 2012 2013
Sales (million) 311 304
price (R$) $47203 $47446
Domestic market share 800 834
Engine 10 L share 386 363
Fuel share
Flex 914 936
Gasoline 82 59
hybrid 0004 0014
Diesel 04 05
Segment market share
Subcompact 332 223
Compact 162 225
Medium 335 388
Large 79 63
Sport 07 09
Off‑road 23 25
SUV 61 66
Minivan 01 01
Manufacturer market share
Fiat 221 200
GM 176 180
Volkswagen 211 179
Ford 96 101
Renault 73 73
hyundai 32 68
honda 43 46
Toyota 24 44
pSa 44 38
Nissan 28 20
Mitsubishi 13 12
Kia 11 08
JaC 06 05
BMw 03 05
Land Rover 03 03
Mercedes‑Benz 02 03
Others 02 14
sales-weighted average
6
Brazil Passenger Vehicle Market statistics
2 vEhiCLE fLEET ChArACTEriSTiCS
this chapter provides an overview of key vehicle fleet characteristics in Brazil number of cylinders engine displacement curb weight1 length footprint2 engine power and power-to-weight ratio (PtWr)3 are relevant indicators to characterize a vehicle fleet and understand individual vehicle and fleet-average energy consumption4
these key characteristics of passenger vehicles in Brazil experienced a small change in 2013 compared to 2012 (Table 2‑1) With the exception of number of cylinders all parameters increased in 2013 consistent with a trend of increasing market shares for larger and more powerful vehicles the evaluation of minimum and maximum parameters also provides important insights While the smallest vehicles continue to be sold in Brazil (since the minimum values did not change with the exception of footprint) it is evident that much larger vehicles started being sold in 2013 represented by the large variation in the maximum values of each parameter Because sales of these recently introduced larger vehicles are relatively small their effect on weighted average parameters is also modest
Figure 2‑1 illustrates key vehicle fleet characteristics by vehicle segment (see appendix a for segment definition) not surprisingly most parameters get larger between the subcompact and large segments off-road vehicles sports cars and minivans tend to be the largest and most powerful vehicles across the fleet while sport utility vehicles (suVs) tend to be comparable with vehicles in the ldquolargerdquo segment Because of their high performance (absolute and relative to vehicle size) sports cars have significantly larger engine power and PtWr compared to all other segments sports vehicles primarily imported are not sold in a flex-fuel configuration and consume strictly gasoline Flex-fuel vehicles have slightly higher engine power and PtWr than their gasoline counterparts in most segments Detailed sales-weighted average data by segment are presented in Table C‑1 in appendix c
1 Based on norm aBnt nBr iso 1176 2006 curb weight is the total weight of a vehicle with standard equipment all necessary operating consumables (eg motor oil and coolant) a full tank of fuel but not loaded with passengers or cargo
2 Footprint (m2) is the product of the distance between the axles of a vehicle (wheelbase) and the distance between the centerline of the tires (average trackwidth)
3 Power to weight ratio (PtWr) is defined as the rated power of the engine (kW) divided by the vehicle weight (kg) PtWr is a metric that describes vehicle acceleration and handling and it is thus used in Brazil as a criterion to classify sports vehicles (PtWr gt 0075 kWkg)
4 Vehicle energy consumption is presented in megajoules per kilometer (Mjkm) for consistency with the vehicle energy consumption targets established by inovar-auto although e27 is currently being used flex-fuel vehicles are tested with e22 fuel
7
ICCT white paper
Table 2‑1 ndash Fleet characteristics of new Brazilian passenger vehicles
Vehicle characteristic 2012 2013 Variation
Number of cylinders weighted average 402 400 ‑06
Displacement (cc)
Min 970 970
Max 6498 6749
weighted average 1418 1430 08
Curb weight (kg)
Min 800 800
Max 2940 2710
weighted average 1102 1106 04
Length (mm)
Min 2695 2695
Max 5290 5842
weighted average 4089 4100 03
Footprint (m2)
Min 217 241
Max 523 874
weighted average 364 367 09
Engine power ndash gasoline (kw)
Min 33 33
Max 153 545
weighted average 743 757 18
Engine power ndash ethanol (kw)
49 49
Max 114 153
weighted average 715 740 34
pTwR ‑ gasoline (kwkg)
00455 00455
Max 04482 03344
weighted average 00658 00671 20
pTwR ‑ ethanol (kwkg)
00476 00477
Max 00935 01033
weighted average 00667 00683 24
Energy consumption ndash US CaFE (MJkm) na 202
8
Brazil Passenger Vehicle Market statistics
0
500
1000
1500
2000
2500
3000
Subco
mpac
t
Compac
t
Medium
Larg
eSport
O-road SUV
Miniva
n
Fleet-a
vera
ge
Dis
pla
cem
ent
(cc)
0200400600800
10001200140016001800
2000
Subco
mpac
t
Compac
t
Medium
Larg
eSport
O-road SUV
Miniva
n
Fleet-a
vera
ge
Cur
b w
eig
ht (
kg)
0500
10001500
2000250030003500400045005000
Subco
mpac
t
Compac
t
Medium
Larg
eSport
O-road SUV
Miniva
n
Fleet-a
vera
ge
Leng
th (
mm
)
000050100150
200250300350400450
Subco
mpac
t
Compac
t
Medium
Larg
eSport
O-road SUV
Miniva
n
Fleet-a
vera
ge
Fo
otp
rint
(m
2 )
020406080
100120140160180
200
Subco
mpac
t
Compac
t
Medium
Larg
eSport
O-road SUV
Miniva
n
Fleet-a
vera
ge
Po
wer
(kW
)
Gasoline EthanolGasoline and Ethanol
000
002
004
006
008
010
012
014
Subco
mpac
t
Compac
t
Medium
Larg
eSport
O-road
SUV
Miniva
n
Fleet-a
vera
gePo
wer
-to
-wei
ght
rat
io (
kWk
g)
Figure 2‑1 ndash Fleet characteristics of new Brazilian passenger vehicles by segment (2013)
Fleet characteristics for the top 20 vehicle manufacturers responsible for more than 99 of passenger vehicle sales in 2013 are presented in Figure 2‑2 the four top-selling manufacturers (Fiat gM Volkswagen and Ford) produce on average lighter vehicles with smaller and less powerful engines average engine rated power is below 80 kW for the 10 largest manufacturers except for toyota and honda since each has a large share of off-road and suV sales respectively luxury manufacturers and off-road dominant manufacturers (jeep and Mitsubishi) show the largest values of engine power PtWr values seem evenly distributed below 0070 kWkg across the five largest manufacturers plus Psa and chery and climb following the power trend for luxury and off-road oriented manufacturers Most vehicles are rated with higher engine power and PtWr under ethanol (e100) than under gasoline (e22) Detailed sales-weighted average data by manufacturer are presented in Table C‑2 in appendix c
9
ICCT white paper
Gasoline Ethanol
0
500
1000
1500
2000
2500
3000
3500
Fiat GM
Volkswag
enFord
Renau
lt
Hyund
ai
Honda
Toyo
taPSA
Nissan
Mitsub
ishiKIA
JACBMW
Land
Rove
r
Merce
des-B
enz
Chery
Audi
Suzuk
iJe
ep
Fleet-a
vera
geFiat GM
Volkswag
enFord
Renau
lt
Hyund
ai
Honda
Toyo
taPSA
Nissan
Mitsub
ishiKIA
JACBMW
Land
Rove
r
Merce
des-B
enz
Chery
Audi
Suzuk
iJe
ep
Fleet-a
vera
ge
Dis
pla
cem
ent
(cc)
0200400600800
10001200140016001800
2000
Cur
b w
eig
ht (
kg)
Fiat GM
Volkswag
enFord
Renau
lt
Hyund
ai
Honda
Toyo
taPSA
Nissan
Mitsub
ishiKIA
JACBMW
Land
Rove
r
Merce
des-B
enz
Chery
Audi
Suzuk
iJe
ep
Fleet-a
vera
geFiat GM
Volkswag
enFord
Renau
lt
Hyund
ai
Honda
Toyo
taPSA
Nissan
Mitsub
ishiKIA
JACBMW
Land
Rove
r
Merce
des-B
enz
Chery
Audi
Suzuk
iJe
ep
Fleet-a
vera
ge000050100150
200250300350400450
Fo
otp
rint
(m
2 )
3400
3600
3800
4000
4200
4400
4600
4800
Leng
th (
mm
)
Fiat GM
Volkswag
enFord
Renau
lt
Hyund
ai
Honda
Toyo
taPSA
Nissan
Mitsub
ishiKIA
JACBMW
Land
Rove
r
Merce
des-B
enz
Chery
Audi
Suzuk
iJe
ep
Fleet-a
vera
geFiat GM
Volkswag
enFord
Renau
lt
Hyund
ai
Honda
Toyo
taPSA
Nissan
Mitsub
ishiKIA
JACBMW
Land
Rove
r
Merce
des-B
enz
Chery
Audi
Suzuk
iJe
ep
Fleet-a
vera
ge0
20406080
100120140160180
200
Po
wer
(kw
)
00000010002000300040005000600070008000900100
Po
wer
-to
-wei
ght
rat
io (
kWk
g)
Gasoline and Ethanol
Figure 2‑2 ndash Fleet characteristics of new Brazilian passenger vehicles by manufacturer (2013)
Manufacturers are organized by total sales in descending order
Figure 2‑3 illustrates vehicle fleet characteristics for domestic and imported vehicles in general imported vehicles are bigger and heavier than those nationally produced the most remarkable contrast lies on engine power and PtWr imported vehicles are more powerful and have higher PtWr but while domestic vehicles exhibit higher engine power and PtWr for ethanol than for gasoline the opposite occurs for imported ones a closer examination of available data on engine compression ratios shows that domestic producers are leveraging ethanolrsquos higher octane rating and designing flex-fuel engines with much higher compression ratios (~1251) than gasoline-only engines (around 1051)5 this confirms the special engine designcalibration for operation with high ethanol gasoline blends from manufacturers with local production Detailed sales-weighted average data by origin are presented in Table C‑3 in appendix c
5 More information on the effect of ethanol on vehicle design characteristics can be found in stein et al (2013)
10
Brazil Passenger Vehicle Market statistics
Gasoline Ethanol
0
200
400
600
800
1000
1200
1400
1600
1800
2000
Domestic Imported Fleet-average
Dis
pla
cem
ent
(cc)
0
200
400
600
800
1000
1200
1400
Domestic Imported Fleet-average
Cur
b w
eig
ht (
kg)
345
350
355
360
365
370
375
380
385
390
395
Domestic Imported Fleet-average
Fo
otp
rint
(m
2 )
3950
4000
4050
4100
4150
4200
4250
4300
4350
Domestic Imported Fleet-average
Leng
th (
mm
)
0
20
40
60
80
100
120
Domestic Imported Fleet-average
Po
wer
(kW
)
0050
0055
0060
0065
0070
0075
0080
Domestic Imported Fleet-average
Po
wer
-to
-wei
ght
rat
io (
kWk
g)
Gasoline and Ethanol
Figure 2‑3 ndash Fleet characteristics of new Brazilian passenger vehicles by origin (2013)
Figure 2‑4 compares Brazilrsquos passenger vehicle fleet with those in china the us eu japan india and south Korea For the energy consumption comparison this analysis considers the us corporate average fuel economy (caFe) test cycle6 average engine displacement curb weight footprint and engine power in Brazil are the smallest with the exception of india (and japan in the case of engine displacement) With respect to PtWr the average Brazilian passenger car breaks the trend set by the power category ie Brazilian cars are less powerful than those in china japan and eu due to their lower average weight which drives the PtWr value above chinese japanese and european cars this suggests that the average Brazilian cars share the driving performance characteristics (eg acceleration times) of the us and Korean vehicles despite their relative smaller engines Detailed international data are presented in appendix B
6 Details on icctrsquos methodology for comparing new vehicle fuel efficiency can be found at the global PV standards section in the icctrsquos website httpwwwtheicctorginfo-toolsglobal-passenger-vehicle-standards
11
ICCT white paper
Despite having the smallest lightest and least powerful vehicles on average (with the exception of india) Brazilrsquos average energy consumption ranks fourth amongst the markets analyzed in this study the japanese fleet had the lowest energy consumption given the small and light vehicle characteristics of japanese cars and their relatively higher adoption of efficiency technologies (eg hybrids) followed by the eu (medium sizeweight fleet with high technology penetration) and india (smaller and lighter fleet overall) the us has the highest energy consumption on average due to the fleetrsquos larger size weight and power requirements china and south Korea trail the us as the most energy-consuming fleet and these countries have fleets with large and heavy vehicles but relatively lower penetration of efficiency technologies a detailed evaluation of energy consumption in Brazil and other markets is presented in chapter 4
0
500
1000
1500
2000
2500
3000
US S Korea EU China Brazil Japan India
Dis
pla
cem
ent
(cc)
0
200
400
600
800
1000
1200
1400
1600
1800
US S Korea EU China Japan Brazil India
Cur
b w
eig
ht (
kg)
000
050
100
150
200
250
300
350
400
450
US S Korea EU China Japan Brazil India
Fo
otp
rint
(m
2)
0
20
40
60
80
100
120
140
160
US S Korea EU China Japan Brazil India
Po
wer
(kW
)
00000
00100
00200
00300
00400
00500
00600
00700
00800
00900
01000
US S Korea Brazil China Japan EU India
Po
wer
-to
-wei
ght
rat
io (
kWk
g)
100
120
140
160
180
200
220
240
260
US China S Korea Brazil India Japan EU
Ene
rgy
cons
ump
tio
n ndash
US
CA
FE
(M
Jkm
)
Figure 2‑4 ndash international comparison of key new passenger vehicle characteristics
12
Brazil Passenger Vehicle Market statistics
3 vEhiCLE TEChNOLOGy ADOpTiON
this chapter provides an overview of current technology adoption including fuel engine and transmission technologies that affect vehicle energy consumption the type and complexity of technologies vary across vehicle segments to a large extent this is a function of vehicle size and weight and its intended performance and ultimately cost Fleet-average parameters presented in Table 3‑1 correspond to sales-weighted fleet-average values this chapter is divided by technology type with supporting information in appendix c an international comparison for each technology is also presented in this chapter the data for this technology adoption analysis came from a diversity of sources listed in appendix D also note that for comparisons at the international level it was required to use information from different years the most recent according to data availability
Table 3‑1 ndash technology adoption in new Brazilian passenger vehicles
Year 2012 2013
Fuel type
Flex 914 936
Gasoline 82 59
hybrid 0004 0014
Diesel 04 049
No of cylinders
Three 03 25
Four 986 966
Five 00 00
Six 09 08
Eight or more 01 01
Transmission
Manual 870 833
automatic 112 147
CVT 14 15
DCT 04 05
No of gear ratios
Four or fewer 61 59
Five 849 831
Six 84 98
Seven 03 07
Eight or more 02 05
Drivetrain
FwD 950 944
RwD 27 29
4wD and awD 23 27
No of valves per cylinder
Two 664 596
Multi valve 336 404
Valve camshaft configuration
Single overhead camshaft 696 630
Dual overhead camshaft 176 245
Valve actuation
Fixed 822 783
VVT 124 159
VVT+VVL 54 58
Fuel systems for gasoline vehicles
Multi‑point fuel injection 982 976
Gasoline direct injection 18 24
air induction systems for gasoline vehicles
Naturally aspirated 984 973
Supercharger turbocharger or twin‑turbo 16 27
13
ICCT white paper
FUEL TYpEFlex-fuel vehicles (FFVs) are designed to run on gasoline (e22) ethanol (e100) or any combination of both fuels except for a few engine and fuel system modifications FFVs are identical to gasoline-only models7 FFVs experience no loss in performance when operating on e100 however since ethanol contains less energy per volume than gasoline FFVs typically get about 25 fewer kilometers per liter when fuelled with e100
Flex-fuel is the dominant technology across all vehicle segments with the exception of sports cars off-road vehicles and minivans (Figure 3‑1) all top 10 manufacturers produce primarily flex-fuel engines and those manufacturers with a larger share of gasoline and diesel engines typically import most of their vehicles (Figure 3‑2) the predominance of FFVs responsible for almost 94 of vehicle sales in 2013 is unique to Brazil (Figure 3‑3)
hybrid-gasoline vehicles achieve reduced fuel consumption by incorporating in the drivetrain a battery and an electric motor in addition to an internal combustion (ic) engine this technology permits the ic engine to shut down when the vehicle is decelerating and is stopped braking energy to be recovered and the ic engine to be downsized and operated at more efficient operating points Depending on the level of complexity hybrid systems can achieve 15 to 35 reductions in fuel consumption with respect to similar-sized vehicles
Despite having very limited penetration sales of new hybrid vehicles have increased three-fold from 131 units in 2012 to 432 in 2013 primarily in the medium and sports segments two manufacturers sell the most gasoline hybrid models (not flex-fuel) in Brazil including the toyota Prius and the Ford Fusion hybrid
Diesel engines offer 20 to 25 reduction in fuel consumption over traditional gasoline multi-point fuel injection (MPFi) engines due to higher compression ratios reduced pumping losses and 12 higher energy content per liter of fuel the challenge for further commercialization is twofold the complexity and additional cost of advanced exhaust after-treatment technologies that reduce emissions of particulate matter and oxides of nitrogen to levels comparable to those of gasoline and FFV engines
sales of diesel passenger vehicles are not allowed in Brazil with the exception of vehicles with some off-road characteristics Despite having a small penetration (around 05) sales of diesel passenger vehicles increased by 16 in 2013 toyota sells the most diesel passenger vehicles followed by Mitsubishi land rover gM and Mercedes-Benz the light-duty diesel market in Brazil is equivalent to the us and china in terms of market penetration and much below the penetration in europe and south Korea although air quality concerns in europe might trigger lower sales of diesel vehicles in coming years
7 Most of the modifications with respect to a gasoline-only vehicle (e00) include changes to fuel systemrsquos materials that are compatible with the oxygen content of ethanol blends and changes to air and fuel ratio management systems (mainly software based)
14
Brazil Passenger Vehicle Market statistics
0
10
20
30
40
50
60
70
80
90
100
Subco
mpac
t
Compac
t
Medium
Larg
eSport
O-Road SUV
Miniva
nTo
tal
Mar
ket
shar
e
Diesel Hybrid Gasoline Flex
Figure 3‑1 ndash Fuel type by segment
0102030405060708090
100
Fiat GM
Volkswag
enFord
Renau
lt
Hyund
ai
Honda
Toyo
taPSA
Nissan
Mitsub
ishi
KIAJA
CBMW
Land
Rove
r
Merce
des-B
enz
Chery
Audi
Suzuk
iJe
epTo
tal
Tech
nolo
gy
shar
e
Diesel Hybrid Gasoline Flex
Figure 3‑2 ndash Fuel type by manufacturer
0
10
20
30
40
50
60
70
80
90
100
China2010
Korea2011
EU-272013
US2013
Japan2011
India2012
Brazil2013
Tech
nolo
gy
shar
e
Diesel Hybrid Gasoline CNGLPGFlex
Figure 3‑3 ndash Fuel type international comparison
15
ICCT white paper
NUMBER OF CYLiNDERSacross all vehicle markets 4-cylinder engines are the most common design in automobile engines with displacements below 25 liters this engine configuration presents the right balance between complexity and performance for the target vehicle segments (small to mid-size sedans suVs and some off-road vehicles) engines with six and more cylinders are designed to provide a smoother vehicle driving experience with lower vibration and noise than 4-cylinder engines can provide and with higher power output this better overall performance comes at a higher cost driving their widespread use in large and luxury vehicles and heavier suVs and off-road vehicles
the need to attain better energy consumption has resulted in a recent wave of 3-cylinder engines from a handful of manufacturers in vehicles that typically used 4-cylinder engines achieving similar or better performance this practice is known as engine downsizing Downsizing can also be applied to larger engines from V-8s to V-6s and from V-6s to i-4s in most cases engine downsizing is accompanied with turbocharging and changes to the fuel delivery system
Four-cylinder engines dominate the passenger vehicle market in Brazil and are sold in more than 90 of new vehicles among all segments except the sports off-road and minivan segments (Figure 3‑4) Despite its predominance sales of 4-cylinder engines fell from over 307 to 293 million units between 2012 and 2013 equivalent to a 4 reduction 4-cylinder vehicles represent the majority of sales among the 20 top manufacturers except for hyundai and jeep (Figure 3‑5) although 4-cylinder engines represent the dominant technology in all countries analyzed Brazil still has the largest market share (Figure 3‑6)
the most significant shift in market preferences in Brazil occurred with 3-cylinder engines this technology is becoming more popular with almost eight times more vehicles sold in 2013 compared to 2012 reaching almost 75000 units in 2013 almost all 3-cylinder engines are being sold as compact vehicles instead of the smaller subcompact segment hyundai is the technology leader in sales of 3-cylinder high-efficiency Kappa engines8 japan and india have relatively high penetration of 3-cylinder engine technology in india the popularity of 2- and 3-cylinder vehicles is primarily driven by lower price tags (lt usD $8000)
six-cylinder engines are third in sales after 4- and 3-cylinder engines with absolute numbers close to 25000 units sold in 2013 its market share reduced by 13 with respect to 2012 six-plus cylinder engines are being sold mostly in the sports off-road and minivan segments Manufacturers that cater to the most expensive models and segments dominate the market of vehicles with six-plus cylinder engines such as land rover BMW and Mercedes-Benz the penetration of 6-plus-cylinder engines in Brazil is very low compared to other countries
Five-cylinder engines are not very common in Brazil or other countries and are losing market with respect to 2012 sales by 56 Volkswagen audi and Volvo are the only manufacturers that offered 5-cylinder engines in Brazil in 2013
8 hyundairsquos 3-cylinder Kappa engine httpworldwidehyundaicomWWshowroomcarshB20PiPindexhtml
16
Brazil Passenger Vehicle Market statistics
0
10
20
30
40
50
60
70
80
90
100
Subco
mpac
t
Compac
t
Medium
Larg
eSport
O-Road SUV
Miniva
nTo
tal
Tech
nolo
gy
shar
e
8+ 6 5 4 3
Figure 3‑4 ndash number of cylinders by segment
0102030405060708090
100
Fiat GM
Volkswag
enFord
Renau
lt
Hyund
ai
Honda
Toyo
taPSA
Nissan
Mitsub
ishi
KIAJA
CBMW
Land
Rove
r
Merce
des-B
enz
Chery
Audi
Suzuk
iJe
epTo
tal
Tech
nolo
gy
shar
e
8+ 6 5 4 3
Figure 3‑5 ndash number of cylinders by manufacturer
0
10
20
30
40
50
60
70
80
90
100
China2010
Korea2011
EU-272013
US2013
Japan2011
India2012
Brazil2013
Tec
hno
log
y sh
are
8+ 6 5 4 3 2
Figure 3‑6 ndash number of cylinders international comparison
17
ICCT white paper
TRaNSMiSSiONtransmission technologies can reduce energy consumption in two ways First by allowing engine operation on a more efficient region of the engine map and second by reducing the mechanical losses within transmissions traditionally manual transmissions have offered better energy consumption than traditional automatic transmissions (with 4 or 5 speeds) due to lower friction losses however new generation of automatic transmissions with higher number of gears lower friction better materials and computer-controlled shift points have not just closed the gap between manual and automatic transmission performance but even exceed manual transmission performance
new technologies such as dual-clutch transmissions (Dcts) and continually variable transmissions (cVts) are gaining market share due to the need for lower vehicle energy consumption Dcts can be defined as manual transmissions with electro-hydraulically operated dual-clutch systems allowing for faster shifting times and selective automatic or ldquomanualrdquo operation as opposed to manual automatic and Dct transmissions which have a discrete number of gear ratios cVts have a theoretically infinite choice of ratios between fixed limits which allows engines to be further optimized for minimizing energy consumption cVt technology has been used in lower-horsepower vehicles because of maximum-torque limitations with the most common metal-belt design (nas 2011) these advanced transmission technologies offer significant benefits in energy consumption compared to traditional manual or automatic technologies according to the us national academy of sciences a 6-speed Dct provides 6 to 9 lower energy consumption than a 4-speed automatic transmission note that a traditional 6-speed automatic transmission provides an estimated 3 to 5 benefit the energy consumption benefit of cVt depends on the application and is estimated to be 1 to 7 (nas 2011)
although vehicle sales with manual transmissions are predominant in Brazil the penetration of automatic transmissions cVts and Dcts is increasing resulting in a market share loss for manual transmissions of about 6 between 2012 and 2013 (Table 3‑1) With the exception of sports and off-road segments manual transmission technology has the largest market share in all segments but it tends to become less predominant as vehicles grow in size and comfort level (Figure 3‑7) the top five manufacturers sell most of their vehicles with manual transmissions but their market share is somewhat smaller for other high-selling manufacturers that cater to a more affluent market (Figures 3‑8)
automatic transmissions are becoming increasingly popular in Brazil experiencing an increase of 28 in sales between 2012 and 2013 automatic transmissions dominate the sports and off-road segments Kia BMW land rover Mercedes-Benz and jeep adopt this type of transmission technology for most of their vehicle sales
Dct transmissions are entering the Brazilian market mostly through the sports segment via imported models the sales of Dct equipped vehicles increased in 2013 by 22 with respect to 2012 Dct technology is being offered mainly by manufacturers that sell sports vehicles such as audi in more than 67 of their vehicles and Mercedes-Benz in more than 15 of their vehicles the global leader in Dct adoption is europe followed by the us (Figure 3‑9)
cVt technology market is still relatively small being sold by small volume manufacturers like jeep audi and Mitsubishi with more than 25 of new vehicle sales each nissan renault honda and toyota also sell vehicles with cVt technology cVt penetration in Brazil is similar to europersquos cVt is the leading transmission technology in japan with more than 65 of the market
18
Brazil Passenger Vehicle Market statistics
0
10
20
30
40
50
60
70
80
90
100
Subco
mpac
t
Compac
t
Medium
Larg
eSport
O-Road SUV
Miniva
nTo
tal
Tech
nolo
gy
shar
e
DCT CVT Automatic Manual
Figure 3‑7 ndash transmission by segment
0
10
20
30
40
50
60
70
80
90
100
Fiat GM
Volkswag
enFord
Renau
lt
Hyund
ai
Honda
Toyo
taPSA
Nissan
Mitsub
ishi
KIAJA
CBMW
Land
Rove
r
Merce
des-B
enz
Chery
Audi
Suzuk
iJe
epTo
tal
Tech
nolo
gy
shar
e
DCT CVT Automatic Manual
Figure 3‑8 ndash transmission by manufacturer
0
10
20
30
40
50
60
70
80
90
100
China2010
Korea2011
EU-272013
US2013
Japan2011
India2012
Brazil2013
Tech
nolo
gy
shar
e
DCT CVT Automatic Manual
Figure 3‑9 ndash transmission international comparison
19
ICCT white paper
NUMBER OF GEaR RaTiOS as mentioned in the previous section increasing the number of gear ratios (whether manual automatic dual-clutch or continuously variable) allows the engine to be operated in the best efficiency region resulting in energy consumption benefits compared to an automatic four-gear ratio transmission (also known as 4-speed transmission) higher ratio automatic transmissions could reduce energy consumption from 2 to 3 (for a five-gear ratio) to 6 to 8 (for an eight-gear ratio) (ePanhtsa 2010)
Four-gear ratio transmissions are losing market share in Brazil by more than 5 between 2012 and 2013 (Table 3‑1) these transmissions are particularly high sellers in the suV and minivan segments which suggest that some models in these more expensive segments are being sold with outdated technologies (Figure 3‑10) Most manufacturers are phasing out this type of transmission (Figure 3‑11) although jeep suzuki and toyota are lagging behind other manufacturers the four-gear ratio transmission technology has been losing market share in most countries even in india where smaller and inexpensive cars dominate the market 4-speed transmissions have the smallest market share (Figure 3‑12)
Five- and six-gear ratio transmissions were predominant in the Brazilian market in 2013 Five-gear ratio transmissions are dominant in all segments except for the off-road and sports segments which have adopted six-gear ratio transmissions in most sales the significant market share of five- and six-gear ratio transmissions is similar to most countries although the us europe and south Korea show higher shares of six and more gear ratios
seven- and eight-gear ratio transmissions which are considered emerging technologies have experienced an increase in sales in Brazil with over twice as many sales in 2013 compared to 2012 seven- and eight-gear ratio transmissions are popular among the large sports and off-road segments all of which are imported models luxury manufacturers such as Mercedes-Benz and audi are selling the most seven-gear vehicles as a share of their sales Volkswagen and toyota are also selling similar numbers of seven-gear ratio vehicles although for Volkswagen and toyota it represented less than 3 of their brand sales BMW and land rover are the leaders in eight-gear ratio vehicles
20
Brazil Passenger Vehicle Market statistics
0
10
20
30
40
50
60
70
80
90
100
Subco
mpac
t
Compac
t
Medium
Larg
eSport
O-Road
SUV
Miniva
nTo
tal
Tech
nolo
gy
shar
e
8 7 6 5 4
Figure 3‑10 ndash number of gear ratios by segment
0
10
20
30
40
50
60
70
80
90
100
Fiat GM
Volkswag
enFord
Renau
lt
Hyund
ai
Honda
Toyo
taPSA
Nissan
Mitsub
ishi
KIAJA
CBMW
Land
Rove
r
Merce
des-B
enz
Chery
Audi
Suzuk
iJe
epTo
tal
Tech
nolo
gy
shar
e
8 7 6 5 4
Figure 3‑11 ndash number of gear ratios by manufacturer
0
10
20
30
40
50
60
70
80
90
100
Tech
nolo
gy
shar
e
Six or more Five Four or fewer
China2010
Korea2011
EU-272013
US2013
India2012
Brazil2013
Figure 3‑12 ndash number of gear ratios international comparison
21
ICCT white paper
DRiVETRaiNDrivetrain technology includes front-wheel drive (FWD) rear-wheel drive (rWD) and all-wheel drive (aWD) vehicles For the same vehicle size FWD vehicles provide more interior space and better energy consumption than rWDs due to lower weight as it avoids the added weight of and space for the driveshaft and differential that rWD requires Because the weight of the engine and transmission is located close to the wheels FWD vehicles have better traction than rWDs rWDs however show better handling as the weight distribution between the front and rear wheels is more uniform and the tasks of turning and acceleration are split between the front and rear wheels also directing large amounts of power through the front wheels can create ldquotorque steerrdquo thus rWD is the adequate technology for the sports segment aWD drivetrains are intended for specific driving applications that imply loss of traction such as off-road terrains snow or towing
FWD vehicles dominate all segments of the Brazilian passenger car market (Table 3‑1) with the exception of the off-road segment (Figure 3‑13) among the 20 largest manufacturer sellers most except for BMW land rover Mercedes-Benz and suzuki offer FWD technology (Figure 3‑14) Brazil has the highest market share of FWD vehicles of all countries analyzed (944) although FWD has at least 50 market share in all seven countries (Figure 3‑15)
aWD market share increased by 15 between 2012 and 2013 due to a tri-fold increase in the sports segment sales off-road vehicle sales with aWD also increased to more than 76000 units in 2013 amongst the largest ten manufacturers toyota is the aWD market leader followed by Ford and Volkswagen note that land rover sells only aWD vehicles in Brazil among non-luxury manufacturers Mitsubishi and suzuki are selling more than 50 of their vehicles with aWD technology
rWD technology is offered mostly in large and sports vehicles and in suVs among the 10 largest manufacturers rWD is offered mainly by gM and toyota while an extended examination of the 20 largest manufacturers by sales show that aWD and rWD is focused among the more expensive brands (Figure 3‑14) Mercedes-Benz and BMW sell close to 90 of their vehicles with rWD technology traditionally associated with engine performance and responsiveness
22
Brazil Passenger Vehicle Market statistics
0
10
20
30
40
50
60
70
80
90
100
Subco
mpac
t
Compac
t
Medium
Larg
eSport
O-Road SUV
Miniva
nTo
tal
Tehn
olo
gy
shar
e
AWD RWD FWD
Figure 3‑13 ndash Drivetrain by segment
0
10
20
30
40
50
60
70
80
90
100
Fiat GM
Volkswag
enFord
Renau
lt
Hyund
ai
Honda
Toyo
taPSA
Nissan
Mitsub
ishi
KIAJA
CBMW
Land
Rove
r
Merce
des-B
enz
Chery
Audi
Suzuk
iJe
epTo
tal
Tech
nolo
gy
shar
e
AWD RWD FWD
Figure 3‑14 ndash Drivetrain by manufacturer
0
10
20
30
40
50
60
70
80
90
100
China2010
Korea2011
EU-272013
US2013
Japan2011
India2012
Brazil2013
Tech
nolo
gy
shar
e
AWD RWD FWD
Figure 3‑15 ndash Drivetrain international comparison
23
ICCT white paper
VaLVE CaMShaFT CONFiGURaTiON (DOhC VS SOhC)the engine camshaft governs the timing duration and lift of valve operation controlling the intake of air and the exhaust of combustion gases this report focuses on single overhead camshafts (sohc) and dual overhead camshafts (Dohc) as these configurations have almost completely replaced the older overhead valve configuration (ohV) sohc design places a single camshaft above the cylinder head that governs all the valves intake and exhaust in the case of sohc V-engines there is one single camshaft per head Dohc designs use separate camshafts for intake valves and exhaust valves Dohc engines achieve increased airflow at high-engine speeds improve volumetric efficiency and reduce the valvetrainrsquos moving mass such engines typically develop higher power at high-engine speeds the us environmental Protection agency (ePa) and national highway traffic safety administration (nhtsa) estimate the effectiveness of Dohc over sohc to be between 1 and 25 (ePanhtsa 2010)
although Dohc produce more power and provide lower fuel consumption the Brazilian fleet is still mostly composed of sohcs vehicles (Table 3‑1) sohc technology is predominant among the subcompact compact and medium segments (Figure 3‑16) among manufacturers sohc technology is predominant among the five largest least expensive brands (Figure 3‑17) sales of vehicles with more advanced Dohc technology grew in 2013 by almost 36 with respect to 2012 albeit from a relatively smaller base this increase was experienced in all vehicle segments but in different magnitudes
although global data on this technology are scarce Figure 3‑18 indicates that most countries are moving away from sohc with Brazil being the only country analyzed where sohc is still predominant no data were available for the us or europe
24
Brazil Passenger Vehicle Market statistics
0
10
20
30
40
50
60
70
80
90
100
Subco
mpac
t
Compac
t
Medium
Larg
eSport
O-Road SUV
Miniva
nTo
tal
Tech
nolo
gy
shar
e
nd DOHC SOHC
Figure 3‑16 ndash Valve camshaft configuration by segment (nd no data)
0
10
20
30
40
50
60
70
80
90
100
Fiat GM
Volkswag
enFord
Renau
lt
Hyund
ai
Honda
Toyo
taPSA
Nissan
Mitsub
ishi
KIAJA
CBMW
Land
Rove
r
Merce
des-B
enz
Chery
Audi
Suzuk
iJe
epTo
tal
Tech
nolo
gy
shar
e
nd DOHC SOHC
Figure 3‑17 ndash Valve camshaft configuration by manufacturer (nd no data)
0
10
20
30
40
50
60
70
80
90
100
China2010
Korea2011
Japan2011
India2012
Brazil2013
Tech
nolo
gy
shar
e
nd OVC DOHC SOHC
Figure 3‑18 ndash Valve camshaft configuration international comparison (nd no data)
25
ICCT white paper
VaLVE aCTUaTiON improved valvetrain systems with variable valve actuation (VVa) technology either variable valve timing (VVt) or variable valve timing and lift (VVt+VVl) improves the enginersquos volumetric and thermodynamic efficiency they also enable further engine improvements such as internal exhaust gas recirculation and cylinder deactivation VVt alters the timing of the intake valve exhaust valve or both primarily to reduce pumping losses increase specific power and control residual exhaust gases VVl increases efficiency by optimizing airflow over a broader range of engine operation which reduces pumping losses and increases specific power VVl is accomplished by controlled switching between two or more cam profile lobe heights the most advanced technology VVt+VVl yields a wide range of performance optimization and volumetric efficiency including enabling the engine to be valve-throttled (no need for intake throttle) VVt provides energy consumption gains of 3 to 5 while the more flexible and complex VVt+VVl system can reach 4 to 8 (ePa amp nhtsa 2010)
VVa technology either VVt or VVt+VVl are emerging technologies in Brazil where most vehicles still have fixed-valve timing designs (Table 3‑1) Fixed technology is predominant among the smaller vehicle segments as well as suVs and minivans (Figure 3‑19) the five largest manufacturers sold more than 90 of their vehicles with fixed-valve technology in 2013 (Figure 3‑20) the international comparison indicates that only Brazil and india have not yet adopted VVa technologies for most of their light-duty fleet (Figure 3‑21)
VVt and VVt+VVl are being adopted across all segments including the subcompact segment but tend to be more predominant in high-end manufacturers a closer examination by manufacturer shows that most are offering some vehicles with either one of the VVa systems while honda and hyundai offer this technology in almost all vehicles (Figure 3‑20) honda is the technology leader in variable valve actuation with the adoption in the early 1990s of the Vtec system (Valve timing electronic control) VVt technologyrsquos market share grew by about 25 in 2013 primarily due to hyundairsquos sales from 80000 units in 2012 to almost 200000 units in 2013 hyundai offered the continuously variable valve technology (cVVt) in the large majority of vehicle sold in 2013 the sports segment is the one where VVt dominates the market Mitsubishi BMW and audi are also selling a large share of their vehicles with the VVt+VVl technology
26
Brazil Passenger Vehicle Market statistics
0
10
20
30
40
50
60
70
80
90
100
Subco
mpac
t
Compac
t
Medium
Larg
eSport
O-Road SUV
Miniva
nTo
tal
Tech
nolo
gy
shar
e
VVT+VVL VVT Fixed
Figure 3‑19 ndash Valve actuation by segment
0
10
20
30
40
50
60
70
80
90
100
Fiat GM
Volkswag
enFord
Renau
lt
Hyund
ai
Honda
Toyo
taPSA
Nissan
Mitsub
ishi
KIAJA
CBMW
Land
Rove
r
Merce
des-B
enz
Chery
Audi
Suzuk
iJe
epTo
tal
Tech
nolo
gy
shar
e
VVT+VVL VVT Fixed
Figure 3‑20 ndash Valve actuation by manufacturer
VVT+VVL VVT Fixed
0
10
20
30
40
50
60
70
80
90
100
China2010
Korea2011
US2013
Japan2011
India2012
Brazil2013
Tech
nolo
gy
shar
e
Figure 3‑21 ndash Valve actuation international comparison
27
ICCT white paper
FUEL SYSTEMS FOR GaSOLiNE VEhiCLESVehicle fuel systems describe the technology required to deliver fuel into the engine combustion chamber this section examines two gasolineflex technologies namely multi-point fuel injection (MPFi) and gasoline direct injection (gDi) MPFi is now the most common fuel-delivery system for gasoline engines used in passenger vehicles worldwide in sequential MPFi engines fuel is injected into the air stream next to the intake valve port while the intake valve is open to draw the air-fuel mixture into the cylinder some of the fuel is vaporized on the surface of the hot intake valve expanding and thus reduces the volumetric efficiency on gDi engines fuel is injected at high pressure directly into the combustion chamber improving volumetric efficiency and providing cooling of the airfuel charge within the cylinder which allows for higher compression ratios and increased thermodynamic efficiency gDi technology alone offers benefits of 2 to 5 with respect to MPFi engines but bigger benefits rely on the synergy between gDi turbocharging and downsizing which can reach 12 to 15 energy consumption reduction with respect to a MPFi naturally aspirated engine (ePa 2012)
Table 3‑1 illustrates that MPFi is still the most common fuel injection technology for gasolineflex vehicles in Brazil which is reflected in its dominant share across most segments except for sports and off-road vehicles in Brazil gDi has found a niche market in the sports and off-road segments with more than 90 of sport vehicles fitted with gDi technology (Figure 3‑22) Within the overall gasoline market the gDi technology is still an emerging technology representing just 24 of new sales gDirsquos market share increased by 31 in 2013 with all but 4000 units being imported among the 10 largest manufacturers the adoption of gDi is extremely low below 5 for Volkswagen Ford hyundai and Psa (Figure 3‑23) high-end european brands (audi land rover Mercedes-Benz and BMW) are the technology leaders in terms of gDi adoption rates echoing the trend of turbocharging technology sales Volkswagen vehicles with gDi systems account for less than 35 of their sales in 2013 but their absolute numbers (around 19000 vehicles) place the company as one of the leaders in gDi technology in the Brazilian market
From a global market perspective the penetration of gDi technology in Brazil is low compared to all other markets in Figure 3‑24 except for india and japan it should be noted that the later has the largest share of hybrid vehicles around the globe
28
Brazil Passenger Vehicle Market statistics
0
10
20
30
40
50
60
70
80
90
100
Compac
t
Subco
mpac
t
Medium
Larg
eSport
O-Road SUV
Miniva
nTo
tal
Tech
nolo
gy
shar
e
GDI MPFI
Figure 3‑22 ndash gasolineflex fuel system by segment
GDI MPFI
0102030405060708090
100
Fiat GM
Volkswag
enFord
Renau
lt
Hyund
ai
Honda
Toyo
taPSA
Nissan
Mitsub
ishi
KIAJA
CBMW
Land
Rove
r
Merce
des-B
enz
Chery
Audi
Suzuk
iJe
epTo
tal
Tech
nolo
gy
shar
e
Figure 3‑23 ndash gasolineflex fuel system by manufacturer
GDI MPFI
0
10
20
30
40
50
60
70
80
90
100
China2010
Korea2011
EU-272013
US2013
Japan2011
India2012
Brazil2013
Tech
nolo
gy
shar
e (n
on-
die
sel)
Figure 3‑24 ndash gasolineflex fuel system international comparison
29
ICCT white paper
TURBOChaRGiNGengine power is primarily limited by the rate at which the engine is able to draw air into the combustion chamber turbocharging and supercharging are two methods to increase the amount of air drawn into the engine above the level of what is possible with the naturally aspirated process (through the expansion of the cylinders) By increasing the amount of air into the engine the amount of fuel can be proportionally increased resulting in increased power output level and with it the ability to reduce engine displacement while maintaining performance the combination of turbocharging and downsizing in spark ignited (gasoline and flex-fuel) vehicles can provide energy consumption improvements between 2 to 6 with respect to a direct-injected gDi engine (ePa amp nhtsa 2010) turbocharging technology is the cornerstone for achieving better energy consumption in vehicles as the basis for downsizing and reducing the engine weight while keeping the same or better vehicle performance (ie acceleration or time to reach certain speed) although turbochargers are used in diesel and gasolineflex vehicles the analysis in this report focuses on turbocharging for spark-ignited gasolineflex vehicles only
turbocharging is one of the most important emerging technologies in Brazil where most vehicles are still naturally aspirated (na) (Table 3‑1) turbocharging technology has increased the market share significantly between 2012 and 2013 by more than 65 albeit from a small base (from about 49000 to 81000 vehicles)
Most vehicles with turbocharging are sold in the sports and off-road segments as this technology also produces superior engine power output (Figure 3‑25) among the 10 largest manufacturers turbocharging is still below 10 of their sales (Figure 3‑26) Volkswagen and Ford despite having small relative sales of vehicles with turbocharging (less than 35) are the manufacturers with the highest total sales of vehicles with turbocharging audi land rover Mercedes-Benz and BMW are the technology leaders with more than 90 of vehicle sales in 2013
the penetration of turbo and supercharging technologies in Brazil is lower than in other countries with a larger gasoline fleet such as the us china and japan (Figure 3‑27) in Brazil 95 of diesel passenger vehicle sales have turbocharging technology
30
Brazil Passenger Vehicle Market statistics
0
10
20
30
40
50
60
70
80
90
100
Compac
t
Subco
mpac
t
Medium
Larg
eSport
O-Road SUV
Miniva
nTo
tal
Tech
nolo
gy
shar
e (n
on-
Die
sel)
Turbo NA
Figure 3‑25 ndash turbocharging for gasolineflex fuel vehicles by segment (NA naturally aspirated)
0102030405060708090
100
Fiat GM
Volkswag
enFord
Renau
lt
Hyund
ai
Honda
Toyo
taPSA
Nissan
Mitsub
ishiKIA
JACBMW
Land
Rove
r
Merce
des-B
enz
Chery
Audi
Suzuk
iJe
epTo
tal
Tech
nolo
gy
shar
e (n
on-
Die
sel)
Turbo NA
Figure 3‑26 ndash turbocharging for gasolineflex fuel vehicles by manufacturer (NA naturally aspirated)
0
10
20
30
40
50
60
70
80
90
100
China2010
Korea2011
EU-272013
US2013
Japan2011
India2012
Brazil2013
Tech
nolo
gy
shar
e (n
on-
die
sel)
Turbo NA
Figure 3‑27 ndash turbocharging for gasolineflex fuel vehicles international comparison (NA naturally aspirated)
31
ICCT white paper
4 vEhiCLE ENErGy CONSuMpTiON
this section analyzes the Brazilian new passenger vehicle energy consumption in 2013 although other metrics are more common (see box) vehicle energy consumption is presented in megajoules per kilometer (Mjkm) for consistency with Brazilrsquos inovar-auto policy in 2012 Brazilrsquos Ministry of Development industry and Foreign trade (MDic) adopted the inovar-auto policy with the aim of fostering industrial competitiveness through technology investments the policy includes a target for corporate average energy consumption (in Mjkm with vehicle curb weight as the attribute parameter) for vehicles sold in 2017
in the us canada Mexico and saudi arabia fleet-average fuel economy standards are defined as a function of vehicle footprint in the eu china japan south Korea and india vehicle weight is the attribute for the calculation of fleet-average targets in Brazil inovar-auto has defined its fiscal targets for vehicle energy consumption measured in megajoules per kilometer (Mjkm) as a function of vehicle weight
VEhiCLE ENERGY MEaSUREMENT UNiTS
Many metrics can be used to describe the amount of fuel energy or emissions generated by unit of distance traveled
Fuel economy measures distance traveled per unit of fuel consumed in Brazil kilometers per liter (kml) is the most common metric to describe vehicle efficiency but other units are used in different countries such as miles per gallon (mpg) in the us
Fuel consumption is the reciprocal of fuel economy and measures fuel consumed per distance traveled it is usually expressed in liters per 100 kilometers (l100 km) and it is used in europe for example
GhGCO2 emissions measures ghg or co2 emissions per distance traveled expressed as grams of pollutant per kilometer or mile
Energy consumption (EC) measures the energy consumed per distance traveled for example in megajoules per kilometer Despite being a less common metric it is sometimes preferred for being a fuel-neutral metric across different types of fuel and vehicle technologies Vehicle energy consumption in Mjkm is the metric used in Brazilrsquos inovar-auto policy to quantify the corporate average energy consumption target for each manufacturer Values for energy consumption in Brazilian spark-ignited vehicles are provided for e22 since that is the fuel mixture used in vehicle tests
Vehicle energy consumption in this report is calculated from co2 emissions data in the Brazilian institute of environment and renewable natural resources (iBaMa) nota Verde program (iBaMa 2014) which reports official emissions data from homologation tests Data are limited to passenger cars sold by the top 10 manufacturers with light commercial vehicles being excluded appendix D presents a description of data sources
32
Brazil Passenger Vehicle Market statistics
and calculation methodologies as well as a discussion of vehicle energy consumption data quality and completeness in Brazil
not surprisingly vehicle energy consumption increases with vehicle footprint and engine rated power the two parameters that define vehicle segments in Brazil (Figure 4‑1) subcompact and compact vehicles which accounted for about 45 of new sales in 2013 have average energy consumption below the fleet average while medium-sized vehicles which hold the largest market share (388) have energy consumption just above the fleet average larger more powerful vehicles consume more energy than the fleet average but have a considerably smaller market share (combined share of 163) Data availability for these segments is not as extensive as the data available for the subcompact compact and medium segments which could affect the relative rankings of each segment
Ene
rgy
cons
ump
tio
n (M
Jkm
)
Subco
mpac
t
Compac
t
Medium
Larg
e
O-road SUV
4000
200000
400000
600000
850000
35
30
25
20
15
10
05
0
Sales
Total 202
Figure 4‑1 ndash new vehicle sales-weighted average energy consumption by segment (2013)
33
ICCT white paper
Figures 4‑2 and 4‑3 illustrate new vehicle energy consumption for multiple weight and footprint bins For each weight bin (in 100 kg increments) and footprint bin (in 01 m2 increments) sales-weighted averages of energy consumption for each vehicle version are presented (dashes) generating energy consumption ranges for each bin (cream areas) Vehicle sales by bin are presented for reference in the lower charts
the strong correlation between vehicle energy consumption and weight follows from the strong physical relationship between the weight of the vehicle and the energy required to accelerate it and overcome resistances9 (Figure 4‑2) Data dispersion within each bin suggests that energy consumption varies due to other vehicle characteristics that affect vehicle aerodynamics and rolling resistance as well as the adoption of technologies that affect engine and transmission efficiency (eg friction reduction technologies gDi VVt)
Curb weight (kg)
SubcompactCompactMediumLargeO-roadSUV
Ene
rgy
cons
ump
tio
n (M
Jkm
)Sa
les
5
6
4
3
2
1
600k
800k
400k
200k
0k800 900 1000 1100 1200 1300 1400 1500 1600 1700 1800 1900 2000 2100
Figure 4‑2 ndash new vehicle energy consumption by vehicle weight (2013)
9 on a plain surface the sum of resistances of a vehicle is acceleration resistance + rolling resistance + aerodynamic resistance = c1 m a + c2 frr m + c3 cw a v2 with mass (m) as an integral part of both acceleration and rolling resistance which are most relevant for inner-city driving situations other factors are acceleration (a) rolling resistance of tires (frr) aerodynamic coefficient of the vehicle (cw) frontal area of vehicle (a) velocity (v) and constants (cx)
34
Brazil Passenger Vehicle Market statistics
Footprint has a reasonable correlation with energy consumption (Figure 4‑3) ie larger vehicles tend to consume more fuel than smaller vehicles however the correlation is not as strong as with vehicle weight similar to the previous figure the broad spread of energy consumption values suggests a combination of different vehicle characteristics (eg weight engine displacement rated power) and technologies (eg transmissions fuel systems) as well as the presence of suVs and off-road vehicles among the medium- and large-sized footprint values respectively
Footprint (m2)
SubcompactCompactMediumLargeO-roadSUV
Ene
rgy
cons
ump
tio
n (M
Jkm
)Sa
les
5
6
4
3
2
1
400k
500k
300k
200k
100k
0k31 32 33 34 35 36 37 38 39 40 41 42 43 44 45 46 48 49
Figure 4‑3 ndash new vehicle energy consumption by vehicle footprint (2013)
35
ICCT white paper
Figure 4‑4 illustrates sales weighted average for new vehicle energy consumption by mass for the top 10 manufacturers in Brazil in 2013 Bubble sizes are proportional to total vehicle sales Manufacturers in the lower-left quadrant produce the lightest and most efficient vehicles with hyundai presenting the best overall average energy consumption renault in the upper-left quadrant produces vehicles that are equivalent in weight but on average with higher energy consumption in the lower-right quadrant are manufacturers that produce relatively heavier vehicles but with lower energy consumption in their weight class Despite producing heavier vehicles on average than many manufacturers honda achieves lower energy consumption on average in the upper-right quadrant are manufacturers that produce on average the heavier and least efficient vehicles with Psa (citroen and Peugeot) producing the heaviest and least efficient cars on average a regression line correlating vehicle energy consumption and mass highlights the best performers (hyundai honda and nissan) average performers (Fiat Volkswagen gM and toyota) and those performing worse than average (renault Ford and Psa)
FIA
GMVW
FORREN
HYU
HON
TOY
PSA
NIS
160
170
180
190
200
210
220
230
240
250
950 1000 1050 1100 1150 1200 1250 1300 1350
Ene
rgy
cons
ump
tio
n (M
Jkm
)
Curb weight (kg)
Fleet Ave
Figure 4‑4 ndashaverage new vehicle sales-weighted energy consumption by manufacturer (2013)
36
Brazil Passenger Vehicle Market statistics
Figure 4‑5 shows fleet-average energy consumption based on certification and type approval data for new vehicles in multiple countries converted to the us caFe combined driving cycle Bubble sizes represent total sales of new passenger cars Because of data availability in different countries the country comparison is based on different calendars years for different countries 2011 for south Korea and japan 2012 for china and india and 2013 for europe the us and Brazil given annual improvements in vehicle energy consumption triggered by regulatory efficiency standards and fiscal incentives those countries with older data could be at a slight disadvantage in this comparison
With the heaviest vehicles on average the us fleet is also the most energy consuming of all countries china and south Korea have similar average energy consumption but since south Korean vehicles are heavier on average they are relatively more efficient than chinese vehicles although Brazilrsquos fleet consumes less fuel on average than those from the us china and south Korea its fleet is relatively inefficient when compared to countries with vehicles of similar weight (japan and india) the average Brazilian vehicle consumes about 34 more energy than the average vehicle in japan whose fleet has a large penetration of gasoline hybrid and advanced fuel-efficiency technologies such as three-cylinder engines VVa Dohc and 6-plus speed transmissions european vehicles are the best performing on average despite being heavier than all countries with the exception of the us and south Korea the adoption of fuel-efficiency technologies (eg Dct 6-plus-speed transmissions gDi turbocharging) contributes to europersquos better than average performance
China2012
SKorea2011
Europe2013
US2013
Japan2011
India2012
Brazil2013
Sales5 MM10 MM
14
16
18
20
22
24
26
28
1000 1100 1200 1300 1400 1500 1600 1700
Ene
rgy
cons
ump
tio
n ndash
CA
FE
(M
Jkm
)
Curb weight (kg)
Type-approval and certification energy consumption data only (does not include o-cycle or real-world driving data)
Figure 4‑5 ndash international comparison of passenger car energy consumption
Country labels indicate the dataset year
Figure 4‑6 provides a more detailed country comparison by illustrating average vehicle energy consumption by vehicle (curb) weight bin Vehicle sales in each bin are shown for reference the us is not shown due to lack of detailed model-by-model data Brazilrsquos vehicles on average have the highest energy consumption in most weight
37
ICCT white paper
bins with china being the second highest in most bins Because china has higher fuel consumption than Brazil on the 1000 bin which represents the highest share of vehicle sales fleet-average energy consumption in china is still higher than in Brazil as illustrated in the previous figure europe consistently performs best in terms of vehicle energy consumption in most weight bins with japan also performing relatively well
Curb weight (kg)
BrazilChinaEuropeIndiaJapanSouth Korea
Ene
rgy
cons
ump
tio
n C
AF
E (
MJ
km)
Sale
s
40
35
25
20
15
10
6M
8M
4M
2M
0M600 800 1000 1200 1400 1600 1800 2000 2200 2400
Figure 4‑6 ndash international comparison of average vehicle energy consumption by vehicle weight
Type-approval and certification energy consumption data only (does not include off-cycle or real-world driving data)
38
Brazil Passenger Vehicle Market statistics
Figure 4‑7 illustrates the distribution of energy consumption data in Brazil for each vehicle version by mass and segment Bubble sizes represent total sales of each version Data were limited to flex-fuel vehicles in the subcompact compact medium and large segments due to its relatively better data quality and representativeness (ie they represented over 87 of sales in 2013) While most vehicles follow a predictable trend that correlates energy consumption and vehicle mass there are a large number of versions with energy consumption substantially higher than the trend line this suggests there is substantial room for improvements in their energy consumption since there are vehicles in similar weight classes with substantially superior energy consumption performance
Sales1000050000
140
160
180
200
220
240
260
280
700 800 900 1000 1100 1200 1300 1400 1500 1600
Ene
rgy
cons
ump
tio
n (M
Jkm
)
Curb weight (kg)
Subcompact Compact Medium Large Fleet average
Figure 4‑7 ndash Distribution of new Brazilian passenger vehicle energy consumption data by vehicle weight and segment (2013)
this chapter suggests that there are potential improvements in vehicle energy consumption for the Brazilian fleet For similar vehicles in terms of weight class footprint or engine rating there is substantial dispersion in energy consumption indicating that there are vehicles performing much worse than the average across manufacturers there is also a clear trend of some manufacturers performing much better than the average while others have a lot more room for improvement the international comparison clearly shows that Brazilian vehicles perform much worse in terms of energy consumption than vehicles of similar weight suggesting a delay in the adoption of energy efficient technologies among Brazilian vehicle manufacturers
Finally a more detailed analysis of vehicle versions clearly illustrates a considerable number of vehicle versions significantly above average thus indicating potential improvements in energy consumption that would place them on par with better performing vehicles with similar characteristics
39
ICCT white paper
Deficiencies in data quality and completeness prevent more definite conclusions about vehicle energy consumption gasoline-only vehicles in particular have poor energy consumption data quality although they represent a relatively small fraction (6) of total vehicles sold in 2013 Because some vehicle segments are primarily composed of gasoline-only vehicles (eg sports minivans) this chapter excludes these segments from the analysis there are also concerns about the gap between energy consumption data reported by iBaMarsquos nota Verde and Brazilrsquos national institute of Metrology standardization and industrial Qualityrsquos (inMetro) labeling program (PBeV using its acronym in Portuguese) with the latter reporting consistently lower values of vehicle energy consumption
Finally the availability of energy consumption data was not adequate for many manufacturers beyond the top 10 sales group which prevented their inclusion in this analysis Despite the data quality and lack of completeness the energy consumption data in this chapter include data that are reasonably accurate and representative thus supporting its interpretation
40
Brazil Passenger Vehicle Market statistics
rEfErENCES
aDK automotive consultoria de Marketing (2013) relatoacuterios de volumes de vendas do mercado brasileiro para veiacuteculos de passeio e comerciais leves referentes a 2013
alves l Wilbert M (2014) reduccedilatildeo do imposto sobre Produto industrializado e a Venda de automoacuteveis Xi congresso usP iniciaccedilatildeo cientiacutefica em contabilidade
associaccedilatildeo nacional de transportes Puacuteblicos (antP 2014) estudo mostra baixo efeito do desconto no iPi de veiacuteculos sobre PiB e emprego available at httpwwwantporgbrwebsitenoticiasshowaspnpgcode=a4DeeFe8-a7BF-48D3-B1F5-8eDe1447BF10
associaccedilatildeo nacional dos Fabricantes de Veiacuteculos automotores (anFaVea 2015) anuaacuterio da induacutestria automobiliacutestica Brasileira 2015 Brazilian automotive industry Yearbook 2015 satildeo Paulo available at wwwanfaveacombr
european environment agency (2014) Monitoring co2 emissions from new passenger cars in the eu summary of data for 2013 april 2014
instituto Brasileiro do Meio ambiente e dos recursos naturais renovaacuteveis (iBaMa 2014) consulta dos niacuteveis de emissatildeo dos veiacuteculos novos brasileiros available at httpsservicosibamagovbrctfpublicosel_marca_modelo_rvepphp
international council on clean transportation (icct 2015) global passenger vehicle standards available at httpwwwtheicctorginfo-toolsglobal-passenger-vehicle-standards
international energy agency (iea 2015) renewables Bioenergy available at httpswwwieaorgtopicsrenewablessubtopicsbioenergy
Korea energy Management corporation (KeMco 2014) Fuel economy regulation available at httpwwwkemcoorkrnew_engmainmainasp
Marklines (2015) Marklines automotive industry Portal available at httpwwwmarklinescomen
Mendonccedila M sachsida a (2014) Modelando a demanda de creacutedito para veiacuteculos no Brasil uma abordagem com mudanccedila de regime iPea
Ministeacuterio do Desenvolvimento induacutestria e comeacutercio exterior (MDic 2013) Programa de incentivo agrave inovaccedilatildeo tecnoloacutegica e adensamento da cadeia Produtiva de Veiacuteculos automotores mdash inovar-auto httpwwwplanaltogov brccivil_03_ato2011-20142012DecretoD7819htm
stein r anderson j and Wallington t (2013) an overview of the effects of ethanol-gasoline Blends on si engine Performance Fuel efficiency and emissions SAE Int J Engines 6(1)470-487 2013 doi1042712013-01-1635
us environmental Protection agency and national highway traffic safety administration (ePanhtsa 2010) Final rulemaking to establish light-Duty Vehicle greenhouse gas emission standards and corporate average Fuel economy standards ePa-420-r-10-901
us environmental Protection agency (ePa 2012) regulatory impact analysis Final rulemaking for 2017-2025 light-Duty Vehicle greenhouse gas emission standards and corporate average Fuel economy standards ePa-420-r-12-016
41
ICCT white paper
us national academy of sciences (nas 2011) assessment of Fuel economy technologies for light-Duty Vehicles available at httpwwwnapeducatalog12924assessment-of-fuel-economy-technologies-for-light-duty-vehicles
World Bank group (2015) World Development indicators available at httpdataworldbankorgdata-catalogworld-development-indicators
42
Brazil Passenger Vehicle Market statistics
LiST Of ACrONyMS
4wD Four-wheel drive
aNFaVEa Brazilian association of automobile Manufacturers
awD all-wheel drive
BRiC Brazil russia india china
CaFE corporate average fuel economy
CBG compressed biogas
CO2 carbon dioxide
CVT continuously variable transmission
CVVT continuously variable valve technology
DCT Dual-clutch transmission
DOhC Dual overhead camshaft
EC energy consumption
Epa us environmental Protection agency
EU european union
FFV Flex-fuel vehicle
FTp Federal test procedure
FwD Front-wheel drive
GDi gasoline direct injection
GDp gross domestic product
GhG greenhouse gas
GM general Motors
iBaMa Brazilian institute of the environment and renewable natural resources
iC internal combustion
iCCT international council on clean transportation
iNMETRO national institute of Metrology standardization and industrial Quality
Kg Kilogram
Km Kilometer
Kw Kilowatt
LDV light-duty vehicle
LpG liquified petroleum gas
MDiC Ministry of Development industry and Foreign trade
MJ Megajoule
MpFi Multi-point fuel injection
Mpg Miles per gallon
NaS us national academy of sciences
43
ICCT white paper
NhTSa us national highway transportation safety administration
OhV overhead valve
pBEV Brazilian Vehicle labeling Program
pSa Psa Peugeot citroeumln
pTwR Power-to-weight ratio
pV Passenger vehicle
RwD rear-wheel drive
SOhC single overhead camshaft
SUV sport utility vehicle
US united states
USD us dollar
VTEC Valve timing electronic control
VVa Variable valve actuation
VVL Variable valve lift
44
Brazil Passenger Vehicle Market statistics
AppENDix A SEGMENT DEfiNiTiONS
Table a‑1 ndash segment definitions
Segmentpower (kw)
pTwR (kwkg) area (m2)
Other characteristics Examples
Subcompact lt 140 lt 0075 le 65 mdash Mini cooper chevrolet celta smart Fortwo
Compact lt 140 lt 0075 65 lt area le 70 mdash honda Fit hyundai hB20 Volkswagen Polo
Medium lt 140 lt 0075 70 lt area le 80 mdash honda civic nissan tiida Peugeot 308
Large lt 140 lt 0075 gt 80 mdash audi a4 BMW 3 series Mercedes c-class
Sports gt 140 gt 0075 mdash 4 seats maxjaguar XF lamborghini gallardo Ferrari california
Off‑road mdash mdash lt 80 traction = 4WDjeep cherokee honda cr-V BMW X3 hyundai santa Fe
SUV mdash mdash lt 80Based on aDKrsquos default classification
BMW X1 Ford ecosport hyundai tucson
Minivan mdash mdash Passengers 6-12
citroen grand Picasso Kia carnival
45
ICCT white paper
AppENDix b iNTErNATiONAL MArKET DATA
Table B‑1 ndash international market comparison of new fleet characteristics
parameters China S Korea EU US Japan india Brazil
Year 2012 2011 2013 2013 2011 2012 2013
Sales (million) 155 13 118 156 352 256 304
price (USD) $21008 $21383 $24439 mdash $20637 $11717 $22015
No of cylinders mdash 43 40 47 38 36 40
Displacement (cc) 1605 1960 1613 2606 1425 1294 1430
Curb weight (kg) 1296 1421 1391 1623 1193 1059 1106
Length (mm) 4323 4531 4263 mdash 4013 3859 4100
Footprint (m2) 38 420 40 425 371 341 367
Engine power (kw) 86 120 89 148 78 55 76
pTwR (kwkg) 00664 00844 00640 00912 00654 00519 00671
Energy consumption ndash US CaFE (MJKm)[1] 235 206 169 250 171 183 202
[1] energy consumption data presented here for countries other than Brazil were obtained from local official sources in its original metric and drive cycle and then converted to Mjkm under the us caFe drive cycle using the methodology described in Yang (2015) Mode details and historical fuel consumption data on their original metrics is presented in the icctrsquos global PV standard website httpwwwtheicctorginfo-toolsglobal-passenger-vehicle-standards
Data Sources
China Ministry of industry and information technology (Miit 2014) corporate average Fuel efficiency accounting Method for Passenger cars available at httpwwwgovcngzdt2013-0320content_2358627htm
Baseline performance china automotive research and technology center through internal communication and icct internal 2010 database for chinese light-duty vehicles
S Korea internal communication with s Korean official and from greencarcongress available at httpwwwgreencarcongresscom200906korea-20090604html
EU european environment agency (2014) Monitoring co2 emissions from new passenger cars in the eu summary of data for 2013 april 2014
US us ePa (2014) light-duty automotive technology carbon dioxide emissions and fuel economy trends1975 through 2014 table 91 page 110 available at http httpwwwepagovfueleconomyfetrends1975-2014420r14023apdf
Japan jaMa (2010) the Motor industry of japan available at httpwwwjama-englishjppublicationsMVs2010pdf Mlit httpwwwmlitgojpcommon000990330pdf
india Bureau of energy efficiency white paper 2010-2012 calculation based on icct database
Brazil icct Brazil Vehicle Database (2013)
46
Brazil Passenger Vehicle Market statistics
Table B‑2 ndash international market comparison of technology adoption in new vehicles
Technology adoption China S Korea EU US Japan india Brazil
Year 2010 2011 2013 2013 2011 2012 2013
Fuel type
CBGLpGFlex 0 11 2 0 0 4 94
Gasoline 99 65 44 93 86 56 6
hybrid 0 1 1 5 13 0 0
Diesel 1 23 53 1 0 40 0
No of cylinders
Two 0 0 0 0 0 6 0
Three 4 0 7 0 36 28 3
Four 90 84 87 56 57 65 97
Five 0 0 1 0 0 0
Six 6 15 4 32 5 0 1
Eight or more 0 0 0 12 1 0 0
Transmission
Manual 60 3 83 5 1 98 83
automatic 34 90 9 75 34 2 15
CVT 5 7 2 18 65 0 1
DCT 1 0 6 2 mdash 0 1
Number of gear ratios
Four or fewer 13 16 1 7 mdash 10 6
Five 68 9 45 11 mdash 85 83
Six or more 19 75 54 82 mdash 5 11
Drivetrain
FwD 74 86 81 83 59 76 0
RwD 21 7 7 10 5 22 0
4wD and awD 5 7 12 7 36 2 100
No of valves per cylinder
Two 17 mdash mdash 2 4 25 60
Multi valve 83 mdash mdash 98 95 75 40
Valve camshaft configuration
Single overhead camshaft 26 1 mdash mdash 16 41 63
Dual overhead camshaft 74 84 mdash mdash 82 53 25
Overhead camshaft mdash 15 mdash mdash 0 6 mdash
Valve actuation
Fixed 50 16 mdash 2 11 86 78
VVT 44 84 mdash 98 89 12 16
VVL 6 mdash mdash mdash mdash 2 6
Fuel systems for gasoline vehicles
Multi‑point fuel injection 94 72 68 62 95 100 98
Gasoline direct injection 6 28 32 37 5 0 2
air induction systems for gasoline vehicles
Naturally aspirated 93 75 41 85 92 64 97
Supercharger turbocharger or twin‑turbo 7 25 59 15 8 36 3
47
ICCT white paper
AppENDix C NEW vEhiCLE ChArACTEriSTiCS AND TEChNOLOGy ADOpTiON DATA iN brAziL
Table C‑1 ndash Fleet characteristics of new Brazilian passenger vehicles by segment (2013)
parameters Subcompact Compact Medium Large Sports Off‑road SUV Minivan
Sales (thousands) 6785 6843 11790 1920 273 768 1997 23
Market share () 223 225 38 8 63 09 25 65 01
price (R$) $30103 $38732 $45496 $66508 $148834 $151284 $75164 $82284
No of cylinders 400 391 399 400 462 448 404 433
Displacement (cc) 1128 1293 1447 1794 2430 2586 1884 2244
Curb weight (kg) 940 1037 1102 1329 1561 1772 1395 1604
Length (mm) 3804 4026 4163 4499 4711 4516 4352 4658
Footprint (m2) 339 361 371 402 418 409 402 427
Engine power ndash gasoline (kw) 58 68 75 99 183 146 103 120
Engine power ndash ethanol (kw) 59 70 77 98 mdash 109 101 mdash
pTwR ndash gasoline (kwkg) 00614 00655 00671 00742 01173 00828 00731 00732
pTwR ndash ethanol (kwkg) 00630 00678 00697 00757 mdash 00766 00745 mdash
48
Brazil Passenger Vehicle Market statistics
Table C‑2 ndash Fleet characteristics of new Brazilian passenger vehicles by manufacturer (2013)
parameters Fiat
GM
Vo
lksw
agen
Ford
Ren
ault
hyu
ndai
ho
nda
Toyo
ta
pSa
Nis
san
Mit
sub
ishi
Kia
JaC
BM
w
Land
Rov
er
Mer
ced
es‑B
enz
Che
ry
aud
i
Suzu
ki
Jeep
Sales (thousands) 6087 5486 5448 3074 2207 2055 1392 1334 1163 621 368 255 158 141 106 94 80 67 63 36
Market share () 2002 1804 1792 1011 726 676 458 439 383 204 121 084 052 046 035 031 026 022 021 012
price (R$) $35017 $42259 $38701 $46174 $43447 $50112 $67078 $68922 $103001 $44035 $100696 $87009 $37654 $165111 $221943 $153281 $30821 $142799 $74769 $139039
No of cylinders 400 401 400 402 400 370 400 400 400 400 408 416 400 424 448 431 400 411 400 552
Displacement (cc) 1250 1340 1287 1497 1423 1495 1691 1808 1575 1579 2262 1856 1411 2095 2281 1934 1398 1912 1831 3182
Curb weight (kg) 1033 1060 1020 1156 1102 1122 1210 1201 1231 1069 1556 1377 1079 1624 1868 1598 1097 1551 1444 1945
Length (mm) 3965 4155 3993 4120 4127 4078 4319 4299 4116 4171 4401 4357 3956 4574 4487 4527 3896 4454 4234 4584
Footprint (m2) 345 370 354 368 378 383 397 387 376 379 395 407 351 429 433 429 349 417 323 420
Engine power ndash gasoline (kw) 64 71 65 79 73 86 96 90 80 82 120 112 83 151 179 138 71 136 94 162
Engine power ndash ethanol (kw) 65 72 65 79 76 85 97 90 81 82 107 106 95 mdash mdash mdash 75 mdash mdash mdash
pTwR ndash gasoline (kwkg)
00613 00662 00631 00674 00657 00739 00788 00745 00646 00766 00779 00792 00784 00921 00977 00856 00638 00870 00649 00835
pTwR ndash ethanol (kwkg) 00629 00681 00642 00693 00685 00781 00800 00795 00660 00768 00710 00798 00896 mdash mdash mdash 00659 mdash mdash mdash
49
ICCT white paper
Table C‑3 ndash Fleet characteristics of new Brazilian passenger vehicles by origin (2013)
parameters Domestic imported
Sales (thousands) 2537 504
Market share () 834 166
price (R$) $41739 $76049
No of cylinders 397 412
Displacement (cc) 1359 1791
Curb weight (kg) 1070 1289
Length (mm) 4063 4285
Footprint (m2) 362 390
Engine power ndash gasoline (kw) 70 102
Engine power ndash ethanol (kw) 73 84
pTwR ndash gasoline (kwkg) 0065 0076
pTwR ndash ethanol (kwkg) 0068 0074
50
Brazil Passenger Vehicle Market statistics
Table C‑4 ndash technology adoption in new Brazilian passenger vehicles by segment (2013)
Technology adoption Subcompact Compact Medium Large SportOff‑road SUV Minivan
Fuel type
Flex 982 988 982 837 00 134 826 00
Gasoline 18 12 17 163 996 540 174 1000
hybrid 0000 0000 0028 0000 0396 0001 0000 0000
Diesel 00 00 00 00 00 326 00 00
No of cylinders
Three 01 91 10 00 00 00 00 00
Four 999 909 990 998 758 775 979 833
Five 00 00 00 02 03 00 00 00
Six 00 00 00 00 175 211 21 167
Eight or more 00 00 00 00 63 13 00 00
Transmission
Manual 993 944 826 622 62 174 505 641
automatic 07 55 161 283 629 707 451 359
CVT 00 00 12 89 09 93 34 00
DCT 00 01 02 06 299 25 10 00
No of gear ratios
Four or fewer 04 47 72 51 00 34 247 193
Five 984 943 848 378 15 392 516 641
Six 12 09 73 515 796 462 225 167
Seven 00 01 06 23 87 53 12 00
Eight or more 00 00 01 32 102 59 00 00
Drivetrain
FwD 998 1000 997 688 550 00 916 1000
RwD 02 00 03 311 221 00 84 00
awD 00 00 00 01 229 1000 00 00
No of valves per cylinder
Two 806 694 584 195 00 00 258 00
Multi valve 194 306 416 805 1000 1000 742 1000
Valve camshaft configuration
Single overhead camshaft 839 786 709 309 00 212 375 00
Dual overhead camshaft 24 158 161 546 880 517 446 255
Valve actuation
Fixed 982 729 807 461 49 493 664 868
VVT 18 211 115 470 827 367 252 132
VVT+VVL 00 61 78 68 124 140 84 00
Fuel systems for gasoline vehicles
Multi‑point fuel injection 999 998 997 949 979 143 766 1000
Gasoline direct injection 01 02 03 51 21 857 234 00
air induction systems for gasoline vehicles
Naturally aspirated 999 997 995 943 974 369 543 1000
Supercharger turbocharger or twin‑turbo 01 03 05 57 26 631 457 00
51
ICCT white paper
Table C‑5 ndash technology adoption in new Brazilian passenger vehicles by manufacturer (2013)
Technology adoption Fi
aT
GM
VO
LKSw
aG
EN
FOR
D
REN
aU
LT
hY
UN
Da
i
hO
ND
a
TOYO
Ta
pSa
NiS
SaN
MiT
SUB
iSh
i
Kia
JaC
BM
w
LaN
D R
OV
ER
MER
CED
ES
Fuel type
Flex 990 987 965 966 997 921 999 886 928 998 283 739 31 42 00 00
Gasoline 10 09 35 34 03 79 01 35 72 02 557 255 969 957 663 950
hybrid 00 00 00 00 00 00 00 02 00 00 00 00 00 00 00 00
Diesel 00 04 00 00 00 00 00 77 00 00 160 06 00 00 337 50
No of cylinders
Three 00 00 05 00 00 348 00 00 00 00 00 00 00 00 00 00
Four 1000 996 994 989 1000 626 999 998 1000 1000 958 922 1000 906 787 878
Five 00 00 00 00 00 00 00 00 00 00 00 00 00 00 00 00
Six 00 02 01 11 00 26 01 02 00 00 42 78 00 68 185 87
Eight or more 00 02 00 00 00 00 00 00 00 00 00 00 00 26 28 35
Transmission
Manual 992 878 985 846 853 632 566 565 703 785 493 120 1000 02 00 151
automatic 08 103 00 137 62 285 355 160 297 121 118 793 00 575 18 14
CVT 00 19 15 16 41 70 01 246 00 00 139 87 00 423 982 836
DCT 00 00 00 00 43 13 78 30 00 94 251 00 00 00 00 00
No of gear ratios
Four or fewer 02 04 00 55 104 237 00 323 249 132 17 133 00 00 00 00
Five 981 811 963 839 797 623 861 643 684 828 530 107 1000 00 00 64
Six 17 185 29 106 99 140 139 07 67 40 453 754 00 217 800 00
Seven 00 00 07 00 00 00 00 27 00 00 00 00 00 08 00 936
Eight or more 00 00 00 00 00 00 00 00 00 00 00 06 00 775 200 00
Drivetrain
FwD 1000 902 989 972 987 985 990 892 1000 1000 496 623 1000 00 00 00
RwD 00 91 00 00 00 00 00 16 00 00 00 370 00 882 00 900
awD 00 06 11 28 13 15 10 92 00 00 504 07 00 118 1000 100
No of valves per cylinder
Two 811 864 988 745 220 00 00 00 00 00 00 00 00 00 00 00
Multi Valve 189 136 12 255 780 1000 1000 1000 1000 1000 1000 1000 1000 1000 1000 1000
Valve camshaft configuration
SOhC 836 755 914 675 832 00 04 00 497 398 331 00 00 00 00 00
DOhC 07 108 56 50 168 992 786 875 352 428 477 1000 907 810 860 453
Valve actuation
Fixed 1000 898 965 966 940 29 00 574 736 573 435 76 124 187 18 55
VVT 00 102 35 34 60 971 00 426 264 427 00 924 876 00 982 945
VVT+VVL 00 00 00 00 00 00 1000 00 00 00 565 00 00 813 00 00
air induction System
Naturally aspirated 997 994 966 977 997 988 1000 923 922 1000 835 936 1000 97 37 101
Supercharger turbocharger or twin‑turbo
03 06 34 23 03 12 00 77 78 00 165 64 00 903 963 899
Fuel systems for gasoline vehicles
Multipoint fuel injection 1000 995 965 972 1000 989 1000 1000 967 1000 994 1000 1000 78 15 158
Gasoline Direct injection 00 05 35 28 00 11 00 00 33 00 06 00 00 922 985 842
note Difference between 100 and summation of sohc and Dohc market share values corresponds to data not available
52
Brazil Passenger Vehicle Market statistics
AppENDix D DATA SOurCES AND COMpLETENESS
the basis of the statistics shown in this report is a database compiled by the icct with vehicle sales technical information (eg fleet characteristics technology content) and energy consumption (converted from either co2 emissions or fuel economy) from various data sources outlined in table D-1
Table D‑1 ndash Brazilian data sources
parameters Sales TechnicalEnergy
consumption
aDK (2014 2015) x x
MarkLines (2015) x
iBaMa (2014) x
iNMETRO (2014) x
UOL (2014) x
icarroscom (2014) x
this analysis examined energy consumption data from two public sources the nota Verde Program by the Brazilian institute of the environment and renewable natural resources (iBaMa) and the Brazilian Vehicle labeling Program (PBeV) by the national institute of Metrology standardization and industrial Quality (inMetro) table D-2 summarizes key differences between these two data sources
Table D‑2 ndash energy consumption data sources
iBaMa iNMETRO
program nota Verde1 Brazilian Vehicle labeling Program (PBeV)2
program description
Mandatory program that reports emissions of co2 co nox and nMhc as part of emissions certification program
Voluntary program since 2009 that allows the comparison of fuel economy across vehicle models
Unit gco2 km kml
Test cycle chassis testing under urban (FtP) driving cycle based on nBr 66012005
chassis testing under urban (FtP) and highway (hWYFe) driving cycles based on nBr 702420103
adjustment
no adjustment for real-world driving conditions Because reported co2 emissions are assumed to be zero for ethanol adjustments were made to account for tailpipe co2 emissions for vehicles running on ethanol
since 2010 published values include real-world adjustment factors to chassis test data a method adopted by the us ePa in 2008
Conversion to MJkm
iBaMarsquos data are reported as FtP (city test) co2 data in gco2 km conversion to caFe test cycle and to a different metric (Mjkm) involves four steps as presented in Figure D-1
inMetrorsquos data in kml are presented separately by fuel type (e22 e100) and driving cycle (urban highway) conversion to Mjkm was done by applying a conversion factor (2167 gco2 l for e22 and 1428gco2l for e00) caFe values are obtained by using a 5545 weighting for the urban (FtP) and highway cycles respectively
1 iBaMa (2014) nota Verde program available at httpwwwmmagovbrcidades-sustentaveisqualidade-do-arcontrole-de-emissoes-veicularesnota-verde
2 inMetro (2014) Programa Brasileiro de etiquetagem Veicular (PBeV) available at httpwwwinmetrogovbrconsumidortabelas_pbe_veicularasp
3 inMetro (2014) Metodologia Para Divulgaccedilatildeo De Dados De consumo Veicular available at httpwwwinmetrogovbrconsumidorpbeMetodologia_consumo_Veicularpdf
53
ICCT white paper
Step 1 Correcting the original IBAMA CO2 reported data ndash FTP CO2 gkm
IBAMArsquos CO2 reported values are corrected to account for tailpipe emissions from ethanol (tailpipe CO2 emissions are reported as zero in IBAMArsquos data)
bull E22 FTP reported CO2 data are reduced by 177bull E100 FTP reported CO2 data are reduced by 100
Flex fuel vehicles are tested with E22 and E00 the final values is calculated as the average of both fuelsCO2 IBAMA_Flex_FTP= 05(1-0177)CO2_E22_test_FTP + 050E100_FTP = 050823CO2_E22_FTPFor Gasoline only vehicles the tests are carried out only with Gasoline E22CO2 IBAMA_Gasoline_FTP = (1-0177) CO2_E22_Test_FTP
Where in the previous equations CO2_E22_FTP means CO2 emissions values obtained under FTP testingCO2 IBAMA_Flex_FTP means IBAMArsquos Corrected FTP values for flex vehiclesCO2 IBAMA_Gasoline_FTP means IBAMArsquos Corrected FTP values for gasoline only (E22) vehicles
INNOVAR AUTO is based on energy consumption data obtained as the combined CAFE test cycle This requires a weighted average of energy consumption data obtained from FTP testing (city driving ) and Highway fuel economy testing (HWFET) In mathematical form CAFE=f(FTPHWFET)
Given that IBAMA data is provided for only the first aprt the FTP testing then it is required to find a way to calculate CAFE combined values through FTP -75 only data A linear function was thus developed from data with FTP and HWY values (INMETRO data) is used to convert FTP only values to CAFE CO2 values ie CAFE=f(FTP) The function used for this conversion is
CO2_CAFE= (CO2_FTP+44756)11572
Step 2Convert FTP CO2 values to CAFE CO2 values
Converting CO2 values to MJkm values is done by using the energy density of E22 Note that all the previous calculations for CO2 come from E22-based data
bull The energy density of E22 is 2894 MJLE22bull E22 emits 2167gCO2LE22bull CAFE (MJkm) = CAFE (gCO2km) (2894 MJLE22 2167 gCO2LE22)
Step 3 Convert US CAFE CO2 values to MJkm values
Figure D‑1 ndash conversion of emission to energy consumption data
energy consumption values calculated from iBaMa and inMetro data differ greatly Figure D-1 illustrates energy consumption data for those models in both databases iBaMa data are on average 126 higher than inMetro data with a standard deviation of 89 and a maximum deviation of 39
54
Brazil Passenger Vehicle Market statistics
0
05
1
15
2
25
3
0 05 1 15 2 25 3
Ene
rgy
cons
ump
tio
n IB
AM
A (
MJ
km)
Energy consumption INMETRO (MJkm)
n=151
Figure D‑2 ndash comparison between energy consumption data from inMetro and iBaMa
151 vehicles tested under both programs
although inMetro data are more transparent as it breaks down fuel economy by fuel and test cycle it is still a voluntary program that allows manufacturers to select which models will participate in addition not all manufacturers participate in the program in turn iBaMa data only include co2 data for the urban cycle and thus energy consumption in the combined cycle had to be estimated from correlations using international data in addition corrections had to be made for gasoline-only engines since it seems that a co2 discount in theory only applicable to flex-fuel engines was also applied to gasoline-only engines Despite these data quality issues iBaMa data were considered the most adequate data source for energy consumption because it is a mandatory program that requires data reporting by all vehicle models and manufacturers
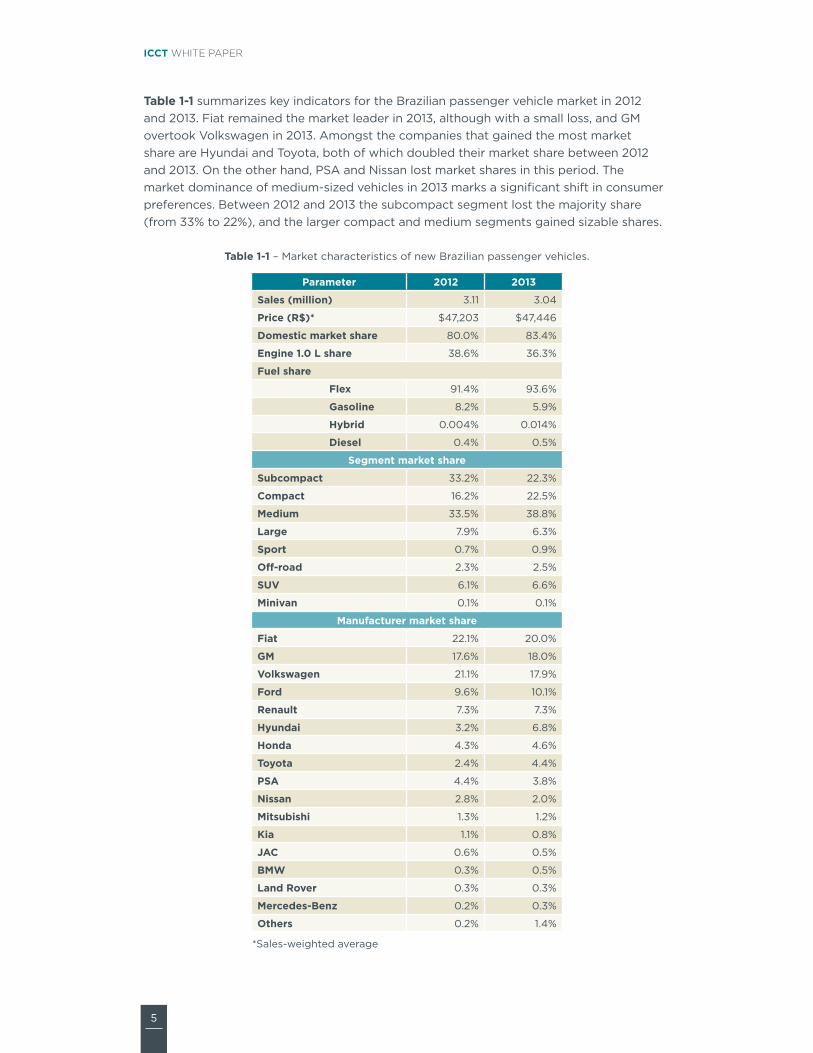
5
ICCT white paper
Table 1‑1 summarizes key indicators for the Brazilian passenger vehicle market in 2012 and 2013 Fiat remained the market leader in 2013 although with a small loss and gM overtook Volkswagen in 2013 amongst the companies that gained the most market share are hyundai and toyota both of which doubled their market share between 2012 and 2013 on the other hand Psa and nissan lost market shares in this period the market dominance of medium-sized vehicles in 2013 marks a significant shift in consumer preferences Between 2012 and 2013 the subcompact segment lost the majority share (from 33 to 22) and the larger compact and medium segments gained sizable shares
Table 1‑1 ndash Market characteristics of new Brazilian passenger vehicles
parameter 2012 2013
Sales (million) 311 304
price (R$) $47203 $47446
Domestic market share 800 834
Engine 10 L share 386 363
Fuel share
Flex 914 936
Gasoline 82 59
hybrid 0004 0014
Diesel 04 05
Segment market share
Subcompact 332 223
Compact 162 225
Medium 335 388
Large 79 63
Sport 07 09
Off‑road 23 25
SUV 61 66
Minivan 01 01
Manufacturer market share
Fiat 221 200
GM 176 180
Volkswagen 211 179
Ford 96 101
Renault 73 73
hyundai 32 68
honda 43 46
Toyota 24 44
pSa 44 38
Nissan 28 20
Mitsubishi 13 12
Kia 11 08
JaC 06 05
BMw 03 05
Land Rover 03 03
Mercedes‑Benz 02 03
Others 02 14
sales-weighted average
6
Brazil Passenger Vehicle Market statistics
2 vEhiCLE fLEET ChArACTEriSTiCS
this chapter provides an overview of key vehicle fleet characteristics in Brazil number of cylinders engine displacement curb weight1 length footprint2 engine power and power-to-weight ratio (PtWr)3 are relevant indicators to characterize a vehicle fleet and understand individual vehicle and fleet-average energy consumption4
these key characteristics of passenger vehicles in Brazil experienced a small change in 2013 compared to 2012 (Table 2‑1) With the exception of number of cylinders all parameters increased in 2013 consistent with a trend of increasing market shares for larger and more powerful vehicles the evaluation of minimum and maximum parameters also provides important insights While the smallest vehicles continue to be sold in Brazil (since the minimum values did not change with the exception of footprint) it is evident that much larger vehicles started being sold in 2013 represented by the large variation in the maximum values of each parameter Because sales of these recently introduced larger vehicles are relatively small their effect on weighted average parameters is also modest
Figure 2‑1 illustrates key vehicle fleet characteristics by vehicle segment (see appendix a for segment definition) not surprisingly most parameters get larger between the subcompact and large segments off-road vehicles sports cars and minivans tend to be the largest and most powerful vehicles across the fleet while sport utility vehicles (suVs) tend to be comparable with vehicles in the ldquolargerdquo segment Because of their high performance (absolute and relative to vehicle size) sports cars have significantly larger engine power and PtWr compared to all other segments sports vehicles primarily imported are not sold in a flex-fuel configuration and consume strictly gasoline Flex-fuel vehicles have slightly higher engine power and PtWr than their gasoline counterparts in most segments Detailed sales-weighted average data by segment are presented in Table C‑1 in appendix c
1 Based on norm aBnt nBr iso 1176 2006 curb weight is the total weight of a vehicle with standard equipment all necessary operating consumables (eg motor oil and coolant) a full tank of fuel but not loaded with passengers or cargo
2 Footprint (m2) is the product of the distance between the axles of a vehicle (wheelbase) and the distance between the centerline of the tires (average trackwidth)
3 Power to weight ratio (PtWr) is defined as the rated power of the engine (kW) divided by the vehicle weight (kg) PtWr is a metric that describes vehicle acceleration and handling and it is thus used in Brazil as a criterion to classify sports vehicles (PtWr gt 0075 kWkg)
4 Vehicle energy consumption is presented in megajoules per kilometer (Mjkm) for consistency with the vehicle energy consumption targets established by inovar-auto although e27 is currently being used flex-fuel vehicles are tested with e22 fuel
7
ICCT white paper
Table 2‑1 ndash Fleet characteristics of new Brazilian passenger vehicles
Vehicle characteristic 2012 2013 Variation
Number of cylinders weighted average 402 400 ‑06
Displacement (cc)
Min 970 970
Max 6498 6749
weighted average 1418 1430 08
Curb weight (kg)
Min 800 800
Max 2940 2710
weighted average 1102 1106 04
Length (mm)
Min 2695 2695
Max 5290 5842
weighted average 4089 4100 03
Footprint (m2)
Min 217 241
Max 523 874
weighted average 364 367 09
Engine power ndash gasoline (kw)
Min 33 33
Max 153 545
weighted average 743 757 18
Engine power ndash ethanol (kw)
49 49
Max 114 153
weighted average 715 740 34
pTwR ‑ gasoline (kwkg)
00455 00455
Max 04482 03344
weighted average 00658 00671 20
pTwR ‑ ethanol (kwkg)
00476 00477
Max 00935 01033
weighted average 00667 00683 24
Energy consumption ndash US CaFE (MJkm) na 202
8
Brazil Passenger Vehicle Market statistics
0
500
1000
1500
2000
2500
3000
Subco
mpac
t
Compac
t
Medium
Larg
eSport
O-road SUV
Miniva
n
Fleet-a
vera
ge
Dis
pla
cem
ent
(cc)
0200400600800
10001200140016001800
2000
Subco
mpac
t
Compac
t
Medium
Larg
eSport
O-road SUV
Miniva
n
Fleet-a
vera
ge
Cur
b w
eig
ht (
kg)
0500
10001500
2000250030003500400045005000
Subco
mpac
t
Compac
t
Medium
Larg
eSport
O-road SUV
Miniva
n
Fleet-a
vera
ge
Leng
th (
mm
)
000050100150
200250300350400450
Subco
mpac
t
Compac
t
Medium
Larg
eSport
O-road SUV
Miniva
n
Fleet-a
vera
ge
Fo
otp
rint
(m
2 )
020406080
100120140160180
200
Subco
mpac
t
Compac
t
Medium
Larg
eSport
O-road SUV
Miniva
n
Fleet-a
vera
ge
Po
wer
(kW
)
Gasoline EthanolGasoline and Ethanol
000
002
004
006
008
010
012
014
Subco
mpac
t
Compac
t
Medium
Larg
eSport
O-road
SUV
Miniva
n
Fleet-a
vera
gePo
wer
-to
-wei
ght
rat
io (
kWk
g)
Figure 2‑1 ndash Fleet characteristics of new Brazilian passenger vehicles by segment (2013)
Fleet characteristics for the top 20 vehicle manufacturers responsible for more than 99 of passenger vehicle sales in 2013 are presented in Figure 2‑2 the four top-selling manufacturers (Fiat gM Volkswagen and Ford) produce on average lighter vehicles with smaller and less powerful engines average engine rated power is below 80 kW for the 10 largest manufacturers except for toyota and honda since each has a large share of off-road and suV sales respectively luxury manufacturers and off-road dominant manufacturers (jeep and Mitsubishi) show the largest values of engine power PtWr values seem evenly distributed below 0070 kWkg across the five largest manufacturers plus Psa and chery and climb following the power trend for luxury and off-road oriented manufacturers Most vehicles are rated with higher engine power and PtWr under ethanol (e100) than under gasoline (e22) Detailed sales-weighted average data by manufacturer are presented in Table C‑2 in appendix c
9
ICCT white paper
Gasoline Ethanol
0
500
1000
1500
2000
2500
3000
3500
Fiat GM
Volkswag
enFord
Renau
lt
Hyund
ai
Honda
Toyo
taPSA
Nissan
Mitsub
ishiKIA
JACBMW
Land
Rove
r
Merce
des-B
enz
Chery
Audi
Suzuk
iJe
ep
Fleet-a
vera
geFiat GM
Volkswag
enFord
Renau
lt
Hyund
ai
Honda
Toyo
taPSA
Nissan
Mitsub
ishiKIA
JACBMW
Land
Rove
r
Merce
des-B
enz
Chery
Audi
Suzuk
iJe
ep
Fleet-a
vera
ge
Dis
pla
cem
ent
(cc)
0200400600800
10001200140016001800
2000
Cur
b w
eig
ht (
kg)
Fiat GM
Volkswag
enFord
Renau
lt
Hyund
ai
Honda
Toyo
taPSA
Nissan
Mitsub
ishiKIA
JACBMW
Land
Rove
r
Merce
des-B
enz
Chery
Audi
Suzuk
iJe
ep
Fleet-a
vera
geFiat GM
Volkswag
enFord
Renau
lt
Hyund
ai
Honda
Toyo
taPSA
Nissan
Mitsub
ishiKIA
JACBMW
Land
Rove
r
Merce
des-B
enz
Chery
Audi
Suzuk
iJe
ep
Fleet-a
vera
ge000050100150
200250300350400450
Fo
otp
rint
(m
2 )
3400
3600
3800
4000
4200
4400
4600
4800
Leng
th (
mm
)
Fiat GM
Volkswag
enFord
Renau
lt
Hyund
ai
Honda
Toyo
taPSA
Nissan
Mitsub
ishiKIA
JACBMW
Land
Rove
r
Merce
des-B
enz
Chery
Audi
Suzuk
iJe
ep
Fleet-a
vera
geFiat GM
Volkswag
enFord
Renau
lt
Hyund
ai
Honda
Toyo
taPSA
Nissan
Mitsub
ishiKIA
JACBMW
Land
Rove
r
Merce
des-B
enz
Chery
Audi
Suzuk
iJe
ep
Fleet-a
vera
ge0
20406080
100120140160180
200
Po
wer
(kw
)
00000010002000300040005000600070008000900100
Po
wer
-to
-wei
ght
rat
io (
kWk
g)
Gasoline and Ethanol
Figure 2‑2 ndash Fleet characteristics of new Brazilian passenger vehicles by manufacturer (2013)
Manufacturers are organized by total sales in descending order
Figure 2‑3 illustrates vehicle fleet characteristics for domestic and imported vehicles in general imported vehicles are bigger and heavier than those nationally produced the most remarkable contrast lies on engine power and PtWr imported vehicles are more powerful and have higher PtWr but while domestic vehicles exhibit higher engine power and PtWr for ethanol than for gasoline the opposite occurs for imported ones a closer examination of available data on engine compression ratios shows that domestic producers are leveraging ethanolrsquos higher octane rating and designing flex-fuel engines with much higher compression ratios (~1251) than gasoline-only engines (around 1051)5 this confirms the special engine designcalibration for operation with high ethanol gasoline blends from manufacturers with local production Detailed sales-weighted average data by origin are presented in Table C‑3 in appendix c
5 More information on the effect of ethanol on vehicle design characteristics can be found in stein et al (2013)
10
Brazil Passenger Vehicle Market statistics
Gasoline Ethanol
0
200
400
600
800
1000
1200
1400
1600
1800
2000
Domestic Imported Fleet-average
Dis
pla
cem
ent
(cc)
0
200
400
600
800
1000
1200
1400
Domestic Imported Fleet-average
Cur
b w
eig
ht (
kg)
345
350
355
360
365
370
375
380
385
390
395
Domestic Imported Fleet-average
Fo
otp
rint
(m
2 )
3950
4000
4050
4100
4150
4200
4250
4300
4350
Domestic Imported Fleet-average
Leng
th (
mm
)
0
20
40
60
80
100
120
Domestic Imported Fleet-average
Po
wer
(kW
)
0050
0055
0060
0065
0070
0075
0080
Domestic Imported Fleet-average
Po
wer
-to
-wei
ght
rat
io (
kWk
g)
Gasoline and Ethanol
Figure 2‑3 ndash Fleet characteristics of new Brazilian passenger vehicles by origin (2013)
Figure 2‑4 compares Brazilrsquos passenger vehicle fleet with those in china the us eu japan india and south Korea For the energy consumption comparison this analysis considers the us corporate average fuel economy (caFe) test cycle6 average engine displacement curb weight footprint and engine power in Brazil are the smallest with the exception of india (and japan in the case of engine displacement) With respect to PtWr the average Brazilian passenger car breaks the trend set by the power category ie Brazilian cars are less powerful than those in china japan and eu due to their lower average weight which drives the PtWr value above chinese japanese and european cars this suggests that the average Brazilian cars share the driving performance characteristics (eg acceleration times) of the us and Korean vehicles despite their relative smaller engines Detailed international data are presented in appendix B
6 Details on icctrsquos methodology for comparing new vehicle fuel efficiency can be found at the global PV standards section in the icctrsquos website httpwwwtheicctorginfo-toolsglobal-passenger-vehicle-standards
11
ICCT white paper
Despite having the smallest lightest and least powerful vehicles on average (with the exception of india) Brazilrsquos average energy consumption ranks fourth amongst the markets analyzed in this study the japanese fleet had the lowest energy consumption given the small and light vehicle characteristics of japanese cars and their relatively higher adoption of efficiency technologies (eg hybrids) followed by the eu (medium sizeweight fleet with high technology penetration) and india (smaller and lighter fleet overall) the us has the highest energy consumption on average due to the fleetrsquos larger size weight and power requirements china and south Korea trail the us as the most energy-consuming fleet and these countries have fleets with large and heavy vehicles but relatively lower penetration of efficiency technologies a detailed evaluation of energy consumption in Brazil and other markets is presented in chapter 4
0
500
1000
1500
2000
2500
3000
US S Korea EU China Brazil Japan India
Dis
pla
cem
ent
(cc)
0
200
400
600
800
1000
1200
1400
1600
1800
US S Korea EU China Japan Brazil India
Cur
b w
eig
ht (
kg)
000
050
100
150
200
250
300
350
400
450
US S Korea EU China Japan Brazil India
Fo
otp
rint
(m
2)
0
20
40
60
80
100
120
140
160
US S Korea EU China Japan Brazil India
Po
wer
(kW
)
00000
00100
00200
00300
00400
00500
00600
00700
00800
00900
01000
US S Korea Brazil China Japan EU India
Po
wer
-to
-wei
ght
rat
io (
kWk
g)
100
120
140
160
180
200
220
240
260
US China S Korea Brazil India Japan EU
Ene
rgy
cons
ump
tio
n ndash
US
CA
FE
(M
Jkm
)
Figure 2‑4 ndash international comparison of key new passenger vehicle characteristics
12
Brazil Passenger Vehicle Market statistics
3 vEhiCLE TEChNOLOGy ADOpTiON
this chapter provides an overview of current technology adoption including fuel engine and transmission technologies that affect vehicle energy consumption the type and complexity of technologies vary across vehicle segments to a large extent this is a function of vehicle size and weight and its intended performance and ultimately cost Fleet-average parameters presented in Table 3‑1 correspond to sales-weighted fleet-average values this chapter is divided by technology type with supporting information in appendix c an international comparison for each technology is also presented in this chapter the data for this technology adoption analysis came from a diversity of sources listed in appendix D also note that for comparisons at the international level it was required to use information from different years the most recent according to data availability
Table 3‑1 ndash technology adoption in new Brazilian passenger vehicles
Year 2012 2013
Fuel type
Flex 914 936
Gasoline 82 59
hybrid 0004 0014
Diesel 04 049
No of cylinders
Three 03 25
Four 986 966
Five 00 00
Six 09 08
Eight or more 01 01
Transmission
Manual 870 833
automatic 112 147
CVT 14 15
DCT 04 05
No of gear ratios
Four or fewer 61 59
Five 849 831
Six 84 98
Seven 03 07
Eight or more 02 05
Drivetrain
FwD 950 944
RwD 27 29
4wD and awD 23 27
No of valves per cylinder
Two 664 596
Multi valve 336 404
Valve camshaft configuration
Single overhead camshaft 696 630
Dual overhead camshaft 176 245
Valve actuation
Fixed 822 783
VVT 124 159
VVT+VVL 54 58
Fuel systems for gasoline vehicles
Multi‑point fuel injection 982 976
Gasoline direct injection 18 24
air induction systems for gasoline vehicles
Naturally aspirated 984 973
Supercharger turbocharger or twin‑turbo 16 27
13
ICCT white paper
FUEL TYpEFlex-fuel vehicles (FFVs) are designed to run on gasoline (e22) ethanol (e100) or any combination of both fuels except for a few engine and fuel system modifications FFVs are identical to gasoline-only models7 FFVs experience no loss in performance when operating on e100 however since ethanol contains less energy per volume than gasoline FFVs typically get about 25 fewer kilometers per liter when fuelled with e100
Flex-fuel is the dominant technology across all vehicle segments with the exception of sports cars off-road vehicles and minivans (Figure 3‑1) all top 10 manufacturers produce primarily flex-fuel engines and those manufacturers with a larger share of gasoline and diesel engines typically import most of their vehicles (Figure 3‑2) the predominance of FFVs responsible for almost 94 of vehicle sales in 2013 is unique to Brazil (Figure 3‑3)
hybrid-gasoline vehicles achieve reduced fuel consumption by incorporating in the drivetrain a battery and an electric motor in addition to an internal combustion (ic) engine this technology permits the ic engine to shut down when the vehicle is decelerating and is stopped braking energy to be recovered and the ic engine to be downsized and operated at more efficient operating points Depending on the level of complexity hybrid systems can achieve 15 to 35 reductions in fuel consumption with respect to similar-sized vehicles
Despite having very limited penetration sales of new hybrid vehicles have increased three-fold from 131 units in 2012 to 432 in 2013 primarily in the medium and sports segments two manufacturers sell the most gasoline hybrid models (not flex-fuel) in Brazil including the toyota Prius and the Ford Fusion hybrid
Diesel engines offer 20 to 25 reduction in fuel consumption over traditional gasoline multi-point fuel injection (MPFi) engines due to higher compression ratios reduced pumping losses and 12 higher energy content per liter of fuel the challenge for further commercialization is twofold the complexity and additional cost of advanced exhaust after-treatment technologies that reduce emissions of particulate matter and oxides of nitrogen to levels comparable to those of gasoline and FFV engines
sales of diesel passenger vehicles are not allowed in Brazil with the exception of vehicles with some off-road characteristics Despite having a small penetration (around 05) sales of diesel passenger vehicles increased by 16 in 2013 toyota sells the most diesel passenger vehicles followed by Mitsubishi land rover gM and Mercedes-Benz the light-duty diesel market in Brazil is equivalent to the us and china in terms of market penetration and much below the penetration in europe and south Korea although air quality concerns in europe might trigger lower sales of diesel vehicles in coming years
7 Most of the modifications with respect to a gasoline-only vehicle (e00) include changes to fuel systemrsquos materials that are compatible with the oxygen content of ethanol blends and changes to air and fuel ratio management systems (mainly software based)
14
Brazil Passenger Vehicle Market statistics
0
10
20
30
40
50
60
70
80
90
100
Subco
mpac
t
Compac
t
Medium
Larg
eSport
O-Road SUV
Miniva
nTo
tal
Mar
ket
shar
e
Diesel Hybrid Gasoline Flex
Figure 3‑1 ndash Fuel type by segment
0102030405060708090
100
Fiat GM
Volkswag
enFord
Renau
lt
Hyund
ai
Honda
Toyo
taPSA
Nissan
Mitsub
ishi
KIAJA
CBMW
Land
Rove
r
Merce
des-B
enz
Chery
Audi
Suzuk
iJe
epTo
tal
Tech
nolo
gy
shar
e
Diesel Hybrid Gasoline Flex
Figure 3‑2 ndash Fuel type by manufacturer
0
10
20
30
40
50
60
70
80
90
100
China2010
Korea2011
EU-272013
US2013
Japan2011
India2012
Brazil2013
Tech
nolo
gy
shar
e
Diesel Hybrid Gasoline CNGLPGFlex
Figure 3‑3 ndash Fuel type international comparison
15
ICCT white paper
NUMBER OF CYLiNDERSacross all vehicle markets 4-cylinder engines are the most common design in automobile engines with displacements below 25 liters this engine configuration presents the right balance between complexity and performance for the target vehicle segments (small to mid-size sedans suVs and some off-road vehicles) engines with six and more cylinders are designed to provide a smoother vehicle driving experience with lower vibration and noise than 4-cylinder engines can provide and with higher power output this better overall performance comes at a higher cost driving their widespread use in large and luxury vehicles and heavier suVs and off-road vehicles
the need to attain better energy consumption has resulted in a recent wave of 3-cylinder engines from a handful of manufacturers in vehicles that typically used 4-cylinder engines achieving similar or better performance this practice is known as engine downsizing Downsizing can also be applied to larger engines from V-8s to V-6s and from V-6s to i-4s in most cases engine downsizing is accompanied with turbocharging and changes to the fuel delivery system
Four-cylinder engines dominate the passenger vehicle market in Brazil and are sold in more than 90 of new vehicles among all segments except the sports off-road and minivan segments (Figure 3‑4) Despite its predominance sales of 4-cylinder engines fell from over 307 to 293 million units between 2012 and 2013 equivalent to a 4 reduction 4-cylinder vehicles represent the majority of sales among the 20 top manufacturers except for hyundai and jeep (Figure 3‑5) although 4-cylinder engines represent the dominant technology in all countries analyzed Brazil still has the largest market share (Figure 3‑6)
the most significant shift in market preferences in Brazil occurred with 3-cylinder engines this technology is becoming more popular with almost eight times more vehicles sold in 2013 compared to 2012 reaching almost 75000 units in 2013 almost all 3-cylinder engines are being sold as compact vehicles instead of the smaller subcompact segment hyundai is the technology leader in sales of 3-cylinder high-efficiency Kappa engines8 japan and india have relatively high penetration of 3-cylinder engine technology in india the popularity of 2- and 3-cylinder vehicles is primarily driven by lower price tags (lt usD $8000)
six-cylinder engines are third in sales after 4- and 3-cylinder engines with absolute numbers close to 25000 units sold in 2013 its market share reduced by 13 with respect to 2012 six-plus cylinder engines are being sold mostly in the sports off-road and minivan segments Manufacturers that cater to the most expensive models and segments dominate the market of vehicles with six-plus cylinder engines such as land rover BMW and Mercedes-Benz the penetration of 6-plus-cylinder engines in Brazil is very low compared to other countries
Five-cylinder engines are not very common in Brazil or other countries and are losing market with respect to 2012 sales by 56 Volkswagen audi and Volvo are the only manufacturers that offered 5-cylinder engines in Brazil in 2013
8 hyundairsquos 3-cylinder Kappa engine httpworldwidehyundaicomWWshowroomcarshB20PiPindexhtml
16
Brazil Passenger Vehicle Market statistics
0
10
20
30
40
50
60
70
80
90
100
Subco
mpac
t
Compac
t
Medium
Larg
eSport
O-Road SUV
Miniva
nTo
tal
Tech
nolo
gy
shar
e
8+ 6 5 4 3
Figure 3‑4 ndash number of cylinders by segment
0102030405060708090
100
Fiat GM
Volkswag
enFord
Renau
lt
Hyund
ai
Honda
Toyo
taPSA
Nissan
Mitsub
ishi
KIAJA
CBMW
Land
Rove
r
Merce
des-B
enz
Chery
Audi
Suzuk
iJe
epTo
tal
Tech
nolo
gy
shar
e
8+ 6 5 4 3
Figure 3‑5 ndash number of cylinders by manufacturer
0
10
20
30
40
50
60
70
80
90
100
China2010
Korea2011
EU-272013
US2013
Japan2011
India2012
Brazil2013
Tec
hno
log
y sh
are
8+ 6 5 4 3 2
Figure 3‑6 ndash number of cylinders international comparison
17
ICCT white paper
TRaNSMiSSiONtransmission technologies can reduce energy consumption in two ways First by allowing engine operation on a more efficient region of the engine map and second by reducing the mechanical losses within transmissions traditionally manual transmissions have offered better energy consumption than traditional automatic transmissions (with 4 or 5 speeds) due to lower friction losses however new generation of automatic transmissions with higher number of gears lower friction better materials and computer-controlled shift points have not just closed the gap between manual and automatic transmission performance but even exceed manual transmission performance
new technologies such as dual-clutch transmissions (Dcts) and continually variable transmissions (cVts) are gaining market share due to the need for lower vehicle energy consumption Dcts can be defined as manual transmissions with electro-hydraulically operated dual-clutch systems allowing for faster shifting times and selective automatic or ldquomanualrdquo operation as opposed to manual automatic and Dct transmissions which have a discrete number of gear ratios cVts have a theoretically infinite choice of ratios between fixed limits which allows engines to be further optimized for minimizing energy consumption cVt technology has been used in lower-horsepower vehicles because of maximum-torque limitations with the most common metal-belt design (nas 2011) these advanced transmission technologies offer significant benefits in energy consumption compared to traditional manual or automatic technologies according to the us national academy of sciences a 6-speed Dct provides 6 to 9 lower energy consumption than a 4-speed automatic transmission note that a traditional 6-speed automatic transmission provides an estimated 3 to 5 benefit the energy consumption benefit of cVt depends on the application and is estimated to be 1 to 7 (nas 2011)
although vehicle sales with manual transmissions are predominant in Brazil the penetration of automatic transmissions cVts and Dcts is increasing resulting in a market share loss for manual transmissions of about 6 between 2012 and 2013 (Table 3‑1) With the exception of sports and off-road segments manual transmission technology has the largest market share in all segments but it tends to become less predominant as vehicles grow in size and comfort level (Figure 3‑7) the top five manufacturers sell most of their vehicles with manual transmissions but their market share is somewhat smaller for other high-selling manufacturers that cater to a more affluent market (Figures 3‑8)
automatic transmissions are becoming increasingly popular in Brazil experiencing an increase of 28 in sales between 2012 and 2013 automatic transmissions dominate the sports and off-road segments Kia BMW land rover Mercedes-Benz and jeep adopt this type of transmission technology for most of their vehicle sales
Dct transmissions are entering the Brazilian market mostly through the sports segment via imported models the sales of Dct equipped vehicles increased in 2013 by 22 with respect to 2012 Dct technology is being offered mainly by manufacturers that sell sports vehicles such as audi in more than 67 of their vehicles and Mercedes-Benz in more than 15 of their vehicles the global leader in Dct adoption is europe followed by the us (Figure 3‑9)
cVt technology market is still relatively small being sold by small volume manufacturers like jeep audi and Mitsubishi with more than 25 of new vehicle sales each nissan renault honda and toyota also sell vehicles with cVt technology cVt penetration in Brazil is similar to europersquos cVt is the leading transmission technology in japan with more than 65 of the market
18
Brazil Passenger Vehicle Market statistics
0
10
20
30
40
50
60
70
80
90
100
Subco
mpac
t
Compac
t
Medium
Larg
eSport
O-Road SUV
Miniva
nTo
tal
Tech
nolo
gy
shar
e
DCT CVT Automatic Manual
Figure 3‑7 ndash transmission by segment
0
10
20
30
40
50
60
70
80
90
100
Fiat GM
Volkswag
enFord
Renau
lt
Hyund
ai
Honda
Toyo
taPSA
Nissan
Mitsub
ishi
KIAJA
CBMW
Land
Rove
r
Merce
des-B
enz
Chery
Audi
Suzuk
iJe
epTo
tal
Tech
nolo
gy
shar
e
DCT CVT Automatic Manual
Figure 3‑8 ndash transmission by manufacturer
0
10
20
30
40
50
60
70
80
90
100
China2010
Korea2011
EU-272013
US2013
Japan2011
India2012
Brazil2013
Tech
nolo
gy
shar
e
DCT CVT Automatic Manual
Figure 3‑9 ndash transmission international comparison
19
ICCT white paper
NUMBER OF GEaR RaTiOS as mentioned in the previous section increasing the number of gear ratios (whether manual automatic dual-clutch or continuously variable) allows the engine to be operated in the best efficiency region resulting in energy consumption benefits compared to an automatic four-gear ratio transmission (also known as 4-speed transmission) higher ratio automatic transmissions could reduce energy consumption from 2 to 3 (for a five-gear ratio) to 6 to 8 (for an eight-gear ratio) (ePanhtsa 2010)
Four-gear ratio transmissions are losing market share in Brazil by more than 5 between 2012 and 2013 (Table 3‑1) these transmissions are particularly high sellers in the suV and minivan segments which suggest that some models in these more expensive segments are being sold with outdated technologies (Figure 3‑10) Most manufacturers are phasing out this type of transmission (Figure 3‑11) although jeep suzuki and toyota are lagging behind other manufacturers the four-gear ratio transmission technology has been losing market share in most countries even in india where smaller and inexpensive cars dominate the market 4-speed transmissions have the smallest market share (Figure 3‑12)
Five- and six-gear ratio transmissions were predominant in the Brazilian market in 2013 Five-gear ratio transmissions are dominant in all segments except for the off-road and sports segments which have adopted six-gear ratio transmissions in most sales the significant market share of five- and six-gear ratio transmissions is similar to most countries although the us europe and south Korea show higher shares of six and more gear ratios
seven- and eight-gear ratio transmissions which are considered emerging technologies have experienced an increase in sales in Brazil with over twice as many sales in 2013 compared to 2012 seven- and eight-gear ratio transmissions are popular among the large sports and off-road segments all of which are imported models luxury manufacturers such as Mercedes-Benz and audi are selling the most seven-gear vehicles as a share of their sales Volkswagen and toyota are also selling similar numbers of seven-gear ratio vehicles although for Volkswagen and toyota it represented less than 3 of their brand sales BMW and land rover are the leaders in eight-gear ratio vehicles
20
Brazil Passenger Vehicle Market statistics
0
10
20
30
40
50
60
70
80
90
100
Subco
mpac
t
Compac
t
Medium
Larg
eSport
O-Road
SUV
Miniva
nTo
tal
Tech
nolo
gy
shar
e
8 7 6 5 4
Figure 3‑10 ndash number of gear ratios by segment
0
10
20
30
40
50
60
70
80
90
100
Fiat GM
Volkswag
enFord
Renau
lt
Hyund
ai
Honda
Toyo
taPSA
Nissan
Mitsub
ishi
KIAJA
CBMW
Land
Rove
r
Merce
des-B
enz
Chery
Audi
Suzuk
iJe
epTo
tal
Tech
nolo
gy
shar
e
8 7 6 5 4
Figure 3‑11 ndash number of gear ratios by manufacturer
0
10
20
30
40
50
60
70
80
90
100
Tech
nolo
gy
shar
e
Six or more Five Four or fewer
China2010
Korea2011
EU-272013
US2013
India2012
Brazil2013
Figure 3‑12 ndash number of gear ratios international comparison
21
ICCT white paper
DRiVETRaiNDrivetrain technology includes front-wheel drive (FWD) rear-wheel drive (rWD) and all-wheel drive (aWD) vehicles For the same vehicle size FWD vehicles provide more interior space and better energy consumption than rWDs due to lower weight as it avoids the added weight of and space for the driveshaft and differential that rWD requires Because the weight of the engine and transmission is located close to the wheels FWD vehicles have better traction than rWDs rWDs however show better handling as the weight distribution between the front and rear wheels is more uniform and the tasks of turning and acceleration are split between the front and rear wheels also directing large amounts of power through the front wheels can create ldquotorque steerrdquo thus rWD is the adequate technology for the sports segment aWD drivetrains are intended for specific driving applications that imply loss of traction such as off-road terrains snow or towing
FWD vehicles dominate all segments of the Brazilian passenger car market (Table 3‑1) with the exception of the off-road segment (Figure 3‑13) among the 20 largest manufacturer sellers most except for BMW land rover Mercedes-Benz and suzuki offer FWD technology (Figure 3‑14) Brazil has the highest market share of FWD vehicles of all countries analyzed (944) although FWD has at least 50 market share in all seven countries (Figure 3‑15)
aWD market share increased by 15 between 2012 and 2013 due to a tri-fold increase in the sports segment sales off-road vehicle sales with aWD also increased to more than 76000 units in 2013 amongst the largest ten manufacturers toyota is the aWD market leader followed by Ford and Volkswagen note that land rover sells only aWD vehicles in Brazil among non-luxury manufacturers Mitsubishi and suzuki are selling more than 50 of their vehicles with aWD technology
rWD technology is offered mostly in large and sports vehicles and in suVs among the 10 largest manufacturers rWD is offered mainly by gM and toyota while an extended examination of the 20 largest manufacturers by sales show that aWD and rWD is focused among the more expensive brands (Figure 3‑14) Mercedes-Benz and BMW sell close to 90 of their vehicles with rWD technology traditionally associated with engine performance and responsiveness
22
Brazil Passenger Vehicle Market statistics
0
10
20
30
40
50
60
70
80
90
100
Subco
mpac
t
Compac
t
Medium
Larg
eSport
O-Road SUV
Miniva
nTo
tal
Tehn
olo
gy
shar
e
AWD RWD FWD
Figure 3‑13 ndash Drivetrain by segment
0
10
20
30
40
50
60
70
80
90
100
Fiat GM
Volkswag
enFord
Renau
lt
Hyund
ai
Honda
Toyo
taPSA
Nissan
Mitsub
ishi
KIAJA
CBMW
Land
Rove
r
Merce
des-B
enz
Chery
Audi
Suzuk
iJe
epTo
tal
Tech
nolo
gy
shar
e
AWD RWD FWD
Figure 3‑14 ndash Drivetrain by manufacturer
0
10
20
30
40
50
60
70
80
90
100
China2010
Korea2011
EU-272013
US2013
Japan2011
India2012
Brazil2013
Tech
nolo
gy
shar
e
AWD RWD FWD
Figure 3‑15 ndash Drivetrain international comparison
23
ICCT white paper
VaLVE CaMShaFT CONFiGURaTiON (DOhC VS SOhC)the engine camshaft governs the timing duration and lift of valve operation controlling the intake of air and the exhaust of combustion gases this report focuses on single overhead camshafts (sohc) and dual overhead camshafts (Dohc) as these configurations have almost completely replaced the older overhead valve configuration (ohV) sohc design places a single camshaft above the cylinder head that governs all the valves intake and exhaust in the case of sohc V-engines there is one single camshaft per head Dohc designs use separate camshafts for intake valves and exhaust valves Dohc engines achieve increased airflow at high-engine speeds improve volumetric efficiency and reduce the valvetrainrsquos moving mass such engines typically develop higher power at high-engine speeds the us environmental Protection agency (ePa) and national highway traffic safety administration (nhtsa) estimate the effectiveness of Dohc over sohc to be between 1 and 25 (ePanhtsa 2010)
although Dohc produce more power and provide lower fuel consumption the Brazilian fleet is still mostly composed of sohcs vehicles (Table 3‑1) sohc technology is predominant among the subcompact compact and medium segments (Figure 3‑16) among manufacturers sohc technology is predominant among the five largest least expensive brands (Figure 3‑17) sales of vehicles with more advanced Dohc technology grew in 2013 by almost 36 with respect to 2012 albeit from a relatively smaller base this increase was experienced in all vehicle segments but in different magnitudes
although global data on this technology are scarce Figure 3‑18 indicates that most countries are moving away from sohc with Brazil being the only country analyzed where sohc is still predominant no data were available for the us or europe
24
Brazil Passenger Vehicle Market statistics
0
10
20
30
40
50
60
70
80
90
100
Subco
mpac
t
Compac
t
Medium
Larg
eSport
O-Road SUV
Miniva
nTo
tal
Tech
nolo
gy
shar
e
nd DOHC SOHC
Figure 3‑16 ndash Valve camshaft configuration by segment (nd no data)
0
10
20
30
40
50
60
70
80
90
100
Fiat GM
Volkswag
enFord
Renau
lt
Hyund
ai
Honda
Toyo
taPSA
Nissan
Mitsub
ishi
KIAJA
CBMW
Land
Rove
r
Merce
des-B
enz
Chery
Audi
Suzuk
iJe
epTo
tal
Tech
nolo
gy
shar
e
nd DOHC SOHC
Figure 3‑17 ndash Valve camshaft configuration by manufacturer (nd no data)
0
10
20
30
40
50
60
70
80
90
100
China2010
Korea2011
Japan2011
India2012
Brazil2013
Tech
nolo
gy
shar
e
nd OVC DOHC SOHC
Figure 3‑18 ndash Valve camshaft configuration international comparison (nd no data)
25
ICCT white paper
VaLVE aCTUaTiON improved valvetrain systems with variable valve actuation (VVa) technology either variable valve timing (VVt) or variable valve timing and lift (VVt+VVl) improves the enginersquos volumetric and thermodynamic efficiency they also enable further engine improvements such as internal exhaust gas recirculation and cylinder deactivation VVt alters the timing of the intake valve exhaust valve or both primarily to reduce pumping losses increase specific power and control residual exhaust gases VVl increases efficiency by optimizing airflow over a broader range of engine operation which reduces pumping losses and increases specific power VVl is accomplished by controlled switching between two or more cam profile lobe heights the most advanced technology VVt+VVl yields a wide range of performance optimization and volumetric efficiency including enabling the engine to be valve-throttled (no need for intake throttle) VVt provides energy consumption gains of 3 to 5 while the more flexible and complex VVt+VVl system can reach 4 to 8 (ePa amp nhtsa 2010)
VVa technology either VVt or VVt+VVl are emerging technologies in Brazil where most vehicles still have fixed-valve timing designs (Table 3‑1) Fixed technology is predominant among the smaller vehicle segments as well as suVs and minivans (Figure 3‑19) the five largest manufacturers sold more than 90 of their vehicles with fixed-valve technology in 2013 (Figure 3‑20) the international comparison indicates that only Brazil and india have not yet adopted VVa technologies for most of their light-duty fleet (Figure 3‑21)
VVt and VVt+VVl are being adopted across all segments including the subcompact segment but tend to be more predominant in high-end manufacturers a closer examination by manufacturer shows that most are offering some vehicles with either one of the VVa systems while honda and hyundai offer this technology in almost all vehicles (Figure 3‑20) honda is the technology leader in variable valve actuation with the adoption in the early 1990s of the Vtec system (Valve timing electronic control) VVt technologyrsquos market share grew by about 25 in 2013 primarily due to hyundairsquos sales from 80000 units in 2012 to almost 200000 units in 2013 hyundai offered the continuously variable valve technology (cVVt) in the large majority of vehicle sold in 2013 the sports segment is the one where VVt dominates the market Mitsubishi BMW and audi are also selling a large share of their vehicles with the VVt+VVl technology
26
Brazil Passenger Vehicle Market statistics
0
10
20
30
40
50
60
70
80
90
100
Subco
mpac
t
Compac
t
Medium
Larg
eSport
O-Road SUV
Miniva
nTo
tal
Tech
nolo
gy
shar
e
VVT+VVL VVT Fixed
Figure 3‑19 ndash Valve actuation by segment
0
10
20
30
40
50
60
70
80
90
100
Fiat GM
Volkswag
enFord
Renau
lt
Hyund
ai
Honda
Toyo
taPSA
Nissan
Mitsub
ishi
KIAJA
CBMW
Land
Rove
r
Merce
des-B
enz
Chery
Audi
Suzuk
iJe
epTo
tal
Tech
nolo
gy
shar
e
VVT+VVL VVT Fixed
Figure 3‑20 ndash Valve actuation by manufacturer
VVT+VVL VVT Fixed
0
10
20
30
40
50
60
70
80
90
100
China2010
Korea2011
US2013
Japan2011
India2012
Brazil2013
Tech
nolo
gy
shar
e
Figure 3‑21 ndash Valve actuation international comparison
27
ICCT white paper
FUEL SYSTEMS FOR GaSOLiNE VEhiCLESVehicle fuel systems describe the technology required to deliver fuel into the engine combustion chamber this section examines two gasolineflex technologies namely multi-point fuel injection (MPFi) and gasoline direct injection (gDi) MPFi is now the most common fuel-delivery system for gasoline engines used in passenger vehicles worldwide in sequential MPFi engines fuel is injected into the air stream next to the intake valve port while the intake valve is open to draw the air-fuel mixture into the cylinder some of the fuel is vaporized on the surface of the hot intake valve expanding and thus reduces the volumetric efficiency on gDi engines fuel is injected at high pressure directly into the combustion chamber improving volumetric efficiency and providing cooling of the airfuel charge within the cylinder which allows for higher compression ratios and increased thermodynamic efficiency gDi technology alone offers benefits of 2 to 5 with respect to MPFi engines but bigger benefits rely on the synergy between gDi turbocharging and downsizing which can reach 12 to 15 energy consumption reduction with respect to a MPFi naturally aspirated engine (ePa 2012)
Table 3‑1 illustrates that MPFi is still the most common fuel injection technology for gasolineflex vehicles in Brazil which is reflected in its dominant share across most segments except for sports and off-road vehicles in Brazil gDi has found a niche market in the sports and off-road segments with more than 90 of sport vehicles fitted with gDi technology (Figure 3‑22) Within the overall gasoline market the gDi technology is still an emerging technology representing just 24 of new sales gDirsquos market share increased by 31 in 2013 with all but 4000 units being imported among the 10 largest manufacturers the adoption of gDi is extremely low below 5 for Volkswagen Ford hyundai and Psa (Figure 3‑23) high-end european brands (audi land rover Mercedes-Benz and BMW) are the technology leaders in terms of gDi adoption rates echoing the trend of turbocharging technology sales Volkswagen vehicles with gDi systems account for less than 35 of their sales in 2013 but their absolute numbers (around 19000 vehicles) place the company as one of the leaders in gDi technology in the Brazilian market
From a global market perspective the penetration of gDi technology in Brazil is low compared to all other markets in Figure 3‑24 except for india and japan it should be noted that the later has the largest share of hybrid vehicles around the globe
28
Brazil Passenger Vehicle Market statistics
0
10
20
30
40
50
60
70
80
90
100
Compac
t
Subco
mpac
t
Medium
Larg
eSport
O-Road SUV
Miniva
nTo
tal
Tech
nolo
gy
shar
e
GDI MPFI
Figure 3‑22 ndash gasolineflex fuel system by segment
GDI MPFI
0102030405060708090
100
Fiat GM
Volkswag
enFord
Renau
lt
Hyund
ai
Honda
Toyo
taPSA
Nissan
Mitsub
ishi
KIAJA
CBMW
Land
Rove
r
Merce
des-B
enz
Chery
Audi
Suzuk
iJe
epTo
tal
Tech
nolo
gy
shar
e
Figure 3‑23 ndash gasolineflex fuel system by manufacturer
GDI MPFI
0
10
20
30
40
50
60
70
80
90
100
China2010
Korea2011
EU-272013
US2013
Japan2011
India2012
Brazil2013
Tech
nolo
gy
shar
e (n
on-
die
sel)
Figure 3‑24 ndash gasolineflex fuel system international comparison
29
ICCT white paper
TURBOChaRGiNGengine power is primarily limited by the rate at which the engine is able to draw air into the combustion chamber turbocharging and supercharging are two methods to increase the amount of air drawn into the engine above the level of what is possible with the naturally aspirated process (through the expansion of the cylinders) By increasing the amount of air into the engine the amount of fuel can be proportionally increased resulting in increased power output level and with it the ability to reduce engine displacement while maintaining performance the combination of turbocharging and downsizing in spark ignited (gasoline and flex-fuel) vehicles can provide energy consumption improvements between 2 to 6 with respect to a direct-injected gDi engine (ePa amp nhtsa 2010) turbocharging technology is the cornerstone for achieving better energy consumption in vehicles as the basis for downsizing and reducing the engine weight while keeping the same or better vehicle performance (ie acceleration or time to reach certain speed) although turbochargers are used in diesel and gasolineflex vehicles the analysis in this report focuses on turbocharging for spark-ignited gasolineflex vehicles only
turbocharging is one of the most important emerging technologies in Brazil where most vehicles are still naturally aspirated (na) (Table 3‑1) turbocharging technology has increased the market share significantly between 2012 and 2013 by more than 65 albeit from a small base (from about 49000 to 81000 vehicles)
Most vehicles with turbocharging are sold in the sports and off-road segments as this technology also produces superior engine power output (Figure 3‑25) among the 10 largest manufacturers turbocharging is still below 10 of their sales (Figure 3‑26) Volkswagen and Ford despite having small relative sales of vehicles with turbocharging (less than 35) are the manufacturers with the highest total sales of vehicles with turbocharging audi land rover Mercedes-Benz and BMW are the technology leaders with more than 90 of vehicle sales in 2013
the penetration of turbo and supercharging technologies in Brazil is lower than in other countries with a larger gasoline fleet such as the us china and japan (Figure 3‑27) in Brazil 95 of diesel passenger vehicle sales have turbocharging technology
30
Brazil Passenger Vehicle Market statistics
0
10
20
30
40
50
60
70
80
90
100
Compac
t
Subco
mpac
t
Medium
Larg
eSport
O-Road SUV
Miniva
nTo
tal
Tech
nolo
gy
shar
e (n
on-
Die
sel)
Turbo NA
Figure 3‑25 ndash turbocharging for gasolineflex fuel vehicles by segment (NA naturally aspirated)
0102030405060708090
100
Fiat GM
Volkswag
enFord
Renau
lt
Hyund
ai
Honda
Toyo
taPSA
Nissan
Mitsub
ishiKIA
JACBMW
Land
Rove
r
Merce
des-B
enz
Chery
Audi
Suzuk
iJe
epTo
tal
Tech
nolo
gy
shar
e (n
on-
Die
sel)
Turbo NA
Figure 3‑26 ndash turbocharging for gasolineflex fuel vehicles by manufacturer (NA naturally aspirated)
0
10
20
30
40
50
60
70
80
90
100
China2010
Korea2011
EU-272013
US2013
Japan2011
India2012
Brazil2013
Tech
nolo
gy
shar
e (n
on-
die
sel)
Turbo NA
Figure 3‑27 ndash turbocharging for gasolineflex fuel vehicles international comparison (NA naturally aspirated)
31
ICCT white paper
4 vEhiCLE ENErGy CONSuMpTiON
this section analyzes the Brazilian new passenger vehicle energy consumption in 2013 although other metrics are more common (see box) vehicle energy consumption is presented in megajoules per kilometer (Mjkm) for consistency with Brazilrsquos inovar-auto policy in 2012 Brazilrsquos Ministry of Development industry and Foreign trade (MDic) adopted the inovar-auto policy with the aim of fostering industrial competitiveness through technology investments the policy includes a target for corporate average energy consumption (in Mjkm with vehicle curb weight as the attribute parameter) for vehicles sold in 2017
in the us canada Mexico and saudi arabia fleet-average fuel economy standards are defined as a function of vehicle footprint in the eu china japan south Korea and india vehicle weight is the attribute for the calculation of fleet-average targets in Brazil inovar-auto has defined its fiscal targets for vehicle energy consumption measured in megajoules per kilometer (Mjkm) as a function of vehicle weight
VEhiCLE ENERGY MEaSUREMENT UNiTS
Many metrics can be used to describe the amount of fuel energy or emissions generated by unit of distance traveled
Fuel economy measures distance traveled per unit of fuel consumed in Brazil kilometers per liter (kml) is the most common metric to describe vehicle efficiency but other units are used in different countries such as miles per gallon (mpg) in the us
Fuel consumption is the reciprocal of fuel economy and measures fuel consumed per distance traveled it is usually expressed in liters per 100 kilometers (l100 km) and it is used in europe for example
GhGCO2 emissions measures ghg or co2 emissions per distance traveled expressed as grams of pollutant per kilometer or mile
Energy consumption (EC) measures the energy consumed per distance traveled for example in megajoules per kilometer Despite being a less common metric it is sometimes preferred for being a fuel-neutral metric across different types of fuel and vehicle technologies Vehicle energy consumption in Mjkm is the metric used in Brazilrsquos inovar-auto policy to quantify the corporate average energy consumption target for each manufacturer Values for energy consumption in Brazilian spark-ignited vehicles are provided for e22 since that is the fuel mixture used in vehicle tests
Vehicle energy consumption in this report is calculated from co2 emissions data in the Brazilian institute of environment and renewable natural resources (iBaMa) nota Verde program (iBaMa 2014) which reports official emissions data from homologation tests Data are limited to passenger cars sold by the top 10 manufacturers with light commercial vehicles being excluded appendix D presents a description of data sources
32
Brazil Passenger Vehicle Market statistics
and calculation methodologies as well as a discussion of vehicle energy consumption data quality and completeness in Brazil
not surprisingly vehicle energy consumption increases with vehicle footprint and engine rated power the two parameters that define vehicle segments in Brazil (Figure 4‑1) subcompact and compact vehicles which accounted for about 45 of new sales in 2013 have average energy consumption below the fleet average while medium-sized vehicles which hold the largest market share (388) have energy consumption just above the fleet average larger more powerful vehicles consume more energy than the fleet average but have a considerably smaller market share (combined share of 163) Data availability for these segments is not as extensive as the data available for the subcompact compact and medium segments which could affect the relative rankings of each segment
Ene
rgy
cons
ump
tio
n (M
Jkm
)
Subco
mpac
t
Compac
t
Medium
Larg
e
O-road SUV
4000
200000
400000
600000
850000
35
30
25
20
15
10
05
0
Sales
Total 202
Figure 4‑1 ndash new vehicle sales-weighted average energy consumption by segment (2013)
33
ICCT white paper
Figures 4‑2 and 4‑3 illustrate new vehicle energy consumption for multiple weight and footprint bins For each weight bin (in 100 kg increments) and footprint bin (in 01 m2 increments) sales-weighted averages of energy consumption for each vehicle version are presented (dashes) generating energy consumption ranges for each bin (cream areas) Vehicle sales by bin are presented for reference in the lower charts
the strong correlation between vehicle energy consumption and weight follows from the strong physical relationship between the weight of the vehicle and the energy required to accelerate it and overcome resistances9 (Figure 4‑2) Data dispersion within each bin suggests that energy consumption varies due to other vehicle characteristics that affect vehicle aerodynamics and rolling resistance as well as the adoption of technologies that affect engine and transmission efficiency (eg friction reduction technologies gDi VVt)
Curb weight (kg)
SubcompactCompactMediumLargeO-roadSUV
Ene
rgy
cons
ump
tio
n (M
Jkm
)Sa
les
5
6
4
3
2
1
600k
800k
400k
200k
0k800 900 1000 1100 1200 1300 1400 1500 1600 1700 1800 1900 2000 2100
Figure 4‑2 ndash new vehicle energy consumption by vehicle weight (2013)
9 on a plain surface the sum of resistances of a vehicle is acceleration resistance + rolling resistance + aerodynamic resistance = c1 m a + c2 frr m + c3 cw a v2 with mass (m) as an integral part of both acceleration and rolling resistance which are most relevant for inner-city driving situations other factors are acceleration (a) rolling resistance of tires (frr) aerodynamic coefficient of the vehicle (cw) frontal area of vehicle (a) velocity (v) and constants (cx)
34
Brazil Passenger Vehicle Market statistics
Footprint has a reasonable correlation with energy consumption (Figure 4‑3) ie larger vehicles tend to consume more fuel than smaller vehicles however the correlation is not as strong as with vehicle weight similar to the previous figure the broad spread of energy consumption values suggests a combination of different vehicle characteristics (eg weight engine displacement rated power) and technologies (eg transmissions fuel systems) as well as the presence of suVs and off-road vehicles among the medium- and large-sized footprint values respectively
Footprint (m2)
SubcompactCompactMediumLargeO-roadSUV
Ene
rgy
cons
ump
tio
n (M
Jkm
)Sa
les
5
6
4
3
2
1
400k
500k
300k
200k
100k
0k31 32 33 34 35 36 37 38 39 40 41 42 43 44 45 46 48 49
Figure 4‑3 ndash new vehicle energy consumption by vehicle footprint (2013)
35
ICCT white paper
Figure 4‑4 illustrates sales weighted average for new vehicle energy consumption by mass for the top 10 manufacturers in Brazil in 2013 Bubble sizes are proportional to total vehicle sales Manufacturers in the lower-left quadrant produce the lightest and most efficient vehicles with hyundai presenting the best overall average energy consumption renault in the upper-left quadrant produces vehicles that are equivalent in weight but on average with higher energy consumption in the lower-right quadrant are manufacturers that produce relatively heavier vehicles but with lower energy consumption in their weight class Despite producing heavier vehicles on average than many manufacturers honda achieves lower energy consumption on average in the upper-right quadrant are manufacturers that produce on average the heavier and least efficient vehicles with Psa (citroen and Peugeot) producing the heaviest and least efficient cars on average a regression line correlating vehicle energy consumption and mass highlights the best performers (hyundai honda and nissan) average performers (Fiat Volkswagen gM and toyota) and those performing worse than average (renault Ford and Psa)
FIA
GMVW
FORREN
HYU
HON
TOY
PSA
NIS
160
170
180
190
200
210
220
230
240
250
950 1000 1050 1100 1150 1200 1250 1300 1350
Ene
rgy
cons
ump
tio
n (M
Jkm
)
Curb weight (kg)
Fleet Ave
Figure 4‑4 ndashaverage new vehicle sales-weighted energy consumption by manufacturer (2013)
36
Brazil Passenger Vehicle Market statistics
Figure 4‑5 shows fleet-average energy consumption based on certification and type approval data for new vehicles in multiple countries converted to the us caFe combined driving cycle Bubble sizes represent total sales of new passenger cars Because of data availability in different countries the country comparison is based on different calendars years for different countries 2011 for south Korea and japan 2012 for china and india and 2013 for europe the us and Brazil given annual improvements in vehicle energy consumption triggered by regulatory efficiency standards and fiscal incentives those countries with older data could be at a slight disadvantage in this comparison
With the heaviest vehicles on average the us fleet is also the most energy consuming of all countries china and south Korea have similar average energy consumption but since south Korean vehicles are heavier on average they are relatively more efficient than chinese vehicles although Brazilrsquos fleet consumes less fuel on average than those from the us china and south Korea its fleet is relatively inefficient when compared to countries with vehicles of similar weight (japan and india) the average Brazilian vehicle consumes about 34 more energy than the average vehicle in japan whose fleet has a large penetration of gasoline hybrid and advanced fuel-efficiency technologies such as three-cylinder engines VVa Dohc and 6-plus speed transmissions european vehicles are the best performing on average despite being heavier than all countries with the exception of the us and south Korea the adoption of fuel-efficiency technologies (eg Dct 6-plus-speed transmissions gDi turbocharging) contributes to europersquos better than average performance
China2012
SKorea2011
Europe2013
US2013
Japan2011
India2012
Brazil2013
Sales5 MM10 MM
14
16
18
20
22
24
26
28
1000 1100 1200 1300 1400 1500 1600 1700
Ene
rgy
cons
ump
tio
n ndash
CA
FE
(M
Jkm
)
Curb weight (kg)
Type-approval and certification energy consumption data only (does not include o-cycle or real-world driving data)
Figure 4‑5 ndash international comparison of passenger car energy consumption
Country labels indicate the dataset year
Figure 4‑6 provides a more detailed country comparison by illustrating average vehicle energy consumption by vehicle (curb) weight bin Vehicle sales in each bin are shown for reference the us is not shown due to lack of detailed model-by-model data Brazilrsquos vehicles on average have the highest energy consumption in most weight
37
ICCT white paper
bins with china being the second highest in most bins Because china has higher fuel consumption than Brazil on the 1000 bin which represents the highest share of vehicle sales fleet-average energy consumption in china is still higher than in Brazil as illustrated in the previous figure europe consistently performs best in terms of vehicle energy consumption in most weight bins with japan also performing relatively well
Curb weight (kg)
BrazilChinaEuropeIndiaJapanSouth Korea
Ene
rgy
cons
ump
tio
n C
AF
E (
MJ
km)
Sale
s
40
35
25
20
15
10
6M
8M
4M
2M
0M600 800 1000 1200 1400 1600 1800 2000 2200 2400
Figure 4‑6 ndash international comparison of average vehicle energy consumption by vehicle weight
Type-approval and certification energy consumption data only (does not include off-cycle or real-world driving data)
38
Brazil Passenger Vehicle Market statistics
Figure 4‑7 illustrates the distribution of energy consumption data in Brazil for each vehicle version by mass and segment Bubble sizes represent total sales of each version Data were limited to flex-fuel vehicles in the subcompact compact medium and large segments due to its relatively better data quality and representativeness (ie they represented over 87 of sales in 2013) While most vehicles follow a predictable trend that correlates energy consumption and vehicle mass there are a large number of versions with energy consumption substantially higher than the trend line this suggests there is substantial room for improvements in their energy consumption since there are vehicles in similar weight classes with substantially superior energy consumption performance
Sales1000050000
140
160
180
200
220
240
260
280
700 800 900 1000 1100 1200 1300 1400 1500 1600
Ene
rgy
cons
ump
tio
n (M
Jkm
)
Curb weight (kg)
Subcompact Compact Medium Large Fleet average
Figure 4‑7 ndash Distribution of new Brazilian passenger vehicle energy consumption data by vehicle weight and segment (2013)
this chapter suggests that there are potential improvements in vehicle energy consumption for the Brazilian fleet For similar vehicles in terms of weight class footprint or engine rating there is substantial dispersion in energy consumption indicating that there are vehicles performing much worse than the average across manufacturers there is also a clear trend of some manufacturers performing much better than the average while others have a lot more room for improvement the international comparison clearly shows that Brazilian vehicles perform much worse in terms of energy consumption than vehicles of similar weight suggesting a delay in the adoption of energy efficient technologies among Brazilian vehicle manufacturers
Finally a more detailed analysis of vehicle versions clearly illustrates a considerable number of vehicle versions significantly above average thus indicating potential improvements in energy consumption that would place them on par with better performing vehicles with similar characteristics
39
ICCT white paper
Deficiencies in data quality and completeness prevent more definite conclusions about vehicle energy consumption gasoline-only vehicles in particular have poor energy consumption data quality although they represent a relatively small fraction (6) of total vehicles sold in 2013 Because some vehicle segments are primarily composed of gasoline-only vehicles (eg sports minivans) this chapter excludes these segments from the analysis there are also concerns about the gap between energy consumption data reported by iBaMarsquos nota Verde and Brazilrsquos national institute of Metrology standardization and industrial Qualityrsquos (inMetro) labeling program (PBeV using its acronym in Portuguese) with the latter reporting consistently lower values of vehicle energy consumption
Finally the availability of energy consumption data was not adequate for many manufacturers beyond the top 10 sales group which prevented their inclusion in this analysis Despite the data quality and lack of completeness the energy consumption data in this chapter include data that are reasonably accurate and representative thus supporting its interpretation
40
Brazil Passenger Vehicle Market statistics
rEfErENCES
aDK automotive consultoria de Marketing (2013) relatoacuterios de volumes de vendas do mercado brasileiro para veiacuteculos de passeio e comerciais leves referentes a 2013
alves l Wilbert M (2014) reduccedilatildeo do imposto sobre Produto industrializado e a Venda de automoacuteveis Xi congresso usP iniciaccedilatildeo cientiacutefica em contabilidade
associaccedilatildeo nacional de transportes Puacuteblicos (antP 2014) estudo mostra baixo efeito do desconto no iPi de veiacuteculos sobre PiB e emprego available at httpwwwantporgbrwebsitenoticiasshowaspnpgcode=a4DeeFe8-a7BF-48D3-B1F5-8eDe1447BF10
associaccedilatildeo nacional dos Fabricantes de Veiacuteculos automotores (anFaVea 2015) anuaacuterio da induacutestria automobiliacutestica Brasileira 2015 Brazilian automotive industry Yearbook 2015 satildeo Paulo available at wwwanfaveacombr
european environment agency (2014) Monitoring co2 emissions from new passenger cars in the eu summary of data for 2013 april 2014
instituto Brasileiro do Meio ambiente e dos recursos naturais renovaacuteveis (iBaMa 2014) consulta dos niacuteveis de emissatildeo dos veiacuteculos novos brasileiros available at httpsservicosibamagovbrctfpublicosel_marca_modelo_rvepphp
international council on clean transportation (icct 2015) global passenger vehicle standards available at httpwwwtheicctorginfo-toolsglobal-passenger-vehicle-standards
international energy agency (iea 2015) renewables Bioenergy available at httpswwwieaorgtopicsrenewablessubtopicsbioenergy
Korea energy Management corporation (KeMco 2014) Fuel economy regulation available at httpwwwkemcoorkrnew_engmainmainasp
Marklines (2015) Marklines automotive industry Portal available at httpwwwmarklinescomen
Mendonccedila M sachsida a (2014) Modelando a demanda de creacutedito para veiacuteculos no Brasil uma abordagem com mudanccedila de regime iPea
Ministeacuterio do Desenvolvimento induacutestria e comeacutercio exterior (MDic 2013) Programa de incentivo agrave inovaccedilatildeo tecnoloacutegica e adensamento da cadeia Produtiva de Veiacuteculos automotores mdash inovar-auto httpwwwplanaltogov brccivil_03_ato2011-20142012DecretoD7819htm
stein r anderson j and Wallington t (2013) an overview of the effects of ethanol-gasoline Blends on si engine Performance Fuel efficiency and emissions SAE Int J Engines 6(1)470-487 2013 doi1042712013-01-1635
us environmental Protection agency and national highway traffic safety administration (ePanhtsa 2010) Final rulemaking to establish light-Duty Vehicle greenhouse gas emission standards and corporate average Fuel economy standards ePa-420-r-10-901
us environmental Protection agency (ePa 2012) regulatory impact analysis Final rulemaking for 2017-2025 light-Duty Vehicle greenhouse gas emission standards and corporate average Fuel economy standards ePa-420-r-12-016
41
ICCT white paper
us national academy of sciences (nas 2011) assessment of Fuel economy technologies for light-Duty Vehicles available at httpwwwnapeducatalog12924assessment-of-fuel-economy-technologies-for-light-duty-vehicles
World Bank group (2015) World Development indicators available at httpdataworldbankorgdata-catalogworld-development-indicators
42
Brazil Passenger Vehicle Market statistics
LiST Of ACrONyMS
4wD Four-wheel drive
aNFaVEa Brazilian association of automobile Manufacturers
awD all-wheel drive
BRiC Brazil russia india china
CaFE corporate average fuel economy
CBG compressed biogas
CO2 carbon dioxide
CVT continuously variable transmission
CVVT continuously variable valve technology
DCT Dual-clutch transmission
DOhC Dual overhead camshaft
EC energy consumption
Epa us environmental Protection agency
EU european union
FFV Flex-fuel vehicle
FTp Federal test procedure
FwD Front-wheel drive
GDi gasoline direct injection
GDp gross domestic product
GhG greenhouse gas
GM general Motors
iBaMa Brazilian institute of the environment and renewable natural resources
iC internal combustion
iCCT international council on clean transportation
iNMETRO national institute of Metrology standardization and industrial Quality
Kg Kilogram
Km Kilometer
Kw Kilowatt
LDV light-duty vehicle
LpG liquified petroleum gas
MDiC Ministry of Development industry and Foreign trade
MJ Megajoule
MpFi Multi-point fuel injection
Mpg Miles per gallon
NaS us national academy of sciences
43
ICCT white paper
NhTSa us national highway transportation safety administration
OhV overhead valve
pBEV Brazilian Vehicle labeling Program
pSa Psa Peugeot citroeumln
pTwR Power-to-weight ratio
pV Passenger vehicle
RwD rear-wheel drive
SOhC single overhead camshaft
SUV sport utility vehicle
US united states
USD us dollar
VTEC Valve timing electronic control
VVa Variable valve actuation
VVL Variable valve lift
44
Brazil Passenger Vehicle Market statistics
AppENDix A SEGMENT DEfiNiTiONS
Table a‑1 ndash segment definitions
Segmentpower (kw)
pTwR (kwkg) area (m2)
Other characteristics Examples
Subcompact lt 140 lt 0075 le 65 mdash Mini cooper chevrolet celta smart Fortwo
Compact lt 140 lt 0075 65 lt area le 70 mdash honda Fit hyundai hB20 Volkswagen Polo
Medium lt 140 lt 0075 70 lt area le 80 mdash honda civic nissan tiida Peugeot 308
Large lt 140 lt 0075 gt 80 mdash audi a4 BMW 3 series Mercedes c-class
Sports gt 140 gt 0075 mdash 4 seats maxjaguar XF lamborghini gallardo Ferrari california
Off‑road mdash mdash lt 80 traction = 4WDjeep cherokee honda cr-V BMW X3 hyundai santa Fe
SUV mdash mdash lt 80Based on aDKrsquos default classification
BMW X1 Ford ecosport hyundai tucson
Minivan mdash mdash Passengers 6-12
citroen grand Picasso Kia carnival
45
ICCT white paper
AppENDix b iNTErNATiONAL MArKET DATA
Table B‑1 ndash international market comparison of new fleet characteristics
parameters China S Korea EU US Japan india Brazil
Year 2012 2011 2013 2013 2011 2012 2013
Sales (million) 155 13 118 156 352 256 304
price (USD) $21008 $21383 $24439 mdash $20637 $11717 $22015
No of cylinders mdash 43 40 47 38 36 40
Displacement (cc) 1605 1960 1613 2606 1425 1294 1430
Curb weight (kg) 1296 1421 1391 1623 1193 1059 1106
Length (mm) 4323 4531 4263 mdash 4013 3859 4100
Footprint (m2) 38 420 40 425 371 341 367
Engine power (kw) 86 120 89 148 78 55 76
pTwR (kwkg) 00664 00844 00640 00912 00654 00519 00671
Energy consumption ndash US CaFE (MJKm)[1] 235 206 169 250 171 183 202
[1] energy consumption data presented here for countries other than Brazil were obtained from local official sources in its original metric and drive cycle and then converted to Mjkm under the us caFe drive cycle using the methodology described in Yang (2015) Mode details and historical fuel consumption data on their original metrics is presented in the icctrsquos global PV standard website httpwwwtheicctorginfo-toolsglobal-passenger-vehicle-standards
Data Sources
China Ministry of industry and information technology (Miit 2014) corporate average Fuel efficiency accounting Method for Passenger cars available at httpwwwgovcngzdt2013-0320content_2358627htm
Baseline performance china automotive research and technology center through internal communication and icct internal 2010 database for chinese light-duty vehicles
S Korea internal communication with s Korean official and from greencarcongress available at httpwwwgreencarcongresscom200906korea-20090604html
EU european environment agency (2014) Monitoring co2 emissions from new passenger cars in the eu summary of data for 2013 april 2014
US us ePa (2014) light-duty automotive technology carbon dioxide emissions and fuel economy trends1975 through 2014 table 91 page 110 available at http httpwwwepagovfueleconomyfetrends1975-2014420r14023apdf
Japan jaMa (2010) the Motor industry of japan available at httpwwwjama-englishjppublicationsMVs2010pdf Mlit httpwwwmlitgojpcommon000990330pdf
india Bureau of energy efficiency white paper 2010-2012 calculation based on icct database
Brazil icct Brazil Vehicle Database (2013)
46
Brazil Passenger Vehicle Market statistics
Table B‑2 ndash international market comparison of technology adoption in new vehicles
Technology adoption China S Korea EU US Japan india Brazil
Year 2010 2011 2013 2013 2011 2012 2013
Fuel type
CBGLpGFlex 0 11 2 0 0 4 94
Gasoline 99 65 44 93 86 56 6
hybrid 0 1 1 5 13 0 0
Diesel 1 23 53 1 0 40 0
No of cylinders
Two 0 0 0 0 0 6 0
Three 4 0 7 0 36 28 3
Four 90 84 87 56 57 65 97
Five 0 0 1 0 0 0
Six 6 15 4 32 5 0 1
Eight or more 0 0 0 12 1 0 0
Transmission
Manual 60 3 83 5 1 98 83
automatic 34 90 9 75 34 2 15
CVT 5 7 2 18 65 0 1
DCT 1 0 6 2 mdash 0 1
Number of gear ratios
Four or fewer 13 16 1 7 mdash 10 6
Five 68 9 45 11 mdash 85 83
Six or more 19 75 54 82 mdash 5 11
Drivetrain
FwD 74 86 81 83 59 76 0
RwD 21 7 7 10 5 22 0
4wD and awD 5 7 12 7 36 2 100
No of valves per cylinder
Two 17 mdash mdash 2 4 25 60
Multi valve 83 mdash mdash 98 95 75 40
Valve camshaft configuration
Single overhead camshaft 26 1 mdash mdash 16 41 63
Dual overhead camshaft 74 84 mdash mdash 82 53 25
Overhead camshaft mdash 15 mdash mdash 0 6 mdash
Valve actuation
Fixed 50 16 mdash 2 11 86 78
VVT 44 84 mdash 98 89 12 16
VVL 6 mdash mdash mdash mdash 2 6
Fuel systems for gasoline vehicles
Multi‑point fuel injection 94 72 68 62 95 100 98
Gasoline direct injection 6 28 32 37 5 0 2
air induction systems for gasoline vehicles
Naturally aspirated 93 75 41 85 92 64 97
Supercharger turbocharger or twin‑turbo 7 25 59 15 8 36 3
47
ICCT white paper
AppENDix C NEW vEhiCLE ChArACTEriSTiCS AND TEChNOLOGy ADOpTiON DATA iN brAziL
Table C‑1 ndash Fleet characteristics of new Brazilian passenger vehicles by segment (2013)
parameters Subcompact Compact Medium Large Sports Off‑road SUV Minivan
Sales (thousands) 6785 6843 11790 1920 273 768 1997 23
Market share () 223 225 38 8 63 09 25 65 01
price (R$) $30103 $38732 $45496 $66508 $148834 $151284 $75164 $82284
No of cylinders 400 391 399 400 462 448 404 433
Displacement (cc) 1128 1293 1447 1794 2430 2586 1884 2244
Curb weight (kg) 940 1037 1102 1329 1561 1772 1395 1604
Length (mm) 3804 4026 4163 4499 4711 4516 4352 4658
Footprint (m2) 339 361 371 402 418 409 402 427
Engine power ndash gasoline (kw) 58 68 75 99 183 146 103 120
Engine power ndash ethanol (kw) 59 70 77 98 mdash 109 101 mdash
pTwR ndash gasoline (kwkg) 00614 00655 00671 00742 01173 00828 00731 00732
pTwR ndash ethanol (kwkg) 00630 00678 00697 00757 mdash 00766 00745 mdash
48
Brazil Passenger Vehicle Market statistics
Table C‑2 ndash Fleet characteristics of new Brazilian passenger vehicles by manufacturer (2013)
parameters Fiat
GM
Vo
lksw
agen
Ford
Ren
ault
hyu
ndai
ho
nda
Toyo
ta
pSa
Nis
san
Mit
sub
ishi
Kia
JaC
BM
w
Land
Rov
er
Mer
ced
es‑B
enz
Che
ry
aud
i
Suzu
ki
Jeep
Sales (thousands) 6087 5486 5448 3074 2207 2055 1392 1334 1163 621 368 255 158 141 106 94 80 67 63 36
Market share () 2002 1804 1792 1011 726 676 458 439 383 204 121 084 052 046 035 031 026 022 021 012
price (R$) $35017 $42259 $38701 $46174 $43447 $50112 $67078 $68922 $103001 $44035 $100696 $87009 $37654 $165111 $221943 $153281 $30821 $142799 $74769 $139039
No of cylinders 400 401 400 402 400 370 400 400 400 400 408 416 400 424 448 431 400 411 400 552
Displacement (cc) 1250 1340 1287 1497 1423 1495 1691 1808 1575 1579 2262 1856 1411 2095 2281 1934 1398 1912 1831 3182
Curb weight (kg) 1033 1060 1020 1156 1102 1122 1210 1201 1231 1069 1556 1377 1079 1624 1868 1598 1097 1551 1444 1945
Length (mm) 3965 4155 3993 4120 4127 4078 4319 4299 4116 4171 4401 4357 3956 4574 4487 4527 3896 4454 4234 4584
Footprint (m2) 345 370 354 368 378 383 397 387 376 379 395 407 351 429 433 429 349 417 323 420
Engine power ndash gasoline (kw) 64 71 65 79 73 86 96 90 80 82 120 112 83 151 179 138 71 136 94 162
Engine power ndash ethanol (kw) 65 72 65 79 76 85 97 90 81 82 107 106 95 mdash mdash mdash 75 mdash mdash mdash
pTwR ndash gasoline (kwkg)
00613 00662 00631 00674 00657 00739 00788 00745 00646 00766 00779 00792 00784 00921 00977 00856 00638 00870 00649 00835
pTwR ndash ethanol (kwkg) 00629 00681 00642 00693 00685 00781 00800 00795 00660 00768 00710 00798 00896 mdash mdash mdash 00659 mdash mdash mdash
49
ICCT white paper
Table C‑3 ndash Fleet characteristics of new Brazilian passenger vehicles by origin (2013)
parameters Domestic imported
Sales (thousands) 2537 504
Market share () 834 166
price (R$) $41739 $76049
No of cylinders 397 412
Displacement (cc) 1359 1791
Curb weight (kg) 1070 1289
Length (mm) 4063 4285
Footprint (m2) 362 390
Engine power ndash gasoline (kw) 70 102
Engine power ndash ethanol (kw) 73 84
pTwR ndash gasoline (kwkg) 0065 0076
pTwR ndash ethanol (kwkg) 0068 0074
50
Brazil Passenger Vehicle Market statistics
Table C‑4 ndash technology adoption in new Brazilian passenger vehicles by segment (2013)
Technology adoption Subcompact Compact Medium Large SportOff‑road SUV Minivan
Fuel type
Flex 982 988 982 837 00 134 826 00
Gasoline 18 12 17 163 996 540 174 1000
hybrid 0000 0000 0028 0000 0396 0001 0000 0000
Diesel 00 00 00 00 00 326 00 00
No of cylinders
Three 01 91 10 00 00 00 00 00
Four 999 909 990 998 758 775 979 833
Five 00 00 00 02 03 00 00 00
Six 00 00 00 00 175 211 21 167
Eight or more 00 00 00 00 63 13 00 00
Transmission
Manual 993 944 826 622 62 174 505 641
automatic 07 55 161 283 629 707 451 359
CVT 00 00 12 89 09 93 34 00
DCT 00 01 02 06 299 25 10 00
No of gear ratios
Four or fewer 04 47 72 51 00 34 247 193
Five 984 943 848 378 15 392 516 641
Six 12 09 73 515 796 462 225 167
Seven 00 01 06 23 87 53 12 00
Eight or more 00 00 01 32 102 59 00 00
Drivetrain
FwD 998 1000 997 688 550 00 916 1000
RwD 02 00 03 311 221 00 84 00
awD 00 00 00 01 229 1000 00 00
No of valves per cylinder
Two 806 694 584 195 00 00 258 00
Multi valve 194 306 416 805 1000 1000 742 1000
Valve camshaft configuration
Single overhead camshaft 839 786 709 309 00 212 375 00
Dual overhead camshaft 24 158 161 546 880 517 446 255
Valve actuation
Fixed 982 729 807 461 49 493 664 868
VVT 18 211 115 470 827 367 252 132
VVT+VVL 00 61 78 68 124 140 84 00
Fuel systems for gasoline vehicles
Multi‑point fuel injection 999 998 997 949 979 143 766 1000
Gasoline direct injection 01 02 03 51 21 857 234 00
air induction systems for gasoline vehicles
Naturally aspirated 999 997 995 943 974 369 543 1000
Supercharger turbocharger or twin‑turbo 01 03 05 57 26 631 457 00
51
ICCT white paper
Table C‑5 ndash technology adoption in new Brazilian passenger vehicles by manufacturer (2013)
Technology adoption Fi
aT
GM
VO
LKSw
aG
EN
FOR
D
REN
aU
LT
hY
UN
Da
i
hO
ND
a
TOYO
Ta
pSa
NiS
SaN
MiT
SUB
iSh
i
Kia
JaC
BM
w
LaN
D R
OV
ER
MER
CED
ES
Fuel type
Flex 990 987 965 966 997 921 999 886 928 998 283 739 31 42 00 00
Gasoline 10 09 35 34 03 79 01 35 72 02 557 255 969 957 663 950
hybrid 00 00 00 00 00 00 00 02 00 00 00 00 00 00 00 00
Diesel 00 04 00 00 00 00 00 77 00 00 160 06 00 00 337 50
No of cylinders
Three 00 00 05 00 00 348 00 00 00 00 00 00 00 00 00 00
Four 1000 996 994 989 1000 626 999 998 1000 1000 958 922 1000 906 787 878
Five 00 00 00 00 00 00 00 00 00 00 00 00 00 00 00 00
Six 00 02 01 11 00 26 01 02 00 00 42 78 00 68 185 87
Eight or more 00 02 00 00 00 00 00 00 00 00 00 00 00 26 28 35
Transmission
Manual 992 878 985 846 853 632 566 565 703 785 493 120 1000 02 00 151
automatic 08 103 00 137 62 285 355 160 297 121 118 793 00 575 18 14
CVT 00 19 15 16 41 70 01 246 00 00 139 87 00 423 982 836
DCT 00 00 00 00 43 13 78 30 00 94 251 00 00 00 00 00
No of gear ratios
Four or fewer 02 04 00 55 104 237 00 323 249 132 17 133 00 00 00 00
Five 981 811 963 839 797 623 861 643 684 828 530 107 1000 00 00 64
Six 17 185 29 106 99 140 139 07 67 40 453 754 00 217 800 00
Seven 00 00 07 00 00 00 00 27 00 00 00 00 00 08 00 936
Eight or more 00 00 00 00 00 00 00 00 00 00 00 06 00 775 200 00
Drivetrain
FwD 1000 902 989 972 987 985 990 892 1000 1000 496 623 1000 00 00 00
RwD 00 91 00 00 00 00 00 16 00 00 00 370 00 882 00 900
awD 00 06 11 28 13 15 10 92 00 00 504 07 00 118 1000 100
No of valves per cylinder
Two 811 864 988 745 220 00 00 00 00 00 00 00 00 00 00 00
Multi Valve 189 136 12 255 780 1000 1000 1000 1000 1000 1000 1000 1000 1000 1000 1000
Valve camshaft configuration
SOhC 836 755 914 675 832 00 04 00 497 398 331 00 00 00 00 00
DOhC 07 108 56 50 168 992 786 875 352 428 477 1000 907 810 860 453
Valve actuation
Fixed 1000 898 965 966 940 29 00 574 736 573 435 76 124 187 18 55
VVT 00 102 35 34 60 971 00 426 264 427 00 924 876 00 982 945
VVT+VVL 00 00 00 00 00 00 1000 00 00 00 565 00 00 813 00 00
air induction System
Naturally aspirated 997 994 966 977 997 988 1000 923 922 1000 835 936 1000 97 37 101
Supercharger turbocharger or twin‑turbo
03 06 34 23 03 12 00 77 78 00 165 64 00 903 963 899
Fuel systems for gasoline vehicles
Multipoint fuel injection 1000 995 965 972 1000 989 1000 1000 967 1000 994 1000 1000 78 15 158
Gasoline Direct injection 00 05 35 28 00 11 00 00 33 00 06 00 00 922 985 842
note Difference between 100 and summation of sohc and Dohc market share values corresponds to data not available
52
Brazil Passenger Vehicle Market statistics
AppENDix D DATA SOurCES AND COMpLETENESS
the basis of the statistics shown in this report is a database compiled by the icct with vehicle sales technical information (eg fleet characteristics technology content) and energy consumption (converted from either co2 emissions or fuel economy) from various data sources outlined in table D-1
Table D‑1 ndash Brazilian data sources
parameters Sales TechnicalEnergy
consumption
aDK (2014 2015) x x
MarkLines (2015) x
iBaMa (2014) x
iNMETRO (2014) x
UOL (2014) x
icarroscom (2014) x
this analysis examined energy consumption data from two public sources the nota Verde Program by the Brazilian institute of the environment and renewable natural resources (iBaMa) and the Brazilian Vehicle labeling Program (PBeV) by the national institute of Metrology standardization and industrial Quality (inMetro) table D-2 summarizes key differences between these two data sources
Table D‑2 ndash energy consumption data sources
iBaMa iNMETRO
program nota Verde1 Brazilian Vehicle labeling Program (PBeV)2
program description
Mandatory program that reports emissions of co2 co nox and nMhc as part of emissions certification program
Voluntary program since 2009 that allows the comparison of fuel economy across vehicle models
Unit gco2 km kml
Test cycle chassis testing under urban (FtP) driving cycle based on nBr 66012005
chassis testing under urban (FtP) and highway (hWYFe) driving cycles based on nBr 702420103
adjustment
no adjustment for real-world driving conditions Because reported co2 emissions are assumed to be zero for ethanol adjustments were made to account for tailpipe co2 emissions for vehicles running on ethanol
since 2010 published values include real-world adjustment factors to chassis test data a method adopted by the us ePa in 2008
Conversion to MJkm
iBaMarsquos data are reported as FtP (city test) co2 data in gco2 km conversion to caFe test cycle and to a different metric (Mjkm) involves four steps as presented in Figure D-1
inMetrorsquos data in kml are presented separately by fuel type (e22 e100) and driving cycle (urban highway) conversion to Mjkm was done by applying a conversion factor (2167 gco2 l for e22 and 1428gco2l for e00) caFe values are obtained by using a 5545 weighting for the urban (FtP) and highway cycles respectively
1 iBaMa (2014) nota Verde program available at httpwwwmmagovbrcidades-sustentaveisqualidade-do-arcontrole-de-emissoes-veicularesnota-verde
2 inMetro (2014) Programa Brasileiro de etiquetagem Veicular (PBeV) available at httpwwwinmetrogovbrconsumidortabelas_pbe_veicularasp
3 inMetro (2014) Metodologia Para Divulgaccedilatildeo De Dados De consumo Veicular available at httpwwwinmetrogovbrconsumidorpbeMetodologia_consumo_Veicularpdf
53
ICCT white paper
Step 1 Correcting the original IBAMA CO2 reported data ndash FTP CO2 gkm
IBAMArsquos CO2 reported values are corrected to account for tailpipe emissions from ethanol (tailpipe CO2 emissions are reported as zero in IBAMArsquos data)
bull E22 FTP reported CO2 data are reduced by 177bull E100 FTP reported CO2 data are reduced by 100
Flex fuel vehicles are tested with E22 and E00 the final values is calculated as the average of both fuelsCO2 IBAMA_Flex_FTP= 05(1-0177)CO2_E22_test_FTP + 050E100_FTP = 050823CO2_E22_FTPFor Gasoline only vehicles the tests are carried out only with Gasoline E22CO2 IBAMA_Gasoline_FTP = (1-0177) CO2_E22_Test_FTP
Where in the previous equations CO2_E22_FTP means CO2 emissions values obtained under FTP testingCO2 IBAMA_Flex_FTP means IBAMArsquos Corrected FTP values for flex vehiclesCO2 IBAMA_Gasoline_FTP means IBAMArsquos Corrected FTP values for gasoline only (E22) vehicles
INNOVAR AUTO is based on energy consumption data obtained as the combined CAFE test cycle This requires a weighted average of energy consumption data obtained from FTP testing (city driving ) and Highway fuel economy testing (HWFET) In mathematical form CAFE=f(FTPHWFET)
Given that IBAMA data is provided for only the first aprt the FTP testing then it is required to find a way to calculate CAFE combined values through FTP -75 only data A linear function was thus developed from data with FTP and HWY values (INMETRO data) is used to convert FTP only values to CAFE CO2 values ie CAFE=f(FTP) The function used for this conversion is
CO2_CAFE= (CO2_FTP+44756)11572
Step 2Convert FTP CO2 values to CAFE CO2 values
Converting CO2 values to MJkm values is done by using the energy density of E22 Note that all the previous calculations for CO2 come from E22-based data
bull The energy density of E22 is 2894 MJLE22bull E22 emits 2167gCO2LE22bull CAFE (MJkm) = CAFE (gCO2km) (2894 MJLE22 2167 gCO2LE22)
Step 3 Convert US CAFE CO2 values to MJkm values
Figure D‑1 ndash conversion of emission to energy consumption data
energy consumption values calculated from iBaMa and inMetro data differ greatly Figure D-1 illustrates energy consumption data for those models in both databases iBaMa data are on average 126 higher than inMetro data with a standard deviation of 89 and a maximum deviation of 39
54
Brazil Passenger Vehicle Market statistics
0
05
1
15
2
25
3
0 05 1 15 2 25 3
Ene
rgy
cons
ump
tio
n IB
AM
A (
MJ
km)
Energy consumption INMETRO (MJkm)
n=151
Figure D‑2 ndash comparison between energy consumption data from inMetro and iBaMa
151 vehicles tested under both programs
although inMetro data are more transparent as it breaks down fuel economy by fuel and test cycle it is still a voluntary program that allows manufacturers to select which models will participate in addition not all manufacturers participate in the program in turn iBaMa data only include co2 data for the urban cycle and thus energy consumption in the combined cycle had to be estimated from correlations using international data in addition corrections had to be made for gasoline-only engines since it seems that a co2 discount in theory only applicable to flex-fuel engines was also applied to gasoline-only engines Despite these data quality issues iBaMa data were considered the most adequate data source for energy consumption because it is a mandatory program that requires data reporting by all vehicle models and manufacturers
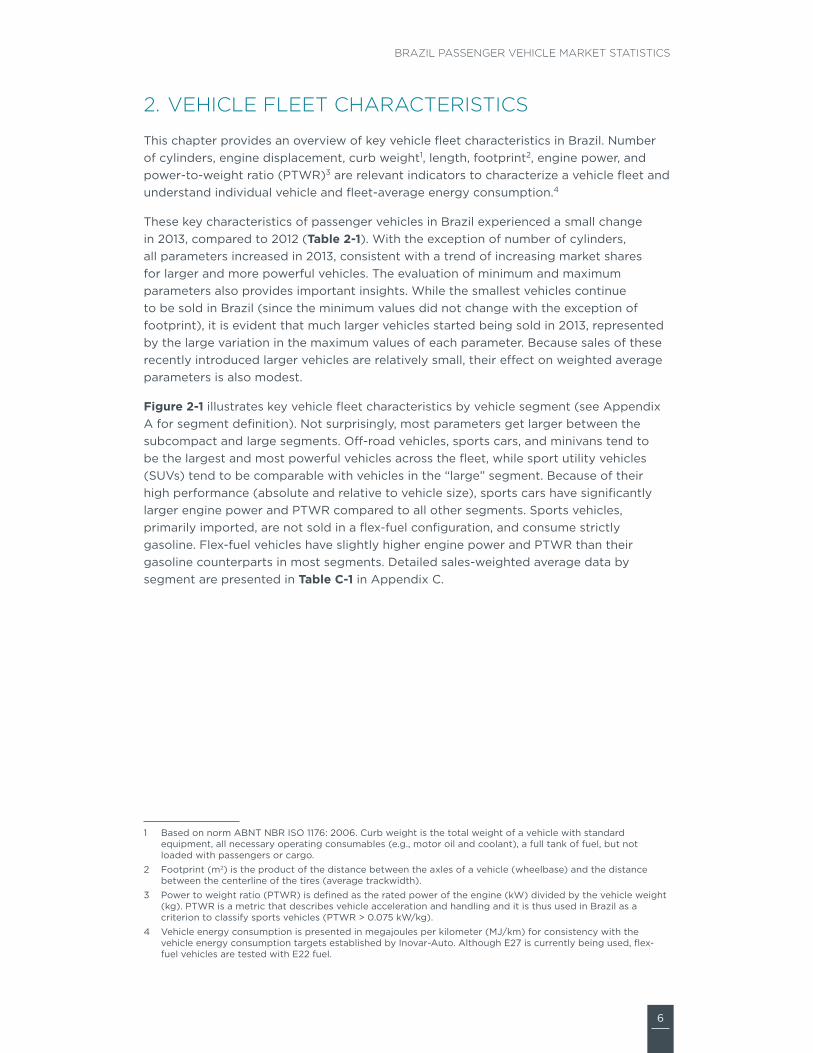
6
Brazil Passenger Vehicle Market statistics
2 vEhiCLE fLEET ChArACTEriSTiCS
this chapter provides an overview of key vehicle fleet characteristics in Brazil number of cylinders engine displacement curb weight1 length footprint2 engine power and power-to-weight ratio (PtWr)3 are relevant indicators to characterize a vehicle fleet and understand individual vehicle and fleet-average energy consumption4
these key characteristics of passenger vehicles in Brazil experienced a small change in 2013 compared to 2012 (Table 2‑1) With the exception of number of cylinders all parameters increased in 2013 consistent with a trend of increasing market shares for larger and more powerful vehicles the evaluation of minimum and maximum parameters also provides important insights While the smallest vehicles continue to be sold in Brazil (since the minimum values did not change with the exception of footprint) it is evident that much larger vehicles started being sold in 2013 represented by the large variation in the maximum values of each parameter Because sales of these recently introduced larger vehicles are relatively small their effect on weighted average parameters is also modest
Figure 2‑1 illustrates key vehicle fleet characteristics by vehicle segment (see appendix a for segment definition) not surprisingly most parameters get larger between the subcompact and large segments off-road vehicles sports cars and minivans tend to be the largest and most powerful vehicles across the fleet while sport utility vehicles (suVs) tend to be comparable with vehicles in the ldquolargerdquo segment Because of their high performance (absolute and relative to vehicle size) sports cars have significantly larger engine power and PtWr compared to all other segments sports vehicles primarily imported are not sold in a flex-fuel configuration and consume strictly gasoline Flex-fuel vehicles have slightly higher engine power and PtWr than their gasoline counterparts in most segments Detailed sales-weighted average data by segment are presented in Table C‑1 in appendix c
1 Based on norm aBnt nBr iso 1176 2006 curb weight is the total weight of a vehicle with standard equipment all necessary operating consumables (eg motor oil and coolant) a full tank of fuel but not loaded with passengers or cargo
2 Footprint (m2) is the product of the distance between the axles of a vehicle (wheelbase) and the distance between the centerline of the tires (average trackwidth)
3 Power to weight ratio (PtWr) is defined as the rated power of the engine (kW) divided by the vehicle weight (kg) PtWr is a metric that describes vehicle acceleration and handling and it is thus used in Brazil as a criterion to classify sports vehicles (PtWr gt 0075 kWkg)
4 Vehicle energy consumption is presented in megajoules per kilometer (Mjkm) for consistency with the vehicle energy consumption targets established by inovar-auto although e27 is currently being used flex-fuel vehicles are tested with e22 fuel
7
ICCT white paper
Table 2‑1 ndash Fleet characteristics of new Brazilian passenger vehicles
Vehicle characteristic 2012 2013 Variation
Number of cylinders weighted average 402 400 ‑06
Displacement (cc)
Min 970 970
Max 6498 6749
weighted average 1418 1430 08
Curb weight (kg)
Min 800 800
Max 2940 2710
weighted average 1102 1106 04
Length (mm)
Min 2695 2695
Max 5290 5842
weighted average 4089 4100 03
Footprint (m2)
Min 217 241
Max 523 874
weighted average 364 367 09
Engine power ndash gasoline (kw)
Min 33 33
Max 153 545
weighted average 743 757 18
Engine power ndash ethanol (kw)
49 49
Max 114 153
weighted average 715 740 34
pTwR ‑ gasoline (kwkg)
00455 00455
Max 04482 03344
weighted average 00658 00671 20
pTwR ‑ ethanol (kwkg)
00476 00477
Max 00935 01033
weighted average 00667 00683 24
Energy consumption ndash US CaFE (MJkm) na 202
8
Brazil Passenger Vehicle Market statistics
0
500
1000
1500
2000
2500
3000
Subco
mpac
t
Compac
t
Medium
Larg
eSport
O-road SUV
Miniva
n
Fleet-a
vera
ge
Dis
pla
cem
ent
(cc)
0200400600800
10001200140016001800
2000
Subco
mpac
t
Compac
t
Medium
Larg
eSport
O-road SUV
Miniva
n
Fleet-a
vera
ge
Cur
b w
eig
ht (
kg)
0500
10001500
2000250030003500400045005000
Subco
mpac
t
Compac
t
Medium
Larg
eSport
O-road SUV
Miniva
n
Fleet-a
vera
ge
Leng
th (
mm
)
000050100150
200250300350400450
Subco
mpac
t
Compac
t
Medium
Larg
eSport
O-road SUV
Miniva
n
Fleet-a
vera
ge
Fo
otp
rint
(m
2 )
020406080
100120140160180
200
Subco
mpac
t
Compac
t
Medium
Larg
eSport
O-road SUV
Miniva
n
Fleet-a
vera
ge
Po
wer
(kW
)
Gasoline EthanolGasoline and Ethanol
000
002
004
006
008
010
012
014
Subco
mpac
t
Compac
t
Medium
Larg
eSport
O-road
SUV
Miniva
n
Fleet-a
vera
gePo
wer
-to
-wei
ght
rat
io (
kWk
g)
Figure 2‑1 ndash Fleet characteristics of new Brazilian passenger vehicles by segment (2013)
Fleet characteristics for the top 20 vehicle manufacturers responsible for more than 99 of passenger vehicle sales in 2013 are presented in Figure 2‑2 the four top-selling manufacturers (Fiat gM Volkswagen and Ford) produce on average lighter vehicles with smaller and less powerful engines average engine rated power is below 80 kW for the 10 largest manufacturers except for toyota and honda since each has a large share of off-road and suV sales respectively luxury manufacturers and off-road dominant manufacturers (jeep and Mitsubishi) show the largest values of engine power PtWr values seem evenly distributed below 0070 kWkg across the five largest manufacturers plus Psa and chery and climb following the power trend for luxury and off-road oriented manufacturers Most vehicles are rated with higher engine power and PtWr under ethanol (e100) than under gasoline (e22) Detailed sales-weighted average data by manufacturer are presented in Table C‑2 in appendix c
9
ICCT white paper
Gasoline Ethanol
0
500
1000
1500
2000
2500
3000
3500
Fiat GM
Volkswag
enFord
Renau
lt
Hyund
ai
Honda
Toyo
taPSA
Nissan
Mitsub
ishiKIA
JACBMW
Land
Rove
r
Merce
des-B
enz
Chery
Audi
Suzuk
iJe
ep
Fleet-a
vera
geFiat GM
Volkswag
enFord
Renau
lt
Hyund
ai
Honda
Toyo
taPSA
Nissan
Mitsub
ishiKIA
JACBMW
Land
Rove
r
Merce
des-B
enz
Chery
Audi
Suzuk
iJe
ep
Fleet-a
vera
ge
Dis
pla
cem
ent
(cc)
0200400600800
10001200140016001800
2000
Cur
b w
eig
ht (
kg)
Fiat GM
Volkswag
enFord
Renau
lt
Hyund
ai
Honda
Toyo
taPSA
Nissan
Mitsub
ishiKIA
JACBMW
Land
Rove
r
Merce
des-B
enz
Chery
Audi
Suzuk
iJe
ep
Fleet-a
vera
geFiat GM
Volkswag
enFord
Renau
lt
Hyund
ai
Honda
Toyo
taPSA
Nissan
Mitsub
ishiKIA
JACBMW
Land
Rove
r
Merce
des-B
enz
Chery
Audi
Suzuk
iJe
ep
Fleet-a
vera
ge000050100150
200250300350400450
Fo
otp
rint
(m
2 )
3400
3600
3800
4000
4200
4400
4600
4800
Leng
th (
mm
)
Fiat GM
Volkswag
enFord
Renau
lt
Hyund
ai
Honda
Toyo
taPSA
Nissan
Mitsub
ishiKIA
JACBMW
Land
Rove
r
Merce
des-B
enz
Chery
Audi
Suzuk
iJe
ep
Fleet-a
vera
geFiat GM
Volkswag
enFord
Renau
lt
Hyund
ai
Honda
Toyo
taPSA
Nissan
Mitsub
ishiKIA
JACBMW
Land
Rove
r
Merce
des-B
enz
Chery
Audi
Suzuk
iJe
ep
Fleet-a
vera
ge0
20406080
100120140160180
200
Po
wer
(kw
)
00000010002000300040005000600070008000900100
Po
wer
-to
-wei
ght
rat
io (
kWk
g)
Gasoline and Ethanol
Figure 2‑2 ndash Fleet characteristics of new Brazilian passenger vehicles by manufacturer (2013)
Manufacturers are organized by total sales in descending order
Figure 2‑3 illustrates vehicle fleet characteristics for domestic and imported vehicles in general imported vehicles are bigger and heavier than those nationally produced the most remarkable contrast lies on engine power and PtWr imported vehicles are more powerful and have higher PtWr but while domestic vehicles exhibit higher engine power and PtWr for ethanol than for gasoline the opposite occurs for imported ones a closer examination of available data on engine compression ratios shows that domestic producers are leveraging ethanolrsquos higher octane rating and designing flex-fuel engines with much higher compression ratios (~1251) than gasoline-only engines (around 1051)5 this confirms the special engine designcalibration for operation with high ethanol gasoline blends from manufacturers with local production Detailed sales-weighted average data by origin are presented in Table C‑3 in appendix c
5 More information on the effect of ethanol on vehicle design characteristics can be found in stein et al (2013)
10
Brazil Passenger Vehicle Market statistics
Gasoline Ethanol
0
200
400
600
800
1000
1200
1400
1600
1800
2000
Domestic Imported Fleet-average
Dis
pla
cem
ent
(cc)
0
200
400
600
800
1000
1200
1400
Domestic Imported Fleet-average
Cur
b w
eig
ht (
kg)
345
350
355
360
365
370
375
380
385
390
395
Domestic Imported Fleet-average
Fo
otp
rint
(m
2 )
3950
4000
4050
4100
4150
4200
4250
4300
4350
Domestic Imported Fleet-average
Leng
th (
mm
)
0
20
40
60
80
100
120
Domestic Imported Fleet-average
Po
wer
(kW
)
0050
0055
0060
0065
0070
0075
0080
Domestic Imported Fleet-average
Po
wer
-to
-wei
ght
rat
io (
kWk
g)
Gasoline and Ethanol
Figure 2‑3 ndash Fleet characteristics of new Brazilian passenger vehicles by origin (2013)
Figure 2‑4 compares Brazilrsquos passenger vehicle fleet with those in china the us eu japan india and south Korea For the energy consumption comparison this analysis considers the us corporate average fuel economy (caFe) test cycle6 average engine displacement curb weight footprint and engine power in Brazil are the smallest with the exception of india (and japan in the case of engine displacement) With respect to PtWr the average Brazilian passenger car breaks the trend set by the power category ie Brazilian cars are less powerful than those in china japan and eu due to their lower average weight which drives the PtWr value above chinese japanese and european cars this suggests that the average Brazilian cars share the driving performance characteristics (eg acceleration times) of the us and Korean vehicles despite their relative smaller engines Detailed international data are presented in appendix B
6 Details on icctrsquos methodology for comparing new vehicle fuel efficiency can be found at the global PV standards section in the icctrsquos website httpwwwtheicctorginfo-toolsglobal-passenger-vehicle-standards
11
ICCT white paper
Despite having the smallest lightest and least powerful vehicles on average (with the exception of india) Brazilrsquos average energy consumption ranks fourth amongst the markets analyzed in this study the japanese fleet had the lowest energy consumption given the small and light vehicle characteristics of japanese cars and their relatively higher adoption of efficiency technologies (eg hybrids) followed by the eu (medium sizeweight fleet with high technology penetration) and india (smaller and lighter fleet overall) the us has the highest energy consumption on average due to the fleetrsquos larger size weight and power requirements china and south Korea trail the us as the most energy-consuming fleet and these countries have fleets with large and heavy vehicles but relatively lower penetration of efficiency technologies a detailed evaluation of energy consumption in Brazil and other markets is presented in chapter 4
0
500
1000
1500
2000
2500
3000
US S Korea EU China Brazil Japan India
Dis
pla
cem
ent
(cc)
0
200
400
600
800
1000
1200
1400
1600
1800
US S Korea EU China Japan Brazil India
Cur
b w
eig
ht (
kg)
000
050
100
150
200
250
300
350
400
450
US S Korea EU China Japan Brazil India
Fo
otp
rint
(m
2)
0
20
40
60
80
100
120
140
160
US S Korea EU China Japan Brazil India
Po
wer
(kW
)
00000
00100
00200
00300
00400
00500
00600
00700
00800
00900
01000
US S Korea Brazil China Japan EU India
Po
wer
-to
-wei
ght
rat
io (
kWk
g)
100
120
140
160
180
200
220
240
260
US China S Korea Brazil India Japan EU
Ene
rgy
cons
ump
tio
n ndash
US
CA
FE
(M
Jkm
)
Figure 2‑4 ndash international comparison of key new passenger vehicle characteristics
12
Brazil Passenger Vehicle Market statistics
3 vEhiCLE TEChNOLOGy ADOpTiON
this chapter provides an overview of current technology adoption including fuel engine and transmission technologies that affect vehicle energy consumption the type and complexity of technologies vary across vehicle segments to a large extent this is a function of vehicle size and weight and its intended performance and ultimately cost Fleet-average parameters presented in Table 3‑1 correspond to sales-weighted fleet-average values this chapter is divided by technology type with supporting information in appendix c an international comparison for each technology is also presented in this chapter the data for this technology adoption analysis came from a diversity of sources listed in appendix D also note that for comparisons at the international level it was required to use information from different years the most recent according to data availability
Table 3‑1 ndash technology adoption in new Brazilian passenger vehicles
Year 2012 2013
Fuel type
Flex 914 936
Gasoline 82 59
hybrid 0004 0014
Diesel 04 049
No of cylinders
Three 03 25
Four 986 966
Five 00 00
Six 09 08
Eight or more 01 01
Transmission
Manual 870 833
automatic 112 147
CVT 14 15
DCT 04 05
No of gear ratios
Four or fewer 61 59
Five 849 831
Six 84 98
Seven 03 07
Eight or more 02 05
Drivetrain
FwD 950 944
RwD 27 29
4wD and awD 23 27
No of valves per cylinder
Two 664 596
Multi valve 336 404
Valve camshaft configuration
Single overhead camshaft 696 630
Dual overhead camshaft 176 245
Valve actuation
Fixed 822 783
VVT 124 159
VVT+VVL 54 58
Fuel systems for gasoline vehicles
Multi‑point fuel injection 982 976
Gasoline direct injection 18 24
air induction systems for gasoline vehicles
Naturally aspirated 984 973
Supercharger turbocharger or twin‑turbo 16 27
13
ICCT white paper
FUEL TYpEFlex-fuel vehicles (FFVs) are designed to run on gasoline (e22) ethanol (e100) or any combination of both fuels except for a few engine and fuel system modifications FFVs are identical to gasoline-only models7 FFVs experience no loss in performance when operating on e100 however since ethanol contains less energy per volume than gasoline FFVs typically get about 25 fewer kilometers per liter when fuelled with e100
Flex-fuel is the dominant technology across all vehicle segments with the exception of sports cars off-road vehicles and minivans (Figure 3‑1) all top 10 manufacturers produce primarily flex-fuel engines and those manufacturers with a larger share of gasoline and diesel engines typically import most of their vehicles (Figure 3‑2) the predominance of FFVs responsible for almost 94 of vehicle sales in 2013 is unique to Brazil (Figure 3‑3)
hybrid-gasoline vehicles achieve reduced fuel consumption by incorporating in the drivetrain a battery and an electric motor in addition to an internal combustion (ic) engine this technology permits the ic engine to shut down when the vehicle is decelerating and is stopped braking energy to be recovered and the ic engine to be downsized and operated at more efficient operating points Depending on the level of complexity hybrid systems can achieve 15 to 35 reductions in fuel consumption with respect to similar-sized vehicles
Despite having very limited penetration sales of new hybrid vehicles have increased three-fold from 131 units in 2012 to 432 in 2013 primarily in the medium and sports segments two manufacturers sell the most gasoline hybrid models (not flex-fuel) in Brazil including the toyota Prius and the Ford Fusion hybrid
Diesel engines offer 20 to 25 reduction in fuel consumption over traditional gasoline multi-point fuel injection (MPFi) engines due to higher compression ratios reduced pumping losses and 12 higher energy content per liter of fuel the challenge for further commercialization is twofold the complexity and additional cost of advanced exhaust after-treatment technologies that reduce emissions of particulate matter and oxides of nitrogen to levels comparable to those of gasoline and FFV engines
sales of diesel passenger vehicles are not allowed in Brazil with the exception of vehicles with some off-road characteristics Despite having a small penetration (around 05) sales of diesel passenger vehicles increased by 16 in 2013 toyota sells the most diesel passenger vehicles followed by Mitsubishi land rover gM and Mercedes-Benz the light-duty diesel market in Brazil is equivalent to the us and china in terms of market penetration and much below the penetration in europe and south Korea although air quality concerns in europe might trigger lower sales of diesel vehicles in coming years
7 Most of the modifications with respect to a gasoline-only vehicle (e00) include changes to fuel systemrsquos materials that are compatible with the oxygen content of ethanol blends and changes to air and fuel ratio management systems (mainly software based)
14
Brazil Passenger Vehicle Market statistics
0
10
20
30
40
50
60
70
80
90
100
Subco
mpac
t
Compac
t
Medium
Larg
eSport
O-Road SUV
Miniva
nTo
tal
Mar
ket
shar
e
Diesel Hybrid Gasoline Flex
Figure 3‑1 ndash Fuel type by segment
0102030405060708090
100
Fiat GM
Volkswag
enFord
Renau
lt
Hyund
ai
Honda
Toyo
taPSA
Nissan
Mitsub
ishi
KIAJA
CBMW
Land
Rove
r
Merce
des-B
enz
Chery
Audi
Suzuk
iJe
epTo
tal
Tech
nolo
gy
shar
e
Diesel Hybrid Gasoline Flex
Figure 3‑2 ndash Fuel type by manufacturer
0
10
20
30
40
50
60
70
80
90
100
China2010
Korea2011
EU-272013
US2013
Japan2011
India2012
Brazil2013
Tech
nolo
gy
shar
e
Diesel Hybrid Gasoline CNGLPGFlex
Figure 3‑3 ndash Fuel type international comparison
15
ICCT white paper
NUMBER OF CYLiNDERSacross all vehicle markets 4-cylinder engines are the most common design in automobile engines with displacements below 25 liters this engine configuration presents the right balance between complexity and performance for the target vehicle segments (small to mid-size sedans suVs and some off-road vehicles) engines with six and more cylinders are designed to provide a smoother vehicle driving experience with lower vibration and noise than 4-cylinder engines can provide and with higher power output this better overall performance comes at a higher cost driving their widespread use in large and luxury vehicles and heavier suVs and off-road vehicles
the need to attain better energy consumption has resulted in a recent wave of 3-cylinder engines from a handful of manufacturers in vehicles that typically used 4-cylinder engines achieving similar or better performance this practice is known as engine downsizing Downsizing can also be applied to larger engines from V-8s to V-6s and from V-6s to i-4s in most cases engine downsizing is accompanied with turbocharging and changes to the fuel delivery system
Four-cylinder engines dominate the passenger vehicle market in Brazil and are sold in more than 90 of new vehicles among all segments except the sports off-road and minivan segments (Figure 3‑4) Despite its predominance sales of 4-cylinder engines fell from over 307 to 293 million units between 2012 and 2013 equivalent to a 4 reduction 4-cylinder vehicles represent the majority of sales among the 20 top manufacturers except for hyundai and jeep (Figure 3‑5) although 4-cylinder engines represent the dominant technology in all countries analyzed Brazil still has the largest market share (Figure 3‑6)
the most significant shift in market preferences in Brazil occurred with 3-cylinder engines this technology is becoming more popular with almost eight times more vehicles sold in 2013 compared to 2012 reaching almost 75000 units in 2013 almost all 3-cylinder engines are being sold as compact vehicles instead of the smaller subcompact segment hyundai is the technology leader in sales of 3-cylinder high-efficiency Kappa engines8 japan and india have relatively high penetration of 3-cylinder engine technology in india the popularity of 2- and 3-cylinder vehicles is primarily driven by lower price tags (lt usD $8000)
six-cylinder engines are third in sales after 4- and 3-cylinder engines with absolute numbers close to 25000 units sold in 2013 its market share reduced by 13 with respect to 2012 six-plus cylinder engines are being sold mostly in the sports off-road and minivan segments Manufacturers that cater to the most expensive models and segments dominate the market of vehicles with six-plus cylinder engines such as land rover BMW and Mercedes-Benz the penetration of 6-plus-cylinder engines in Brazil is very low compared to other countries
Five-cylinder engines are not very common in Brazil or other countries and are losing market with respect to 2012 sales by 56 Volkswagen audi and Volvo are the only manufacturers that offered 5-cylinder engines in Brazil in 2013
8 hyundairsquos 3-cylinder Kappa engine httpworldwidehyundaicomWWshowroomcarshB20PiPindexhtml
16
Brazil Passenger Vehicle Market statistics
0
10
20
30
40
50
60
70
80
90
100
Subco
mpac
t
Compac
t
Medium
Larg
eSport
O-Road SUV
Miniva
nTo
tal
Tech
nolo
gy
shar
e
8+ 6 5 4 3
Figure 3‑4 ndash number of cylinders by segment
0102030405060708090
100
Fiat GM
Volkswag
enFord
Renau
lt
Hyund
ai
Honda
Toyo
taPSA
Nissan
Mitsub
ishi
KIAJA
CBMW
Land
Rove
r
Merce
des-B
enz
Chery
Audi
Suzuk
iJe
epTo
tal
Tech
nolo
gy
shar
e
8+ 6 5 4 3
Figure 3‑5 ndash number of cylinders by manufacturer
0
10
20
30
40
50
60
70
80
90
100
China2010
Korea2011
EU-272013
US2013
Japan2011
India2012
Brazil2013
Tec
hno
log
y sh
are
8+ 6 5 4 3 2
Figure 3‑6 ndash number of cylinders international comparison
17
ICCT white paper
TRaNSMiSSiONtransmission technologies can reduce energy consumption in two ways First by allowing engine operation on a more efficient region of the engine map and second by reducing the mechanical losses within transmissions traditionally manual transmissions have offered better energy consumption than traditional automatic transmissions (with 4 or 5 speeds) due to lower friction losses however new generation of automatic transmissions with higher number of gears lower friction better materials and computer-controlled shift points have not just closed the gap between manual and automatic transmission performance but even exceed manual transmission performance
new technologies such as dual-clutch transmissions (Dcts) and continually variable transmissions (cVts) are gaining market share due to the need for lower vehicle energy consumption Dcts can be defined as manual transmissions with electro-hydraulically operated dual-clutch systems allowing for faster shifting times and selective automatic or ldquomanualrdquo operation as opposed to manual automatic and Dct transmissions which have a discrete number of gear ratios cVts have a theoretically infinite choice of ratios between fixed limits which allows engines to be further optimized for minimizing energy consumption cVt technology has been used in lower-horsepower vehicles because of maximum-torque limitations with the most common metal-belt design (nas 2011) these advanced transmission technologies offer significant benefits in energy consumption compared to traditional manual or automatic technologies according to the us national academy of sciences a 6-speed Dct provides 6 to 9 lower energy consumption than a 4-speed automatic transmission note that a traditional 6-speed automatic transmission provides an estimated 3 to 5 benefit the energy consumption benefit of cVt depends on the application and is estimated to be 1 to 7 (nas 2011)
although vehicle sales with manual transmissions are predominant in Brazil the penetration of automatic transmissions cVts and Dcts is increasing resulting in a market share loss for manual transmissions of about 6 between 2012 and 2013 (Table 3‑1) With the exception of sports and off-road segments manual transmission technology has the largest market share in all segments but it tends to become less predominant as vehicles grow in size and comfort level (Figure 3‑7) the top five manufacturers sell most of their vehicles with manual transmissions but their market share is somewhat smaller for other high-selling manufacturers that cater to a more affluent market (Figures 3‑8)
automatic transmissions are becoming increasingly popular in Brazil experiencing an increase of 28 in sales between 2012 and 2013 automatic transmissions dominate the sports and off-road segments Kia BMW land rover Mercedes-Benz and jeep adopt this type of transmission technology for most of their vehicle sales
Dct transmissions are entering the Brazilian market mostly through the sports segment via imported models the sales of Dct equipped vehicles increased in 2013 by 22 with respect to 2012 Dct technology is being offered mainly by manufacturers that sell sports vehicles such as audi in more than 67 of their vehicles and Mercedes-Benz in more than 15 of their vehicles the global leader in Dct adoption is europe followed by the us (Figure 3‑9)
cVt technology market is still relatively small being sold by small volume manufacturers like jeep audi and Mitsubishi with more than 25 of new vehicle sales each nissan renault honda and toyota also sell vehicles with cVt technology cVt penetration in Brazil is similar to europersquos cVt is the leading transmission technology in japan with more than 65 of the market
18
Brazil Passenger Vehicle Market statistics
0
10
20
30
40
50
60
70
80
90
100
Subco
mpac
t
Compac
t
Medium
Larg
eSport
O-Road SUV
Miniva
nTo
tal
Tech
nolo
gy
shar
e
DCT CVT Automatic Manual
Figure 3‑7 ndash transmission by segment
0
10
20
30
40
50
60
70
80
90
100
Fiat GM
Volkswag
enFord
Renau
lt
Hyund
ai
Honda
Toyo
taPSA
Nissan
Mitsub
ishi
KIAJA
CBMW
Land
Rove
r
Merce
des-B
enz
Chery
Audi
Suzuk
iJe
epTo
tal
Tech
nolo
gy
shar
e
DCT CVT Automatic Manual
Figure 3‑8 ndash transmission by manufacturer
0
10
20
30
40
50
60
70
80
90
100
China2010
Korea2011
EU-272013
US2013
Japan2011
India2012
Brazil2013
Tech
nolo
gy
shar
e
DCT CVT Automatic Manual
Figure 3‑9 ndash transmission international comparison
19
ICCT white paper
NUMBER OF GEaR RaTiOS as mentioned in the previous section increasing the number of gear ratios (whether manual automatic dual-clutch or continuously variable) allows the engine to be operated in the best efficiency region resulting in energy consumption benefits compared to an automatic four-gear ratio transmission (also known as 4-speed transmission) higher ratio automatic transmissions could reduce energy consumption from 2 to 3 (for a five-gear ratio) to 6 to 8 (for an eight-gear ratio) (ePanhtsa 2010)
Four-gear ratio transmissions are losing market share in Brazil by more than 5 between 2012 and 2013 (Table 3‑1) these transmissions are particularly high sellers in the suV and minivan segments which suggest that some models in these more expensive segments are being sold with outdated technologies (Figure 3‑10) Most manufacturers are phasing out this type of transmission (Figure 3‑11) although jeep suzuki and toyota are lagging behind other manufacturers the four-gear ratio transmission technology has been losing market share in most countries even in india where smaller and inexpensive cars dominate the market 4-speed transmissions have the smallest market share (Figure 3‑12)
Five- and six-gear ratio transmissions were predominant in the Brazilian market in 2013 Five-gear ratio transmissions are dominant in all segments except for the off-road and sports segments which have adopted six-gear ratio transmissions in most sales the significant market share of five- and six-gear ratio transmissions is similar to most countries although the us europe and south Korea show higher shares of six and more gear ratios
seven- and eight-gear ratio transmissions which are considered emerging technologies have experienced an increase in sales in Brazil with over twice as many sales in 2013 compared to 2012 seven- and eight-gear ratio transmissions are popular among the large sports and off-road segments all of which are imported models luxury manufacturers such as Mercedes-Benz and audi are selling the most seven-gear vehicles as a share of their sales Volkswagen and toyota are also selling similar numbers of seven-gear ratio vehicles although for Volkswagen and toyota it represented less than 3 of their brand sales BMW and land rover are the leaders in eight-gear ratio vehicles
20
Brazil Passenger Vehicle Market statistics
0
10
20
30
40
50
60
70
80
90
100
Subco
mpac
t
Compac
t
Medium
Larg
eSport
O-Road
SUV
Miniva
nTo
tal
Tech
nolo
gy
shar
e
8 7 6 5 4
Figure 3‑10 ndash number of gear ratios by segment
0
10
20
30
40
50
60
70
80
90
100
Fiat GM
Volkswag
enFord
Renau
lt
Hyund
ai
Honda
Toyo
taPSA
Nissan
Mitsub
ishi
KIAJA
CBMW
Land
Rove
r
Merce
des-B
enz
Chery
Audi
Suzuk
iJe
epTo
tal
Tech
nolo
gy
shar
e
8 7 6 5 4
Figure 3‑11 ndash number of gear ratios by manufacturer
0
10
20
30
40
50
60
70
80
90
100
Tech
nolo
gy
shar
e
Six or more Five Four or fewer
China2010
Korea2011
EU-272013
US2013
India2012
Brazil2013
Figure 3‑12 ndash number of gear ratios international comparison
21
ICCT white paper
DRiVETRaiNDrivetrain technology includes front-wheel drive (FWD) rear-wheel drive (rWD) and all-wheel drive (aWD) vehicles For the same vehicle size FWD vehicles provide more interior space and better energy consumption than rWDs due to lower weight as it avoids the added weight of and space for the driveshaft and differential that rWD requires Because the weight of the engine and transmission is located close to the wheels FWD vehicles have better traction than rWDs rWDs however show better handling as the weight distribution between the front and rear wheels is more uniform and the tasks of turning and acceleration are split between the front and rear wheels also directing large amounts of power through the front wheels can create ldquotorque steerrdquo thus rWD is the adequate technology for the sports segment aWD drivetrains are intended for specific driving applications that imply loss of traction such as off-road terrains snow or towing
FWD vehicles dominate all segments of the Brazilian passenger car market (Table 3‑1) with the exception of the off-road segment (Figure 3‑13) among the 20 largest manufacturer sellers most except for BMW land rover Mercedes-Benz and suzuki offer FWD technology (Figure 3‑14) Brazil has the highest market share of FWD vehicles of all countries analyzed (944) although FWD has at least 50 market share in all seven countries (Figure 3‑15)
aWD market share increased by 15 between 2012 and 2013 due to a tri-fold increase in the sports segment sales off-road vehicle sales with aWD also increased to more than 76000 units in 2013 amongst the largest ten manufacturers toyota is the aWD market leader followed by Ford and Volkswagen note that land rover sells only aWD vehicles in Brazil among non-luxury manufacturers Mitsubishi and suzuki are selling more than 50 of their vehicles with aWD technology
rWD technology is offered mostly in large and sports vehicles and in suVs among the 10 largest manufacturers rWD is offered mainly by gM and toyota while an extended examination of the 20 largest manufacturers by sales show that aWD and rWD is focused among the more expensive brands (Figure 3‑14) Mercedes-Benz and BMW sell close to 90 of their vehicles with rWD technology traditionally associated with engine performance and responsiveness
22
Brazil Passenger Vehicle Market statistics
0
10
20
30
40
50
60
70
80
90
100
Subco
mpac
t
Compac
t
Medium
Larg
eSport
O-Road SUV
Miniva
nTo
tal
Tehn
olo
gy
shar
e
AWD RWD FWD
Figure 3‑13 ndash Drivetrain by segment
0
10
20
30
40
50
60
70
80
90
100
Fiat GM
Volkswag
enFord
Renau
lt
Hyund
ai
Honda
Toyo
taPSA
Nissan
Mitsub
ishi
KIAJA
CBMW
Land
Rove
r
Merce
des-B
enz
Chery
Audi
Suzuk
iJe
epTo
tal
Tech
nolo
gy
shar
e
AWD RWD FWD
Figure 3‑14 ndash Drivetrain by manufacturer
0
10
20
30
40
50
60
70
80
90
100
China2010
Korea2011
EU-272013
US2013
Japan2011
India2012
Brazil2013
Tech
nolo
gy
shar
e
AWD RWD FWD
Figure 3‑15 ndash Drivetrain international comparison
23
ICCT white paper
VaLVE CaMShaFT CONFiGURaTiON (DOhC VS SOhC)the engine camshaft governs the timing duration and lift of valve operation controlling the intake of air and the exhaust of combustion gases this report focuses on single overhead camshafts (sohc) and dual overhead camshafts (Dohc) as these configurations have almost completely replaced the older overhead valve configuration (ohV) sohc design places a single camshaft above the cylinder head that governs all the valves intake and exhaust in the case of sohc V-engines there is one single camshaft per head Dohc designs use separate camshafts for intake valves and exhaust valves Dohc engines achieve increased airflow at high-engine speeds improve volumetric efficiency and reduce the valvetrainrsquos moving mass such engines typically develop higher power at high-engine speeds the us environmental Protection agency (ePa) and national highway traffic safety administration (nhtsa) estimate the effectiveness of Dohc over sohc to be between 1 and 25 (ePanhtsa 2010)
although Dohc produce more power and provide lower fuel consumption the Brazilian fleet is still mostly composed of sohcs vehicles (Table 3‑1) sohc technology is predominant among the subcompact compact and medium segments (Figure 3‑16) among manufacturers sohc technology is predominant among the five largest least expensive brands (Figure 3‑17) sales of vehicles with more advanced Dohc technology grew in 2013 by almost 36 with respect to 2012 albeit from a relatively smaller base this increase was experienced in all vehicle segments but in different magnitudes
although global data on this technology are scarce Figure 3‑18 indicates that most countries are moving away from sohc with Brazil being the only country analyzed where sohc is still predominant no data were available for the us or europe
24
Brazil Passenger Vehicle Market statistics
0
10
20
30
40
50
60
70
80
90
100
Subco
mpac
t
Compac
t
Medium
Larg
eSport
O-Road SUV
Miniva
nTo
tal
Tech
nolo
gy
shar
e
nd DOHC SOHC
Figure 3‑16 ndash Valve camshaft configuration by segment (nd no data)
0
10
20
30
40
50
60
70
80
90
100
Fiat GM
Volkswag
enFord
Renau
lt
Hyund
ai
Honda
Toyo
taPSA
Nissan
Mitsub
ishi
KIAJA
CBMW
Land
Rove
r
Merce
des-B
enz
Chery
Audi
Suzuk
iJe
epTo
tal
Tech
nolo
gy
shar
e
nd DOHC SOHC
Figure 3‑17 ndash Valve camshaft configuration by manufacturer (nd no data)
0
10
20
30
40
50
60
70
80
90
100
China2010
Korea2011
Japan2011
India2012
Brazil2013
Tech
nolo
gy
shar
e
nd OVC DOHC SOHC
Figure 3‑18 ndash Valve camshaft configuration international comparison (nd no data)
25
ICCT white paper
VaLVE aCTUaTiON improved valvetrain systems with variable valve actuation (VVa) technology either variable valve timing (VVt) or variable valve timing and lift (VVt+VVl) improves the enginersquos volumetric and thermodynamic efficiency they also enable further engine improvements such as internal exhaust gas recirculation and cylinder deactivation VVt alters the timing of the intake valve exhaust valve or both primarily to reduce pumping losses increase specific power and control residual exhaust gases VVl increases efficiency by optimizing airflow over a broader range of engine operation which reduces pumping losses and increases specific power VVl is accomplished by controlled switching between two or more cam profile lobe heights the most advanced technology VVt+VVl yields a wide range of performance optimization and volumetric efficiency including enabling the engine to be valve-throttled (no need for intake throttle) VVt provides energy consumption gains of 3 to 5 while the more flexible and complex VVt+VVl system can reach 4 to 8 (ePa amp nhtsa 2010)
VVa technology either VVt or VVt+VVl are emerging technologies in Brazil where most vehicles still have fixed-valve timing designs (Table 3‑1) Fixed technology is predominant among the smaller vehicle segments as well as suVs and minivans (Figure 3‑19) the five largest manufacturers sold more than 90 of their vehicles with fixed-valve technology in 2013 (Figure 3‑20) the international comparison indicates that only Brazil and india have not yet adopted VVa technologies for most of their light-duty fleet (Figure 3‑21)
VVt and VVt+VVl are being adopted across all segments including the subcompact segment but tend to be more predominant in high-end manufacturers a closer examination by manufacturer shows that most are offering some vehicles with either one of the VVa systems while honda and hyundai offer this technology in almost all vehicles (Figure 3‑20) honda is the technology leader in variable valve actuation with the adoption in the early 1990s of the Vtec system (Valve timing electronic control) VVt technologyrsquos market share grew by about 25 in 2013 primarily due to hyundairsquos sales from 80000 units in 2012 to almost 200000 units in 2013 hyundai offered the continuously variable valve technology (cVVt) in the large majority of vehicle sold in 2013 the sports segment is the one where VVt dominates the market Mitsubishi BMW and audi are also selling a large share of their vehicles with the VVt+VVl technology
26
Brazil Passenger Vehicle Market statistics
0
10
20
30
40
50
60
70
80
90
100
Subco
mpac
t
Compac
t
Medium
Larg
eSport
O-Road SUV
Miniva
nTo
tal
Tech
nolo
gy
shar
e
VVT+VVL VVT Fixed
Figure 3‑19 ndash Valve actuation by segment
0
10
20
30
40
50
60
70
80
90
100
Fiat GM
Volkswag
enFord
Renau
lt
Hyund
ai
Honda
Toyo
taPSA
Nissan
Mitsub
ishi
KIAJA
CBMW
Land
Rove
r
Merce
des-B
enz
Chery
Audi
Suzuk
iJe
epTo
tal
Tech
nolo
gy
shar
e
VVT+VVL VVT Fixed
Figure 3‑20 ndash Valve actuation by manufacturer
VVT+VVL VVT Fixed
0
10
20
30
40
50
60
70
80
90
100
China2010
Korea2011
US2013
Japan2011
India2012
Brazil2013
Tech
nolo
gy
shar
e
Figure 3‑21 ndash Valve actuation international comparison
27
ICCT white paper
FUEL SYSTEMS FOR GaSOLiNE VEhiCLESVehicle fuel systems describe the technology required to deliver fuel into the engine combustion chamber this section examines two gasolineflex technologies namely multi-point fuel injection (MPFi) and gasoline direct injection (gDi) MPFi is now the most common fuel-delivery system for gasoline engines used in passenger vehicles worldwide in sequential MPFi engines fuel is injected into the air stream next to the intake valve port while the intake valve is open to draw the air-fuel mixture into the cylinder some of the fuel is vaporized on the surface of the hot intake valve expanding and thus reduces the volumetric efficiency on gDi engines fuel is injected at high pressure directly into the combustion chamber improving volumetric efficiency and providing cooling of the airfuel charge within the cylinder which allows for higher compression ratios and increased thermodynamic efficiency gDi technology alone offers benefits of 2 to 5 with respect to MPFi engines but bigger benefits rely on the synergy between gDi turbocharging and downsizing which can reach 12 to 15 energy consumption reduction with respect to a MPFi naturally aspirated engine (ePa 2012)
Table 3‑1 illustrates that MPFi is still the most common fuel injection technology for gasolineflex vehicles in Brazil which is reflected in its dominant share across most segments except for sports and off-road vehicles in Brazil gDi has found a niche market in the sports and off-road segments with more than 90 of sport vehicles fitted with gDi technology (Figure 3‑22) Within the overall gasoline market the gDi technology is still an emerging technology representing just 24 of new sales gDirsquos market share increased by 31 in 2013 with all but 4000 units being imported among the 10 largest manufacturers the adoption of gDi is extremely low below 5 for Volkswagen Ford hyundai and Psa (Figure 3‑23) high-end european brands (audi land rover Mercedes-Benz and BMW) are the technology leaders in terms of gDi adoption rates echoing the trend of turbocharging technology sales Volkswagen vehicles with gDi systems account for less than 35 of their sales in 2013 but their absolute numbers (around 19000 vehicles) place the company as one of the leaders in gDi technology in the Brazilian market
From a global market perspective the penetration of gDi technology in Brazil is low compared to all other markets in Figure 3‑24 except for india and japan it should be noted that the later has the largest share of hybrid vehicles around the globe
28
Brazil Passenger Vehicle Market statistics
0
10
20
30
40
50
60
70
80
90
100
Compac
t
Subco
mpac
t
Medium
Larg
eSport
O-Road SUV
Miniva
nTo
tal
Tech
nolo
gy
shar
e
GDI MPFI
Figure 3‑22 ndash gasolineflex fuel system by segment
GDI MPFI
0102030405060708090
100
Fiat GM
Volkswag
enFord
Renau
lt
Hyund
ai
Honda
Toyo
taPSA
Nissan
Mitsub
ishi
KIAJA
CBMW
Land
Rove
r
Merce
des-B
enz
Chery
Audi
Suzuk
iJe
epTo
tal
Tech
nolo
gy
shar
e
Figure 3‑23 ndash gasolineflex fuel system by manufacturer
GDI MPFI
0
10
20
30
40
50
60
70
80
90
100
China2010
Korea2011
EU-272013
US2013
Japan2011
India2012
Brazil2013
Tech
nolo
gy
shar
e (n
on-
die
sel)
Figure 3‑24 ndash gasolineflex fuel system international comparison
29
ICCT white paper
TURBOChaRGiNGengine power is primarily limited by the rate at which the engine is able to draw air into the combustion chamber turbocharging and supercharging are two methods to increase the amount of air drawn into the engine above the level of what is possible with the naturally aspirated process (through the expansion of the cylinders) By increasing the amount of air into the engine the amount of fuel can be proportionally increased resulting in increased power output level and with it the ability to reduce engine displacement while maintaining performance the combination of turbocharging and downsizing in spark ignited (gasoline and flex-fuel) vehicles can provide energy consumption improvements between 2 to 6 with respect to a direct-injected gDi engine (ePa amp nhtsa 2010) turbocharging technology is the cornerstone for achieving better energy consumption in vehicles as the basis for downsizing and reducing the engine weight while keeping the same or better vehicle performance (ie acceleration or time to reach certain speed) although turbochargers are used in diesel and gasolineflex vehicles the analysis in this report focuses on turbocharging for spark-ignited gasolineflex vehicles only
turbocharging is one of the most important emerging technologies in Brazil where most vehicles are still naturally aspirated (na) (Table 3‑1) turbocharging technology has increased the market share significantly between 2012 and 2013 by more than 65 albeit from a small base (from about 49000 to 81000 vehicles)
Most vehicles with turbocharging are sold in the sports and off-road segments as this technology also produces superior engine power output (Figure 3‑25) among the 10 largest manufacturers turbocharging is still below 10 of their sales (Figure 3‑26) Volkswagen and Ford despite having small relative sales of vehicles with turbocharging (less than 35) are the manufacturers with the highest total sales of vehicles with turbocharging audi land rover Mercedes-Benz and BMW are the technology leaders with more than 90 of vehicle sales in 2013
the penetration of turbo and supercharging technologies in Brazil is lower than in other countries with a larger gasoline fleet such as the us china and japan (Figure 3‑27) in Brazil 95 of diesel passenger vehicle sales have turbocharging technology
30
Brazil Passenger Vehicle Market statistics
0
10
20
30
40
50
60
70
80
90
100
Compac
t
Subco
mpac
t
Medium
Larg
eSport
O-Road SUV
Miniva
nTo
tal
Tech
nolo
gy
shar
e (n
on-
Die
sel)
Turbo NA
Figure 3‑25 ndash turbocharging for gasolineflex fuel vehicles by segment (NA naturally aspirated)
0102030405060708090
100
Fiat GM
Volkswag
enFord
Renau
lt
Hyund
ai
Honda
Toyo
taPSA
Nissan
Mitsub
ishiKIA
JACBMW
Land
Rove
r
Merce
des-B
enz
Chery
Audi
Suzuk
iJe
epTo
tal
Tech
nolo
gy
shar
e (n
on-
Die
sel)
Turbo NA
Figure 3‑26 ndash turbocharging for gasolineflex fuel vehicles by manufacturer (NA naturally aspirated)
0
10
20
30
40
50
60
70
80
90
100
China2010
Korea2011
EU-272013
US2013
Japan2011
India2012
Brazil2013
Tech
nolo
gy
shar
e (n
on-
die
sel)
Turbo NA
Figure 3‑27 ndash turbocharging for gasolineflex fuel vehicles international comparison (NA naturally aspirated)
31
ICCT white paper
4 vEhiCLE ENErGy CONSuMpTiON
this section analyzes the Brazilian new passenger vehicle energy consumption in 2013 although other metrics are more common (see box) vehicle energy consumption is presented in megajoules per kilometer (Mjkm) for consistency with Brazilrsquos inovar-auto policy in 2012 Brazilrsquos Ministry of Development industry and Foreign trade (MDic) adopted the inovar-auto policy with the aim of fostering industrial competitiveness through technology investments the policy includes a target for corporate average energy consumption (in Mjkm with vehicle curb weight as the attribute parameter) for vehicles sold in 2017
in the us canada Mexico and saudi arabia fleet-average fuel economy standards are defined as a function of vehicle footprint in the eu china japan south Korea and india vehicle weight is the attribute for the calculation of fleet-average targets in Brazil inovar-auto has defined its fiscal targets for vehicle energy consumption measured in megajoules per kilometer (Mjkm) as a function of vehicle weight
VEhiCLE ENERGY MEaSUREMENT UNiTS
Many metrics can be used to describe the amount of fuel energy or emissions generated by unit of distance traveled
Fuel economy measures distance traveled per unit of fuel consumed in Brazil kilometers per liter (kml) is the most common metric to describe vehicle efficiency but other units are used in different countries such as miles per gallon (mpg) in the us
Fuel consumption is the reciprocal of fuel economy and measures fuel consumed per distance traveled it is usually expressed in liters per 100 kilometers (l100 km) and it is used in europe for example
GhGCO2 emissions measures ghg or co2 emissions per distance traveled expressed as grams of pollutant per kilometer or mile
Energy consumption (EC) measures the energy consumed per distance traveled for example in megajoules per kilometer Despite being a less common metric it is sometimes preferred for being a fuel-neutral metric across different types of fuel and vehicle technologies Vehicle energy consumption in Mjkm is the metric used in Brazilrsquos inovar-auto policy to quantify the corporate average energy consumption target for each manufacturer Values for energy consumption in Brazilian spark-ignited vehicles are provided for e22 since that is the fuel mixture used in vehicle tests
Vehicle energy consumption in this report is calculated from co2 emissions data in the Brazilian institute of environment and renewable natural resources (iBaMa) nota Verde program (iBaMa 2014) which reports official emissions data from homologation tests Data are limited to passenger cars sold by the top 10 manufacturers with light commercial vehicles being excluded appendix D presents a description of data sources
32
Brazil Passenger Vehicle Market statistics
and calculation methodologies as well as a discussion of vehicle energy consumption data quality and completeness in Brazil
not surprisingly vehicle energy consumption increases with vehicle footprint and engine rated power the two parameters that define vehicle segments in Brazil (Figure 4‑1) subcompact and compact vehicles which accounted for about 45 of new sales in 2013 have average energy consumption below the fleet average while medium-sized vehicles which hold the largest market share (388) have energy consumption just above the fleet average larger more powerful vehicles consume more energy than the fleet average but have a considerably smaller market share (combined share of 163) Data availability for these segments is not as extensive as the data available for the subcompact compact and medium segments which could affect the relative rankings of each segment
Ene
rgy
cons
ump
tio
n (M
Jkm
)
Subco
mpac
t
Compac
t
Medium
Larg
e
O-road SUV
4000
200000
400000
600000
850000
35
30
25
20
15
10
05
0
Sales
Total 202
Figure 4‑1 ndash new vehicle sales-weighted average energy consumption by segment (2013)
33
ICCT white paper
Figures 4‑2 and 4‑3 illustrate new vehicle energy consumption for multiple weight and footprint bins For each weight bin (in 100 kg increments) and footprint bin (in 01 m2 increments) sales-weighted averages of energy consumption for each vehicle version are presented (dashes) generating energy consumption ranges for each bin (cream areas) Vehicle sales by bin are presented for reference in the lower charts
the strong correlation between vehicle energy consumption and weight follows from the strong physical relationship between the weight of the vehicle and the energy required to accelerate it and overcome resistances9 (Figure 4‑2) Data dispersion within each bin suggests that energy consumption varies due to other vehicle characteristics that affect vehicle aerodynamics and rolling resistance as well as the adoption of technologies that affect engine and transmission efficiency (eg friction reduction technologies gDi VVt)
Curb weight (kg)
SubcompactCompactMediumLargeO-roadSUV
Ene
rgy
cons
ump
tio
n (M
Jkm
)Sa
les
5
6
4
3
2
1
600k
800k
400k
200k
0k800 900 1000 1100 1200 1300 1400 1500 1600 1700 1800 1900 2000 2100
Figure 4‑2 ndash new vehicle energy consumption by vehicle weight (2013)
9 on a plain surface the sum of resistances of a vehicle is acceleration resistance + rolling resistance + aerodynamic resistance = c1 m a + c2 frr m + c3 cw a v2 with mass (m) as an integral part of both acceleration and rolling resistance which are most relevant for inner-city driving situations other factors are acceleration (a) rolling resistance of tires (frr) aerodynamic coefficient of the vehicle (cw) frontal area of vehicle (a) velocity (v) and constants (cx)
34
Brazil Passenger Vehicle Market statistics
Footprint has a reasonable correlation with energy consumption (Figure 4‑3) ie larger vehicles tend to consume more fuel than smaller vehicles however the correlation is not as strong as with vehicle weight similar to the previous figure the broad spread of energy consumption values suggests a combination of different vehicle characteristics (eg weight engine displacement rated power) and technologies (eg transmissions fuel systems) as well as the presence of suVs and off-road vehicles among the medium- and large-sized footprint values respectively
Footprint (m2)
SubcompactCompactMediumLargeO-roadSUV
Ene
rgy
cons
ump
tio
n (M
Jkm
)Sa
les
5
6
4
3
2
1
400k
500k
300k
200k
100k
0k31 32 33 34 35 36 37 38 39 40 41 42 43 44 45 46 48 49
Figure 4‑3 ndash new vehicle energy consumption by vehicle footprint (2013)
35
ICCT white paper
Figure 4‑4 illustrates sales weighted average for new vehicle energy consumption by mass for the top 10 manufacturers in Brazil in 2013 Bubble sizes are proportional to total vehicle sales Manufacturers in the lower-left quadrant produce the lightest and most efficient vehicles with hyundai presenting the best overall average energy consumption renault in the upper-left quadrant produces vehicles that are equivalent in weight but on average with higher energy consumption in the lower-right quadrant are manufacturers that produce relatively heavier vehicles but with lower energy consumption in their weight class Despite producing heavier vehicles on average than many manufacturers honda achieves lower energy consumption on average in the upper-right quadrant are manufacturers that produce on average the heavier and least efficient vehicles with Psa (citroen and Peugeot) producing the heaviest and least efficient cars on average a regression line correlating vehicle energy consumption and mass highlights the best performers (hyundai honda and nissan) average performers (Fiat Volkswagen gM and toyota) and those performing worse than average (renault Ford and Psa)
FIA
GMVW
FORREN
HYU
HON
TOY
PSA
NIS
160
170
180
190
200
210
220
230
240
250
950 1000 1050 1100 1150 1200 1250 1300 1350
Ene
rgy
cons
ump
tio
n (M
Jkm
)
Curb weight (kg)
Fleet Ave
Figure 4‑4 ndashaverage new vehicle sales-weighted energy consumption by manufacturer (2013)
36
Brazil Passenger Vehicle Market statistics
Figure 4‑5 shows fleet-average energy consumption based on certification and type approval data for new vehicles in multiple countries converted to the us caFe combined driving cycle Bubble sizes represent total sales of new passenger cars Because of data availability in different countries the country comparison is based on different calendars years for different countries 2011 for south Korea and japan 2012 for china and india and 2013 for europe the us and Brazil given annual improvements in vehicle energy consumption triggered by regulatory efficiency standards and fiscal incentives those countries with older data could be at a slight disadvantage in this comparison
With the heaviest vehicles on average the us fleet is also the most energy consuming of all countries china and south Korea have similar average energy consumption but since south Korean vehicles are heavier on average they are relatively more efficient than chinese vehicles although Brazilrsquos fleet consumes less fuel on average than those from the us china and south Korea its fleet is relatively inefficient when compared to countries with vehicles of similar weight (japan and india) the average Brazilian vehicle consumes about 34 more energy than the average vehicle in japan whose fleet has a large penetration of gasoline hybrid and advanced fuel-efficiency technologies such as three-cylinder engines VVa Dohc and 6-plus speed transmissions european vehicles are the best performing on average despite being heavier than all countries with the exception of the us and south Korea the adoption of fuel-efficiency technologies (eg Dct 6-plus-speed transmissions gDi turbocharging) contributes to europersquos better than average performance
China2012
SKorea2011
Europe2013
US2013
Japan2011
India2012
Brazil2013
Sales5 MM10 MM
14
16
18
20
22
24
26
28
1000 1100 1200 1300 1400 1500 1600 1700
Ene
rgy
cons
ump
tio
n ndash
CA
FE
(M
Jkm
)
Curb weight (kg)
Type-approval and certification energy consumption data only (does not include o-cycle or real-world driving data)
Figure 4‑5 ndash international comparison of passenger car energy consumption
Country labels indicate the dataset year
Figure 4‑6 provides a more detailed country comparison by illustrating average vehicle energy consumption by vehicle (curb) weight bin Vehicle sales in each bin are shown for reference the us is not shown due to lack of detailed model-by-model data Brazilrsquos vehicles on average have the highest energy consumption in most weight
37
ICCT white paper
bins with china being the second highest in most bins Because china has higher fuel consumption than Brazil on the 1000 bin which represents the highest share of vehicle sales fleet-average energy consumption in china is still higher than in Brazil as illustrated in the previous figure europe consistently performs best in terms of vehicle energy consumption in most weight bins with japan also performing relatively well
Curb weight (kg)
BrazilChinaEuropeIndiaJapanSouth Korea
Ene
rgy
cons
ump
tio
n C
AF
E (
MJ
km)
Sale
s
40
35
25
20
15
10
6M
8M
4M
2M
0M600 800 1000 1200 1400 1600 1800 2000 2200 2400
Figure 4‑6 ndash international comparison of average vehicle energy consumption by vehicle weight
Type-approval and certification energy consumption data only (does not include off-cycle or real-world driving data)
38
Brazil Passenger Vehicle Market statistics
Figure 4‑7 illustrates the distribution of energy consumption data in Brazil for each vehicle version by mass and segment Bubble sizes represent total sales of each version Data were limited to flex-fuel vehicles in the subcompact compact medium and large segments due to its relatively better data quality and representativeness (ie they represented over 87 of sales in 2013) While most vehicles follow a predictable trend that correlates energy consumption and vehicle mass there are a large number of versions with energy consumption substantially higher than the trend line this suggests there is substantial room for improvements in their energy consumption since there are vehicles in similar weight classes with substantially superior energy consumption performance
Sales1000050000
140
160
180
200
220
240
260
280
700 800 900 1000 1100 1200 1300 1400 1500 1600
Ene
rgy
cons
ump
tio
n (M
Jkm
)
Curb weight (kg)
Subcompact Compact Medium Large Fleet average
Figure 4‑7 ndash Distribution of new Brazilian passenger vehicle energy consumption data by vehicle weight and segment (2013)
this chapter suggests that there are potential improvements in vehicle energy consumption for the Brazilian fleet For similar vehicles in terms of weight class footprint or engine rating there is substantial dispersion in energy consumption indicating that there are vehicles performing much worse than the average across manufacturers there is also a clear trend of some manufacturers performing much better than the average while others have a lot more room for improvement the international comparison clearly shows that Brazilian vehicles perform much worse in terms of energy consumption than vehicles of similar weight suggesting a delay in the adoption of energy efficient technologies among Brazilian vehicle manufacturers
Finally a more detailed analysis of vehicle versions clearly illustrates a considerable number of vehicle versions significantly above average thus indicating potential improvements in energy consumption that would place them on par with better performing vehicles with similar characteristics
39
ICCT white paper
Deficiencies in data quality and completeness prevent more definite conclusions about vehicle energy consumption gasoline-only vehicles in particular have poor energy consumption data quality although they represent a relatively small fraction (6) of total vehicles sold in 2013 Because some vehicle segments are primarily composed of gasoline-only vehicles (eg sports minivans) this chapter excludes these segments from the analysis there are also concerns about the gap between energy consumption data reported by iBaMarsquos nota Verde and Brazilrsquos national institute of Metrology standardization and industrial Qualityrsquos (inMetro) labeling program (PBeV using its acronym in Portuguese) with the latter reporting consistently lower values of vehicle energy consumption
Finally the availability of energy consumption data was not adequate for many manufacturers beyond the top 10 sales group which prevented their inclusion in this analysis Despite the data quality and lack of completeness the energy consumption data in this chapter include data that are reasonably accurate and representative thus supporting its interpretation
40
Brazil Passenger Vehicle Market statistics
rEfErENCES
aDK automotive consultoria de Marketing (2013) relatoacuterios de volumes de vendas do mercado brasileiro para veiacuteculos de passeio e comerciais leves referentes a 2013
alves l Wilbert M (2014) reduccedilatildeo do imposto sobre Produto industrializado e a Venda de automoacuteveis Xi congresso usP iniciaccedilatildeo cientiacutefica em contabilidade
associaccedilatildeo nacional de transportes Puacuteblicos (antP 2014) estudo mostra baixo efeito do desconto no iPi de veiacuteculos sobre PiB e emprego available at httpwwwantporgbrwebsitenoticiasshowaspnpgcode=a4DeeFe8-a7BF-48D3-B1F5-8eDe1447BF10
associaccedilatildeo nacional dos Fabricantes de Veiacuteculos automotores (anFaVea 2015) anuaacuterio da induacutestria automobiliacutestica Brasileira 2015 Brazilian automotive industry Yearbook 2015 satildeo Paulo available at wwwanfaveacombr
european environment agency (2014) Monitoring co2 emissions from new passenger cars in the eu summary of data for 2013 april 2014
instituto Brasileiro do Meio ambiente e dos recursos naturais renovaacuteveis (iBaMa 2014) consulta dos niacuteveis de emissatildeo dos veiacuteculos novos brasileiros available at httpsservicosibamagovbrctfpublicosel_marca_modelo_rvepphp
international council on clean transportation (icct 2015) global passenger vehicle standards available at httpwwwtheicctorginfo-toolsglobal-passenger-vehicle-standards
international energy agency (iea 2015) renewables Bioenergy available at httpswwwieaorgtopicsrenewablessubtopicsbioenergy
Korea energy Management corporation (KeMco 2014) Fuel economy regulation available at httpwwwkemcoorkrnew_engmainmainasp
Marklines (2015) Marklines automotive industry Portal available at httpwwwmarklinescomen
Mendonccedila M sachsida a (2014) Modelando a demanda de creacutedito para veiacuteculos no Brasil uma abordagem com mudanccedila de regime iPea
Ministeacuterio do Desenvolvimento induacutestria e comeacutercio exterior (MDic 2013) Programa de incentivo agrave inovaccedilatildeo tecnoloacutegica e adensamento da cadeia Produtiva de Veiacuteculos automotores mdash inovar-auto httpwwwplanaltogov brccivil_03_ato2011-20142012DecretoD7819htm
stein r anderson j and Wallington t (2013) an overview of the effects of ethanol-gasoline Blends on si engine Performance Fuel efficiency and emissions SAE Int J Engines 6(1)470-487 2013 doi1042712013-01-1635
us environmental Protection agency and national highway traffic safety administration (ePanhtsa 2010) Final rulemaking to establish light-Duty Vehicle greenhouse gas emission standards and corporate average Fuel economy standards ePa-420-r-10-901
us environmental Protection agency (ePa 2012) regulatory impact analysis Final rulemaking for 2017-2025 light-Duty Vehicle greenhouse gas emission standards and corporate average Fuel economy standards ePa-420-r-12-016
41
ICCT white paper
us national academy of sciences (nas 2011) assessment of Fuel economy technologies for light-Duty Vehicles available at httpwwwnapeducatalog12924assessment-of-fuel-economy-technologies-for-light-duty-vehicles
World Bank group (2015) World Development indicators available at httpdataworldbankorgdata-catalogworld-development-indicators
42
Brazil Passenger Vehicle Market statistics
LiST Of ACrONyMS
4wD Four-wheel drive
aNFaVEa Brazilian association of automobile Manufacturers
awD all-wheel drive
BRiC Brazil russia india china
CaFE corporate average fuel economy
CBG compressed biogas
CO2 carbon dioxide
CVT continuously variable transmission
CVVT continuously variable valve technology
DCT Dual-clutch transmission
DOhC Dual overhead camshaft
EC energy consumption
Epa us environmental Protection agency
EU european union
FFV Flex-fuel vehicle
FTp Federal test procedure
FwD Front-wheel drive
GDi gasoline direct injection
GDp gross domestic product
GhG greenhouse gas
GM general Motors
iBaMa Brazilian institute of the environment and renewable natural resources
iC internal combustion
iCCT international council on clean transportation
iNMETRO national institute of Metrology standardization and industrial Quality
Kg Kilogram
Km Kilometer
Kw Kilowatt
LDV light-duty vehicle
LpG liquified petroleum gas
MDiC Ministry of Development industry and Foreign trade
MJ Megajoule
MpFi Multi-point fuel injection
Mpg Miles per gallon
NaS us national academy of sciences
43
ICCT white paper
NhTSa us national highway transportation safety administration
OhV overhead valve
pBEV Brazilian Vehicle labeling Program
pSa Psa Peugeot citroeumln
pTwR Power-to-weight ratio
pV Passenger vehicle
RwD rear-wheel drive
SOhC single overhead camshaft
SUV sport utility vehicle
US united states
USD us dollar
VTEC Valve timing electronic control
VVa Variable valve actuation
VVL Variable valve lift
44
Brazil Passenger Vehicle Market statistics
AppENDix A SEGMENT DEfiNiTiONS
Table a‑1 ndash segment definitions
Segmentpower (kw)
pTwR (kwkg) area (m2)
Other characteristics Examples
Subcompact lt 140 lt 0075 le 65 mdash Mini cooper chevrolet celta smart Fortwo
Compact lt 140 lt 0075 65 lt area le 70 mdash honda Fit hyundai hB20 Volkswagen Polo
Medium lt 140 lt 0075 70 lt area le 80 mdash honda civic nissan tiida Peugeot 308
Large lt 140 lt 0075 gt 80 mdash audi a4 BMW 3 series Mercedes c-class
Sports gt 140 gt 0075 mdash 4 seats maxjaguar XF lamborghini gallardo Ferrari california
Off‑road mdash mdash lt 80 traction = 4WDjeep cherokee honda cr-V BMW X3 hyundai santa Fe
SUV mdash mdash lt 80Based on aDKrsquos default classification
BMW X1 Ford ecosport hyundai tucson
Minivan mdash mdash Passengers 6-12
citroen grand Picasso Kia carnival
45
ICCT white paper
AppENDix b iNTErNATiONAL MArKET DATA
Table B‑1 ndash international market comparison of new fleet characteristics
parameters China S Korea EU US Japan india Brazil
Year 2012 2011 2013 2013 2011 2012 2013
Sales (million) 155 13 118 156 352 256 304
price (USD) $21008 $21383 $24439 mdash $20637 $11717 $22015
No of cylinders mdash 43 40 47 38 36 40
Displacement (cc) 1605 1960 1613 2606 1425 1294 1430
Curb weight (kg) 1296 1421 1391 1623 1193 1059 1106
Length (mm) 4323 4531 4263 mdash 4013 3859 4100
Footprint (m2) 38 420 40 425 371 341 367
Engine power (kw) 86 120 89 148 78 55 76
pTwR (kwkg) 00664 00844 00640 00912 00654 00519 00671
Energy consumption ndash US CaFE (MJKm)[1] 235 206 169 250 171 183 202
[1] energy consumption data presented here for countries other than Brazil were obtained from local official sources in its original metric and drive cycle and then converted to Mjkm under the us caFe drive cycle using the methodology described in Yang (2015) Mode details and historical fuel consumption data on their original metrics is presented in the icctrsquos global PV standard website httpwwwtheicctorginfo-toolsglobal-passenger-vehicle-standards
Data Sources
China Ministry of industry and information technology (Miit 2014) corporate average Fuel efficiency accounting Method for Passenger cars available at httpwwwgovcngzdt2013-0320content_2358627htm
Baseline performance china automotive research and technology center through internal communication and icct internal 2010 database for chinese light-duty vehicles
S Korea internal communication with s Korean official and from greencarcongress available at httpwwwgreencarcongresscom200906korea-20090604html
EU european environment agency (2014) Monitoring co2 emissions from new passenger cars in the eu summary of data for 2013 april 2014
US us ePa (2014) light-duty automotive technology carbon dioxide emissions and fuel economy trends1975 through 2014 table 91 page 110 available at http httpwwwepagovfueleconomyfetrends1975-2014420r14023apdf
Japan jaMa (2010) the Motor industry of japan available at httpwwwjama-englishjppublicationsMVs2010pdf Mlit httpwwwmlitgojpcommon000990330pdf
india Bureau of energy efficiency white paper 2010-2012 calculation based on icct database
Brazil icct Brazil Vehicle Database (2013)
46
Brazil Passenger Vehicle Market statistics
Table B‑2 ndash international market comparison of technology adoption in new vehicles
Technology adoption China S Korea EU US Japan india Brazil
Year 2010 2011 2013 2013 2011 2012 2013
Fuel type
CBGLpGFlex 0 11 2 0 0 4 94
Gasoline 99 65 44 93 86 56 6
hybrid 0 1 1 5 13 0 0
Diesel 1 23 53 1 0 40 0
No of cylinders
Two 0 0 0 0 0 6 0
Three 4 0 7 0 36 28 3
Four 90 84 87 56 57 65 97
Five 0 0 1 0 0 0
Six 6 15 4 32 5 0 1
Eight or more 0 0 0 12 1 0 0
Transmission
Manual 60 3 83 5 1 98 83
automatic 34 90 9 75 34 2 15
CVT 5 7 2 18 65 0 1
DCT 1 0 6 2 mdash 0 1
Number of gear ratios
Four or fewer 13 16 1 7 mdash 10 6
Five 68 9 45 11 mdash 85 83
Six or more 19 75 54 82 mdash 5 11
Drivetrain
FwD 74 86 81 83 59 76 0
RwD 21 7 7 10 5 22 0
4wD and awD 5 7 12 7 36 2 100
No of valves per cylinder
Two 17 mdash mdash 2 4 25 60
Multi valve 83 mdash mdash 98 95 75 40
Valve camshaft configuration
Single overhead camshaft 26 1 mdash mdash 16 41 63
Dual overhead camshaft 74 84 mdash mdash 82 53 25
Overhead camshaft mdash 15 mdash mdash 0 6 mdash
Valve actuation
Fixed 50 16 mdash 2 11 86 78
VVT 44 84 mdash 98 89 12 16
VVL 6 mdash mdash mdash mdash 2 6
Fuel systems for gasoline vehicles
Multi‑point fuel injection 94 72 68 62 95 100 98
Gasoline direct injection 6 28 32 37 5 0 2
air induction systems for gasoline vehicles
Naturally aspirated 93 75 41 85 92 64 97
Supercharger turbocharger or twin‑turbo 7 25 59 15 8 36 3
47
ICCT white paper
AppENDix C NEW vEhiCLE ChArACTEriSTiCS AND TEChNOLOGy ADOpTiON DATA iN brAziL
Table C‑1 ndash Fleet characteristics of new Brazilian passenger vehicles by segment (2013)
parameters Subcompact Compact Medium Large Sports Off‑road SUV Minivan
Sales (thousands) 6785 6843 11790 1920 273 768 1997 23
Market share () 223 225 38 8 63 09 25 65 01
price (R$) $30103 $38732 $45496 $66508 $148834 $151284 $75164 $82284
No of cylinders 400 391 399 400 462 448 404 433
Displacement (cc) 1128 1293 1447 1794 2430 2586 1884 2244
Curb weight (kg) 940 1037 1102 1329 1561 1772 1395 1604
Length (mm) 3804 4026 4163 4499 4711 4516 4352 4658
Footprint (m2) 339 361 371 402 418 409 402 427
Engine power ndash gasoline (kw) 58 68 75 99 183 146 103 120
Engine power ndash ethanol (kw) 59 70 77 98 mdash 109 101 mdash
pTwR ndash gasoline (kwkg) 00614 00655 00671 00742 01173 00828 00731 00732
pTwR ndash ethanol (kwkg) 00630 00678 00697 00757 mdash 00766 00745 mdash
48
Brazil Passenger Vehicle Market statistics
Table C‑2 ndash Fleet characteristics of new Brazilian passenger vehicles by manufacturer (2013)
parameters Fiat
GM
Vo
lksw
agen
Ford
Ren
ault
hyu
ndai
ho
nda
Toyo
ta
pSa
Nis
san
Mit
sub
ishi
Kia
JaC
BM
w
Land
Rov
er
Mer
ced
es‑B
enz
Che
ry
aud
i
Suzu
ki
Jeep
Sales (thousands) 6087 5486 5448 3074 2207 2055 1392 1334 1163 621 368 255 158 141 106 94 80 67 63 36
Market share () 2002 1804 1792 1011 726 676 458 439 383 204 121 084 052 046 035 031 026 022 021 012
price (R$) $35017 $42259 $38701 $46174 $43447 $50112 $67078 $68922 $103001 $44035 $100696 $87009 $37654 $165111 $221943 $153281 $30821 $142799 $74769 $139039
No of cylinders 400 401 400 402 400 370 400 400 400 400 408 416 400 424 448 431 400 411 400 552
Displacement (cc) 1250 1340 1287 1497 1423 1495 1691 1808 1575 1579 2262 1856 1411 2095 2281 1934 1398 1912 1831 3182
Curb weight (kg) 1033 1060 1020 1156 1102 1122 1210 1201 1231 1069 1556 1377 1079 1624 1868 1598 1097 1551 1444 1945
Length (mm) 3965 4155 3993 4120 4127 4078 4319 4299 4116 4171 4401 4357 3956 4574 4487 4527 3896 4454 4234 4584
Footprint (m2) 345 370 354 368 378 383 397 387 376 379 395 407 351 429 433 429 349 417 323 420
Engine power ndash gasoline (kw) 64 71 65 79 73 86 96 90 80 82 120 112 83 151 179 138 71 136 94 162
Engine power ndash ethanol (kw) 65 72 65 79 76 85 97 90 81 82 107 106 95 mdash mdash mdash 75 mdash mdash mdash
pTwR ndash gasoline (kwkg)
00613 00662 00631 00674 00657 00739 00788 00745 00646 00766 00779 00792 00784 00921 00977 00856 00638 00870 00649 00835
pTwR ndash ethanol (kwkg) 00629 00681 00642 00693 00685 00781 00800 00795 00660 00768 00710 00798 00896 mdash mdash mdash 00659 mdash mdash mdash
49
ICCT white paper
Table C‑3 ndash Fleet characteristics of new Brazilian passenger vehicles by origin (2013)
parameters Domestic imported
Sales (thousands) 2537 504
Market share () 834 166
price (R$) $41739 $76049
No of cylinders 397 412
Displacement (cc) 1359 1791
Curb weight (kg) 1070 1289
Length (mm) 4063 4285
Footprint (m2) 362 390
Engine power ndash gasoline (kw) 70 102
Engine power ndash ethanol (kw) 73 84
pTwR ndash gasoline (kwkg) 0065 0076
pTwR ndash ethanol (kwkg) 0068 0074
50
Brazil Passenger Vehicle Market statistics
Table C‑4 ndash technology adoption in new Brazilian passenger vehicles by segment (2013)
Technology adoption Subcompact Compact Medium Large SportOff‑road SUV Minivan
Fuel type
Flex 982 988 982 837 00 134 826 00
Gasoline 18 12 17 163 996 540 174 1000
hybrid 0000 0000 0028 0000 0396 0001 0000 0000
Diesel 00 00 00 00 00 326 00 00
No of cylinders
Three 01 91 10 00 00 00 00 00
Four 999 909 990 998 758 775 979 833
Five 00 00 00 02 03 00 00 00
Six 00 00 00 00 175 211 21 167
Eight or more 00 00 00 00 63 13 00 00
Transmission
Manual 993 944 826 622 62 174 505 641
automatic 07 55 161 283 629 707 451 359
CVT 00 00 12 89 09 93 34 00
DCT 00 01 02 06 299 25 10 00
No of gear ratios
Four or fewer 04 47 72 51 00 34 247 193
Five 984 943 848 378 15 392 516 641
Six 12 09 73 515 796 462 225 167
Seven 00 01 06 23 87 53 12 00
Eight or more 00 00 01 32 102 59 00 00
Drivetrain
FwD 998 1000 997 688 550 00 916 1000
RwD 02 00 03 311 221 00 84 00
awD 00 00 00 01 229 1000 00 00
No of valves per cylinder
Two 806 694 584 195 00 00 258 00
Multi valve 194 306 416 805 1000 1000 742 1000
Valve camshaft configuration
Single overhead camshaft 839 786 709 309 00 212 375 00
Dual overhead camshaft 24 158 161 546 880 517 446 255
Valve actuation
Fixed 982 729 807 461 49 493 664 868
VVT 18 211 115 470 827 367 252 132
VVT+VVL 00 61 78 68 124 140 84 00
Fuel systems for gasoline vehicles
Multi‑point fuel injection 999 998 997 949 979 143 766 1000
Gasoline direct injection 01 02 03 51 21 857 234 00
air induction systems for gasoline vehicles
Naturally aspirated 999 997 995 943 974 369 543 1000
Supercharger turbocharger or twin‑turbo 01 03 05 57 26 631 457 00
51
ICCT white paper
Table C‑5 ndash technology adoption in new Brazilian passenger vehicles by manufacturer (2013)
Technology adoption Fi
aT
GM
VO
LKSw
aG
EN
FOR
D
REN
aU
LT
hY
UN
Da
i
hO
ND
a
TOYO
Ta
pSa
NiS
SaN
MiT
SUB
iSh
i
Kia
JaC
BM
w
LaN
D R
OV
ER
MER
CED
ES
Fuel type
Flex 990 987 965 966 997 921 999 886 928 998 283 739 31 42 00 00
Gasoline 10 09 35 34 03 79 01 35 72 02 557 255 969 957 663 950
hybrid 00 00 00 00 00 00 00 02 00 00 00 00 00 00 00 00
Diesel 00 04 00 00 00 00 00 77 00 00 160 06 00 00 337 50
No of cylinders
Three 00 00 05 00 00 348 00 00 00 00 00 00 00 00 00 00
Four 1000 996 994 989 1000 626 999 998 1000 1000 958 922 1000 906 787 878
Five 00 00 00 00 00 00 00 00 00 00 00 00 00 00 00 00
Six 00 02 01 11 00 26 01 02 00 00 42 78 00 68 185 87
Eight or more 00 02 00 00 00 00 00 00 00 00 00 00 00 26 28 35
Transmission
Manual 992 878 985 846 853 632 566 565 703 785 493 120 1000 02 00 151
automatic 08 103 00 137 62 285 355 160 297 121 118 793 00 575 18 14
CVT 00 19 15 16 41 70 01 246 00 00 139 87 00 423 982 836
DCT 00 00 00 00 43 13 78 30 00 94 251 00 00 00 00 00
No of gear ratios
Four or fewer 02 04 00 55 104 237 00 323 249 132 17 133 00 00 00 00
Five 981 811 963 839 797 623 861 643 684 828 530 107 1000 00 00 64
Six 17 185 29 106 99 140 139 07 67 40 453 754 00 217 800 00
Seven 00 00 07 00 00 00 00 27 00 00 00 00 00 08 00 936
Eight or more 00 00 00 00 00 00 00 00 00 00 00 06 00 775 200 00
Drivetrain
FwD 1000 902 989 972 987 985 990 892 1000 1000 496 623 1000 00 00 00
RwD 00 91 00 00 00 00 00 16 00 00 00 370 00 882 00 900
awD 00 06 11 28 13 15 10 92 00 00 504 07 00 118 1000 100
No of valves per cylinder
Two 811 864 988 745 220 00 00 00 00 00 00 00 00 00 00 00
Multi Valve 189 136 12 255 780 1000 1000 1000 1000 1000 1000 1000 1000 1000 1000 1000
Valve camshaft configuration
SOhC 836 755 914 675 832 00 04 00 497 398 331 00 00 00 00 00
DOhC 07 108 56 50 168 992 786 875 352 428 477 1000 907 810 860 453
Valve actuation
Fixed 1000 898 965 966 940 29 00 574 736 573 435 76 124 187 18 55
VVT 00 102 35 34 60 971 00 426 264 427 00 924 876 00 982 945
VVT+VVL 00 00 00 00 00 00 1000 00 00 00 565 00 00 813 00 00
air induction System
Naturally aspirated 997 994 966 977 997 988 1000 923 922 1000 835 936 1000 97 37 101
Supercharger turbocharger or twin‑turbo
03 06 34 23 03 12 00 77 78 00 165 64 00 903 963 899
Fuel systems for gasoline vehicles
Multipoint fuel injection 1000 995 965 972 1000 989 1000 1000 967 1000 994 1000 1000 78 15 158
Gasoline Direct injection 00 05 35 28 00 11 00 00 33 00 06 00 00 922 985 842
note Difference between 100 and summation of sohc and Dohc market share values corresponds to data not available
52
Brazil Passenger Vehicle Market statistics
AppENDix D DATA SOurCES AND COMpLETENESS
the basis of the statistics shown in this report is a database compiled by the icct with vehicle sales technical information (eg fleet characteristics technology content) and energy consumption (converted from either co2 emissions or fuel economy) from various data sources outlined in table D-1
Table D‑1 ndash Brazilian data sources
parameters Sales TechnicalEnergy
consumption
aDK (2014 2015) x x
MarkLines (2015) x
iBaMa (2014) x
iNMETRO (2014) x
UOL (2014) x
icarroscom (2014) x
this analysis examined energy consumption data from two public sources the nota Verde Program by the Brazilian institute of the environment and renewable natural resources (iBaMa) and the Brazilian Vehicle labeling Program (PBeV) by the national institute of Metrology standardization and industrial Quality (inMetro) table D-2 summarizes key differences between these two data sources
Table D‑2 ndash energy consumption data sources
iBaMa iNMETRO
program nota Verde1 Brazilian Vehicle labeling Program (PBeV)2
program description
Mandatory program that reports emissions of co2 co nox and nMhc as part of emissions certification program
Voluntary program since 2009 that allows the comparison of fuel economy across vehicle models
Unit gco2 km kml
Test cycle chassis testing under urban (FtP) driving cycle based on nBr 66012005
chassis testing under urban (FtP) and highway (hWYFe) driving cycles based on nBr 702420103
adjustment
no adjustment for real-world driving conditions Because reported co2 emissions are assumed to be zero for ethanol adjustments were made to account for tailpipe co2 emissions for vehicles running on ethanol
since 2010 published values include real-world adjustment factors to chassis test data a method adopted by the us ePa in 2008
Conversion to MJkm
iBaMarsquos data are reported as FtP (city test) co2 data in gco2 km conversion to caFe test cycle and to a different metric (Mjkm) involves four steps as presented in Figure D-1
inMetrorsquos data in kml are presented separately by fuel type (e22 e100) and driving cycle (urban highway) conversion to Mjkm was done by applying a conversion factor (2167 gco2 l for e22 and 1428gco2l for e00) caFe values are obtained by using a 5545 weighting for the urban (FtP) and highway cycles respectively
1 iBaMa (2014) nota Verde program available at httpwwwmmagovbrcidades-sustentaveisqualidade-do-arcontrole-de-emissoes-veicularesnota-verde
2 inMetro (2014) Programa Brasileiro de etiquetagem Veicular (PBeV) available at httpwwwinmetrogovbrconsumidortabelas_pbe_veicularasp
3 inMetro (2014) Metodologia Para Divulgaccedilatildeo De Dados De consumo Veicular available at httpwwwinmetrogovbrconsumidorpbeMetodologia_consumo_Veicularpdf
53
ICCT white paper
Step 1 Correcting the original IBAMA CO2 reported data ndash FTP CO2 gkm
IBAMArsquos CO2 reported values are corrected to account for tailpipe emissions from ethanol (tailpipe CO2 emissions are reported as zero in IBAMArsquos data)
bull E22 FTP reported CO2 data are reduced by 177bull E100 FTP reported CO2 data are reduced by 100
Flex fuel vehicles are tested with E22 and E00 the final values is calculated as the average of both fuelsCO2 IBAMA_Flex_FTP= 05(1-0177)CO2_E22_test_FTP + 050E100_FTP = 050823CO2_E22_FTPFor Gasoline only vehicles the tests are carried out only with Gasoline E22CO2 IBAMA_Gasoline_FTP = (1-0177) CO2_E22_Test_FTP
Where in the previous equations CO2_E22_FTP means CO2 emissions values obtained under FTP testingCO2 IBAMA_Flex_FTP means IBAMArsquos Corrected FTP values for flex vehiclesCO2 IBAMA_Gasoline_FTP means IBAMArsquos Corrected FTP values for gasoline only (E22) vehicles
INNOVAR AUTO is based on energy consumption data obtained as the combined CAFE test cycle This requires a weighted average of energy consumption data obtained from FTP testing (city driving ) and Highway fuel economy testing (HWFET) In mathematical form CAFE=f(FTPHWFET)
Given that IBAMA data is provided for only the first aprt the FTP testing then it is required to find a way to calculate CAFE combined values through FTP -75 only data A linear function was thus developed from data with FTP and HWY values (INMETRO data) is used to convert FTP only values to CAFE CO2 values ie CAFE=f(FTP) The function used for this conversion is
CO2_CAFE= (CO2_FTP+44756)11572
Step 2Convert FTP CO2 values to CAFE CO2 values
Converting CO2 values to MJkm values is done by using the energy density of E22 Note that all the previous calculations for CO2 come from E22-based data
bull The energy density of E22 is 2894 MJLE22bull E22 emits 2167gCO2LE22bull CAFE (MJkm) = CAFE (gCO2km) (2894 MJLE22 2167 gCO2LE22)
Step 3 Convert US CAFE CO2 values to MJkm values
Figure D‑1 ndash conversion of emission to energy consumption data
energy consumption values calculated from iBaMa and inMetro data differ greatly Figure D-1 illustrates energy consumption data for those models in both databases iBaMa data are on average 126 higher than inMetro data with a standard deviation of 89 and a maximum deviation of 39
54
Brazil Passenger Vehicle Market statistics
0
05
1
15
2
25
3
0 05 1 15 2 25 3
Ene
rgy
cons
ump
tio
n IB
AM
A (
MJ
km)
Energy consumption INMETRO (MJkm)
n=151
Figure D‑2 ndash comparison between energy consumption data from inMetro and iBaMa
151 vehicles tested under both programs
although inMetro data are more transparent as it breaks down fuel economy by fuel and test cycle it is still a voluntary program that allows manufacturers to select which models will participate in addition not all manufacturers participate in the program in turn iBaMa data only include co2 data for the urban cycle and thus energy consumption in the combined cycle had to be estimated from correlations using international data in addition corrections had to be made for gasoline-only engines since it seems that a co2 discount in theory only applicable to flex-fuel engines was also applied to gasoline-only engines Despite these data quality issues iBaMa data were considered the most adequate data source for energy consumption because it is a mandatory program that requires data reporting by all vehicle models and manufacturers
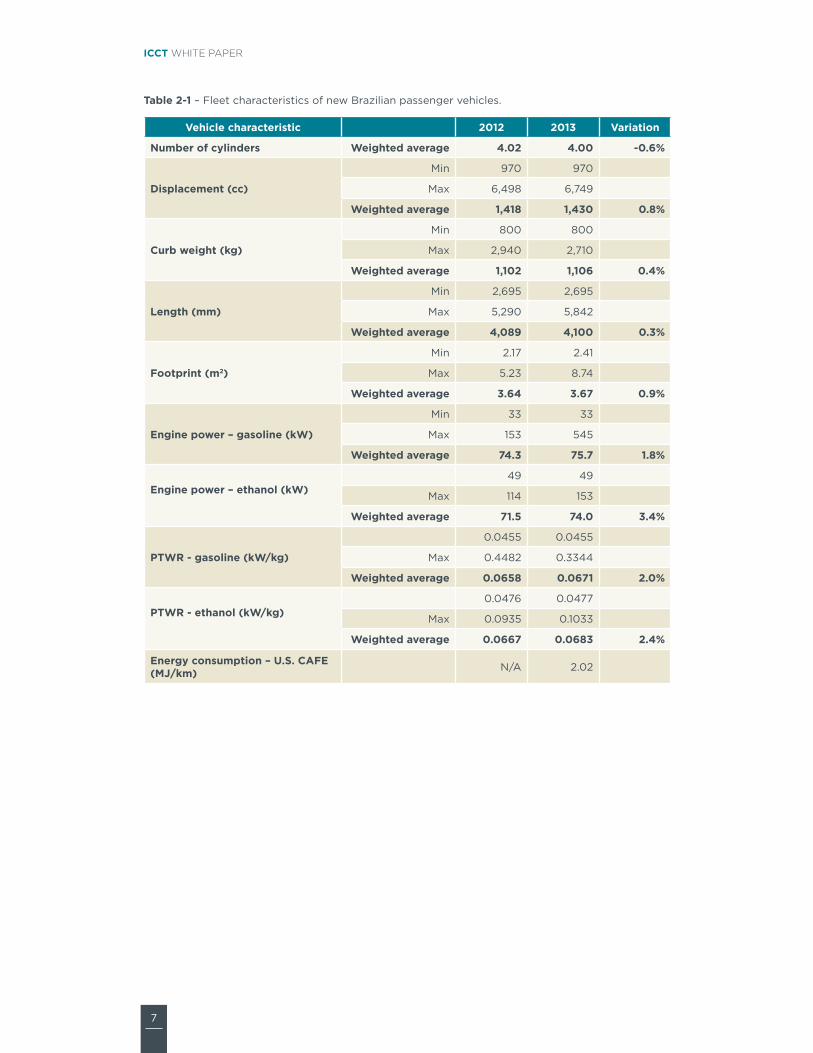
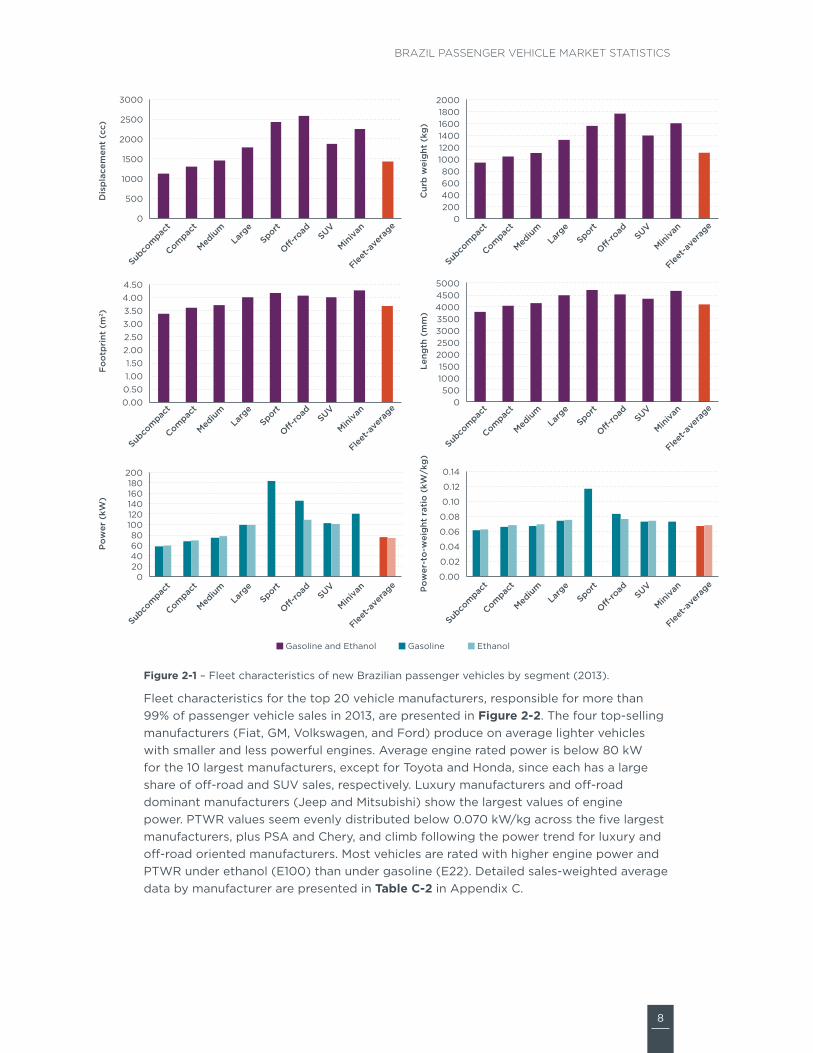
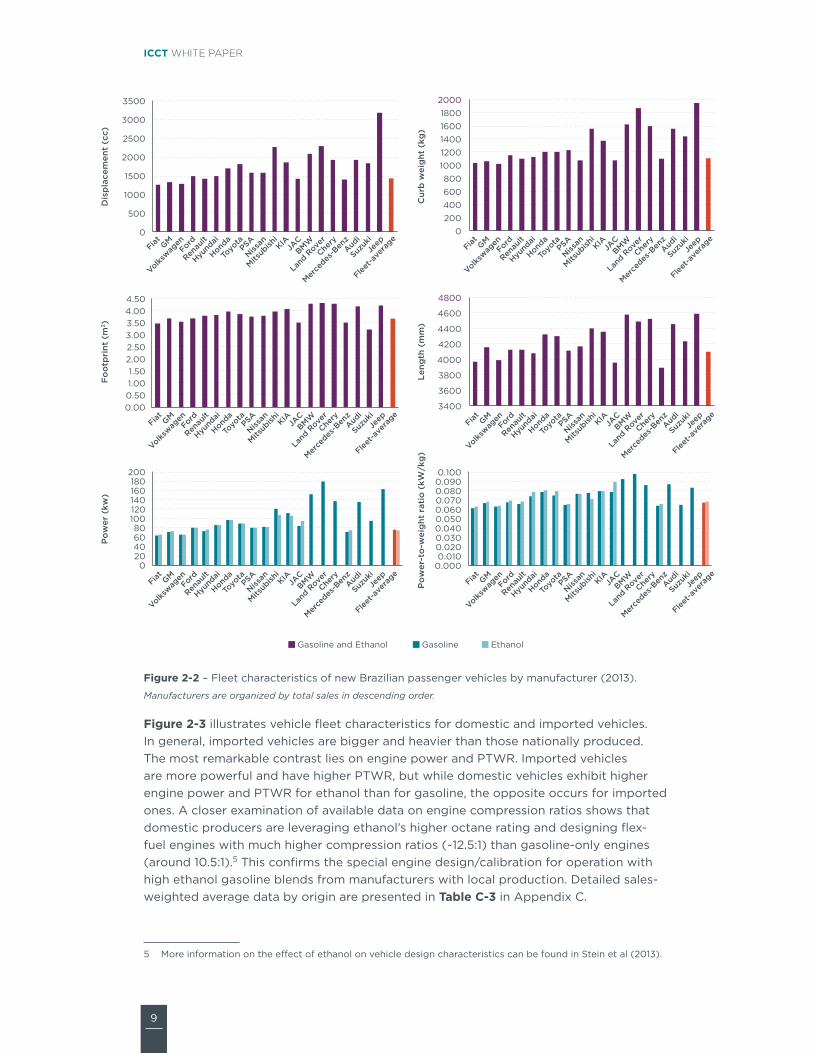
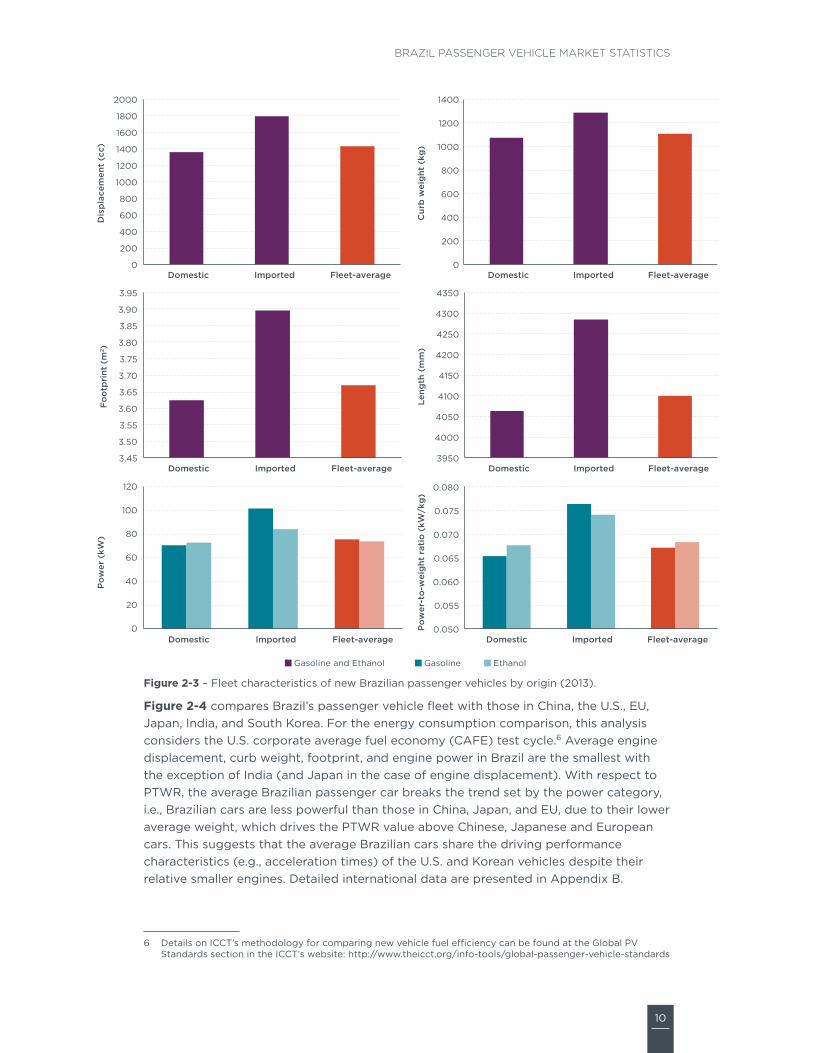
10
Brazil Passenger Vehicle Market statistics
Gasoline Ethanol
0
200
400
600
800
1000
1200
1400
1600
1800
2000
Domestic Imported Fleet-average
Dis
pla
cem
ent
(cc)
0
200
400
600
800
1000
1200
1400
Domestic Imported Fleet-average
Cur
b w
eig
ht (
kg)
345
350
355
360
365
370
375
380
385
390
395
Domestic Imported Fleet-average
Fo
otp
rint
(m
2 )
3950
4000
4050
4100
4150
4200
4250
4300
4350
Domestic Imported Fleet-average
Leng
th (
mm
)
0
20
40
60
80
100
120
Domestic Imported Fleet-average
Po
wer
(kW
)
0050
0055
0060
0065
0070
0075
0080
Domestic Imported Fleet-average
Po
wer
-to
-wei
ght
rat
io (
kWk
g)
Gasoline and Ethanol
Figure 2‑3 ndash Fleet characteristics of new Brazilian passenger vehicles by origin (2013)
Figure 2‑4 compares Brazilrsquos passenger vehicle fleet with those in china the us eu japan india and south Korea For the energy consumption comparison this analysis considers the us corporate average fuel economy (caFe) test cycle6 average engine displacement curb weight footprint and engine power in Brazil are the smallest with the exception of india (and japan in the case of engine displacement) With respect to PtWr the average Brazilian passenger car breaks the trend set by the power category ie Brazilian cars are less powerful than those in china japan and eu due to their lower average weight which drives the PtWr value above chinese japanese and european cars this suggests that the average Brazilian cars share the driving performance characteristics (eg acceleration times) of the us and Korean vehicles despite their relative smaller engines Detailed international data are presented in appendix B
6 Details on icctrsquos methodology for comparing new vehicle fuel efficiency can be found at the global PV standards section in the icctrsquos website httpwwwtheicctorginfo-toolsglobal-passenger-vehicle-standards
11
ICCT white paper
Despite having the smallest lightest and least powerful vehicles on average (with the exception of india) Brazilrsquos average energy consumption ranks fourth amongst the markets analyzed in this study the japanese fleet had the lowest energy consumption given the small and light vehicle characteristics of japanese cars and their relatively higher adoption of efficiency technologies (eg hybrids) followed by the eu (medium sizeweight fleet with high technology penetration) and india (smaller and lighter fleet overall) the us has the highest energy consumption on average due to the fleetrsquos larger size weight and power requirements china and south Korea trail the us as the most energy-consuming fleet and these countries have fleets with large and heavy vehicles but relatively lower penetration of efficiency technologies a detailed evaluation of energy consumption in Brazil and other markets is presented in chapter 4
0
500
1000
1500
2000
2500
3000
US S Korea EU China Brazil Japan India
Dis
pla
cem
ent
(cc)
0
200
400
600
800
1000
1200
1400
1600
1800
US S Korea EU China Japan Brazil India
Cur
b w
eig
ht (
kg)
000
050
100
150
200
250
300
350
400
450
US S Korea EU China Japan Brazil India
Fo
otp
rint
(m
2)
0
20
40
60
80
100
120
140
160
US S Korea EU China Japan Brazil India
Po
wer
(kW
)
00000
00100
00200
00300
00400
00500
00600
00700
00800
00900
01000
US S Korea Brazil China Japan EU India
Po
wer
-to
-wei
ght
rat
io (
kWk
g)
100
120
140
160
180
200
220
240
260
US China S Korea Brazil India Japan EU
Ene
rgy
cons
ump
tio
n ndash
US
CA
FE
(M
Jkm
)
Figure 2‑4 ndash international comparison of key new passenger vehicle characteristics
12
Brazil Passenger Vehicle Market statistics
3 vEhiCLE TEChNOLOGy ADOpTiON
this chapter provides an overview of current technology adoption including fuel engine and transmission technologies that affect vehicle energy consumption the type and complexity of technologies vary across vehicle segments to a large extent this is a function of vehicle size and weight and its intended performance and ultimately cost Fleet-average parameters presented in Table 3‑1 correspond to sales-weighted fleet-average values this chapter is divided by technology type with supporting information in appendix c an international comparison for each technology is also presented in this chapter the data for this technology adoption analysis came from a diversity of sources listed in appendix D also note that for comparisons at the international level it was required to use information from different years the most recent according to data availability
Table 3‑1 ndash technology adoption in new Brazilian passenger vehicles
Year 2012 2013
Fuel type
Flex 914 936
Gasoline 82 59
hybrid 0004 0014
Diesel 04 049
No of cylinders
Three 03 25
Four 986 966
Five 00 00
Six 09 08
Eight or more 01 01
Transmission
Manual 870 833
automatic 112 147
CVT 14 15
DCT 04 05
No of gear ratios
Four or fewer 61 59
Five 849 831
Six 84 98
Seven 03 07
Eight or more 02 05
Drivetrain
FwD 950 944
RwD 27 29
4wD and awD 23 27
No of valves per cylinder
Two 664 596
Multi valve 336 404
Valve camshaft configuration
Single overhead camshaft 696 630
Dual overhead camshaft 176 245
Valve actuation
Fixed 822 783
VVT 124 159
VVT+VVL 54 58
Fuel systems for gasoline vehicles
Multi‑point fuel injection 982 976
Gasoline direct injection 18 24
air induction systems for gasoline vehicles
Naturally aspirated 984 973
Supercharger turbocharger or twin‑turbo 16 27
13
ICCT white paper
FUEL TYpEFlex-fuel vehicles (FFVs) are designed to run on gasoline (e22) ethanol (e100) or any combination of both fuels except for a few engine and fuel system modifications FFVs are identical to gasoline-only models7 FFVs experience no loss in performance when operating on e100 however since ethanol contains less energy per volume than gasoline FFVs typically get about 25 fewer kilometers per liter when fuelled with e100
Flex-fuel is the dominant technology across all vehicle segments with the exception of sports cars off-road vehicles and minivans (Figure 3‑1) all top 10 manufacturers produce primarily flex-fuel engines and those manufacturers with a larger share of gasoline and diesel engines typically import most of their vehicles (Figure 3‑2) the predominance of FFVs responsible for almost 94 of vehicle sales in 2013 is unique to Brazil (Figure 3‑3)
hybrid-gasoline vehicles achieve reduced fuel consumption by incorporating in the drivetrain a battery and an electric motor in addition to an internal combustion (ic) engine this technology permits the ic engine to shut down when the vehicle is decelerating and is stopped braking energy to be recovered and the ic engine to be downsized and operated at more efficient operating points Depending on the level of complexity hybrid systems can achieve 15 to 35 reductions in fuel consumption with respect to similar-sized vehicles
Despite having very limited penetration sales of new hybrid vehicles have increased three-fold from 131 units in 2012 to 432 in 2013 primarily in the medium and sports segments two manufacturers sell the most gasoline hybrid models (not flex-fuel) in Brazil including the toyota Prius and the Ford Fusion hybrid
Diesel engines offer 20 to 25 reduction in fuel consumption over traditional gasoline multi-point fuel injection (MPFi) engines due to higher compression ratios reduced pumping losses and 12 higher energy content per liter of fuel the challenge for further commercialization is twofold the complexity and additional cost of advanced exhaust after-treatment technologies that reduce emissions of particulate matter and oxides of nitrogen to levels comparable to those of gasoline and FFV engines
sales of diesel passenger vehicles are not allowed in Brazil with the exception of vehicles with some off-road characteristics Despite having a small penetration (around 05) sales of diesel passenger vehicles increased by 16 in 2013 toyota sells the most diesel passenger vehicles followed by Mitsubishi land rover gM and Mercedes-Benz the light-duty diesel market in Brazil is equivalent to the us and china in terms of market penetration and much below the penetration in europe and south Korea although air quality concerns in europe might trigger lower sales of diesel vehicles in coming years
7 Most of the modifications with respect to a gasoline-only vehicle (e00) include changes to fuel systemrsquos materials that are compatible with the oxygen content of ethanol blends and changes to air and fuel ratio management systems (mainly software based)
14
Brazil Passenger Vehicle Market statistics
0
10
20
30
40
50
60
70
80
90
100
Subco
mpac
t
Compac
t
Medium
Larg
eSport
O-Road SUV
Miniva
nTo
tal
Mar
ket
shar
e
Diesel Hybrid Gasoline Flex
Figure 3‑1 ndash Fuel type by segment
0102030405060708090
100
Fiat GM
Volkswag
enFord
Renau
lt
Hyund
ai
Honda
Toyo
taPSA
Nissan
Mitsub
ishi
KIAJA
CBMW
Land
Rove
r
Merce
des-B
enz
Chery
Audi
Suzuk
iJe
epTo
tal
Tech
nolo
gy
shar
e
Diesel Hybrid Gasoline Flex
Figure 3‑2 ndash Fuel type by manufacturer
0
10
20
30
40
50
60
70
80
90
100
China2010
Korea2011
EU-272013
US2013
Japan2011
India2012
Brazil2013
Tech
nolo
gy
shar
e
Diesel Hybrid Gasoline CNGLPGFlex
Figure 3‑3 ndash Fuel type international comparison
15
ICCT white paper
NUMBER OF CYLiNDERSacross all vehicle markets 4-cylinder engines are the most common design in automobile engines with displacements below 25 liters this engine configuration presents the right balance between complexity and performance for the target vehicle segments (small to mid-size sedans suVs and some off-road vehicles) engines with six and more cylinders are designed to provide a smoother vehicle driving experience with lower vibration and noise than 4-cylinder engines can provide and with higher power output this better overall performance comes at a higher cost driving their widespread use in large and luxury vehicles and heavier suVs and off-road vehicles
the need to attain better energy consumption has resulted in a recent wave of 3-cylinder engines from a handful of manufacturers in vehicles that typically used 4-cylinder engines achieving similar or better performance this practice is known as engine downsizing Downsizing can also be applied to larger engines from V-8s to V-6s and from V-6s to i-4s in most cases engine downsizing is accompanied with turbocharging and changes to the fuel delivery system
Four-cylinder engines dominate the passenger vehicle market in Brazil and are sold in more than 90 of new vehicles among all segments except the sports off-road and minivan segments (Figure 3‑4) Despite its predominance sales of 4-cylinder engines fell from over 307 to 293 million units between 2012 and 2013 equivalent to a 4 reduction 4-cylinder vehicles represent the majority of sales among the 20 top manufacturers except for hyundai and jeep (Figure 3‑5) although 4-cylinder engines represent the dominant technology in all countries analyzed Brazil still has the largest market share (Figure 3‑6)
the most significant shift in market preferences in Brazil occurred with 3-cylinder engines this technology is becoming more popular with almost eight times more vehicles sold in 2013 compared to 2012 reaching almost 75000 units in 2013 almost all 3-cylinder engines are being sold as compact vehicles instead of the smaller subcompact segment hyundai is the technology leader in sales of 3-cylinder high-efficiency Kappa engines8 japan and india have relatively high penetration of 3-cylinder engine technology in india the popularity of 2- and 3-cylinder vehicles is primarily driven by lower price tags (lt usD $8000)
six-cylinder engines are third in sales after 4- and 3-cylinder engines with absolute numbers close to 25000 units sold in 2013 its market share reduced by 13 with respect to 2012 six-plus cylinder engines are being sold mostly in the sports off-road and minivan segments Manufacturers that cater to the most expensive models and segments dominate the market of vehicles with six-plus cylinder engines such as land rover BMW and Mercedes-Benz the penetration of 6-plus-cylinder engines in Brazil is very low compared to other countries
Five-cylinder engines are not very common in Brazil or other countries and are losing market with respect to 2012 sales by 56 Volkswagen audi and Volvo are the only manufacturers that offered 5-cylinder engines in Brazil in 2013
8 hyundairsquos 3-cylinder Kappa engine httpworldwidehyundaicomWWshowroomcarshB20PiPindexhtml
16
Brazil Passenger Vehicle Market statistics
0
10
20
30
40
50
60
70
80
90
100
Subco
mpac
t
Compac
t
Medium
Larg
eSport
O-Road SUV
Miniva
nTo
tal
Tech
nolo
gy
shar
e
8+ 6 5 4 3
Figure 3‑4 ndash number of cylinders by segment
0102030405060708090
100
Fiat GM
Volkswag
enFord
Renau
lt
Hyund
ai
Honda
Toyo
taPSA
Nissan
Mitsub
ishi
KIAJA
CBMW
Land
Rove
r
Merce
des-B
enz
Chery
Audi
Suzuk
iJe
epTo
tal
Tech
nolo
gy
shar
e
8+ 6 5 4 3
Figure 3‑5 ndash number of cylinders by manufacturer
0
10
20
30
40
50
60
70
80
90
100
China2010
Korea2011
EU-272013
US2013
Japan2011
India2012
Brazil2013
Tec
hno
log
y sh
are
8+ 6 5 4 3 2
Figure 3‑6 ndash number of cylinders international comparison
17
ICCT white paper
TRaNSMiSSiONtransmission technologies can reduce energy consumption in two ways First by allowing engine operation on a more efficient region of the engine map and second by reducing the mechanical losses within transmissions traditionally manual transmissions have offered better energy consumption than traditional automatic transmissions (with 4 or 5 speeds) due to lower friction losses however new generation of automatic transmissions with higher number of gears lower friction better materials and computer-controlled shift points have not just closed the gap between manual and automatic transmission performance but even exceed manual transmission performance
new technologies such as dual-clutch transmissions (Dcts) and continually variable transmissions (cVts) are gaining market share due to the need for lower vehicle energy consumption Dcts can be defined as manual transmissions with electro-hydraulically operated dual-clutch systems allowing for faster shifting times and selective automatic or ldquomanualrdquo operation as opposed to manual automatic and Dct transmissions which have a discrete number of gear ratios cVts have a theoretically infinite choice of ratios between fixed limits which allows engines to be further optimized for minimizing energy consumption cVt technology has been used in lower-horsepower vehicles because of maximum-torque limitations with the most common metal-belt design (nas 2011) these advanced transmission technologies offer significant benefits in energy consumption compared to traditional manual or automatic technologies according to the us national academy of sciences a 6-speed Dct provides 6 to 9 lower energy consumption than a 4-speed automatic transmission note that a traditional 6-speed automatic transmission provides an estimated 3 to 5 benefit the energy consumption benefit of cVt depends on the application and is estimated to be 1 to 7 (nas 2011)
although vehicle sales with manual transmissions are predominant in Brazil the penetration of automatic transmissions cVts and Dcts is increasing resulting in a market share loss for manual transmissions of about 6 between 2012 and 2013 (Table 3‑1) With the exception of sports and off-road segments manual transmission technology has the largest market share in all segments but it tends to become less predominant as vehicles grow in size and comfort level (Figure 3‑7) the top five manufacturers sell most of their vehicles with manual transmissions but their market share is somewhat smaller for other high-selling manufacturers that cater to a more affluent market (Figures 3‑8)
automatic transmissions are becoming increasingly popular in Brazil experiencing an increase of 28 in sales between 2012 and 2013 automatic transmissions dominate the sports and off-road segments Kia BMW land rover Mercedes-Benz and jeep adopt this type of transmission technology for most of their vehicle sales
Dct transmissions are entering the Brazilian market mostly through the sports segment via imported models the sales of Dct equipped vehicles increased in 2013 by 22 with respect to 2012 Dct technology is being offered mainly by manufacturers that sell sports vehicles such as audi in more than 67 of their vehicles and Mercedes-Benz in more than 15 of their vehicles the global leader in Dct adoption is europe followed by the us (Figure 3‑9)
cVt technology market is still relatively small being sold by small volume manufacturers like jeep audi and Mitsubishi with more than 25 of new vehicle sales each nissan renault honda and toyota also sell vehicles with cVt technology cVt penetration in Brazil is similar to europersquos cVt is the leading transmission technology in japan with more than 65 of the market
18
Brazil Passenger Vehicle Market statistics
0
10
20
30
40
50
60
70
80
90
100
Subco
mpac
t
Compac
t
Medium
Larg
eSport
O-Road SUV
Miniva
nTo
tal
Tech
nolo
gy
shar
e
DCT CVT Automatic Manual
Figure 3‑7 ndash transmission by segment
0
10
20
30
40
50
60
70
80
90
100
Fiat GM
Volkswag
enFord
Renau
lt
Hyund
ai
Honda
Toyo
taPSA
Nissan
Mitsub
ishi
KIAJA
CBMW
Land
Rove
r
Merce
des-B
enz
Chery
Audi
Suzuk
iJe
epTo
tal
Tech
nolo
gy
shar
e
DCT CVT Automatic Manual
Figure 3‑8 ndash transmission by manufacturer
0
10
20
30
40
50
60
70
80
90
100
China2010
Korea2011
EU-272013
US2013
Japan2011
India2012
Brazil2013
Tech
nolo
gy
shar
e
DCT CVT Automatic Manual
Figure 3‑9 ndash transmission international comparison
19
ICCT white paper
NUMBER OF GEaR RaTiOS as mentioned in the previous section increasing the number of gear ratios (whether manual automatic dual-clutch or continuously variable) allows the engine to be operated in the best efficiency region resulting in energy consumption benefits compared to an automatic four-gear ratio transmission (also known as 4-speed transmission) higher ratio automatic transmissions could reduce energy consumption from 2 to 3 (for a five-gear ratio) to 6 to 8 (for an eight-gear ratio) (ePanhtsa 2010)
Four-gear ratio transmissions are losing market share in Brazil by more than 5 between 2012 and 2013 (Table 3‑1) these transmissions are particularly high sellers in the suV and minivan segments which suggest that some models in these more expensive segments are being sold with outdated technologies (Figure 3‑10) Most manufacturers are phasing out this type of transmission (Figure 3‑11) although jeep suzuki and toyota are lagging behind other manufacturers the four-gear ratio transmission technology has been losing market share in most countries even in india where smaller and inexpensive cars dominate the market 4-speed transmissions have the smallest market share (Figure 3‑12)
Five- and six-gear ratio transmissions were predominant in the Brazilian market in 2013 Five-gear ratio transmissions are dominant in all segments except for the off-road and sports segments which have adopted six-gear ratio transmissions in most sales the significant market share of five- and six-gear ratio transmissions is similar to most countries although the us europe and south Korea show higher shares of six and more gear ratios
seven- and eight-gear ratio transmissions which are considered emerging technologies have experienced an increase in sales in Brazil with over twice as many sales in 2013 compared to 2012 seven- and eight-gear ratio transmissions are popular among the large sports and off-road segments all of which are imported models luxury manufacturers such as Mercedes-Benz and audi are selling the most seven-gear vehicles as a share of their sales Volkswagen and toyota are also selling similar numbers of seven-gear ratio vehicles although for Volkswagen and toyota it represented less than 3 of their brand sales BMW and land rover are the leaders in eight-gear ratio vehicles
20
Brazil Passenger Vehicle Market statistics
0
10
20
30
40
50
60
70
80
90
100
Subco
mpac
t
Compac
t
Medium
Larg
eSport
O-Road
SUV
Miniva
nTo
tal
Tech
nolo
gy
shar
e
8 7 6 5 4
Figure 3‑10 ndash number of gear ratios by segment
0
10
20
30
40
50
60
70
80
90
100
Fiat GM
Volkswag
enFord
Renau
lt
Hyund
ai
Honda
Toyo
taPSA
Nissan
Mitsub
ishi
KIAJA
CBMW
Land
Rove
r
Merce
des-B
enz
Chery
Audi
Suzuk
iJe
epTo
tal
Tech
nolo
gy
shar
e
8 7 6 5 4
Figure 3‑11 ndash number of gear ratios by manufacturer
0
10
20
30
40
50
60
70
80
90
100
Tech
nolo
gy
shar
e
Six or more Five Four or fewer
China2010
Korea2011
EU-272013
US2013
India2012
Brazil2013
Figure 3‑12 ndash number of gear ratios international comparison
21
ICCT white paper
DRiVETRaiNDrivetrain technology includes front-wheel drive (FWD) rear-wheel drive (rWD) and all-wheel drive (aWD) vehicles For the same vehicle size FWD vehicles provide more interior space and better energy consumption than rWDs due to lower weight as it avoids the added weight of and space for the driveshaft and differential that rWD requires Because the weight of the engine and transmission is located close to the wheels FWD vehicles have better traction than rWDs rWDs however show better handling as the weight distribution between the front and rear wheels is more uniform and the tasks of turning and acceleration are split between the front and rear wheels also directing large amounts of power through the front wheels can create ldquotorque steerrdquo thus rWD is the adequate technology for the sports segment aWD drivetrains are intended for specific driving applications that imply loss of traction such as off-road terrains snow or towing
FWD vehicles dominate all segments of the Brazilian passenger car market (Table 3‑1) with the exception of the off-road segment (Figure 3‑13) among the 20 largest manufacturer sellers most except for BMW land rover Mercedes-Benz and suzuki offer FWD technology (Figure 3‑14) Brazil has the highest market share of FWD vehicles of all countries analyzed (944) although FWD has at least 50 market share in all seven countries (Figure 3‑15)
aWD market share increased by 15 between 2012 and 2013 due to a tri-fold increase in the sports segment sales off-road vehicle sales with aWD also increased to more than 76000 units in 2013 amongst the largest ten manufacturers toyota is the aWD market leader followed by Ford and Volkswagen note that land rover sells only aWD vehicles in Brazil among non-luxury manufacturers Mitsubishi and suzuki are selling more than 50 of their vehicles with aWD technology
rWD technology is offered mostly in large and sports vehicles and in suVs among the 10 largest manufacturers rWD is offered mainly by gM and toyota while an extended examination of the 20 largest manufacturers by sales show that aWD and rWD is focused among the more expensive brands (Figure 3‑14) Mercedes-Benz and BMW sell close to 90 of their vehicles with rWD technology traditionally associated with engine performance and responsiveness
22
Brazil Passenger Vehicle Market statistics
0
10
20
30
40
50
60
70
80
90
100
Subco
mpac
t
Compac
t
Medium
Larg
eSport
O-Road SUV
Miniva
nTo
tal
Tehn
olo
gy
shar
e
AWD RWD FWD
Figure 3‑13 ndash Drivetrain by segment
0
10
20
30
40
50
60
70
80
90
100
Fiat GM
Volkswag
enFord
Renau
lt
Hyund
ai
Honda
Toyo
taPSA
Nissan
Mitsub
ishi
KIAJA
CBMW
Land
Rove
r
Merce
des-B
enz
Chery
Audi
Suzuk
iJe
epTo
tal
Tech
nolo
gy
shar
e
AWD RWD FWD
Figure 3‑14 ndash Drivetrain by manufacturer
0
10
20
30
40
50
60
70
80
90
100
China2010
Korea2011
EU-272013
US2013
Japan2011
India2012
Brazil2013
Tech
nolo
gy
shar
e
AWD RWD FWD
Figure 3‑15 ndash Drivetrain international comparison
23
ICCT white paper
VaLVE CaMShaFT CONFiGURaTiON (DOhC VS SOhC)the engine camshaft governs the timing duration and lift of valve operation controlling the intake of air and the exhaust of combustion gases this report focuses on single overhead camshafts (sohc) and dual overhead camshafts (Dohc) as these configurations have almost completely replaced the older overhead valve configuration (ohV) sohc design places a single camshaft above the cylinder head that governs all the valves intake and exhaust in the case of sohc V-engines there is one single camshaft per head Dohc designs use separate camshafts for intake valves and exhaust valves Dohc engines achieve increased airflow at high-engine speeds improve volumetric efficiency and reduce the valvetrainrsquos moving mass such engines typically develop higher power at high-engine speeds the us environmental Protection agency (ePa) and national highway traffic safety administration (nhtsa) estimate the effectiveness of Dohc over sohc to be between 1 and 25 (ePanhtsa 2010)
although Dohc produce more power and provide lower fuel consumption the Brazilian fleet is still mostly composed of sohcs vehicles (Table 3‑1) sohc technology is predominant among the subcompact compact and medium segments (Figure 3‑16) among manufacturers sohc technology is predominant among the five largest least expensive brands (Figure 3‑17) sales of vehicles with more advanced Dohc technology grew in 2013 by almost 36 with respect to 2012 albeit from a relatively smaller base this increase was experienced in all vehicle segments but in different magnitudes
although global data on this technology are scarce Figure 3‑18 indicates that most countries are moving away from sohc with Brazil being the only country analyzed where sohc is still predominant no data were available for the us or europe
24
Brazil Passenger Vehicle Market statistics
0
10
20
30
40
50
60
70
80
90
100
Subco
mpac
t
Compac
t
Medium
Larg
eSport
O-Road SUV
Miniva
nTo
tal
Tech
nolo
gy
shar
e
nd DOHC SOHC
Figure 3‑16 ndash Valve camshaft configuration by segment (nd no data)
0
10
20
30
40
50
60
70
80
90
100
Fiat GM
Volkswag
enFord
Renau
lt
Hyund
ai
Honda
Toyo
taPSA
Nissan
Mitsub
ishi
KIAJA
CBMW
Land
Rove
r
Merce
des-B
enz
Chery
Audi
Suzuk
iJe
epTo
tal
Tech
nolo
gy
shar
e
nd DOHC SOHC
Figure 3‑17 ndash Valve camshaft configuration by manufacturer (nd no data)
0
10
20
30
40
50
60
70
80
90
100
China2010
Korea2011
Japan2011
India2012
Brazil2013
Tech
nolo
gy
shar
e
nd OVC DOHC SOHC
Figure 3‑18 ndash Valve camshaft configuration international comparison (nd no data)
25
ICCT white paper
VaLVE aCTUaTiON improved valvetrain systems with variable valve actuation (VVa) technology either variable valve timing (VVt) or variable valve timing and lift (VVt+VVl) improves the enginersquos volumetric and thermodynamic efficiency they also enable further engine improvements such as internal exhaust gas recirculation and cylinder deactivation VVt alters the timing of the intake valve exhaust valve or both primarily to reduce pumping losses increase specific power and control residual exhaust gases VVl increases efficiency by optimizing airflow over a broader range of engine operation which reduces pumping losses and increases specific power VVl is accomplished by controlled switching between two or more cam profile lobe heights the most advanced technology VVt+VVl yields a wide range of performance optimization and volumetric efficiency including enabling the engine to be valve-throttled (no need for intake throttle) VVt provides energy consumption gains of 3 to 5 while the more flexible and complex VVt+VVl system can reach 4 to 8 (ePa amp nhtsa 2010)
VVa technology either VVt or VVt+VVl are emerging technologies in Brazil where most vehicles still have fixed-valve timing designs (Table 3‑1) Fixed technology is predominant among the smaller vehicle segments as well as suVs and minivans (Figure 3‑19) the five largest manufacturers sold more than 90 of their vehicles with fixed-valve technology in 2013 (Figure 3‑20) the international comparison indicates that only Brazil and india have not yet adopted VVa technologies for most of their light-duty fleet (Figure 3‑21)
VVt and VVt+VVl are being adopted across all segments including the subcompact segment but tend to be more predominant in high-end manufacturers a closer examination by manufacturer shows that most are offering some vehicles with either one of the VVa systems while honda and hyundai offer this technology in almost all vehicles (Figure 3‑20) honda is the technology leader in variable valve actuation with the adoption in the early 1990s of the Vtec system (Valve timing electronic control) VVt technologyrsquos market share grew by about 25 in 2013 primarily due to hyundairsquos sales from 80000 units in 2012 to almost 200000 units in 2013 hyundai offered the continuously variable valve technology (cVVt) in the large majority of vehicle sold in 2013 the sports segment is the one where VVt dominates the market Mitsubishi BMW and audi are also selling a large share of their vehicles with the VVt+VVl technology
26
Brazil Passenger Vehicle Market statistics
0
10
20
30
40
50
60
70
80
90
100
Subco
mpac
t
Compac
t
Medium
Larg
eSport
O-Road SUV
Miniva
nTo
tal
Tech
nolo
gy
shar
e
VVT+VVL VVT Fixed
Figure 3‑19 ndash Valve actuation by segment
0
10
20
30
40
50
60
70
80
90
100
Fiat GM
Volkswag
enFord
Renau
lt
Hyund
ai
Honda
Toyo
taPSA
Nissan
Mitsub
ishi
KIAJA
CBMW
Land
Rove
r
Merce
des-B
enz
Chery
Audi
Suzuk
iJe
epTo
tal
Tech
nolo
gy
shar
e
VVT+VVL VVT Fixed
Figure 3‑20 ndash Valve actuation by manufacturer
VVT+VVL VVT Fixed
0
10
20
30
40
50
60
70
80
90
100
China2010
Korea2011
US2013
Japan2011
India2012
Brazil2013
Tech
nolo
gy
shar
e
Figure 3‑21 ndash Valve actuation international comparison
27
ICCT white paper
FUEL SYSTEMS FOR GaSOLiNE VEhiCLESVehicle fuel systems describe the technology required to deliver fuel into the engine combustion chamber this section examines two gasolineflex technologies namely multi-point fuel injection (MPFi) and gasoline direct injection (gDi) MPFi is now the most common fuel-delivery system for gasoline engines used in passenger vehicles worldwide in sequential MPFi engines fuel is injected into the air stream next to the intake valve port while the intake valve is open to draw the air-fuel mixture into the cylinder some of the fuel is vaporized on the surface of the hot intake valve expanding and thus reduces the volumetric efficiency on gDi engines fuel is injected at high pressure directly into the combustion chamber improving volumetric efficiency and providing cooling of the airfuel charge within the cylinder which allows for higher compression ratios and increased thermodynamic efficiency gDi technology alone offers benefits of 2 to 5 with respect to MPFi engines but bigger benefits rely on the synergy between gDi turbocharging and downsizing which can reach 12 to 15 energy consumption reduction with respect to a MPFi naturally aspirated engine (ePa 2012)
Table 3‑1 illustrates that MPFi is still the most common fuel injection technology for gasolineflex vehicles in Brazil which is reflected in its dominant share across most segments except for sports and off-road vehicles in Brazil gDi has found a niche market in the sports and off-road segments with more than 90 of sport vehicles fitted with gDi technology (Figure 3‑22) Within the overall gasoline market the gDi technology is still an emerging technology representing just 24 of new sales gDirsquos market share increased by 31 in 2013 with all but 4000 units being imported among the 10 largest manufacturers the adoption of gDi is extremely low below 5 for Volkswagen Ford hyundai and Psa (Figure 3‑23) high-end european brands (audi land rover Mercedes-Benz and BMW) are the technology leaders in terms of gDi adoption rates echoing the trend of turbocharging technology sales Volkswagen vehicles with gDi systems account for less than 35 of their sales in 2013 but their absolute numbers (around 19000 vehicles) place the company as one of the leaders in gDi technology in the Brazilian market
From a global market perspective the penetration of gDi technology in Brazil is low compared to all other markets in Figure 3‑24 except for india and japan it should be noted that the later has the largest share of hybrid vehicles around the globe
28
Brazil Passenger Vehicle Market statistics
0
10
20
30
40
50
60
70
80
90
100
Compac
t
Subco
mpac
t
Medium
Larg
eSport
O-Road SUV
Miniva
nTo
tal
Tech
nolo
gy
shar
e
GDI MPFI
Figure 3‑22 ndash gasolineflex fuel system by segment
GDI MPFI
0102030405060708090
100
Fiat GM
Volkswag
enFord
Renau
lt
Hyund
ai
Honda
Toyo
taPSA
Nissan
Mitsub
ishi
KIAJA
CBMW
Land
Rove
r
Merce
des-B
enz
Chery
Audi
Suzuk
iJe
epTo
tal
Tech
nolo
gy
shar
e
Figure 3‑23 ndash gasolineflex fuel system by manufacturer
GDI MPFI
0
10
20
30
40
50
60
70
80
90
100
China2010
Korea2011
EU-272013
US2013
Japan2011
India2012
Brazil2013
Tech
nolo
gy
shar
e (n
on-
die
sel)
Figure 3‑24 ndash gasolineflex fuel system international comparison
29
ICCT white paper
TURBOChaRGiNGengine power is primarily limited by the rate at which the engine is able to draw air into the combustion chamber turbocharging and supercharging are two methods to increase the amount of air drawn into the engine above the level of what is possible with the naturally aspirated process (through the expansion of the cylinders) By increasing the amount of air into the engine the amount of fuel can be proportionally increased resulting in increased power output level and with it the ability to reduce engine displacement while maintaining performance the combination of turbocharging and downsizing in spark ignited (gasoline and flex-fuel) vehicles can provide energy consumption improvements between 2 to 6 with respect to a direct-injected gDi engine (ePa amp nhtsa 2010) turbocharging technology is the cornerstone for achieving better energy consumption in vehicles as the basis for downsizing and reducing the engine weight while keeping the same or better vehicle performance (ie acceleration or time to reach certain speed) although turbochargers are used in diesel and gasolineflex vehicles the analysis in this report focuses on turbocharging for spark-ignited gasolineflex vehicles only
turbocharging is one of the most important emerging technologies in Brazil where most vehicles are still naturally aspirated (na) (Table 3‑1) turbocharging technology has increased the market share significantly between 2012 and 2013 by more than 65 albeit from a small base (from about 49000 to 81000 vehicles)
Most vehicles with turbocharging are sold in the sports and off-road segments as this technology also produces superior engine power output (Figure 3‑25) among the 10 largest manufacturers turbocharging is still below 10 of their sales (Figure 3‑26) Volkswagen and Ford despite having small relative sales of vehicles with turbocharging (less than 35) are the manufacturers with the highest total sales of vehicles with turbocharging audi land rover Mercedes-Benz and BMW are the technology leaders with more than 90 of vehicle sales in 2013
the penetration of turbo and supercharging technologies in Brazil is lower than in other countries with a larger gasoline fleet such as the us china and japan (Figure 3‑27) in Brazil 95 of diesel passenger vehicle sales have turbocharging technology
30
Brazil Passenger Vehicle Market statistics
0
10
20
30
40
50
60
70
80
90
100
Compac
t
Subco
mpac
t
Medium
Larg
eSport
O-Road SUV
Miniva
nTo
tal
Tech
nolo
gy
shar
e (n
on-
Die
sel)
Turbo NA
Figure 3‑25 ndash turbocharging for gasolineflex fuel vehicles by segment (NA naturally aspirated)
0102030405060708090
100
Fiat GM
Volkswag
enFord
Renau
lt
Hyund
ai
Honda
Toyo
taPSA
Nissan
Mitsub
ishiKIA
JACBMW
Land
Rove
r
Merce
des-B
enz
Chery
Audi
Suzuk
iJe
epTo
tal
Tech
nolo
gy
shar
e (n
on-
Die
sel)
Turbo NA
Figure 3‑26 ndash turbocharging for gasolineflex fuel vehicles by manufacturer (NA naturally aspirated)
0
10
20
30
40
50
60
70
80
90
100
China2010
Korea2011
EU-272013
US2013
Japan2011
India2012
Brazil2013
Tech
nolo
gy
shar
e (n
on-
die
sel)
Turbo NA
Figure 3‑27 ndash turbocharging for gasolineflex fuel vehicles international comparison (NA naturally aspirated)
31
ICCT white paper
4 vEhiCLE ENErGy CONSuMpTiON
this section analyzes the Brazilian new passenger vehicle energy consumption in 2013 although other metrics are more common (see box) vehicle energy consumption is presented in megajoules per kilometer (Mjkm) for consistency with Brazilrsquos inovar-auto policy in 2012 Brazilrsquos Ministry of Development industry and Foreign trade (MDic) adopted the inovar-auto policy with the aim of fostering industrial competitiveness through technology investments the policy includes a target for corporate average energy consumption (in Mjkm with vehicle curb weight as the attribute parameter) for vehicles sold in 2017
in the us canada Mexico and saudi arabia fleet-average fuel economy standards are defined as a function of vehicle footprint in the eu china japan south Korea and india vehicle weight is the attribute for the calculation of fleet-average targets in Brazil inovar-auto has defined its fiscal targets for vehicle energy consumption measured in megajoules per kilometer (Mjkm) as a function of vehicle weight
VEhiCLE ENERGY MEaSUREMENT UNiTS
Many metrics can be used to describe the amount of fuel energy or emissions generated by unit of distance traveled
Fuel economy measures distance traveled per unit of fuel consumed in Brazil kilometers per liter (kml) is the most common metric to describe vehicle efficiency but other units are used in different countries such as miles per gallon (mpg) in the us
Fuel consumption is the reciprocal of fuel economy and measures fuel consumed per distance traveled it is usually expressed in liters per 100 kilometers (l100 km) and it is used in europe for example
GhGCO2 emissions measures ghg or co2 emissions per distance traveled expressed as grams of pollutant per kilometer or mile
Energy consumption (EC) measures the energy consumed per distance traveled for example in megajoules per kilometer Despite being a less common metric it is sometimes preferred for being a fuel-neutral metric across different types of fuel and vehicle technologies Vehicle energy consumption in Mjkm is the metric used in Brazilrsquos inovar-auto policy to quantify the corporate average energy consumption target for each manufacturer Values for energy consumption in Brazilian spark-ignited vehicles are provided for e22 since that is the fuel mixture used in vehicle tests
Vehicle energy consumption in this report is calculated from co2 emissions data in the Brazilian institute of environment and renewable natural resources (iBaMa) nota Verde program (iBaMa 2014) which reports official emissions data from homologation tests Data are limited to passenger cars sold by the top 10 manufacturers with light commercial vehicles being excluded appendix D presents a description of data sources
32
Brazil Passenger Vehicle Market statistics
and calculation methodologies as well as a discussion of vehicle energy consumption data quality and completeness in Brazil
not surprisingly vehicle energy consumption increases with vehicle footprint and engine rated power the two parameters that define vehicle segments in Brazil (Figure 4‑1) subcompact and compact vehicles which accounted for about 45 of new sales in 2013 have average energy consumption below the fleet average while medium-sized vehicles which hold the largest market share (388) have energy consumption just above the fleet average larger more powerful vehicles consume more energy than the fleet average but have a considerably smaller market share (combined share of 163) Data availability for these segments is not as extensive as the data available for the subcompact compact and medium segments which could affect the relative rankings of each segment
Ene
rgy
cons
ump
tio
n (M
Jkm
)
Subco
mpac
t
Compac
t
Medium
Larg
e
O-road SUV
4000
200000
400000
600000
850000
35
30
25
20
15
10
05
0
Sales
Total 202
Figure 4‑1 ndash new vehicle sales-weighted average energy consumption by segment (2013)
33
ICCT white paper
Figures 4‑2 and 4‑3 illustrate new vehicle energy consumption for multiple weight and footprint bins For each weight bin (in 100 kg increments) and footprint bin (in 01 m2 increments) sales-weighted averages of energy consumption for each vehicle version are presented (dashes) generating energy consumption ranges for each bin (cream areas) Vehicle sales by bin are presented for reference in the lower charts
the strong correlation between vehicle energy consumption and weight follows from the strong physical relationship between the weight of the vehicle and the energy required to accelerate it and overcome resistances9 (Figure 4‑2) Data dispersion within each bin suggests that energy consumption varies due to other vehicle characteristics that affect vehicle aerodynamics and rolling resistance as well as the adoption of technologies that affect engine and transmission efficiency (eg friction reduction technologies gDi VVt)
Curb weight (kg)
SubcompactCompactMediumLargeO-roadSUV
Ene
rgy
cons
ump
tio
n (M
Jkm
)Sa
les
5
6
4
3
2
1
600k
800k
400k
200k
0k800 900 1000 1100 1200 1300 1400 1500 1600 1700 1800 1900 2000 2100
Figure 4‑2 ndash new vehicle energy consumption by vehicle weight (2013)
9 on a plain surface the sum of resistances of a vehicle is acceleration resistance + rolling resistance + aerodynamic resistance = c1 m a + c2 frr m + c3 cw a v2 with mass (m) as an integral part of both acceleration and rolling resistance which are most relevant for inner-city driving situations other factors are acceleration (a) rolling resistance of tires (frr) aerodynamic coefficient of the vehicle (cw) frontal area of vehicle (a) velocity (v) and constants (cx)
34
Brazil Passenger Vehicle Market statistics
Footprint has a reasonable correlation with energy consumption (Figure 4‑3) ie larger vehicles tend to consume more fuel than smaller vehicles however the correlation is not as strong as with vehicle weight similar to the previous figure the broad spread of energy consumption values suggests a combination of different vehicle characteristics (eg weight engine displacement rated power) and technologies (eg transmissions fuel systems) as well as the presence of suVs and off-road vehicles among the medium- and large-sized footprint values respectively
Footprint (m2)
SubcompactCompactMediumLargeO-roadSUV
Ene
rgy
cons
ump
tio
n (M
Jkm
)Sa
les
5
6
4
3
2
1
400k
500k
300k
200k
100k
0k31 32 33 34 35 36 37 38 39 40 41 42 43 44 45 46 48 49
Figure 4‑3 ndash new vehicle energy consumption by vehicle footprint (2013)
35
ICCT white paper
Figure 4‑4 illustrates sales weighted average for new vehicle energy consumption by mass for the top 10 manufacturers in Brazil in 2013 Bubble sizes are proportional to total vehicle sales Manufacturers in the lower-left quadrant produce the lightest and most efficient vehicles with hyundai presenting the best overall average energy consumption renault in the upper-left quadrant produces vehicles that are equivalent in weight but on average with higher energy consumption in the lower-right quadrant are manufacturers that produce relatively heavier vehicles but with lower energy consumption in their weight class Despite producing heavier vehicles on average than many manufacturers honda achieves lower energy consumption on average in the upper-right quadrant are manufacturers that produce on average the heavier and least efficient vehicles with Psa (citroen and Peugeot) producing the heaviest and least efficient cars on average a regression line correlating vehicle energy consumption and mass highlights the best performers (hyundai honda and nissan) average performers (Fiat Volkswagen gM and toyota) and those performing worse than average (renault Ford and Psa)
FIA
GMVW
FORREN
HYU
HON
TOY
PSA
NIS
160
170
180
190
200
210
220
230
240
250
950 1000 1050 1100 1150 1200 1250 1300 1350
Ene
rgy
cons
ump
tio
n (M
Jkm
)
Curb weight (kg)
Fleet Ave
Figure 4‑4 ndashaverage new vehicle sales-weighted energy consumption by manufacturer (2013)
36
Brazil Passenger Vehicle Market statistics
Figure 4‑5 shows fleet-average energy consumption based on certification and type approval data for new vehicles in multiple countries converted to the us caFe combined driving cycle Bubble sizes represent total sales of new passenger cars Because of data availability in different countries the country comparison is based on different calendars years for different countries 2011 for south Korea and japan 2012 for china and india and 2013 for europe the us and Brazil given annual improvements in vehicle energy consumption triggered by regulatory efficiency standards and fiscal incentives those countries with older data could be at a slight disadvantage in this comparison
With the heaviest vehicles on average the us fleet is also the most energy consuming of all countries china and south Korea have similar average energy consumption but since south Korean vehicles are heavier on average they are relatively more efficient than chinese vehicles although Brazilrsquos fleet consumes less fuel on average than those from the us china and south Korea its fleet is relatively inefficient when compared to countries with vehicles of similar weight (japan and india) the average Brazilian vehicle consumes about 34 more energy than the average vehicle in japan whose fleet has a large penetration of gasoline hybrid and advanced fuel-efficiency technologies such as three-cylinder engines VVa Dohc and 6-plus speed transmissions european vehicles are the best performing on average despite being heavier than all countries with the exception of the us and south Korea the adoption of fuel-efficiency technologies (eg Dct 6-plus-speed transmissions gDi turbocharging) contributes to europersquos better than average performance
China2012
SKorea2011
Europe2013
US2013
Japan2011
India2012
Brazil2013
Sales5 MM10 MM
14
16
18
20
22
24
26
28
1000 1100 1200 1300 1400 1500 1600 1700
Ene
rgy
cons
ump
tio
n ndash
CA
FE
(M
Jkm
)
Curb weight (kg)
Type-approval and certification energy consumption data only (does not include o-cycle or real-world driving data)
Figure 4‑5 ndash international comparison of passenger car energy consumption
Country labels indicate the dataset year
Figure 4‑6 provides a more detailed country comparison by illustrating average vehicle energy consumption by vehicle (curb) weight bin Vehicle sales in each bin are shown for reference the us is not shown due to lack of detailed model-by-model data Brazilrsquos vehicles on average have the highest energy consumption in most weight
37
ICCT white paper
bins with china being the second highest in most bins Because china has higher fuel consumption than Brazil on the 1000 bin which represents the highest share of vehicle sales fleet-average energy consumption in china is still higher than in Brazil as illustrated in the previous figure europe consistently performs best in terms of vehicle energy consumption in most weight bins with japan also performing relatively well
Curb weight (kg)
BrazilChinaEuropeIndiaJapanSouth Korea
Ene
rgy
cons
ump
tio
n C
AF
E (
MJ
km)
Sale
s
40
35
25
20
15
10
6M
8M
4M
2M
0M600 800 1000 1200 1400 1600 1800 2000 2200 2400
Figure 4‑6 ndash international comparison of average vehicle energy consumption by vehicle weight
Type-approval and certification energy consumption data only (does not include off-cycle or real-world driving data)
38
Brazil Passenger Vehicle Market statistics
Figure 4‑7 illustrates the distribution of energy consumption data in Brazil for each vehicle version by mass and segment Bubble sizes represent total sales of each version Data were limited to flex-fuel vehicles in the subcompact compact medium and large segments due to its relatively better data quality and representativeness (ie they represented over 87 of sales in 2013) While most vehicles follow a predictable trend that correlates energy consumption and vehicle mass there are a large number of versions with energy consumption substantially higher than the trend line this suggests there is substantial room for improvements in their energy consumption since there are vehicles in similar weight classes with substantially superior energy consumption performance
Sales1000050000
140
160
180
200
220
240
260
280
700 800 900 1000 1100 1200 1300 1400 1500 1600
Ene
rgy
cons
ump
tio
n (M
Jkm
)
Curb weight (kg)
Subcompact Compact Medium Large Fleet average
Figure 4‑7 ndash Distribution of new Brazilian passenger vehicle energy consumption data by vehicle weight and segment (2013)
this chapter suggests that there are potential improvements in vehicle energy consumption for the Brazilian fleet For similar vehicles in terms of weight class footprint or engine rating there is substantial dispersion in energy consumption indicating that there are vehicles performing much worse than the average across manufacturers there is also a clear trend of some manufacturers performing much better than the average while others have a lot more room for improvement the international comparison clearly shows that Brazilian vehicles perform much worse in terms of energy consumption than vehicles of similar weight suggesting a delay in the adoption of energy efficient technologies among Brazilian vehicle manufacturers
Finally a more detailed analysis of vehicle versions clearly illustrates a considerable number of vehicle versions significantly above average thus indicating potential improvements in energy consumption that would place them on par with better performing vehicles with similar characteristics
39
ICCT white paper
Deficiencies in data quality and completeness prevent more definite conclusions about vehicle energy consumption gasoline-only vehicles in particular have poor energy consumption data quality although they represent a relatively small fraction (6) of total vehicles sold in 2013 Because some vehicle segments are primarily composed of gasoline-only vehicles (eg sports minivans) this chapter excludes these segments from the analysis there are also concerns about the gap between energy consumption data reported by iBaMarsquos nota Verde and Brazilrsquos national institute of Metrology standardization and industrial Qualityrsquos (inMetro) labeling program (PBeV using its acronym in Portuguese) with the latter reporting consistently lower values of vehicle energy consumption
Finally the availability of energy consumption data was not adequate for many manufacturers beyond the top 10 sales group which prevented their inclusion in this analysis Despite the data quality and lack of completeness the energy consumption data in this chapter include data that are reasonably accurate and representative thus supporting its interpretation
40
Brazil Passenger Vehicle Market statistics
rEfErENCES
aDK automotive consultoria de Marketing (2013) relatoacuterios de volumes de vendas do mercado brasileiro para veiacuteculos de passeio e comerciais leves referentes a 2013
alves l Wilbert M (2014) reduccedilatildeo do imposto sobre Produto industrializado e a Venda de automoacuteveis Xi congresso usP iniciaccedilatildeo cientiacutefica em contabilidade
associaccedilatildeo nacional de transportes Puacuteblicos (antP 2014) estudo mostra baixo efeito do desconto no iPi de veiacuteculos sobre PiB e emprego available at httpwwwantporgbrwebsitenoticiasshowaspnpgcode=a4DeeFe8-a7BF-48D3-B1F5-8eDe1447BF10
associaccedilatildeo nacional dos Fabricantes de Veiacuteculos automotores (anFaVea 2015) anuaacuterio da induacutestria automobiliacutestica Brasileira 2015 Brazilian automotive industry Yearbook 2015 satildeo Paulo available at wwwanfaveacombr
european environment agency (2014) Monitoring co2 emissions from new passenger cars in the eu summary of data for 2013 april 2014
instituto Brasileiro do Meio ambiente e dos recursos naturais renovaacuteveis (iBaMa 2014) consulta dos niacuteveis de emissatildeo dos veiacuteculos novos brasileiros available at httpsservicosibamagovbrctfpublicosel_marca_modelo_rvepphp
international council on clean transportation (icct 2015) global passenger vehicle standards available at httpwwwtheicctorginfo-toolsglobal-passenger-vehicle-standards
international energy agency (iea 2015) renewables Bioenergy available at httpswwwieaorgtopicsrenewablessubtopicsbioenergy
Korea energy Management corporation (KeMco 2014) Fuel economy regulation available at httpwwwkemcoorkrnew_engmainmainasp
Marklines (2015) Marklines automotive industry Portal available at httpwwwmarklinescomen
Mendonccedila M sachsida a (2014) Modelando a demanda de creacutedito para veiacuteculos no Brasil uma abordagem com mudanccedila de regime iPea
Ministeacuterio do Desenvolvimento induacutestria e comeacutercio exterior (MDic 2013) Programa de incentivo agrave inovaccedilatildeo tecnoloacutegica e adensamento da cadeia Produtiva de Veiacuteculos automotores mdash inovar-auto httpwwwplanaltogov brccivil_03_ato2011-20142012DecretoD7819htm
stein r anderson j and Wallington t (2013) an overview of the effects of ethanol-gasoline Blends on si engine Performance Fuel efficiency and emissions SAE Int J Engines 6(1)470-487 2013 doi1042712013-01-1635
us environmental Protection agency and national highway traffic safety administration (ePanhtsa 2010) Final rulemaking to establish light-Duty Vehicle greenhouse gas emission standards and corporate average Fuel economy standards ePa-420-r-10-901
us environmental Protection agency (ePa 2012) regulatory impact analysis Final rulemaking for 2017-2025 light-Duty Vehicle greenhouse gas emission standards and corporate average Fuel economy standards ePa-420-r-12-016
41
ICCT white paper
us national academy of sciences (nas 2011) assessment of Fuel economy technologies for light-Duty Vehicles available at httpwwwnapeducatalog12924assessment-of-fuel-economy-technologies-for-light-duty-vehicles
World Bank group (2015) World Development indicators available at httpdataworldbankorgdata-catalogworld-development-indicators
42
Brazil Passenger Vehicle Market statistics
LiST Of ACrONyMS
4wD Four-wheel drive
aNFaVEa Brazilian association of automobile Manufacturers
awD all-wheel drive
BRiC Brazil russia india china
CaFE corporate average fuel economy
CBG compressed biogas
CO2 carbon dioxide
CVT continuously variable transmission
CVVT continuously variable valve technology
DCT Dual-clutch transmission
DOhC Dual overhead camshaft
EC energy consumption
Epa us environmental Protection agency
EU european union
FFV Flex-fuel vehicle
FTp Federal test procedure
FwD Front-wheel drive
GDi gasoline direct injection
GDp gross domestic product
GhG greenhouse gas
GM general Motors
iBaMa Brazilian institute of the environment and renewable natural resources
iC internal combustion
iCCT international council on clean transportation
iNMETRO national institute of Metrology standardization and industrial Quality
Kg Kilogram
Km Kilometer
Kw Kilowatt
LDV light-duty vehicle
LpG liquified petroleum gas
MDiC Ministry of Development industry and Foreign trade
MJ Megajoule
MpFi Multi-point fuel injection
Mpg Miles per gallon
NaS us national academy of sciences
43
ICCT white paper
NhTSa us national highway transportation safety administration
OhV overhead valve
pBEV Brazilian Vehicle labeling Program
pSa Psa Peugeot citroeumln
pTwR Power-to-weight ratio
pV Passenger vehicle
RwD rear-wheel drive
SOhC single overhead camshaft
SUV sport utility vehicle
US united states
USD us dollar
VTEC Valve timing electronic control
VVa Variable valve actuation
VVL Variable valve lift
44
Brazil Passenger Vehicle Market statistics
AppENDix A SEGMENT DEfiNiTiONS
Table a‑1 ndash segment definitions
Segmentpower (kw)
pTwR (kwkg) area (m2)
Other characteristics Examples
Subcompact lt 140 lt 0075 le 65 mdash Mini cooper chevrolet celta smart Fortwo
Compact lt 140 lt 0075 65 lt area le 70 mdash honda Fit hyundai hB20 Volkswagen Polo
Medium lt 140 lt 0075 70 lt area le 80 mdash honda civic nissan tiida Peugeot 308
Large lt 140 lt 0075 gt 80 mdash audi a4 BMW 3 series Mercedes c-class
Sports gt 140 gt 0075 mdash 4 seats maxjaguar XF lamborghini gallardo Ferrari california
Off‑road mdash mdash lt 80 traction = 4WDjeep cherokee honda cr-V BMW X3 hyundai santa Fe
SUV mdash mdash lt 80Based on aDKrsquos default classification
BMW X1 Ford ecosport hyundai tucson
Minivan mdash mdash Passengers 6-12
citroen grand Picasso Kia carnival
45
ICCT white paper
AppENDix b iNTErNATiONAL MArKET DATA
Table B‑1 ndash international market comparison of new fleet characteristics
parameters China S Korea EU US Japan india Brazil
Year 2012 2011 2013 2013 2011 2012 2013
Sales (million) 155 13 118 156 352 256 304
price (USD) $21008 $21383 $24439 mdash $20637 $11717 $22015
No of cylinders mdash 43 40 47 38 36 40
Displacement (cc) 1605 1960 1613 2606 1425 1294 1430
Curb weight (kg) 1296 1421 1391 1623 1193 1059 1106
Length (mm) 4323 4531 4263 mdash 4013 3859 4100
Footprint (m2) 38 420 40 425 371 341 367
Engine power (kw) 86 120 89 148 78 55 76
pTwR (kwkg) 00664 00844 00640 00912 00654 00519 00671
Energy consumption ndash US CaFE (MJKm)[1] 235 206 169 250 171 183 202
[1] energy consumption data presented here for countries other than Brazil were obtained from local official sources in its original metric and drive cycle and then converted to Mjkm under the us caFe drive cycle using the methodology described in Yang (2015) Mode details and historical fuel consumption data on their original metrics is presented in the icctrsquos global PV standard website httpwwwtheicctorginfo-toolsglobal-passenger-vehicle-standards
Data Sources
China Ministry of industry and information technology (Miit 2014) corporate average Fuel efficiency accounting Method for Passenger cars available at httpwwwgovcngzdt2013-0320content_2358627htm
Baseline performance china automotive research and technology center through internal communication and icct internal 2010 database for chinese light-duty vehicles
S Korea internal communication with s Korean official and from greencarcongress available at httpwwwgreencarcongresscom200906korea-20090604html
EU european environment agency (2014) Monitoring co2 emissions from new passenger cars in the eu summary of data for 2013 april 2014
US us ePa (2014) light-duty automotive technology carbon dioxide emissions and fuel economy trends1975 through 2014 table 91 page 110 available at http httpwwwepagovfueleconomyfetrends1975-2014420r14023apdf
Japan jaMa (2010) the Motor industry of japan available at httpwwwjama-englishjppublicationsMVs2010pdf Mlit httpwwwmlitgojpcommon000990330pdf
india Bureau of energy efficiency white paper 2010-2012 calculation based on icct database
Brazil icct Brazil Vehicle Database (2013)
46
Brazil Passenger Vehicle Market statistics
Table B‑2 ndash international market comparison of technology adoption in new vehicles
Technology adoption China S Korea EU US Japan india Brazil
Year 2010 2011 2013 2013 2011 2012 2013
Fuel type
CBGLpGFlex 0 11 2 0 0 4 94
Gasoline 99 65 44 93 86 56 6
hybrid 0 1 1 5 13 0 0
Diesel 1 23 53 1 0 40 0
No of cylinders
Two 0 0 0 0 0 6 0
Three 4 0 7 0 36 28 3
Four 90 84 87 56 57 65 97
Five 0 0 1 0 0 0
Six 6 15 4 32 5 0 1
Eight or more 0 0 0 12 1 0 0
Transmission
Manual 60 3 83 5 1 98 83
automatic 34 90 9 75 34 2 15
CVT 5 7 2 18 65 0 1
DCT 1 0 6 2 mdash 0 1
Number of gear ratios
Four or fewer 13 16 1 7 mdash 10 6
Five 68 9 45 11 mdash 85 83
Six or more 19 75 54 82 mdash 5 11
Drivetrain
FwD 74 86 81 83 59 76 0
RwD 21 7 7 10 5 22 0
4wD and awD 5 7 12 7 36 2 100
No of valves per cylinder
Two 17 mdash mdash 2 4 25 60
Multi valve 83 mdash mdash 98 95 75 40
Valve camshaft configuration
Single overhead camshaft 26 1 mdash mdash 16 41 63
Dual overhead camshaft 74 84 mdash mdash 82 53 25
Overhead camshaft mdash 15 mdash mdash 0 6 mdash
Valve actuation
Fixed 50 16 mdash 2 11 86 78
VVT 44 84 mdash 98 89 12 16
VVL 6 mdash mdash mdash mdash 2 6
Fuel systems for gasoline vehicles
Multi‑point fuel injection 94 72 68 62 95 100 98
Gasoline direct injection 6 28 32 37 5 0 2
air induction systems for gasoline vehicles
Naturally aspirated 93 75 41 85 92 64 97
Supercharger turbocharger or twin‑turbo 7 25 59 15 8 36 3
47
ICCT white paper
AppENDix C NEW vEhiCLE ChArACTEriSTiCS AND TEChNOLOGy ADOpTiON DATA iN brAziL
Table C‑1 ndash Fleet characteristics of new Brazilian passenger vehicles by segment (2013)
parameters Subcompact Compact Medium Large Sports Off‑road SUV Minivan
Sales (thousands) 6785 6843 11790 1920 273 768 1997 23
Market share () 223 225 38 8 63 09 25 65 01
price (R$) $30103 $38732 $45496 $66508 $148834 $151284 $75164 $82284
No of cylinders 400 391 399 400 462 448 404 433
Displacement (cc) 1128 1293 1447 1794 2430 2586 1884 2244
Curb weight (kg) 940 1037 1102 1329 1561 1772 1395 1604
Length (mm) 3804 4026 4163 4499 4711 4516 4352 4658
Footprint (m2) 339 361 371 402 418 409 402 427
Engine power ndash gasoline (kw) 58 68 75 99 183 146 103 120
Engine power ndash ethanol (kw) 59 70 77 98 mdash 109 101 mdash
pTwR ndash gasoline (kwkg) 00614 00655 00671 00742 01173 00828 00731 00732
pTwR ndash ethanol (kwkg) 00630 00678 00697 00757 mdash 00766 00745 mdash
48
Brazil Passenger Vehicle Market statistics
Table C‑2 ndash Fleet characteristics of new Brazilian passenger vehicles by manufacturer (2013)
parameters Fiat
GM
Vo
lksw
agen
Ford
Ren
ault
hyu
ndai
ho
nda
Toyo
ta
pSa
Nis
san
Mit
sub
ishi
Kia
JaC
BM
w
Land
Rov
er
Mer
ced
es‑B
enz
Che
ry
aud
i
Suzu
ki
Jeep
Sales (thousands) 6087 5486 5448 3074 2207 2055 1392 1334 1163 621 368 255 158 141 106 94 80 67 63 36
Market share () 2002 1804 1792 1011 726 676 458 439 383 204 121 084 052 046 035 031 026 022 021 012
price (R$) $35017 $42259 $38701 $46174 $43447 $50112 $67078 $68922 $103001 $44035 $100696 $87009 $37654 $165111 $221943 $153281 $30821 $142799 $74769 $139039
No of cylinders 400 401 400 402 400 370 400 400 400 400 408 416 400 424 448 431 400 411 400 552
Displacement (cc) 1250 1340 1287 1497 1423 1495 1691 1808 1575 1579 2262 1856 1411 2095 2281 1934 1398 1912 1831 3182
Curb weight (kg) 1033 1060 1020 1156 1102 1122 1210 1201 1231 1069 1556 1377 1079 1624 1868 1598 1097 1551 1444 1945
Length (mm) 3965 4155 3993 4120 4127 4078 4319 4299 4116 4171 4401 4357 3956 4574 4487 4527 3896 4454 4234 4584
Footprint (m2) 345 370 354 368 378 383 397 387 376 379 395 407 351 429 433 429 349 417 323 420
Engine power ndash gasoline (kw) 64 71 65 79 73 86 96 90 80 82 120 112 83 151 179 138 71 136 94 162
Engine power ndash ethanol (kw) 65 72 65 79 76 85 97 90 81 82 107 106 95 mdash mdash mdash 75 mdash mdash mdash
pTwR ndash gasoline (kwkg)
00613 00662 00631 00674 00657 00739 00788 00745 00646 00766 00779 00792 00784 00921 00977 00856 00638 00870 00649 00835
pTwR ndash ethanol (kwkg) 00629 00681 00642 00693 00685 00781 00800 00795 00660 00768 00710 00798 00896 mdash mdash mdash 00659 mdash mdash mdash
49
ICCT white paper
Table C‑3 ndash Fleet characteristics of new Brazilian passenger vehicles by origin (2013)
parameters Domestic imported
Sales (thousands) 2537 504
Market share () 834 166
price (R$) $41739 $76049
No of cylinders 397 412
Displacement (cc) 1359 1791
Curb weight (kg) 1070 1289
Length (mm) 4063 4285
Footprint (m2) 362 390
Engine power ndash gasoline (kw) 70 102
Engine power ndash ethanol (kw) 73 84
pTwR ndash gasoline (kwkg) 0065 0076
pTwR ndash ethanol (kwkg) 0068 0074
50
Brazil Passenger Vehicle Market statistics
Table C‑4 ndash technology adoption in new Brazilian passenger vehicles by segment (2013)
Technology adoption Subcompact Compact Medium Large SportOff‑road SUV Minivan
Fuel type
Flex 982 988 982 837 00 134 826 00
Gasoline 18 12 17 163 996 540 174 1000
hybrid 0000 0000 0028 0000 0396 0001 0000 0000
Diesel 00 00 00 00 00 326 00 00
No of cylinders
Three 01 91 10 00 00 00 00 00
Four 999 909 990 998 758 775 979 833
Five 00 00 00 02 03 00 00 00
Six 00 00 00 00 175 211 21 167
Eight or more 00 00 00 00 63 13 00 00
Transmission
Manual 993 944 826 622 62 174 505 641
automatic 07 55 161 283 629 707 451 359
CVT 00 00 12 89 09 93 34 00
DCT 00 01 02 06 299 25 10 00
No of gear ratios
Four or fewer 04 47 72 51 00 34 247 193
Five 984 943 848 378 15 392 516 641
Six 12 09 73 515 796 462 225 167
Seven 00 01 06 23 87 53 12 00
Eight or more 00 00 01 32 102 59 00 00
Drivetrain
FwD 998 1000 997 688 550 00 916 1000
RwD 02 00 03 311 221 00 84 00
awD 00 00 00 01 229 1000 00 00
No of valves per cylinder
Two 806 694 584 195 00 00 258 00
Multi valve 194 306 416 805 1000 1000 742 1000
Valve camshaft configuration
Single overhead camshaft 839 786 709 309 00 212 375 00
Dual overhead camshaft 24 158 161 546 880 517 446 255
Valve actuation
Fixed 982 729 807 461 49 493 664 868
VVT 18 211 115 470 827 367 252 132
VVT+VVL 00 61 78 68 124 140 84 00
Fuel systems for gasoline vehicles
Multi‑point fuel injection 999 998 997 949 979 143 766 1000
Gasoline direct injection 01 02 03 51 21 857 234 00
air induction systems for gasoline vehicles
Naturally aspirated 999 997 995 943 974 369 543 1000
Supercharger turbocharger or twin‑turbo 01 03 05 57 26 631 457 00
51
ICCT white paper
Table C‑5 ndash technology adoption in new Brazilian passenger vehicles by manufacturer (2013)
Technology adoption Fi
aT
GM
VO
LKSw
aG
EN
FOR
D
REN
aU
LT
hY
UN
Da
i
hO
ND
a
TOYO
Ta
pSa
NiS
SaN
MiT
SUB
iSh
i
Kia
JaC
BM
w
LaN
D R
OV
ER
MER
CED
ES
Fuel type
Flex 990 987 965 966 997 921 999 886 928 998 283 739 31 42 00 00
Gasoline 10 09 35 34 03 79 01 35 72 02 557 255 969 957 663 950
hybrid 00 00 00 00 00 00 00 02 00 00 00 00 00 00 00 00
Diesel 00 04 00 00 00 00 00 77 00 00 160 06 00 00 337 50
No of cylinders
Three 00 00 05 00 00 348 00 00 00 00 00 00 00 00 00 00
Four 1000 996 994 989 1000 626 999 998 1000 1000 958 922 1000 906 787 878
Five 00 00 00 00 00 00 00 00 00 00 00 00 00 00 00 00
Six 00 02 01 11 00 26 01 02 00 00 42 78 00 68 185 87
Eight or more 00 02 00 00 00 00 00 00 00 00 00 00 00 26 28 35
Transmission
Manual 992 878 985 846 853 632 566 565 703 785 493 120 1000 02 00 151
automatic 08 103 00 137 62 285 355 160 297 121 118 793 00 575 18 14
CVT 00 19 15 16 41 70 01 246 00 00 139 87 00 423 982 836
DCT 00 00 00 00 43 13 78 30 00 94 251 00 00 00 00 00
No of gear ratios
Four or fewer 02 04 00 55 104 237 00 323 249 132 17 133 00 00 00 00
Five 981 811 963 839 797 623 861 643 684 828 530 107 1000 00 00 64
Six 17 185 29 106 99 140 139 07 67 40 453 754 00 217 800 00
Seven 00 00 07 00 00 00 00 27 00 00 00 00 00 08 00 936
Eight or more 00 00 00 00 00 00 00 00 00 00 00 06 00 775 200 00
Drivetrain
FwD 1000 902 989 972 987 985 990 892 1000 1000 496 623 1000 00 00 00
RwD 00 91 00 00 00 00 00 16 00 00 00 370 00 882 00 900
awD 00 06 11 28 13 15 10 92 00 00 504 07 00 118 1000 100
No of valves per cylinder
Two 811 864 988 745 220 00 00 00 00 00 00 00 00 00 00 00
Multi Valve 189 136 12 255 780 1000 1000 1000 1000 1000 1000 1000 1000 1000 1000 1000
Valve camshaft configuration
SOhC 836 755 914 675 832 00 04 00 497 398 331 00 00 00 00 00
DOhC 07 108 56 50 168 992 786 875 352 428 477 1000 907 810 860 453
Valve actuation
Fixed 1000 898 965 966 940 29 00 574 736 573 435 76 124 187 18 55
VVT 00 102 35 34 60 971 00 426 264 427 00 924 876 00 982 945
VVT+VVL 00 00 00 00 00 00 1000 00 00 00 565 00 00 813 00 00
air induction System
Naturally aspirated 997 994 966 977 997 988 1000 923 922 1000 835 936 1000 97 37 101
Supercharger turbocharger or twin‑turbo
03 06 34 23 03 12 00 77 78 00 165 64 00 903 963 899
Fuel systems for gasoline vehicles
Multipoint fuel injection 1000 995 965 972 1000 989 1000 1000 967 1000 994 1000 1000 78 15 158
Gasoline Direct injection 00 05 35 28 00 11 00 00 33 00 06 00 00 922 985 842
note Difference between 100 and summation of sohc and Dohc market share values corresponds to data not available
52
Brazil Passenger Vehicle Market statistics
AppENDix D DATA SOurCES AND COMpLETENESS
the basis of the statistics shown in this report is a database compiled by the icct with vehicle sales technical information (eg fleet characteristics technology content) and energy consumption (converted from either co2 emissions or fuel economy) from various data sources outlined in table D-1
Table D‑1 ndash Brazilian data sources
parameters Sales TechnicalEnergy
consumption
aDK (2014 2015) x x
MarkLines (2015) x
iBaMa (2014) x
iNMETRO (2014) x
UOL (2014) x
icarroscom (2014) x
this analysis examined energy consumption data from two public sources the nota Verde Program by the Brazilian institute of the environment and renewable natural resources (iBaMa) and the Brazilian Vehicle labeling Program (PBeV) by the national institute of Metrology standardization and industrial Quality (inMetro) table D-2 summarizes key differences between these two data sources
Table D‑2 ndash energy consumption data sources
iBaMa iNMETRO
program nota Verde1 Brazilian Vehicle labeling Program (PBeV)2
program description
Mandatory program that reports emissions of co2 co nox and nMhc as part of emissions certification program
Voluntary program since 2009 that allows the comparison of fuel economy across vehicle models
Unit gco2 km kml
Test cycle chassis testing under urban (FtP) driving cycle based on nBr 66012005
chassis testing under urban (FtP) and highway (hWYFe) driving cycles based on nBr 702420103
adjustment
no adjustment for real-world driving conditions Because reported co2 emissions are assumed to be zero for ethanol adjustments were made to account for tailpipe co2 emissions for vehicles running on ethanol
since 2010 published values include real-world adjustment factors to chassis test data a method adopted by the us ePa in 2008
Conversion to MJkm
iBaMarsquos data are reported as FtP (city test) co2 data in gco2 km conversion to caFe test cycle and to a different metric (Mjkm) involves four steps as presented in Figure D-1
inMetrorsquos data in kml are presented separately by fuel type (e22 e100) and driving cycle (urban highway) conversion to Mjkm was done by applying a conversion factor (2167 gco2 l for e22 and 1428gco2l for e00) caFe values are obtained by using a 5545 weighting for the urban (FtP) and highway cycles respectively
1 iBaMa (2014) nota Verde program available at httpwwwmmagovbrcidades-sustentaveisqualidade-do-arcontrole-de-emissoes-veicularesnota-verde
2 inMetro (2014) Programa Brasileiro de etiquetagem Veicular (PBeV) available at httpwwwinmetrogovbrconsumidortabelas_pbe_veicularasp
3 inMetro (2014) Metodologia Para Divulgaccedilatildeo De Dados De consumo Veicular available at httpwwwinmetrogovbrconsumidorpbeMetodologia_consumo_Veicularpdf
53
ICCT white paper
Step 1 Correcting the original IBAMA CO2 reported data ndash FTP CO2 gkm
IBAMArsquos CO2 reported values are corrected to account for tailpipe emissions from ethanol (tailpipe CO2 emissions are reported as zero in IBAMArsquos data)
bull E22 FTP reported CO2 data are reduced by 177bull E100 FTP reported CO2 data are reduced by 100
Flex fuel vehicles are tested with E22 and E00 the final values is calculated as the average of both fuelsCO2 IBAMA_Flex_FTP= 05(1-0177)CO2_E22_test_FTP + 050E100_FTP = 050823CO2_E22_FTPFor Gasoline only vehicles the tests are carried out only with Gasoline E22CO2 IBAMA_Gasoline_FTP = (1-0177) CO2_E22_Test_FTP
Where in the previous equations CO2_E22_FTP means CO2 emissions values obtained under FTP testingCO2 IBAMA_Flex_FTP means IBAMArsquos Corrected FTP values for flex vehiclesCO2 IBAMA_Gasoline_FTP means IBAMArsquos Corrected FTP values for gasoline only (E22) vehicles
INNOVAR AUTO is based on energy consumption data obtained as the combined CAFE test cycle This requires a weighted average of energy consumption data obtained from FTP testing (city driving ) and Highway fuel economy testing (HWFET) In mathematical form CAFE=f(FTPHWFET)
Given that IBAMA data is provided for only the first aprt the FTP testing then it is required to find a way to calculate CAFE combined values through FTP -75 only data A linear function was thus developed from data with FTP and HWY values (INMETRO data) is used to convert FTP only values to CAFE CO2 values ie CAFE=f(FTP) The function used for this conversion is
CO2_CAFE= (CO2_FTP+44756)11572
Step 2Convert FTP CO2 values to CAFE CO2 values
Converting CO2 values to MJkm values is done by using the energy density of E22 Note that all the previous calculations for CO2 come from E22-based data
bull The energy density of E22 is 2894 MJLE22bull E22 emits 2167gCO2LE22bull CAFE (MJkm) = CAFE (gCO2km) (2894 MJLE22 2167 gCO2LE22)
Step 3 Convert US CAFE CO2 values to MJkm values
Figure D‑1 ndash conversion of emission to energy consumption data
energy consumption values calculated from iBaMa and inMetro data differ greatly Figure D-1 illustrates energy consumption data for those models in both databases iBaMa data are on average 126 higher than inMetro data with a standard deviation of 89 and a maximum deviation of 39
54
Brazil Passenger Vehicle Market statistics
0
05
1
15
2
25
3
0 05 1 15 2 25 3
Ene
rgy
cons
ump
tio
n IB
AM
A (
MJ
km)
Energy consumption INMETRO (MJkm)
n=151
Figure D‑2 ndash comparison between energy consumption data from inMetro and iBaMa
151 vehicles tested under both programs
although inMetro data are more transparent as it breaks down fuel economy by fuel and test cycle it is still a voluntary program that allows manufacturers to select which models will participate in addition not all manufacturers participate in the program in turn iBaMa data only include co2 data for the urban cycle and thus energy consumption in the combined cycle had to be estimated from correlations using international data in addition corrections had to be made for gasoline-only engines since it seems that a co2 discount in theory only applicable to flex-fuel engines was also applied to gasoline-only engines Despite these data quality issues iBaMa data were considered the most adequate data source for energy consumption because it is a mandatory program that requires data reporting by all vehicle models and manufacturers
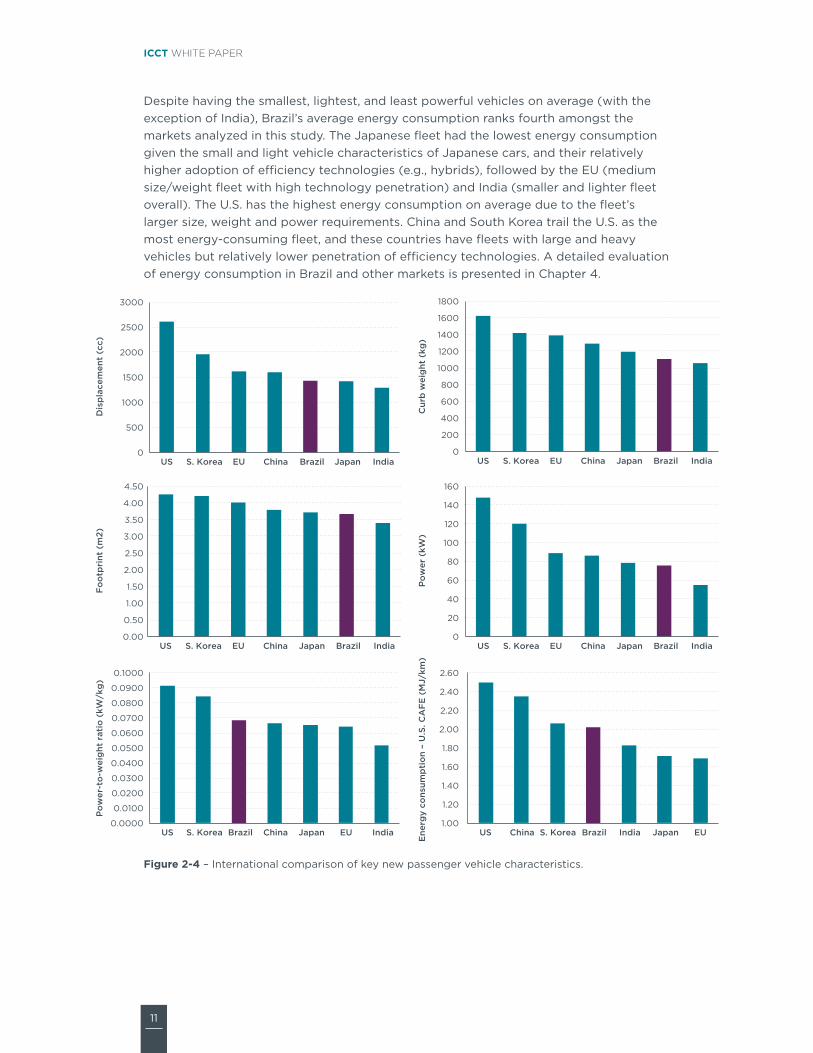
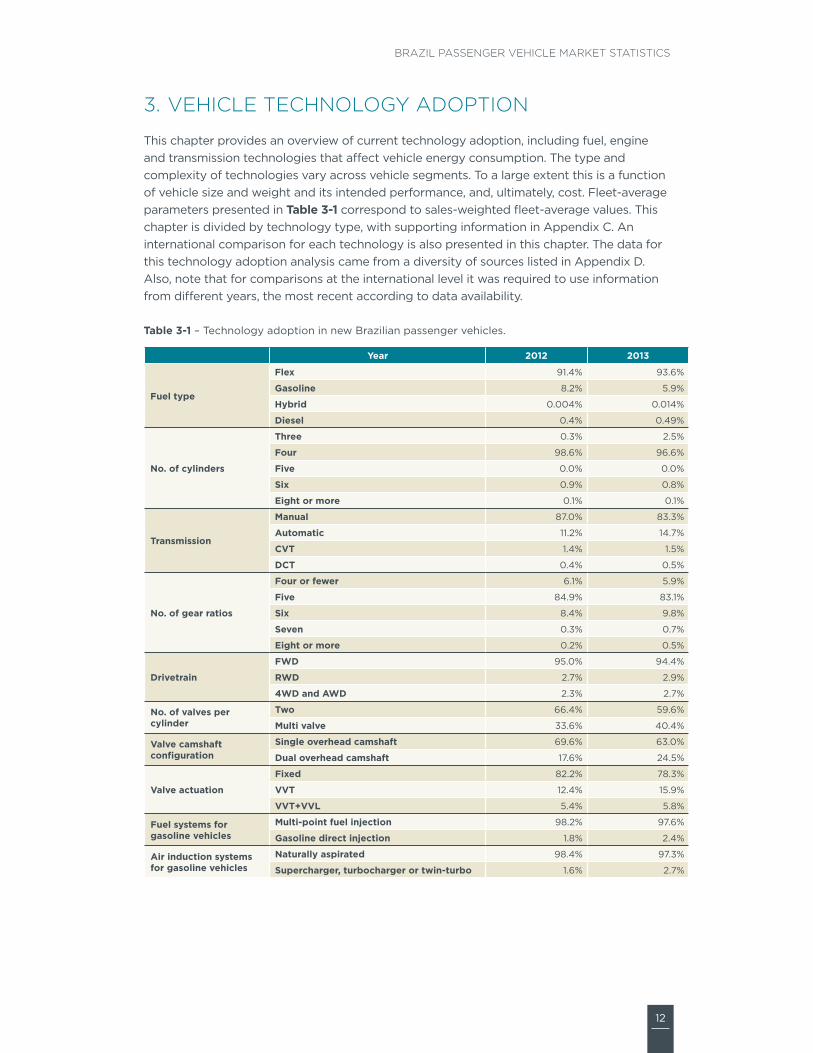
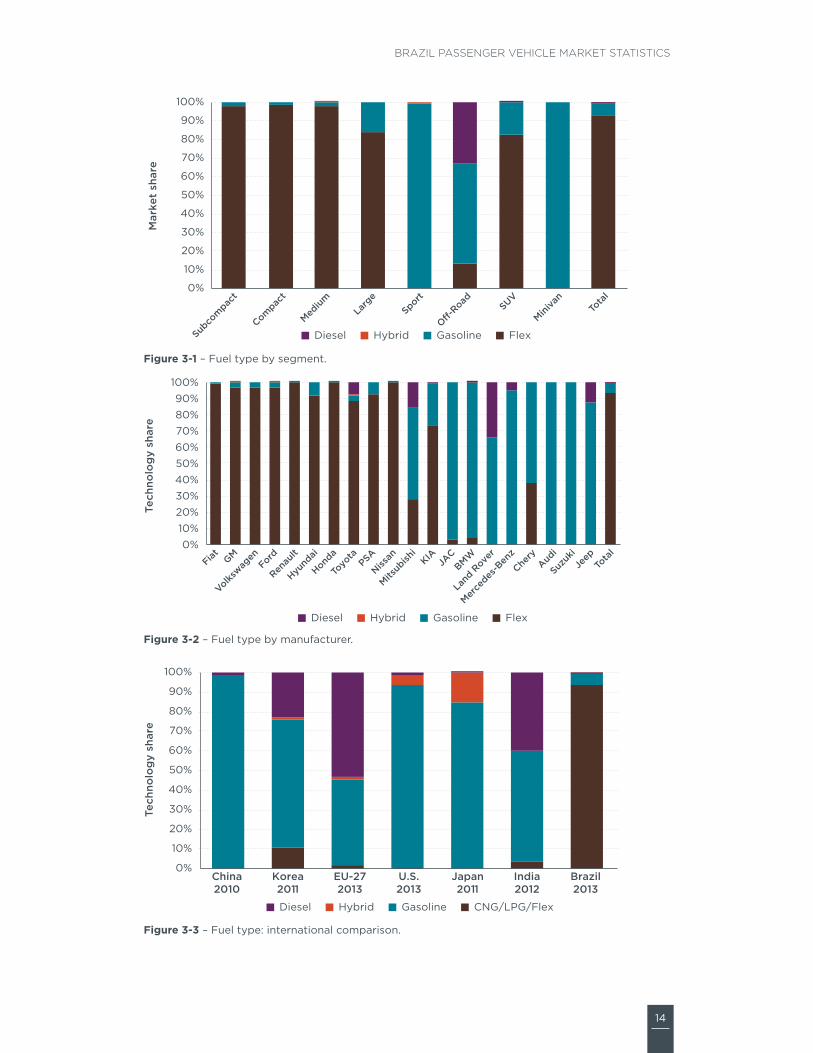
14
Brazil Passenger Vehicle Market statistics
0
10
20
30
40
50
60
70
80
90
100
Subco
mpac
t
Compac
t
Medium
Larg
eSport
O-Road SUV
Miniva
nTo
tal
Mar
ket
shar
e
Diesel Hybrid Gasoline Flex
Figure 3‑1 ndash Fuel type by segment
0102030405060708090
100
Fiat GM
Volkswag
enFord
Renau
lt
Hyund
ai
Honda
Toyo
taPSA
Nissan
Mitsub
ishi
KIAJA
CBMW
Land
Rove
r
Merce
des-B
enz
Chery
Audi
Suzuk
iJe
epTo
tal
Tech
nolo
gy
shar
e
Diesel Hybrid Gasoline Flex
Figure 3‑2 ndash Fuel type by manufacturer
0
10
20
30
40
50
60
70
80
90
100
China2010
Korea2011
EU-272013
US2013
Japan2011
India2012
Brazil2013
Tech
nolo
gy
shar
e
Diesel Hybrid Gasoline CNGLPGFlex
Figure 3‑3 ndash Fuel type international comparison
15
ICCT white paper
NUMBER OF CYLiNDERSacross all vehicle markets 4-cylinder engines are the most common design in automobile engines with displacements below 25 liters this engine configuration presents the right balance between complexity and performance for the target vehicle segments (small to mid-size sedans suVs and some off-road vehicles) engines with six and more cylinders are designed to provide a smoother vehicle driving experience with lower vibration and noise than 4-cylinder engines can provide and with higher power output this better overall performance comes at a higher cost driving their widespread use in large and luxury vehicles and heavier suVs and off-road vehicles
the need to attain better energy consumption has resulted in a recent wave of 3-cylinder engines from a handful of manufacturers in vehicles that typically used 4-cylinder engines achieving similar or better performance this practice is known as engine downsizing Downsizing can also be applied to larger engines from V-8s to V-6s and from V-6s to i-4s in most cases engine downsizing is accompanied with turbocharging and changes to the fuel delivery system
Four-cylinder engines dominate the passenger vehicle market in Brazil and are sold in more than 90 of new vehicles among all segments except the sports off-road and minivan segments (Figure 3‑4) Despite its predominance sales of 4-cylinder engines fell from over 307 to 293 million units between 2012 and 2013 equivalent to a 4 reduction 4-cylinder vehicles represent the majority of sales among the 20 top manufacturers except for hyundai and jeep (Figure 3‑5) although 4-cylinder engines represent the dominant technology in all countries analyzed Brazil still has the largest market share (Figure 3‑6)
the most significant shift in market preferences in Brazil occurred with 3-cylinder engines this technology is becoming more popular with almost eight times more vehicles sold in 2013 compared to 2012 reaching almost 75000 units in 2013 almost all 3-cylinder engines are being sold as compact vehicles instead of the smaller subcompact segment hyundai is the technology leader in sales of 3-cylinder high-efficiency Kappa engines8 japan and india have relatively high penetration of 3-cylinder engine technology in india the popularity of 2- and 3-cylinder vehicles is primarily driven by lower price tags (lt usD $8000)
six-cylinder engines are third in sales after 4- and 3-cylinder engines with absolute numbers close to 25000 units sold in 2013 its market share reduced by 13 with respect to 2012 six-plus cylinder engines are being sold mostly in the sports off-road and minivan segments Manufacturers that cater to the most expensive models and segments dominate the market of vehicles with six-plus cylinder engines such as land rover BMW and Mercedes-Benz the penetration of 6-plus-cylinder engines in Brazil is very low compared to other countries
Five-cylinder engines are not very common in Brazil or other countries and are losing market with respect to 2012 sales by 56 Volkswagen audi and Volvo are the only manufacturers that offered 5-cylinder engines in Brazil in 2013
8 hyundairsquos 3-cylinder Kappa engine httpworldwidehyundaicomWWshowroomcarshB20PiPindexhtml
16
Brazil Passenger Vehicle Market statistics
0
10
20
30
40
50
60
70
80
90
100
Subco
mpac
t
Compac
t
Medium
Larg
eSport
O-Road SUV
Miniva
nTo
tal
Tech
nolo
gy
shar
e
8+ 6 5 4 3
Figure 3‑4 ndash number of cylinders by segment
0102030405060708090
100
Fiat GM
Volkswag
enFord
Renau
lt
Hyund
ai
Honda
Toyo
taPSA
Nissan
Mitsub
ishi
KIAJA
CBMW
Land
Rove
r
Merce
des-B
enz
Chery
Audi
Suzuk
iJe
epTo
tal
Tech
nolo
gy
shar
e
8+ 6 5 4 3
Figure 3‑5 ndash number of cylinders by manufacturer
0
10
20
30
40
50
60
70
80
90
100
China2010
Korea2011
EU-272013
US2013
Japan2011
India2012
Brazil2013
Tec
hno
log
y sh
are
8+ 6 5 4 3 2
Figure 3‑6 ndash number of cylinders international comparison
17
ICCT white paper
TRaNSMiSSiONtransmission technologies can reduce energy consumption in two ways First by allowing engine operation on a more efficient region of the engine map and second by reducing the mechanical losses within transmissions traditionally manual transmissions have offered better energy consumption than traditional automatic transmissions (with 4 or 5 speeds) due to lower friction losses however new generation of automatic transmissions with higher number of gears lower friction better materials and computer-controlled shift points have not just closed the gap between manual and automatic transmission performance but even exceed manual transmission performance
new technologies such as dual-clutch transmissions (Dcts) and continually variable transmissions (cVts) are gaining market share due to the need for lower vehicle energy consumption Dcts can be defined as manual transmissions with electro-hydraulically operated dual-clutch systems allowing for faster shifting times and selective automatic or ldquomanualrdquo operation as opposed to manual automatic and Dct transmissions which have a discrete number of gear ratios cVts have a theoretically infinite choice of ratios between fixed limits which allows engines to be further optimized for minimizing energy consumption cVt technology has been used in lower-horsepower vehicles because of maximum-torque limitations with the most common metal-belt design (nas 2011) these advanced transmission technologies offer significant benefits in energy consumption compared to traditional manual or automatic technologies according to the us national academy of sciences a 6-speed Dct provides 6 to 9 lower energy consumption than a 4-speed automatic transmission note that a traditional 6-speed automatic transmission provides an estimated 3 to 5 benefit the energy consumption benefit of cVt depends on the application and is estimated to be 1 to 7 (nas 2011)
although vehicle sales with manual transmissions are predominant in Brazil the penetration of automatic transmissions cVts and Dcts is increasing resulting in a market share loss for manual transmissions of about 6 between 2012 and 2013 (Table 3‑1) With the exception of sports and off-road segments manual transmission technology has the largest market share in all segments but it tends to become less predominant as vehicles grow in size and comfort level (Figure 3‑7) the top five manufacturers sell most of their vehicles with manual transmissions but their market share is somewhat smaller for other high-selling manufacturers that cater to a more affluent market (Figures 3‑8)
automatic transmissions are becoming increasingly popular in Brazil experiencing an increase of 28 in sales between 2012 and 2013 automatic transmissions dominate the sports and off-road segments Kia BMW land rover Mercedes-Benz and jeep adopt this type of transmission technology for most of their vehicle sales
Dct transmissions are entering the Brazilian market mostly through the sports segment via imported models the sales of Dct equipped vehicles increased in 2013 by 22 with respect to 2012 Dct technology is being offered mainly by manufacturers that sell sports vehicles such as audi in more than 67 of their vehicles and Mercedes-Benz in more than 15 of their vehicles the global leader in Dct adoption is europe followed by the us (Figure 3‑9)
cVt technology market is still relatively small being sold by small volume manufacturers like jeep audi and Mitsubishi with more than 25 of new vehicle sales each nissan renault honda and toyota also sell vehicles with cVt technology cVt penetration in Brazil is similar to europersquos cVt is the leading transmission technology in japan with more than 65 of the market
18
Brazil Passenger Vehicle Market statistics
0
10
20
30
40
50
60
70
80
90
100
Subco
mpac
t
Compac
t
Medium
Larg
eSport
O-Road SUV
Miniva
nTo
tal
Tech
nolo
gy
shar
e
DCT CVT Automatic Manual
Figure 3‑7 ndash transmission by segment
0
10
20
30
40
50
60
70
80
90
100
Fiat GM
Volkswag
enFord
Renau
lt
Hyund
ai
Honda
Toyo
taPSA
Nissan
Mitsub
ishi
KIAJA
CBMW
Land
Rove
r
Merce
des-B
enz
Chery
Audi
Suzuk
iJe
epTo
tal
Tech
nolo
gy
shar
e
DCT CVT Automatic Manual
Figure 3‑8 ndash transmission by manufacturer
0
10
20
30
40
50
60
70
80
90
100
China2010
Korea2011
EU-272013
US2013
Japan2011
India2012
Brazil2013
Tech
nolo
gy
shar
e
DCT CVT Automatic Manual
Figure 3‑9 ndash transmission international comparison
19
ICCT white paper
NUMBER OF GEaR RaTiOS as mentioned in the previous section increasing the number of gear ratios (whether manual automatic dual-clutch or continuously variable) allows the engine to be operated in the best efficiency region resulting in energy consumption benefits compared to an automatic four-gear ratio transmission (also known as 4-speed transmission) higher ratio automatic transmissions could reduce energy consumption from 2 to 3 (for a five-gear ratio) to 6 to 8 (for an eight-gear ratio) (ePanhtsa 2010)
Four-gear ratio transmissions are losing market share in Brazil by more than 5 between 2012 and 2013 (Table 3‑1) these transmissions are particularly high sellers in the suV and minivan segments which suggest that some models in these more expensive segments are being sold with outdated technologies (Figure 3‑10) Most manufacturers are phasing out this type of transmission (Figure 3‑11) although jeep suzuki and toyota are lagging behind other manufacturers the four-gear ratio transmission technology has been losing market share in most countries even in india where smaller and inexpensive cars dominate the market 4-speed transmissions have the smallest market share (Figure 3‑12)
Five- and six-gear ratio transmissions were predominant in the Brazilian market in 2013 Five-gear ratio transmissions are dominant in all segments except for the off-road and sports segments which have adopted six-gear ratio transmissions in most sales the significant market share of five- and six-gear ratio transmissions is similar to most countries although the us europe and south Korea show higher shares of six and more gear ratios
seven- and eight-gear ratio transmissions which are considered emerging technologies have experienced an increase in sales in Brazil with over twice as many sales in 2013 compared to 2012 seven- and eight-gear ratio transmissions are popular among the large sports and off-road segments all of which are imported models luxury manufacturers such as Mercedes-Benz and audi are selling the most seven-gear vehicles as a share of their sales Volkswagen and toyota are also selling similar numbers of seven-gear ratio vehicles although for Volkswagen and toyota it represented less than 3 of their brand sales BMW and land rover are the leaders in eight-gear ratio vehicles
20
Brazil Passenger Vehicle Market statistics
0
10
20
30
40
50
60
70
80
90
100
Subco
mpac
t
Compac
t
Medium
Larg
eSport
O-Road
SUV
Miniva
nTo
tal
Tech
nolo
gy
shar
e
8 7 6 5 4
Figure 3‑10 ndash number of gear ratios by segment
0
10
20
30
40
50
60
70
80
90
100
Fiat GM
Volkswag
enFord
Renau
lt
Hyund
ai
Honda
Toyo
taPSA
Nissan
Mitsub
ishi
KIAJA
CBMW
Land
Rove
r
Merce
des-B
enz
Chery
Audi
Suzuk
iJe
epTo
tal
Tech
nolo
gy
shar
e
8 7 6 5 4
Figure 3‑11 ndash number of gear ratios by manufacturer
0
10
20
30
40
50
60
70
80
90
100
Tech
nolo
gy
shar
e
Six or more Five Four or fewer
China2010
Korea2011
EU-272013
US2013
India2012
Brazil2013
Figure 3‑12 ndash number of gear ratios international comparison
21
ICCT white paper
DRiVETRaiNDrivetrain technology includes front-wheel drive (FWD) rear-wheel drive (rWD) and all-wheel drive (aWD) vehicles For the same vehicle size FWD vehicles provide more interior space and better energy consumption than rWDs due to lower weight as it avoids the added weight of and space for the driveshaft and differential that rWD requires Because the weight of the engine and transmission is located close to the wheels FWD vehicles have better traction than rWDs rWDs however show better handling as the weight distribution between the front and rear wheels is more uniform and the tasks of turning and acceleration are split between the front and rear wheels also directing large amounts of power through the front wheels can create ldquotorque steerrdquo thus rWD is the adequate technology for the sports segment aWD drivetrains are intended for specific driving applications that imply loss of traction such as off-road terrains snow or towing
FWD vehicles dominate all segments of the Brazilian passenger car market (Table 3‑1) with the exception of the off-road segment (Figure 3‑13) among the 20 largest manufacturer sellers most except for BMW land rover Mercedes-Benz and suzuki offer FWD technology (Figure 3‑14) Brazil has the highest market share of FWD vehicles of all countries analyzed (944) although FWD has at least 50 market share in all seven countries (Figure 3‑15)
aWD market share increased by 15 between 2012 and 2013 due to a tri-fold increase in the sports segment sales off-road vehicle sales with aWD also increased to more than 76000 units in 2013 amongst the largest ten manufacturers toyota is the aWD market leader followed by Ford and Volkswagen note that land rover sells only aWD vehicles in Brazil among non-luxury manufacturers Mitsubishi and suzuki are selling more than 50 of their vehicles with aWD technology
rWD technology is offered mostly in large and sports vehicles and in suVs among the 10 largest manufacturers rWD is offered mainly by gM and toyota while an extended examination of the 20 largest manufacturers by sales show that aWD and rWD is focused among the more expensive brands (Figure 3‑14) Mercedes-Benz and BMW sell close to 90 of their vehicles with rWD technology traditionally associated with engine performance and responsiveness
22
Brazil Passenger Vehicle Market statistics
0
10
20
30
40
50
60
70
80
90
100
Subco
mpac
t
Compac
t
Medium
Larg
eSport
O-Road SUV
Miniva
nTo
tal
Tehn
olo
gy
shar
e
AWD RWD FWD
Figure 3‑13 ndash Drivetrain by segment
0
10
20
30
40
50
60
70
80
90
100
Fiat GM
Volkswag
enFord
Renau
lt
Hyund
ai
Honda
Toyo
taPSA
Nissan
Mitsub
ishi
KIAJA
CBMW
Land
Rove
r
Merce
des-B
enz
Chery
Audi
Suzuk
iJe
epTo
tal
Tech
nolo
gy
shar
e
AWD RWD FWD
Figure 3‑14 ndash Drivetrain by manufacturer
0
10
20
30
40
50
60
70
80
90
100
China2010
Korea2011
EU-272013
US2013
Japan2011
India2012
Brazil2013
Tech
nolo
gy
shar
e
AWD RWD FWD
Figure 3‑15 ndash Drivetrain international comparison
23
ICCT white paper
VaLVE CaMShaFT CONFiGURaTiON (DOhC VS SOhC)the engine camshaft governs the timing duration and lift of valve operation controlling the intake of air and the exhaust of combustion gases this report focuses on single overhead camshafts (sohc) and dual overhead camshafts (Dohc) as these configurations have almost completely replaced the older overhead valve configuration (ohV) sohc design places a single camshaft above the cylinder head that governs all the valves intake and exhaust in the case of sohc V-engines there is one single camshaft per head Dohc designs use separate camshafts for intake valves and exhaust valves Dohc engines achieve increased airflow at high-engine speeds improve volumetric efficiency and reduce the valvetrainrsquos moving mass such engines typically develop higher power at high-engine speeds the us environmental Protection agency (ePa) and national highway traffic safety administration (nhtsa) estimate the effectiveness of Dohc over sohc to be between 1 and 25 (ePanhtsa 2010)
although Dohc produce more power and provide lower fuel consumption the Brazilian fleet is still mostly composed of sohcs vehicles (Table 3‑1) sohc technology is predominant among the subcompact compact and medium segments (Figure 3‑16) among manufacturers sohc technology is predominant among the five largest least expensive brands (Figure 3‑17) sales of vehicles with more advanced Dohc technology grew in 2013 by almost 36 with respect to 2012 albeit from a relatively smaller base this increase was experienced in all vehicle segments but in different magnitudes
although global data on this technology are scarce Figure 3‑18 indicates that most countries are moving away from sohc with Brazil being the only country analyzed where sohc is still predominant no data were available for the us or europe
24
Brazil Passenger Vehicle Market statistics
0
10
20
30
40
50
60
70
80
90
100
Subco
mpac
t
Compac
t
Medium
Larg
eSport
O-Road SUV
Miniva
nTo
tal
Tech
nolo
gy
shar
e
nd DOHC SOHC
Figure 3‑16 ndash Valve camshaft configuration by segment (nd no data)
0
10
20
30
40
50
60
70
80
90
100
Fiat GM
Volkswag
enFord
Renau
lt
Hyund
ai
Honda
Toyo
taPSA
Nissan
Mitsub
ishi
KIAJA
CBMW
Land
Rove
r
Merce
des-B
enz
Chery
Audi
Suzuk
iJe
epTo
tal
Tech
nolo
gy
shar
e
nd DOHC SOHC
Figure 3‑17 ndash Valve camshaft configuration by manufacturer (nd no data)
0
10
20
30
40
50
60
70
80
90
100
China2010
Korea2011
Japan2011
India2012
Brazil2013
Tech
nolo
gy
shar
e
nd OVC DOHC SOHC
Figure 3‑18 ndash Valve camshaft configuration international comparison (nd no data)
25
ICCT white paper
VaLVE aCTUaTiON improved valvetrain systems with variable valve actuation (VVa) technology either variable valve timing (VVt) or variable valve timing and lift (VVt+VVl) improves the enginersquos volumetric and thermodynamic efficiency they also enable further engine improvements such as internal exhaust gas recirculation and cylinder deactivation VVt alters the timing of the intake valve exhaust valve or both primarily to reduce pumping losses increase specific power and control residual exhaust gases VVl increases efficiency by optimizing airflow over a broader range of engine operation which reduces pumping losses and increases specific power VVl is accomplished by controlled switching between two or more cam profile lobe heights the most advanced technology VVt+VVl yields a wide range of performance optimization and volumetric efficiency including enabling the engine to be valve-throttled (no need for intake throttle) VVt provides energy consumption gains of 3 to 5 while the more flexible and complex VVt+VVl system can reach 4 to 8 (ePa amp nhtsa 2010)
VVa technology either VVt or VVt+VVl are emerging technologies in Brazil where most vehicles still have fixed-valve timing designs (Table 3‑1) Fixed technology is predominant among the smaller vehicle segments as well as suVs and minivans (Figure 3‑19) the five largest manufacturers sold more than 90 of their vehicles with fixed-valve technology in 2013 (Figure 3‑20) the international comparison indicates that only Brazil and india have not yet adopted VVa technologies for most of their light-duty fleet (Figure 3‑21)
VVt and VVt+VVl are being adopted across all segments including the subcompact segment but tend to be more predominant in high-end manufacturers a closer examination by manufacturer shows that most are offering some vehicles with either one of the VVa systems while honda and hyundai offer this technology in almost all vehicles (Figure 3‑20) honda is the technology leader in variable valve actuation with the adoption in the early 1990s of the Vtec system (Valve timing electronic control) VVt technologyrsquos market share grew by about 25 in 2013 primarily due to hyundairsquos sales from 80000 units in 2012 to almost 200000 units in 2013 hyundai offered the continuously variable valve technology (cVVt) in the large majority of vehicle sold in 2013 the sports segment is the one where VVt dominates the market Mitsubishi BMW and audi are also selling a large share of their vehicles with the VVt+VVl technology
26
Brazil Passenger Vehicle Market statistics
0
10
20
30
40
50
60
70
80
90
100
Subco
mpac
t
Compac
t
Medium
Larg
eSport
O-Road SUV
Miniva
nTo
tal
Tech
nolo
gy
shar
e
VVT+VVL VVT Fixed
Figure 3‑19 ndash Valve actuation by segment
0
10
20
30
40
50
60
70
80
90
100
Fiat GM
Volkswag
enFord
Renau
lt
Hyund
ai
Honda
Toyo
taPSA
Nissan
Mitsub
ishi
KIAJA
CBMW
Land
Rove
r
Merce
des-B
enz
Chery
Audi
Suzuk
iJe
epTo
tal
Tech
nolo
gy
shar
e
VVT+VVL VVT Fixed
Figure 3‑20 ndash Valve actuation by manufacturer
VVT+VVL VVT Fixed
0
10
20
30
40
50
60
70
80
90
100
China2010
Korea2011
US2013
Japan2011
India2012
Brazil2013
Tech
nolo
gy
shar
e
Figure 3‑21 ndash Valve actuation international comparison
27
ICCT white paper
FUEL SYSTEMS FOR GaSOLiNE VEhiCLESVehicle fuel systems describe the technology required to deliver fuel into the engine combustion chamber this section examines two gasolineflex technologies namely multi-point fuel injection (MPFi) and gasoline direct injection (gDi) MPFi is now the most common fuel-delivery system for gasoline engines used in passenger vehicles worldwide in sequential MPFi engines fuel is injected into the air stream next to the intake valve port while the intake valve is open to draw the air-fuel mixture into the cylinder some of the fuel is vaporized on the surface of the hot intake valve expanding and thus reduces the volumetric efficiency on gDi engines fuel is injected at high pressure directly into the combustion chamber improving volumetric efficiency and providing cooling of the airfuel charge within the cylinder which allows for higher compression ratios and increased thermodynamic efficiency gDi technology alone offers benefits of 2 to 5 with respect to MPFi engines but bigger benefits rely on the synergy between gDi turbocharging and downsizing which can reach 12 to 15 energy consumption reduction with respect to a MPFi naturally aspirated engine (ePa 2012)
Table 3‑1 illustrates that MPFi is still the most common fuel injection technology for gasolineflex vehicles in Brazil which is reflected in its dominant share across most segments except for sports and off-road vehicles in Brazil gDi has found a niche market in the sports and off-road segments with more than 90 of sport vehicles fitted with gDi technology (Figure 3‑22) Within the overall gasoline market the gDi technology is still an emerging technology representing just 24 of new sales gDirsquos market share increased by 31 in 2013 with all but 4000 units being imported among the 10 largest manufacturers the adoption of gDi is extremely low below 5 for Volkswagen Ford hyundai and Psa (Figure 3‑23) high-end european brands (audi land rover Mercedes-Benz and BMW) are the technology leaders in terms of gDi adoption rates echoing the trend of turbocharging technology sales Volkswagen vehicles with gDi systems account for less than 35 of their sales in 2013 but their absolute numbers (around 19000 vehicles) place the company as one of the leaders in gDi technology in the Brazilian market
From a global market perspective the penetration of gDi technology in Brazil is low compared to all other markets in Figure 3‑24 except for india and japan it should be noted that the later has the largest share of hybrid vehicles around the globe
28
Brazil Passenger Vehicle Market statistics
0
10
20
30
40
50
60
70
80
90
100
Compac
t
Subco
mpac
t
Medium
Larg
eSport
O-Road SUV
Miniva
nTo
tal
Tech
nolo
gy
shar
e
GDI MPFI
Figure 3‑22 ndash gasolineflex fuel system by segment
GDI MPFI
0102030405060708090
100
Fiat GM
Volkswag
enFord
Renau
lt
Hyund
ai
Honda
Toyo
taPSA
Nissan
Mitsub
ishi
KIAJA
CBMW
Land
Rove
r
Merce
des-B
enz
Chery
Audi
Suzuk
iJe
epTo
tal
Tech
nolo
gy
shar
e
Figure 3‑23 ndash gasolineflex fuel system by manufacturer
GDI MPFI
0
10
20
30
40
50
60
70
80
90
100
China2010
Korea2011
EU-272013
US2013
Japan2011
India2012
Brazil2013
Tech
nolo
gy
shar
e (n
on-
die
sel)
Figure 3‑24 ndash gasolineflex fuel system international comparison
29
ICCT white paper
TURBOChaRGiNGengine power is primarily limited by the rate at which the engine is able to draw air into the combustion chamber turbocharging and supercharging are two methods to increase the amount of air drawn into the engine above the level of what is possible with the naturally aspirated process (through the expansion of the cylinders) By increasing the amount of air into the engine the amount of fuel can be proportionally increased resulting in increased power output level and with it the ability to reduce engine displacement while maintaining performance the combination of turbocharging and downsizing in spark ignited (gasoline and flex-fuel) vehicles can provide energy consumption improvements between 2 to 6 with respect to a direct-injected gDi engine (ePa amp nhtsa 2010) turbocharging technology is the cornerstone for achieving better energy consumption in vehicles as the basis for downsizing and reducing the engine weight while keeping the same or better vehicle performance (ie acceleration or time to reach certain speed) although turbochargers are used in diesel and gasolineflex vehicles the analysis in this report focuses on turbocharging for spark-ignited gasolineflex vehicles only
turbocharging is one of the most important emerging technologies in Brazil where most vehicles are still naturally aspirated (na) (Table 3‑1) turbocharging technology has increased the market share significantly between 2012 and 2013 by more than 65 albeit from a small base (from about 49000 to 81000 vehicles)
Most vehicles with turbocharging are sold in the sports and off-road segments as this technology also produces superior engine power output (Figure 3‑25) among the 10 largest manufacturers turbocharging is still below 10 of their sales (Figure 3‑26) Volkswagen and Ford despite having small relative sales of vehicles with turbocharging (less than 35) are the manufacturers with the highest total sales of vehicles with turbocharging audi land rover Mercedes-Benz and BMW are the technology leaders with more than 90 of vehicle sales in 2013
the penetration of turbo and supercharging technologies in Brazil is lower than in other countries with a larger gasoline fleet such as the us china and japan (Figure 3‑27) in Brazil 95 of diesel passenger vehicle sales have turbocharging technology
30
Brazil Passenger Vehicle Market statistics
0
10
20
30
40
50
60
70
80
90
100
Compac
t
Subco
mpac
t
Medium
Larg
eSport
O-Road SUV
Miniva
nTo
tal
Tech
nolo
gy
shar
e (n
on-
Die
sel)
Turbo NA
Figure 3‑25 ndash turbocharging for gasolineflex fuel vehicles by segment (NA naturally aspirated)
0102030405060708090
100
Fiat GM
Volkswag
enFord
Renau
lt
Hyund
ai
Honda
Toyo
taPSA
Nissan
Mitsub
ishiKIA
JACBMW
Land
Rove
r
Merce
des-B
enz
Chery
Audi
Suzuk
iJe
epTo
tal
Tech
nolo
gy
shar
e (n
on-
Die
sel)
Turbo NA
Figure 3‑26 ndash turbocharging for gasolineflex fuel vehicles by manufacturer (NA naturally aspirated)
0
10
20
30
40
50
60
70
80
90
100
China2010
Korea2011
EU-272013
US2013
Japan2011
India2012
Brazil2013
Tech
nolo
gy
shar
e (n
on-
die
sel)
Turbo NA
Figure 3‑27 ndash turbocharging for gasolineflex fuel vehicles international comparison (NA naturally aspirated)
31
ICCT white paper
4 vEhiCLE ENErGy CONSuMpTiON
this section analyzes the Brazilian new passenger vehicle energy consumption in 2013 although other metrics are more common (see box) vehicle energy consumption is presented in megajoules per kilometer (Mjkm) for consistency with Brazilrsquos inovar-auto policy in 2012 Brazilrsquos Ministry of Development industry and Foreign trade (MDic) adopted the inovar-auto policy with the aim of fostering industrial competitiveness through technology investments the policy includes a target for corporate average energy consumption (in Mjkm with vehicle curb weight as the attribute parameter) for vehicles sold in 2017
in the us canada Mexico and saudi arabia fleet-average fuel economy standards are defined as a function of vehicle footprint in the eu china japan south Korea and india vehicle weight is the attribute for the calculation of fleet-average targets in Brazil inovar-auto has defined its fiscal targets for vehicle energy consumption measured in megajoules per kilometer (Mjkm) as a function of vehicle weight
VEhiCLE ENERGY MEaSUREMENT UNiTS
Many metrics can be used to describe the amount of fuel energy or emissions generated by unit of distance traveled
Fuel economy measures distance traveled per unit of fuel consumed in Brazil kilometers per liter (kml) is the most common metric to describe vehicle efficiency but other units are used in different countries such as miles per gallon (mpg) in the us
Fuel consumption is the reciprocal of fuel economy and measures fuel consumed per distance traveled it is usually expressed in liters per 100 kilometers (l100 km) and it is used in europe for example
GhGCO2 emissions measures ghg or co2 emissions per distance traveled expressed as grams of pollutant per kilometer or mile
Energy consumption (EC) measures the energy consumed per distance traveled for example in megajoules per kilometer Despite being a less common metric it is sometimes preferred for being a fuel-neutral metric across different types of fuel and vehicle technologies Vehicle energy consumption in Mjkm is the metric used in Brazilrsquos inovar-auto policy to quantify the corporate average energy consumption target for each manufacturer Values for energy consumption in Brazilian spark-ignited vehicles are provided for e22 since that is the fuel mixture used in vehicle tests
Vehicle energy consumption in this report is calculated from co2 emissions data in the Brazilian institute of environment and renewable natural resources (iBaMa) nota Verde program (iBaMa 2014) which reports official emissions data from homologation tests Data are limited to passenger cars sold by the top 10 manufacturers with light commercial vehicles being excluded appendix D presents a description of data sources
32
Brazil Passenger Vehicle Market statistics
and calculation methodologies as well as a discussion of vehicle energy consumption data quality and completeness in Brazil
not surprisingly vehicle energy consumption increases with vehicle footprint and engine rated power the two parameters that define vehicle segments in Brazil (Figure 4‑1) subcompact and compact vehicles which accounted for about 45 of new sales in 2013 have average energy consumption below the fleet average while medium-sized vehicles which hold the largest market share (388) have energy consumption just above the fleet average larger more powerful vehicles consume more energy than the fleet average but have a considerably smaller market share (combined share of 163) Data availability for these segments is not as extensive as the data available for the subcompact compact and medium segments which could affect the relative rankings of each segment
Ene
rgy
cons
ump
tio
n (M
Jkm
)
Subco
mpac
t
Compac
t
Medium
Larg
e
O-road SUV
4000
200000
400000
600000
850000
35
30
25
20
15
10
05
0
Sales
Total 202
Figure 4‑1 ndash new vehicle sales-weighted average energy consumption by segment (2013)
33
ICCT white paper
Figures 4‑2 and 4‑3 illustrate new vehicle energy consumption for multiple weight and footprint bins For each weight bin (in 100 kg increments) and footprint bin (in 01 m2 increments) sales-weighted averages of energy consumption for each vehicle version are presented (dashes) generating energy consumption ranges for each bin (cream areas) Vehicle sales by bin are presented for reference in the lower charts
the strong correlation between vehicle energy consumption and weight follows from the strong physical relationship between the weight of the vehicle and the energy required to accelerate it and overcome resistances9 (Figure 4‑2) Data dispersion within each bin suggests that energy consumption varies due to other vehicle characteristics that affect vehicle aerodynamics and rolling resistance as well as the adoption of technologies that affect engine and transmission efficiency (eg friction reduction technologies gDi VVt)
Curb weight (kg)
SubcompactCompactMediumLargeO-roadSUV
Ene
rgy
cons
ump
tio
n (M
Jkm
)Sa
les
5
6
4
3
2
1
600k
800k
400k
200k
0k800 900 1000 1100 1200 1300 1400 1500 1600 1700 1800 1900 2000 2100
Figure 4‑2 ndash new vehicle energy consumption by vehicle weight (2013)
9 on a plain surface the sum of resistances of a vehicle is acceleration resistance + rolling resistance + aerodynamic resistance = c1 m a + c2 frr m + c3 cw a v2 with mass (m) as an integral part of both acceleration and rolling resistance which are most relevant for inner-city driving situations other factors are acceleration (a) rolling resistance of tires (frr) aerodynamic coefficient of the vehicle (cw) frontal area of vehicle (a) velocity (v) and constants (cx)
34
Brazil Passenger Vehicle Market statistics
Footprint has a reasonable correlation with energy consumption (Figure 4‑3) ie larger vehicles tend to consume more fuel than smaller vehicles however the correlation is not as strong as with vehicle weight similar to the previous figure the broad spread of energy consumption values suggests a combination of different vehicle characteristics (eg weight engine displacement rated power) and technologies (eg transmissions fuel systems) as well as the presence of suVs and off-road vehicles among the medium- and large-sized footprint values respectively
Footprint (m2)
SubcompactCompactMediumLargeO-roadSUV
Ene
rgy
cons
ump
tio
n (M
Jkm
)Sa
les
5
6
4
3
2
1
400k
500k
300k
200k
100k
0k31 32 33 34 35 36 37 38 39 40 41 42 43 44 45 46 48 49
Figure 4‑3 ndash new vehicle energy consumption by vehicle footprint (2013)
35
ICCT white paper
Figure 4‑4 illustrates sales weighted average for new vehicle energy consumption by mass for the top 10 manufacturers in Brazil in 2013 Bubble sizes are proportional to total vehicle sales Manufacturers in the lower-left quadrant produce the lightest and most efficient vehicles with hyundai presenting the best overall average energy consumption renault in the upper-left quadrant produces vehicles that are equivalent in weight but on average with higher energy consumption in the lower-right quadrant are manufacturers that produce relatively heavier vehicles but with lower energy consumption in their weight class Despite producing heavier vehicles on average than many manufacturers honda achieves lower energy consumption on average in the upper-right quadrant are manufacturers that produce on average the heavier and least efficient vehicles with Psa (citroen and Peugeot) producing the heaviest and least efficient cars on average a regression line correlating vehicle energy consumption and mass highlights the best performers (hyundai honda and nissan) average performers (Fiat Volkswagen gM and toyota) and those performing worse than average (renault Ford and Psa)
FIA
GMVW
FORREN
HYU
HON
TOY
PSA
NIS
160
170
180
190
200
210
220
230
240
250
950 1000 1050 1100 1150 1200 1250 1300 1350
Ene
rgy
cons
ump
tio
n (M
Jkm
)
Curb weight (kg)
Fleet Ave
Figure 4‑4 ndashaverage new vehicle sales-weighted energy consumption by manufacturer (2013)
36
Brazil Passenger Vehicle Market statistics
Figure 4‑5 shows fleet-average energy consumption based on certification and type approval data for new vehicles in multiple countries converted to the us caFe combined driving cycle Bubble sizes represent total sales of new passenger cars Because of data availability in different countries the country comparison is based on different calendars years for different countries 2011 for south Korea and japan 2012 for china and india and 2013 for europe the us and Brazil given annual improvements in vehicle energy consumption triggered by regulatory efficiency standards and fiscal incentives those countries with older data could be at a slight disadvantage in this comparison
With the heaviest vehicles on average the us fleet is also the most energy consuming of all countries china and south Korea have similar average energy consumption but since south Korean vehicles are heavier on average they are relatively more efficient than chinese vehicles although Brazilrsquos fleet consumes less fuel on average than those from the us china and south Korea its fleet is relatively inefficient when compared to countries with vehicles of similar weight (japan and india) the average Brazilian vehicle consumes about 34 more energy than the average vehicle in japan whose fleet has a large penetration of gasoline hybrid and advanced fuel-efficiency technologies such as three-cylinder engines VVa Dohc and 6-plus speed transmissions european vehicles are the best performing on average despite being heavier than all countries with the exception of the us and south Korea the adoption of fuel-efficiency technologies (eg Dct 6-plus-speed transmissions gDi turbocharging) contributes to europersquos better than average performance
China2012
SKorea2011
Europe2013
US2013
Japan2011
India2012
Brazil2013
Sales5 MM10 MM
14
16
18
20
22
24
26
28
1000 1100 1200 1300 1400 1500 1600 1700
Ene
rgy
cons
ump
tio
n ndash
CA
FE
(M
Jkm
)
Curb weight (kg)
Type-approval and certification energy consumption data only (does not include o-cycle or real-world driving data)
Figure 4‑5 ndash international comparison of passenger car energy consumption
Country labels indicate the dataset year
Figure 4‑6 provides a more detailed country comparison by illustrating average vehicle energy consumption by vehicle (curb) weight bin Vehicle sales in each bin are shown for reference the us is not shown due to lack of detailed model-by-model data Brazilrsquos vehicles on average have the highest energy consumption in most weight
37
ICCT white paper
bins with china being the second highest in most bins Because china has higher fuel consumption than Brazil on the 1000 bin which represents the highest share of vehicle sales fleet-average energy consumption in china is still higher than in Brazil as illustrated in the previous figure europe consistently performs best in terms of vehicle energy consumption in most weight bins with japan also performing relatively well
Curb weight (kg)
BrazilChinaEuropeIndiaJapanSouth Korea
Ene
rgy
cons
ump
tio
n C
AF
E (
MJ
km)
Sale
s
40
35
25
20
15
10
6M
8M
4M
2M
0M600 800 1000 1200 1400 1600 1800 2000 2200 2400
Figure 4‑6 ndash international comparison of average vehicle energy consumption by vehicle weight
Type-approval and certification energy consumption data only (does not include off-cycle or real-world driving data)
38
Brazil Passenger Vehicle Market statistics
Figure 4‑7 illustrates the distribution of energy consumption data in Brazil for each vehicle version by mass and segment Bubble sizes represent total sales of each version Data were limited to flex-fuel vehicles in the subcompact compact medium and large segments due to its relatively better data quality and representativeness (ie they represented over 87 of sales in 2013) While most vehicles follow a predictable trend that correlates energy consumption and vehicle mass there are a large number of versions with energy consumption substantially higher than the trend line this suggests there is substantial room for improvements in their energy consumption since there are vehicles in similar weight classes with substantially superior energy consumption performance
Sales1000050000
140
160
180
200
220
240
260
280
700 800 900 1000 1100 1200 1300 1400 1500 1600
Ene
rgy
cons
ump
tio
n (M
Jkm
)
Curb weight (kg)
Subcompact Compact Medium Large Fleet average
Figure 4‑7 ndash Distribution of new Brazilian passenger vehicle energy consumption data by vehicle weight and segment (2013)
this chapter suggests that there are potential improvements in vehicle energy consumption for the Brazilian fleet For similar vehicles in terms of weight class footprint or engine rating there is substantial dispersion in energy consumption indicating that there are vehicles performing much worse than the average across manufacturers there is also a clear trend of some manufacturers performing much better than the average while others have a lot more room for improvement the international comparison clearly shows that Brazilian vehicles perform much worse in terms of energy consumption than vehicles of similar weight suggesting a delay in the adoption of energy efficient technologies among Brazilian vehicle manufacturers
Finally a more detailed analysis of vehicle versions clearly illustrates a considerable number of vehicle versions significantly above average thus indicating potential improvements in energy consumption that would place them on par with better performing vehicles with similar characteristics
39
ICCT white paper
Deficiencies in data quality and completeness prevent more definite conclusions about vehicle energy consumption gasoline-only vehicles in particular have poor energy consumption data quality although they represent a relatively small fraction (6) of total vehicles sold in 2013 Because some vehicle segments are primarily composed of gasoline-only vehicles (eg sports minivans) this chapter excludes these segments from the analysis there are also concerns about the gap between energy consumption data reported by iBaMarsquos nota Verde and Brazilrsquos national institute of Metrology standardization and industrial Qualityrsquos (inMetro) labeling program (PBeV using its acronym in Portuguese) with the latter reporting consistently lower values of vehicle energy consumption
Finally the availability of energy consumption data was not adequate for many manufacturers beyond the top 10 sales group which prevented their inclusion in this analysis Despite the data quality and lack of completeness the energy consumption data in this chapter include data that are reasonably accurate and representative thus supporting its interpretation
40
Brazil Passenger Vehicle Market statistics
rEfErENCES
aDK automotive consultoria de Marketing (2013) relatoacuterios de volumes de vendas do mercado brasileiro para veiacuteculos de passeio e comerciais leves referentes a 2013
alves l Wilbert M (2014) reduccedilatildeo do imposto sobre Produto industrializado e a Venda de automoacuteveis Xi congresso usP iniciaccedilatildeo cientiacutefica em contabilidade
associaccedilatildeo nacional de transportes Puacuteblicos (antP 2014) estudo mostra baixo efeito do desconto no iPi de veiacuteculos sobre PiB e emprego available at httpwwwantporgbrwebsitenoticiasshowaspnpgcode=a4DeeFe8-a7BF-48D3-B1F5-8eDe1447BF10
associaccedilatildeo nacional dos Fabricantes de Veiacuteculos automotores (anFaVea 2015) anuaacuterio da induacutestria automobiliacutestica Brasileira 2015 Brazilian automotive industry Yearbook 2015 satildeo Paulo available at wwwanfaveacombr
european environment agency (2014) Monitoring co2 emissions from new passenger cars in the eu summary of data for 2013 april 2014
instituto Brasileiro do Meio ambiente e dos recursos naturais renovaacuteveis (iBaMa 2014) consulta dos niacuteveis de emissatildeo dos veiacuteculos novos brasileiros available at httpsservicosibamagovbrctfpublicosel_marca_modelo_rvepphp
international council on clean transportation (icct 2015) global passenger vehicle standards available at httpwwwtheicctorginfo-toolsglobal-passenger-vehicle-standards
international energy agency (iea 2015) renewables Bioenergy available at httpswwwieaorgtopicsrenewablessubtopicsbioenergy
Korea energy Management corporation (KeMco 2014) Fuel economy regulation available at httpwwwkemcoorkrnew_engmainmainasp
Marklines (2015) Marklines automotive industry Portal available at httpwwwmarklinescomen
Mendonccedila M sachsida a (2014) Modelando a demanda de creacutedito para veiacuteculos no Brasil uma abordagem com mudanccedila de regime iPea
Ministeacuterio do Desenvolvimento induacutestria e comeacutercio exterior (MDic 2013) Programa de incentivo agrave inovaccedilatildeo tecnoloacutegica e adensamento da cadeia Produtiva de Veiacuteculos automotores mdash inovar-auto httpwwwplanaltogov brccivil_03_ato2011-20142012DecretoD7819htm
stein r anderson j and Wallington t (2013) an overview of the effects of ethanol-gasoline Blends on si engine Performance Fuel efficiency and emissions SAE Int J Engines 6(1)470-487 2013 doi1042712013-01-1635
us environmental Protection agency and national highway traffic safety administration (ePanhtsa 2010) Final rulemaking to establish light-Duty Vehicle greenhouse gas emission standards and corporate average Fuel economy standards ePa-420-r-10-901
us environmental Protection agency (ePa 2012) regulatory impact analysis Final rulemaking for 2017-2025 light-Duty Vehicle greenhouse gas emission standards and corporate average Fuel economy standards ePa-420-r-12-016
41
ICCT white paper
us national academy of sciences (nas 2011) assessment of Fuel economy technologies for light-Duty Vehicles available at httpwwwnapeducatalog12924assessment-of-fuel-economy-technologies-for-light-duty-vehicles
World Bank group (2015) World Development indicators available at httpdataworldbankorgdata-catalogworld-development-indicators
42
Brazil Passenger Vehicle Market statistics
LiST Of ACrONyMS
4wD Four-wheel drive
aNFaVEa Brazilian association of automobile Manufacturers
awD all-wheel drive
BRiC Brazil russia india china
CaFE corporate average fuel economy
CBG compressed biogas
CO2 carbon dioxide
CVT continuously variable transmission
CVVT continuously variable valve technology
DCT Dual-clutch transmission
DOhC Dual overhead camshaft
EC energy consumption
Epa us environmental Protection agency
EU european union
FFV Flex-fuel vehicle
FTp Federal test procedure
FwD Front-wheel drive
GDi gasoline direct injection
GDp gross domestic product
GhG greenhouse gas
GM general Motors
iBaMa Brazilian institute of the environment and renewable natural resources
iC internal combustion
iCCT international council on clean transportation
iNMETRO national institute of Metrology standardization and industrial Quality
Kg Kilogram
Km Kilometer
Kw Kilowatt
LDV light-duty vehicle
LpG liquified petroleum gas
MDiC Ministry of Development industry and Foreign trade
MJ Megajoule
MpFi Multi-point fuel injection
Mpg Miles per gallon
NaS us national academy of sciences
43
ICCT white paper
NhTSa us national highway transportation safety administration
OhV overhead valve
pBEV Brazilian Vehicle labeling Program
pSa Psa Peugeot citroeumln
pTwR Power-to-weight ratio
pV Passenger vehicle
RwD rear-wheel drive
SOhC single overhead camshaft
SUV sport utility vehicle
US united states
USD us dollar
VTEC Valve timing electronic control
VVa Variable valve actuation
VVL Variable valve lift
44
Brazil Passenger Vehicle Market statistics
AppENDix A SEGMENT DEfiNiTiONS
Table a‑1 ndash segment definitions
Segmentpower (kw)
pTwR (kwkg) area (m2)
Other characteristics Examples
Subcompact lt 140 lt 0075 le 65 mdash Mini cooper chevrolet celta smart Fortwo
Compact lt 140 lt 0075 65 lt area le 70 mdash honda Fit hyundai hB20 Volkswagen Polo
Medium lt 140 lt 0075 70 lt area le 80 mdash honda civic nissan tiida Peugeot 308
Large lt 140 lt 0075 gt 80 mdash audi a4 BMW 3 series Mercedes c-class
Sports gt 140 gt 0075 mdash 4 seats maxjaguar XF lamborghini gallardo Ferrari california
Off‑road mdash mdash lt 80 traction = 4WDjeep cherokee honda cr-V BMW X3 hyundai santa Fe
SUV mdash mdash lt 80Based on aDKrsquos default classification
BMW X1 Ford ecosport hyundai tucson
Minivan mdash mdash Passengers 6-12
citroen grand Picasso Kia carnival
45
ICCT white paper
AppENDix b iNTErNATiONAL MArKET DATA
Table B‑1 ndash international market comparison of new fleet characteristics
parameters China S Korea EU US Japan india Brazil
Year 2012 2011 2013 2013 2011 2012 2013
Sales (million) 155 13 118 156 352 256 304
price (USD) $21008 $21383 $24439 mdash $20637 $11717 $22015
No of cylinders mdash 43 40 47 38 36 40
Displacement (cc) 1605 1960 1613 2606 1425 1294 1430
Curb weight (kg) 1296 1421 1391 1623 1193 1059 1106
Length (mm) 4323 4531 4263 mdash 4013 3859 4100
Footprint (m2) 38 420 40 425 371 341 367
Engine power (kw) 86 120 89 148 78 55 76
pTwR (kwkg) 00664 00844 00640 00912 00654 00519 00671
Energy consumption ndash US CaFE (MJKm)[1] 235 206 169 250 171 183 202
[1] energy consumption data presented here for countries other than Brazil were obtained from local official sources in its original metric and drive cycle and then converted to Mjkm under the us caFe drive cycle using the methodology described in Yang (2015) Mode details and historical fuel consumption data on their original metrics is presented in the icctrsquos global PV standard website httpwwwtheicctorginfo-toolsglobal-passenger-vehicle-standards
Data Sources
China Ministry of industry and information technology (Miit 2014) corporate average Fuel efficiency accounting Method for Passenger cars available at httpwwwgovcngzdt2013-0320content_2358627htm
Baseline performance china automotive research and technology center through internal communication and icct internal 2010 database for chinese light-duty vehicles
S Korea internal communication with s Korean official and from greencarcongress available at httpwwwgreencarcongresscom200906korea-20090604html
EU european environment agency (2014) Monitoring co2 emissions from new passenger cars in the eu summary of data for 2013 april 2014
US us ePa (2014) light-duty automotive technology carbon dioxide emissions and fuel economy trends1975 through 2014 table 91 page 110 available at http httpwwwepagovfueleconomyfetrends1975-2014420r14023apdf
Japan jaMa (2010) the Motor industry of japan available at httpwwwjama-englishjppublicationsMVs2010pdf Mlit httpwwwmlitgojpcommon000990330pdf
india Bureau of energy efficiency white paper 2010-2012 calculation based on icct database
Brazil icct Brazil Vehicle Database (2013)
46
Brazil Passenger Vehicle Market statistics
Table B‑2 ndash international market comparison of technology adoption in new vehicles
Technology adoption China S Korea EU US Japan india Brazil
Year 2010 2011 2013 2013 2011 2012 2013
Fuel type
CBGLpGFlex 0 11 2 0 0 4 94
Gasoline 99 65 44 93 86 56 6
hybrid 0 1 1 5 13 0 0
Diesel 1 23 53 1 0 40 0
No of cylinders
Two 0 0 0 0 0 6 0
Three 4 0 7 0 36 28 3
Four 90 84 87 56 57 65 97
Five 0 0 1 0 0 0
Six 6 15 4 32 5 0 1
Eight or more 0 0 0 12 1 0 0
Transmission
Manual 60 3 83 5 1 98 83
automatic 34 90 9 75 34 2 15
CVT 5 7 2 18 65 0 1
DCT 1 0 6 2 mdash 0 1
Number of gear ratios
Four or fewer 13 16 1 7 mdash 10 6
Five 68 9 45 11 mdash 85 83
Six or more 19 75 54 82 mdash 5 11
Drivetrain
FwD 74 86 81 83 59 76 0
RwD 21 7 7 10 5 22 0
4wD and awD 5 7 12 7 36 2 100
No of valves per cylinder
Two 17 mdash mdash 2 4 25 60
Multi valve 83 mdash mdash 98 95 75 40
Valve camshaft configuration
Single overhead camshaft 26 1 mdash mdash 16 41 63
Dual overhead camshaft 74 84 mdash mdash 82 53 25
Overhead camshaft mdash 15 mdash mdash 0 6 mdash
Valve actuation
Fixed 50 16 mdash 2 11 86 78
VVT 44 84 mdash 98 89 12 16
VVL 6 mdash mdash mdash mdash 2 6
Fuel systems for gasoline vehicles
Multi‑point fuel injection 94 72 68 62 95 100 98
Gasoline direct injection 6 28 32 37 5 0 2
air induction systems for gasoline vehicles
Naturally aspirated 93 75 41 85 92 64 97
Supercharger turbocharger or twin‑turbo 7 25 59 15 8 36 3
47
ICCT white paper
AppENDix C NEW vEhiCLE ChArACTEriSTiCS AND TEChNOLOGy ADOpTiON DATA iN brAziL
Table C‑1 ndash Fleet characteristics of new Brazilian passenger vehicles by segment (2013)
parameters Subcompact Compact Medium Large Sports Off‑road SUV Minivan
Sales (thousands) 6785 6843 11790 1920 273 768 1997 23
Market share () 223 225 38 8 63 09 25 65 01
price (R$) $30103 $38732 $45496 $66508 $148834 $151284 $75164 $82284
No of cylinders 400 391 399 400 462 448 404 433
Displacement (cc) 1128 1293 1447 1794 2430 2586 1884 2244
Curb weight (kg) 940 1037 1102 1329 1561 1772 1395 1604
Length (mm) 3804 4026 4163 4499 4711 4516 4352 4658
Footprint (m2) 339 361 371 402 418 409 402 427
Engine power ndash gasoline (kw) 58 68 75 99 183 146 103 120
Engine power ndash ethanol (kw) 59 70 77 98 mdash 109 101 mdash
pTwR ndash gasoline (kwkg) 00614 00655 00671 00742 01173 00828 00731 00732
pTwR ndash ethanol (kwkg) 00630 00678 00697 00757 mdash 00766 00745 mdash
48
Brazil Passenger Vehicle Market statistics
Table C‑2 ndash Fleet characteristics of new Brazilian passenger vehicles by manufacturer (2013)
parameters Fiat
GM
Vo
lksw
agen
Ford
Ren
ault
hyu
ndai
ho
nda
Toyo
ta
pSa
Nis
san
Mit
sub
ishi
Kia
JaC
BM
w
Land
Rov
er
Mer
ced
es‑B
enz
Che
ry
aud
i
Suzu
ki
Jeep
Sales (thousands) 6087 5486 5448 3074 2207 2055 1392 1334 1163 621 368 255 158 141 106 94 80 67 63 36
Market share () 2002 1804 1792 1011 726 676 458 439 383 204 121 084 052 046 035 031 026 022 021 012
price (R$) $35017 $42259 $38701 $46174 $43447 $50112 $67078 $68922 $103001 $44035 $100696 $87009 $37654 $165111 $221943 $153281 $30821 $142799 $74769 $139039
No of cylinders 400 401 400 402 400 370 400 400 400 400 408 416 400 424 448 431 400 411 400 552
Displacement (cc) 1250 1340 1287 1497 1423 1495 1691 1808 1575 1579 2262 1856 1411 2095 2281 1934 1398 1912 1831 3182
Curb weight (kg) 1033 1060 1020 1156 1102 1122 1210 1201 1231 1069 1556 1377 1079 1624 1868 1598 1097 1551 1444 1945
Length (mm) 3965 4155 3993 4120 4127 4078 4319 4299 4116 4171 4401 4357 3956 4574 4487 4527 3896 4454 4234 4584
Footprint (m2) 345 370 354 368 378 383 397 387 376 379 395 407 351 429 433 429 349 417 323 420
Engine power ndash gasoline (kw) 64 71 65 79 73 86 96 90 80 82 120 112 83 151 179 138 71 136 94 162
Engine power ndash ethanol (kw) 65 72 65 79 76 85 97 90 81 82 107 106 95 mdash mdash mdash 75 mdash mdash mdash
pTwR ndash gasoline (kwkg)
00613 00662 00631 00674 00657 00739 00788 00745 00646 00766 00779 00792 00784 00921 00977 00856 00638 00870 00649 00835
pTwR ndash ethanol (kwkg) 00629 00681 00642 00693 00685 00781 00800 00795 00660 00768 00710 00798 00896 mdash mdash mdash 00659 mdash mdash mdash
49
ICCT white paper
Table C‑3 ndash Fleet characteristics of new Brazilian passenger vehicles by origin (2013)
parameters Domestic imported
Sales (thousands) 2537 504
Market share () 834 166
price (R$) $41739 $76049
No of cylinders 397 412
Displacement (cc) 1359 1791
Curb weight (kg) 1070 1289
Length (mm) 4063 4285
Footprint (m2) 362 390
Engine power ndash gasoline (kw) 70 102
Engine power ndash ethanol (kw) 73 84
pTwR ndash gasoline (kwkg) 0065 0076
pTwR ndash ethanol (kwkg) 0068 0074
50
Brazil Passenger Vehicle Market statistics
Table C‑4 ndash technology adoption in new Brazilian passenger vehicles by segment (2013)
Technology adoption Subcompact Compact Medium Large SportOff‑road SUV Minivan
Fuel type
Flex 982 988 982 837 00 134 826 00
Gasoline 18 12 17 163 996 540 174 1000
hybrid 0000 0000 0028 0000 0396 0001 0000 0000
Diesel 00 00 00 00 00 326 00 00
No of cylinders
Three 01 91 10 00 00 00 00 00
Four 999 909 990 998 758 775 979 833
Five 00 00 00 02 03 00 00 00
Six 00 00 00 00 175 211 21 167
Eight or more 00 00 00 00 63 13 00 00
Transmission
Manual 993 944 826 622 62 174 505 641
automatic 07 55 161 283 629 707 451 359
CVT 00 00 12 89 09 93 34 00
DCT 00 01 02 06 299 25 10 00
No of gear ratios
Four or fewer 04 47 72 51 00 34 247 193
Five 984 943 848 378 15 392 516 641
Six 12 09 73 515 796 462 225 167
Seven 00 01 06 23 87 53 12 00
Eight or more 00 00 01 32 102 59 00 00
Drivetrain
FwD 998 1000 997 688 550 00 916 1000
RwD 02 00 03 311 221 00 84 00
awD 00 00 00 01 229 1000 00 00
No of valves per cylinder
Two 806 694 584 195 00 00 258 00
Multi valve 194 306 416 805 1000 1000 742 1000
Valve camshaft configuration
Single overhead camshaft 839 786 709 309 00 212 375 00
Dual overhead camshaft 24 158 161 546 880 517 446 255
Valve actuation
Fixed 982 729 807 461 49 493 664 868
VVT 18 211 115 470 827 367 252 132
VVT+VVL 00 61 78 68 124 140 84 00
Fuel systems for gasoline vehicles
Multi‑point fuel injection 999 998 997 949 979 143 766 1000
Gasoline direct injection 01 02 03 51 21 857 234 00
air induction systems for gasoline vehicles
Naturally aspirated 999 997 995 943 974 369 543 1000
Supercharger turbocharger or twin‑turbo 01 03 05 57 26 631 457 00
51
ICCT white paper
Table C‑5 ndash technology adoption in new Brazilian passenger vehicles by manufacturer (2013)
Technology adoption Fi
aT
GM
VO
LKSw
aG
EN
FOR
D
REN
aU
LT
hY
UN
Da
i
hO
ND
a
TOYO
Ta
pSa
NiS
SaN
MiT
SUB
iSh
i
Kia
JaC
BM
w
LaN
D R
OV
ER
MER
CED
ES
Fuel type
Flex 990 987 965 966 997 921 999 886 928 998 283 739 31 42 00 00
Gasoline 10 09 35 34 03 79 01 35 72 02 557 255 969 957 663 950
hybrid 00 00 00 00 00 00 00 02 00 00 00 00 00 00 00 00
Diesel 00 04 00 00 00 00 00 77 00 00 160 06 00 00 337 50
No of cylinders
Three 00 00 05 00 00 348 00 00 00 00 00 00 00 00 00 00
Four 1000 996 994 989 1000 626 999 998 1000 1000 958 922 1000 906 787 878
Five 00 00 00 00 00 00 00 00 00 00 00 00 00 00 00 00
Six 00 02 01 11 00 26 01 02 00 00 42 78 00 68 185 87
Eight or more 00 02 00 00 00 00 00 00 00 00 00 00 00 26 28 35
Transmission
Manual 992 878 985 846 853 632 566 565 703 785 493 120 1000 02 00 151
automatic 08 103 00 137 62 285 355 160 297 121 118 793 00 575 18 14
CVT 00 19 15 16 41 70 01 246 00 00 139 87 00 423 982 836
DCT 00 00 00 00 43 13 78 30 00 94 251 00 00 00 00 00
No of gear ratios
Four or fewer 02 04 00 55 104 237 00 323 249 132 17 133 00 00 00 00
Five 981 811 963 839 797 623 861 643 684 828 530 107 1000 00 00 64
Six 17 185 29 106 99 140 139 07 67 40 453 754 00 217 800 00
Seven 00 00 07 00 00 00 00 27 00 00 00 00 00 08 00 936
Eight or more 00 00 00 00 00 00 00 00 00 00 00 06 00 775 200 00
Drivetrain
FwD 1000 902 989 972 987 985 990 892 1000 1000 496 623 1000 00 00 00
RwD 00 91 00 00 00 00 00 16 00 00 00 370 00 882 00 900
awD 00 06 11 28 13 15 10 92 00 00 504 07 00 118 1000 100
No of valves per cylinder
Two 811 864 988 745 220 00 00 00 00 00 00 00 00 00 00 00
Multi Valve 189 136 12 255 780 1000 1000 1000 1000 1000 1000 1000 1000 1000 1000 1000
Valve camshaft configuration
SOhC 836 755 914 675 832 00 04 00 497 398 331 00 00 00 00 00
DOhC 07 108 56 50 168 992 786 875 352 428 477 1000 907 810 860 453
Valve actuation
Fixed 1000 898 965 966 940 29 00 574 736 573 435 76 124 187 18 55
VVT 00 102 35 34 60 971 00 426 264 427 00 924 876 00 982 945
VVT+VVL 00 00 00 00 00 00 1000 00 00 00 565 00 00 813 00 00
air induction System
Naturally aspirated 997 994 966 977 997 988 1000 923 922 1000 835 936 1000 97 37 101
Supercharger turbocharger or twin‑turbo
03 06 34 23 03 12 00 77 78 00 165 64 00 903 963 899
Fuel systems for gasoline vehicles
Multipoint fuel injection 1000 995 965 972 1000 989 1000 1000 967 1000 994 1000 1000 78 15 158
Gasoline Direct injection 00 05 35 28 00 11 00 00 33 00 06 00 00 922 985 842
note Difference between 100 and summation of sohc and Dohc market share values corresponds to data not available
52
Brazil Passenger Vehicle Market statistics
AppENDix D DATA SOurCES AND COMpLETENESS
the basis of the statistics shown in this report is a database compiled by the icct with vehicle sales technical information (eg fleet characteristics technology content) and energy consumption (converted from either co2 emissions or fuel economy) from various data sources outlined in table D-1
Table D‑1 ndash Brazilian data sources
parameters Sales TechnicalEnergy
consumption
aDK (2014 2015) x x
MarkLines (2015) x
iBaMa (2014) x
iNMETRO (2014) x
UOL (2014) x
icarroscom (2014) x
this analysis examined energy consumption data from two public sources the nota Verde Program by the Brazilian institute of the environment and renewable natural resources (iBaMa) and the Brazilian Vehicle labeling Program (PBeV) by the national institute of Metrology standardization and industrial Quality (inMetro) table D-2 summarizes key differences between these two data sources
Table D‑2 ndash energy consumption data sources
iBaMa iNMETRO
program nota Verde1 Brazilian Vehicle labeling Program (PBeV)2
program description
Mandatory program that reports emissions of co2 co nox and nMhc as part of emissions certification program
Voluntary program since 2009 that allows the comparison of fuel economy across vehicle models
Unit gco2 km kml
Test cycle chassis testing under urban (FtP) driving cycle based on nBr 66012005
chassis testing under urban (FtP) and highway (hWYFe) driving cycles based on nBr 702420103
adjustment
no adjustment for real-world driving conditions Because reported co2 emissions are assumed to be zero for ethanol adjustments were made to account for tailpipe co2 emissions for vehicles running on ethanol
since 2010 published values include real-world adjustment factors to chassis test data a method adopted by the us ePa in 2008
Conversion to MJkm
iBaMarsquos data are reported as FtP (city test) co2 data in gco2 km conversion to caFe test cycle and to a different metric (Mjkm) involves four steps as presented in Figure D-1
inMetrorsquos data in kml are presented separately by fuel type (e22 e100) and driving cycle (urban highway) conversion to Mjkm was done by applying a conversion factor (2167 gco2 l for e22 and 1428gco2l for e00) caFe values are obtained by using a 5545 weighting for the urban (FtP) and highway cycles respectively
1 iBaMa (2014) nota Verde program available at httpwwwmmagovbrcidades-sustentaveisqualidade-do-arcontrole-de-emissoes-veicularesnota-verde
2 inMetro (2014) Programa Brasileiro de etiquetagem Veicular (PBeV) available at httpwwwinmetrogovbrconsumidortabelas_pbe_veicularasp
3 inMetro (2014) Metodologia Para Divulgaccedilatildeo De Dados De consumo Veicular available at httpwwwinmetrogovbrconsumidorpbeMetodologia_consumo_Veicularpdf
53
ICCT white paper
Step 1 Correcting the original IBAMA CO2 reported data ndash FTP CO2 gkm
IBAMArsquos CO2 reported values are corrected to account for tailpipe emissions from ethanol (tailpipe CO2 emissions are reported as zero in IBAMArsquos data)
bull E22 FTP reported CO2 data are reduced by 177bull E100 FTP reported CO2 data are reduced by 100
Flex fuel vehicles are tested with E22 and E00 the final values is calculated as the average of both fuelsCO2 IBAMA_Flex_FTP= 05(1-0177)CO2_E22_test_FTP + 050E100_FTP = 050823CO2_E22_FTPFor Gasoline only vehicles the tests are carried out only with Gasoline E22CO2 IBAMA_Gasoline_FTP = (1-0177) CO2_E22_Test_FTP
Where in the previous equations CO2_E22_FTP means CO2 emissions values obtained under FTP testingCO2 IBAMA_Flex_FTP means IBAMArsquos Corrected FTP values for flex vehiclesCO2 IBAMA_Gasoline_FTP means IBAMArsquos Corrected FTP values for gasoline only (E22) vehicles
INNOVAR AUTO is based on energy consumption data obtained as the combined CAFE test cycle This requires a weighted average of energy consumption data obtained from FTP testing (city driving ) and Highway fuel economy testing (HWFET) In mathematical form CAFE=f(FTPHWFET)
Given that IBAMA data is provided for only the first aprt the FTP testing then it is required to find a way to calculate CAFE combined values through FTP -75 only data A linear function was thus developed from data with FTP and HWY values (INMETRO data) is used to convert FTP only values to CAFE CO2 values ie CAFE=f(FTP) The function used for this conversion is
CO2_CAFE= (CO2_FTP+44756)11572
Step 2Convert FTP CO2 values to CAFE CO2 values
Converting CO2 values to MJkm values is done by using the energy density of E22 Note that all the previous calculations for CO2 come from E22-based data
bull The energy density of E22 is 2894 MJLE22bull E22 emits 2167gCO2LE22bull CAFE (MJkm) = CAFE (gCO2km) (2894 MJLE22 2167 gCO2LE22)
Step 3 Convert US CAFE CO2 values to MJkm values
Figure D‑1 ndash conversion of emission to energy consumption data
energy consumption values calculated from iBaMa and inMetro data differ greatly Figure D-1 illustrates energy consumption data for those models in both databases iBaMa data are on average 126 higher than inMetro data with a standard deviation of 89 and a maximum deviation of 39
54
Brazil Passenger Vehicle Market statistics
0
05
1
15
2
25
3
0 05 1 15 2 25 3
Ene
rgy
cons
ump
tio
n IB
AM
A (
MJ
km)
Energy consumption INMETRO (MJkm)
n=151
Figure D‑2 ndash comparison between energy consumption data from inMetro and iBaMa
151 vehicles tested under both programs
although inMetro data are more transparent as it breaks down fuel economy by fuel and test cycle it is still a voluntary program that allows manufacturers to select which models will participate in addition not all manufacturers participate in the program in turn iBaMa data only include co2 data for the urban cycle and thus energy consumption in the combined cycle had to be estimated from correlations using international data in addition corrections had to be made for gasoline-only engines since it seems that a co2 discount in theory only applicable to flex-fuel engines was also applied to gasoline-only engines Despite these data quality issues iBaMa data were considered the most adequate data source for energy consumption because it is a mandatory program that requires data reporting by all vehicle models and manufacturers
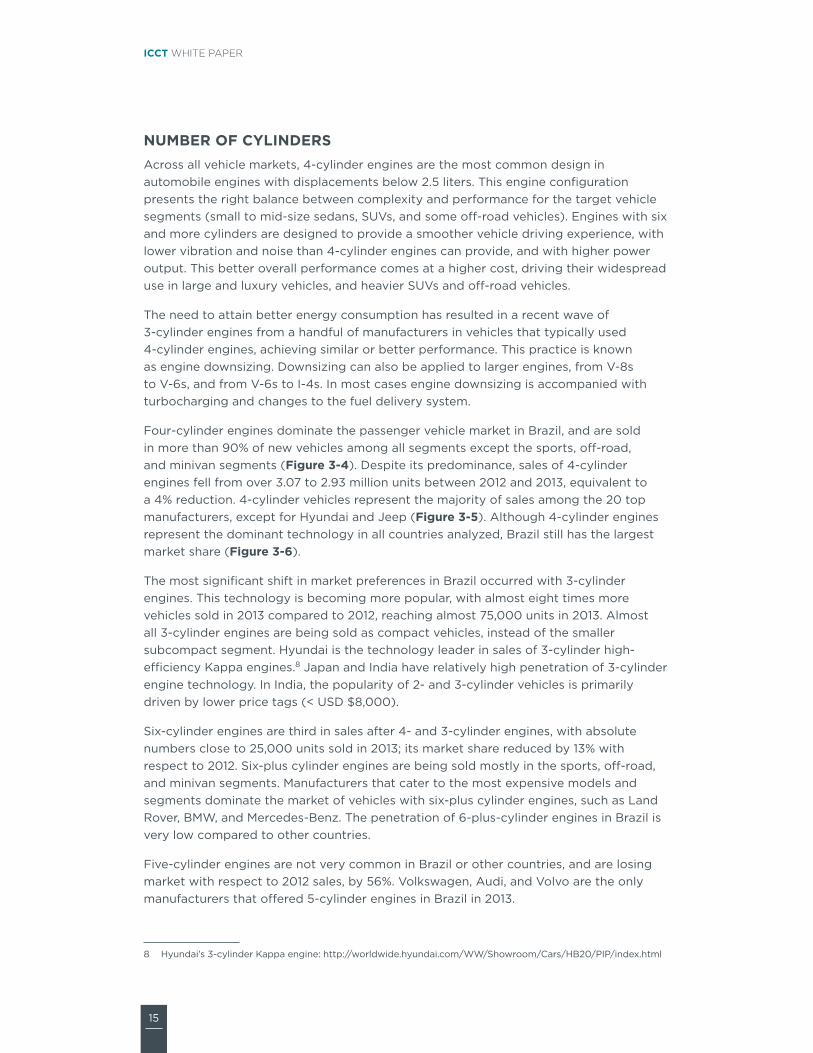
15
ICCT white paper
NUMBER OF CYLiNDERSacross all vehicle markets 4-cylinder engines are the most common design in automobile engines with displacements below 25 liters this engine configuration presents the right balance between complexity and performance for the target vehicle segments (small to mid-size sedans suVs and some off-road vehicles) engines with six and more cylinders are designed to provide a smoother vehicle driving experience with lower vibration and noise than 4-cylinder engines can provide and with higher power output this better overall performance comes at a higher cost driving their widespread use in large and luxury vehicles and heavier suVs and off-road vehicles
the need to attain better energy consumption has resulted in a recent wave of 3-cylinder engines from a handful of manufacturers in vehicles that typically used 4-cylinder engines achieving similar or better performance this practice is known as engine downsizing Downsizing can also be applied to larger engines from V-8s to V-6s and from V-6s to i-4s in most cases engine downsizing is accompanied with turbocharging and changes to the fuel delivery system
Four-cylinder engines dominate the passenger vehicle market in Brazil and are sold in more than 90 of new vehicles among all segments except the sports off-road and minivan segments (Figure 3‑4) Despite its predominance sales of 4-cylinder engines fell from over 307 to 293 million units between 2012 and 2013 equivalent to a 4 reduction 4-cylinder vehicles represent the majority of sales among the 20 top manufacturers except for hyundai and jeep (Figure 3‑5) although 4-cylinder engines represent the dominant technology in all countries analyzed Brazil still has the largest market share (Figure 3‑6)
the most significant shift in market preferences in Brazil occurred with 3-cylinder engines this technology is becoming more popular with almost eight times more vehicles sold in 2013 compared to 2012 reaching almost 75000 units in 2013 almost all 3-cylinder engines are being sold as compact vehicles instead of the smaller subcompact segment hyundai is the technology leader in sales of 3-cylinder high-efficiency Kappa engines8 japan and india have relatively high penetration of 3-cylinder engine technology in india the popularity of 2- and 3-cylinder vehicles is primarily driven by lower price tags (lt usD $8000)
six-cylinder engines are third in sales after 4- and 3-cylinder engines with absolute numbers close to 25000 units sold in 2013 its market share reduced by 13 with respect to 2012 six-plus cylinder engines are being sold mostly in the sports off-road and minivan segments Manufacturers that cater to the most expensive models and segments dominate the market of vehicles with six-plus cylinder engines such as land rover BMW and Mercedes-Benz the penetration of 6-plus-cylinder engines in Brazil is very low compared to other countries
Five-cylinder engines are not very common in Brazil or other countries and are losing market with respect to 2012 sales by 56 Volkswagen audi and Volvo are the only manufacturers that offered 5-cylinder engines in Brazil in 2013
8 hyundairsquos 3-cylinder Kappa engine httpworldwidehyundaicomWWshowroomcarshB20PiPindexhtml
16
Brazil Passenger Vehicle Market statistics
0
10
20
30
40
50
60
70
80
90
100
Subco
mpac
t
Compac
t
Medium
Larg
eSport
O-Road SUV
Miniva
nTo
tal
Tech
nolo
gy
shar
e
8+ 6 5 4 3
Figure 3‑4 ndash number of cylinders by segment
0102030405060708090
100
Fiat GM
Volkswag
enFord
Renau
lt
Hyund
ai
Honda
Toyo
taPSA
Nissan
Mitsub
ishi
KIAJA
CBMW
Land
Rove
r
Merce
des-B
enz
Chery
Audi
Suzuk
iJe
epTo
tal
Tech
nolo
gy
shar
e
8+ 6 5 4 3
Figure 3‑5 ndash number of cylinders by manufacturer
0
10
20
30
40
50
60
70
80
90
100
China2010
Korea2011
EU-272013
US2013
Japan2011
India2012
Brazil2013
Tec
hno
log
y sh
are
8+ 6 5 4 3 2
Figure 3‑6 ndash number of cylinders international comparison
17
ICCT white paper
TRaNSMiSSiONtransmission technologies can reduce energy consumption in two ways First by allowing engine operation on a more efficient region of the engine map and second by reducing the mechanical losses within transmissions traditionally manual transmissions have offered better energy consumption than traditional automatic transmissions (with 4 or 5 speeds) due to lower friction losses however new generation of automatic transmissions with higher number of gears lower friction better materials and computer-controlled shift points have not just closed the gap between manual and automatic transmission performance but even exceed manual transmission performance
new technologies such as dual-clutch transmissions (Dcts) and continually variable transmissions (cVts) are gaining market share due to the need for lower vehicle energy consumption Dcts can be defined as manual transmissions with electro-hydraulically operated dual-clutch systems allowing for faster shifting times and selective automatic or ldquomanualrdquo operation as opposed to manual automatic and Dct transmissions which have a discrete number of gear ratios cVts have a theoretically infinite choice of ratios between fixed limits which allows engines to be further optimized for minimizing energy consumption cVt technology has been used in lower-horsepower vehicles because of maximum-torque limitations with the most common metal-belt design (nas 2011) these advanced transmission technologies offer significant benefits in energy consumption compared to traditional manual or automatic technologies according to the us national academy of sciences a 6-speed Dct provides 6 to 9 lower energy consumption than a 4-speed automatic transmission note that a traditional 6-speed automatic transmission provides an estimated 3 to 5 benefit the energy consumption benefit of cVt depends on the application and is estimated to be 1 to 7 (nas 2011)
although vehicle sales with manual transmissions are predominant in Brazil the penetration of automatic transmissions cVts and Dcts is increasing resulting in a market share loss for manual transmissions of about 6 between 2012 and 2013 (Table 3‑1) With the exception of sports and off-road segments manual transmission technology has the largest market share in all segments but it tends to become less predominant as vehicles grow in size and comfort level (Figure 3‑7) the top five manufacturers sell most of their vehicles with manual transmissions but their market share is somewhat smaller for other high-selling manufacturers that cater to a more affluent market (Figures 3‑8)
automatic transmissions are becoming increasingly popular in Brazil experiencing an increase of 28 in sales between 2012 and 2013 automatic transmissions dominate the sports and off-road segments Kia BMW land rover Mercedes-Benz and jeep adopt this type of transmission technology for most of their vehicle sales
Dct transmissions are entering the Brazilian market mostly through the sports segment via imported models the sales of Dct equipped vehicles increased in 2013 by 22 with respect to 2012 Dct technology is being offered mainly by manufacturers that sell sports vehicles such as audi in more than 67 of their vehicles and Mercedes-Benz in more than 15 of their vehicles the global leader in Dct adoption is europe followed by the us (Figure 3‑9)
cVt technology market is still relatively small being sold by small volume manufacturers like jeep audi and Mitsubishi with more than 25 of new vehicle sales each nissan renault honda and toyota also sell vehicles with cVt technology cVt penetration in Brazil is similar to europersquos cVt is the leading transmission technology in japan with more than 65 of the market
18
Brazil Passenger Vehicle Market statistics
0
10
20
30
40
50
60
70
80
90
100
Subco
mpac
t
Compac
t
Medium
Larg
eSport
O-Road SUV
Miniva
nTo
tal
Tech
nolo
gy
shar
e
DCT CVT Automatic Manual
Figure 3‑7 ndash transmission by segment
0
10
20
30
40
50
60
70
80
90
100
Fiat GM
Volkswag
enFord
Renau
lt
Hyund
ai
Honda
Toyo
taPSA
Nissan
Mitsub
ishi
KIAJA
CBMW
Land
Rove
r
Merce
des-B
enz
Chery
Audi
Suzuk
iJe
epTo
tal
Tech
nolo
gy
shar
e
DCT CVT Automatic Manual
Figure 3‑8 ndash transmission by manufacturer
0
10
20
30
40
50
60
70
80
90
100
China2010
Korea2011
EU-272013
US2013
Japan2011
India2012
Brazil2013
Tech
nolo
gy
shar
e
DCT CVT Automatic Manual
Figure 3‑9 ndash transmission international comparison
19
ICCT white paper
NUMBER OF GEaR RaTiOS as mentioned in the previous section increasing the number of gear ratios (whether manual automatic dual-clutch or continuously variable) allows the engine to be operated in the best efficiency region resulting in energy consumption benefits compared to an automatic four-gear ratio transmission (also known as 4-speed transmission) higher ratio automatic transmissions could reduce energy consumption from 2 to 3 (for a five-gear ratio) to 6 to 8 (for an eight-gear ratio) (ePanhtsa 2010)
Four-gear ratio transmissions are losing market share in Brazil by more than 5 between 2012 and 2013 (Table 3‑1) these transmissions are particularly high sellers in the suV and minivan segments which suggest that some models in these more expensive segments are being sold with outdated technologies (Figure 3‑10) Most manufacturers are phasing out this type of transmission (Figure 3‑11) although jeep suzuki and toyota are lagging behind other manufacturers the four-gear ratio transmission technology has been losing market share in most countries even in india where smaller and inexpensive cars dominate the market 4-speed transmissions have the smallest market share (Figure 3‑12)
Five- and six-gear ratio transmissions were predominant in the Brazilian market in 2013 Five-gear ratio transmissions are dominant in all segments except for the off-road and sports segments which have adopted six-gear ratio transmissions in most sales the significant market share of five- and six-gear ratio transmissions is similar to most countries although the us europe and south Korea show higher shares of six and more gear ratios
seven- and eight-gear ratio transmissions which are considered emerging technologies have experienced an increase in sales in Brazil with over twice as many sales in 2013 compared to 2012 seven- and eight-gear ratio transmissions are popular among the large sports and off-road segments all of which are imported models luxury manufacturers such as Mercedes-Benz and audi are selling the most seven-gear vehicles as a share of their sales Volkswagen and toyota are also selling similar numbers of seven-gear ratio vehicles although for Volkswagen and toyota it represented less than 3 of their brand sales BMW and land rover are the leaders in eight-gear ratio vehicles
20
Brazil Passenger Vehicle Market statistics
0
10
20
30
40
50
60
70
80
90
100
Subco
mpac
t
Compac
t
Medium
Larg
eSport
O-Road
SUV
Miniva
nTo
tal
Tech
nolo
gy
shar
e
8 7 6 5 4
Figure 3‑10 ndash number of gear ratios by segment
0
10
20
30
40
50
60
70
80
90
100
Fiat GM
Volkswag
enFord
Renau
lt
Hyund
ai
Honda
Toyo
taPSA
Nissan
Mitsub
ishi
KIAJA
CBMW
Land
Rove
r
Merce
des-B
enz
Chery
Audi
Suzuk
iJe
epTo
tal
Tech
nolo
gy
shar
e
8 7 6 5 4
Figure 3‑11 ndash number of gear ratios by manufacturer
0
10
20
30
40
50
60
70
80
90
100
Tech
nolo
gy
shar
e
Six or more Five Four or fewer
China2010
Korea2011
EU-272013
US2013
India2012
Brazil2013
Figure 3‑12 ndash number of gear ratios international comparison
21
ICCT white paper
DRiVETRaiNDrivetrain technology includes front-wheel drive (FWD) rear-wheel drive (rWD) and all-wheel drive (aWD) vehicles For the same vehicle size FWD vehicles provide more interior space and better energy consumption than rWDs due to lower weight as it avoids the added weight of and space for the driveshaft and differential that rWD requires Because the weight of the engine and transmission is located close to the wheels FWD vehicles have better traction than rWDs rWDs however show better handling as the weight distribution between the front and rear wheels is more uniform and the tasks of turning and acceleration are split between the front and rear wheels also directing large amounts of power through the front wheels can create ldquotorque steerrdquo thus rWD is the adequate technology for the sports segment aWD drivetrains are intended for specific driving applications that imply loss of traction such as off-road terrains snow or towing
FWD vehicles dominate all segments of the Brazilian passenger car market (Table 3‑1) with the exception of the off-road segment (Figure 3‑13) among the 20 largest manufacturer sellers most except for BMW land rover Mercedes-Benz and suzuki offer FWD technology (Figure 3‑14) Brazil has the highest market share of FWD vehicles of all countries analyzed (944) although FWD has at least 50 market share in all seven countries (Figure 3‑15)
aWD market share increased by 15 between 2012 and 2013 due to a tri-fold increase in the sports segment sales off-road vehicle sales with aWD also increased to more than 76000 units in 2013 amongst the largest ten manufacturers toyota is the aWD market leader followed by Ford and Volkswagen note that land rover sells only aWD vehicles in Brazil among non-luxury manufacturers Mitsubishi and suzuki are selling more than 50 of their vehicles with aWD technology
rWD technology is offered mostly in large and sports vehicles and in suVs among the 10 largest manufacturers rWD is offered mainly by gM and toyota while an extended examination of the 20 largest manufacturers by sales show that aWD and rWD is focused among the more expensive brands (Figure 3‑14) Mercedes-Benz and BMW sell close to 90 of their vehicles with rWD technology traditionally associated with engine performance and responsiveness
22
Brazil Passenger Vehicle Market statistics
0
10
20
30
40
50
60
70
80
90
100
Subco
mpac
t
Compac
t
Medium
Larg
eSport
O-Road SUV
Miniva
nTo
tal
Tehn
olo
gy
shar
e
AWD RWD FWD
Figure 3‑13 ndash Drivetrain by segment
0
10
20
30
40
50
60
70
80
90
100
Fiat GM
Volkswag
enFord
Renau
lt
Hyund
ai
Honda
Toyo
taPSA
Nissan
Mitsub
ishi
KIAJA
CBMW
Land
Rove
r
Merce
des-B
enz
Chery
Audi
Suzuk
iJe
epTo
tal
Tech
nolo
gy
shar
e
AWD RWD FWD
Figure 3‑14 ndash Drivetrain by manufacturer
0
10
20
30
40
50
60
70
80
90
100
China2010
Korea2011
EU-272013
US2013
Japan2011
India2012
Brazil2013
Tech
nolo
gy
shar
e
AWD RWD FWD
Figure 3‑15 ndash Drivetrain international comparison
23
ICCT white paper
VaLVE CaMShaFT CONFiGURaTiON (DOhC VS SOhC)the engine camshaft governs the timing duration and lift of valve operation controlling the intake of air and the exhaust of combustion gases this report focuses on single overhead camshafts (sohc) and dual overhead camshafts (Dohc) as these configurations have almost completely replaced the older overhead valve configuration (ohV) sohc design places a single camshaft above the cylinder head that governs all the valves intake and exhaust in the case of sohc V-engines there is one single camshaft per head Dohc designs use separate camshafts for intake valves and exhaust valves Dohc engines achieve increased airflow at high-engine speeds improve volumetric efficiency and reduce the valvetrainrsquos moving mass such engines typically develop higher power at high-engine speeds the us environmental Protection agency (ePa) and national highway traffic safety administration (nhtsa) estimate the effectiveness of Dohc over sohc to be between 1 and 25 (ePanhtsa 2010)
although Dohc produce more power and provide lower fuel consumption the Brazilian fleet is still mostly composed of sohcs vehicles (Table 3‑1) sohc technology is predominant among the subcompact compact and medium segments (Figure 3‑16) among manufacturers sohc technology is predominant among the five largest least expensive brands (Figure 3‑17) sales of vehicles with more advanced Dohc technology grew in 2013 by almost 36 with respect to 2012 albeit from a relatively smaller base this increase was experienced in all vehicle segments but in different magnitudes
although global data on this technology are scarce Figure 3‑18 indicates that most countries are moving away from sohc with Brazil being the only country analyzed where sohc is still predominant no data were available for the us or europe
24
Brazil Passenger Vehicle Market statistics
0
10
20
30
40
50
60
70
80
90
100
Subco
mpac
t
Compac
t
Medium
Larg
eSport
O-Road SUV
Miniva
nTo
tal
Tech
nolo
gy
shar
e
nd DOHC SOHC
Figure 3‑16 ndash Valve camshaft configuration by segment (nd no data)
0
10
20
30
40
50
60
70
80
90
100
Fiat GM
Volkswag
enFord
Renau
lt
Hyund
ai
Honda
Toyo
taPSA
Nissan
Mitsub
ishi
KIAJA
CBMW
Land
Rove
r
Merce
des-B
enz
Chery
Audi
Suzuk
iJe
epTo
tal
Tech
nolo
gy
shar
e
nd DOHC SOHC
Figure 3‑17 ndash Valve camshaft configuration by manufacturer (nd no data)
0
10
20
30
40
50
60
70
80
90
100
China2010
Korea2011
Japan2011
India2012
Brazil2013
Tech
nolo
gy
shar
e
nd OVC DOHC SOHC
Figure 3‑18 ndash Valve camshaft configuration international comparison (nd no data)
25
ICCT white paper
VaLVE aCTUaTiON improved valvetrain systems with variable valve actuation (VVa) technology either variable valve timing (VVt) or variable valve timing and lift (VVt+VVl) improves the enginersquos volumetric and thermodynamic efficiency they also enable further engine improvements such as internal exhaust gas recirculation and cylinder deactivation VVt alters the timing of the intake valve exhaust valve or both primarily to reduce pumping losses increase specific power and control residual exhaust gases VVl increases efficiency by optimizing airflow over a broader range of engine operation which reduces pumping losses and increases specific power VVl is accomplished by controlled switching between two or more cam profile lobe heights the most advanced technology VVt+VVl yields a wide range of performance optimization and volumetric efficiency including enabling the engine to be valve-throttled (no need for intake throttle) VVt provides energy consumption gains of 3 to 5 while the more flexible and complex VVt+VVl system can reach 4 to 8 (ePa amp nhtsa 2010)
VVa technology either VVt or VVt+VVl are emerging technologies in Brazil where most vehicles still have fixed-valve timing designs (Table 3‑1) Fixed technology is predominant among the smaller vehicle segments as well as suVs and minivans (Figure 3‑19) the five largest manufacturers sold more than 90 of their vehicles with fixed-valve technology in 2013 (Figure 3‑20) the international comparison indicates that only Brazil and india have not yet adopted VVa technologies for most of their light-duty fleet (Figure 3‑21)
VVt and VVt+VVl are being adopted across all segments including the subcompact segment but tend to be more predominant in high-end manufacturers a closer examination by manufacturer shows that most are offering some vehicles with either one of the VVa systems while honda and hyundai offer this technology in almost all vehicles (Figure 3‑20) honda is the technology leader in variable valve actuation with the adoption in the early 1990s of the Vtec system (Valve timing electronic control) VVt technologyrsquos market share grew by about 25 in 2013 primarily due to hyundairsquos sales from 80000 units in 2012 to almost 200000 units in 2013 hyundai offered the continuously variable valve technology (cVVt) in the large majority of vehicle sold in 2013 the sports segment is the one where VVt dominates the market Mitsubishi BMW and audi are also selling a large share of their vehicles with the VVt+VVl technology
26
Brazil Passenger Vehicle Market statistics
0
10
20
30
40
50
60
70
80
90
100
Subco
mpac
t
Compac
t
Medium
Larg
eSport
O-Road SUV
Miniva
nTo
tal
Tech
nolo
gy
shar
e
VVT+VVL VVT Fixed
Figure 3‑19 ndash Valve actuation by segment
0
10
20
30
40
50
60
70
80
90
100
Fiat GM
Volkswag
enFord
Renau
lt
Hyund
ai
Honda
Toyo
taPSA
Nissan
Mitsub
ishi
KIAJA
CBMW
Land
Rove
r
Merce
des-B
enz
Chery
Audi
Suzuk
iJe
epTo
tal
Tech
nolo
gy
shar
e
VVT+VVL VVT Fixed
Figure 3‑20 ndash Valve actuation by manufacturer
VVT+VVL VVT Fixed
0
10
20
30
40
50
60
70
80
90
100
China2010
Korea2011
US2013
Japan2011
India2012
Brazil2013
Tech
nolo
gy
shar
e
Figure 3‑21 ndash Valve actuation international comparison
27
ICCT white paper
FUEL SYSTEMS FOR GaSOLiNE VEhiCLESVehicle fuel systems describe the technology required to deliver fuel into the engine combustion chamber this section examines two gasolineflex technologies namely multi-point fuel injection (MPFi) and gasoline direct injection (gDi) MPFi is now the most common fuel-delivery system for gasoline engines used in passenger vehicles worldwide in sequential MPFi engines fuel is injected into the air stream next to the intake valve port while the intake valve is open to draw the air-fuel mixture into the cylinder some of the fuel is vaporized on the surface of the hot intake valve expanding and thus reduces the volumetric efficiency on gDi engines fuel is injected at high pressure directly into the combustion chamber improving volumetric efficiency and providing cooling of the airfuel charge within the cylinder which allows for higher compression ratios and increased thermodynamic efficiency gDi technology alone offers benefits of 2 to 5 with respect to MPFi engines but bigger benefits rely on the synergy between gDi turbocharging and downsizing which can reach 12 to 15 energy consumption reduction with respect to a MPFi naturally aspirated engine (ePa 2012)
Table 3‑1 illustrates that MPFi is still the most common fuel injection technology for gasolineflex vehicles in Brazil which is reflected in its dominant share across most segments except for sports and off-road vehicles in Brazil gDi has found a niche market in the sports and off-road segments with more than 90 of sport vehicles fitted with gDi technology (Figure 3‑22) Within the overall gasoline market the gDi technology is still an emerging technology representing just 24 of new sales gDirsquos market share increased by 31 in 2013 with all but 4000 units being imported among the 10 largest manufacturers the adoption of gDi is extremely low below 5 for Volkswagen Ford hyundai and Psa (Figure 3‑23) high-end european brands (audi land rover Mercedes-Benz and BMW) are the technology leaders in terms of gDi adoption rates echoing the trend of turbocharging technology sales Volkswagen vehicles with gDi systems account for less than 35 of their sales in 2013 but their absolute numbers (around 19000 vehicles) place the company as one of the leaders in gDi technology in the Brazilian market
From a global market perspective the penetration of gDi technology in Brazil is low compared to all other markets in Figure 3‑24 except for india and japan it should be noted that the later has the largest share of hybrid vehicles around the globe
28
Brazil Passenger Vehicle Market statistics
0
10
20
30
40
50
60
70
80
90
100
Compac
t
Subco
mpac
t
Medium
Larg
eSport
O-Road SUV
Miniva
nTo
tal
Tech
nolo
gy
shar
e
GDI MPFI
Figure 3‑22 ndash gasolineflex fuel system by segment
GDI MPFI
0102030405060708090
100
Fiat GM
Volkswag
enFord
Renau
lt
Hyund
ai
Honda
Toyo
taPSA
Nissan
Mitsub
ishi
KIAJA
CBMW
Land
Rove
r
Merce
des-B
enz
Chery
Audi
Suzuk
iJe
epTo
tal
Tech
nolo
gy
shar
e
Figure 3‑23 ndash gasolineflex fuel system by manufacturer
GDI MPFI
0
10
20
30
40
50
60
70
80
90
100
China2010
Korea2011
EU-272013
US2013
Japan2011
India2012
Brazil2013
Tech
nolo
gy
shar
e (n
on-
die
sel)
Figure 3‑24 ndash gasolineflex fuel system international comparison
29
ICCT white paper
TURBOChaRGiNGengine power is primarily limited by the rate at which the engine is able to draw air into the combustion chamber turbocharging and supercharging are two methods to increase the amount of air drawn into the engine above the level of what is possible with the naturally aspirated process (through the expansion of the cylinders) By increasing the amount of air into the engine the amount of fuel can be proportionally increased resulting in increased power output level and with it the ability to reduce engine displacement while maintaining performance the combination of turbocharging and downsizing in spark ignited (gasoline and flex-fuel) vehicles can provide energy consumption improvements between 2 to 6 with respect to a direct-injected gDi engine (ePa amp nhtsa 2010) turbocharging technology is the cornerstone for achieving better energy consumption in vehicles as the basis for downsizing and reducing the engine weight while keeping the same or better vehicle performance (ie acceleration or time to reach certain speed) although turbochargers are used in diesel and gasolineflex vehicles the analysis in this report focuses on turbocharging for spark-ignited gasolineflex vehicles only
turbocharging is one of the most important emerging technologies in Brazil where most vehicles are still naturally aspirated (na) (Table 3‑1) turbocharging technology has increased the market share significantly between 2012 and 2013 by more than 65 albeit from a small base (from about 49000 to 81000 vehicles)
Most vehicles with turbocharging are sold in the sports and off-road segments as this technology also produces superior engine power output (Figure 3‑25) among the 10 largest manufacturers turbocharging is still below 10 of their sales (Figure 3‑26) Volkswagen and Ford despite having small relative sales of vehicles with turbocharging (less than 35) are the manufacturers with the highest total sales of vehicles with turbocharging audi land rover Mercedes-Benz and BMW are the technology leaders with more than 90 of vehicle sales in 2013
the penetration of turbo and supercharging technologies in Brazil is lower than in other countries with a larger gasoline fleet such as the us china and japan (Figure 3‑27) in Brazil 95 of diesel passenger vehicle sales have turbocharging technology
30
Brazil Passenger Vehicle Market statistics
0
10
20
30
40
50
60
70
80
90
100
Compac
t
Subco
mpac
t
Medium
Larg
eSport
O-Road SUV
Miniva
nTo
tal
Tech
nolo
gy
shar
e (n
on-
Die
sel)
Turbo NA
Figure 3‑25 ndash turbocharging for gasolineflex fuel vehicles by segment (NA naturally aspirated)
0102030405060708090
100
Fiat GM
Volkswag
enFord
Renau
lt
Hyund
ai
Honda
Toyo
taPSA
Nissan
Mitsub
ishiKIA
JACBMW
Land
Rove
r
Merce
des-B
enz
Chery
Audi
Suzuk
iJe
epTo
tal
Tech
nolo
gy
shar
e (n
on-
Die
sel)
Turbo NA
Figure 3‑26 ndash turbocharging for gasolineflex fuel vehicles by manufacturer (NA naturally aspirated)
0
10
20
30
40
50
60
70
80
90
100
China2010
Korea2011
EU-272013
US2013
Japan2011
India2012
Brazil2013
Tech
nolo
gy
shar
e (n
on-
die
sel)
Turbo NA
Figure 3‑27 ndash turbocharging for gasolineflex fuel vehicles international comparison (NA naturally aspirated)
31
ICCT white paper
4 vEhiCLE ENErGy CONSuMpTiON
this section analyzes the Brazilian new passenger vehicle energy consumption in 2013 although other metrics are more common (see box) vehicle energy consumption is presented in megajoules per kilometer (Mjkm) for consistency with Brazilrsquos inovar-auto policy in 2012 Brazilrsquos Ministry of Development industry and Foreign trade (MDic) adopted the inovar-auto policy with the aim of fostering industrial competitiveness through technology investments the policy includes a target for corporate average energy consumption (in Mjkm with vehicle curb weight as the attribute parameter) for vehicles sold in 2017
in the us canada Mexico and saudi arabia fleet-average fuel economy standards are defined as a function of vehicle footprint in the eu china japan south Korea and india vehicle weight is the attribute for the calculation of fleet-average targets in Brazil inovar-auto has defined its fiscal targets for vehicle energy consumption measured in megajoules per kilometer (Mjkm) as a function of vehicle weight
VEhiCLE ENERGY MEaSUREMENT UNiTS
Many metrics can be used to describe the amount of fuel energy or emissions generated by unit of distance traveled
Fuel economy measures distance traveled per unit of fuel consumed in Brazil kilometers per liter (kml) is the most common metric to describe vehicle efficiency but other units are used in different countries such as miles per gallon (mpg) in the us
Fuel consumption is the reciprocal of fuel economy and measures fuel consumed per distance traveled it is usually expressed in liters per 100 kilometers (l100 km) and it is used in europe for example
GhGCO2 emissions measures ghg or co2 emissions per distance traveled expressed as grams of pollutant per kilometer or mile
Energy consumption (EC) measures the energy consumed per distance traveled for example in megajoules per kilometer Despite being a less common metric it is sometimes preferred for being a fuel-neutral metric across different types of fuel and vehicle technologies Vehicle energy consumption in Mjkm is the metric used in Brazilrsquos inovar-auto policy to quantify the corporate average energy consumption target for each manufacturer Values for energy consumption in Brazilian spark-ignited vehicles are provided for e22 since that is the fuel mixture used in vehicle tests
Vehicle energy consumption in this report is calculated from co2 emissions data in the Brazilian institute of environment and renewable natural resources (iBaMa) nota Verde program (iBaMa 2014) which reports official emissions data from homologation tests Data are limited to passenger cars sold by the top 10 manufacturers with light commercial vehicles being excluded appendix D presents a description of data sources
32
Brazil Passenger Vehicle Market statistics
and calculation methodologies as well as a discussion of vehicle energy consumption data quality and completeness in Brazil
not surprisingly vehicle energy consumption increases with vehicle footprint and engine rated power the two parameters that define vehicle segments in Brazil (Figure 4‑1) subcompact and compact vehicles which accounted for about 45 of new sales in 2013 have average energy consumption below the fleet average while medium-sized vehicles which hold the largest market share (388) have energy consumption just above the fleet average larger more powerful vehicles consume more energy than the fleet average but have a considerably smaller market share (combined share of 163) Data availability for these segments is not as extensive as the data available for the subcompact compact and medium segments which could affect the relative rankings of each segment
Ene
rgy
cons
ump
tio
n (M
Jkm
)
Subco
mpac
t
Compac
t
Medium
Larg
e
O-road SUV
4000
200000
400000
600000
850000
35
30
25
20
15
10
05
0
Sales
Total 202
Figure 4‑1 ndash new vehicle sales-weighted average energy consumption by segment (2013)
33
ICCT white paper
Figures 4‑2 and 4‑3 illustrate new vehicle energy consumption for multiple weight and footprint bins For each weight bin (in 100 kg increments) and footprint bin (in 01 m2 increments) sales-weighted averages of energy consumption for each vehicle version are presented (dashes) generating energy consumption ranges for each bin (cream areas) Vehicle sales by bin are presented for reference in the lower charts
the strong correlation between vehicle energy consumption and weight follows from the strong physical relationship between the weight of the vehicle and the energy required to accelerate it and overcome resistances9 (Figure 4‑2) Data dispersion within each bin suggests that energy consumption varies due to other vehicle characteristics that affect vehicle aerodynamics and rolling resistance as well as the adoption of technologies that affect engine and transmission efficiency (eg friction reduction technologies gDi VVt)
Curb weight (kg)
SubcompactCompactMediumLargeO-roadSUV
Ene
rgy
cons
ump
tio
n (M
Jkm
)Sa
les
5
6
4
3
2
1
600k
800k
400k
200k
0k800 900 1000 1100 1200 1300 1400 1500 1600 1700 1800 1900 2000 2100
Figure 4‑2 ndash new vehicle energy consumption by vehicle weight (2013)
9 on a plain surface the sum of resistances of a vehicle is acceleration resistance + rolling resistance + aerodynamic resistance = c1 m a + c2 frr m + c3 cw a v2 with mass (m) as an integral part of both acceleration and rolling resistance which are most relevant for inner-city driving situations other factors are acceleration (a) rolling resistance of tires (frr) aerodynamic coefficient of the vehicle (cw) frontal area of vehicle (a) velocity (v) and constants (cx)
34
Brazil Passenger Vehicle Market statistics
Footprint has a reasonable correlation with energy consumption (Figure 4‑3) ie larger vehicles tend to consume more fuel than smaller vehicles however the correlation is not as strong as with vehicle weight similar to the previous figure the broad spread of energy consumption values suggests a combination of different vehicle characteristics (eg weight engine displacement rated power) and technologies (eg transmissions fuel systems) as well as the presence of suVs and off-road vehicles among the medium- and large-sized footprint values respectively
Footprint (m2)
SubcompactCompactMediumLargeO-roadSUV
Ene
rgy
cons
ump
tio
n (M
Jkm
)Sa
les
5
6
4
3
2
1
400k
500k
300k
200k
100k
0k31 32 33 34 35 36 37 38 39 40 41 42 43 44 45 46 48 49
Figure 4‑3 ndash new vehicle energy consumption by vehicle footprint (2013)
35
ICCT white paper
Figure 4‑4 illustrates sales weighted average for new vehicle energy consumption by mass for the top 10 manufacturers in Brazil in 2013 Bubble sizes are proportional to total vehicle sales Manufacturers in the lower-left quadrant produce the lightest and most efficient vehicles with hyundai presenting the best overall average energy consumption renault in the upper-left quadrant produces vehicles that are equivalent in weight but on average with higher energy consumption in the lower-right quadrant are manufacturers that produce relatively heavier vehicles but with lower energy consumption in their weight class Despite producing heavier vehicles on average than many manufacturers honda achieves lower energy consumption on average in the upper-right quadrant are manufacturers that produce on average the heavier and least efficient vehicles with Psa (citroen and Peugeot) producing the heaviest and least efficient cars on average a regression line correlating vehicle energy consumption and mass highlights the best performers (hyundai honda and nissan) average performers (Fiat Volkswagen gM and toyota) and those performing worse than average (renault Ford and Psa)
FIA
GMVW
FORREN
HYU
HON
TOY
PSA
NIS
160
170
180
190
200
210
220
230
240
250
950 1000 1050 1100 1150 1200 1250 1300 1350
Ene
rgy
cons
ump
tio
n (M
Jkm
)
Curb weight (kg)
Fleet Ave
Figure 4‑4 ndashaverage new vehicle sales-weighted energy consumption by manufacturer (2013)
36
Brazil Passenger Vehicle Market statistics
Figure 4‑5 shows fleet-average energy consumption based on certification and type approval data for new vehicles in multiple countries converted to the us caFe combined driving cycle Bubble sizes represent total sales of new passenger cars Because of data availability in different countries the country comparison is based on different calendars years for different countries 2011 for south Korea and japan 2012 for china and india and 2013 for europe the us and Brazil given annual improvements in vehicle energy consumption triggered by regulatory efficiency standards and fiscal incentives those countries with older data could be at a slight disadvantage in this comparison
With the heaviest vehicles on average the us fleet is also the most energy consuming of all countries china and south Korea have similar average energy consumption but since south Korean vehicles are heavier on average they are relatively more efficient than chinese vehicles although Brazilrsquos fleet consumes less fuel on average than those from the us china and south Korea its fleet is relatively inefficient when compared to countries with vehicles of similar weight (japan and india) the average Brazilian vehicle consumes about 34 more energy than the average vehicle in japan whose fleet has a large penetration of gasoline hybrid and advanced fuel-efficiency technologies such as three-cylinder engines VVa Dohc and 6-plus speed transmissions european vehicles are the best performing on average despite being heavier than all countries with the exception of the us and south Korea the adoption of fuel-efficiency technologies (eg Dct 6-plus-speed transmissions gDi turbocharging) contributes to europersquos better than average performance
China2012
SKorea2011
Europe2013
US2013
Japan2011
India2012
Brazil2013
Sales5 MM10 MM
14
16
18
20
22
24
26
28
1000 1100 1200 1300 1400 1500 1600 1700
Ene
rgy
cons
ump
tio
n ndash
CA
FE
(M
Jkm
)
Curb weight (kg)
Type-approval and certification energy consumption data only (does not include o-cycle or real-world driving data)
Figure 4‑5 ndash international comparison of passenger car energy consumption
Country labels indicate the dataset year
Figure 4‑6 provides a more detailed country comparison by illustrating average vehicle energy consumption by vehicle (curb) weight bin Vehicle sales in each bin are shown for reference the us is not shown due to lack of detailed model-by-model data Brazilrsquos vehicles on average have the highest energy consumption in most weight
37
ICCT white paper
bins with china being the second highest in most bins Because china has higher fuel consumption than Brazil on the 1000 bin which represents the highest share of vehicle sales fleet-average energy consumption in china is still higher than in Brazil as illustrated in the previous figure europe consistently performs best in terms of vehicle energy consumption in most weight bins with japan also performing relatively well
Curb weight (kg)
BrazilChinaEuropeIndiaJapanSouth Korea
Ene
rgy
cons
ump
tio
n C
AF
E (
MJ
km)
Sale
s
40
35
25
20
15
10
6M
8M
4M
2M
0M600 800 1000 1200 1400 1600 1800 2000 2200 2400
Figure 4‑6 ndash international comparison of average vehicle energy consumption by vehicle weight
Type-approval and certification energy consumption data only (does not include off-cycle or real-world driving data)
38
Brazil Passenger Vehicle Market statistics
Figure 4‑7 illustrates the distribution of energy consumption data in Brazil for each vehicle version by mass and segment Bubble sizes represent total sales of each version Data were limited to flex-fuel vehicles in the subcompact compact medium and large segments due to its relatively better data quality and representativeness (ie they represented over 87 of sales in 2013) While most vehicles follow a predictable trend that correlates energy consumption and vehicle mass there are a large number of versions with energy consumption substantially higher than the trend line this suggests there is substantial room for improvements in their energy consumption since there are vehicles in similar weight classes with substantially superior energy consumption performance
Sales1000050000
140
160
180
200
220
240
260
280
700 800 900 1000 1100 1200 1300 1400 1500 1600
Ene
rgy
cons
ump
tio
n (M
Jkm
)
Curb weight (kg)
Subcompact Compact Medium Large Fleet average
Figure 4‑7 ndash Distribution of new Brazilian passenger vehicle energy consumption data by vehicle weight and segment (2013)
this chapter suggests that there are potential improvements in vehicle energy consumption for the Brazilian fleet For similar vehicles in terms of weight class footprint or engine rating there is substantial dispersion in energy consumption indicating that there are vehicles performing much worse than the average across manufacturers there is also a clear trend of some manufacturers performing much better than the average while others have a lot more room for improvement the international comparison clearly shows that Brazilian vehicles perform much worse in terms of energy consumption than vehicles of similar weight suggesting a delay in the adoption of energy efficient technologies among Brazilian vehicle manufacturers
Finally a more detailed analysis of vehicle versions clearly illustrates a considerable number of vehicle versions significantly above average thus indicating potential improvements in energy consumption that would place them on par with better performing vehicles with similar characteristics
39
ICCT white paper
Deficiencies in data quality and completeness prevent more definite conclusions about vehicle energy consumption gasoline-only vehicles in particular have poor energy consumption data quality although they represent a relatively small fraction (6) of total vehicles sold in 2013 Because some vehicle segments are primarily composed of gasoline-only vehicles (eg sports minivans) this chapter excludes these segments from the analysis there are also concerns about the gap between energy consumption data reported by iBaMarsquos nota Verde and Brazilrsquos national institute of Metrology standardization and industrial Qualityrsquos (inMetro) labeling program (PBeV using its acronym in Portuguese) with the latter reporting consistently lower values of vehicle energy consumption
Finally the availability of energy consumption data was not adequate for many manufacturers beyond the top 10 sales group which prevented their inclusion in this analysis Despite the data quality and lack of completeness the energy consumption data in this chapter include data that are reasonably accurate and representative thus supporting its interpretation
40
Brazil Passenger Vehicle Market statistics
rEfErENCES
aDK automotive consultoria de Marketing (2013) relatoacuterios de volumes de vendas do mercado brasileiro para veiacuteculos de passeio e comerciais leves referentes a 2013
alves l Wilbert M (2014) reduccedilatildeo do imposto sobre Produto industrializado e a Venda de automoacuteveis Xi congresso usP iniciaccedilatildeo cientiacutefica em contabilidade
associaccedilatildeo nacional de transportes Puacuteblicos (antP 2014) estudo mostra baixo efeito do desconto no iPi de veiacuteculos sobre PiB e emprego available at httpwwwantporgbrwebsitenoticiasshowaspnpgcode=a4DeeFe8-a7BF-48D3-B1F5-8eDe1447BF10
associaccedilatildeo nacional dos Fabricantes de Veiacuteculos automotores (anFaVea 2015) anuaacuterio da induacutestria automobiliacutestica Brasileira 2015 Brazilian automotive industry Yearbook 2015 satildeo Paulo available at wwwanfaveacombr
european environment agency (2014) Monitoring co2 emissions from new passenger cars in the eu summary of data for 2013 april 2014
instituto Brasileiro do Meio ambiente e dos recursos naturais renovaacuteveis (iBaMa 2014) consulta dos niacuteveis de emissatildeo dos veiacuteculos novos brasileiros available at httpsservicosibamagovbrctfpublicosel_marca_modelo_rvepphp
international council on clean transportation (icct 2015) global passenger vehicle standards available at httpwwwtheicctorginfo-toolsglobal-passenger-vehicle-standards
international energy agency (iea 2015) renewables Bioenergy available at httpswwwieaorgtopicsrenewablessubtopicsbioenergy
Korea energy Management corporation (KeMco 2014) Fuel economy regulation available at httpwwwkemcoorkrnew_engmainmainasp
Marklines (2015) Marklines automotive industry Portal available at httpwwwmarklinescomen
Mendonccedila M sachsida a (2014) Modelando a demanda de creacutedito para veiacuteculos no Brasil uma abordagem com mudanccedila de regime iPea
Ministeacuterio do Desenvolvimento induacutestria e comeacutercio exterior (MDic 2013) Programa de incentivo agrave inovaccedilatildeo tecnoloacutegica e adensamento da cadeia Produtiva de Veiacuteculos automotores mdash inovar-auto httpwwwplanaltogov brccivil_03_ato2011-20142012DecretoD7819htm
stein r anderson j and Wallington t (2013) an overview of the effects of ethanol-gasoline Blends on si engine Performance Fuel efficiency and emissions SAE Int J Engines 6(1)470-487 2013 doi1042712013-01-1635
us environmental Protection agency and national highway traffic safety administration (ePanhtsa 2010) Final rulemaking to establish light-Duty Vehicle greenhouse gas emission standards and corporate average Fuel economy standards ePa-420-r-10-901
us environmental Protection agency (ePa 2012) regulatory impact analysis Final rulemaking for 2017-2025 light-Duty Vehicle greenhouse gas emission standards and corporate average Fuel economy standards ePa-420-r-12-016
41
ICCT white paper
us national academy of sciences (nas 2011) assessment of Fuel economy technologies for light-Duty Vehicles available at httpwwwnapeducatalog12924assessment-of-fuel-economy-technologies-for-light-duty-vehicles
World Bank group (2015) World Development indicators available at httpdataworldbankorgdata-catalogworld-development-indicators
42
Brazil Passenger Vehicle Market statistics
LiST Of ACrONyMS
4wD Four-wheel drive
aNFaVEa Brazilian association of automobile Manufacturers
awD all-wheel drive
BRiC Brazil russia india china
CaFE corporate average fuel economy
CBG compressed biogas
CO2 carbon dioxide
CVT continuously variable transmission
CVVT continuously variable valve technology
DCT Dual-clutch transmission
DOhC Dual overhead camshaft
EC energy consumption
Epa us environmental Protection agency
EU european union
FFV Flex-fuel vehicle
FTp Federal test procedure
FwD Front-wheel drive
GDi gasoline direct injection
GDp gross domestic product
GhG greenhouse gas
GM general Motors
iBaMa Brazilian institute of the environment and renewable natural resources
iC internal combustion
iCCT international council on clean transportation
iNMETRO national institute of Metrology standardization and industrial Quality
Kg Kilogram
Km Kilometer
Kw Kilowatt
LDV light-duty vehicle
LpG liquified petroleum gas
MDiC Ministry of Development industry and Foreign trade
MJ Megajoule
MpFi Multi-point fuel injection
Mpg Miles per gallon
NaS us national academy of sciences
43
ICCT white paper
NhTSa us national highway transportation safety administration
OhV overhead valve
pBEV Brazilian Vehicle labeling Program
pSa Psa Peugeot citroeumln
pTwR Power-to-weight ratio
pV Passenger vehicle
RwD rear-wheel drive
SOhC single overhead camshaft
SUV sport utility vehicle
US united states
USD us dollar
VTEC Valve timing electronic control
VVa Variable valve actuation
VVL Variable valve lift
44
Brazil Passenger Vehicle Market statistics
AppENDix A SEGMENT DEfiNiTiONS
Table a‑1 ndash segment definitions
Segmentpower (kw)
pTwR (kwkg) area (m2)
Other characteristics Examples
Subcompact lt 140 lt 0075 le 65 mdash Mini cooper chevrolet celta smart Fortwo
Compact lt 140 lt 0075 65 lt area le 70 mdash honda Fit hyundai hB20 Volkswagen Polo
Medium lt 140 lt 0075 70 lt area le 80 mdash honda civic nissan tiida Peugeot 308
Large lt 140 lt 0075 gt 80 mdash audi a4 BMW 3 series Mercedes c-class
Sports gt 140 gt 0075 mdash 4 seats maxjaguar XF lamborghini gallardo Ferrari california
Off‑road mdash mdash lt 80 traction = 4WDjeep cherokee honda cr-V BMW X3 hyundai santa Fe
SUV mdash mdash lt 80Based on aDKrsquos default classification
BMW X1 Ford ecosport hyundai tucson
Minivan mdash mdash Passengers 6-12
citroen grand Picasso Kia carnival
45
ICCT white paper
AppENDix b iNTErNATiONAL MArKET DATA
Table B‑1 ndash international market comparison of new fleet characteristics
parameters China S Korea EU US Japan india Brazil
Year 2012 2011 2013 2013 2011 2012 2013
Sales (million) 155 13 118 156 352 256 304
price (USD) $21008 $21383 $24439 mdash $20637 $11717 $22015
No of cylinders mdash 43 40 47 38 36 40
Displacement (cc) 1605 1960 1613 2606 1425 1294 1430
Curb weight (kg) 1296 1421 1391 1623 1193 1059 1106
Length (mm) 4323 4531 4263 mdash 4013 3859 4100
Footprint (m2) 38 420 40 425 371 341 367
Engine power (kw) 86 120 89 148 78 55 76
pTwR (kwkg) 00664 00844 00640 00912 00654 00519 00671
Energy consumption ndash US CaFE (MJKm)[1] 235 206 169 250 171 183 202
[1] energy consumption data presented here for countries other than Brazil were obtained from local official sources in its original metric and drive cycle and then converted to Mjkm under the us caFe drive cycle using the methodology described in Yang (2015) Mode details and historical fuel consumption data on their original metrics is presented in the icctrsquos global PV standard website httpwwwtheicctorginfo-toolsglobal-passenger-vehicle-standards
Data Sources
China Ministry of industry and information technology (Miit 2014) corporate average Fuel efficiency accounting Method for Passenger cars available at httpwwwgovcngzdt2013-0320content_2358627htm
Baseline performance china automotive research and technology center through internal communication and icct internal 2010 database for chinese light-duty vehicles
S Korea internal communication with s Korean official and from greencarcongress available at httpwwwgreencarcongresscom200906korea-20090604html
EU european environment agency (2014) Monitoring co2 emissions from new passenger cars in the eu summary of data for 2013 april 2014
US us ePa (2014) light-duty automotive technology carbon dioxide emissions and fuel economy trends1975 through 2014 table 91 page 110 available at http httpwwwepagovfueleconomyfetrends1975-2014420r14023apdf
Japan jaMa (2010) the Motor industry of japan available at httpwwwjama-englishjppublicationsMVs2010pdf Mlit httpwwwmlitgojpcommon000990330pdf
india Bureau of energy efficiency white paper 2010-2012 calculation based on icct database
Brazil icct Brazil Vehicle Database (2013)
46
Brazil Passenger Vehicle Market statistics
Table B‑2 ndash international market comparison of technology adoption in new vehicles
Technology adoption China S Korea EU US Japan india Brazil
Year 2010 2011 2013 2013 2011 2012 2013
Fuel type
CBGLpGFlex 0 11 2 0 0 4 94
Gasoline 99 65 44 93 86 56 6
hybrid 0 1 1 5 13 0 0
Diesel 1 23 53 1 0 40 0
No of cylinders
Two 0 0 0 0 0 6 0
Three 4 0 7 0 36 28 3
Four 90 84 87 56 57 65 97
Five 0 0 1 0 0 0
Six 6 15 4 32 5 0 1
Eight or more 0 0 0 12 1 0 0
Transmission
Manual 60 3 83 5 1 98 83
automatic 34 90 9 75 34 2 15
CVT 5 7 2 18 65 0 1
DCT 1 0 6 2 mdash 0 1
Number of gear ratios
Four or fewer 13 16 1 7 mdash 10 6
Five 68 9 45 11 mdash 85 83
Six or more 19 75 54 82 mdash 5 11
Drivetrain
FwD 74 86 81 83 59 76 0
RwD 21 7 7 10 5 22 0
4wD and awD 5 7 12 7 36 2 100
No of valves per cylinder
Two 17 mdash mdash 2 4 25 60
Multi valve 83 mdash mdash 98 95 75 40
Valve camshaft configuration
Single overhead camshaft 26 1 mdash mdash 16 41 63
Dual overhead camshaft 74 84 mdash mdash 82 53 25
Overhead camshaft mdash 15 mdash mdash 0 6 mdash
Valve actuation
Fixed 50 16 mdash 2 11 86 78
VVT 44 84 mdash 98 89 12 16
VVL 6 mdash mdash mdash mdash 2 6
Fuel systems for gasoline vehicles
Multi‑point fuel injection 94 72 68 62 95 100 98
Gasoline direct injection 6 28 32 37 5 0 2
air induction systems for gasoline vehicles
Naturally aspirated 93 75 41 85 92 64 97
Supercharger turbocharger or twin‑turbo 7 25 59 15 8 36 3
47
ICCT white paper
AppENDix C NEW vEhiCLE ChArACTEriSTiCS AND TEChNOLOGy ADOpTiON DATA iN brAziL
Table C‑1 ndash Fleet characteristics of new Brazilian passenger vehicles by segment (2013)
parameters Subcompact Compact Medium Large Sports Off‑road SUV Minivan
Sales (thousands) 6785 6843 11790 1920 273 768 1997 23
Market share () 223 225 38 8 63 09 25 65 01
price (R$) $30103 $38732 $45496 $66508 $148834 $151284 $75164 $82284
No of cylinders 400 391 399 400 462 448 404 433
Displacement (cc) 1128 1293 1447 1794 2430 2586 1884 2244
Curb weight (kg) 940 1037 1102 1329 1561 1772 1395 1604
Length (mm) 3804 4026 4163 4499 4711 4516 4352 4658
Footprint (m2) 339 361 371 402 418 409 402 427
Engine power ndash gasoline (kw) 58 68 75 99 183 146 103 120
Engine power ndash ethanol (kw) 59 70 77 98 mdash 109 101 mdash
pTwR ndash gasoline (kwkg) 00614 00655 00671 00742 01173 00828 00731 00732
pTwR ndash ethanol (kwkg) 00630 00678 00697 00757 mdash 00766 00745 mdash
48
Brazil Passenger Vehicle Market statistics
Table C‑2 ndash Fleet characteristics of new Brazilian passenger vehicles by manufacturer (2013)
parameters Fiat
GM
Vo
lksw
agen
Ford
Ren
ault
hyu
ndai
ho
nda
Toyo
ta
pSa
Nis
san
Mit
sub
ishi
Kia
JaC
BM
w
Land
Rov
er
Mer
ced
es‑B
enz
Che
ry
aud
i
Suzu
ki
Jeep
Sales (thousands) 6087 5486 5448 3074 2207 2055 1392 1334 1163 621 368 255 158 141 106 94 80 67 63 36
Market share () 2002 1804 1792 1011 726 676 458 439 383 204 121 084 052 046 035 031 026 022 021 012
price (R$) $35017 $42259 $38701 $46174 $43447 $50112 $67078 $68922 $103001 $44035 $100696 $87009 $37654 $165111 $221943 $153281 $30821 $142799 $74769 $139039
No of cylinders 400 401 400 402 400 370 400 400 400 400 408 416 400 424 448 431 400 411 400 552
Displacement (cc) 1250 1340 1287 1497 1423 1495 1691 1808 1575 1579 2262 1856 1411 2095 2281 1934 1398 1912 1831 3182
Curb weight (kg) 1033 1060 1020 1156 1102 1122 1210 1201 1231 1069 1556 1377 1079 1624 1868 1598 1097 1551 1444 1945
Length (mm) 3965 4155 3993 4120 4127 4078 4319 4299 4116 4171 4401 4357 3956 4574 4487 4527 3896 4454 4234 4584
Footprint (m2) 345 370 354 368 378 383 397 387 376 379 395 407 351 429 433 429 349 417 323 420
Engine power ndash gasoline (kw) 64 71 65 79 73 86 96 90 80 82 120 112 83 151 179 138 71 136 94 162
Engine power ndash ethanol (kw) 65 72 65 79 76 85 97 90 81 82 107 106 95 mdash mdash mdash 75 mdash mdash mdash
pTwR ndash gasoline (kwkg)
00613 00662 00631 00674 00657 00739 00788 00745 00646 00766 00779 00792 00784 00921 00977 00856 00638 00870 00649 00835
pTwR ndash ethanol (kwkg) 00629 00681 00642 00693 00685 00781 00800 00795 00660 00768 00710 00798 00896 mdash mdash mdash 00659 mdash mdash mdash
49
ICCT white paper
Table C‑3 ndash Fleet characteristics of new Brazilian passenger vehicles by origin (2013)
parameters Domestic imported
Sales (thousands) 2537 504
Market share () 834 166
price (R$) $41739 $76049
No of cylinders 397 412
Displacement (cc) 1359 1791
Curb weight (kg) 1070 1289
Length (mm) 4063 4285
Footprint (m2) 362 390
Engine power ndash gasoline (kw) 70 102
Engine power ndash ethanol (kw) 73 84
pTwR ndash gasoline (kwkg) 0065 0076
pTwR ndash ethanol (kwkg) 0068 0074
50
Brazil Passenger Vehicle Market statistics
Table C‑4 ndash technology adoption in new Brazilian passenger vehicles by segment (2013)
Technology adoption Subcompact Compact Medium Large SportOff‑road SUV Minivan
Fuel type
Flex 982 988 982 837 00 134 826 00
Gasoline 18 12 17 163 996 540 174 1000
hybrid 0000 0000 0028 0000 0396 0001 0000 0000
Diesel 00 00 00 00 00 326 00 00
No of cylinders
Three 01 91 10 00 00 00 00 00
Four 999 909 990 998 758 775 979 833
Five 00 00 00 02 03 00 00 00
Six 00 00 00 00 175 211 21 167
Eight or more 00 00 00 00 63 13 00 00
Transmission
Manual 993 944 826 622 62 174 505 641
automatic 07 55 161 283 629 707 451 359
CVT 00 00 12 89 09 93 34 00
DCT 00 01 02 06 299 25 10 00
No of gear ratios
Four or fewer 04 47 72 51 00 34 247 193
Five 984 943 848 378 15 392 516 641
Six 12 09 73 515 796 462 225 167
Seven 00 01 06 23 87 53 12 00
Eight or more 00 00 01 32 102 59 00 00
Drivetrain
FwD 998 1000 997 688 550 00 916 1000
RwD 02 00 03 311 221 00 84 00
awD 00 00 00 01 229 1000 00 00
No of valves per cylinder
Two 806 694 584 195 00 00 258 00
Multi valve 194 306 416 805 1000 1000 742 1000
Valve camshaft configuration
Single overhead camshaft 839 786 709 309 00 212 375 00
Dual overhead camshaft 24 158 161 546 880 517 446 255
Valve actuation
Fixed 982 729 807 461 49 493 664 868
VVT 18 211 115 470 827 367 252 132
VVT+VVL 00 61 78 68 124 140 84 00
Fuel systems for gasoline vehicles
Multi‑point fuel injection 999 998 997 949 979 143 766 1000
Gasoline direct injection 01 02 03 51 21 857 234 00
air induction systems for gasoline vehicles
Naturally aspirated 999 997 995 943 974 369 543 1000
Supercharger turbocharger or twin‑turbo 01 03 05 57 26 631 457 00
51
ICCT white paper
Table C‑5 ndash technology adoption in new Brazilian passenger vehicles by manufacturer (2013)
Technology adoption Fi
aT
GM
VO
LKSw
aG
EN
FOR
D
REN
aU
LT
hY
UN
Da
i
hO
ND
a
TOYO
Ta
pSa
NiS
SaN
MiT
SUB
iSh
i
Kia
JaC
BM
w
LaN
D R
OV
ER
MER
CED
ES
Fuel type
Flex 990 987 965 966 997 921 999 886 928 998 283 739 31 42 00 00
Gasoline 10 09 35 34 03 79 01 35 72 02 557 255 969 957 663 950
hybrid 00 00 00 00 00 00 00 02 00 00 00 00 00 00 00 00
Diesel 00 04 00 00 00 00 00 77 00 00 160 06 00 00 337 50
No of cylinders
Three 00 00 05 00 00 348 00 00 00 00 00 00 00 00 00 00
Four 1000 996 994 989 1000 626 999 998 1000 1000 958 922 1000 906 787 878
Five 00 00 00 00 00 00 00 00 00 00 00 00 00 00 00 00
Six 00 02 01 11 00 26 01 02 00 00 42 78 00 68 185 87
Eight or more 00 02 00 00 00 00 00 00 00 00 00 00 00 26 28 35
Transmission
Manual 992 878 985 846 853 632 566 565 703 785 493 120 1000 02 00 151
automatic 08 103 00 137 62 285 355 160 297 121 118 793 00 575 18 14
CVT 00 19 15 16 41 70 01 246 00 00 139 87 00 423 982 836
DCT 00 00 00 00 43 13 78 30 00 94 251 00 00 00 00 00
No of gear ratios
Four or fewer 02 04 00 55 104 237 00 323 249 132 17 133 00 00 00 00
Five 981 811 963 839 797 623 861 643 684 828 530 107 1000 00 00 64
Six 17 185 29 106 99 140 139 07 67 40 453 754 00 217 800 00
Seven 00 00 07 00 00 00 00 27 00 00 00 00 00 08 00 936
Eight or more 00 00 00 00 00 00 00 00 00 00 00 06 00 775 200 00
Drivetrain
FwD 1000 902 989 972 987 985 990 892 1000 1000 496 623 1000 00 00 00
RwD 00 91 00 00 00 00 00 16 00 00 00 370 00 882 00 900
awD 00 06 11 28 13 15 10 92 00 00 504 07 00 118 1000 100
No of valves per cylinder
Two 811 864 988 745 220 00 00 00 00 00 00 00 00 00 00 00
Multi Valve 189 136 12 255 780 1000 1000 1000 1000 1000 1000 1000 1000 1000 1000 1000
Valve camshaft configuration
SOhC 836 755 914 675 832 00 04 00 497 398 331 00 00 00 00 00
DOhC 07 108 56 50 168 992 786 875 352 428 477 1000 907 810 860 453
Valve actuation
Fixed 1000 898 965 966 940 29 00 574 736 573 435 76 124 187 18 55
VVT 00 102 35 34 60 971 00 426 264 427 00 924 876 00 982 945
VVT+VVL 00 00 00 00 00 00 1000 00 00 00 565 00 00 813 00 00
air induction System
Naturally aspirated 997 994 966 977 997 988 1000 923 922 1000 835 936 1000 97 37 101
Supercharger turbocharger or twin‑turbo
03 06 34 23 03 12 00 77 78 00 165 64 00 903 963 899
Fuel systems for gasoline vehicles
Multipoint fuel injection 1000 995 965 972 1000 989 1000 1000 967 1000 994 1000 1000 78 15 158
Gasoline Direct injection 00 05 35 28 00 11 00 00 33 00 06 00 00 922 985 842
note Difference between 100 and summation of sohc and Dohc market share values corresponds to data not available
52
Brazil Passenger Vehicle Market statistics
AppENDix D DATA SOurCES AND COMpLETENESS
the basis of the statistics shown in this report is a database compiled by the icct with vehicle sales technical information (eg fleet characteristics technology content) and energy consumption (converted from either co2 emissions or fuel economy) from various data sources outlined in table D-1
Table D‑1 ndash Brazilian data sources
parameters Sales TechnicalEnergy
consumption
aDK (2014 2015) x x
MarkLines (2015) x
iBaMa (2014) x
iNMETRO (2014) x
UOL (2014) x
icarroscom (2014) x
this analysis examined energy consumption data from two public sources the nota Verde Program by the Brazilian institute of the environment and renewable natural resources (iBaMa) and the Brazilian Vehicle labeling Program (PBeV) by the national institute of Metrology standardization and industrial Quality (inMetro) table D-2 summarizes key differences between these two data sources
Table D‑2 ndash energy consumption data sources
iBaMa iNMETRO
program nota Verde1 Brazilian Vehicle labeling Program (PBeV)2
program description
Mandatory program that reports emissions of co2 co nox and nMhc as part of emissions certification program
Voluntary program since 2009 that allows the comparison of fuel economy across vehicle models
Unit gco2 km kml
Test cycle chassis testing under urban (FtP) driving cycle based on nBr 66012005
chassis testing under urban (FtP) and highway (hWYFe) driving cycles based on nBr 702420103
adjustment
no adjustment for real-world driving conditions Because reported co2 emissions are assumed to be zero for ethanol adjustments were made to account for tailpipe co2 emissions for vehicles running on ethanol
since 2010 published values include real-world adjustment factors to chassis test data a method adopted by the us ePa in 2008
Conversion to MJkm
iBaMarsquos data are reported as FtP (city test) co2 data in gco2 km conversion to caFe test cycle and to a different metric (Mjkm) involves four steps as presented in Figure D-1
inMetrorsquos data in kml are presented separately by fuel type (e22 e100) and driving cycle (urban highway) conversion to Mjkm was done by applying a conversion factor (2167 gco2 l for e22 and 1428gco2l for e00) caFe values are obtained by using a 5545 weighting for the urban (FtP) and highway cycles respectively
1 iBaMa (2014) nota Verde program available at httpwwwmmagovbrcidades-sustentaveisqualidade-do-arcontrole-de-emissoes-veicularesnota-verde
2 inMetro (2014) Programa Brasileiro de etiquetagem Veicular (PBeV) available at httpwwwinmetrogovbrconsumidortabelas_pbe_veicularasp
3 inMetro (2014) Metodologia Para Divulgaccedilatildeo De Dados De consumo Veicular available at httpwwwinmetrogovbrconsumidorpbeMetodologia_consumo_Veicularpdf
53
ICCT white paper
Step 1 Correcting the original IBAMA CO2 reported data ndash FTP CO2 gkm
IBAMArsquos CO2 reported values are corrected to account for tailpipe emissions from ethanol (tailpipe CO2 emissions are reported as zero in IBAMArsquos data)
bull E22 FTP reported CO2 data are reduced by 177bull E100 FTP reported CO2 data are reduced by 100
Flex fuel vehicles are tested with E22 and E00 the final values is calculated as the average of both fuelsCO2 IBAMA_Flex_FTP= 05(1-0177)CO2_E22_test_FTP + 050E100_FTP = 050823CO2_E22_FTPFor Gasoline only vehicles the tests are carried out only with Gasoline E22CO2 IBAMA_Gasoline_FTP = (1-0177) CO2_E22_Test_FTP
Where in the previous equations CO2_E22_FTP means CO2 emissions values obtained under FTP testingCO2 IBAMA_Flex_FTP means IBAMArsquos Corrected FTP values for flex vehiclesCO2 IBAMA_Gasoline_FTP means IBAMArsquos Corrected FTP values for gasoline only (E22) vehicles
INNOVAR AUTO is based on energy consumption data obtained as the combined CAFE test cycle This requires a weighted average of energy consumption data obtained from FTP testing (city driving ) and Highway fuel economy testing (HWFET) In mathematical form CAFE=f(FTPHWFET)
Given that IBAMA data is provided for only the first aprt the FTP testing then it is required to find a way to calculate CAFE combined values through FTP -75 only data A linear function was thus developed from data with FTP and HWY values (INMETRO data) is used to convert FTP only values to CAFE CO2 values ie CAFE=f(FTP) The function used for this conversion is
CO2_CAFE= (CO2_FTP+44756)11572
Step 2Convert FTP CO2 values to CAFE CO2 values
Converting CO2 values to MJkm values is done by using the energy density of E22 Note that all the previous calculations for CO2 come from E22-based data
bull The energy density of E22 is 2894 MJLE22bull E22 emits 2167gCO2LE22bull CAFE (MJkm) = CAFE (gCO2km) (2894 MJLE22 2167 gCO2LE22)
Step 3 Convert US CAFE CO2 values to MJkm values
Figure D‑1 ndash conversion of emission to energy consumption data
energy consumption values calculated from iBaMa and inMetro data differ greatly Figure D-1 illustrates energy consumption data for those models in both databases iBaMa data are on average 126 higher than inMetro data with a standard deviation of 89 and a maximum deviation of 39
54
Brazil Passenger Vehicle Market statistics
0
05
1
15
2
25
3
0 05 1 15 2 25 3
Ene
rgy
cons
ump
tio
n IB
AM
A (
MJ
km)
Energy consumption INMETRO (MJkm)
n=151
Figure D‑2 ndash comparison between energy consumption data from inMetro and iBaMa
151 vehicles tested under both programs
although inMetro data are more transparent as it breaks down fuel economy by fuel and test cycle it is still a voluntary program that allows manufacturers to select which models will participate in addition not all manufacturers participate in the program in turn iBaMa data only include co2 data for the urban cycle and thus energy consumption in the combined cycle had to be estimated from correlations using international data in addition corrections had to be made for gasoline-only engines since it seems that a co2 discount in theory only applicable to flex-fuel engines was also applied to gasoline-only engines Despite these data quality issues iBaMa data were considered the most adequate data source for energy consumption because it is a mandatory program that requires data reporting by all vehicle models and manufacturers
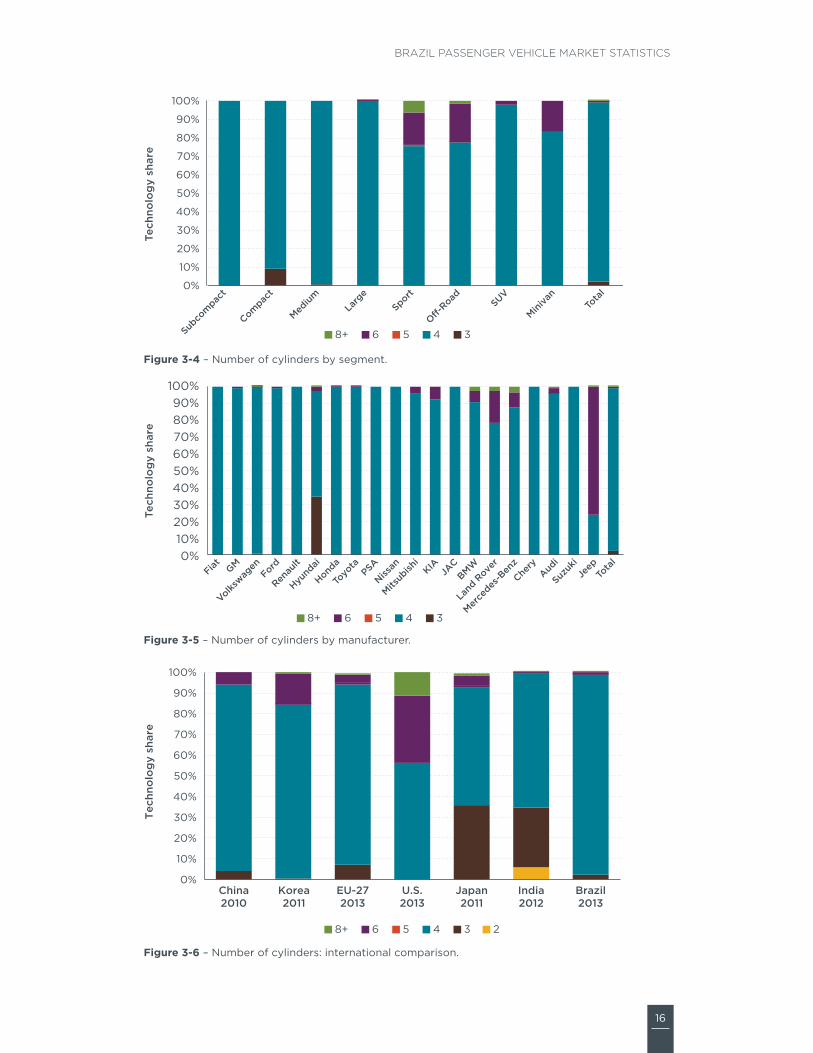
16
Brazil Passenger Vehicle Market statistics
0
10
20
30
40
50
60
70
80
90
100
Subco
mpac
t
Compac
t
Medium
Larg
eSport
O-Road SUV
Miniva
nTo
tal
Tech
nolo
gy
shar
e
8+ 6 5 4 3
Figure 3‑4 ndash number of cylinders by segment
0102030405060708090
100
Fiat GM
Volkswag
enFord
Renau
lt
Hyund
ai
Honda
Toyo
taPSA
Nissan
Mitsub
ishi
KIAJA
CBMW
Land
Rove
r
Merce
des-B
enz
Chery
Audi
Suzuk
iJe
epTo
tal
Tech
nolo
gy
shar
e
8+ 6 5 4 3
Figure 3‑5 ndash number of cylinders by manufacturer
0
10
20
30
40
50
60
70
80
90
100
China2010
Korea2011
EU-272013
US2013
Japan2011
India2012
Brazil2013
Tec
hno
log
y sh
are
8+ 6 5 4 3 2
Figure 3‑6 ndash number of cylinders international comparison
17
ICCT white paper
TRaNSMiSSiONtransmission technologies can reduce energy consumption in two ways First by allowing engine operation on a more efficient region of the engine map and second by reducing the mechanical losses within transmissions traditionally manual transmissions have offered better energy consumption than traditional automatic transmissions (with 4 or 5 speeds) due to lower friction losses however new generation of automatic transmissions with higher number of gears lower friction better materials and computer-controlled shift points have not just closed the gap between manual and automatic transmission performance but even exceed manual transmission performance
new technologies such as dual-clutch transmissions (Dcts) and continually variable transmissions (cVts) are gaining market share due to the need for lower vehicle energy consumption Dcts can be defined as manual transmissions with electro-hydraulically operated dual-clutch systems allowing for faster shifting times and selective automatic or ldquomanualrdquo operation as opposed to manual automatic and Dct transmissions which have a discrete number of gear ratios cVts have a theoretically infinite choice of ratios between fixed limits which allows engines to be further optimized for minimizing energy consumption cVt technology has been used in lower-horsepower vehicles because of maximum-torque limitations with the most common metal-belt design (nas 2011) these advanced transmission technologies offer significant benefits in energy consumption compared to traditional manual or automatic technologies according to the us national academy of sciences a 6-speed Dct provides 6 to 9 lower energy consumption than a 4-speed automatic transmission note that a traditional 6-speed automatic transmission provides an estimated 3 to 5 benefit the energy consumption benefit of cVt depends on the application and is estimated to be 1 to 7 (nas 2011)
although vehicle sales with manual transmissions are predominant in Brazil the penetration of automatic transmissions cVts and Dcts is increasing resulting in a market share loss for manual transmissions of about 6 between 2012 and 2013 (Table 3‑1) With the exception of sports and off-road segments manual transmission technology has the largest market share in all segments but it tends to become less predominant as vehicles grow in size and comfort level (Figure 3‑7) the top five manufacturers sell most of their vehicles with manual transmissions but their market share is somewhat smaller for other high-selling manufacturers that cater to a more affluent market (Figures 3‑8)
automatic transmissions are becoming increasingly popular in Brazil experiencing an increase of 28 in sales between 2012 and 2013 automatic transmissions dominate the sports and off-road segments Kia BMW land rover Mercedes-Benz and jeep adopt this type of transmission technology for most of their vehicle sales
Dct transmissions are entering the Brazilian market mostly through the sports segment via imported models the sales of Dct equipped vehicles increased in 2013 by 22 with respect to 2012 Dct technology is being offered mainly by manufacturers that sell sports vehicles such as audi in more than 67 of their vehicles and Mercedes-Benz in more than 15 of their vehicles the global leader in Dct adoption is europe followed by the us (Figure 3‑9)
cVt technology market is still relatively small being sold by small volume manufacturers like jeep audi and Mitsubishi with more than 25 of new vehicle sales each nissan renault honda and toyota also sell vehicles with cVt technology cVt penetration in Brazil is similar to europersquos cVt is the leading transmission technology in japan with more than 65 of the market
18
Brazil Passenger Vehicle Market statistics
0
10
20
30
40
50
60
70
80
90
100
Subco
mpac
t
Compac
t
Medium
Larg
eSport
O-Road SUV
Miniva
nTo
tal
Tech
nolo
gy
shar
e
DCT CVT Automatic Manual
Figure 3‑7 ndash transmission by segment
0
10
20
30
40
50
60
70
80
90
100
Fiat GM
Volkswag
enFord
Renau
lt
Hyund
ai
Honda
Toyo
taPSA
Nissan
Mitsub
ishi
KIAJA
CBMW
Land
Rove
r
Merce
des-B
enz
Chery
Audi
Suzuk
iJe
epTo
tal
Tech
nolo
gy
shar
e
DCT CVT Automatic Manual
Figure 3‑8 ndash transmission by manufacturer
0
10
20
30
40
50
60
70
80
90
100
China2010
Korea2011
EU-272013
US2013
Japan2011
India2012
Brazil2013
Tech
nolo
gy
shar
e
DCT CVT Automatic Manual
Figure 3‑9 ndash transmission international comparison
19
ICCT white paper
NUMBER OF GEaR RaTiOS as mentioned in the previous section increasing the number of gear ratios (whether manual automatic dual-clutch or continuously variable) allows the engine to be operated in the best efficiency region resulting in energy consumption benefits compared to an automatic four-gear ratio transmission (also known as 4-speed transmission) higher ratio automatic transmissions could reduce energy consumption from 2 to 3 (for a five-gear ratio) to 6 to 8 (for an eight-gear ratio) (ePanhtsa 2010)
Four-gear ratio transmissions are losing market share in Brazil by more than 5 between 2012 and 2013 (Table 3‑1) these transmissions are particularly high sellers in the suV and minivan segments which suggest that some models in these more expensive segments are being sold with outdated technologies (Figure 3‑10) Most manufacturers are phasing out this type of transmission (Figure 3‑11) although jeep suzuki and toyota are lagging behind other manufacturers the four-gear ratio transmission technology has been losing market share in most countries even in india where smaller and inexpensive cars dominate the market 4-speed transmissions have the smallest market share (Figure 3‑12)
Five- and six-gear ratio transmissions were predominant in the Brazilian market in 2013 Five-gear ratio transmissions are dominant in all segments except for the off-road and sports segments which have adopted six-gear ratio transmissions in most sales the significant market share of five- and six-gear ratio transmissions is similar to most countries although the us europe and south Korea show higher shares of six and more gear ratios
seven- and eight-gear ratio transmissions which are considered emerging technologies have experienced an increase in sales in Brazil with over twice as many sales in 2013 compared to 2012 seven- and eight-gear ratio transmissions are popular among the large sports and off-road segments all of which are imported models luxury manufacturers such as Mercedes-Benz and audi are selling the most seven-gear vehicles as a share of their sales Volkswagen and toyota are also selling similar numbers of seven-gear ratio vehicles although for Volkswagen and toyota it represented less than 3 of their brand sales BMW and land rover are the leaders in eight-gear ratio vehicles
20
Brazil Passenger Vehicle Market statistics
0
10
20
30
40
50
60
70
80
90
100
Subco
mpac
t
Compac
t
Medium
Larg
eSport
O-Road
SUV
Miniva
nTo
tal
Tech
nolo
gy
shar
e
8 7 6 5 4
Figure 3‑10 ndash number of gear ratios by segment
0
10
20
30
40
50
60
70
80
90
100
Fiat GM
Volkswag
enFord
Renau
lt
Hyund
ai
Honda
Toyo
taPSA
Nissan
Mitsub
ishi
KIAJA
CBMW
Land
Rove
r
Merce
des-B
enz
Chery
Audi
Suzuk
iJe
epTo
tal
Tech
nolo
gy
shar
e
8 7 6 5 4
Figure 3‑11 ndash number of gear ratios by manufacturer
0
10
20
30
40
50
60
70
80
90
100
Tech
nolo
gy
shar
e
Six or more Five Four or fewer
China2010
Korea2011
EU-272013
US2013
India2012
Brazil2013
Figure 3‑12 ndash number of gear ratios international comparison
21
ICCT white paper
DRiVETRaiNDrivetrain technology includes front-wheel drive (FWD) rear-wheel drive (rWD) and all-wheel drive (aWD) vehicles For the same vehicle size FWD vehicles provide more interior space and better energy consumption than rWDs due to lower weight as it avoids the added weight of and space for the driveshaft and differential that rWD requires Because the weight of the engine and transmission is located close to the wheels FWD vehicles have better traction than rWDs rWDs however show better handling as the weight distribution between the front and rear wheels is more uniform and the tasks of turning and acceleration are split between the front and rear wheels also directing large amounts of power through the front wheels can create ldquotorque steerrdquo thus rWD is the adequate technology for the sports segment aWD drivetrains are intended for specific driving applications that imply loss of traction such as off-road terrains snow or towing
FWD vehicles dominate all segments of the Brazilian passenger car market (Table 3‑1) with the exception of the off-road segment (Figure 3‑13) among the 20 largest manufacturer sellers most except for BMW land rover Mercedes-Benz and suzuki offer FWD technology (Figure 3‑14) Brazil has the highest market share of FWD vehicles of all countries analyzed (944) although FWD has at least 50 market share in all seven countries (Figure 3‑15)
aWD market share increased by 15 between 2012 and 2013 due to a tri-fold increase in the sports segment sales off-road vehicle sales with aWD also increased to more than 76000 units in 2013 amongst the largest ten manufacturers toyota is the aWD market leader followed by Ford and Volkswagen note that land rover sells only aWD vehicles in Brazil among non-luxury manufacturers Mitsubishi and suzuki are selling more than 50 of their vehicles with aWD technology
rWD technology is offered mostly in large and sports vehicles and in suVs among the 10 largest manufacturers rWD is offered mainly by gM and toyota while an extended examination of the 20 largest manufacturers by sales show that aWD and rWD is focused among the more expensive brands (Figure 3‑14) Mercedes-Benz and BMW sell close to 90 of their vehicles with rWD technology traditionally associated with engine performance and responsiveness
22
Brazil Passenger Vehicle Market statistics
0
10
20
30
40
50
60
70
80
90
100
Subco
mpac
t
Compac
t
Medium
Larg
eSport
O-Road SUV
Miniva
nTo
tal
Tehn
olo
gy
shar
e
AWD RWD FWD
Figure 3‑13 ndash Drivetrain by segment
0
10
20
30
40
50
60
70
80
90
100
Fiat GM
Volkswag
enFord
Renau
lt
Hyund
ai
Honda
Toyo
taPSA
Nissan
Mitsub
ishi
KIAJA
CBMW
Land
Rove
r
Merce
des-B
enz
Chery
Audi
Suzuk
iJe
epTo
tal
Tech
nolo
gy
shar
e
AWD RWD FWD
Figure 3‑14 ndash Drivetrain by manufacturer
0
10
20
30
40
50
60
70
80
90
100
China2010
Korea2011
EU-272013
US2013
Japan2011
India2012
Brazil2013
Tech
nolo
gy
shar
e
AWD RWD FWD
Figure 3‑15 ndash Drivetrain international comparison
23
ICCT white paper
VaLVE CaMShaFT CONFiGURaTiON (DOhC VS SOhC)the engine camshaft governs the timing duration and lift of valve operation controlling the intake of air and the exhaust of combustion gases this report focuses on single overhead camshafts (sohc) and dual overhead camshafts (Dohc) as these configurations have almost completely replaced the older overhead valve configuration (ohV) sohc design places a single camshaft above the cylinder head that governs all the valves intake and exhaust in the case of sohc V-engines there is one single camshaft per head Dohc designs use separate camshafts for intake valves and exhaust valves Dohc engines achieve increased airflow at high-engine speeds improve volumetric efficiency and reduce the valvetrainrsquos moving mass such engines typically develop higher power at high-engine speeds the us environmental Protection agency (ePa) and national highway traffic safety administration (nhtsa) estimate the effectiveness of Dohc over sohc to be between 1 and 25 (ePanhtsa 2010)
although Dohc produce more power and provide lower fuel consumption the Brazilian fleet is still mostly composed of sohcs vehicles (Table 3‑1) sohc technology is predominant among the subcompact compact and medium segments (Figure 3‑16) among manufacturers sohc technology is predominant among the five largest least expensive brands (Figure 3‑17) sales of vehicles with more advanced Dohc technology grew in 2013 by almost 36 with respect to 2012 albeit from a relatively smaller base this increase was experienced in all vehicle segments but in different magnitudes
although global data on this technology are scarce Figure 3‑18 indicates that most countries are moving away from sohc with Brazil being the only country analyzed where sohc is still predominant no data were available for the us or europe
24
Brazil Passenger Vehicle Market statistics
0
10
20
30
40
50
60
70
80
90
100
Subco
mpac
t
Compac
t
Medium
Larg
eSport
O-Road SUV
Miniva
nTo
tal
Tech
nolo
gy
shar
e
nd DOHC SOHC
Figure 3‑16 ndash Valve camshaft configuration by segment (nd no data)
0
10
20
30
40
50
60
70
80
90
100
Fiat GM
Volkswag
enFord
Renau
lt
Hyund
ai
Honda
Toyo
taPSA
Nissan
Mitsub
ishi
KIAJA
CBMW
Land
Rove
r
Merce
des-B
enz
Chery
Audi
Suzuk
iJe
epTo
tal
Tech
nolo
gy
shar
e
nd DOHC SOHC
Figure 3‑17 ndash Valve camshaft configuration by manufacturer (nd no data)
0
10
20
30
40
50
60
70
80
90
100
China2010
Korea2011
Japan2011
India2012
Brazil2013
Tech
nolo
gy
shar
e
nd OVC DOHC SOHC
Figure 3‑18 ndash Valve camshaft configuration international comparison (nd no data)
25
ICCT white paper
VaLVE aCTUaTiON improved valvetrain systems with variable valve actuation (VVa) technology either variable valve timing (VVt) or variable valve timing and lift (VVt+VVl) improves the enginersquos volumetric and thermodynamic efficiency they also enable further engine improvements such as internal exhaust gas recirculation and cylinder deactivation VVt alters the timing of the intake valve exhaust valve or both primarily to reduce pumping losses increase specific power and control residual exhaust gases VVl increases efficiency by optimizing airflow over a broader range of engine operation which reduces pumping losses and increases specific power VVl is accomplished by controlled switching between two or more cam profile lobe heights the most advanced technology VVt+VVl yields a wide range of performance optimization and volumetric efficiency including enabling the engine to be valve-throttled (no need for intake throttle) VVt provides energy consumption gains of 3 to 5 while the more flexible and complex VVt+VVl system can reach 4 to 8 (ePa amp nhtsa 2010)
VVa technology either VVt or VVt+VVl are emerging technologies in Brazil where most vehicles still have fixed-valve timing designs (Table 3‑1) Fixed technology is predominant among the smaller vehicle segments as well as suVs and minivans (Figure 3‑19) the five largest manufacturers sold more than 90 of their vehicles with fixed-valve technology in 2013 (Figure 3‑20) the international comparison indicates that only Brazil and india have not yet adopted VVa technologies for most of their light-duty fleet (Figure 3‑21)
VVt and VVt+VVl are being adopted across all segments including the subcompact segment but tend to be more predominant in high-end manufacturers a closer examination by manufacturer shows that most are offering some vehicles with either one of the VVa systems while honda and hyundai offer this technology in almost all vehicles (Figure 3‑20) honda is the technology leader in variable valve actuation with the adoption in the early 1990s of the Vtec system (Valve timing electronic control) VVt technologyrsquos market share grew by about 25 in 2013 primarily due to hyundairsquos sales from 80000 units in 2012 to almost 200000 units in 2013 hyundai offered the continuously variable valve technology (cVVt) in the large majority of vehicle sold in 2013 the sports segment is the one where VVt dominates the market Mitsubishi BMW and audi are also selling a large share of their vehicles with the VVt+VVl technology
26
Brazil Passenger Vehicle Market statistics
0
10
20
30
40
50
60
70
80
90
100
Subco
mpac
t
Compac
t
Medium
Larg
eSport
O-Road SUV
Miniva
nTo
tal
Tech
nolo
gy
shar
e
VVT+VVL VVT Fixed
Figure 3‑19 ndash Valve actuation by segment
0
10
20
30
40
50
60
70
80
90
100
Fiat GM
Volkswag
enFord
Renau
lt
Hyund
ai
Honda
Toyo
taPSA
Nissan
Mitsub
ishi
KIAJA
CBMW
Land
Rove
r
Merce
des-B
enz
Chery
Audi
Suzuk
iJe
epTo
tal
Tech
nolo
gy
shar
e
VVT+VVL VVT Fixed
Figure 3‑20 ndash Valve actuation by manufacturer
VVT+VVL VVT Fixed
0
10
20
30
40
50
60
70
80
90
100
China2010
Korea2011
US2013
Japan2011
India2012
Brazil2013
Tech
nolo
gy
shar
e
Figure 3‑21 ndash Valve actuation international comparison
27
ICCT white paper
FUEL SYSTEMS FOR GaSOLiNE VEhiCLESVehicle fuel systems describe the technology required to deliver fuel into the engine combustion chamber this section examines two gasolineflex technologies namely multi-point fuel injection (MPFi) and gasoline direct injection (gDi) MPFi is now the most common fuel-delivery system for gasoline engines used in passenger vehicles worldwide in sequential MPFi engines fuel is injected into the air stream next to the intake valve port while the intake valve is open to draw the air-fuel mixture into the cylinder some of the fuel is vaporized on the surface of the hot intake valve expanding and thus reduces the volumetric efficiency on gDi engines fuel is injected at high pressure directly into the combustion chamber improving volumetric efficiency and providing cooling of the airfuel charge within the cylinder which allows for higher compression ratios and increased thermodynamic efficiency gDi technology alone offers benefits of 2 to 5 with respect to MPFi engines but bigger benefits rely on the synergy between gDi turbocharging and downsizing which can reach 12 to 15 energy consumption reduction with respect to a MPFi naturally aspirated engine (ePa 2012)
Table 3‑1 illustrates that MPFi is still the most common fuel injection technology for gasolineflex vehicles in Brazil which is reflected in its dominant share across most segments except for sports and off-road vehicles in Brazil gDi has found a niche market in the sports and off-road segments with more than 90 of sport vehicles fitted with gDi technology (Figure 3‑22) Within the overall gasoline market the gDi technology is still an emerging technology representing just 24 of new sales gDirsquos market share increased by 31 in 2013 with all but 4000 units being imported among the 10 largest manufacturers the adoption of gDi is extremely low below 5 for Volkswagen Ford hyundai and Psa (Figure 3‑23) high-end european brands (audi land rover Mercedes-Benz and BMW) are the technology leaders in terms of gDi adoption rates echoing the trend of turbocharging technology sales Volkswagen vehicles with gDi systems account for less than 35 of their sales in 2013 but their absolute numbers (around 19000 vehicles) place the company as one of the leaders in gDi technology in the Brazilian market
From a global market perspective the penetration of gDi technology in Brazil is low compared to all other markets in Figure 3‑24 except for india and japan it should be noted that the later has the largest share of hybrid vehicles around the globe
28
Brazil Passenger Vehicle Market statistics
0
10
20
30
40
50
60
70
80
90
100
Compac
t
Subco
mpac
t
Medium
Larg
eSport
O-Road SUV
Miniva
nTo
tal
Tech
nolo
gy
shar
e
GDI MPFI
Figure 3‑22 ndash gasolineflex fuel system by segment
GDI MPFI
0102030405060708090
100
Fiat GM
Volkswag
enFord
Renau
lt
Hyund
ai
Honda
Toyo
taPSA
Nissan
Mitsub
ishi
KIAJA
CBMW
Land
Rove
r
Merce
des-B
enz
Chery
Audi
Suzuk
iJe
epTo
tal
Tech
nolo
gy
shar
e
Figure 3‑23 ndash gasolineflex fuel system by manufacturer
GDI MPFI
0
10
20
30
40
50
60
70
80
90
100
China2010
Korea2011
EU-272013
US2013
Japan2011
India2012
Brazil2013
Tech
nolo
gy
shar
e (n
on-
die
sel)
Figure 3‑24 ndash gasolineflex fuel system international comparison
29
ICCT white paper
TURBOChaRGiNGengine power is primarily limited by the rate at which the engine is able to draw air into the combustion chamber turbocharging and supercharging are two methods to increase the amount of air drawn into the engine above the level of what is possible with the naturally aspirated process (through the expansion of the cylinders) By increasing the amount of air into the engine the amount of fuel can be proportionally increased resulting in increased power output level and with it the ability to reduce engine displacement while maintaining performance the combination of turbocharging and downsizing in spark ignited (gasoline and flex-fuel) vehicles can provide energy consumption improvements between 2 to 6 with respect to a direct-injected gDi engine (ePa amp nhtsa 2010) turbocharging technology is the cornerstone for achieving better energy consumption in vehicles as the basis for downsizing and reducing the engine weight while keeping the same or better vehicle performance (ie acceleration or time to reach certain speed) although turbochargers are used in diesel and gasolineflex vehicles the analysis in this report focuses on turbocharging for spark-ignited gasolineflex vehicles only
turbocharging is one of the most important emerging technologies in Brazil where most vehicles are still naturally aspirated (na) (Table 3‑1) turbocharging technology has increased the market share significantly between 2012 and 2013 by more than 65 albeit from a small base (from about 49000 to 81000 vehicles)
Most vehicles with turbocharging are sold in the sports and off-road segments as this technology also produces superior engine power output (Figure 3‑25) among the 10 largest manufacturers turbocharging is still below 10 of their sales (Figure 3‑26) Volkswagen and Ford despite having small relative sales of vehicles with turbocharging (less than 35) are the manufacturers with the highest total sales of vehicles with turbocharging audi land rover Mercedes-Benz and BMW are the technology leaders with more than 90 of vehicle sales in 2013
the penetration of turbo and supercharging technologies in Brazil is lower than in other countries with a larger gasoline fleet such as the us china and japan (Figure 3‑27) in Brazil 95 of diesel passenger vehicle sales have turbocharging technology
30
Brazil Passenger Vehicle Market statistics
0
10
20
30
40
50
60
70
80
90
100
Compac
t
Subco
mpac
t
Medium
Larg
eSport
O-Road SUV
Miniva
nTo
tal
Tech
nolo
gy
shar
e (n
on-
Die
sel)
Turbo NA
Figure 3‑25 ndash turbocharging for gasolineflex fuel vehicles by segment (NA naturally aspirated)
0102030405060708090
100
Fiat GM
Volkswag
enFord
Renau
lt
Hyund
ai
Honda
Toyo
taPSA
Nissan
Mitsub
ishiKIA
JACBMW
Land
Rove
r
Merce
des-B
enz
Chery
Audi
Suzuk
iJe
epTo
tal
Tech
nolo
gy
shar
e (n
on-
Die
sel)
Turbo NA
Figure 3‑26 ndash turbocharging for gasolineflex fuel vehicles by manufacturer (NA naturally aspirated)
0
10
20
30
40
50
60
70
80
90
100
China2010
Korea2011
EU-272013
US2013
Japan2011
India2012
Brazil2013
Tech
nolo
gy
shar
e (n
on-
die
sel)
Turbo NA
Figure 3‑27 ndash turbocharging for gasolineflex fuel vehicles international comparison (NA naturally aspirated)
31
ICCT white paper
4 vEhiCLE ENErGy CONSuMpTiON
this section analyzes the Brazilian new passenger vehicle energy consumption in 2013 although other metrics are more common (see box) vehicle energy consumption is presented in megajoules per kilometer (Mjkm) for consistency with Brazilrsquos inovar-auto policy in 2012 Brazilrsquos Ministry of Development industry and Foreign trade (MDic) adopted the inovar-auto policy with the aim of fostering industrial competitiveness through technology investments the policy includes a target for corporate average energy consumption (in Mjkm with vehicle curb weight as the attribute parameter) for vehicles sold in 2017
in the us canada Mexico and saudi arabia fleet-average fuel economy standards are defined as a function of vehicle footprint in the eu china japan south Korea and india vehicle weight is the attribute for the calculation of fleet-average targets in Brazil inovar-auto has defined its fiscal targets for vehicle energy consumption measured in megajoules per kilometer (Mjkm) as a function of vehicle weight
VEhiCLE ENERGY MEaSUREMENT UNiTS
Many metrics can be used to describe the amount of fuel energy or emissions generated by unit of distance traveled
Fuel economy measures distance traveled per unit of fuel consumed in Brazil kilometers per liter (kml) is the most common metric to describe vehicle efficiency but other units are used in different countries such as miles per gallon (mpg) in the us
Fuel consumption is the reciprocal of fuel economy and measures fuel consumed per distance traveled it is usually expressed in liters per 100 kilometers (l100 km) and it is used in europe for example
GhGCO2 emissions measures ghg or co2 emissions per distance traveled expressed as grams of pollutant per kilometer or mile
Energy consumption (EC) measures the energy consumed per distance traveled for example in megajoules per kilometer Despite being a less common metric it is sometimes preferred for being a fuel-neutral metric across different types of fuel and vehicle technologies Vehicle energy consumption in Mjkm is the metric used in Brazilrsquos inovar-auto policy to quantify the corporate average energy consumption target for each manufacturer Values for energy consumption in Brazilian spark-ignited vehicles are provided for e22 since that is the fuel mixture used in vehicle tests
Vehicle energy consumption in this report is calculated from co2 emissions data in the Brazilian institute of environment and renewable natural resources (iBaMa) nota Verde program (iBaMa 2014) which reports official emissions data from homologation tests Data are limited to passenger cars sold by the top 10 manufacturers with light commercial vehicles being excluded appendix D presents a description of data sources
32
Brazil Passenger Vehicle Market statistics
and calculation methodologies as well as a discussion of vehicle energy consumption data quality and completeness in Brazil
not surprisingly vehicle energy consumption increases with vehicle footprint and engine rated power the two parameters that define vehicle segments in Brazil (Figure 4‑1) subcompact and compact vehicles which accounted for about 45 of new sales in 2013 have average energy consumption below the fleet average while medium-sized vehicles which hold the largest market share (388) have energy consumption just above the fleet average larger more powerful vehicles consume more energy than the fleet average but have a considerably smaller market share (combined share of 163) Data availability for these segments is not as extensive as the data available for the subcompact compact and medium segments which could affect the relative rankings of each segment
Ene
rgy
cons
ump
tio
n (M
Jkm
)
Subco
mpac
t
Compac
t
Medium
Larg
e
O-road SUV
4000
200000
400000
600000
850000
35
30
25
20
15
10
05
0
Sales
Total 202
Figure 4‑1 ndash new vehicle sales-weighted average energy consumption by segment (2013)
33
ICCT white paper
Figures 4‑2 and 4‑3 illustrate new vehicle energy consumption for multiple weight and footprint bins For each weight bin (in 100 kg increments) and footprint bin (in 01 m2 increments) sales-weighted averages of energy consumption for each vehicle version are presented (dashes) generating energy consumption ranges for each bin (cream areas) Vehicle sales by bin are presented for reference in the lower charts
the strong correlation between vehicle energy consumption and weight follows from the strong physical relationship between the weight of the vehicle and the energy required to accelerate it and overcome resistances9 (Figure 4‑2) Data dispersion within each bin suggests that energy consumption varies due to other vehicle characteristics that affect vehicle aerodynamics and rolling resistance as well as the adoption of technologies that affect engine and transmission efficiency (eg friction reduction technologies gDi VVt)
Curb weight (kg)
SubcompactCompactMediumLargeO-roadSUV
Ene
rgy
cons
ump
tio
n (M
Jkm
)Sa
les
5
6
4
3
2
1
600k
800k
400k
200k
0k800 900 1000 1100 1200 1300 1400 1500 1600 1700 1800 1900 2000 2100
Figure 4‑2 ndash new vehicle energy consumption by vehicle weight (2013)
9 on a plain surface the sum of resistances of a vehicle is acceleration resistance + rolling resistance + aerodynamic resistance = c1 m a + c2 frr m + c3 cw a v2 with mass (m) as an integral part of both acceleration and rolling resistance which are most relevant for inner-city driving situations other factors are acceleration (a) rolling resistance of tires (frr) aerodynamic coefficient of the vehicle (cw) frontal area of vehicle (a) velocity (v) and constants (cx)
34
Brazil Passenger Vehicle Market statistics
Footprint has a reasonable correlation with energy consumption (Figure 4‑3) ie larger vehicles tend to consume more fuel than smaller vehicles however the correlation is not as strong as with vehicle weight similar to the previous figure the broad spread of energy consumption values suggests a combination of different vehicle characteristics (eg weight engine displacement rated power) and technologies (eg transmissions fuel systems) as well as the presence of suVs and off-road vehicles among the medium- and large-sized footprint values respectively
Footprint (m2)
SubcompactCompactMediumLargeO-roadSUV
Ene
rgy
cons
ump
tio
n (M
Jkm
)Sa
les
5
6
4
3
2
1
400k
500k
300k
200k
100k
0k31 32 33 34 35 36 37 38 39 40 41 42 43 44 45 46 48 49
Figure 4‑3 ndash new vehicle energy consumption by vehicle footprint (2013)
35
ICCT white paper
Figure 4‑4 illustrates sales weighted average for new vehicle energy consumption by mass for the top 10 manufacturers in Brazil in 2013 Bubble sizes are proportional to total vehicle sales Manufacturers in the lower-left quadrant produce the lightest and most efficient vehicles with hyundai presenting the best overall average energy consumption renault in the upper-left quadrant produces vehicles that are equivalent in weight but on average with higher energy consumption in the lower-right quadrant are manufacturers that produce relatively heavier vehicles but with lower energy consumption in their weight class Despite producing heavier vehicles on average than many manufacturers honda achieves lower energy consumption on average in the upper-right quadrant are manufacturers that produce on average the heavier and least efficient vehicles with Psa (citroen and Peugeot) producing the heaviest and least efficient cars on average a regression line correlating vehicle energy consumption and mass highlights the best performers (hyundai honda and nissan) average performers (Fiat Volkswagen gM and toyota) and those performing worse than average (renault Ford and Psa)
FIA
GMVW
FORREN
HYU
HON
TOY
PSA
NIS
160
170
180
190
200
210
220
230
240
250
950 1000 1050 1100 1150 1200 1250 1300 1350
Ene
rgy
cons
ump
tio
n (M
Jkm
)
Curb weight (kg)
Fleet Ave
Figure 4‑4 ndashaverage new vehicle sales-weighted energy consumption by manufacturer (2013)
36
Brazil Passenger Vehicle Market statistics
Figure 4‑5 shows fleet-average energy consumption based on certification and type approval data for new vehicles in multiple countries converted to the us caFe combined driving cycle Bubble sizes represent total sales of new passenger cars Because of data availability in different countries the country comparison is based on different calendars years for different countries 2011 for south Korea and japan 2012 for china and india and 2013 for europe the us and Brazil given annual improvements in vehicle energy consumption triggered by regulatory efficiency standards and fiscal incentives those countries with older data could be at a slight disadvantage in this comparison
With the heaviest vehicles on average the us fleet is also the most energy consuming of all countries china and south Korea have similar average energy consumption but since south Korean vehicles are heavier on average they are relatively more efficient than chinese vehicles although Brazilrsquos fleet consumes less fuel on average than those from the us china and south Korea its fleet is relatively inefficient when compared to countries with vehicles of similar weight (japan and india) the average Brazilian vehicle consumes about 34 more energy than the average vehicle in japan whose fleet has a large penetration of gasoline hybrid and advanced fuel-efficiency technologies such as three-cylinder engines VVa Dohc and 6-plus speed transmissions european vehicles are the best performing on average despite being heavier than all countries with the exception of the us and south Korea the adoption of fuel-efficiency technologies (eg Dct 6-plus-speed transmissions gDi turbocharging) contributes to europersquos better than average performance
China2012
SKorea2011
Europe2013
US2013
Japan2011
India2012
Brazil2013
Sales5 MM10 MM
14
16
18
20
22
24
26
28
1000 1100 1200 1300 1400 1500 1600 1700
Ene
rgy
cons
ump
tio
n ndash
CA
FE
(M
Jkm
)
Curb weight (kg)
Type-approval and certification energy consumption data only (does not include o-cycle or real-world driving data)
Figure 4‑5 ndash international comparison of passenger car energy consumption
Country labels indicate the dataset year
Figure 4‑6 provides a more detailed country comparison by illustrating average vehicle energy consumption by vehicle (curb) weight bin Vehicle sales in each bin are shown for reference the us is not shown due to lack of detailed model-by-model data Brazilrsquos vehicles on average have the highest energy consumption in most weight
37
ICCT white paper
bins with china being the second highest in most bins Because china has higher fuel consumption than Brazil on the 1000 bin which represents the highest share of vehicle sales fleet-average energy consumption in china is still higher than in Brazil as illustrated in the previous figure europe consistently performs best in terms of vehicle energy consumption in most weight bins with japan also performing relatively well
Curb weight (kg)
BrazilChinaEuropeIndiaJapanSouth Korea
Ene
rgy
cons
ump
tio
n C
AF
E (
MJ
km)
Sale
s
40
35
25
20
15
10
6M
8M
4M
2M
0M600 800 1000 1200 1400 1600 1800 2000 2200 2400
Figure 4‑6 ndash international comparison of average vehicle energy consumption by vehicle weight
Type-approval and certification energy consumption data only (does not include off-cycle or real-world driving data)
38
Brazil Passenger Vehicle Market statistics
Figure 4‑7 illustrates the distribution of energy consumption data in Brazil for each vehicle version by mass and segment Bubble sizes represent total sales of each version Data were limited to flex-fuel vehicles in the subcompact compact medium and large segments due to its relatively better data quality and representativeness (ie they represented over 87 of sales in 2013) While most vehicles follow a predictable trend that correlates energy consumption and vehicle mass there are a large number of versions with energy consumption substantially higher than the trend line this suggests there is substantial room for improvements in their energy consumption since there are vehicles in similar weight classes with substantially superior energy consumption performance
Sales1000050000
140
160
180
200
220
240
260
280
700 800 900 1000 1100 1200 1300 1400 1500 1600
Ene
rgy
cons
ump
tio
n (M
Jkm
)
Curb weight (kg)
Subcompact Compact Medium Large Fleet average
Figure 4‑7 ndash Distribution of new Brazilian passenger vehicle energy consumption data by vehicle weight and segment (2013)
this chapter suggests that there are potential improvements in vehicle energy consumption for the Brazilian fleet For similar vehicles in terms of weight class footprint or engine rating there is substantial dispersion in energy consumption indicating that there are vehicles performing much worse than the average across manufacturers there is also a clear trend of some manufacturers performing much better than the average while others have a lot more room for improvement the international comparison clearly shows that Brazilian vehicles perform much worse in terms of energy consumption than vehicles of similar weight suggesting a delay in the adoption of energy efficient technologies among Brazilian vehicle manufacturers
Finally a more detailed analysis of vehicle versions clearly illustrates a considerable number of vehicle versions significantly above average thus indicating potential improvements in energy consumption that would place them on par with better performing vehicles with similar characteristics
39
ICCT white paper
Deficiencies in data quality and completeness prevent more definite conclusions about vehicle energy consumption gasoline-only vehicles in particular have poor energy consumption data quality although they represent a relatively small fraction (6) of total vehicles sold in 2013 Because some vehicle segments are primarily composed of gasoline-only vehicles (eg sports minivans) this chapter excludes these segments from the analysis there are also concerns about the gap between energy consumption data reported by iBaMarsquos nota Verde and Brazilrsquos national institute of Metrology standardization and industrial Qualityrsquos (inMetro) labeling program (PBeV using its acronym in Portuguese) with the latter reporting consistently lower values of vehicle energy consumption
Finally the availability of energy consumption data was not adequate for many manufacturers beyond the top 10 sales group which prevented their inclusion in this analysis Despite the data quality and lack of completeness the energy consumption data in this chapter include data that are reasonably accurate and representative thus supporting its interpretation
40
Brazil Passenger Vehicle Market statistics
rEfErENCES
aDK automotive consultoria de Marketing (2013) relatoacuterios de volumes de vendas do mercado brasileiro para veiacuteculos de passeio e comerciais leves referentes a 2013
alves l Wilbert M (2014) reduccedilatildeo do imposto sobre Produto industrializado e a Venda de automoacuteveis Xi congresso usP iniciaccedilatildeo cientiacutefica em contabilidade
associaccedilatildeo nacional de transportes Puacuteblicos (antP 2014) estudo mostra baixo efeito do desconto no iPi de veiacuteculos sobre PiB e emprego available at httpwwwantporgbrwebsitenoticiasshowaspnpgcode=a4DeeFe8-a7BF-48D3-B1F5-8eDe1447BF10
associaccedilatildeo nacional dos Fabricantes de Veiacuteculos automotores (anFaVea 2015) anuaacuterio da induacutestria automobiliacutestica Brasileira 2015 Brazilian automotive industry Yearbook 2015 satildeo Paulo available at wwwanfaveacombr
european environment agency (2014) Monitoring co2 emissions from new passenger cars in the eu summary of data for 2013 april 2014
instituto Brasileiro do Meio ambiente e dos recursos naturais renovaacuteveis (iBaMa 2014) consulta dos niacuteveis de emissatildeo dos veiacuteculos novos brasileiros available at httpsservicosibamagovbrctfpublicosel_marca_modelo_rvepphp
international council on clean transportation (icct 2015) global passenger vehicle standards available at httpwwwtheicctorginfo-toolsglobal-passenger-vehicle-standards
international energy agency (iea 2015) renewables Bioenergy available at httpswwwieaorgtopicsrenewablessubtopicsbioenergy
Korea energy Management corporation (KeMco 2014) Fuel economy regulation available at httpwwwkemcoorkrnew_engmainmainasp
Marklines (2015) Marklines automotive industry Portal available at httpwwwmarklinescomen
Mendonccedila M sachsida a (2014) Modelando a demanda de creacutedito para veiacuteculos no Brasil uma abordagem com mudanccedila de regime iPea
Ministeacuterio do Desenvolvimento induacutestria e comeacutercio exterior (MDic 2013) Programa de incentivo agrave inovaccedilatildeo tecnoloacutegica e adensamento da cadeia Produtiva de Veiacuteculos automotores mdash inovar-auto httpwwwplanaltogov brccivil_03_ato2011-20142012DecretoD7819htm
stein r anderson j and Wallington t (2013) an overview of the effects of ethanol-gasoline Blends on si engine Performance Fuel efficiency and emissions SAE Int J Engines 6(1)470-487 2013 doi1042712013-01-1635
us environmental Protection agency and national highway traffic safety administration (ePanhtsa 2010) Final rulemaking to establish light-Duty Vehicle greenhouse gas emission standards and corporate average Fuel economy standards ePa-420-r-10-901
us environmental Protection agency (ePa 2012) regulatory impact analysis Final rulemaking for 2017-2025 light-Duty Vehicle greenhouse gas emission standards and corporate average Fuel economy standards ePa-420-r-12-016
41
ICCT white paper
us national academy of sciences (nas 2011) assessment of Fuel economy technologies for light-Duty Vehicles available at httpwwwnapeducatalog12924assessment-of-fuel-economy-technologies-for-light-duty-vehicles
World Bank group (2015) World Development indicators available at httpdataworldbankorgdata-catalogworld-development-indicators
42
Brazil Passenger Vehicle Market statistics
LiST Of ACrONyMS
4wD Four-wheel drive
aNFaVEa Brazilian association of automobile Manufacturers
awD all-wheel drive
BRiC Brazil russia india china
CaFE corporate average fuel economy
CBG compressed biogas
CO2 carbon dioxide
CVT continuously variable transmission
CVVT continuously variable valve technology
DCT Dual-clutch transmission
DOhC Dual overhead camshaft
EC energy consumption
Epa us environmental Protection agency
EU european union
FFV Flex-fuel vehicle
FTp Federal test procedure
FwD Front-wheel drive
GDi gasoline direct injection
GDp gross domestic product
GhG greenhouse gas
GM general Motors
iBaMa Brazilian institute of the environment and renewable natural resources
iC internal combustion
iCCT international council on clean transportation
iNMETRO national institute of Metrology standardization and industrial Quality
Kg Kilogram
Km Kilometer
Kw Kilowatt
LDV light-duty vehicle
LpG liquified petroleum gas
MDiC Ministry of Development industry and Foreign trade
MJ Megajoule
MpFi Multi-point fuel injection
Mpg Miles per gallon
NaS us national academy of sciences
43
ICCT white paper
NhTSa us national highway transportation safety administration
OhV overhead valve
pBEV Brazilian Vehicle labeling Program
pSa Psa Peugeot citroeumln
pTwR Power-to-weight ratio
pV Passenger vehicle
RwD rear-wheel drive
SOhC single overhead camshaft
SUV sport utility vehicle
US united states
USD us dollar
VTEC Valve timing electronic control
VVa Variable valve actuation
VVL Variable valve lift
44
Brazil Passenger Vehicle Market statistics
AppENDix A SEGMENT DEfiNiTiONS
Table a‑1 ndash segment definitions
Segmentpower (kw)
pTwR (kwkg) area (m2)
Other characteristics Examples
Subcompact lt 140 lt 0075 le 65 mdash Mini cooper chevrolet celta smart Fortwo
Compact lt 140 lt 0075 65 lt area le 70 mdash honda Fit hyundai hB20 Volkswagen Polo
Medium lt 140 lt 0075 70 lt area le 80 mdash honda civic nissan tiida Peugeot 308
Large lt 140 lt 0075 gt 80 mdash audi a4 BMW 3 series Mercedes c-class
Sports gt 140 gt 0075 mdash 4 seats maxjaguar XF lamborghini gallardo Ferrari california
Off‑road mdash mdash lt 80 traction = 4WDjeep cherokee honda cr-V BMW X3 hyundai santa Fe
SUV mdash mdash lt 80Based on aDKrsquos default classification
BMW X1 Ford ecosport hyundai tucson
Minivan mdash mdash Passengers 6-12
citroen grand Picasso Kia carnival
45
ICCT white paper
AppENDix b iNTErNATiONAL MArKET DATA
Table B‑1 ndash international market comparison of new fleet characteristics
parameters China S Korea EU US Japan india Brazil
Year 2012 2011 2013 2013 2011 2012 2013
Sales (million) 155 13 118 156 352 256 304
price (USD) $21008 $21383 $24439 mdash $20637 $11717 $22015
No of cylinders mdash 43 40 47 38 36 40
Displacement (cc) 1605 1960 1613 2606 1425 1294 1430
Curb weight (kg) 1296 1421 1391 1623 1193 1059 1106
Length (mm) 4323 4531 4263 mdash 4013 3859 4100
Footprint (m2) 38 420 40 425 371 341 367
Engine power (kw) 86 120 89 148 78 55 76
pTwR (kwkg) 00664 00844 00640 00912 00654 00519 00671
Energy consumption ndash US CaFE (MJKm)[1] 235 206 169 250 171 183 202
[1] energy consumption data presented here for countries other than Brazil were obtained from local official sources in its original metric and drive cycle and then converted to Mjkm under the us caFe drive cycle using the methodology described in Yang (2015) Mode details and historical fuel consumption data on their original metrics is presented in the icctrsquos global PV standard website httpwwwtheicctorginfo-toolsglobal-passenger-vehicle-standards
Data Sources
China Ministry of industry and information technology (Miit 2014) corporate average Fuel efficiency accounting Method for Passenger cars available at httpwwwgovcngzdt2013-0320content_2358627htm
Baseline performance china automotive research and technology center through internal communication and icct internal 2010 database for chinese light-duty vehicles
S Korea internal communication with s Korean official and from greencarcongress available at httpwwwgreencarcongresscom200906korea-20090604html
EU european environment agency (2014) Monitoring co2 emissions from new passenger cars in the eu summary of data for 2013 april 2014
US us ePa (2014) light-duty automotive technology carbon dioxide emissions and fuel economy trends1975 through 2014 table 91 page 110 available at http httpwwwepagovfueleconomyfetrends1975-2014420r14023apdf
Japan jaMa (2010) the Motor industry of japan available at httpwwwjama-englishjppublicationsMVs2010pdf Mlit httpwwwmlitgojpcommon000990330pdf
india Bureau of energy efficiency white paper 2010-2012 calculation based on icct database
Brazil icct Brazil Vehicle Database (2013)
46
Brazil Passenger Vehicle Market statistics
Table B‑2 ndash international market comparison of technology adoption in new vehicles
Technology adoption China S Korea EU US Japan india Brazil
Year 2010 2011 2013 2013 2011 2012 2013
Fuel type
CBGLpGFlex 0 11 2 0 0 4 94
Gasoline 99 65 44 93 86 56 6
hybrid 0 1 1 5 13 0 0
Diesel 1 23 53 1 0 40 0
No of cylinders
Two 0 0 0 0 0 6 0
Three 4 0 7 0 36 28 3
Four 90 84 87 56 57 65 97
Five 0 0 1 0 0 0
Six 6 15 4 32 5 0 1
Eight or more 0 0 0 12 1 0 0
Transmission
Manual 60 3 83 5 1 98 83
automatic 34 90 9 75 34 2 15
CVT 5 7 2 18 65 0 1
DCT 1 0 6 2 mdash 0 1
Number of gear ratios
Four or fewer 13 16 1 7 mdash 10 6
Five 68 9 45 11 mdash 85 83
Six or more 19 75 54 82 mdash 5 11
Drivetrain
FwD 74 86 81 83 59 76 0
RwD 21 7 7 10 5 22 0
4wD and awD 5 7 12 7 36 2 100
No of valves per cylinder
Two 17 mdash mdash 2 4 25 60
Multi valve 83 mdash mdash 98 95 75 40
Valve camshaft configuration
Single overhead camshaft 26 1 mdash mdash 16 41 63
Dual overhead camshaft 74 84 mdash mdash 82 53 25
Overhead camshaft mdash 15 mdash mdash 0 6 mdash
Valve actuation
Fixed 50 16 mdash 2 11 86 78
VVT 44 84 mdash 98 89 12 16
VVL 6 mdash mdash mdash mdash 2 6
Fuel systems for gasoline vehicles
Multi‑point fuel injection 94 72 68 62 95 100 98
Gasoline direct injection 6 28 32 37 5 0 2
air induction systems for gasoline vehicles
Naturally aspirated 93 75 41 85 92 64 97
Supercharger turbocharger or twin‑turbo 7 25 59 15 8 36 3
47
ICCT white paper
AppENDix C NEW vEhiCLE ChArACTEriSTiCS AND TEChNOLOGy ADOpTiON DATA iN brAziL
Table C‑1 ndash Fleet characteristics of new Brazilian passenger vehicles by segment (2013)
parameters Subcompact Compact Medium Large Sports Off‑road SUV Minivan
Sales (thousands) 6785 6843 11790 1920 273 768 1997 23
Market share () 223 225 38 8 63 09 25 65 01
price (R$) $30103 $38732 $45496 $66508 $148834 $151284 $75164 $82284
No of cylinders 400 391 399 400 462 448 404 433
Displacement (cc) 1128 1293 1447 1794 2430 2586 1884 2244
Curb weight (kg) 940 1037 1102 1329 1561 1772 1395 1604
Length (mm) 3804 4026 4163 4499 4711 4516 4352 4658
Footprint (m2) 339 361 371 402 418 409 402 427
Engine power ndash gasoline (kw) 58 68 75 99 183 146 103 120
Engine power ndash ethanol (kw) 59 70 77 98 mdash 109 101 mdash
pTwR ndash gasoline (kwkg) 00614 00655 00671 00742 01173 00828 00731 00732
pTwR ndash ethanol (kwkg) 00630 00678 00697 00757 mdash 00766 00745 mdash
48
Brazil Passenger Vehicle Market statistics
Table C‑2 ndash Fleet characteristics of new Brazilian passenger vehicles by manufacturer (2013)
parameters Fiat
GM
Vo
lksw
agen
Ford
Ren
ault
hyu
ndai
ho
nda
Toyo
ta
pSa
Nis
san
Mit
sub
ishi
Kia
JaC
BM
w
Land
Rov
er
Mer
ced
es‑B
enz
Che
ry
aud
i
Suzu
ki
Jeep
Sales (thousands) 6087 5486 5448 3074 2207 2055 1392 1334 1163 621 368 255 158 141 106 94 80 67 63 36
Market share () 2002 1804 1792 1011 726 676 458 439 383 204 121 084 052 046 035 031 026 022 021 012
price (R$) $35017 $42259 $38701 $46174 $43447 $50112 $67078 $68922 $103001 $44035 $100696 $87009 $37654 $165111 $221943 $153281 $30821 $142799 $74769 $139039
No of cylinders 400 401 400 402 400 370 400 400 400 400 408 416 400 424 448 431 400 411 400 552
Displacement (cc) 1250 1340 1287 1497 1423 1495 1691 1808 1575 1579 2262 1856 1411 2095 2281 1934 1398 1912 1831 3182
Curb weight (kg) 1033 1060 1020 1156 1102 1122 1210 1201 1231 1069 1556 1377 1079 1624 1868 1598 1097 1551 1444 1945
Length (mm) 3965 4155 3993 4120 4127 4078 4319 4299 4116 4171 4401 4357 3956 4574 4487 4527 3896 4454 4234 4584
Footprint (m2) 345 370 354 368 378 383 397 387 376 379 395 407 351 429 433 429 349 417 323 420
Engine power ndash gasoline (kw) 64 71 65 79 73 86 96 90 80 82 120 112 83 151 179 138 71 136 94 162
Engine power ndash ethanol (kw) 65 72 65 79 76 85 97 90 81 82 107 106 95 mdash mdash mdash 75 mdash mdash mdash
pTwR ndash gasoline (kwkg)
00613 00662 00631 00674 00657 00739 00788 00745 00646 00766 00779 00792 00784 00921 00977 00856 00638 00870 00649 00835
pTwR ndash ethanol (kwkg) 00629 00681 00642 00693 00685 00781 00800 00795 00660 00768 00710 00798 00896 mdash mdash mdash 00659 mdash mdash mdash
49
ICCT white paper
Table C‑3 ndash Fleet characteristics of new Brazilian passenger vehicles by origin (2013)
parameters Domestic imported
Sales (thousands) 2537 504
Market share () 834 166
price (R$) $41739 $76049
No of cylinders 397 412
Displacement (cc) 1359 1791
Curb weight (kg) 1070 1289
Length (mm) 4063 4285
Footprint (m2) 362 390
Engine power ndash gasoline (kw) 70 102
Engine power ndash ethanol (kw) 73 84
pTwR ndash gasoline (kwkg) 0065 0076
pTwR ndash ethanol (kwkg) 0068 0074
50
Brazil Passenger Vehicle Market statistics
Table C‑4 ndash technology adoption in new Brazilian passenger vehicles by segment (2013)
Technology adoption Subcompact Compact Medium Large SportOff‑road SUV Minivan
Fuel type
Flex 982 988 982 837 00 134 826 00
Gasoline 18 12 17 163 996 540 174 1000
hybrid 0000 0000 0028 0000 0396 0001 0000 0000
Diesel 00 00 00 00 00 326 00 00
No of cylinders
Three 01 91 10 00 00 00 00 00
Four 999 909 990 998 758 775 979 833
Five 00 00 00 02 03 00 00 00
Six 00 00 00 00 175 211 21 167
Eight or more 00 00 00 00 63 13 00 00
Transmission
Manual 993 944 826 622 62 174 505 641
automatic 07 55 161 283 629 707 451 359
CVT 00 00 12 89 09 93 34 00
DCT 00 01 02 06 299 25 10 00
No of gear ratios
Four or fewer 04 47 72 51 00 34 247 193
Five 984 943 848 378 15 392 516 641
Six 12 09 73 515 796 462 225 167
Seven 00 01 06 23 87 53 12 00
Eight or more 00 00 01 32 102 59 00 00
Drivetrain
FwD 998 1000 997 688 550 00 916 1000
RwD 02 00 03 311 221 00 84 00
awD 00 00 00 01 229 1000 00 00
No of valves per cylinder
Two 806 694 584 195 00 00 258 00
Multi valve 194 306 416 805 1000 1000 742 1000
Valve camshaft configuration
Single overhead camshaft 839 786 709 309 00 212 375 00
Dual overhead camshaft 24 158 161 546 880 517 446 255
Valve actuation
Fixed 982 729 807 461 49 493 664 868
VVT 18 211 115 470 827 367 252 132
VVT+VVL 00 61 78 68 124 140 84 00
Fuel systems for gasoline vehicles
Multi‑point fuel injection 999 998 997 949 979 143 766 1000
Gasoline direct injection 01 02 03 51 21 857 234 00
air induction systems for gasoline vehicles
Naturally aspirated 999 997 995 943 974 369 543 1000
Supercharger turbocharger or twin‑turbo 01 03 05 57 26 631 457 00
51
ICCT white paper
Table C‑5 ndash technology adoption in new Brazilian passenger vehicles by manufacturer (2013)
Technology adoption Fi
aT
GM
VO
LKSw
aG
EN
FOR
D
REN
aU
LT
hY
UN
Da
i
hO
ND
a
TOYO
Ta
pSa
NiS
SaN
MiT
SUB
iSh
i
Kia
JaC
BM
w
LaN
D R
OV
ER
MER
CED
ES
Fuel type
Flex 990 987 965 966 997 921 999 886 928 998 283 739 31 42 00 00
Gasoline 10 09 35 34 03 79 01 35 72 02 557 255 969 957 663 950
hybrid 00 00 00 00 00 00 00 02 00 00 00 00 00 00 00 00
Diesel 00 04 00 00 00 00 00 77 00 00 160 06 00 00 337 50
No of cylinders
Three 00 00 05 00 00 348 00 00 00 00 00 00 00 00 00 00
Four 1000 996 994 989 1000 626 999 998 1000 1000 958 922 1000 906 787 878
Five 00 00 00 00 00 00 00 00 00 00 00 00 00 00 00 00
Six 00 02 01 11 00 26 01 02 00 00 42 78 00 68 185 87
Eight or more 00 02 00 00 00 00 00 00 00 00 00 00 00 26 28 35
Transmission
Manual 992 878 985 846 853 632 566 565 703 785 493 120 1000 02 00 151
automatic 08 103 00 137 62 285 355 160 297 121 118 793 00 575 18 14
CVT 00 19 15 16 41 70 01 246 00 00 139 87 00 423 982 836
DCT 00 00 00 00 43 13 78 30 00 94 251 00 00 00 00 00
No of gear ratios
Four or fewer 02 04 00 55 104 237 00 323 249 132 17 133 00 00 00 00
Five 981 811 963 839 797 623 861 643 684 828 530 107 1000 00 00 64
Six 17 185 29 106 99 140 139 07 67 40 453 754 00 217 800 00
Seven 00 00 07 00 00 00 00 27 00 00 00 00 00 08 00 936
Eight or more 00 00 00 00 00 00 00 00 00 00 00 06 00 775 200 00
Drivetrain
FwD 1000 902 989 972 987 985 990 892 1000 1000 496 623 1000 00 00 00
RwD 00 91 00 00 00 00 00 16 00 00 00 370 00 882 00 900
awD 00 06 11 28 13 15 10 92 00 00 504 07 00 118 1000 100
No of valves per cylinder
Two 811 864 988 745 220 00 00 00 00 00 00 00 00 00 00 00
Multi Valve 189 136 12 255 780 1000 1000 1000 1000 1000 1000 1000 1000 1000 1000 1000
Valve camshaft configuration
SOhC 836 755 914 675 832 00 04 00 497 398 331 00 00 00 00 00
DOhC 07 108 56 50 168 992 786 875 352 428 477 1000 907 810 860 453
Valve actuation
Fixed 1000 898 965 966 940 29 00 574 736 573 435 76 124 187 18 55
VVT 00 102 35 34 60 971 00 426 264 427 00 924 876 00 982 945
VVT+VVL 00 00 00 00 00 00 1000 00 00 00 565 00 00 813 00 00
air induction System
Naturally aspirated 997 994 966 977 997 988 1000 923 922 1000 835 936 1000 97 37 101
Supercharger turbocharger or twin‑turbo
03 06 34 23 03 12 00 77 78 00 165 64 00 903 963 899
Fuel systems for gasoline vehicles
Multipoint fuel injection 1000 995 965 972 1000 989 1000 1000 967 1000 994 1000 1000 78 15 158
Gasoline Direct injection 00 05 35 28 00 11 00 00 33 00 06 00 00 922 985 842
note Difference between 100 and summation of sohc and Dohc market share values corresponds to data not available
52
Brazil Passenger Vehicle Market statistics
AppENDix D DATA SOurCES AND COMpLETENESS
the basis of the statistics shown in this report is a database compiled by the icct with vehicle sales technical information (eg fleet characteristics technology content) and energy consumption (converted from either co2 emissions or fuel economy) from various data sources outlined in table D-1
Table D‑1 ndash Brazilian data sources
parameters Sales TechnicalEnergy
consumption
aDK (2014 2015) x x
MarkLines (2015) x
iBaMa (2014) x
iNMETRO (2014) x
UOL (2014) x
icarroscom (2014) x
this analysis examined energy consumption data from two public sources the nota Verde Program by the Brazilian institute of the environment and renewable natural resources (iBaMa) and the Brazilian Vehicle labeling Program (PBeV) by the national institute of Metrology standardization and industrial Quality (inMetro) table D-2 summarizes key differences between these two data sources
Table D‑2 ndash energy consumption data sources
iBaMa iNMETRO
program nota Verde1 Brazilian Vehicle labeling Program (PBeV)2
program description
Mandatory program that reports emissions of co2 co nox and nMhc as part of emissions certification program
Voluntary program since 2009 that allows the comparison of fuel economy across vehicle models
Unit gco2 km kml
Test cycle chassis testing under urban (FtP) driving cycle based on nBr 66012005
chassis testing under urban (FtP) and highway (hWYFe) driving cycles based on nBr 702420103
adjustment
no adjustment for real-world driving conditions Because reported co2 emissions are assumed to be zero for ethanol adjustments were made to account for tailpipe co2 emissions for vehicles running on ethanol
since 2010 published values include real-world adjustment factors to chassis test data a method adopted by the us ePa in 2008
Conversion to MJkm
iBaMarsquos data are reported as FtP (city test) co2 data in gco2 km conversion to caFe test cycle and to a different metric (Mjkm) involves four steps as presented in Figure D-1
inMetrorsquos data in kml are presented separately by fuel type (e22 e100) and driving cycle (urban highway) conversion to Mjkm was done by applying a conversion factor (2167 gco2 l for e22 and 1428gco2l for e00) caFe values are obtained by using a 5545 weighting for the urban (FtP) and highway cycles respectively
1 iBaMa (2014) nota Verde program available at httpwwwmmagovbrcidades-sustentaveisqualidade-do-arcontrole-de-emissoes-veicularesnota-verde
2 inMetro (2014) Programa Brasileiro de etiquetagem Veicular (PBeV) available at httpwwwinmetrogovbrconsumidortabelas_pbe_veicularasp
3 inMetro (2014) Metodologia Para Divulgaccedilatildeo De Dados De consumo Veicular available at httpwwwinmetrogovbrconsumidorpbeMetodologia_consumo_Veicularpdf
53
ICCT white paper
Step 1 Correcting the original IBAMA CO2 reported data ndash FTP CO2 gkm
IBAMArsquos CO2 reported values are corrected to account for tailpipe emissions from ethanol (tailpipe CO2 emissions are reported as zero in IBAMArsquos data)
bull E22 FTP reported CO2 data are reduced by 177bull E100 FTP reported CO2 data are reduced by 100
Flex fuel vehicles are tested with E22 and E00 the final values is calculated as the average of both fuelsCO2 IBAMA_Flex_FTP= 05(1-0177)CO2_E22_test_FTP + 050E100_FTP = 050823CO2_E22_FTPFor Gasoline only vehicles the tests are carried out only with Gasoline E22CO2 IBAMA_Gasoline_FTP = (1-0177) CO2_E22_Test_FTP
Where in the previous equations CO2_E22_FTP means CO2 emissions values obtained under FTP testingCO2 IBAMA_Flex_FTP means IBAMArsquos Corrected FTP values for flex vehiclesCO2 IBAMA_Gasoline_FTP means IBAMArsquos Corrected FTP values for gasoline only (E22) vehicles
INNOVAR AUTO is based on energy consumption data obtained as the combined CAFE test cycle This requires a weighted average of energy consumption data obtained from FTP testing (city driving ) and Highway fuel economy testing (HWFET) In mathematical form CAFE=f(FTPHWFET)
Given that IBAMA data is provided for only the first aprt the FTP testing then it is required to find a way to calculate CAFE combined values through FTP -75 only data A linear function was thus developed from data with FTP and HWY values (INMETRO data) is used to convert FTP only values to CAFE CO2 values ie CAFE=f(FTP) The function used for this conversion is
CO2_CAFE= (CO2_FTP+44756)11572
Step 2Convert FTP CO2 values to CAFE CO2 values
Converting CO2 values to MJkm values is done by using the energy density of E22 Note that all the previous calculations for CO2 come from E22-based data
bull The energy density of E22 is 2894 MJLE22bull E22 emits 2167gCO2LE22bull CAFE (MJkm) = CAFE (gCO2km) (2894 MJLE22 2167 gCO2LE22)
Step 3 Convert US CAFE CO2 values to MJkm values
Figure D‑1 ndash conversion of emission to energy consumption data
energy consumption values calculated from iBaMa and inMetro data differ greatly Figure D-1 illustrates energy consumption data for those models in both databases iBaMa data are on average 126 higher than inMetro data with a standard deviation of 89 and a maximum deviation of 39
54
Brazil Passenger Vehicle Market statistics
0
05
1
15
2
25
3
0 05 1 15 2 25 3
Ene
rgy
cons
ump
tio
n IB
AM
A (
MJ
km)
Energy consumption INMETRO (MJkm)
n=151
Figure D‑2 ndash comparison between energy consumption data from inMetro and iBaMa
151 vehicles tested under both programs
although inMetro data are more transparent as it breaks down fuel economy by fuel and test cycle it is still a voluntary program that allows manufacturers to select which models will participate in addition not all manufacturers participate in the program in turn iBaMa data only include co2 data for the urban cycle and thus energy consumption in the combined cycle had to be estimated from correlations using international data in addition corrections had to be made for gasoline-only engines since it seems that a co2 discount in theory only applicable to flex-fuel engines was also applied to gasoline-only engines Despite these data quality issues iBaMa data were considered the most adequate data source for energy consumption because it is a mandatory program that requires data reporting by all vehicle models and manufacturers
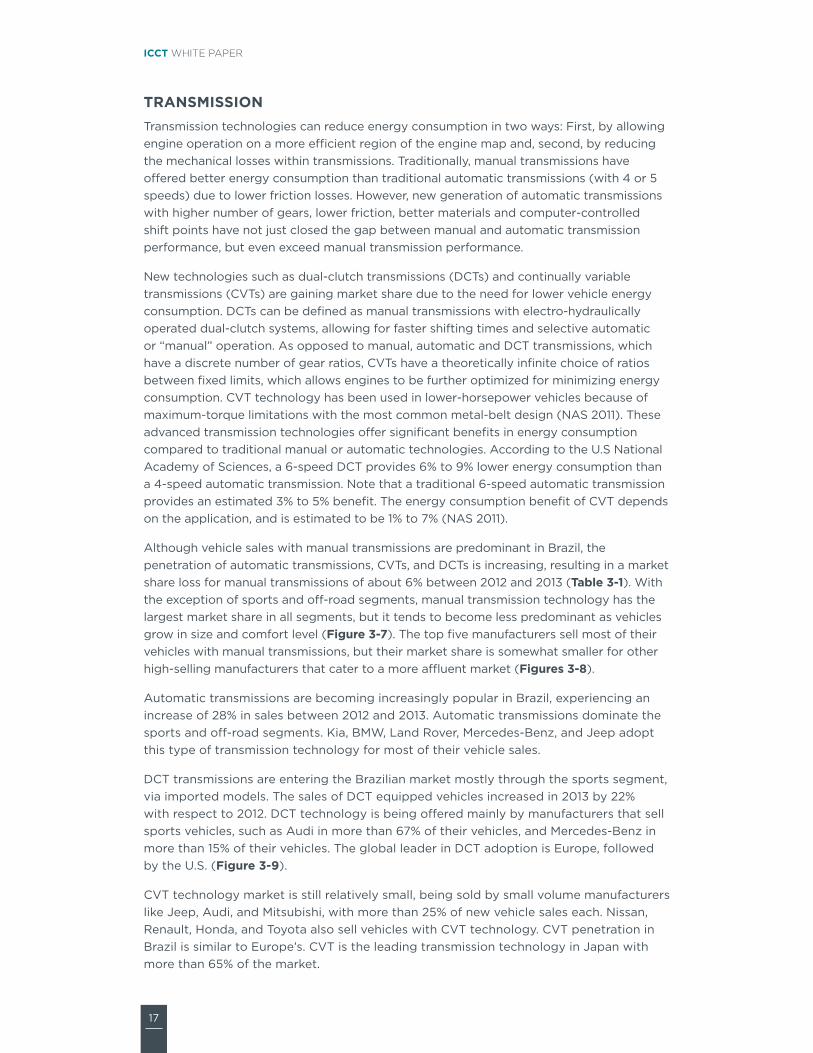
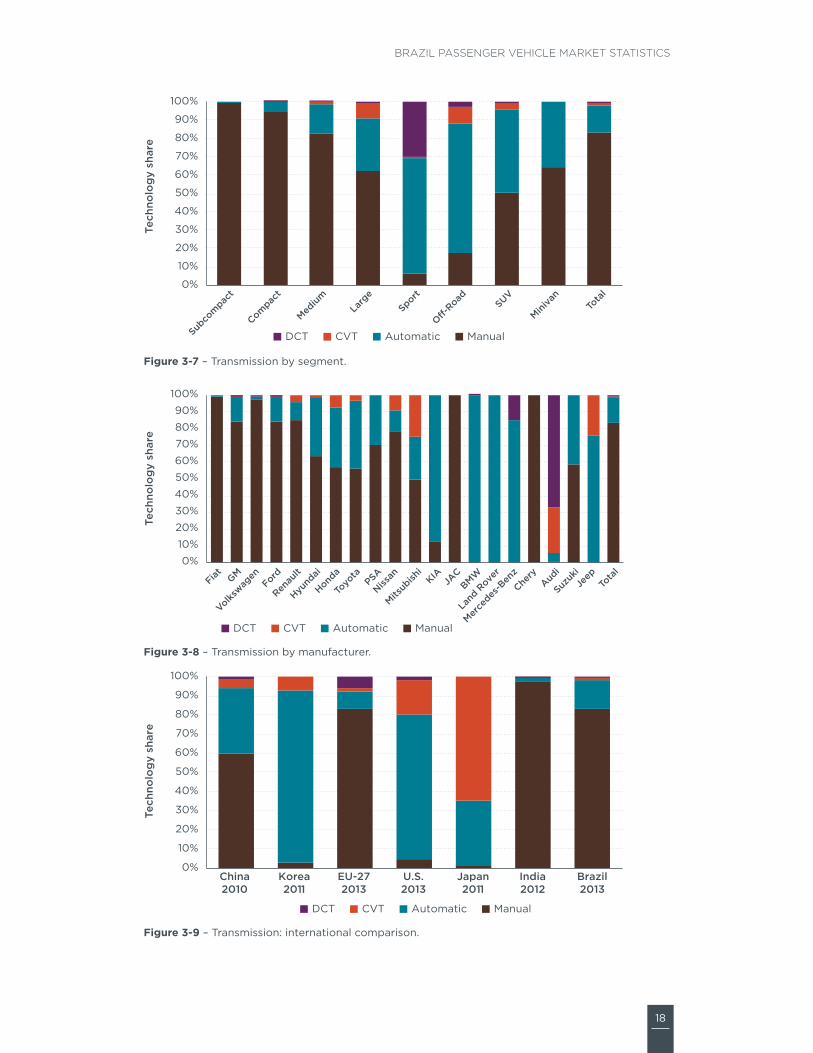
18
Brazil Passenger Vehicle Market statistics
0
10
20
30
40
50
60
70
80
90
100
Subco
mpac
t
Compac
t
Medium
Larg
eSport
O-Road SUV
Miniva
nTo
tal
Tech
nolo
gy
shar
e
DCT CVT Automatic Manual
Figure 3‑7 ndash transmission by segment
0
10
20
30
40
50
60
70
80
90
100
Fiat GM
Volkswag
enFord
Renau
lt
Hyund
ai
Honda
Toyo
taPSA
Nissan
Mitsub
ishi
KIAJA
CBMW
Land
Rove
r
Merce
des-B
enz
Chery
Audi
Suzuk
iJe
epTo
tal
Tech
nolo
gy
shar
e
DCT CVT Automatic Manual
Figure 3‑8 ndash transmission by manufacturer
0
10
20
30
40
50
60
70
80
90
100
China2010
Korea2011
EU-272013
US2013
Japan2011
India2012
Brazil2013
Tech
nolo
gy
shar
e
DCT CVT Automatic Manual
Figure 3‑9 ndash transmission international comparison
19
ICCT white paper
NUMBER OF GEaR RaTiOS as mentioned in the previous section increasing the number of gear ratios (whether manual automatic dual-clutch or continuously variable) allows the engine to be operated in the best efficiency region resulting in energy consumption benefits compared to an automatic four-gear ratio transmission (also known as 4-speed transmission) higher ratio automatic transmissions could reduce energy consumption from 2 to 3 (for a five-gear ratio) to 6 to 8 (for an eight-gear ratio) (ePanhtsa 2010)
Four-gear ratio transmissions are losing market share in Brazil by more than 5 between 2012 and 2013 (Table 3‑1) these transmissions are particularly high sellers in the suV and minivan segments which suggest that some models in these more expensive segments are being sold with outdated technologies (Figure 3‑10) Most manufacturers are phasing out this type of transmission (Figure 3‑11) although jeep suzuki and toyota are lagging behind other manufacturers the four-gear ratio transmission technology has been losing market share in most countries even in india where smaller and inexpensive cars dominate the market 4-speed transmissions have the smallest market share (Figure 3‑12)
Five- and six-gear ratio transmissions were predominant in the Brazilian market in 2013 Five-gear ratio transmissions are dominant in all segments except for the off-road and sports segments which have adopted six-gear ratio transmissions in most sales the significant market share of five- and six-gear ratio transmissions is similar to most countries although the us europe and south Korea show higher shares of six and more gear ratios
seven- and eight-gear ratio transmissions which are considered emerging technologies have experienced an increase in sales in Brazil with over twice as many sales in 2013 compared to 2012 seven- and eight-gear ratio transmissions are popular among the large sports and off-road segments all of which are imported models luxury manufacturers such as Mercedes-Benz and audi are selling the most seven-gear vehicles as a share of their sales Volkswagen and toyota are also selling similar numbers of seven-gear ratio vehicles although for Volkswagen and toyota it represented less than 3 of their brand sales BMW and land rover are the leaders in eight-gear ratio vehicles
20
Brazil Passenger Vehicle Market statistics
0
10
20
30
40
50
60
70
80
90
100
Subco
mpac
t
Compac
t
Medium
Larg
eSport
O-Road
SUV
Miniva
nTo
tal
Tech
nolo
gy
shar
e
8 7 6 5 4
Figure 3‑10 ndash number of gear ratios by segment
0
10
20
30
40
50
60
70
80
90
100
Fiat GM
Volkswag
enFord
Renau
lt
Hyund
ai
Honda
Toyo
taPSA
Nissan
Mitsub
ishi
KIAJA
CBMW
Land
Rove
r
Merce
des-B
enz
Chery
Audi
Suzuk
iJe
epTo
tal
Tech
nolo
gy
shar
e
8 7 6 5 4
Figure 3‑11 ndash number of gear ratios by manufacturer
0
10
20
30
40
50
60
70
80
90
100
Tech
nolo
gy
shar
e
Six or more Five Four or fewer
China2010
Korea2011
EU-272013
US2013
India2012
Brazil2013
Figure 3‑12 ndash number of gear ratios international comparison
21
ICCT white paper
DRiVETRaiNDrivetrain technology includes front-wheel drive (FWD) rear-wheel drive (rWD) and all-wheel drive (aWD) vehicles For the same vehicle size FWD vehicles provide more interior space and better energy consumption than rWDs due to lower weight as it avoids the added weight of and space for the driveshaft and differential that rWD requires Because the weight of the engine and transmission is located close to the wheels FWD vehicles have better traction than rWDs rWDs however show better handling as the weight distribution between the front and rear wheels is more uniform and the tasks of turning and acceleration are split between the front and rear wheels also directing large amounts of power through the front wheels can create ldquotorque steerrdquo thus rWD is the adequate technology for the sports segment aWD drivetrains are intended for specific driving applications that imply loss of traction such as off-road terrains snow or towing
FWD vehicles dominate all segments of the Brazilian passenger car market (Table 3‑1) with the exception of the off-road segment (Figure 3‑13) among the 20 largest manufacturer sellers most except for BMW land rover Mercedes-Benz and suzuki offer FWD technology (Figure 3‑14) Brazil has the highest market share of FWD vehicles of all countries analyzed (944) although FWD has at least 50 market share in all seven countries (Figure 3‑15)
aWD market share increased by 15 between 2012 and 2013 due to a tri-fold increase in the sports segment sales off-road vehicle sales with aWD also increased to more than 76000 units in 2013 amongst the largest ten manufacturers toyota is the aWD market leader followed by Ford and Volkswagen note that land rover sells only aWD vehicles in Brazil among non-luxury manufacturers Mitsubishi and suzuki are selling more than 50 of their vehicles with aWD technology
rWD technology is offered mostly in large and sports vehicles and in suVs among the 10 largest manufacturers rWD is offered mainly by gM and toyota while an extended examination of the 20 largest manufacturers by sales show that aWD and rWD is focused among the more expensive brands (Figure 3‑14) Mercedes-Benz and BMW sell close to 90 of their vehicles with rWD technology traditionally associated with engine performance and responsiveness
22
Brazil Passenger Vehicle Market statistics
0
10
20
30
40
50
60
70
80
90
100
Subco
mpac
t
Compac
t
Medium
Larg
eSport
O-Road SUV
Miniva
nTo
tal
Tehn
olo
gy
shar
e
AWD RWD FWD
Figure 3‑13 ndash Drivetrain by segment
0
10
20
30
40
50
60
70
80
90
100
Fiat GM
Volkswag
enFord
Renau
lt
Hyund
ai
Honda
Toyo
taPSA
Nissan
Mitsub
ishi
KIAJA
CBMW
Land
Rove
r
Merce
des-B
enz
Chery
Audi
Suzuk
iJe
epTo
tal
Tech
nolo
gy
shar
e
AWD RWD FWD
Figure 3‑14 ndash Drivetrain by manufacturer
0
10
20
30
40
50
60
70
80
90
100
China2010
Korea2011
EU-272013
US2013
Japan2011
India2012
Brazil2013
Tech
nolo
gy
shar
e
AWD RWD FWD
Figure 3‑15 ndash Drivetrain international comparison
23
ICCT white paper
VaLVE CaMShaFT CONFiGURaTiON (DOhC VS SOhC)the engine camshaft governs the timing duration and lift of valve operation controlling the intake of air and the exhaust of combustion gases this report focuses on single overhead camshafts (sohc) and dual overhead camshafts (Dohc) as these configurations have almost completely replaced the older overhead valve configuration (ohV) sohc design places a single camshaft above the cylinder head that governs all the valves intake and exhaust in the case of sohc V-engines there is one single camshaft per head Dohc designs use separate camshafts for intake valves and exhaust valves Dohc engines achieve increased airflow at high-engine speeds improve volumetric efficiency and reduce the valvetrainrsquos moving mass such engines typically develop higher power at high-engine speeds the us environmental Protection agency (ePa) and national highway traffic safety administration (nhtsa) estimate the effectiveness of Dohc over sohc to be between 1 and 25 (ePanhtsa 2010)
although Dohc produce more power and provide lower fuel consumption the Brazilian fleet is still mostly composed of sohcs vehicles (Table 3‑1) sohc technology is predominant among the subcompact compact and medium segments (Figure 3‑16) among manufacturers sohc technology is predominant among the five largest least expensive brands (Figure 3‑17) sales of vehicles with more advanced Dohc technology grew in 2013 by almost 36 with respect to 2012 albeit from a relatively smaller base this increase was experienced in all vehicle segments but in different magnitudes
although global data on this technology are scarce Figure 3‑18 indicates that most countries are moving away from sohc with Brazil being the only country analyzed where sohc is still predominant no data were available for the us or europe
24
Brazil Passenger Vehicle Market statistics
0
10
20
30
40
50
60
70
80
90
100
Subco
mpac
t
Compac
t
Medium
Larg
eSport
O-Road SUV
Miniva
nTo
tal
Tech
nolo
gy
shar
e
nd DOHC SOHC
Figure 3‑16 ndash Valve camshaft configuration by segment (nd no data)
0
10
20
30
40
50
60
70
80
90
100
Fiat GM
Volkswag
enFord
Renau
lt
Hyund
ai
Honda
Toyo
taPSA
Nissan
Mitsub
ishi
KIAJA
CBMW
Land
Rove
r
Merce
des-B
enz
Chery
Audi
Suzuk
iJe
epTo
tal
Tech
nolo
gy
shar
e
nd DOHC SOHC
Figure 3‑17 ndash Valve camshaft configuration by manufacturer (nd no data)
0
10
20
30
40
50
60
70
80
90
100
China2010
Korea2011
Japan2011
India2012
Brazil2013
Tech
nolo
gy
shar
e
nd OVC DOHC SOHC
Figure 3‑18 ndash Valve camshaft configuration international comparison (nd no data)
25
ICCT white paper
VaLVE aCTUaTiON improved valvetrain systems with variable valve actuation (VVa) technology either variable valve timing (VVt) or variable valve timing and lift (VVt+VVl) improves the enginersquos volumetric and thermodynamic efficiency they also enable further engine improvements such as internal exhaust gas recirculation and cylinder deactivation VVt alters the timing of the intake valve exhaust valve or both primarily to reduce pumping losses increase specific power and control residual exhaust gases VVl increases efficiency by optimizing airflow over a broader range of engine operation which reduces pumping losses and increases specific power VVl is accomplished by controlled switching between two or more cam profile lobe heights the most advanced technology VVt+VVl yields a wide range of performance optimization and volumetric efficiency including enabling the engine to be valve-throttled (no need for intake throttle) VVt provides energy consumption gains of 3 to 5 while the more flexible and complex VVt+VVl system can reach 4 to 8 (ePa amp nhtsa 2010)
VVa technology either VVt or VVt+VVl are emerging technologies in Brazil where most vehicles still have fixed-valve timing designs (Table 3‑1) Fixed technology is predominant among the smaller vehicle segments as well as suVs and minivans (Figure 3‑19) the five largest manufacturers sold more than 90 of their vehicles with fixed-valve technology in 2013 (Figure 3‑20) the international comparison indicates that only Brazil and india have not yet adopted VVa technologies for most of their light-duty fleet (Figure 3‑21)
VVt and VVt+VVl are being adopted across all segments including the subcompact segment but tend to be more predominant in high-end manufacturers a closer examination by manufacturer shows that most are offering some vehicles with either one of the VVa systems while honda and hyundai offer this technology in almost all vehicles (Figure 3‑20) honda is the technology leader in variable valve actuation with the adoption in the early 1990s of the Vtec system (Valve timing electronic control) VVt technologyrsquos market share grew by about 25 in 2013 primarily due to hyundairsquos sales from 80000 units in 2012 to almost 200000 units in 2013 hyundai offered the continuously variable valve technology (cVVt) in the large majority of vehicle sold in 2013 the sports segment is the one where VVt dominates the market Mitsubishi BMW and audi are also selling a large share of their vehicles with the VVt+VVl technology
26
Brazil Passenger Vehicle Market statistics
0
10
20
30
40
50
60
70
80
90
100
Subco
mpac
t
Compac
t
Medium
Larg
eSport
O-Road SUV
Miniva
nTo
tal
Tech
nolo
gy
shar
e
VVT+VVL VVT Fixed
Figure 3‑19 ndash Valve actuation by segment
0
10
20
30
40
50
60
70
80
90
100
Fiat GM
Volkswag
enFord
Renau
lt
Hyund
ai
Honda
Toyo
taPSA
Nissan
Mitsub
ishi
KIAJA
CBMW
Land
Rove
r
Merce
des-B
enz
Chery
Audi
Suzuk
iJe
epTo
tal
Tech
nolo
gy
shar
e
VVT+VVL VVT Fixed
Figure 3‑20 ndash Valve actuation by manufacturer
VVT+VVL VVT Fixed
0
10
20
30
40
50
60
70
80
90
100
China2010
Korea2011
US2013
Japan2011
India2012
Brazil2013
Tech
nolo
gy
shar
e
Figure 3‑21 ndash Valve actuation international comparison
27
ICCT white paper
FUEL SYSTEMS FOR GaSOLiNE VEhiCLESVehicle fuel systems describe the technology required to deliver fuel into the engine combustion chamber this section examines two gasolineflex technologies namely multi-point fuel injection (MPFi) and gasoline direct injection (gDi) MPFi is now the most common fuel-delivery system for gasoline engines used in passenger vehicles worldwide in sequential MPFi engines fuel is injected into the air stream next to the intake valve port while the intake valve is open to draw the air-fuel mixture into the cylinder some of the fuel is vaporized on the surface of the hot intake valve expanding and thus reduces the volumetric efficiency on gDi engines fuel is injected at high pressure directly into the combustion chamber improving volumetric efficiency and providing cooling of the airfuel charge within the cylinder which allows for higher compression ratios and increased thermodynamic efficiency gDi technology alone offers benefits of 2 to 5 with respect to MPFi engines but bigger benefits rely on the synergy between gDi turbocharging and downsizing which can reach 12 to 15 energy consumption reduction with respect to a MPFi naturally aspirated engine (ePa 2012)
Table 3‑1 illustrates that MPFi is still the most common fuel injection technology for gasolineflex vehicles in Brazil which is reflected in its dominant share across most segments except for sports and off-road vehicles in Brazil gDi has found a niche market in the sports and off-road segments with more than 90 of sport vehicles fitted with gDi technology (Figure 3‑22) Within the overall gasoline market the gDi technology is still an emerging technology representing just 24 of new sales gDirsquos market share increased by 31 in 2013 with all but 4000 units being imported among the 10 largest manufacturers the adoption of gDi is extremely low below 5 for Volkswagen Ford hyundai and Psa (Figure 3‑23) high-end european brands (audi land rover Mercedes-Benz and BMW) are the technology leaders in terms of gDi adoption rates echoing the trend of turbocharging technology sales Volkswagen vehicles with gDi systems account for less than 35 of their sales in 2013 but their absolute numbers (around 19000 vehicles) place the company as one of the leaders in gDi technology in the Brazilian market
From a global market perspective the penetration of gDi technology in Brazil is low compared to all other markets in Figure 3‑24 except for india and japan it should be noted that the later has the largest share of hybrid vehicles around the globe
28
Brazil Passenger Vehicle Market statistics
0
10
20
30
40
50
60
70
80
90
100
Compac
t
Subco
mpac
t
Medium
Larg
eSport
O-Road SUV
Miniva
nTo
tal
Tech
nolo
gy
shar
e
GDI MPFI
Figure 3‑22 ndash gasolineflex fuel system by segment
GDI MPFI
0102030405060708090
100
Fiat GM
Volkswag
enFord
Renau
lt
Hyund
ai
Honda
Toyo
taPSA
Nissan
Mitsub
ishi
KIAJA
CBMW
Land
Rove
r
Merce
des-B
enz
Chery
Audi
Suzuk
iJe
epTo
tal
Tech
nolo
gy
shar
e
Figure 3‑23 ndash gasolineflex fuel system by manufacturer
GDI MPFI
0
10
20
30
40
50
60
70
80
90
100
China2010
Korea2011
EU-272013
US2013
Japan2011
India2012
Brazil2013
Tech
nolo
gy
shar
e (n
on-
die
sel)
Figure 3‑24 ndash gasolineflex fuel system international comparison
29
ICCT white paper
TURBOChaRGiNGengine power is primarily limited by the rate at which the engine is able to draw air into the combustion chamber turbocharging and supercharging are two methods to increase the amount of air drawn into the engine above the level of what is possible with the naturally aspirated process (through the expansion of the cylinders) By increasing the amount of air into the engine the amount of fuel can be proportionally increased resulting in increased power output level and with it the ability to reduce engine displacement while maintaining performance the combination of turbocharging and downsizing in spark ignited (gasoline and flex-fuel) vehicles can provide energy consumption improvements between 2 to 6 with respect to a direct-injected gDi engine (ePa amp nhtsa 2010) turbocharging technology is the cornerstone for achieving better energy consumption in vehicles as the basis for downsizing and reducing the engine weight while keeping the same or better vehicle performance (ie acceleration or time to reach certain speed) although turbochargers are used in diesel and gasolineflex vehicles the analysis in this report focuses on turbocharging for spark-ignited gasolineflex vehicles only
turbocharging is one of the most important emerging technologies in Brazil where most vehicles are still naturally aspirated (na) (Table 3‑1) turbocharging technology has increased the market share significantly between 2012 and 2013 by more than 65 albeit from a small base (from about 49000 to 81000 vehicles)
Most vehicles with turbocharging are sold in the sports and off-road segments as this technology also produces superior engine power output (Figure 3‑25) among the 10 largest manufacturers turbocharging is still below 10 of their sales (Figure 3‑26) Volkswagen and Ford despite having small relative sales of vehicles with turbocharging (less than 35) are the manufacturers with the highest total sales of vehicles with turbocharging audi land rover Mercedes-Benz and BMW are the technology leaders with more than 90 of vehicle sales in 2013
the penetration of turbo and supercharging technologies in Brazil is lower than in other countries with a larger gasoline fleet such as the us china and japan (Figure 3‑27) in Brazil 95 of diesel passenger vehicle sales have turbocharging technology
30
Brazil Passenger Vehicle Market statistics
0
10
20
30
40
50
60
70
80
90
100
Compac
t
Subco
mpac
t
Medium
Larg
eSport
O-Road SUV
Miniva
nTo
tal
Tech
nolo
gy
shar
e (n
on-
Die
sel)
Turbo NA
Figure 3‑25 ndash turbocharging for gasolineflex fuel vehicles by segment (NA naturally aspirated)
0102030405060708090
100
Fiat GM
Volkswag
enFord
Renau
lt
Hyund
ai
Honda
Toyo
taPSA
Nissan
Mitsub
ishiKIA
JACBMW
Land
Rove
r
Merce
des-B
enz
Chery
Audi
Suzuk
iJe
epTo
tal
Tech
nolo
gy
shar
e (n
on-
Die
sel)
Turbo NA
Figure 3‑26 ndash turbocharging for gasolineflex fuel vehicles by manufacturer (NA naturally aspirated)
0
10
20
30
40
50
60
70
80
90
100
China2010
Korea2011
EU-272013
US2013
Japan2011
India2012
Brazil2013
Tech
nolo
gy
shar
e (n
on-
die
sel)
Turbo NA
Figure 3‑27 ndash turbocharging for gasolineflex fuel vehicles international comparison (NA naturally aspirated)
31
ICCT white paper
4 vEhiCLE ENErGy CONSuMpTiON
this section analyzes the Brazilian new passenger vehicle energy consumption in 2013 although other metrics are more common (see box) vehicle energy consumption is presented in megajoules per kilometer (Mjkm) for consistency with Brazilrsquos inovar-auto policy in 2012 Brazilrsquos Ministry of Development industry and Foreign trade (MDic) adopted the inovar-auto policy with the aim of fostering industrial competitiveness through technology investments the policy includes a target for corporate average energy consumption (in Mjkm with vehicle curb weight as the attribute parameter) for vehicles sold in 2017
in the us canada Mexico and saudi arabia fleet-average fuel economy standards are defined as a function of vehicle footprint in the eu china japan south Korea and india vehicle weight is the attribute for the calculation of fleet-average targets in Brazil inovar-auto has defined its fiscal targets for vehicle energy consumption measured in megajoules per kilometer (Mjkm) as a function of vehicle weight
VEhiCLE ENERGY MEaSUREMENT UNiTS
Many metrics can be used to describe the amount of fuel energy or emissions generated by unit of distance traveled
Fuel economy measures distance traveled per unit of fuel consumed in Brazil kilometers per liter (kml) is the most common metric to describe vehicle efficiency but other units are used in different countries such as miles per gallon (mpg) in the us
Fuel consumption is the reciprocal of fuel economy and measures fuel consumed per distance traveled it is usually expressed in liters per 100 kilometers (l100 km) and it is used in europe for example
GhGCO2 emissions measures ghg or co2 emissions per distance traveled expressed as grams of pollutant per kilometer or mile
Energy consumption (EC) measures the energy consumed per distance traveled for example in megajoules per kilometer Despite being a less common metric it is sometimes preferred for being a fuel-neutral metric across different types of fuel and vehicle technologies Vehicle energy consumption in Mjkm is the metric used in Brazilrsquos inovar-auto policy to quantify the corporate average energy consumption target for each manufacturer Values for energy consumption in Brazilian spark-ignited vehicles are provided for e22 since that is the fuel mixture used in vehicle tests
Vehicle energy consumption in this report is calculated from co2 emissions data in the Brazilian institute of environment and renewable natural resources (iBaMa) nota Verde program (iBaMa 2014) which reports official emissions data from homologation tests Data are limited to passenger cars sold by the top 10 manufacturers with light commercial vehicles being excluded appendix D presents a description of data sources
32
Brazil Passenger Vehicle Market statistics
and calculation methodologies as well as a discussion of vehicle energy consumption data quality and completeness in Brazil
not surprisingly vehicle energy consumption increases with vehicle footprint and engine rated power the two parameters that define vehicle segments in Brazil (Figure 4‑1) subcompact and compact vehicles which accounted for about 45 of new sales in 2013 have average energy consumption below the fleet average while medium-sized vehicles which hold the largest market share (388) have energy consumption just above the fleet average larger more powerful vehicles consume more energy than the fleet average but have a considerably smaller market share (combined share of 163) Data availability for these segments is not as extensive as the data available for the subcompact compact and medium segments which could affect the relative rankings of each segment
Ene
rgy
cons
ump
tio
n (M
Jkm
)
Subco
mpac
t
Compac
t
Medium
Larg
e
O-road SUV
4000
200000
400000
600000
850000
35
30
25
20
15
10
05
0
Sales
Total 202
Figure 4‑1 ndash new vehicle sales-weighted average energy consumption by segment (2013)
33
ICCT white paper
Figures 4‑2 and 4‑3 illustrate new vehicle energy consumption for multiple weight and footprint bins For each weight bin (in 100 kg increments) and footprint bin (in 01 m2 increments) sales-weighted averages of energy consumption for each vehicle version are presented (dashes) generating energy consumption ranges for each bin (cream areas) Vehicle sales by bin are presented for reference in the lower charts
the strong correlation between vehicle energy consumption and weight follows from the strong physical relationship between the weight of the vehicle and the energy required to accelerate it and overcome resistances9 (Figure 4‑2) Data dispersion within each bin suggests that energy consumption varies due to other vehicle characteristics that affect vehicle aerodynamics and rolling resistance as well as the adoption of technologies that affect engine and transmission efficiency (eg friction reduction technologies gDi VVt)
Curb weight (kg)
SubcompactCompactMediumLargeO-roadSUV
Ene
rgy
cons
ump
tio
n (M
Jkm
)Sa
les
5
6
4
3
2
1
600k
800k
400k
200k
0k800 900 1000 1100 1200 1300 1400 1500 1600 1700 1800 1900 2000 2100
Figure 4‑2 ndash new vehicle energy consumption by vehicle weight (2013)
9 on a plain surface the sum of resistances of a vehicle is acceleration resistance + rolling resistance + aerodynamic resistance = c1 m a + c2 frr m + c3 cw a v2 with mass (m) as an integral part of both acceleration and rolling resistance which are most relevant for inner-city driving situations other factors are acceleration (a) rolling resistance of tires (frr) aerodynamic coefficient of the vehicle (cw) frontal area of vehicle (a) velocity (v) and constants (cx)
34
Brazil Passenger Vehicle Market statistics
Footprint has a reasonable correlation with energy consumption (Figure 4‑3) ie larger vehicles tend to consume more fuel than smaller vehicles however the correlation is not as strong as with vehicle weight similar to the previous figure the broad spread of energy consumption values suggests a combination of different vehicle characteristics (eg weight engine displacement rated power) and technologies (eg transmissions fuel systems) as well as the presence of suVs and off-road vehicles among the medium- and large-sized footprint values respectively
Footprint (m2)
SubcompactCompactMediumLargeO-roadSUV
Ene
rgy
cons
ump
tio
n (M
Jkm
)Sa
les
5
6
4
3
2
1
400k
500k
300k
200k
100k
0k31 32 33 34 35 36 37 38 39 40 41 42 43 44 45 46 48 49
Figure 4‑3 ndash new vehicle energy consumption by vehicle footprint (2013)
35
ICCT white paper
Figure 4‑4 illustrates sales weighted average for new vehicle energy consumption by mass for the top 10 manufacturers in Brazil in 2013 Bubble sizes are proportional to total vehicle sales Manufacturers in the lower-left quadrant produce the lightest and most efficient vehicles with hyundai presenting the best overall average energy consumption renault in the upper-left quadrant produces vehicles that are equivalent in weight but on average with higher energy consumption in the lower-right quadrant are manufacturers that produce relatively heavier vehicles but with lower energy consumption in their weight class Despite producing heavier vehicles on average than many manufacturers honda achieves lower energy consumption on average in the upper-right quadrant are manufacturers that produce on average the heavier and least efficient vehicles with Psa (citroen and Peugeot) producing the heaviest and least efficient cars on average a regression line correlating vehicle energy consumption and mass highlights the best performers (hyundai honda and nissan) average performers (Fiat Volkswagen gM and toyota) and those performing worse than average (renault Ford and Psa)
FIA
GMVW
FORREN
HYU
HON
TOY
PSA
NIS
160
170
180
190
200
210
220
230
240
250
950 1000 1050 1100 1150 1200 1250 1300 1350
Ene
rgy
cons
ump
tio
n (M
Jkm
)
Curb weight (kg)
Fleet Ave
Figure 4‑4 ndashaverage new vehicle sales-weighted energy consumption by manufacturer (2013)
36
Brazil Passenger Vehicle Market statistics
Figure 4‑5 shows fleet-average energy consumption based on certification and type approval data for new vehicles in multiple countries converted to the us caFe combined driving cycle Bubble sizes represent total sales of new passenger cars Because of data availability in different countries the country comparison is based on different calendars years for different countries 2011 for south Korea and japan 2012 for china and india and 2013 for europe the us and Brazil given annual improvements in vehicle energy consumption triggered by regulatory efficiency standards and fiscal incentives those countries with older data could be at a slight disadvantage in this comparison
With the heaviest vehicles on average the us fleet is also the most energy consuming of all countries china and south Korea have similar average energy consumption but since south Korean vehicles are heavier on average they are relatively more efficient than chinese vehicles although Brazilrsquos fleet consumes less fuel on average than those from the us china and south Korea its fleet is relatively inefficient when compared to countries with vehicles of similar weight (japan and india) the average Brazilian vehicle consumes about 34 more energy than the average vehicle in japan whose fleet has a large penetration of gasoline hybrid and advanced fuel-efficiency technologies such as three-cylinder engines VVa Dohc and 6-plus speed transmissions european vehicles are the best performing on average despite being heavier than all countries with the exception of the us and south Korea the adoption of fuel-efficiency technologies (eg Dct 6-plus-speed transmissions gDi turbocharging) contributes to europersquos better than average performance
China2012
SKorea2011
Europe2013
US2013
Japan2011
India2012
Brazil2013
Sales5 MM10 MM
14
16
18
20
22
24
26
28
1000 1100 1200 1300 1400 1500 1600 1700
Ene
rgy
cons
ump
tio
n ndash
CA
FE
(M
Jkm
)
Curb weight (kg)
Type-approval and certification energy consumption data only (does not include o-cycle or real-world driving data)
Figure 4‑5 ndash international comparison of passenger car energy consumption
Country labels indicate the dataset year
Figure 4‑6 provides a more detailed country comparison by illustrating average vehicle energy consumption by vehicle (curb) weight bin Vehicle sales in each bin are shown for reference the us is not shown due to lack of detailed model-by-model data Brazilrsquos vehicles on average have the highest energy consumption in most weight
37
ICCT white paper
bins with china being the second highest in most bins Because china has higher fuel consumption than Brazil on the 1000 bin which represents the highest share of vehicle sales fleet-average energy consumption in china is still higher than in Brazil as illustrated in the previous figure europe consistently performs best in terms of vehicle energy consumption in most weight bins with japan also performing relatively well
Curb weight (kg)
BrazilChinaEuropeIndiaJapanSouth Korea
Ene
rgy
cons
ump
tio
n C
AF
E (
MJ
km)
Sale
s
40
35
25
20
15
10
6M
8M
4M
2M
0M600 800 1000 1200 1400 1600 1800 2000 2200 2400
Figure 4‑6 ndash international comparison of average vehicle energy consumption by vehicle weight
Type-approval and certification energy consumption data only (does not include off-cycle or real-world driving data)
38
Brazil Passenger Vehicle Market statistics
Figure 4‑7 illustrates the distribution of energy consumption data in Brazil for each vehicle version by mass and segment Bubble sizes represent total sales of each version Data were limited to flex-fuel vehicles in the subcompact compact medium and large segments due to its relatively better data quality and representativeness (ie they represented over 87 of sales in 2013) While most vehicles follow a predictable trend that correlates energy consumption and vehicle mass there are a large number of versions with energy consumption substantially higher than the trend line this suggests there is substantial room for improvements in their energy consumption since there are vehicles in similar weight classes with substantially superior energy consumption performance
Sales1000050000
140
160
180
200
220
240
260
280
700 800 900 1000 1100 1200 1300 1400 1500 1600
Ene
rgy
cons
ump
tio
n (M
Jkm
)
Curb weight (kg)
Subcompact Compact Medium Large Fleet average
Figure 4‑7 ndash Distribution of new Brazilian passenger vehicle energy consumption data by vehicle weight and segment (2013)
this chapter suggests that there are potential improvements in vehicle energy consumption for the Brazilian fleet For similar vehicles in terms of weight class footprint or engine rating there is substantial dispersion in energy consumption indicating that there are vehicles performing much worse than the average across manufacturers there is also a clear trend of some manufacturers performing much better than the average while others have a lot more room for improvement the international comparison clearly shows that Brazilian vehicles perform much worse in terms of energy consumption than vehicles of similar weight suggesting a delay in the adoption of energy efficient technologies among Brazilian vehicle manufacturers
Finally a more detailed analysis of vehicle versions clearly illustrates a considerable number of vehicle versions significantly above average thus indicating potential improvements in energy consumption that would place them on par with better performing vehicles with similar characteristics
39
ICCT white paper
Deficiencies in data quality and completeness prevent more definite conclusions about vehicle energy consumption gasoline-only vehicles in particular have poor energy consumption data quality although they represent a relatively small fraction (6) of total vehicles sold in 2013 Because some vehicle segments are primarily composed of gasoline-only vehicles (eg sports minivans) this chapter excludes these segments from the analysis there are also concerns about the gap between energy consumption data reported by iBaMarsquos nota Verde and Brazilrsquos national institute of Metrology standardization and industrial Qualityrsquos (inMetro) labeling program (PBeV using its acronym in Portuguese) with the latter reporting consistently lower values of vehicle energy consumption
Finally the availability of energy consumption data was not adequate for many manufacturers beyond the top 10 sales group which prevented their inclusion in this analysis Despite the data quality and lack of completeness the energy consumption data in this chapter include data that are reasonably accurate and representative thus supporting its interpretation
40
Brazil Passenger Vehicle Market statistics
rEfErENCES
aDK automotive consultoria de Marketing (2013) relatoacuterios de volumes de vendas do mercado brasileiro para veiacuteculos de passeio e comerciais leves referentes a 2013
alves l Wilbert M (2014) reduccedilatildeo do imposto sobre Produto industrializado e a Venda de automoacuteveis Xi congresso usP iniciaccedilatildeo cientiacutefica em contabilidade
associaccedilatildeo nacional de transportes Puacuteblicos (antP 2014) estudo mostra baixo efeito do desconto no iPi de veiacuteculos sobre PiB e emprego available at httpwwwantporgbrwebsitenoticiasshowaspnpgcode=a4DeeFe8-a7BF-48D3-B1F5-8eDe1447BF10
associaccedilatildeo nacional dos Fabricantes de Veiacuteculos automotores (anFaVea 2015) anuaacuterio da induacutestria automobiliacutestica Brasileira 2015 Brazilian automotive industry Yearbook 2015 satildeo Paulo available at wwwanfaveacombr
european environment agency (2014) Monitoring co2 emissions from new passenger cars in the eu summary of data for 2013 april 2014
instituto Brasileiro do Meio ambiente e dos recursos naturais renovaacuteveis (iBaMa 2014) consulta dos niacuteveis de emissatildeo dos veiacuteculos novos brasileiros available at httpsservicosibamagovbrctfpublicosel_marca_modelo_rvepphp
international council on clean transportation (icct 2015) global passenger vehicle standards available at httpwwwtheicctorginfo-toolsglobal-passenger-vehicle-standards
international energy agency (iea 2015) renewables Bioenergy available at httpswwwieaorgtopicsrenewablessubtopicsbioenergy
Korea energy Management corporation (KeMco 2014) Fuel economy regulation available at httpwwwkemcoorkrnew_engmainmainasp
Marklines (2015) Marklines automotive industry Portal available at httpwwwmarklinescomen
Mendonccedila M sachsida a (2014) Modelando a demanda de creacutedito para veiacuteculos no Brasil uma abordagem com mudanccedila de regime iPea
Ministeacuterio do Desenvolvimento induacutestria e comeacutercio exterior (MDic 2013) Programa de incentivo agrave inovaccedilatildeo tecnoloacutegica e adensamento da cadeia Produtiva de Veiacuteculos automotores mdash inovar-auto httpwwwplanaltogov brccivil_03_ato2011-20142012DecretoD7819htm
stein r anderson j and Wallington t (2013) an overview of the effects of ethanol-gasoline Blends on si engine Performance Fuel efficiency and emissions SAE Int J Engines 6(1)470-487 2013 doi1042712013-01-1635
us environmental Protection agency and national highway traffic safety administration (ePanhtsa 2010) Final rulemaking to establish light-Duty Vehicle greenhouse gas emission standards and corporate average Fuel economy standards ePa-420-r-10-901
us environmental Protection agency (ePa 2012) regulatory impact analysis Final rulemaking for 2017-2025 light-Duty Vehicle greenhouse gas emission standards and corporate average Fuel economy standards ePa-420-r-12-016
41
ICCT white paper
us national academy of sciences (nas 2011) assessment of Fuel economy technologies for light-Duty Vehicles available at httpwwwnapeducatalog12924assessment-of-fuel-economy-technologies-for-light-duty-vehicles
World Bank group (2015) World Development indicators available at httpdataworldbankorgdata-catalogworld-development-indicators
42
Brazil Passenger Vehicle Market statistics
LiST Of ACrONyMS
4wD Four-wheel drive
aNFaVEa Brazilian association of automobile Manufacturers
awD all-wheel drive
BRiC Brazil russia india china
CaFE corporate average fuel economy
CBG compressed biogas
CO2 carbon dioxide
CVT continuously variable transmission
CVVT continuously variable valve technology
DCT Dual-clutch transmission
DOhC Dual overhead camshaft
EC energy consumption
Epa us environmental Protection agency
EU european union
FFV Flex-fuel vehicle
FTp Federal test procedure
FwD Front-wheel drive
GDi gasoline direct injection
GDp gross domestic product
GhG greenhouse gas
GM general Motors
iBaMa Brazilian institute of the environment and renewable natural resources
iC internal combustion
iCCT international council on clean transportation
iNMETRO national institute of Metrology standardization and industrial Quality
Kg Kilogram
Km Kilometer
Kw Kilowatt
LDV light-duty vehicle
LpG liquified petroleum gas
MDiC Ministry of Development industry and Foreign trade
MJ Megajoule
MpFi Multi-point fuel injection
Mpg Miles per gallon
NaS us national academy of sciences
43
ICCT white paper
NhTSa us national highway transportation safety administration
OhV overhead valve
pBEV Brazilian Vehicle labeling Program
pSa Psa Peugeot citroeumln
pTwR Power-to-weight ratio
pV Passenger vehicle
RwD rear-wheel drive
SOhC single overhead camshaft
SUV sport utility vehicle
US united states
USD us dollar
VTEC Valve timing electronic control
VVa Variable valve actuation
VVL Variable valve lift
44
Brazil Passenger Vehicle Market statistics
AppENDix A SEGMENT DEfiNiTiONS
Table a‑1 ndash segment definitions
Segmentpower (kw)
pTwR (kwkg) area (m2)
Other characteristics Examples
Subcompact lt 140 lt 0075 le 65 mdash Mini cooper chevrolet celta smart Fortwo
Compact lt 140 lt 0075 65 lt area le 70 mdash honda Fit hyundai hB20 Volkswagen Polo
Medium lt 140 lt 0075 70 lt area le 80 mdash honda civic nissan tiida Peugeot 308
Large lt 140 lt 0075 gt 80 mdash audi a4 BMW 3 series Mercedes c-class
Sports gt 140 gt 0075 mdash 4 seats maxjaguar XF lamborghini gallardo Ferrari california
Off‑road mdash mdash lt 80 traction = 4WDjeep cherokee honda cr-V BMW X3 hyundai santa Fe
SUV mdash mdash lt 80Based on aDKrsquos default classification
BMW X1 Ford ecosport hyundai tucson
Minivan mdash mdash Passengers 6-12
citroen grand Picasso Kia carnival
45
ICCT white paper
AppENDix b iNTErNATiONAL MArKET DATA
Table B‑1 ndash international market comparison of new fleet characteristics
parameters China S Korea EU US Japan india Brazil
Year 2012 2011 2013 2013 2011 2012 2013
Sales (million) 155 13 118 156 352 256 304
price (USD) $21008 $21383 $24439 mdash $20637 $11717 $22015
No of cylinders mdash 43 40 47 38 36 40
Displacement (cc) 1605 1960 1613 2606 1425 1294 1430
Curb weight (kg) 1296 1421 1391 1623 1193 1059 1106
Length (mm) 4323 4531 4263 mdash 4013 3859 4100
Footprint (m2) 38 420 40 425 371 341 367
Engine power (kw) 86 120 89 148 78 55 76
pTwR (kwkg) 00664 00844 00640 00912 00654 00519 00671
Energy consumption ndash US CaFE (MJKm)[1] 235 206 169 250 171 183 202
[1] energy consumption data presented here for countries other than Brazil were obtained from local official sources in its original metric and drive cycle and then converted to Mjkm under the us caFe drive cycle using the methodology described in Yang (2015) Mode details and historical fuel consumption data on their original metrics is presented in the icctrsquos global PV standard website httpwwwtheicctorginfo-toolsglobal-passenger-vehicle-standards
Data Sources
China Ministry of industry and information technology (Miit 2014) corporate average Fuel efficiency accounting Method for Passenger cars available at httpwwwgovcngzdt2013-0320content_2358627htm
Baseline performance china automotive research and technology center through internal communication and icct internal 2010 database for chinese light-duty vehicles
S Korea internal communication with s Korean official and from greencarcongress available at httpwwwgreencarcongresscom200906korea-20090604html
EU european environment agency (2014) Monitoring co2 emissions from new passenger cars in the eu summary of data for 2013 april 2014
US us ePa (2014) light-duty automotive technology carbon dioxide emissions and fuel economy trends1975 through 2014 table 91 page 110 available at http httpwwwepagovfueleconomyfetrends1975-2014420r14023apdf
Japan jaMa (2010) the Motor industry of japan available at httpwwwjama-englishjppublicationsMVs2010pdf Mlit httpwwwmlitgojpcommon000990330pdf
india Bureau of energy efficiency white paper 2010-2012 calculation based on icct database
Brazil icct Brazil Vehicle Database (2013)
46
Brazil Passenger Vehicle Market statistics
Table B‑2 ndash international market comparison of technology adoption in new vehicles
Technology adoption China S Korea EU US Japan india Brazil
Year 2010 2011 2013 2013 2011 2012 2013
Fuel type
CBGLpGFlex 0 11 2 0 0 4 94
Gasoline 99 65 44 93 86 56 6
hybrid 0 1 1 5 13 0 0
Diesel 1 23 53 1 0 40 0
No of cylinders
Two 0 0 0 0 0 6 0
Three 4 0 7 0 36 28 3
Four 90 84 87 56 57 65 97
Five 0 0 1 0 0 0
Six 6 15 4 32 5 0 1
Eight or more 0 0 0 12 1 0 0
Transmission
Manual 60 3 83 5 1 98 83
automatic 34 90 9 75 34 2 15
CVT 5 7 2 18 65 0 1
DCT 1 0 6 2 mdash 0 1
Number of gear ratios
Four or fewer 13 16 1 7 mdash 10 6
Five 68 9 45 11 mdash 85 83
Six or more 19 75 54 82 mdash 5 11
Drivetrain
FwD 74 86 81 83 59 76 0
RwD 21 7 7 10 5 22 0
4wD and awD 5 7 12 7 36 2 100
No of valves per cylinder
Two 17 mdash mdash 2 4 25 60
Multi valve 83 mdash mdash 98 95 75 40
Valve camshaft configuration
Single overhead camshaft 26 1 mdash mdash 16 41 63
Dual overhead camshaft 74 84 mdash mdash 82 53 25
Overhead camshaft mdash 15 mdash mdash 0 6 mdash
Valve actuation
Fixed 50 16 mdash 2 11 86 78
VVT 44 84 mdash 98 89 12 16
VVL 6 mdash mdash mdash mdash 2 6
Fuel systems for gasoline vehicles
Multi‑point fuel injection 94 72 68 62 95 100 98
Gasoline direct injection 6 28 32 37 5 0 2
air induction systems for gasoline vehicles
Naturally aspirated 93 75 41 85 92 64 97
Supercharger turbocharger or twin‑turbo 7 25 59 15 8 36 3
47
ICCT white paper
AppENDix C NEW vEhiCLE ChArACTEriSTiCS AND TEChNOLOGy ADOpTiON DATA iN brAziL
Table C‑1 ndash Fleet characteristics of new Brazilian passenger vehicles by segment (2013)
parameters Subcompact Compact Medium Large Sports Off‑road SUV Minivan
Sales (thousands) 6785 6843 11790 1920 273 768 1997 23
Market share () 223 225 38 8 63 09 25 65 01
price (R$) $30103 $38732 $45496 $66508 $148834 $151284 $75164 $82284
No of cylinders 400 391 399 400 462 448 404 433
Displacement (cc) 1128 1293 1447 1794 2430 2586 1884 2244
Curb weight (kg) 940 1037 1102 1329 1561 1772 1395 1604
Length (mm) 3804 4026 4163 4499 4711 4516 4352 4658
Footprint (m2) 339 361 371 402 418 409 402 427
Engine power ndash gasoline (kw) 58 68 75 99 183 146 103 120
Engine power ndash ethanol (kw) 59 70 77 98 mdash 109 101 mdash
pTwR ndash gasoline (kwkg) 00614 00655 00671 00742 01173 00828 00731 00732
pTwR ndash ethanol (kwkg) 00630 00678 00697 00757 mdash 00766 00745 mdash
48
Brazil Passenger Vehicle Market statistics
Table C‑2 ndash Fleet characteristics of new Brazilian passenger vehicles by manufacturer (2013)
parameters Fiat
GM
Vo
lksw
agen
Ford
Ren
ault
hyu
ndai
ho
nda
Toyo
ta
pSa
Nis
san
Mit
sub
ishi
Kia
JaC
BM
w
Land
Rov
er
Mer
ced
es‑B
enz
Che
ry
aud
i
Suzu
ki
Jeep
Sales (thousands) 6087 5486 5448 3074 2207 2055 1392 1334 1163 621 368 255 158 141 106 94 80 67 63 36
Market share () 2002 1804 1792 1011 726 676 458 439 383 204 121 084 052 046 035 031 026 022 021 012
price (R$) $35017 $42259 $38701 $46174 $43447 $50112 $67078 $68922 $103001 $44035 $100696 $87009 $37654 $165111 $221943 $153281 $30821 $142799 $74769 $139039
No of cylinders 400 401 400 402 400 370 400 400 400 400 408 416 400 424 448 431 400 411 400 552
Displacement (cc) 1250 1340 1287 1497 1423 1495 1691 1808 1575 1579 2262 1856 1411 2095 2281 1934 1398 1912 1831 3182
Curb weight (kg) 1033 1060 1020 1156 1102 1122 1210 1201 1231 1069 1556 1377 1079 1624 1868 1598 1097 1551 1444 1945
Length (mm) 3965 4155 3993 4120 4127 4078 4319 4299 4116 4171 4401 4357 3956 4574 4487 4527 3896 4454 4234 4584
Footprint (m2) 345 370 354 368 378 383 397 387 376 379 395 407 351 429 433 429 349 417 323 420
Engine power ndash gasoline (kw) 64 71 65 79 73 86 96 90 80 82 120 112 83 151 179 138 71 136 94 162
Engine power ndash ethanol (kw) 65 72 65 79 76 85 97 90 81 82 107 106 95 mdash mdash mdash 75 mdash mdash mdash
pTwR ndash gasoline (kwkg)
00613 00662 00631 00674 00657 00739 00788 00745 00646 00766 00779 00792 00784 00921 00977 00856 00638 00870 00649 00835
pTwR ndash ethanol (kwkg) 00629 00681 00642 00693 00685 00781 00800 00795 00660 00768 00710 00798 00896 mdash mdash mdash 00659 mdash mdash mdash
49
ICCT white paper
Table C‑3 ndash Fleet characteristics of new Brazilian passenger vehicles by origin (2013)
parameters Domestic imported
Sales (thousands) 2537 504
Market share () 834 166
price (R$) $41739 $76049
No of cylinders 397 412
Displacement (cc) 1359 1791
Curb weight (kg) 1070 1289
Length (mm) 4063 4285
Footprint (m2) 362 390
Engine power ndash gasoline (kw) 70 102
Engine power ndash ethanol (kw) 73 84
pTwR ndash gasoline (kwkg) 0065 0076
pTwR ndash ethanol (kwkg) 0068 0074
50
Brazil Passenger Vehicle Market statistics
Table C‑4 ndash technology adoption in new Brazilian passenger vehicles by segment (2013)
Technology adoption Subcompact Compact Medium Large SportOff‑road SUV Minivan
Fuel type
Flex 982 988 982 837 00 134 826 00
Gasoline 18 12 17 163 996 540 174 1000
hybrid 0000 0000 0028 0000 0396 0001 0000 0000
Diesel 00 00 00 00 00 326 00 00
No of cylinders
Three 01 91 10 00 00 00 00 00
Four 999 909 990 998 758 775 979 833
Five 00 00 00 02 03 00 00 00
Six 00 00 00 00 175 211 21 167
Eight or more 00 00 00 00 63 13 00 00
Transmission
Manual 993 944 826 622 62 174 505 641
automatic 07 55 161 283 629 707 451 359
CVT 00 00 12 89 09 93 34 00
DCT 00 01 02 06 299 25 10 00
No of gear ratios
Four or fewer 04 47 72 51 00 34 247 193
Five 984 943 848 378 15 392 516 641
Six 12 09 73 515 796 462 225 167
Seven 00 01 06 23 87 53 12 00
Eight or more 00 00 01 32 102 59 00 00
Drivetrain
FwD 998 1000 997 688 550 00 916 1000
RwD 02 00 03 311 221 00 84 00
awD 00 00 00 01 229 1000 00 00
No of valves per cylinder
Two 806 694 584 195 00 00 258 00
Multi valve 194 306 416 805 1000 1000 742 1000
Valve camshaft configuration
Single overhead camshaft 839 786 709 309 00 212 375 00
Dual overhead camshaft 24 158 161 546 880 517 446 255
Valve actuation
Fixed 982 729 807 461 49 493 664 868
VVT 18 211 115 470 827 367 252 132
VVT+VVL 00 61 78 68 124 140 84 00
Fuel systems for gasoline vehicles
Multi‑point fuel injection 999 998 997 949 979 143 766 1000
Gasoline direct injection 01 02 03 51 21 857 234 00
air induction systems for gasoline vehicles
Naturally aspirated 999 997 995 943 974 369 543 1000
Supercharger turbocharger or twin‑turbo 01 03 05 57 26 631 457 00
51
ICCT white paper
Table C‑5 ndash technology adoption in new Brazilian passenger vehicles by manufacturer (2013)
Technology adoption Fi
aT
GM
VO
LKSw
aG
EN
FOR
D
REN
aU
LT
hY
UN
Da
i
hO
ND
a
TOYO
Ta
pSa
NiS
SaN
MiT
SUB
iSh
i
Kia
JaC
BM
w
LaN
D R
OV
ER
MER
CED
ES
Fuel type
Flex 990 987 965 966 997 921 999 886 928 998 283 739 31 42 00 00
Gasoline 10 09 35 34 03 79 01 35 72 02 557 255 969 957 663 950
hybrid 00 00 00 00 00 00 00 02 00 00 00 00 00 00 00 00
Diesel 00 04 00 00 00 00 00 77 00 00 160 06 00 00 337 50
No of cylinders
Three 00 00 05 00 00 348 00 00 00 00 00 00 00 00 00 00
Four 1000 996 994 989 1000 626 999 998 1000 1000 958 922 1000 906 787 878
Five 00 00 00 00 00 00 00 00 00 00 00 00 00 00 00 00
Six 00 02 01 11 00 26 01 02 00 00 42 78 00 68 185 87
Eight or more 00 02 00 00 00 00 00 00 00 00 00 00 00 26 28 35
Transmission
Manual 992 878 985 846 853 632 566 565 703 785 493 120 1000 02 00 151
automatic 08 103 00 137 62 285 355 160 297 121 118 793 00 575 18 14
CVT 00 19 15 16 41 70 01 246 00 00 139 87 00 423 982 836
DCT 00 00 00 00 43 13 78 30 00 94 251 00 00 00 00 00
No of gear ratios
Four or fewer 02 04 00 55 104 237 00 323 249 132 17 133 00 00 00 00
Five 981 811 963 839 797 623 861 643 684 828 530 107 1000 00 00 64
Six 17 185 29 106 99 140 139 07 67 40 453 754 00 217 800 00
Seven 00 00 07 00 00 00 00 27 00 00 00 00 00 08 00 936
Eight or more 00 00 00 00 00 00 00 00 00 00 00 06 00 775 200 00
Drivetrain
FwD 1000 902 989 972 987 985 990 892 1000 1000 496 623 1000 00 00 00
RwD 00 91 00 00 00 00 00 16 00 00 00 370 00 882 00 900
awD 00 06 11 28 13 15 10 92 00 00 504 07 00 118 1000 100
No of valves per cylinder
Two 811 864 988 745 220 00 00 00 00 00 00 00 00 00 00 00
Multi Valve 189 136 12 255 780 1000 1000 1000 1000 1000 1000 1000 1000 1000 1000 1000
Valve camshaft configuration
SOhC 836 755 914 675 832 00 04 00 497 398 331 00 00 00 00 00
DOhC 07 108 56 50 168 992 786 875 352 428 477 1000 907 810 860 453
Valve actuation
Fixed 1000 898 965 966 940 29 00 574 736 573 435 76 124 187 18 55
VVT 00 102 35 34 60 971 00 426 264 427 00 924 876 00 982 945
VVT+VVL 00 00 00 00 00 00 1000 00 00 00 565 00 00 813 00 00
air induction System
Naturally aspirated 997 994 966 977 997 988 1000 923 922 1000 835 936 1000 97 37 101
Supercharger turbocharger or twin‑turbo
03 06 34 23 03 12 00 77 78 00 165 64 00 903 963 899
Fuel systems for gasoline vehicles
Multipoint fuel injection 1000 995 965 972 1000 989 1000 1000 967 1000 994 1000 1000 78 15 158
Gasoline Direct injection 00 05 35 28 00 11 00 00 33 00 06 00 00 922 985 842
note Difference between 100 and summation of sohc and Dohc market share values corresponds to data not available
52
Brazil Passenger Vehicle Market statistics
AppENDix D DATA SOurCES AND COMpLETENESS
the basis of the statistics shown in this report is a database compiled by the icct with vehicle sales technical information (eg fleet characteristics technology content) and energy consumption (converted from either co2 emissions or fuel economy) from various data sources outlined in table D-1
Table D‑1 ndash Brazilian data sources
parameters Sales TechnicalEnergy
consumption
aDK (2014 2015) x x
MarkLines (2015) x
iBaMa (2014) x
iNMETRO (2014) x
UOL (2014) x
icarroscom (2014) x
this analysis examined energy consumption data from two public sources the nota Verde Program by the Brazilian institute of the environment and renewable natural resources (iBaMa) and the Brazilian Vehicle labeling Program (PBeV) by the national institute of Metrology standardization and industrial Quality (inMetro) table D-2 summarizes key differences between these two data sources
Table D‑2 ndash energy consumption data sources
iBaMa iNMETRO
program nota Verde1 Brazilian Vehicle labeling Program (PBeV)2
program description
Mandatory program that reports emissions of co2 co nox and nMhc as part of emissions certification program
Voluntary program since 2009 that allows the comparison of fuel economy across vehicle models
Unit gco2 km kml
Test cycle chassis testing under urban (FtP) driving cycle based on nBr 66012005
chassis testing under urban (FtP) and highway (hWYFe) driving cycles based on nBr 702420103
adjustment
no adjustment for real-world driving conditions Because reported co2 emissions are assumed to be zero for ethanol adjustments were made to account for tailpipe co2 emissions for vehicles running on ethanol
since 2010 published values include real-world adjustment factors to chassis test data a method adopted by the us ePa in 2008
Conversion to MJkm
iBaMarsquos data are reported as FtP (city test) co2 data in gco2 km conversion to caFe test cycle and to a different metric (Mjkm) involves four steps as presented in Figure D-1
inMetrorsquos data in kml are presented separately by fuel type (e22 e100) and driving cycle (urban highway) conversion to Mjkm was done by applying a conversion factor (2167 gco2 l for e22 and 1428gco2l for e00) caFe values are obtained by using a 5545 weighting for the urban (FtP) and highway cycles respectively
1 iBaMa (2014) nota Verde program available at httpwwwmmagovbrcidades-sustentaveisqualidade-do-arcontrole-de-emissoes-veicularesnota-verde
2 inMetro (2014) Programa Brasileiro de etiquetagem Veicular (PBeV) available at httpwwwinmetrogovbrconsumidortabelas_pbe_veicularasp
3 inMetro (2014) Metodologia Para Divulgaccedilatildeo De Dados De consumo Veicular available at httpwwwinmetrogovbrconsumidorpbeMetodologia_consumo_Veicularpdf
53
ICCT white paper
Step 1 Correcting the original IBAMA CO2 reported data ndash FTP CO2 gkm
IBAMArsquos CO2 reported values are corrected to account for tailpipe emissions from ethanol (tailpipe CO2 emissions are reported as zero in IBAMArsquos data)
bull E22 FTP reported CO2 data are reduced by 177bull E100 FTP reported CO2 data are reduced by 100
Flex fuel vehicles are tested with E22 and E00 the final values is calculated as the average of both fuelsCO2 IBAMA_Flex_FTP= 05(1-0177)CO2_E22_test_FTP + 050E100_FTP = 050823CO2_E22_FTPFor Gasoline only vehicles the tests are carried out only with Gasoline E22CO2 IBAMA_Gasoline_FTP = (1-0177) CO2_E22_Test_FTP
Where in the previous equations CO2_E22_FTP means CO2 emissions values obtained under FTP testingCO2 IBAMA_Flex_FTP means IBAMArsquos Corrected FTP values for flex vehiclesCO2 IBAMA_Gasoline_FTP means IBAMArsquos Corrected FTP values for gasoline only (E22) vehicles
INNOVAR AUTO is based on energy consumption data obtained as the combined CAFE test cycle This requires a weighted average of energy consumption data obtained from FTP testing (city driving ) and Highway fuel economy testing (HWFET) In mathematical form CAFE=f(FTPHWFET)
Given that IBAMA data is provided for only the first aprt the FTP testing then it is required to find a way to calculate CAFE combined values through FTP -75 only data A linear function was thus developed from data with FTP and HWY values (INMETRO data) is used to convert FTP only values to CAFE CO2 values ie CAFE=f(FTP) The function used for this conversion is
CO2_CAFE= (CO2_FTP+44756)11572
Step 2Convert FTP CO2 values to CAFE CO2 values
Converting CO2 values to MJkm values is done by using the energy density of E22 Note that all the previous calculations for CO2 come from E22-based data
bull The energy density of E22 is 2894 MJLE22bull E22 emits 2167gCO2LE22bull CAFE (MJkm) = CAFE (gCO2km) (2894 MJLE22 2167 gCO2LE22)
Step 3 Convert US CAFE CO2 values to MJkm values
Figure D‑1 ndash conversion of emission to energy consumption data
energy consumption values calculated from iBaMa and inMetro data differ greatly Figure D-1 illustrates energy consumption data for those models in both databases iBaMa data are on average 126 higher than inMetro data with a standard deviation of 89 and a maximum deviation of 39
54
Brazil Passenger Vehicle Market statistics
0
05
1
15
2
25
3
0 05 1 15 2 25 3
Ene
rgy
cons
ump
tio
n IB
AM
A (
MJ
km)
Energy consumption INMETRO (MJkm)
n=151
Figure D‑2 ndash comparison between energy consumption data from inMetro and iBaMa
151 vehicles tested under both programs
although inMetro data are more transparent as it breaks down fuel economy by fuel and test cycle it is still a voluntary program that allows manufacturers to select which models will participate in addition not all manufacturers participate in the program in turn iBaMa data only include co2 data for the urban cycle and thus energy consumption in the combined cycle had to be estimated from correlations using international data in addition corrections had to be made for gasoline-only engines since it seems that a co2 discount in theory only applicable to flex-fuel engines was also applied to gasoline-only engines Despite these data quality issues iBaMa data were considered the most adequate data source for energy consumption because it is a mandatory program that requires data reporting by all vehicle models and manufacturers
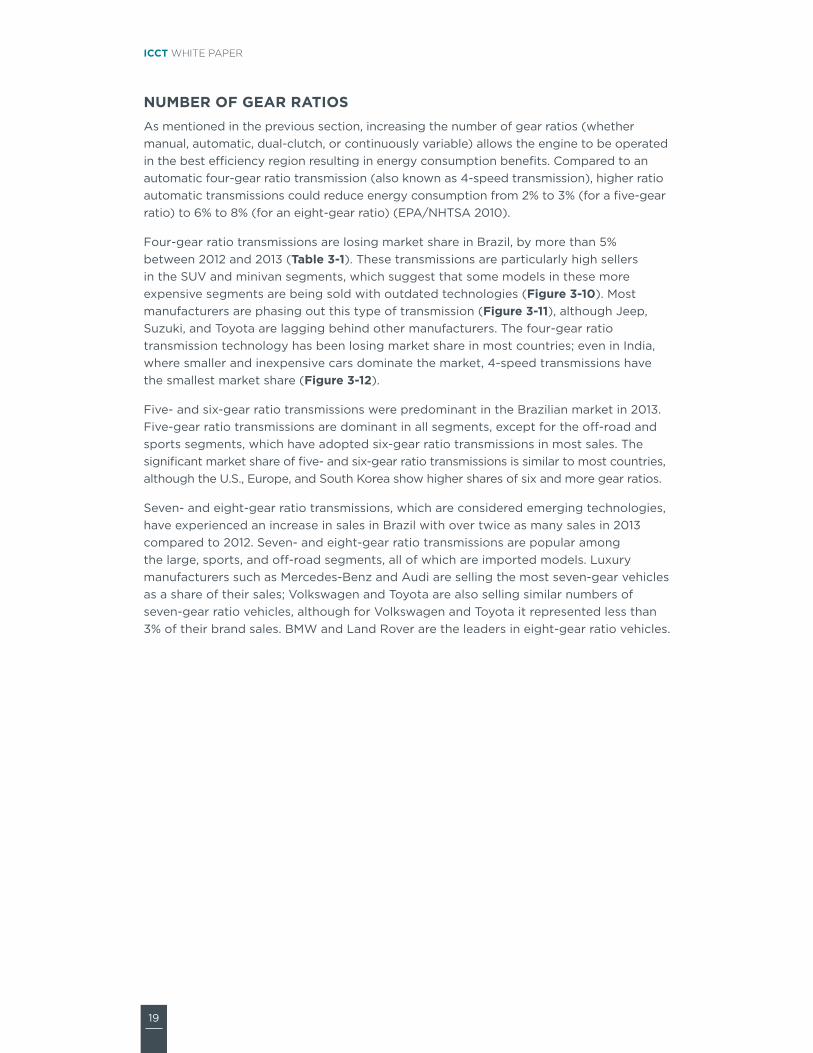
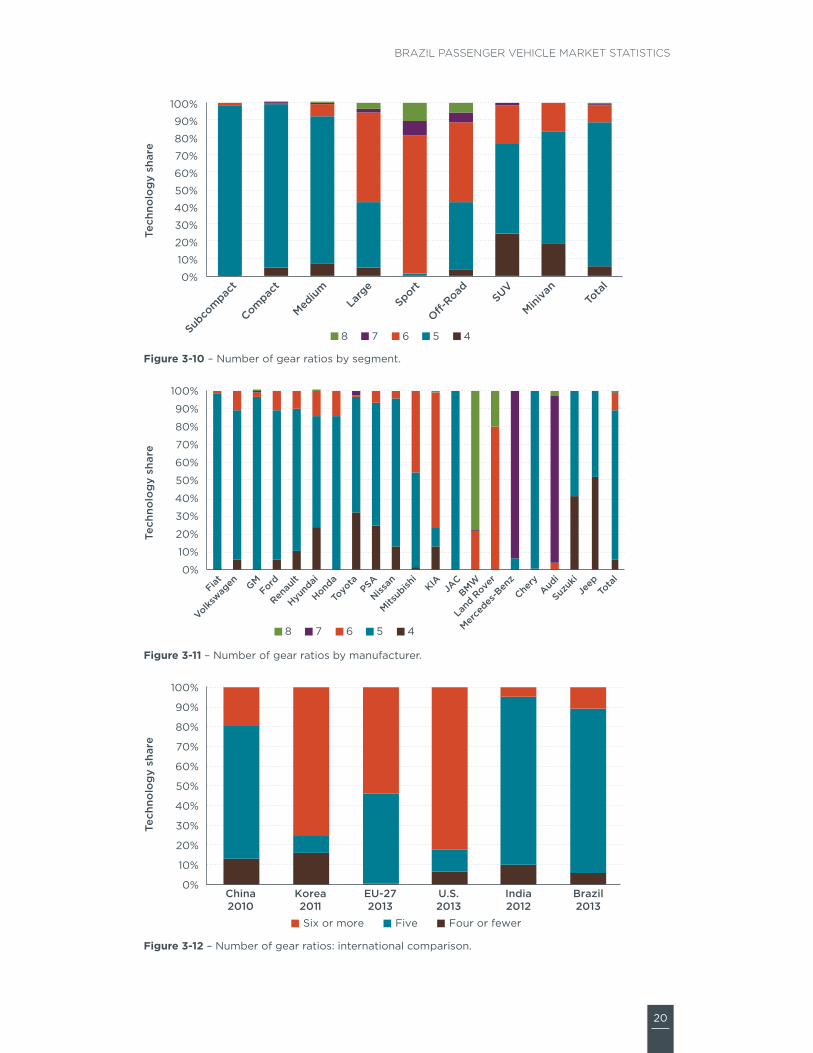
20
Brazil Passenger Vehicle Market statistics
0
10
20
30
40
50
60
70
80
90
100
Subco
mpac
t
Compac
t
Medium
Larg
eSport
O-Road
SUV
Miniva
nTo
tal
Tech
nolo
gy
shar
e
8 7 6 5 4
Figure 3‑10 ndash number of gear ratios by segment
0
10
20
30
40
50
60
70
80
90
100
Fiat GM
Volkswag
enFord
Renau
lt
Hyund
ai
Honda
Toyo
taPSA
Nissan
Mitsub
ishi
KIAJA
CBMW
Land
Rove
r
Merce
des-B
enz
Chery
Audi
Suzuk
iJe
epTo
tal
Tech
nolo
gy
shar
e
8 7 6 5 4
Figure 3‑11 ndash number of gear ratios by manufacturer
0
10
20
30
40
50
60
70
80
90
100
Tech
nolo
gy
shar
e
Six or more Five Four or fewer
China2010
Korea2011
EU-272013
US2013
India2012
Brazil2013
Figure 3‑12 ndash number of gear ratios international comparison
21
ICCT white paper
DRiVETRaiNDrivetrain technology includes front-wheel drive (FWD) rear-wheel drive (rWD) and all-wheel drive (aWD) vehicles For the same vehicle size FWD vehicles provide more interior space and better energy consumption than rWDs due to lower weight as it avoids the added weight of and space for the driveshaft and differential that rWD requires Because the weight of the engine and transmission is located close to the wheels FWD vehicles have better traction than rWDs rWDs however show better handling as the weight distribution between the front and rear wheels is more uniform and the tasks of turning and acceleration are split between the front and rear wheels also directing large amounts of power through the front wheels can create ldquotorque steerrdquo thus rWD is the adequate technology for the sports segment aWD drivetrains are intended for specific driving applications that imply loss of traction such as off-road terrains snow or towing
FWD vehicles dominate all segments of the Brazilian passenger car market (Table 3‑1) with the exception of the off-road segment (Figure 3‑13) among the 20 largest manufacturer sellers most except for BMW land rover Mercedes-Benz and suzuki offer FWD technology (Figure 3‑14) Brazil has the highest market share of FWD vehicles of all countries analyzed (944) although FWD has at least 50 market share in all seven countries (Figure 3‑15)
aWD market share increased by 15 between 2012 and 2013 due to a tri-fold increase in the sports segment sales off-road vehicle sales with aWD also increased to more than 76000 units in 2013 amongst the largest ten manufacturers toyota is the aWD market leader followed by Ford and Volkswagen note that land rover sells only aWD vehicles in Brazil among non-luxury manufacturers Mitsubishi and suzuki are selling more than 50 of their vehicles with aWD technology
rWD technology is offered mostly in large and sports vehicles and in suVs among the 10 largest manufacturers rWD is offered mainly by gM and toyota while an extended examination of the 20 largest manufacturers by sales show that aWD and rWD is focused among the more expensive brands (Figure 3‑14) Mercedes-Benz and BMW sell close to 90 of their vehicles with rWD technology traditionally associated with engine performance and responsiveness
22
Brazil Passenger Vehicle Market statistics
0
10
20
30
40
50
60
70
80
90
100
Subco
mpac
t
Compac
t
Medium
Larg
eSport
O-Road SUV
Miniva
nTo
tal
Tehn
olo
gy
shar
e
AWD RWD FWD
Figure 3‑13 ndash Drivetrain by segment
0
10
20
30
40
50
60
70
80
90
100
Fiat GM
Volkswag
enFord
Renau
lt
Hyund
ai
Honda
Toyo
taPSA
Nissan
Mitsub
ishi
KIAJA
CBMW
Land
Rove
r
Merce
des-B
enz
Chery
Audi
Suzuk
iJe
epTo
tal
Tech
nolo
gy
shar
e
AWD RWD FWD
Figure 3‑14 ndash Drivetrain by manufacturer
0
10
20
30
40
50
60
70
80
90
100
China2010
Korea2011
EU-272013
US2013
Japan2011
India2012
Brazil2013
Tech
nolo
gy
shar
e
AWD RWD FWD
Figure 3‑15 ndash Drivetrain international comparison
23
ICCT white paper
VaLVE CaMShaFT CONFiGURaTiON (DOhC VS SOhC)the engine camshaft governs the timing duration and lift of valve operation controlling the intake of air and the exhaust of combustion gases this report focuses on single overhead camshafts (sohc) and dual overhead camshafts (Dohc) as these configurations have almost completely replaced the older overhead valve configuration (ohV) sohc design places a single camshaft above the cylinder head that governs all the valves intake and exhaust in the case of sohc V-engines there is one single camshaft per head Dohc designs use separate camshafts for intake valves and exhaust valves Dohc engines achieve increased airflow at high-engine speeds improve volumetric efficiency and reduce the valvetrainrsquos moving mass such engines typically develop higher power at high-engine speeds the us environmental Protection agency (ePa) and national highway traffic safety administration (nhtsa) estimate the effectiveness of Dohc over sohc to be between 1 and 25 (ePanhtsa 2010)
although Dohc produce more power and provide lower fuel consumption the Brazilian fleet is still mostly composed of sohcs vehicles (Table 3‑1) sohc technology is predominant among the subcompact compact and medium segments (Figure 3‑16) among manufacturers sohc technology is predominant among the five largest least expensive brands (Figure 3‑17) sales of vehicles with more advanced Dohc technology grew in 2013 by almost 36 with respect to 2012 albeit from a relatively smaller base this increase was experienced in all vehicle segments but in different magnitudes
although global data on this technology are scarce Figure 3‑18 indicates that most countries are moving away from sohc with Brazil being the only country analyzed where sohc is still predominant no data were available for the us or europe
24
Brazil Passenger Vehicle Market statistics
0
10
20
30
40
50
60
70
80
90
100
Subco
mpac
t
Compac
t
Medium
Larg
eSport
O-Road SUV
Miniva
nTo
tal
Tech
nolo
gy
shar
e
nd DOHC SOHC
Figure 3‑16 ndash Valve camshaft configuration by segment (nd no data)
0
10
20
30
40
50
60
70
80
90
100
Fiat GM
Volkswag
enFord
Renau
lt
Hyund
ai
Honda
Toyo
taPSA
Nissan
Mitsub
ishi
KIAJA
CBMW
Land
Rove
r
Merce
des-B
enz
Chery
Audi
Suzuk
iJe
epTo
tal
Tech
nolo
gy
shar
e
nd DOHC SOHC
Figure 3‑17 ndash Valve camshaft configuration by manufacturer (nd no data)
0
10
20
30
40
50
60
70
80
90
100
China2010
Korea2011
Japan2011
India2012
Brazil2013
Tech
nolo
gy
shar
e
nd OVC DOHC SOHC
Figure 3‑18 ndash Valve camshaft configuration international comparison (nd no data)
25
ICCT white paper
VaLVE aCTUaTiON improved valvetrain systems with variable valve actuation (VVa) technology either variable valve timing (VVt) or variable valve timing and lift (VVt+VVl) improves the enginersquos volumetric and thermodynamic efficiency they also enable further engine improvements such as internal exhaust gas recirculation and cylinder deactivation VVt alters the timing of the intake valve exhaust valve or both primarily to reduce pumping losses increase specific power and control residual exhaust gases VVl increases efficiency by optimizing airflow over a broader range of engine operation which reduces pumping losses and increases specific power VVl is accomplished by controlled switching between two or more cam profile lobe heights the most advanced technology VVt+VVl yields a wide range of performance optimization and volumetric efficiency including enabling the engine to be valve-throttled (no need for intake throttle) VVt provides energy consumption gains of 3 to 5 while the more flexible and complex VVt+VVl system can reach 4 to 8 (ePa amp nhtsa 2010)
VVa technology either VVt or VVt+VVl are emerging technologies in Brazil where most vehicles still have fixed-valve timing designs (Table 3‑1) Fixed technology is predominant among the smaller vehicle segments as well as suVs and minivans (Figure 3‑19) the five largest manufacturers sold more than 90 of their vehicles with fixed-valve technology in 2013 (Figure 3‑20) the international comparison indicates that only Brazil and india have not yet adopted VVa technologies for most of their light-duty fleet (Figure 3‑21)
VVt and VVt+VVl are being adopted across all segments including the subcompact segment but tend to be more predominant in high-end manufacturers a closer examination by manufacturer shows that most are offering some vehicles with either one of the VVa systems while honda and hyundai offer this technology in almost all vehicles (Figure 3‑20) honda is the technology leader in variable valve actuation with the adoption in the early 1990s of the Vtec system (Valve timing electronic control) VVt technologyrsquos market share grew by about 25 in 2013 primarily due to hyundairsquos sales from 80000 units in 2012 to almost 200000 units in 2013 hyundai offered the continuously variable valve technology (cVVt) in the large majority of vehicle sold in 2013 the sports segment is the one where VVt dominates the market Mitsubishi BMW and audi are also selling a large share of their vehicles with the VVt+VVl technology
26
Brazil Passenger Vehicle Market statistics
0
10
20
30
40
50
60
70
80
90
100
Subco
mpac
t
Compac
t
Medium
Larg
eSport
O-Road SUV
Miniva
nTo
tal
Tech
nolo
gy
shar
e
VVT+VVL VVT Fixed
Figure 3‑19 ndash Valve actuation by segment
0
10
20
30
40
50
60
70
80
90
100
Fiat GM
Volkswag
enFord
Renau
lt
Hyund
ai
Honda
Toyo
taPSA
Nissan
Mitsub
ishi
KIAJA
CBMW
Land
Rove
r
Merce
des-B
enz
Chery
Audi
Suzuk
iJe
epTo
tal
Tech
nolo
gy
shar
e
VVT+VVL VVT Fixed
Figure 3‑20 ndash Valve actuation by manufacturer
VVT+VVL VVT Fixed
0
10
20
30
40
50
60
70
80
90
100
China2010
Korea2011
US2013
Japan2011
India2012
Brazil2013
Tech
nolo
gy
shar
e
Figure 3‑21 ndash Valve actuation international comparison
27
ICCT white paper
FUEL SYSTEMS FOR GaSOLiNE VEhiCLESVehicle fuel systems describe the technology required to deliver fuel into the engine combustion chamber this section examines two gasolineflex technologies namely multi-point fuel injection (MPFi) and gasoline direct injection (gDi) MPFi is now the most common fuel-delivery system for gasoline engines used in passenger vehicles worldwide in sequential MPFi engines fuel is injected into the air stream next to the intake valve port while the intake valve is open to draw the air-fuel mixture into the cylinder some of the fuel is vaporized on the surface of the hot intake valve expanding and thus reduces the volumetric efficiency on gDi engines fuel is injected at high pressure directly into the combustion chamber improving volumetric efficiency and providing cooling of the airfuel charge within the cylinder which allows for higher compression ratios and increased thermodynamic efficiency gDi technology alone offers benefits of 2 to 5 with respect to MPFi engines but bigger benefits rely on the synergy between gDi turbocharging and downsizing which can reach 12 to 15 energy consumption reduction with respect to a MPFi naturally aspirated engine (ePa 2012)
Table 3‑1 illustrates that MPFi is still the most common fuel injection technology for gasolineflex vehicles in Brazil which is reflected in its dominant share across most segments except for sports and off-road vehicles in Brazil gDi has found a niche market in the sports and off-road segments with more than 90 of sport vehicles fitted with gDi technology (Figure 3‑22) Within the overall gasoline market the gDi technology is still an emerging technology representing just 24 of new sales gDirsquos market share increased by 31 in 2013 with all but 4000 units being imported among the 10 largest manufacturers the adoption of gDi is extremely low below 5 for Volkswagen Ford hyundai and Psa (Figure 3‑23) high-end european brands (audi land rover Mercedes-Benz and BMW) are the technology leaders in terms of gDi adoption rates echoing the trend of turbocharging technology sales Volkswagen vehicles with gDi systems account for less than 35 of their sales in 2013 but their absolute numbers (around 19000 vehicles) place the company as one of the leaders in gDi technology in the Brazilian market
From a global market perspective the penetration of gDi technology in Brazil is low compared to all other markets in Figure 3‑24 except for india and japan it should be noted that the later has the largest share of hybrid vehicles around the globe
28
Brazil Passenger Vehicle Market statistics
0
10
20
30
40
50
60
70
80
90
100
Compac
t
Subco
mpac
t
Medium
Larg
eSport
O-Road SUV
Miniva
nTo
tal
Tech
nolo
gy
shar
e
GDI MPFI
Figure 3‑22 ndash gasolineflex fuel system by segment
GDI MPFI
0102030405060708090
100
Fiat GM
Volkswag
enFord
Renau
lt
Hyund
ai
Honda
Toyo
taPSA
Nissan
Mitsub
ishi
KIAJA
CBMW
Land
Rove
r
Merce
des-B
enz
Chery
Audi
Suzuk
iJe
epTo
tal
Tech
nolo
gy
shar
e
Figure 3‑23 ndash gasolineflex fuel system by manufacturer
GDI MPFI
0
10
20
30
40
50
60
70
80
90
100
China2010
Korea2011
EU-272013
US2013
Japan2011
India2012
Brazil2013
Tech
nolo
gy
shar
e (n
on-
die
sel)
Figure 3‑24 ndash gasolineflex fuel system international comparison
29
ICCT white paper
TURBOChaRGiNGengine power is primarily limited by the rate at which the engine is able to draw air into the combustion chamber turbocharging and supercharging are two methods to increase the amount of air drawn into the engine above the level of what is possible with the naturally aspirated process (through the expansion of the cylinders) By increasing the amount of air into the engine the amount of fuel can be proportionally increased resulting in increased power output level and with it the ability to reduce engine displacement while maintaining performance the combination of turbocharging and downsizing in spark ignited (gasoline and flex-fuel) vehicles can provide energy consumption improvements between 2 to 6 with respect to a direct-injected gDi engine (ePa amp nhtsa 2010) turbocharging technology is the cornerstone for achieving better energy consumption in vehicles as the basis for downsizing and reducing the engine weight while keeping the same or better vehicle performance (ie acceleration or time to reach certain speed) although turbochargers are used in diesel and gasolineflex vehicles the analysis in this report focuses on turbocharging for spark-ignited gasolineflex vehicles only
turbocharging is one of the most important emerging technologies in Brazil where most vehicles are still naturally aspirated (na) (Table 3‑1) turbocharging technology has increased the market share significantly between 2012 and 2013 by more than 65 albeit from a small base (from about 49000 to 81000 vehicles)
Most vehicles with turbocharging are sold in the sports and off-road segments as this technology also produces superior engine power output (Figure 3‑25) among the 10 largest manufacturers turbocharging is still below 10 of their sales (Figure 3‑26) Volkswagen and Ford despite having small relative sales of vehicles with turbocharging (less than 35) are the manufacturers with the highest total sales of vehicles with turbocharging audi land rover Mercedes-Benz and BMW are the technology leaders with more than 90 of vehicle sales in 2013
the penetration of turbo and supercharging technologies in Brazil is lower than in other countries with a larger gasoline fleet such as the us china and japan (Figure 3‑27) in Brazil 95 of diesel passenger vehicle sales have turbocharging technology
30
Brazil Passenger Vehicle Market statistics
0
10
20
30
40
50
60
70
80
90
100
Compac
t
Subco
mpac
t
Medium
Larg
eSport
O-Road SUV
Miniva
nTo
tal
Tech
nolo
gy
shar
e (n
on-
Die
sel)
Turbo NA
Figure 3‑25 ndash turbocharging for gasolineflex fuel vehicles by segment (NA naturally aspirated)
0102030405060708090
100
Fiat GM
Volkswag
enFord
Renau
lt
Hyund
ai
Honda
Toyo
taPSA
Nissan
Mitsub
ishiKIA
JACBMW
Land
Rove
r
Merce
des-B
enz
Chery
Audi
Suzuk
iJe
epTo
tal
Tech
nolo
gy
shar
e (n
on-
Die
sel)
Turbo NA
Figure 3‑26 ndash turbocharging for gasolineflex fuel vehicles by manufacturer (NA naturally aspirated)
0
10
20
30
40
50
60
70
80
90
100
China2010
Korea2011
EU-272013
US2013
Japan2011
India2012
Brazil2013
Tech
nolo
gy
shar
e (n
on-
die
sel)
Turbo NA
Figure 3‑27 ndash turbocharging for gasolineflex fuel vehicles international comparison (NA naturally aspirated)
31
ICCT white paper
4 vEhiCLE ENErGy CONSuMpTiON
this section analyzes the Brazilian new passenger vehicle energy consumption in 2013 although other metrics are more common (see box) vehicle energy consumption is presented in megajoules per kilometer (Mjkm) for consistency with Brazilrsquos inovar-auto policy in 2012 Brazilrsquos Ministry of Development industry and Foreign trade (MDic) adopted the inovar-auto policy with the aim of fostering industrial competitiveness through technology investments the policy includes a target for corporate average energy consumption (in Mjkm with vehicle curb weight as the attribute parameter) for vehicles sold in 2017
in the us canada Mexico and saudi arabia fleet-average fuel economy standards are defined as a function of vehicle footprint in the eu china japan south Korea and india vehicle weight is the attribute for the calculation of fleet-average targets in Brazil inovar-auto has defined its fiscal targets for vehicle energy consumption measured in megajoules per kilometer (Mjkm) as a function of vehicle weight
VEhiCLE ENERGY MEaSUREMENT UNiTS
Many metrics can be used to describe the amount of fuel energy or emissions generated by unit of distance traveled
Fuel economy measures distance traveled per unit of fuel consumed in Brazil kilometers per liter (kml) is the most common metric to describe vehicle efficiency but other units are used in different countries such as miles per gallon (mpg) in the us
Fuel consumption is the reciprocal of fuel economy and measures fuel consumed per distance traveled it is usually expressed in liters per 100 kilometers (l100 km) and it is used in europe for example
GhGCO2 emissions measures ghg or co2 emissions per distance traveled expressed as grams of pollutant per kilometer or mile
Energy consumption (EC) measures the energy consumed per distance traveled for example in megajoules per kilometer Despite being a less common metric it is sometimes preferred for being a fuel-neutral metric across different types of fuel and vehicle technologies Vehicle energy consumption in Mjkm is the metric used in Brazilrsquos inovar-auto policy to quantify the corporate average energy consumption target for each manufacturer Values for energy consumption in Brazilian spark-ignited vehicles are provided for e22 since that is the fuel mixture used in vehicle tests
Vehicle energy consumption in this report is calculated from co2 emissions data in the Brazilian institute of environment and renewable natural resources (iBaMa) nota Verde program (iBaMa 2014) which reports official emissions data from homologation tests Data are limited to passenger cars sold by the top 10 manufacturers with light commercial vehicles being excluded appendix D presents a description of data sources
32
Brazil Passenger Vehicle Market statistics
and calculation methodologies as well as a discussion of vehicle energy consumption data quality and completeness in Brazil
not surprisingly vehicle energy consumption increases with vehicle footprint and engine rated power the two parameters that define vehicle segments in Brazil (Figure 4‑1) subcompact and compact vehicles which accounted for about 45 of new sales in 2013 have average energy consumption below the fleet average while medium-sized vehicles which hold the largest market share (388) have energy consumption just above the fleet average larger more powerful vehicles consume more energy than the fleet average but have a considerably smaller market share (combined share of 163) Data availability for these segments is not as extensive as the data available for the subcompact compact and medium segments which could affect the relative rankings of each segment
Ene
rgy
cons
ump
tio
n (M
Jkm
)
Subco
mpac
t
Compac
t
Medium
Larg
e
O-road SUV
4000
200000
400000
600000
850000
35
30
25
20
15
10
05
0
Sales
Total 202
Figure 4‑1 ndash new vehicle sales-weighted average energy consumption by segment (2013)
33
ICCT white paper
Figures 4‑2 and 4‑3 illustrate new vehicle energy consumption for multiple weight and footprint bins For each weight bin (in 100 kg increments) and footprint bin (in 01 m2 increments) sales-weighted averages of energy consumption for each vehicle version are presented (dashes) generating energy consumption ranges for each bin (cream areas) Vehicle sales by bin are presented for reference in the lower charts
the strong correlation between vehicle energy consumption and weight follows from the strong physical relationship between the weight of the vehicle and the energy required to accelerate it and overcome resistances9 (Figure 4‑2) Data dispersion within each bin suggests that energy consumption varies due to other vehicle characteristics that affect vehicle aerodynamics and rolling resistance as well as the adoption of technologies that affect engine and transmission efficiency (eg friction reduction technologies gDi VVt)
Curb weight (kg)
SubcompactCompactMediumLargeO-roadSUV
Ene
rgy
cons
ump
tio
n (M
Jkm
)Sa
les
5
6
4
3
2
1
600k
800k
400k
200k
0k800 900 1000 1100 1200 1300 1400 1500 1600 1700 1800 1900 2000 2100
Figure 4‑2 ndash new vehicle energy consumption by vehicle weight (2013)
9 on a plain surface the sum of resistances of a vehicle is acceleration resistance + rolling resistance + aerodynamic resistance = c1 m a + c2 frr m + c3 cw a v2 with mass (m) as an integral part of both acceleration and rolling resistance which are most relevant for inner-city driving situations other factors are acceleration (a) rolling resistance of tires (frr) aerodynamic coefficient of the vehicle (cw) frontal area of vehicle (a) velocity (v) and constants (cx)
34
Brazil Passenger Vehicle Market statistics
Footprint has a reasonable correlation with energy consumption (Figure 4‑3) ie larger vehicles tend to consume more fuel than smaller vehicles however the correlation is not as strong as with vehicle weight similar to the previous figure the broad spread of energy consumption values suggests a combination of different vehicle characteristics (eg weight engine displacement rated power) and technologies (eg transmissions fuel systems) as well as the presence of suVs and off-road vehicles among the medium- and large-sized footprint values respectively
Footprint (m2)
SubcompactCompactMediumLargeO-roadSUV
Ene
rgy
cons
ump
tio
n (M
Jkm
)Sa
les
5
6
4
3
2
1
400k
500k
300k
200k
100k
0k31 32 33 34 35 36 37 38 39 40 41 42 43 44 45 46 48 49
Figure 4‑3 ndash new vehicle energy consumption by vehicle footprint (2013)
35
ICCT white paper
Figure 4‑4 illustrates sales weighted average for new vehicle energy consumption by mass for the top 10 manufacturers in Brazil in 2013 Bubble sizes are proportional to total vehicle sales Manufacturers in the lower-left quadrant produce the lightest and most efficient vehicles with hyundai presenting the best overall average energy consumption renault in the upper-left quadrant produces vehicles that are equivalent in weight but on average with higher energy consumption in the lower-right quadrant are manufacturers that produce relatively heavier vehicles but with lower energy consumption in their weight class Despite producing heavier vehicles on average than many manufacturers honda achieves lower energy consumption on average in the upper-right quadrant are manufacturers that produce on average the heavier and least efficient vehicles with Psa (citroen and Peugeot) producing the heaviest and least efficient cars on average a regression line correlating vehicle energy consumption and mass highlights the best performers (hyundai honda and nissan) average performers (Fiat Volkswagen gM and toyota) and those performing worse than average (renault Ford and Psa)
FIA
GMVW
FORREN
HYU
HON
TOY
PSA
NIS
160
170
180
190
200
210
220
230
240
250
950 1000 1050 1100 1150 1200 1250 1300 1350
Ene
rgy
cons
ump
tio
n (M
Jkm
)
Curb weight (kg)
Fleet Ave
Figure 4‑4 ndashaverage new vehicle sales-weighted energy consumption by manufacturer (2013)
36
Brazil Passenger Vehicle Market statistics
Figure 4‑5 shows fleet-average energy consumption based on certification and type approval data for new vehicles in multiple countries converted to the us caFe combined driving cycle Bubble sizes represent total sales of new passenger cars Because of data availability in different countries the country comparison is based on different calendars years for different countries 2011 for south Korea and japan 2012 for china and india and 2013 for europe the us and Brazil given annual improvements in vehicle energy consumption triggered by regulatory efficiency standards and fiscal incentives those countries with older data could be at a slight disadvantage in this comparison
With the heaviest vehicles on average the us fleet is also the most energy consuming of all countries china and south Korea have similar average energy consumption but since south Korean vehicles are heavier on average they are relatively more efficient than chinese vehicles although Brazilrsquos fleet consumes less fuel on average than those from the us china and south Korea its fleet is relatively inefficient when compared to countries with vehicles of similar weight (japan and india) the average Brazilian vehicle consumes about 34 more energy than the average vehicle in japan whose fleet has a large penetration of gasoline hybrid and advanced fuel-efficiency technologies such as three-cylinder engines VVa Dohc and 6-plus speed transmissions european vehicles are the best performing on average despite being heavier than all countries with the exception of the us and south Korea the adoption of fuel-efficiency technologies (eg Dct 6-plus-speed transmissions gDi turbocharging) contributes to europersquos better than average performance
China2012
SKorea2011
Europe2013
US2013
Japan2011
India2012
Brazil2013
Sales5 MM10 MM
14
16
18
20
22
24
26
28
1000 1100 1200 1300 1400 1500 1600 1700
Ene
rgy
cons
ump
tio
n ndash
CA
FE
(M
Jkm
)
Curb weight (kg)
Type-approval and certification energy consumption data only (does not include o-cycle or real-world driving data)
Figure 4‑5 ndash international comparison of passenger car energy consumption
Country labels indicate the dataset year
Figure 4‑6 provides a more detailed country comparison by illustrating average vehicle energy consumption by vehicle (curb) weight bin Vehicle sales in each bin are shown for reference the us is not shown due to lack of detailed model-by-model data Brazilrsquos vehicles on average have the highest energy consumption in most weight
37
ICCT white paper
bins with china being the second highest in most bins Because china has higher fuel consumption than Brazil on the 1000 bin which represents the highest share of vehicle sales fleet-average energy consumption in china is still higher than in Brazil as illustrated in the previous figure europe consistently performs best in terms of vehicle energy consumption in most weight bins with japan also performing relatively well
Curb weight (kg)
BrazilChinaEuropeIndiaJapanSouth Korea
Ene
rgy
cons
ump
tio
n C
AF
E (
MJ
km)
Sale
s
40
35
25
20
15
10
6M
8M
4M
2M
0M600 800 1000 1200 1400 1600 1800 2000 2200 2400
Figure 4‑6 ndash international comparison of average vehicle energy consumption by vehicle weight
Type-approval and certification energy consumption data only (does not include off-cycle or real-world driving data)
38
Brazil Passenger Vehicle Market statistics
Figure 4‑7 illustrates the distribution of energy consumption data in Brazil for each vehicle version by mass and segment Bubble sizes represent total sales of each version Data were limited to flex-fuel vehicles in the subcompact compact medium and large segments due to its relatively better data quality and representativeness (ie they represented over 87 of sales in 2013) While most vehicles follow a predictable trend that correlates energy consumption and vehicle mass there are a large number of versions with energy consumption substantially higher than the trend line this suggests there is substantial room for improvements in their energy consumption since there are vehicles in similar weight classes with substantially superior energy consumption performance
Sales1000050000
140
160
180
200
220
240
260
280
700 800 900 1000 1100 1200 1300 1400 1500 1600
Ene
rgy
cons
ump
tio
n (M
Jkm
)
Curb weight (kg)
Subcompact Compact Medium Large Fleet average
Figure 4‑7 ndash Distribution of new Brazilian passenger vehicle energy consumption data by vehicle weight and segment (2013)
this chapter suggests that there are potential improvements in vehicle energy consumption for the Brazilian fleet For similar vehicles in terms of weight class footprint or engine rating there is substantial dispersion in energy consumption indicating that there are vehicles performing much worse than the average across manufacturers there is also a clear trend of some manufacturers performing much better than the average while others have a lot more room for improvement the international comparison clearly shows that Brazilian vehicles perform much worse in terms of energy consumption than vehicles of similar weight suggesting a delay in the adoption of energy efficient technologies among Brazilian vehicle manufacturers
Finally a more detailed analysis of vehicle versions clearly illustrates a considerable number of vehicle versions significantly above average thus indicating potential improvements in energy consumption that would place them on par with better performing vehicles with similar characteristics
39
ICCT white paper
Deficiencies in data quality and completeness prevent more definite conclusions about vehicle energy consumption gasoline-only vehicles in particular have poor energy consumption data quality although they represent a relatively small fraction (6) of total vehicles sold in 2013 Because some vehicle segments are primarily composed of gasoline-only vehicles (eg sports minivans) this chapter excludes these segments from the analysis there are also concerns about the gap between energy consumption data reported by iBaMarsquos nota Verde and Brazilrsquos national institute of Metrology standardization and industrial Qualityrsquos (inMetro) labeling program (PBeV using its acronym in Portuguese) with the latter reporting consistently lower values of vehicle energy consumption
Finally the availability of energy consumption data was not adequate for many manufacturers beyond the top 10 sales group which prevented their inclusion in this analysis Despite the data quality and lack of completeness the energy consumption data in this chapter include data that are reasonably accurate and representative thus supporting its interpretation
40
Brazil Passenger Vehicle Market statistics
rEfErENCES
aDK automotive consultoria de Marketing (2013) relatoacuterios de volumes de vendas do mercado brasileiro para veiacuteculos de passeio e comerciais leves referentes a 2013
alves l Wilbert M (2014) reduccedilatildeo do imposto sobre Produto industrializado e a Venda de automoacuteveis Xi congresso usP iniciaccedilatildeo cientiacutefica em contabilidade
associaccedilatildeo nacional de transportes Puacuteblicos (antP 2014) estudo mostra baixo efeito do desconto no iPi de veiacuteculos sobre PiB e emprego available at httpwwwantporgbrwebsitenoticiasshowaspnpgcode=a4DeeFe8-a7BF-48D3-B1F5-8eDe1447BF10
associaccedilatildeo nacional dos Fabricantes de Veiacuteculos automotores (anFaVea 2015) anuaacuterio da induacutestria automobiliacutestica Brasileira 2015 Brazilian automotive industry Yearbook 2015 satildeo Paulo available at wwwanfaveacombr
european environment agency (2014) Monitoring co2 emissions from new passenger cars in the eu summary of data for 2013 april 2014
instituto Brasileiro do Meio ambiente e dos recursos naturais renovaacuteveis (iBaMa 2014) consulta dos niacuteveis de emissatildeo dos veiacuteculos novos brasileiros available at httpsservicosibamagovbrctfpublicosel_marca_modelo_rvepphp
international council on clean transportation (icct 2015) global passenger vehicle standards available at httpwwwtheicctorginfo-toolsglobal-passenger-vehicle-standards
international energy agency (iea 2015) renewables Bioenergy available at httpswwwieaorgtopicsrenewablessubtopicsbioenergy
Korea energy Management corporation (KeMco 2014) Fuel economy regulation available at httpwwwkemcoorkrnew_engmainmainasp
Marklines (2015) Marklines automotive industry Portal available at httpwwwmarklinescomen
Mendonccedila M sachsida a (2014) Modelando a demanda de creacutedito para veiacuteculos no Brasil uma abordagem com mudanccedila de regime iPea
Ministeacuterio do Desenvolvimento induacutestria e comeacutercio exterior (MDic 2013) Programa de incentivo agrave inovaccedilatildeo tecnoloacutegica e adensamento da cadeia Produtiva de Veiacuteculos automotores mdash inovar-auto httpwwwplanaltogov brccivil_03_ato2011-20142012DecretoD7819htm
stein r anderson j and Wallington t (2013) an overview of the effects of ethanol-gasoline Blends on si engine Performance Fuel efficiency and emissions SAE Int J Engines 6(1)470-487 2013 doi1042712013-01-1635
us environmental Protection agency and national highway traffic safety administration (ePanhtsa 2010) Final rulemaking to establish light-Duty Vehicle greenhouse gas emission standards and corporate average Fuel economy standards ePa-420-r-10-901
us environmental Protection agency (ePa 2012) regulatory impact analysis Final rulemaking for 2017-2025 light-Duty Vehicle greenhouse gas emission standards and corporate average Fuel economy standards ePa-420-r-12-016
41
ICCT white paper
us national academy of sciences (nas 2011) assessment of Fuel economy technologies for light-Duty Vehicles available at httpwwwnapeducatalog12924assessment-of-fuel-economy-technologies-for-light-duty-vehicles
World Bank group (2015) World Development indicators available at httpdataworldbankorgdata-catalogworld-development-indicators
42
Brazil Passenger Vehicle Market statistics
LiST Of ACrONyMS
4wD Four-wheel drive
aNFaVEa Brazilian association of automobile Manufacturers
awD all-wheel drive
BRiC Brazil russia india china
CaFE corporate average fuel economy
CBG compressed biogas
CO2 carbon dioxide
CVT continuously variable transmission
CVVT continuously variable valve technology
DCT Dual-clutch transmission
DOhC Dual overhead camshaft
EC energy consumption
Epa us environmental Protection agency
EU european union
FFV Flex-fuel vehicle
FTp Federal test procedure
FwD Front-wheel drive
GDi gasoline direct injection
GDp gross domestic product
GhG greenhouse gas
GM general Motors
iBaMa Brazilian institute of the environment and renewable natural resources
iC internal combustion
iCCT international council on clean transportation
iNMETRO national institute of Metrology standardization and industrial Quality
Kg Kilogram
Km Kilometer
Kw Kilowatt
LDV light-duty vehicle
LpG liquified petroleum gas
MDiC Ministry of Development industry and Foreign trade
MJ Megajoule
MpFi Multi-point fuel injection
Mpg Miles per gallon
NaS us national academy of sciences
43
ICCT white paper
NhTSa us national highway transportation safety administration
OhV overhead valve
pBEV Brazilian Vehicle labeling Program
pSa Psa Peugeot citroeumln
pTwR Power-to-weight ratio
pV Passenger vehicle
RwD rear-wheel drive
SOhC single overhead camshaft
SUV sport utility vehicle
US united states
USD us dollar
VTEC Valve timing electronic control
VVa Variable valve actuation
VVL Variable valve lift
44
Brazil Passenger Vehicle Market statistics
AppENDix A SEGMENT DEfiNiTiONS
Table a‑1 ndash segment definitions
Segmentpower (kw)
pTwR (kwkg) area (m2)
Other characteristics Examples
Subcompact lt 140 lt 0075 le 65 mdash Mini cooper chevrolet celta smart Fortwo
Compact lt 140 lt 0075 65 lt area le 70 mdash honda Fit hyundai hB20 Volkswagen Polo
Medium lt 140 lt 0075 70 lt area le 80 mdash honda civic nissan tiida Peugeot 308
Large lt 140 lt 0075 gt 80 mdash audi a4 BMW 3 series Mercedes c-class
Sports gt 140 gt 0075 mdash 4 seats maxjaguar XF lamborghini gallardo Ferrari california
Off‑road mdash mdash lt 80 traction = 4WDjeep cherokee honda cr-V BMW X3 hyundai santa Fe
SUV mdash mdash lt 80Based on aDKrsquos default classification
BMW X1 Ford ecosport hyundai tucson
Minivan mdash mdash Passengers 6-12
citroen grand Picasso Kia carnival
45
ICCT white paper
AppENDix b iNTErNATiONAL MArKET DATA
Table B‑1 ndash international market comparison of new fleet characteristics
parameters China S Korea EU US Japan india Brazil
Year 2012 2011 2013 2013 2011 2012 2013
Sales (million) 155 13 118 156 352 256 304
price (USD) $21008 $21383 $24439 mdash $20637 $11717 $22015
No of cylinders mdash 43 40 47 38 36 40
Displacement (cc) 1605 1960 1613 2606 1425 1294 1430
Curb weight (kg) 1296 1421 1391 1623 1193 1059 1106
Length (mm) 4323 4531 4263 mdash 4013 3859 4100
Footprint (m2) 38 420 40 425 371 341 367
Engine power (kw) 86 120 89 148 78 55 76
pTwR (kwkg) 00664 00844 00640 00912 00654 00519 00671
Energy consumption ndash US CaFE (MJKm)[1] 235 206 169 250 171 183 202
[1] energy consumption data presented here for countries other than Brazil were obtained from local official sources in its original metric and drive cycle and then converted to Mjkm under the us caFe drive cycle using the methodology described in Yang (2015) Mode details and historical fuel consumption data on their original metrics is presented in the icctrsquos global PV standard website httpwwwtheicctorginfo-toolsglobal-passenger-vehicle-standards
Data Sources
China Ministry of industry and information technology (Miit 2014) corporate average Fuel efficiency accounting Method for Passenger cars available at httpwwwgovcngzdt2013-0320content_2358627htm
Baseline performance china automotive research and technology center through internal communication and icct internal 2010 database for chinese light-duty vehicles
S Korea internal communication with s Korean official and from greencarcongress available at httpwwwgreencarcongresscom200906korea-20090604html
EU european environment agency (2014) Monitoring co2 emissions from new passenger cars in the eu summary of data for 2013 april 2014
US us ePa (2014) light-duty automotive technology carbon dioxide emissions and fuel economy trends1975 through 2014 table 91 page 110 available at http httpwwwepagovfueleconomyfetrends1975-2014420r14023apdf
Japan jaMa (2010) the Motor industry of japan available at httpwwwjama-englishjppublicationsMVs2010pdf Mlit httpwwwmlitgojpcommon000990330pdf
india Bureau of energy efficiency white paper 2010-2012 calculation based on icct database
Brazil icct Brazil Vehicle Database (2013)
46
Brazil Passenger Vehicle Market statistics
Table B‑2 ndash international market comparison of technology adoption in new vehicles
Technology adoption China S Korea EU US Japan india Brazil
Year 2010 2011 2013 2013 2011 2012 2013
Fuel type
CBGLpGFlex 0 11 2 0 0 4 94
Gasoline 99 65 44 93 86 56 6
hybrid 0 1 1 5 13 0 0
Diesel 1 23 53 1 0 40 0
No of cylinders
Two 0 0 0 0 0 6 0
Three 4 0 7 0 36 28 3
Four 90 84 87 56 57 65 97
Five 0 0 1 0 0 0
Six 6 15 4 32 5 0 1
Eight or more 0 0 0 12 1 0 0
Transmission
Manual 60 3 83 5 1 98 83
automatic 34 90 9 75 34 2 15
CVT 5 7 2 18 65 0 1
DCT 1 0 6 2 mdash 0 1
Number of gear ratios
Four or fewer 13 16 1 7 mdash 10 6
Five 68 9 45 11 mdash 85 83
Six or more 19 75 54 82 mdash 5 11
Drivetrain
FwD 74 86 81 83 59 76 0
RwD 21 7 7 10 5 22 0
4wD and awD 5 7 12 7 36 2 100
No of valves per cylinder
Two 17 mdash mdash 2 4 25 60
Multi valve 83 mdash mdash 98 95 75 40
Valve camshaft configuration
Single overhead camshaft 26 1 mdash mdash 16 41 63
Dual overhead camshaft 74 84 mdash mdash 82 53 25
Overhead camshaft mdash 15 mdash mdash 0 6 mdash
Valve actuation
Fixed 50 16 mdash 2 11 86 78
VVT 44 84 mdash 98 89 12 16
VVL 6 mdash mdash mdash mdash 2 6
Fuel systems for gasoline vehicles
Multi‑point fuel injection 94 72 68 62 95 100 98
Gasoline direct injection 6 28 32 37 5 0 2
air induction systems for gasoline vehicles
Naturally aspirated 93 75 41 85 92 64 97
Supercharger turbocharger or twin‑turbo 7 25 59 15 8 36 3
47
ICCT white paper
AppENDix C NEW vEhiCLE ChArACTEriSTiCS AND TEChNOLOGy ADOpTiON DATA iN brAziL
Table C‑1 ndash Fleet characteristics of new Brazilian passenger vehicles by segment (2013)
parameters Subcompact Compact Medium Large Sports Off‑road SUV Minivan
Sales (thousands) 6785 6843 11790 1920 273 768 1997 23
Market share () 223 225 38 8 63 09 25 65 01
price (R$) $30103 $38732 $45496 $66508 $148834 $151284 $75164 $82284
No of cylinders 400 391 399 400 462 448 404 433
Displacement (cc) 1128 1293 1447 1794 2430 2586 1884 2244
Curb weight (kg) 940 1037 1102 1329 1561 1772 1395 1604
Length (mm) 3804 4026 4163 4499 4711 4516 4352 4658
Footprint (m2) 339 361 371 402 418 409 402 427
Engine power ndash gasoline (kw) 58 68 75 99 183 146 103 120
Engine power ndash ethanol (kw) 59 70 77 98 mdash 109 101 mdash
pTwR ndash gasoline (kwkg) 00614 00655 00671 00742 01173 00828 00731 00732
pTwR ndash ethanol (kwkg) 00630 00678 00697 00757 mdash 00766 00745 mdash
48
Brazil Passenger Vehicle Market statistics
Table C‑2 ndash Fleet characteristics of new Brazilian passenger vehicles by manufacturer (2013)
parameters Fiat
GM
Vo
lksw
agen
Ford
Ren
ault
hyu
ndai
ho
nda
Toyo
ta
pSa
Nis
san
Mit
sub
ishi
Kia
JaC
BM
w
Land
Rov
er
Mer
ced
es‑B
enz
Che
ry
aud
i
Suzu
ki
Jeep
Sales (thousands) 6087 5486 5448 3074 2207 2055 1392 1334 1163 621 368 255 158 141 106 94 80 67 63 36
Market share () 2002 1804 1792 1011 726 676 458 439 383 204 121 084 052 046 035 031 026 022 021 012
price (R$) $35017 $42259 $38701 $46174 $43447 $50112 $67078 $68922 $103001 $44035 $100696 $87009 $37654 $165111 $221943 $153281 $30821 $142799 $74769 $139039
No of cylinders 400 401 400 402 400 370 400 400 400 400 408 416 400 424 448 431 400 411 400 552
Displacement (cc) 1250 1340 1287 1497 1423 1495 1691 1808 1575 1579 2262 1856 1411 2095 2281 1934 1398 1912 1831 3182
Curb weight (kg) 1033 1060 1020 1156 1102 1122 1210 1201 1231 1069 1556 1377 1079 1624 1868 1598 1097 1551 1444 1945
Length (mm) 3965 4155 3993 4120 4127 4078 4319 4299 4116 4171 4401 4357 3956 4574 4487 4527 3896 4454 4234 4584
Footprint (m2) 345 370 354 368 378 383 397 387 376 379 395 407 351 429 433 429 349 417 323 420
Engine power ndash gasoline (kw) 64 71 65 79 73 86 96 90 80 82 120 112 83 151 179 138 71 136 94 162
Engine power ndash ethanol (kw) 65 72 65 79 76 85 97 90 81 82 107 106 95 mdash mdash mdash 75 mdash mdash mdash
pTwR ndash gasoline (kwkg)
00613 00662 00631 00674 00657 00739 00788 00745 00646 00766 00779 00792 00784 00921 00977 00856 00638 00870 00649 00835
pTwR ndash ethanol (kwkg) 00629 00681 00642 00693 00685 00781 00800 00795 00660 00768 00710 00798 00896 mdash mdash mdash 00659 mdash mdash mdash
49
ICCT white paper
Table C‑3 ndash Fleet characteristics of new Brazilian passenger vehicles by origin (2013)
parameters Domestic imported
Sales (thousands) 2537 504
Market share () 834 166
price (R$) $41739 $76049
No of cylinders 397 412
Displacement (cc) 1359 1791
Curb weight (kg) 1070 1289
Length (mm) 4063 4285
Footprint (m2) 362 390
Engine power ndash gasoline (kw) 70 102
Engine power ndash ethanol (kw) 73 84
pTwR ndash gasoline (kwkg) 0065 0076
pTwR ndash ethanol (kwkg) 0068 0074
50
Brazil Passenger Vehicle Market statistics
Table C‑4 ndash technology adoption in new Brazilian passenger vehicles by segment (2013)
Technology adoption Subcompact Compact Medium Large SportOff‑road SUV Minivan
Fuel type
Flex 982 988 982 837 00 134 826 00
Gasoline 18 12 17 163 996 540 174 1000
hybrid 0000 0000 0028 0000 0396 0001 0000 0000
Diesel 00 00 00 00 00 326 00 00
No of cylinders
Three 01 91 10 00 00 00 00 00
Four 999 909 990 998 758 775 979 833
Five 00 00 00 02 03 00 00 00
Six 00 00 00 00 175 211 21 167
Eight or more 00 00 00 00 63 13 00 00
Transmission
Manual 993 944 826 622 62 174 505 641
automatic 07 55 161 283 629 707 451 359
CVT 00 00 12 89 09 93 34 00
DCT 00 01 02 06 299 25 10 00
No of gear ratios
Four or fewer 04 47 72 51 00 34 247 193
Five 984 943 848 378 15 392 516 641
Six 12 09 73 515 796 462 225 167
Seven 00 01 06 23 87 53 12 00
Eight or more 00 00 01 32 102 59 00 00
Drivetrain
FwD 998 1000 997 688 550 00 916 1000
RwD 02 00 03 311 221 00 84 00
awD 00 00 00 01 229 1000 00 00
No of valves per cylinder
Two 806 694 584 195 00 00 258 00
Multi valve 194 306 416 805 1000 1000 742 1000
Valve camshaft configuration
Single overhead camshaft 839 786 709 309 00 212 375 00
Dual overhead camshaft 24 158 161 546 880 517 446 255
Valve actuation
Fixed 982 729 807 461 49 493 664 868
VVT 18 211 115 470 827 367 252 132
VVT+VVL 00 61 78 68 124 140 84 00
Fuel systems for gasoline vehicles
Multi‑point fuel injection 999 998 997 949 979 143 766 1000
Gasoline direct injection 01 02 03 51 21 857 234 00
air induction systems for gasoline vehicles
Naturally aspirated 999 997 995 943 974 369 543 1000
Supercharger turbocharger or twin‑turbo 01 03 05 57 26 631 457 00
51
ICCT white paper
Table C‑5 ndash technology adoption in new Brazilian passenger vehicles by manufacturer (2013)
Technology adoption Fi
aT
GM
VO
LKSw
aG
EN
FOR
D
REN
aU
LT
hY
UN
Da
i
hO
ND
a
TOYO
Ta
pSa
NiS
SaN
MiT
SUB
iSh
i
Kia
JaC
BM
w
LaN
D R
OV
ER
MER
CED
ES
Fuel type
Flex 990 987 965 966 997 921 999 886 928 998 283 739 31 42 00 00
Gasoline 10 09 35 34 03 79 01 35 72 02 557 255 969 957 663 950
hybrid 00 00 00 00 00 00 00 02 00 00 00 00 00 00 00 00
Diesel 00 04 00 00 00 00 00 77 00 00 160 06 00 00 337 50
No of cylinders
Three 00 00 05 00 00 348 00 00 00 00 00 00 00 00 00 00
Four 1000 996 994 989 1000 626 999 998 1000 1000 958 922 1000 906 787 878
Five 00 00 00 00 00 00 00 00 00 00 00 00 00 00 00 00
Six 00 02 01 11 00 26 01 02 00 00 42 78 00 68 185 87
Eight or more 00 02 00 00 00 00 00 00 00 00 00 00 00 26 28 35
Transmission
Manual 992 878 985 846 853 632 566 565 703 785 493 120 1000 02 00 151
automatic 08 103 00 137 62 285 355 160 297 121 118 793 00 575 18 14
CVT 00 19 15 16 41 70 01 246 00 00 139 87 00 423 982 836
DCT 00 00 00 00 43 13 78 30 00 94 251 00 00 00 00 00
No of gear ratios
Four or fewer 02 04 00 55 104 237 00 323 249 132 17 133 00 00 00 00
Five 981 811 963 839 797 623 861 643 684 828 530 107 1000 00 00 64
Six 17 185 29 106 99 140 139 07 67 40 453 754 00 217 800 00
Seven 00 00 07 00 00 00 00 27 00 00 00 00 00 08 00 936
Eight or more 00 00 00 00 00 00 00 00 00 00 00 06 00 775 200 00
Drivetrain
FwD 1000 902 989 972 987 985 990 892 1000 1000 496 623 1000 00 00 00
RwD 00 91 00 00 00 00 00 16 00 00 00 370 00 882 00 900
awD 00 06 11 28 13 15 10 92 00 00 504 07 00 118 1000 100
No of valves per cylinder
Two 811 864 988 745 220 00 00 00 00 00 00 00 00 00 00 00
Multi Valve 189 136 12 255 780 1000 1000 1000 1000 1000 1000 1000 1000 1000 1000 1000
Valve camshaft configuration
SOhC 836 755 914 675 832 00 04 00 497 398 331 00 00 00 00 00
DOhC 07 108 56 50 168 992 786 875 352 428 477 1000 907 810 860 453
Valve actuation
Fixed 1000 898 965 966 940 29 00 574 736 573 435 76 124 187 18 55
VVT 00 102 35 34 60 971 00 426 264 427 00 924 876 00 982 945
VVT+VVL 00 00 00 00 00 00 1000 00 00 00 565 00 00 813 00 00
air induction System
Naturally aspirated 997 994 966 977 997 988 1000 923 922 1000 835 936 1000 97 37 101
Supercharger turbocharger or twin‑turbo
03 06 34 23 03 12 00 77 78 00 165 64 00 903 963 899
Fuel systems for gasoline vehicles
Multipoint fuel injection 1000 995 965 972 1000 989 1000 1000 967 1000 994 1000 1000 78 15 158
Gasoline Direct injection 00 05 35 28 00 11 00 00 33 00 06 00 00 922 985 842
note Difference between 100 and summation of sohc and Dohc market share values corresponds to data not available
52
Brazil Passenger Vehicle Market statistics
AppENDix D DATA SOurCES AND COMpLETENESS
the basis of the statistics shown in this report is a database compiled by the icct with vehicle sales technical information (eg fleet characteristics technology content) and energy consumption (converted from either co2 emissions or fuel economy) from various data sources outlined in table D-1
Table D‑1 ndash Brazilian data sources
parameters Sales TechnicalEnergy
consumption
aDK (2014 2015) x x
MarkLines (2015) x
iBaMa (2014) x
iNMETRO (2014) x
UOL (2014) x
icarroscom (2014) x
this analysis examined energy consumption data from two public sources the nota Verde Program by the Brazilian institute of the environment and renewable natural resources (iBaMa) and the Brazilian Vehicle labeling Program (PBeV) by the national institute of Metrology standardization and industrial Quality (inMetro) table D-2 summarizes key differences between these two data sources
Table D‑2 ndash energy consumption data sources
iBaMa iNMETRO
program nota Verde1 Brazilian Vehicle labeling Program (PBeV)2
program description
Mandatory program that reports emissions of co2 co nox and nMhc as part of emissions certification program
Voluntary program since 2009 that allows the comparison of fuel economy across vehicle models
Unit gco2 km kml
Test cycle chassis testing under urban (FtP) driving cycle based on nBr 66012005
chassis testing under urban (FtP) and highway (hWYFe) driving cycles based on nBr 702420103
adjustment
no adjustment for real-world driving conditions Because reported co2 emissions are assumed to be zero for ethanol adjustments were made to account for tailpipe co2 emissions for vehicles running on ethanol
since 2010 published values include real-world adjustment factors to chassis test data a method adopted by the us ePa in 2008
Conversion to MJkm
iBaMarsquos data are reported as FtP (city test) co2 data in gco2 km conversion to caFe test cycle and to a different metric (Mjkm) involves four steps as presented in Figure D-1
inMetrorsquos data in kml are presented separately by fuel type (e22 e100) and driving cycle (urban highway) conversion to Mjkm was done by applying a conversion factor (2167 gco2 l for e22 and 1428gco2l for e00) caFe values are obtained by using a 5545 weighting for the urban (FtP) and highway cycles respectively
1 iBaMa (2014) nota Verde program available at httpwwwmmagovbrcidades-sustentaveisqualidade-do-arcontrole-de-emissoes-veicularesnota-verde
2 inMetro (2014) Programa Brasileiro de etiquetagem Veicular (PBeV) available at httpwwwinmetrogovbrconsumidortabelas_pbe_veicularasp
3 inMetro (2014) Metodologia Para Divulgaccedilatildeo De Dados De consumo Veicular available at httpwwwinmetrogovbrconsumidorpbeMetodologia_consumo_Veicularpdf
53
ICCT white paper
Step 1 Correcting the original IBAMA CO2 reported data ndash FTP CO2 gkm
IBAMArsquos CO2 reported values are corrected to account for tailpipe emissions from ethanol (tailpipe CO2 emissions are reported as zero in IBAMArsquos data)
bull E22 FTP reported CO2 data are reduced by 177bull E100 FTP reported CO2 data are reduced by 100
Flex fuel vehicles are tested with E22 and E00 the final values is calculated as the average of both fuelsCO2 IBAMA_Flex_FTP= 05(1-0177)CO2_E22_test_FTP + 050E100_FTP = 050823CO2_E22_FTPFor Gasoline only vehicles the tests are carried out only with Gasoline E22CO2 IBAMA_Gasoline_FTP = (1-0177) CO2_E22_Test_FTP
Where in the previous equations CO2_E22_FTP means CO2 emissions values obtained under FTP testingCO2 IBAMA_Flex_FTP means IBAMArsquos Corrected FTP values for flex vehiclesCO2 IBAMA_Gasoline_FTP means IBAMArsquos Corrected FTP values for gasoline only (E22) vehicles
INNOVAR AUTO is based on energy consumption data obtained as the combined CAFE test cycle This requires a weighted average of energy consumption data obtained from FTP testing (city driving ) and Highway fuel economy testing (HWFET) In mathematical form CAFE=f(FTPHWFET)
Given that IBAMA data is provided for only the first aprt the FTP testing then it is required to find a way to calculate CAFE combined values through FTP -75 only data A linear function was thus developed from data with FTP and HWY values (INMETRO data) is used to convert FTP only values to CAFE CO2 values ie CAFE=f(FTP) The function used for this conversion is
CO2_CAFE= (CO2_FTP+44756)11572
Step 2Convert FTP CO2 values to CAFE CO2 values
Converting CO2 values to MJkm values is done by using the energy density of E22 Note that all the previous calculations for CO2 come from E22-based data
bull The energy density of E22 is 2894 MJLE22bull E22 emits 2167gCO2LE22bull CAFE (MJkm) = CAFE (gCO2km) (2894 MJLE22 2167 gCO2LE22)
Step 3 Convert US CAFE CO2 values to MJkm values
Figure D‑1 ndash conversion of emission to energy consumption data
energy consumption values calculated from iBaMa and inMetro data differ greatly Figure D-1 illustrates energy consumption data for those models in both databases iBaMa data are on average 126 higher than inMetro data with a standard deviation of 89 and a maximum deviation of 39
54
Brazil Passenger Vehicle Market statistics
0
05
1
15
2
25
3
0 05 1 15 2 25 3
Ene
rgy
cons
ump
tio
n IB
AM
A (
MJ
km)
Energy consumption INMETRO (MJkm)
n=151
Figure D‑2 ndash comparison between energy consumption data from inMetro and iBaMa
151 vehicles tested under both programs
although inMetro data are more transparent as it breaks down fuel economy by fuel and test cycle it is still a voluntary program that allows manufacturers to select which models will participate in addition not all manufacturers participate in the program in turn iBaMa data only include co2 data for the urban cycle and thus energy consumption in the combined cycle had to be estimated from correlations using international data in addition corrections had to be made for gasoline-only engines since it seems that a co2 discount in theory only applicable to flex-fuel engines was also applied to gasoline-only engines Despite these data quality issues iBaMa data were considered the most adequate data source for energy consumption because it is a mandatory program that requires data reporting by all vehicle models and manufacturers
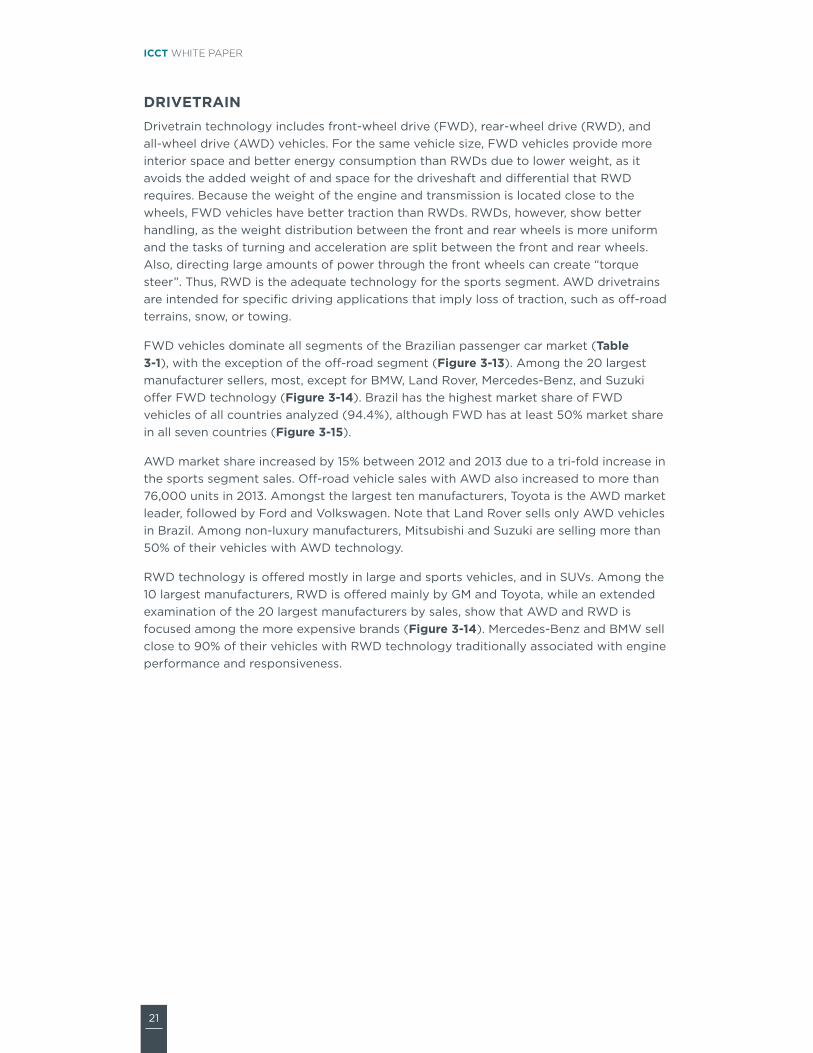
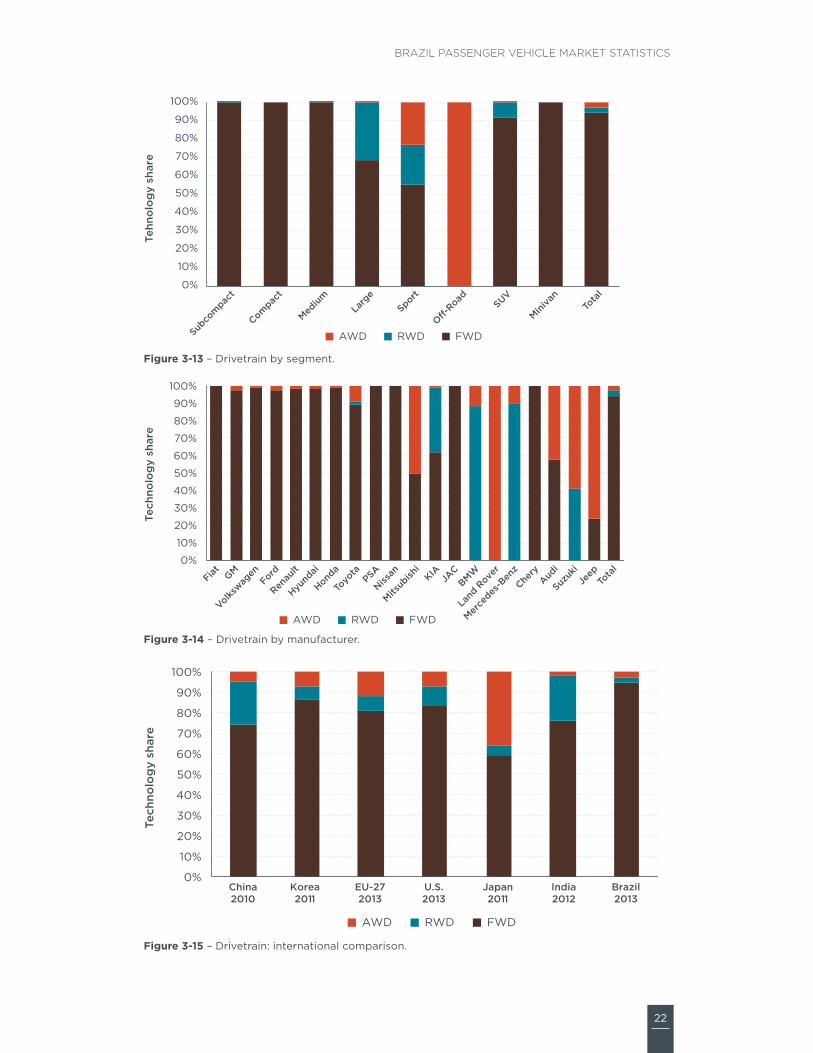
22
Brazil Passenger Vehicle Market statistics
0
10
20
30
40
50
60
70
80
90
100
Subco
mpac
t
Compac
t
Medium
Larg
eSport
O-Road SUV
Miniva
nTo
tal
Tehn
olo
gy
shar
e
AWD RWD FWD
Figure 3‑13 ndash Drivetrain by segment
0
10
20
30
40
50
60
70
80
90
100
Fiat GM
Volkswag
enFord
Renau
lt
Hyund
ai
Honda
Toyo
taPSA
Nissan
Mitsub
ishi
KIAJA
CBMW
Land
Rove
r
Merce
des-B
enz
Chery
Audi
Suzuk
iJe
epTo
tal
Tech
nolo
gy
shar
e
AWD RWD FWD
Figure 3‑14 ndash Drivetrain by manufacturer
0
10
20
30
40
50
60
70
80
90
100
China2010
Korea2011
EU-272013
US2013
Japan2011
India2012
Brazil2013
Tech
nolo
gy
shar
e
AWD RWD FWD
Figure 3‑15 ndash Drivetrain international comparison
23
ICCT white paper
VaLVE CaMShaFT CONFiGURaTiON (DOhC VS SOhC)the engine camshaft governs the timing duration and lift of valve operation controlling the intake of air and the exhaust of combustion gases this report focuses on single overhead camshafts (sohc) and dual overhead camshafts (Dohc) as these configurations have almost completely replaced the older overhead valve configuration (ohV) sohc design places a single camshaft above the cylinder head that governs all the valves intake and exhaust in the case of sohc V-engines there is one single camshaft per head Dohc designs use separate camshafts for intake valves and exhaust valves Dohc engines achieve increased airflow at high-engine speeds improve volumetric efficiency and reduce the valvetrainrsquos moving mass such engines typically develop higher power at high-engine speeds the us environmental Protection agency (ePa) and national highway traffic safety administration (nhtsa) estimate the effectiveness of Dohc over sohc to be between 1 and 25 (ePanhtsa 2010)
although Dohc produce more power and provide lower fuel consumption the Brazilian fleet is still mostly composed of sohcs vehicles (Table 3‑1) sohc technology is predominant among the subcompact compact and medium segments (Figure 3‑16) among manufacturers sohc technology is predominant among the five largest least expensive brands (Figure 3‑17) sales of vehicles with more advanced Dohc technology grew in 2013 by almost 36 with respect to 2012 albeit from a relatively smaller base this increase was experienced in all vehicle segments but in different magnitudes
although global data on this technology are scarce Figure 3‑18 indicates that most countries are moving away from sohc with Brazil being the only country analyzed where sohc is still predominant no data were available for the us or europe
24
Brazil Passenger Vehicle Market statistics
0
10
20
30
40
50
60
70
80
90
100
Subco
mpac
t
Compac
t
Medium
Larg
eSport
O-Road SUV
Miniva
nTo
tal
Tech
nolo
gy
shar
e
nd DOHC SOHC
Figure 3‑16 ndash Valve camshaft configuration by segment (nd no data)
0
10
20
30
40
50
60
70
80
90
100
Fiat GM
Volkswag
enFord
Renau
lt
Hyund
ai
Honda
Toyo
taPSA
Nissan
Mitsub
ishi
KIAJA
CBMW
Land
Rove
r
Merce
des-B
enz
Chery
Audi
Suzuk
iJe
epTo
tal
Tech
nolo
gy
shar
e
nd DOHC SOHC
Figure 3‑17 ndash Valve camshaft configuration by manufacturer (nd no data)
0
10
20
30
40
50
60
70
80
90
100
China2010
Korea2011
Japan2011
India2012
Brazil2013
Tech
nolo
gy
shar
e
nd OVC DOHC SOHC
Figure 3‑18 ndash Valve camshaft configuration international comparison (nd no data)
25
ICCT white paper
VaLVE aCTUaTiON improved valvetrain systems with variable valve actuation (VVa) technology either variable valve timing (VVt) or variable valve timing and lift (VVt+VVl) improves the enginersquos volumetric and thermodynamic efficiency they also enable further engine improvements such as internal exhaust gas recirculation and cylinder deactivation VVt alters the timing of the intake valve exhaust valve or both primarily to reduce pumping losses increase specific power and control residual exhaust gases VVl increases efficiency by optimizing airflow over a broader range of engine operation which reduces pumping losses and increases specific power VVl is accomplished by controlled switching between two or more cam profile lobe heights the most advanced technology VVt+VVl yields a wide range of performance optimization and volumetric efficiency including enabling the engine to be valve-throttled (no need for intake throttle) VVt provides energy consumption gains of 3 to 5 while the more flexible and complex VVt+VVl system can reach 4 to 8 (ePa amp nhtsa 2010)
VVa technology either VVt or VVt+VVl are emerging technologies in Brazil where most vehicles still have fixed-valve timing designs (Table 3‑1) Fixed technology is predominant among the smaller vehicle segments as well as suVs and minivans (Figure 3‑19) the five largest manufacturers sold more than 90 of their vehicles with fixed-valve technology in 2013 (Figure 3‑20) the international comparison indicates that only Brazil and india have not yet adopted VVa technologies for most of their light-duty fleet (Figure 3‑21)
VVt and VVt+VVl are being adopted across all segments including the subcompact segment but tend to be more predominant in high-end manufacturers a closer examination by manufacturer shows that most are offering some vehicles with either one of the VVa systems while honda and hyundai offer this technology in almost all vehicles (Figure 3‑20) honda is the technology leader in variable valve actuation with the adoption in the early 1990s of the Vtec system (Valve timing electronic control) VVt technologyrsquos market share grew by about 25 in 2013 primarily due to hyundairsquos sales from 80000 units in 2012 to almost 200000 units in 2013 hyundai offered the continuously variable valve technology (cVVt) in the large majority of vehicle sold in 2013 the sports segment is the one where VVt dominates the market Mitsubishi BMW and audi are also selling a large share of their vehicles with the VVt+VVl technology
26
Brazil Passenger Vehicle Market statistics
0
10
20
30
40
50
60
70
80
90
100
Subco
mpac
t
Compac
t
Medium
Larg
eSport
O-Road SUV
Miniva
nTo
tal
Tech
nolo
gy
shar
e
VVT+VVL VVT Fixed
Figure 3‑19 ndash Valve actuation by segment
0
10
20
30
40
50
60
70
80
90
100
Fiat GM
Volkswag
enFord
Renau
lt
Hyund
ai
Honda
Toyo
taPSA
Nissan
Mitsub
ishi
KIAJA
CBMW
Land
Rove
r
Merce
des-B
enz
Chery
Audi
Suzuk
iJe
epTo
tal
Tech
nolo
gy
shar
e
VVT+VVL VVT Fixed
Figure 3‑20 ndash Valve actuation by manufacturer
VVT+VVL VVT Fixed
0
10
20
30
40
50
60
70
80
90
100
China2010
Korea2011
US2013
Japan2011
India2012
Brazil2013
Tech
nolo
gy
shar
e
Figure 3‑21 ndash Valve actuation international comparison
27
ICCT white paper
FUEL SYSTEMS FOR GaSOLiNE VEhiCLESVehicle fuel systems describe the technology required to deliver fuel into the engine combustion chamber this section examines two gasolineflex technologies namely multi-point fuel injection (MPFi) and gasoline direct injection (gDi) MPFi is now the most common fuel-delivery system for gasoline engines used in passenger vehicles worldwide in sequential MPFi engines fuel is injected into the air stream next to the intake valve port while the intake valve is open to draw the air-fuel mixture into the cylinder some of the fuel is vaporized on the surface of the hot intake valve expanding and thus reduces the volumetric efficiency on gDi engines fuel is injected at high pressure directly into the combustion chamber improving volumetric efficiency and providing cooling of the airfuel charge within the cylinder which allows for higher compression ratios and increased thermodynamic efficiency gDi technology alone offers benefits of 2 to 5 with respect to MPFi engines but bigger benefits rely on the synergy between gDi turbocharging and downsizing which can reach 12 to 15 energy consumption reduction with respect to a MPFi naturally aspirated engine (ePa 2012)
Table 3‑1 illustrates that MPFi is still the most common fuel injection technology for gasolineflex vehicles in Brazil which is reflected in its dominant share across most segments except for sports and off-road vehicles in Brazil gDi has found a niche market in the sports and off-road segments with more than 90 of sport vehicles fitted with gDi technology (Figure 3‑22) Within the overall gasoline market the gDi technology is still an emerging technology representing just 24 of new sales gDirsquos market share increased by 31 in 2013 with all but 4000 units being imported among the 10 largest manufacturers the adoption of gDi is extremely low below 5 for Volkswagen Ford hyundai and Psa (Figure 3‑23) high-end european brands (audi land rover Mercedes-Benz and BMW) are the technology leaders in terms of gDi adoption rates echoing the trend of turbocharging technology sales Volkswagen vehicles with gDi systems account for less than 35 of their sales in 2013 but their absolute numbers (around 19000 vehicles) place the company as one of the leaders in gDi technology in the Brazilian market
From a global market perspective the penetration of gDi technology in Brazil is low compared to all other markets in Figure 3‑24 except for india and japan it should be noted that the later has the largest share of hybrid vehicles around the globe
28
Brazil Passenger Vehicle Market statistics
0
10
20
30
40
50
60
70
80
90
100
Compac
t
Subco
mpac
t
Medium
Larg
eSport
O-Road SUV
Miniva
nTo
tal
Tech
nolo
gy
shar
e
GDI MPFI
Figure 3‑22 ndash gasolineflex fuel system by segment
GDI MPFI
0102030405060708090
100
Fiat GM
Volkswag
enFord
Renau
lt
Hyund
ai
Honda
Toyo
taPSA
Nissan
Mitsub
ishi
KIAJA
CBMW
Land
Rove
r
Merce
des-B
enz
Chery
Audi
Suzuk
iJe
epTo
tal
Tech
nolo
gy
shar
e
Figure 3‑23 ndash gasolineflex fuel system by manufacturer
GDI MPFI
0
10
20
30
40
50
60
70
80
90
100
China2010
Korea2011
EU-272013
US2013
Japan2011
India2012
Brazil2013
Tech
nolo
gy
shar
e (n
on-
die
sel)
Figure 3‑24 ndash gasolineflex fuel system international comparison
29
ICCT white paper
TURBOChaRGiNGengine power is primarily limited by the rate at which the engine is able to draw air into the combustion chamber turbocharging and supercharging are two methods to increase the amount of air drawn into the engine above the level of what is possible with the naturally aspirated process (through the expansion of the cylinders) By increasing the amount of air into the engine the amount of fuel can be proportionally increased resulting in increased power output level and with it the ability to reduce engine displacement while maintaining performance the combination of turbocharging and downsizing in spark ignited (gasoline and flex-fuel) vehicles can provide energy consumption improvements between 2 to 6 with respect to a direct-injected gDi engine (ePa amp nhtsa 2010) turbocharging technology is the cornerstone for achieving better energy consumption in vehicles as the basis for downsizing and reducing the engine weight while keeping the same or better vehicle performance (ie acceleration or time to reach certain speed) although turbochargers are used in diesel and gasolineflex vehicles the analysis in this report focuses on turbocharging for spark-ignited gasolineflex vehicles only
turbocharging is one of the most important emerging technologies in Brazil where most vehicles are still naturally aspirated (na) (Table 3‑1) turbocharging technology has increased the market share significantly between 2012 and 2013 by more than 65 albeit from a small base (from about 49000 to 81000 vehicles)
Most vehicles with turbocharging are sold in the sports and off-road segments as this technology also produces superior engine power output (Figure 3‑25) among the 10 largest manufacturers turbocharging is still below 10 of their sales (Figure 3‑26) Volkswagen and Ford despite having small relative sales of vehicles with turbocharging (less than 35) are the manufacturers with the highest total sales of vehicles with turbocharging audi land rover Mercedes-Benz and BMW are the technology leaders with more than 90 of vehicle sales in 2013
the penetration of turbo and supercharging technologies in Brazil is lower than in other countries with a larger gasoline fleet such as the us china and japan (Figure 3‑27) in Brazil 95 of diesel passenger vehicle sales have turbocharging technology
30
Brazil Passenger Vehicle Market statistics
0
10
20
30
40
50
60
70
80
90
100
Compac
t
Subco
mpac
t
Medium
Larg
eSport
O-Road SUV
Miniva
nTo
tal
Tech
nolo
gy
shar
e (n
on-
Die
sel)
Turbo NA
Figure 3‑25 ndash turbocharging for gasolineflex fuel vehicles by segment (NA naturally aspirated)
0102030405060708090
100
Fiat GM
Volkswag
enFord
Renau
lt
Hyund
ai
Honda
Toyo
taPSA
Nissan
Mitsub
ishiKIA
JACBMW
Land
Rove
r
Merce
des-B
enz
Chery
Audi
Suzuk
iJe
epTo
tal
Tech
nolo
gy
shar
e (n
on-
Die
sel)
Turbo NA
Figure 3‑26 ndash turbocharging for gasolineflex fuel vehicles by manufacturer (NA naturally aspirated)
0
10
20
30
40
50
60
70
80
90
100
China2010
Korea2011
EU-272013
US2013
Japan2011
India2012
Brazil2013
Tech
nolo
gy
shar
e (n
on-
die
sel)
Turbo NA
Figure 3‑27 ndash turbocharging for gasolineflex fuel vehicles international comparison (NA naturally aspirated)
31
ICCT white paper
4 vEhiCLE ENErGy CONSuMpTiON
this section analyzes the Brazilian new passenger vehicle energy consumption in 2013 although other metrics are more common (see box) vehicle energy consumption is presented in megajoules per kilometer (Mjkm) for consistency with Brazilrsquos inovar-auto policy in 2012 Brazilrsquos Ministry of Development industry and Foreign trade (MDic) adopted the inovar-auto policy with the aim of fostering industrial competitiveness through technology investments the policy includes a target for corporate average energy consumption (in Mjkm with vehicle curb weight as the attribute parameter) for vehicles sold in 2017
in the us canada Mexico and saudi arabia fleet-average fuel economy standards are defined as a function of vehicle footprint in the eu china japan south Korea and india vehicle weight is the attribute for the calculation of fleet-average targets in Brazil inovar-auto has defined its fiscal targets for vehicle energy consumption measured in megajoules per kilometer (Mjkm) as a function of vehicle weight
VEhiCLE ENERGY MEaSUREMENT UNiTS
Many metrics can be used to describe the amount of fuel energy or emissions generated by unit of distance traveled
Fuel economy measures distance traveled per unit of fuel consumed in Brazil kilometers per liter (kml) is the most common metric to describe vehicle efficiency but other units are used in different countries such as miles per gallon (mpg) in the us
Fuel consumption is the reciprocal of fuel economy and measures fuel consumed per distance traveled it is usually expressed in liters per 100 kilometers (l100 km) and it is used in europe for example
GhGCO2 emissions measures ghg or co2 emissions per distance traveled expressed as grams of pollutant per kilometer or mile
Energy consumption (EC) measures the energy consumed per distance traveled for example in megajoules per kilometer Despite being a less common metric it is sometimes preferred for being a fuel-neutral metric across different types of fuel and vehicle technologies Vehicle energy consumption in Mjkm is the metric used in Brazilrsquos inovar-auto policy to quantify the corporate average energy consumption target for each manufacturer Values for energy consumption in Brazilian spark-ignited vehicles are provided for e22 since that is the fuel mixture used in vehicle tests
Vehicle energy consumption in this report is calculated from co2 emissions data in the Brazilian institute of environment and renewable natural resources (iBaMa) nota Verde program (iBaMa 2014) which reports official emissions data from homologation tests Data are limited to passenger cars sold by the top 10 manufacturers with light commercial vehicles being excluded appendix D presents a description of data sources
32
Brazil Passenger Vehicle Market statistics
and calculation methodologies as well as a discussion of vehicle energy consumption data quality and completeness in Brazil
not surprisingly vehicle energy consumption increases with vehicle footprint and engine rated power the two parameters that define vehicle segments in Brazil (Figure 4‑1) subcompact and compact vehicles which accounted for about 45 of new sales in 2013 have average energy consumption below the fleet average while medium-sized vehicles which hold the largest market share (388) have energy consumption just above the fleet average larger more powerful vehicles consume more energy than the fleet average but have a considerably smaller market share (combined share of 163) Data availability for these segments is not as extensive as the data available for the subcompact compact and medium segments which could affect the relative rankings of each segment
Ene
rgy
cons
ump
tio
n (M
Jkm
)
Subco
mpac
t
Compac
t
Medium
Larg
e
O-road SUV
4000
200000
400000
600000
850000
35
30
25
20
15
10
05
0
Sales
Total 202
Figure 4‑1 ndash new vehicle sales-weighted average energy consumption by segment (2013)
33
ICCT white paper
Figures 4‑2 and 4‑3 illustrate new vehicle energy consumption for multiple weight and footprint bins For each weight bin (in 100 kg increments) and footprint bin (in 01 m2 increments) sales-weighted averages of energy consumption for each vehicle version are presented (dashes) generating energy consumption ranges for each bin (cream areas) Vehicle sales by bin are presented for reference in the lower charts
the strong correlation between vehicle energy consumption and weight follows from the strong physical relationship between the weight of the vehicle and the energy required to accelerate it and overcome resistances9 (Figure 4‑2) Data dispersion within each bin suggests that energy consumption varies due to other vehicle characteristics that affect vehicle aerodynamics and rolling resistance as well as the adoption of technologies that affect engine and transmission efficiency (eg friction reduction technologies gDi VVt)
Curb weight (kg)
SubcompactCompactMediumLargeO-roadSUV
Ene
rgy
cons
ump
tio
n (M
Jkm
)Sa
les
5
6
4
3
2
1
600k
800k
400k
200k
0k800 900 1000 1100 1200 1300 1400 1500 1600 1700 1800 1900 2000 2100
Figure 4‑2 ndash new vehicle energy consumption by vehicle weight (2013)
9 on a plain surface the sum of resistances of a vehicle is acceleration resistance + rolling resistance + aerodynamic resistance = c1 m a + c2 frr m + c3 cw a v2 with mass (m) as an integral part of both acceleration and rolling resistance which are most relevant for inner-city driving situations other factors are acceleration (a) rolling resistance of tires (frr) aerodynamic coefficient of the vehicle (cw) frontal area of vehicle (a) velocity (v) and constants (cx)
34
Brazil Passenger Vehicle Market statistics
Footprint has a reasonable correlation with energy consumption (Figure 4‑3) ie larger vehicles tend to consume more fuel than smaller vehicles however the correlation is not as strong as with vehicle weight similar to the previous figure the broad spread of energy consumption values suggests a combination of different vehicle characteristics (eg weight engine displacement rated power) and technologies (eg transmissions fuel systems) as well as the presence of suVs and off-road vehicles among the medium- and large-sized footprint values respectively
Footprint (m2)
SubcompactCompactMediumLargeO-roadSUV
Ene
rgy
cons
ump
tio
n (M
Jkm
)Sa
les
5
6
4
3
2
1
400k
500k
300k
200k
100k
0k31 32 33 34 35 36 37 38 39 40 41 42 43 44 45 46 48 49
Figure 4‑3 ndash new vehicle energy consumption by vehicle footprint (2013)
35
ICCT white paper
Figure 4‑4 illustrates sales weighted average for new vehicle energy consumption by mass for the top 10 manufacturers in Brazil in 2013 Bubble sizes are proportional to total vehicle sales Manufacturers in the lower-left quadrant produce the lightest and most efficient vehicles with hyundai presenting the best overall average energy consumption renault in the upper-left quadrant produces vehicles that are equivalent in weight but on average with higher energy consumption in the lower-right quadrant are manufacturers that produce relatively heavier vehicles but with lower energy consumption in their weight class Despite producing heavier vehicles on average than many manufacturers honda achieves lower energy consumption on average in the upper-right quadrant are manufacturers that produce on average the heavier and least efficient vehicles with Psa (citroen and Peugeot) producing the heaviest and least efficient cars on average a regression line correlating vehicle energy consumption and mass highlights the best performers (hyundai honda and nissan) average performers (Fiat Volkswagen gM and toyota) and those performing worse than average (renault Ford and Psa)
FIA
GMVW
FORREN
HYU
HON
TOY
PSA
NIS
160
170
180
190
200
210
220
230
240
250
950 1000 1050 1100 1150 1200 1250 1300 1350
Ene
rgy
cons
ump
tio
n (M
Jkm
)
Curb weight (kg)
Fleet Ave
Figure 4‑4 ndashaverage new vehicle sales-weighted energy consumption by manufacturer (2013)
36
Brazil Passenger Vehicle Market statistics
Figure 4‑5 shows fleet-average energy consumption based on certification and type approval data for new vehicles in multiple countries converted to the us caFe combined driving cycle Bubble sizes represent total sales of new passenger cars Because of data availability in different countries the country comparison is based on different calendars years for different countries 2011 for south Korea and japan 2012 for china and india and 2013 for europe the us and Brazil given annual improvements in vehicle energy consumption triggered by regulatory efficiency standards and fiscal incentives those countries with older data could be at a slight disadvantage in this comparison
With the heaviest vehicles on average the us fleet is also the most energy consuming of all countries china and south Korea have similar average energy consumption but since south Korean vehicles are heavier on average they are relatively more efficient than chinese vehicles although Brazilrsquos fleet consumes less fuel on average than those from the us china and south Korea its fleet is relatively inefficient when compared to countries with vehicles of similar weight (japan and india) the average Brazilian vehicle consumes about 34 more energy than the average vehicle in japan whose fleet has a large penetration of gasoline hybrid and advanced fuel-efficiency technologies such as three-cylinder engines VVa Dohc and 6-plus speed transmissions european vehicles are the best performing on average despite being heavier than all countries with the exception of the us and south Korea the adoption of fuel-efficiency technologies (eg Dct 6-plus-speed transmissions gDi turbocharging) contributes to europersquos better than average performance
China2012
SKorea2011
Europe2013
US2013
Japan2011
India2012
Brazil2013
Sales5 MM10 MM
14
16
18
20
22
24
26
28
1000 1100 1200 1300 1400 1500 1600 1700
Ene
rgy
cons
ump
tio
n ndash
CA
FE
(M
Jkm
)
Curb weight (kg)
Type-approval and certification energy consumption data only (does not include o-cycle or real-world driving data)
Figure 4‑5 ndash international comparison of passenger car energy consumption
Country labels indicate the dataset year
Figure 4‑6 provides a more detailed country comparison by illustrating average vehicle energy consumption by vehicle (curb) weight bin Vehicle sales in each bin are shown for reference the us is not shown due to lack of detailed model-by-model data Brazilrsquos vehicles on average have the highest energy consumption in most weight
37
ICCT white paper
bins with china being the second highest in most bins Because china has higher fuel consumption than Brazil on the 1000 bin which represents the highest share of vehicle sales fleet-average energy consumption in china is still higher than in Brazil as illustrated in the previous figure europe consistently performs best in terms of vehicle energy consumption in most weight bins with japan also performing relatively well
Curb weight (kg)
BrazilChinaEuropeIndiaJapanSouth Korea
Ene
rgy
cons
ump
tio
n C
AF
E (
MJ
km)
Sale
s
40
35
25
20
15
10
6M
8M
4M
2M
0M600 800 1000 1200 1400 1600 1800 2000 2200 2400
Figure 4‑6 ndash international comparison of average vehicle energy consumption by vehicle weight
Type-approval and certification energy consumption data only (does not include off-cycle or real-world driving data)
38
Brazil Passenger Vehicle Market statistics
Figure 4‑7 illustrates the distribution of energy consumption data in Brazil for each vehicle version by mass and segment Bubble sizes represent total sales of each version Data were limited to flex-fuel vehicles in the subcompact compact medium and large segments due to its relatively better data quality and representativeness (ie they represented over 87 of sales in 2013) While most vehicles follow a predictable trend that correlates energy consumption and vehicle mass there are a large number of versions with energy consumption substantially higher than the trend line this suggests there is substantial room for improvements in their energy consumption since there are vehicles in similar weight classes with substantially superior energy consumption performance
Sales1000050000
140
160
180
200
220
240
260
280
700 800 900 1000 1100 1200 1300 1400 1500 1600
Ene
rgy
cons
ump
tio
n (M
Jkm
)
Curb weight (kg)
Subcompact Compact Medium Large Fleet average
Figure 4‑7 ndash Distribution of new Brazilian passenger vehicle energy consumption data by vehicle weight and segment (2013)
this chapter suggests that there are potential improvements in vehicle energy consumption for the Brazilian fleet For similar vehicles in terms of weight class footprint or engine rating there is substantial dispersion in energy consumption indicating that there are vehicles performing much worse than the average across manufacturers there is also a clear trend of some manufacturers performing much better than the average while others have a lot more room for improvement the international comparison clearly shows that Brazilian vehicles perform much worse in terms of energy consumption than vehicles of similar weight suggesting a delay in the adoption of energy efficient technologies among Brazilian vehicle manufacturers
Finally a more detailed analysis of vehicle versions clearly illustrates a considerable number of vehicle versions significantly above average thus indicating potential improvements in energy consumption that would place them on par with better performing vehicles with similar characteristics
39
ICCT white paper
Deficiencies in data quality and completeness prevent more definite conclusions about vehicle energy consumption gasoline-only vehicles in particular have poor energy consumption data quality although they represent a relatively small fraction (6) of total vehicles sold in 2013 Because some vehicle segments are primarily composed of gasoline-only vehicles (eg sports minivans) this chapter excludes these segments from the analysis there are also concerns about the gap between energy consumption data reported by iBaMarsquos nota Verde and Brazilrsquos national institute of Metrology standardization and industrial Qualityrsquos (inMetro) labeling program (PBeV using its acronym in Portuguese) with the latter reporting consistently lower values of vehicle energy consumption
Finally the availability of energy consumption data was not adequate for many manufacturers beyond the top 10 sales group which prevented their inclusion in this analysis Despite the data quality and lack of completeness the energy consumption data in this chapter include data that are reasonably accurate and representative thus supporting its interpretation
40
Brazil Passenger Vehicle Market statistics
rEfErENCES
aDK automotive consultoria de Marketing (2013) relatoacuterios de volumes de vendas do mercado brasileiro para veiacuteculos de passeio e comerciais leves referentes a 2013
alves l Wilbert M (2014) reduccedilatildeo do imposto sobre Produto industrializado e a Venda de automoacuteveis Xi congresso usP iniciaccedilatildeo cientiacutefica em contabilidade
associaccedilatildeo nacional de transportes Puacuteblicos (antP 2014) estudo mostra baixo efeito do desconto no iPi de veiacuteculos sobre PiB e emprego available at httpwwwantporgbrwebsitenoticiasshowaspnpgcode=a4DeeFe8-a7BF-48D3-B1F5-8eDe1447BF10
associaccedilatildeo nacional dos Fabricantes de Veiacuteculos automotores (anFaVea 2015) anuaacuterio da induacutestria automobiliacutestica Brasileira 2015 Brazilian automotive industry Yearbook 2015 satildeo Paulo available at wwwanfaveacombr
european environment agency (2014) Monitoring co2 emissions from new passenger cars in the eu summary of data for 2013 april 2014
instituto Brasileiro do Meio ambiente e dos recursos naturais renovaacuteveis (iBaMa 2014) consulta dos niacuteveis de emissatildeo dos veiacuteculos novos brasileiros available at httpsservicosibamagovbrctfpublicosel_marca_modelo_rvepphp
international council on clean transportation (icct 2015) global passenger vehicle standards available at httpwwwtheicctorginfo-toolsglobal-passenger-vehicle-standards
international energy agency (iea 2015) renewables Bioenergy available at httpswwwieaorgtopicsrenewablessubtopicsbioenergy
Korea energy Management corporation (KeMco 2014) Fuel economy regulation available at httpwwwkemcoorkrnew_engmainmainasp
Marklines (2015) Marklines automotive industry Portal available at httpwwwmarklinescomen
Mendonccedila M sachsida a (2014) Modelando a demanda de creacutedito para veiacuteculos no Brasil uma abordagem com mudanccedila de regime iPea
Ministeacuterio do Desenvolvimento induacutestria e comeacutercio exterior (MDic 2013) Programa de incentivo agrave inovaccedilatildeo tecnoloacutegica e adensamento da cadeia Produtiva de Veiacuteculos automotores mdash inovar-auto httpwwwplanaltogov brccivil_03_ato2011-20142012DecretoD7819htm
stein r anderson j and Wallington t (2013) an overview of the effects of ethanol-gasoline Blends on si engine Performance Fuel efficiency and emissions SAE Int J Engines 6(1)470-487 2013 doi1042712013-01-1635
us environmental Protection agency and national highway traffic safety administration (ePanhtsa 2010) Final rulemaking to establish light-Duty Vehicle greenhouse gas emission standards and corporate average Fuel economy standards ePa-420-r-10-901
us environmental Protection agency (ePa 2012) regulatory impact analysis Final rulemaking for 2017-2025 light-Duty Vehicle greenhouse gas emission standards and corporate average Fuel economy standards ePa-420-r-12-016
41
ICCT white paper
us national academy of sciences (nas 2011) assessment of Fuel economy technologies for light-Duty Vehicles available at httpwwwnapeducatalog12924assessment-of-fuel-economy-technologies-for-light-duty-vehicles
World Bank group (2015) World Development indicators available at httpdataworldbankorgdata-catalogworld-development-indicators
42
Brazil Passenger Vehicle Market statistics
LiST Of ACrONyMS
4wD Four-wheel drive
aNFaVEa Brazilian association of automobile Manufacturers
awD all-wheel drive
BRiC Brazil russia india china
CaFE corporate average fuel economy
CBG compressed biogas
CO2 carbon dioxide
CVT continuously variable transmission
CVVT continuously variable valve technology
DCT Dual-clutch transmission
DOhC Dual overhead camshaft
EC energy consumption
Epa us environmental Protection agency
EU european union
FFV Flex-fuel vehicle
FTp Federal test procedure
FwD Front-wheel drive
GDi gasoline direct injection
GDp gross domestic product
GhG greenhouse gas
GM general Motors
iBaMa Brazilian institute of the environment and renewable natural resources
iC internal combustion
iCCT international council on clean transportation
iNMETRO national institute of Metrology standardization and industrial Quality
Kg Kilogram
Km Kilometer
Kw Kilowatt
LDV light-duty vehicle
LpG liquified petroleum gas
MDiC Ministry of Development industry and Foreign trade
MJ Megajoule
MpFi Multi-point fuel injection
Mpg Miles per gallon
NaS us national academy of sciences
43
ICCT white paper
NhTSa us national highway transportation safety administration
OhV overhead valve
pBEV Brazilian Vehicle labeling Program
pSa Psa Peugeot citroeumln
pTwR Power-to-weight ratio
pV Passenger vehicle
RwD rear-wheel drive
SOhC single overhead camshaft
SUV sport utility vehicle
US united states
USD us dollar
VTEC Valve timing electronic control
VVa Variable valve actuation
VVL Variable valve lift
44
Brazil Passenger Vehicle Market statistics
AppENDix A SEGMENT DEfiNiTiONS
Table a‑1 ndash segment definitions
Segmentpower (kw)
pTwR (kwkg) area (m2)
Other characteristics Examples
Subcompact lt 140 lt 0075 le 65 mdash Mini cooper chevrolet celta smart Fortwo
Compact lt 140 lt 0075 65 lt area le 70 mdash honda Fit hyundai hB20 Volkswagen Polo
Medium lt 140 lt 0075 70 lt area le 80 mdash honda civic nissan tiida Peugeot 308
Large lt 140 lt 0075 gt 80 mdash audi a4 BMW 3 series Mercedes c-class
Sports gt 140 gt 0075 mdash 4 seats maxjaguar XF lamborghini gallardo Ferrari california
Off‑road mdash mdash lt 80 traction = 4WDjeep cherokee honda cr-V BMW X3 hyundai santa Fe
SUV mdash mdash lt 80Based on aDKrsquos default classification
BMW X1 Ford ecosport hyundai tucson
Minivan mdash mdash Passengers 6-12
citroen grand Picasso Kia carnival
45
ICCT white paper
AppENDix b iNTErNATiONAL MArKET DATA
Table B‑1 ndash international market comparison of new fleet characteristics
parameters China S Korea EU US Japan india Brazil
Year 2012 2011 2013 2013 2011 2012 2013
Sales (million) 155 13 118 156 352 256 304
price (USD) $21008 $21383 $24439 mdash $20637 $11717 $22015
No of cylinders mdash 43 40 47 38 36 40
Displacement (cc) 1605 1960 1613 2606 1425 1294 1430
Curb weight (kg) 1296 1421 1391 1623 1193 1059 1106
Length (mm) 4323 4531 4263 mdash 4013 3859 4100
Footprint (m2) 38 420 40 425 371 341 367
Engine power (kw) 86 120 89 148 78 55 76
pTwR (kwkg) 00664 00844 00640 00912 00654 00519 00671
Energy consumption ndash US CaFE (MJKm)[1] 235 206 169 250 171 183 202
[1] energy consumption data presented here for countries other than Brazil were obtained from local official sources in its original metric and drive cycle and then converted to Mjkm under the us caFe drive cycle using the methodology described in Yang (2015) Mode details and historical fuel consumption data on their original metrics is presented in the icctrsquos global PV standard website httpwwwtheicctorginfo-toolsglobal-passenger-vehicle-standards
Data Sources
China Ministry of industry and information technology (Miit 2014) corporate average Fuel efficiency accounting Method for Passenger cars available at httpwwwgovcngzdt2013-0320content_2358627htm
Baseline performance china automotive research and technology center through internal communication and icct internal 2010 database for chinese light-duty vehicles
S Korea internal communication with s Korean official and from greencarcongress available at httpwwwgreencarcongresscom200906korea-20090604html
EU european environment agency (2014) Monitoring co2 emissions from new passenger cars in the eu summary of data for 2013 april 2014
US us ePa (2014) light-duty automotive technology carbon dioxide emissions and fuel economy trends1975 through 2014 table 91 page 110 available at http httpwwwepagovfueleconomyfetrends1975-2014420r14023apdf
Japan jaMa (2010) the Motor industry of japan available at httpwwwjama-englishjppublicationsMVs2010pdf Mlit httpwwwmlitgojpcommon000990330pdf
india Bureau of energy efficiency white paper 2010-2012 calculation based on icct database
Brazil icct Brazil Vehicle Database (2013)
46
Brazil Passenger Vehicle Market statistics
Table B‑2 ndash international market comparison of technology adoption in new vehicles
Technology adoption China S Korea EU US Japan india Brazil
Year 2010 2011 2013 2013 2011 2012 2013
Fuel type
CBGLpGFlex 0 11 2 0 0 4 94
Gasoline 99 65 44 93 86 56 6
hybrid 0 1 1 5 13 0 0
Diesel 1 23 53 1 0 40 0
No of cylinders
Two 0 0 0 0 0 6 0
Three 4 0 7 0 36 28 3
Four 90 84 87 56 57 65 97
Five 0 0 1 0 0 0
Six 6 15 4 32 5 0 1
Eight or more 0 0 0 12 1 0 0
Transmission
Manual 60 3 83 5 1 98 83
automatic 34 90 9 75 34 2 15
CVT 5 7 2 18 65 0 1
DCT 1 0 6 2 mdash 0 1
Number of gear ratios
Four or fewer 13 16 1 7 mdash 10 6
Five 68 9 45 11 mdash 85 83
Six or more 19 75 54 82 mdash 5 11
Drivetrain
FwD 74 86 81 83 59 76 0
RwD 21 7 7 10 5 22 0
4wD and awD 5 7 12 7 36 2 100
No of valves per cylinder
Two 17 mdash mdash 2 4 25 60
Multi valve 83 mdash mdash 98 95 75 40
Valve camshaft configuration
Single overhead camshaft 26 1 mdash mdash 16 41 63
Dual overhead camshaft 74 84 mdash mdash 82 53 25
Overhead camshaft mdash 15 mdash mdash 0 6 mdash
Valve actuation
Fixed 50 16 mdash 2 11 86 78
VVT 44 84 mdash 98 89 12 16
VVL 6 mdash mdash mdash mdash 2 6
Fuel systems for gasoline vehicles
Multi‑point fuel injection 94 72 68 62 95 100 98
Gasoline direct injection 6 28 32 37 5 0 2
air induction systems for gasoline vehicles
Naturally aspirated 93 75 41 85 92 64 97
Supercharger turbocharger or twin‑turbo 7 25 59 15 8 36 3
47
ICCT white paper
AppENDix C NEW vEhiCLE ChArACTEriSTiCS AND TEChNOLOGy ADOpTiON DATA iN brAziL
Table C‑1 ndash Fleet characteristics of new Brazilian passenger vehicles by segment (2013)
parameters Subcompact Compact Medium Large Sports Off‑road SUV Minivan
Sales (thousands) 6785 6843 11790 1920 273 768 1997 23
Market share () 223 225 38 8 63 09 25 65 01
price (R$) $30103 $38732 $45496 $66508 $148834 $151284 $75164 $82284
No of cylinders 400 391 399 400 462 448 404 433
Displacement (cc) 1128 1293 1447 1794 2430 2586 1884 2244
Curb weight (kg) 940 1037 1102 1329 1561 1772 1395 1604
Length (mm) 3804 4026 4163 4499 4711 4516 4352 4658
Footprint (m2) 339 361 371 402 418 409 402 427
Engine power ndash gasoline (kw) 58 68 75 99 183 146 103 120
Engine power ndash ethanol (kw) 59 70 77 98 mdash 109 101 mdash
pTwR ndash gasoline (kwkg) 00614 00655 00671 00742 01173 00828 00731 00732
pTwR ndash ethanol (kwkg) 00630 00678 00697 00757 mdash 00766 00745 mdash
48
Brazil Passenger Vehicle Market statistics
Table C‑2 ndash Fleet characteristics of new Brazilian passenger vehicles by manufacturer (2013)
parameters Fiat
GM
Vo
lksw
agen
Ford
Ren
ault
hyu
ndai
ho
nda
Toyo
ta
pSa
Nis
san
Mit
sub
ishi
Kia
JaC
BM
w
Land
Rov
er
Mer
ced
es‑B
enz
Che
ry
aud
i
Suzu
ki
Jeep
Sales (thousands) 6087 5486 5448 3074 2207 2055 1392 1334 1163 621 368 255 158 141 106 94 80 67 63 36
Market share () 2002 1804 1792 1011 726 676 458 439 383 204 121 084 052 046 035 031 026 022 021 012
price (R$) $35017 $42259 $38701 $46174 $43447 $50112 $67078 $68922 $103001 $44035 $100696 $87009 $37654 $165111 $221943 $153281 $30821 $142799 $74769 $139039
No of cylinders 400 401 400 402 400 370 400 400 400 400 408 416 400 424 448 431 400 411 400 552
Displacement (cc) 1250 1340 1287 1497 1423 1495 1691 1808 1575 1579 2262 1856 1411 2095 2281 1934 1398 1912 1831 3182
Curb weight (kg) 1033 1060 1020 1156 1102 1122 1210 1201 1231 1069 1556 1377 1079 1624 1868 1598 1097 1551 1444 1945
Length (mm) 3965 4155 3993 4120 4127 4078 4319 4299 4116 4171 4401 4357 3956 4574 4487 4527 3896 4454 4234 4584
Footprint (m2) 345 370 354 368 378 383 397 387 376 379 395 407 351 429 433 429 349 417 323 420
Engine power ndash gasoline (kw) 64 71 65 79 73 86 96 90 80 82 120 112 83 151 179 138 71 136 94 162
Engine power ndash ethanol (kw) 65 72 65 79 76 85 97 90 81 82 107 106 95 mdash mdash mdash 75 mdash mdash mdash
pTwR ndash gasoline (kwkg)
00613 00662 00631 00674 00657 00739 00788 00745 00646 00766 00779 00792 00784 00921 00977 00856 00638 00870 00649 00835
pTwR ndash ethanol (kwkg) 00629 00681 00642 00693 00685 00781 00800 00795 00660 00768 00710 00798 00896 mdash mdash mdash 00659 mdash mdash mdash
49
ICCT white paper
Table C‑3 ndash Fleet characteristics of new Brazilian passenger vehicles by origin (2013)
parameters Domestic imported
Sales (thousands) 2537 504
Market share () 834 166
price (R$) $41739 $76049
No of cylinders 397 412
Displacement (cc) 1359 1791
Curb weight (kg) 1070 1289
Length (mm) 4063 4285
Footprint (m2) 362 390
Engine power ndash gasoline (kw) 70 102
Engine power ndash ethanol (kw) 73 84
pTwR ndash gasoline (kwkg) 0065 0076
pTwR ndash ethanol (kwkg) 0068 0074
50
Brazil Passenger Vehicle Market statistics
Table C‑4 ndash technology adoption in new Brazilian passenger vehicles by segment (2013)
Technology adoption Subcompact Compact Medium Large SportOff‑road SUV Minivan
Fuel type
Flex 982 988 982 837 00 134 826 00
Gasoline 18 12 17 163 996 540 174 1000
hybrid 0000 0000 0028 0000 0396 0001 0000 0000
Diesel 00 00 00 00 00 326 00 00
No of cylinders
Three 01 91 10 00 00 00 00 00
Four 999 909 990 998 758 775 979 833
Five 00 00 00 02 03 00 00 00
Six 00 00 00 00 175 211 21 167
Eight or more 00 00 00 00 63 13 00 00
Transmission
Manual 993 944 826 622 62 174 505 641
automatic 07 55 161 283 629 707 451 359
CVT 00 00 12 89 09 93 34 00
DCT 00 01 02 06 299 25 10 00
No of gear ratios
Four or fewer 04 47 72 51 00 34 247 193
Five 984 943 848 378 15 392 516 641
Six 12 09 73 515 796 462 225 167
Seven 00 01 06 23 87 53 12 00
Eight or more 00 00 01 32 102 59 00 00
Drivetrain
FwD 998 1000 997 688 550 00 916 1000
RwD 02 00 03 311 221 00 84 00
awD 00 00 00 01 229 1000 00 00
No of valves per cylinder
Two 806 694 584 195 00 00 258 00
Multi valve 194 306 416 805 1000 1000 742 1000
Valve camshaft configuration
Single overhead camshaft 839 786 709 309 00 212 375 00
Dual overhead camshaft 24 158 161 546 880 517 446 255
Valve actuation
Fixed 982 729 807 461 49 493 664 868
VVT 18 211 115 470 827 367 252 132
VVT+VVL 00 61 78 68 124 140 84 00
Fuel systems for gasoline vehicles
Multi‑point fuel injection 999 998 997 949 979 143 766 1000
Gasoline direct injection 01 02 03 51 21 857 234 00
air induction systems for gasoline vehicles
Naturally aspirated 999 997 995 943 974 369 543 1000
Supercharger turbocharger or twin‑turbo 01 03 05 57 26 631 457 00
51
ICCT white paper
Table C‑5 ndash technology adoption in new Brazilian passenger vehicles by manufacturer (2013)
Technology adoption Fi
aT
GM
VO
LKSw
aG
EN
FOR
D
REN
aU
LT
hY
UN
Da
i
hO
ND
a
TOYO
Ta
pSa
NiS
SaN
MiT
SUB
iSh
i
Kia
JaC
BM
w
LaN
D R
OV
ER
MER
CED
ES
Fuel type
Flex 990 987 965 966 997 921 999 886 928 998 283 739 31 42 00 00
Gasoline 10 09 35 34 03 79 01 35 72 02 557 255 969 957 663 950
hybrid 00 00 00 00 00 00 00 02 00 00 00 00 00 00 00 00
Diesel 00 04 00 00 00 00 00 77 00 00 160 06 00 00 337 50
No of cylinders
Three 00 00 05 00 00 348 00 00 00 00 00 00 00 00 00 00
Four 1000 996 994 989 1000 626 999 998 1000 1000 958 922 1000 906 787 878
Five 00 00 00 00 00 00 00 00 00 00 00 00 00 00 00 00
Six 00 02 01 11 00 26 01 02 00 00 42 78 00 68 185 87
Eight or more 00 02 00 00 00 00 00 00 00 00 00 00 00 26 28 35
Transmission
Manual 992 878 985 846 853 632 566 565 703 785 493 120 1000 02 00 151
automatic 08 103 00 137 62 285 355 160 297 121 118 793 00 575 18 14
CVT 00 19 15 16 41 70 01 246 00 00 139 87 00 423 982 836
DCT 00 00 00 00 43 13 78 30 00 94 251 00 00 00 00 00
No of gear ratios
Four or fewer 02 04 00 55 104 237 00 323 249 132 17 133 00 00 00 00
Five 981 811 963 839 797 623 861 643 684 828 530 107 1000 00 00 64
Six 17 185 29 106 99 140 139 07 67 40 453 754 00 217 800 00
Seven 00 00 07 00 00 00 00 27 00 00 00 00 00 08 00 936
Eight or more 00 00 00 00 00 00 00 00 00 00 00 06 00 775 200 00
Drivetrain
FwD 1000 902 989 972 987 985 990 892 1000 1000 496 623 1000 00 00 00
RwD 00 91 00 00 00 00 00 16 00 00 00 370 00 882 00 900
awD 00 06 11 28 13 15 10 92 00 00 504 07 00 118 1000 100
No of valves per cylinder
Two 811 864 988 745 220 00 00 00 00 00 00 00 00 00 00 00
Multi Valve 189 136 12 255 780 1000 1000 1000 1000 1000 1000 1000 1000 1000 1000 1000
Valve camshaft configuration
SOhC 836 755 914 675 832 00 04 00 497 398 331 00 00 00 00 00
DOhC 07 108 56 50 168 992 786 875 352 428 477 1000 907 810 860 453
Valve actuation
Fixed 1000 898 965 966 940 29 00 574 736 573 435 76 124 187 18 55
VVT 00 102 35 34 60 971 00 426 264 427 00 924 876 00 982 945
VVT+VVL 00 00 00 00 00 00 1000 00 00 00 565 00 00 813 00 00
air induction System
Naturally aspirated 997 994 966 977 997 988 1000 923 922 1000 835 936 1000 97 37 101
Supercharger turbocharger or twin‑turbo
03 06 34 23 03 12 00 77 78 00 165 64 00 903 963 899
Fuel systems for gasoline vehicles
Multipoint fuel injection 1000 995 965 972 1000 989 1000 1000 967 1000 994 1000 1000 78 15 158
Gasoline Direct injection 00 05 35 28 00 11 00 00 33 00 06 00 00 922 985 842
note Difference between 100 and summation of sohc and Dohc market share values corresponds to data not available
52
Brazil Passenger Vehicle Market statistics
AppENDix D DATA SOurCES AND COMpLETENESS
the basis of the statistics shown in this report is a database compiled by the icct with vehicle sales technical information (eg fleet characteristics technology content) and energy consumption (converted from either co2 emissions or fuel economy) from various data sources outlined in table D-1
Table D‑1 ndash Brazilian data sources
parameters Sales TechnicalEnergy
consumption
aDK (2014 2015) x x
MarkLines (2015) x
iBaMa (2014) x
iNMETRO (2014) x
UOL (2014) x
icarroscom (2014) x
this analysis examined energy consumption data from two public sources the nota Verde Program by the Brazilian institute of the environment and renewable natural resources (iBaMa) and the Brazilian Vehicle labeling Program (PBeV) by the national institute of Metrology standardization and industrial Quality (inMetro) table D-2 summarizes key differences between these two data sources
Table D‑2 ndash energy consumption data sources
iBaMa iNMETRO
program nota Verde1 Brazilian Vehicle labeling Program (PBeV)2
program description
Mandatory program that reports emissions of co2 co nox and nMhc as part of emissions certification program
Voluntary program since 2009 that allows the comparison of fuel economy across vehicle models
Unit gco2 km kml
Test cycle chassis testing under urban (FtP) driving cycle based on nBr 66012005
chassis testing under urban (FtP) and highway (hWYFe) driving cycles based on nBr 702420103
adjustment
no adjustment for real-world driving conditions Because reported co2 emissions are assumed to be zero for ethanol adjustments were made to account for tailpipe co2 emissions for vehicles running on ethanol
since 2010 published values include real-world adjustment factors to chassis test data a method adopted by the us ePa in 2008
Conversion to MJkm
iBaMarsquos data are reported as FtP (city test) co2 data in gco2 km conversion to caFe test cycle and to a different metric (Mjkm) involves four steps as presented in Figure D-1
inMetrorsquos data in kml are presented separately by fuel type (e22 e100) and driving cycle (urban highway) conversion to Mjkm was done by applying a conversion factor (2167 gco2 l for e22 and 1428gco2l for e00) caFe values are obtained by using a 5545 weighting for the urban (FtP) and highway cycles respectively
1 iBaMa (2014) nota Verde program available at httpwwwmmagovbrcidades-sustentaveisqualidade-do-arcontrole-de-emissoes-veicularesnota-verde
2 inMetro (2014) Programa Brasileiro de etiquetagem Veicular (PBeV) available at httpwwwinmetrogovbrconsumidortabelas_pbe_veicularasp
3 inMetro (2014) Metodologia Para Divulgaccedilatildeo De Dados De consumo Veicular available at httpwwwinmetrogovbrconsumidorpbeMetodologia_consumo_Veicularpdf
53
ICCT white paper
Step 1 Correcting the original IBAMA CO2 reported data ndash FTP CO2 gkm
IBAMArsquos CO2 reported values are corrected to account for tailpipe emissions from ethanol (tailpipe CO2 emissions are reported as zero in IBAMArsquos data)
bull E22 FTP reported CO2 data are reduced by 177bull E100 FTP reported CO2 data are reduced by 100
Flex fuel vehicles are tested with E22 and E00 the final values is calculated as the average of both fuelsCO2 IBAMA_Flex_FTP= 05(1-0177)CO2_E22_test_FTP + 050E100_FTP = 050823CO2_E22_FTPFor Gasoline only vehicles the tests are carried out only with Gasoline E22CO2 IBAMA_Gasoline_FTP = (1-0177) CO2_E22_Test_FTP
Where in the previous equations CO2_E22_FTP means CO2 emissions values obtained under FTP testingCO2 IBAMA_Flex_FTP means IBAMArsquos Corrected FTP values for flex vehiclesCO2 IBAMA_Gasoline_FTP means IBAMArsquos Corrected FTP values for gasoline only (E22) vehicles
INNOVAR AUTO is based on energy consumption data obtained as the combined CAFE test cycle This requires a weighted average of energy consumption data obtained from FTP testing (city driving ) and Highway fuel economy testing (HWFET) In mathematical form CAFE=f(FTPHWFET)
Given that IBAMA data is provided for only the first aprt the FTP testing then it is required to find a way to calculate CAFE combined values through FTP -75 only data A linear function was thus developed from data with FTP and HWY values (INMETRO data) is used to convert FTP only values to CAFE CO2 values ie CAFE=f(FTP) The function used for this conversion is
CO2_CAFE= (CO2_FTP+44756)11572
Step 2Convert FTP CO2 values to CAFE CO2 values
Converting CO2 values to MJkm values is done by using the energy density of E22 Note that all the previous calculations for CO2 come from E22-based data
bull The energy density of E22 is 2894 MJLE22bull E22 emits 2167gCO2LE22bull CAFE (MJkm) = CAFE (gCO2km) (2894 MJLE22 2167 gCO2LE22)
Step 3 Convert US CAFE CO2 values to MJkm values
Figure D‑1 ndash conversion of emission to energy consumption data
energy consumption values calculated from iBaMa and inMetro data differ greatly Figure D-1 illustrates energy consumption data for those models in both databases iBaMa data are on average 126 higher than inMetro data with a standard deviation of 89 and a maximum deviation of 39
54
Brazil Passenger Vehicle Market statistics
0
05
1
15
2
25
3
0 05 1 15 2 25 3
Ene
rgy
cons
ump
tio
n IB
AM
A (
MJ
km)
Energy consumption INMETRO (MJkm)
n=151
Figure D‑2 ndash comparison between energy consumption data from inMetro and iBaMa
151 vehicles tested under both programs
although inMetro data are more transparent as it breaks down fuel economy by fuel and test cycle it is still a voluntary program that allows manufacturers to select which models will participate in addition not all manufacturers participate in the program in turn iBaMa data only include co2 data for the urban cycle and thus energy consumption in the combined cycle had to be estimated from correlations using international data in addition corrections had to be made for gasoline-only engines since it seems that a co2 discount in theory only applicable to flex-fuel engines was also applied to gasoline-only engines Despite these data quality issues iBaMa data were considered the most adequate data source for energy consumption because it is a mandatory program that requires data reporting by all vehicle models and manufacturers
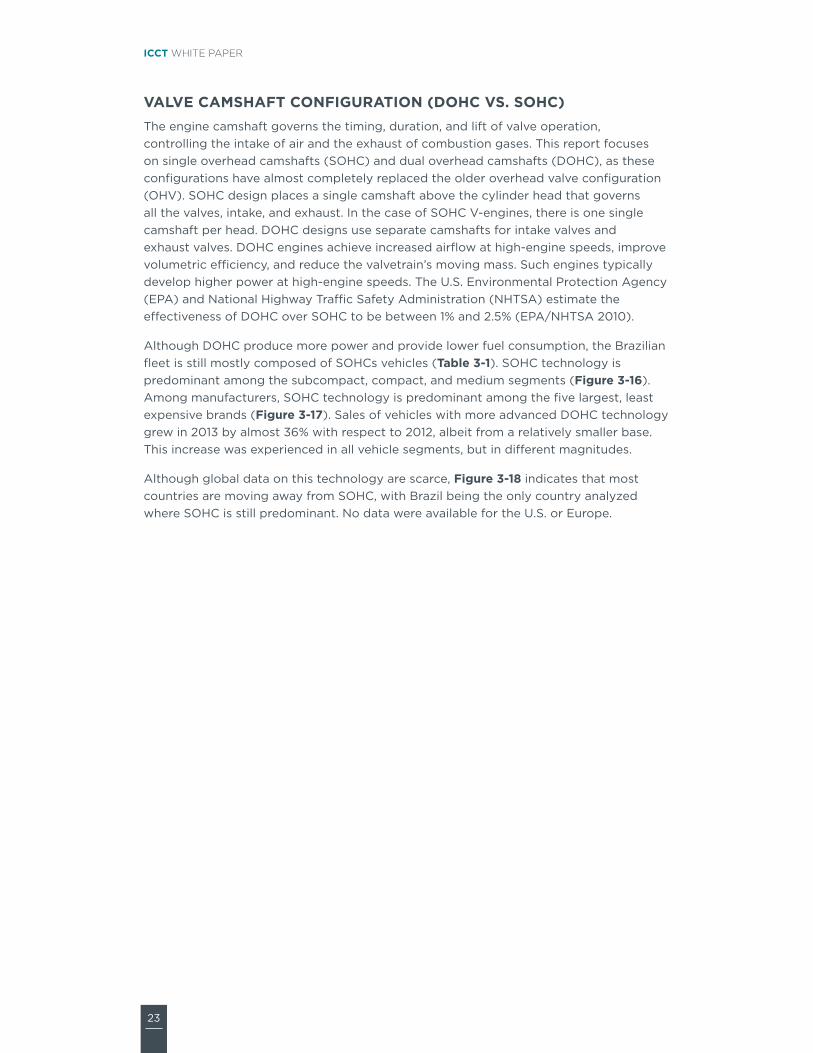
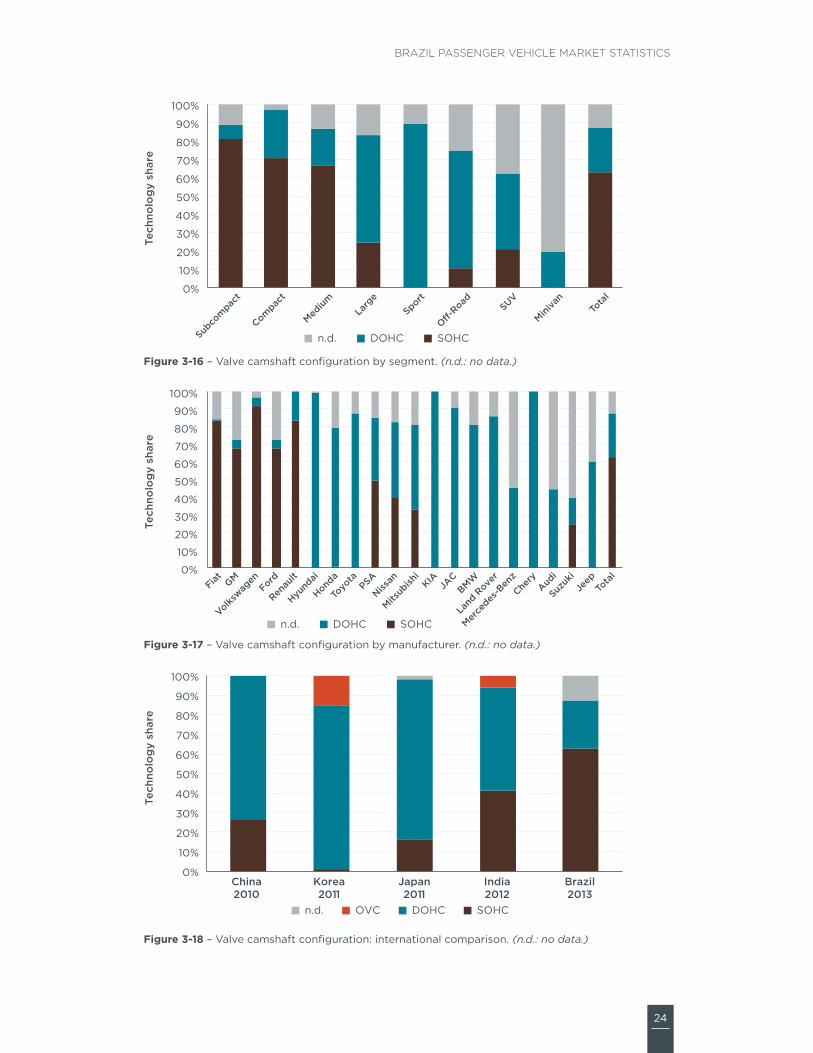
24
Brazil Passenger Vehicle Market statistics
0
10
20
30
40
50
60
70
80
90
100
Subco
mpac
t
Compac
t
Medium
Larg
eSport
O-Road SUV
Miniva
nTo
tal
Tech
nolo
gy
shar
e
nd DOHC SOHC
Figure 3‑16 ndash Valve camshaft configuration by segment (nd no data)
0
10
20
30
40
50
60
70
80
90
100
Fiat GM
Volkswag
enFord
Renau
lt
Hyund
ai
Honda
Toyo
taPSA
Nissan
Mitsub
ishi
KIAJA
CBMW
Land
Rove
r
Merce
des-B
enz
Chery
Audi
Suzuk
iJe
epTo
tal
Tech
nolo
gy
shar
e
nd DOHC SOHC
Figure 3‑17 ndash Valve camshaft configuration by manufacturer (nd no data)
0
10
20
30
40
50
60
70
80
90
100
China2010
Korea2011
Japan2011
India2012
Brazil2013
Tech
nolo
gy
shar
e
nd OVC DOHC SOHC
Figure 3‑18 ndash Valve camshaft configuration international comparison (nd no data)
25
ICCT white paper
VaLVE aCTUaTiON improved valvetrain systems with variable valve actuation (VVa) technology either variable valve timing (VVt) or variable valve timing and lift (VVt+VVl) improves the enginersquos volumetric and thermodynamic efficiency they also enable further engine improvements such as internal exhaust gas recirculation and cylinder deactivation VVt alters the timing of the intake valve exhaust valve or both primarily to reduce pumping losses increase specific power and control residual exhaust gases VVl increases efficiency by optimizing airflow over a broader range of engine operation which reduces pumping losses and increases specific power VVl is accomplished by controlled switching between two or more cam profile lobe heights the most advanced technology VVt+VVl yields a wide range of performance optimization and volumetric efficiency including enabling the engine to be valve-throttled (no need for intake throttle) VVt provides energy consumption gains of 3 to 5 while the more flexible and complex VVt+VVl system can reach 4 to 8 (ePa amp nhtsa 2010)
VVa technology either VVt or VVt+VVl are emerging technologies in Brazil where most vehicles still have fixed-valve timing designs (Table 3‑1) Fixed technology is predominant among the smaller vehicle segments as well as suVs and minivans (Figure 3‑19) the five largest manufacturers sold more than 90 of their vehicles with fixed-valve technology in 2013 (Figure 3‑20) the international comparison indicates that only Brazil and india have not yet adopted VVa technologies for most of their light-duty fleet (Figure 3‑21)
VVt and VVt+VVl are being adopted across all segments including the subcompact segment but tend to be more predominant in high-end manufacturers a closer examination by manufacturer shows that most are offering some vehicles with either one of the VVa systems while honda and hyundai offer this technology in almost all vehicles (Figure 3‑20) honda is the technology leader in variable valve actuation with the adoption in the early 1990s of the Vtec system (Valve timing electronic control) VVt technologyrsquos market share grew by about 25 in 2013 primarily due to hyundairsquos sales from 80000 units in 2012 to almost 200000 units in 2013 hyundai offered the continuously variable valve technology (cVVt) in the large majority of vehicle sold in 2013 the sports segment is the one where VVt dominates the market Mitsubishi BMW and audi are also selling a large share of their vehicles with the VVt+VVl technology
26
Brazil Passenger Vehicle Market statistics
0
10
20
30
40
50
60
70
80
90
100
Subco
mpac
t
Compac
t
Medium
Larg
eSport
O-Road SUV
Miniva
nTo
tal
Tech
nolo
gy
shar
e
VVT+VVL VVT Fixed
Figure 3‑19 ndash Valve actuation by segment
0
10
20
30
40
50
60
70
80
90
100
Fiat GM
Volkswag
enFord
Renau
lt
Hyund
ai
Honda
Toyo
taPSA
Nissan
Mitsub
ishi
KIAJA
CBMW
Land
Rove
r
Merce
des-B
enz
Chery
Audi
Suzuk
iJe
epTo
tal
Tech
nolo
gy
shar
e
VVT+VVL VVT Fixed
Figure 3‑20 ndash Valve actuation by manufacturer
VVT+VVL VVT Fixed
0
10
20
30
40
50
60
70
80
90
100
China2010
Korea2011
US2013
Japan2011
India2012
Brazil2013
Tech
nolo
gy
shar
e
Figure 3‑21 ndash Valve actuation international comparison
27
ICCT white paper
FUEL SYSTEMS FOR GaSOLiNE VEhiCLESVehicle fuel systems describe the technology required to deliver fuel into the engine combustion chamber this section examines two gasolineflex technologies namely multi-point fuel injection (MPFi) and gasoline direct injection (gDi) MPFi is now the most common fuel-delivery system for gasoline engines used in passenger vehicles worldwide in sequential MPFi engines fuel is injected into the air stream next to the intake valve port while the intake valve is open to draw the air-fuel mixture into the cylinder some of the fuel is vaporized on the surface of the hot intake valve expanding and thus reduces the volumetric efficiency on gDi engines fuel is injected at high pressure directly into the combustion chamber improving volumetric efficiency and providing cooling of the airfuel charge within the cylinder which allows for higher compression ratios and increased thermodynamic efficiency gDi technology alone offers benefits of 2 to 5 with respect to MPFi engines but bigger benefits rely on the synergy between gDi turbocharging and downsizing which can reach 12 to 15 energy consumption reduction with respect to a MPFi naturally aspirated engine (ePa 2012)
Table 3‑1 illustrates that MPFi is still the most common fuel injection technology for gasolineflex vehicles in Brazil which is reflected in its dominant share across most segments except for sports and off-road vehicles in Brazil gDi has found a niche market in the sports and off-road segments with more than 90 of sport vehicles fitted with gDi technology (Figure 3‑22) Within the overall gasoline market the gDi technology is still an emerging technology representing just 24 of new sales gDirsquos market share increased by 31 in 2013 with all but 4000 units being imported among the 10 largest manufacturers the adoption of gDi is extremely low below 5 for Volkswagen Ford hyundai and Psa (Figure 3‑23) high-end european brands (audi land rover Mercedes-Benz and BMW) are the technology leaders in terms of gDi adoption rates echoing the trend of turbocharging technology sales Volkswagen vehicles with gDi systems account for less than 35 of their sales in 2013 but their absolute numbers (around 19000 vehicles) place the company as one of the leaders in gDi technology in the Brazilian market
From a global market perspective the penetration of gDi technology in Brazil is low compared to all other markets in Figure 3‑24 except for india and japan it should be noted that the later has the largest share of hybrid vehicles around the globe
28
Brazil Passenger Vehicle Market statistics
0
10
20
30
40
50
60
70
80
90
100
Compac
t
Subco
mpac
t
Medium
Larg
eSport
O-Road SUV
Miniva
nTo
tal
Tech
nolo
gy
shar
e
GDI MPFI
Figure 3‑22 ndash gasolineflex fuel system by segment
GDI MPFI
0102030405060708090
100
Fiat GM
Volkswag
enFord
Renau
lt
Hyund
ai
Honda
Toyo
taPSA
Nissan
Mitsub
ishi
KIAJA
CBMW
Land
Rove
r
Merce
des-B
enz
Chery
Audi
Suzuk
iJe
epTo
tal
Tech
nolo
gy
shar
e
Figure 3‑23 ndash gasolineflex fuel system by manufacturer
GDI MPFI
0
10
20
30
40
50
60
70
80
90
100
China2010
Korea2011
EU-272013
US2013
Japan2011
India2012
Brazil2013
Tech
nolo
gy
shar
e (n
on-
die
sel)
Figure 3‑24 ndash gasolineflex fuel system international comparison
29
ICCT white paper
TURBOChaRGiNGengine power is primarily limited by the rate at which the engine is able to draw air into the combustion chamber turbocharging and supercharging are two methods to increase the amount of air drawn into the engine above the level of what is possible with the naturally aspirated process (through the expansion of the cylinders) By increasing the amount of air into the engine the amount of fuel can be proportionally increased resulting in increased power output level and with it the ability to reduce engine displacement while maintaining performance the combination of turbocharging and downsizing in spark ignited (gasoline and flex-fuel) vehicles can provide energy consumption improvements between 2 to 6 with respect to a direct-injected gDi engine (ePa amp nhtsa 2010) turbocharging technology is the cornerstone for achieving better energy consumption in vehicles as the basis for downsizing and reducing the engine weight while keeping the same or better vehicle performance (ie acceleration or time to reach certain speed) although turbochargers are used in diesel and gasolineflex vehicles the analysis in this report focuses on turbocharging for spark-ignited gasolineflex vehicles only
turbocharging is one of the most important emerging technologies in Brazil where most vehicles are still naturally aspirated (na) (Table 3‑1) turbocharging technology has increased the market share significantly between 2012 and 2013 by more than 65 albeit from a small base (from about 49000 to 81000 vehicles)
Most vehicles with turbocharging are sold in the sports and off-road segments as this technology also produces superior engine power output (Figure 3‑25) among the 10 largest manufacturers turbocharging is still below 10 of their sales (Figure 3‑26) Volkswagen and Ford despite having small relative sales of vehicles with turbocharging (less than 35) are the manufacturers with the highest total sales of vehicles with turbocharging audi land rover Mercedes-Benz and BMW are the technology leaders with more than 90 of vehicle sales in 2013
the penetration of turbo and supercharging technologies in Brazil is lower than in other countries with a larger gasoline fleet such as the us china and japan (Figure 3‑27) in Brazil 95 of diesel passenger vehicle sales have turbocharging technology
30
Brazil Passenger Vehicle Market statistics
0
10
20
30
40
50
60
70
80
90
100
Compac
t
Subco
mpac
t
Medium
Larg
eSport
O-Road SUV
Miniva
nTo
tal
Tech
nolo
gy
shar
e (n
on-
Die
sel)
Turbo NA
Figure 3‑25 ndash turbocharging for gasolineflex fuel vehicles by segment (NA naturally aspirated)
0102030405060708090
100
Fiat GM
Volkswag
enFord
Renau
lt
Hyund
ai
Honda
Toyo
taPSA
Nissan
Mitsub
ishiKIA
JACBMW
Land
Rove
r
Merce
des-B
enz
Chery
Audi
Suzuk
iJe
epTo
tal
Tech
nolo
gy
shar
e (n
on-
Die
sel)
Turbo NA
Figure 3‑26 ndash turbocharging for gasolineflex fuel vehicles by manufacturer (NA naturally aspirated)
0
10
20
30
40
50
60
70
80
90
100
China2010
Korea2011
EU-272013
US2013
Japan2011
India2012
Brazil2013
Tech
nolo
gy
shar
e (n
on-
die
sel)
Turbo NA
Figure 3‑27 ndash turbocharging for gasolineflex fuel vehicles international comparison (NA naturally aspirated)
31
ICCT white paper
4 vEhiCLE ENErGy CONSuMpTiON
this section analyzes the Brazilian new passenger vehicle energy consumption in 2013 although other metrics are more common (see box) vehicle energy consumption is presented in megajoules per kilometer (Mjkm) for consistency with Brazilrsquos inovar-auto policy in 2012 Brazilrsquos Ministry of Development industry and Foreign trade (MDic) adopted the inovar-auto policy with the aim of fostering industrial competitiveness through technology investments the policy includes a target for corporate average energy consumption (in Mjkm with vehicle curb weight as the attribute parameter) for vehicles sold in 2017
in the us canada Mexico and saudi arabia fleet-average fuel economy standards are defined as a function of vehicle footprint in the eu china japan south Korea and india vehicle weight is the attribute for the calculation of fleet-average targets in Brazil inovar-auto has defined its fiscal targets for vehicle energy consumption measured in megajoules per kilometer (Mjkm) as a function of vehicle weight
VEhiCLE ENERGY MEaSUREMENT UNiTS
Many metrics can be used to describe the amount of fuel energy or emissions generated by unit of distance traveled
Fuel economy measures distance traveled per unit of fuel consumed in Brazil kilometers per liter (kml) is the most common metric to describe vehicle efficiency but other units are used in different countries such as miles per gallon (mpg) in the us
Fuel consumption is the reciprocal of fuel economy and measures fuel consumed per distance traveled it is usually expressed in liters per 100 kilometers (l100 km) and it is used in europe for example
GhGCO2 emissions measures ghg or co2 emissions per distance traveled expressed as grams of pollutant per kilometer or mile
Energy consumption (EC) measures the energy consumed per distance traveled for example in megajoules per kilometer Despite being a less common metric it is sometimes preferred for being a fuel-neutral metric across different types of fuel and vehicle technologies Vehicle energy consumption in Mjkm is the metric used in Brazilrsquos inovar-auto policy to quantify the corporate average energy consumption target for each manufacturer Values for energy consumption in Brazilian spark-ignited vehicles are provided for e22 since that is the fuel mixture used in vehicle tests
Vehicle energy consumption in this report is calculated from co2 emissions data in the Brazilian institute of environment and renewable natural resources (iBaMa) nota Verde program (iBaMa 2014) which reports official emissions data from homologation tests Data are limited to passenger cars sold by the top 10 manufacturers with light commercial vehicles being excluded appendix D presents a description of data sources
32
Brazil Passenger Vehicle Market statistics
and calculation methodologies as well as a discussion of vehicle energy consumption data quality and completeness in Brazil
not surprisingly vehicle energy consumption increases with vehicle footprint and engine rated power the two parameters that define vehicle segments in Brazil (Figure 4‑1) subcompact and compact vehicles which accounted for about 45 of new sales in 2013 have average energy consumption below the fleet average while medium-sized vehicles which hold the largest market share (388) have energy consumption just above the fleet average larger more powerful vehicles consume more energy than the fleet average but have a considerably smaller market share (combined share of 163) Data availability for these segments is not as extensive as the data available for the subcompact compact and medium segments which could affect the relative rankings of each segment
Ene
rgy
cons
ump
tio
n (M
Jkm
)
Subco
mpac
t
Compac
t
Medium
Larg
e
O-road SUV
4000
200000
400000
600000
850000
35
30
25
20
15
10
05
0
Sales
Total 202
Figure 4‑1 ndash new vehicle sales-weighted average energy consumption by segment (2013)
33
ICCT white paper
Figures 4‑2 and 4‑3 illustrate new vehicle energy consumption for multiple weight and footprint bins For each weight bin (in 100 kg increments) and footprint bin (in 01 m2 increments) sales-weighted averages of energy consumption for each vehicle version are presented (dashes) generating energy consumption ranges for each bin (cream areas) Vehicle sales by bin are presented for reference in the lower charts
the strong correlation between vehicle energy consumption and weight follows from the strong physical relationship between the weight of the vehicle and the energy required to accelerate it and overcome resistances9 (Figure 4‑2) Data dispersion within each bin suggests that energy consumption varies due to other vehicle characteristics that affect vehicle aerodynamics and rolling resistance as well as the adoption of technologies that affect engine and transmission efficiency (eg friction reduction technologies gDi VVt)
Curb weight (kg)
SubcompactCompactMediumLargeO-roadSUV
Ene
rgy
cons
ump
tio
n (M
Jkm
)Sa
les
5
6
4
3
2
1
600k
800k
400k
200k
0k800 900 1000 1100 1200 1300 1400 1500 1600 1700 1800 1900 2000 2100
Figure 4‑2 ndash new vehicle energy consumption by vehicle weight (2013)
9 on a plain surface the sum of resistances of a vehicle is acceleration resistance + rolling resistance + aerodynamic resistance = c1 m a + c2 frr m + c3 cw a v2 with mass (m) as an integral part of both acceleration and rolling resistance which are most relevant for inner-city driving situations other factors are acceleration (a) rolling resistance of tires (frr) aerodynamic coefficient of the vehicle (cw) frontal area of vehicle (a) velocity (v) and constants (cx)
34
Brazil Passenger Vehicle Market statistics
Footprint has a reasonable correlation with energy consumption (Figure 4‑3) ie larger vehicles tend to consume more fuel than smaller vehicles however the correlation is not as strong as with vehicle weight similar to the previous figure the broad spread of energy consumption values suggests a combination of different vehicle characteristics (eg weight engine displacement rated power) and technologies (eg transmissions fuel systems) as well as the presence of suVs and off-road vehicles among the medium- and large-sized footprint values respectively
Footprint (m2)
SubcompactCompactMediumLargeO-roadSUV
Ene
rgy
cons
ump
tio
n (M
Jkm
)Sa
les
5
6
4
3
2
1
400k
500k
300k
200k
100k
0k31 32 33 34 35 36 37 38 39 40 41 42 43 44 45 46 48 49
Figure 4‑3 ndash new vehicle energy consumption by vehicle footprint (2013)
35
ICCT white paper
Figure 4‑4 illustrates sales weighted average for new vehicle energy consumption by mass for the top 10 manufacturers in Brazil in 2013 Bubble sizes are proportional to total vehicle sales Manufacturers in the lower-left quadrant produce the lightest and most efficient vehicles with hyundai presenting the best overall average energy consumption renault in the upper-left quadrant produces vehicles that are equivalent in weight but on average with higher energy consumption in the lower-right quadrant are manufacturers that produce relatively heavier vehicles but with lower energy consumption in their weight class Despite producing heavier vehicles on average than many manufacturers honda achieves lower energy consumption on average in the upper-right quadrant are manufacturers that produce on average the heavier and least efficient vehicles with Psa (citroen and Peugeot) producing the heaviest and least efficient cars on average a regression line correlating vehicle energy consumption and mass highlights the best performers (hyundai honda and nissan) average performers (Fiat Volkswagen gM and toyota) and those performing worse than average (renault Ford and Psa)
FIA
GMVW
FORREN
HYU
HON
TOY
PSA
NIS
160
170
180
190
200
210
220
230
240
250
950 1000 1050 1100 1150 1200 1250 1300 1350
Ene
rgy
cons
ump
tio
n (M
Jkm
)
Curb weight (kg)
Fleet Ave
Figure 4‑4 ndashaverage new vehicle sales-weighted energy consumption by manufacturer (2013)
36
Brazil Passenger Vehicle Market statistics
Figure 4‑5 shows fleet-average energy consumption based on certification and type approval data for new vehicles in multiple countries converted to the us caFe combined driving cycle Bubble sizes represent total sales of new passenger cars Because of data availability in different countries the country comparison is based on different calendars years for different countries 2011 for south Korea and japan 2012 for china and india and 2013 for europe the us and Brazil given annual improvements in vehicle energy consumption triggered by regulatory efficiency standards and fiscal incentives those countries with older data could be at a slight disadvantage in this comparison
With the heaviest vehicles on average the us fleet is also the most energy consuming of all countries china and south Korea have similar average energy consumption but since south Korean vehicles are heavier on average they are relatively more efficient than chinese vehicles although Brazilrsquos fleet consumes less fuel on average than those from the us china and south Korea its fleet is relatively inefficient when compared to countries with vehicles of similar weight (japan and india) the average Brazilian vehicle consumes about 34 more energy than the average vehicle in japan whose fleet has a large penetration of gasoline hybrid and advanced fuel-efficiency technologies such as three-cylinder engines VVa Dohc and 6-plus speed transmissions european vehicles are the best performing on average despite being heavier than all countries with the exception of the us and south Korea the adoption of fuel-efficiency technologies (eg Dct 6-plus-speed transmissions gDi turbocharging) contributes to europersquos better than average performance
China2012
SKorea2011
Europe2013
US2013
Japan2011
India2012
Brazil2013
Sales5 MM10 MM
14
16
18
20
22
24
26
28
1000 1100 1200 1300 1400 1500 1600 1700
Ene
rgy
cons
ump
tio
n ndash
CA
FE
(M
Jkm
)
Curb weight (kg)
Type-approval and certification energy consumption data only (does not include o-cycle or real-world driving data)
Figure 4‑5 ndash international comparison of passenger car energy consumption
Country labels indicate the dataset year
Figure 4‑6 provides a more detailed country comparison by illustrating average vehicle energy consumption by vehicle (curb) weight bin Vehicle sales in each bin are shown for reference the us is not shown due to lack of detailed model-by-model data Brazilrsquos vehicles on average have the highest energy consumption in most weight
37
ICCT white paper
bins with china being the second highest in most bins Because china has higher fuel consumption than Brazil on the 1000 bin which represents the highest share of vehicle sales fleet-average energy consumption in china is still higher than in Brazil as illustrated in the previous figure europe consistently performs best in terms of vehicle energy consumption in most weight bins with japan also performing relatively well
Curb weight (kg)
BrazilChinaEuropeIndiaJapanSouth Korea
Ene
rgy
cons
ump
tio
n C
AF
E (
MJ
km)
Sale
s
40
35
25
20
15
10
6M
8M
4M
2M
0M600 800 1000 1200 1400 1600 1800 2000 2200 2400
Figure 4‑6 ndash international comparison of average vehicle energy consumption by vehicle weight
Type-approval and certification energy consumption data only (does not include off-cycle or real-world driving data)
38
Brazil Passenger Vehicle Market statistics
Figure 4‑7 illustrates the distribution of energy consumption data in Brazil for each vehicle version by mass and segment Bubble sizes represent total sales of each version Data were limited to flex-fuel vehicles in the subcompact compact medium and large segments due to its relatively better data quality and representativeness (ie they represented over 87 of sales in 2013) While most vehicles follow a predictable trend that correlates energy consumption and vehicle mass there are a large number of versions with energy consumption substantially higher than the trend line this suggests there is substantial room for improvements in their energy consumption since there are vehicles in similar weight classes with substantially superior energy consumption performance
Sales1000050000
140
160
180
200
220
240
260
280
700 800 900 1000 1100 1200 1300 1400 1500 1600
Ene
rgy
cons
ump
tio
n (M
Jkm
)
Curb weight (kg)
Subcompact Compact Medium Large Fleet average
Figure 4‑7 ndash Distribution of new Brazilian passenger vehicle energy consumption data by vehicle weight and segment (2013)
this chapter suggests that there are potential improvements in vehicle energy consumption for the Brazilian fleet For similar vehicles in terms of weight class footprint or engine rating there is substantial dispersion in energy consumption indicating that there are vehicles performing much worse than the average across manufacturers there is also a clear trend of some manufacturers performing much better than the average while others have a lot more room for improvement the international comparison clearly shows that Brazilian vehicles perform much worse in terms of energy consumption than vehicles of similar weight suggesting a delay in the adoption of energy efficient technologies among Brazilian vehicle manufacturers
Finally a more detailed analysis of vehicle versions clearly illustrates a considerable number of vehicle versions significantly above average thus indicating potential improvements in energy consumption that would place them on par with better performing vehicles with similar characteristics
39
ICCT white paper
Deficiencies in data quality and completeness prevent more definite conclusions about vehicle energy consumption gasoline-only vehicles in particular have poor energy consumption data quality although they represent a relatively small fraction (6) of total vehicles sold in 2013 Because some vehicle segments are primarily composed of gasoline-only vehicles (eg sports minivans) this chapter excludes these segments from the analysis there are also concerns about the gap between energy consumption data reported by iBaMarsquos nota Verde and Brazilrsquos national institute of Metrology standardization and industrial Qualityrsquos (inMetro) labeling program (PBeV using its acronym in Portuguese) with the latter reporting consistently lower values of vehicle energy consumption
Finally the availability of energy consumption data was not adequate for many manufacturers beyond the top 10 sales group which prevented their inclusion in this analysis Despite the data quality and lack of completeness the energy consumption data in this chapter include data that are reasonably accurate and representative thus supporting its interpretation
40
Brazil Passenger Vehicle Market statistics
rEfErENCES
aDK automotive consultoria de Marketing (2013) relatoacuterios de volumes de vendas do mercado brasileiro para veiacuteculos de passeio e comerciais leves referentes a 2013
alves l Wilbert M (2014) reduccedilatildeo do imposto sobre Produto industrializado e a Venda de automoacuteveis Xi congresso usP iniciaccedilatildeo cientiacutefica em contabilidade
associaccedilatildeo nacional de transportes Puacuteblicos (antP 2014) estudo mostra baixo efeito do desconto no iPi de veiacuteculos sobre PiB e emprego available at httpwwwantporgbrwebsitenoticiasshowaspnpgcode=a4DeeFe8-a7BF-48D3-B1F5-8eDe1447BF10
associaccedilatildeo nacional dos Fabricantes de Veiacuteculos automotores (anFaVea 2015) anuaacuterio da induacutestria automobiliacutestica Brasileira 2015 Brazilian automotive industry Yearbook 2015 satildeo Paulo available at wwwanfaveacombr
european environment agency (2014) Monitoring co2 emissions from new passenger cars in the eu summary of data for 2013 april 2014
instituto Brasileiro do Meio ambiente e dos recursos naturais renovaacuteveis (iBaMa 2014) consulta dos niacuteveis de emissatildeo dos veiacuteculos novos brasileiros available at httpsservicosibamagovbrctfpublicosel_marca_modelo_rvepphp
international council on clean transportation (icct 2015) global passenger vehicle standards available at httpwwwtheicctorginfo-toolsglobal-passenger-vehicle-standards
international energy agency (iea 2015) renewables Bioenergy available at httpswwwieaorgtopicsrenewablessubtopicsbioenergy
Korea energy Management corporation (KeMco 2014) Fuel economy regulation available at httpwwwkemcoorkrnew_engmainmainasp
Marklines (2015) Marklines automotive industry Portal available at httpwwwmarklinescomen
Mendonccedila M sachsida a (2014) Modelando a demanda de creacutedito para veiacuteculos no Brasil uma abordagem com mudanccedila de regime iPea
Ministeacuterio do Desenvolvimento induacutestria e comeacutercio exterior (MDic 2013) Programa de incentivo agrave inovaccedilatildeo tecnoloacutegica e adensamento da cadeia Produtiva de Veiacuteculos automotores mdash inovar-auto httpwwwplanaltogov brccivil_03_ato2011-20142012DecretoD7819htm
stein r anderson j and Wallington t (2013) an overview of the effects of ethanol-gasoline Blends on si engine Performance Fuel efficiency and emissions SAE Int J Engines 6(1)470-487 2013 doi1042712013-01-1635
us environmental Protection agency and national highway traffic safety administration (ePanhtsa 2010) Final rulemaking to establish light-Duty Vehicle greenhouse gas emission standards and corporate average Fuel economy standards ePa-420-r-10-901
us environmental Protection agency (ePa 2012) regulatory impact analysis Final rulemaking for 2017-2025 light-Duty Vehicle greenhouse gas emission standards and corporate average Fuel economy standards ePa-420-r-12-016
41
ICCT white paper
us national academy of sciences (nas 2011) assessment of Fuel economy technologies for light-Duty Vehicles available at httpwwwnapeducatalog12924assessment-of-fuel-economy-technologies-for-light-duty-vehicles
World Bank group (2015) World Development indicators available at httpdataworldbankorgdata-catalogworld-development-indicators
42
Brazil Passenger Vehicle Market statistics
LiST Of ACrONyMS
4wD Four-wheel drive
aNFaVEa Brazilian association of automobile Manufacturers
awD all-wheel drive
BRiC Brazil russia india china
CaFE corporate average fuel economy
CBG compressed biogas
CO2 carbon dioxide
CVT continuously variable transmission
CVVT continuously variable valve technology
DCT Dual-clutch transmission
DOhC Dual overhead camshaft
EC energy consumption
Epa us environmental Protection agency
EU european union
FFV Flex-fuel vehicle
FTp Federal test procedure
FwD Front-wheel drive
GDi gasoline direct injection
GDp gross domestic product
GhG greenhouse gas
GM general Motors
iBaMa Brazilian institute of the environment and renewable natural resources
iC internal combustion
iCCT international council on clean transportation
iNMETRO national institute of Metrology standardization and industrial Quality
Kg Kilogram
Km Kilometer
Kw Kilowatt
LDV light-duty vehicle
LpG liquified petroleum gas
MDiC Ministry of Development industry and Foreign trade
MJ Megajoule
MpFi Multi-point fuel injection
Mpg Miles per gallon
NaS us national academy of sciences
43
ICCT white paper
NhTSa us national highway transportation safety administration
OhV overhead valve
pBEV Brazilian Vehicle labeling Program
pSa Psa Peugeot citroeumln
pTwR Power-to-weight ratio
pV Passenger vehicle
RwD rear-wheel drive
SOhC single overhead camshaft
SUV sport utility vehicle
US united states
USD us dollar
VTEC Valve timing electronic control
VVa Variable valve actuation
VVL Variable valve lift
44
Brazil Passenger Vehicle Market statistics
AppENDix A SEGMENT DEfiNiTiONS
Table a‑1 ndash segment definitions
Segmentpower (kw)
pTwR (kwkg) area (m2)
Other characteristics Examples
Subcompact lt 140 lt 0075 le 65 mdash Mini cooper chevrolet celta smart Fortwo
Compact lt 140 lt 0075 65 lt area le 70 mdash honda Fit hyundai hB20 Volkswagen Polo
Medium lt 140 lt 0075 70 lt area le 80 mdash honda civic nissan tiida Peugeot 308
Large lt 140 lt 0075 gt 80 mdash audi a4 BMW 3 series Mercedes c-class
Sports gt 140 gt 0075 mdash 4 seats maxjaguar XF lamborghini gallardo Ferrari california
Off‑road mdash mdash lt 80 traction = 4WDjeep cherokee honda cr-V BMW X3 hyundai santa Fe
SUV mdash mdash lt 80Based on aDKrsquos default classification
BMW X1 Ford ecosport hyundai tucson
Minivan mdash mdash Passengers 6-12
citroen grand Picasso Kia carnival
45
ICCT white paper
AppENDix b iNTErNATiONAL MArKET DATA
Table B‑1 ndash international market comparison of new fleet characteristics
parameters China S Korea EU US Japan india Brazil
Year 2012 2011 2013 2013 2011 2012 2013
Sales (million) 155 13 118 156 352 256 304
price (USD) $21008 $21383 $24439 mdash $20637 $11717 $22015
No of cylinders mdash 43 40 47 38 36 40
Displacement (cc) 1605 1960 1613 2606 1425 1294 1430
Curb weight (kg) 1296 1421 1391 1623 1193 1059 1106
Length (mm) 4323 4531 4263 mdash 4013 3859 4100
Footprint (m2) 38 420 40 425 371 341 367
Engine power (kw) 86 120 89 148 78 55 76
pTwR (kwkg) 00664 00844 00640 00912 00654 00519 00671
Energy consumption ndash US CaFE (MJKm)[1] 235 206 169 250 171 183 202
[1] energy consumption data presented here for countries other than Brazil were obtained from local official sources in its original metric and drive cycle and then converted to Mjkm under the us caFe drive cycle using the methodology described in Yang (2015) Mode details and historical fuel consumption data on their original metrics is presented in the icctrsquos global PV standard website httpwwwtheicctorginfo-toolsglobal-passenger-vehicle-standards
Data Sources
China Ministry of industry and information technology (Miit 2014) corporate average Fuel efficiency accounting Method for Passenger cars available at httpwwwgovcngzdt2013-0320content_2358627htm
Baseline performance china automotive research and technology center through internal communication and icct internal 2010 database for chinese light-duty vehicles
S Korea internal communication with s Korean official and from greencarcongress available at httpwwwgreencarcongresscom200906korea-20090604html
EU european environment agency (2014) Monitoring co2 emissions from new passenger cars in the eu summary of data for 2013 april 2014
US us ePa (2014) light-duty automotive technology carbon dioxide emissions and fuel economy trends1975 through 2014 table 91 page 110 available at http httpwwwepagovfueleconomyfetrends1975-2014420r14023apdf
Japan jaMa (2010) the Motor industry of japan available at httpwwwjama-englishjppublicationsMVs2010pdf Mlit httpwwwmlitgojpcommon000990330pdf
india Bureau of energy efficiency white paper 2010-2012 calculation based on icct database
Brazil icct Brazil Vehicle Database (2013)
46
Brazil Passenger Vehicle Market statistics
Table B‑2 ndash international market comparison of technology adoption in new vehicles
Technology adoption China S Korea EU US Japan india Brazil
Year 2010 2011 2013 2013 2011 2012 2013
Fuel type
CBGLpGFlex 0 11 2 0 0 4 94
Gasoline 99 65 44 93 86 56 6
hybrid 0 1 1 5 13 0 0
Diesel 1 23 53 1 0 40 0
No of cylinders
Two 0 0 0 0 0 6 0
Three 4 0 7 0 36 28 3
Four 90 84 87 56 57 65 97
Five 0 0 1 0 0 0
Six 6 15 4 32 5 0 1
Eight or more 0 0 0 12 1 0 0
Transmission
Manual 60 3 83 5 1 98 83
automatic 34 90 9 75 34 2 15
CVT 5 7 2 18 65 0 1
DCT 1 0 6 2 mdash 0 1
Number of gear ratios
Four or fewer 13 16 1 7 mdash 10 6
Five 68 9 45 11 mdash 85 83
Six or more 19 75 54 82 mdash 5 11
Drivetrain
FwD 74 86 81 83 59 76 0
RwD 21 7 7 10 5 22 0
4wD and awD 5 7 12 7 36 2 100
No of valves per cylinder
Two 17 mdash mdash 2 4 25 60
Multi valve 83 mdash mdash 98 95 75 40
Valve camshaft configuration
Single overhead camshaft 26 1 mdash mdash 16 41 63
Dual overhead camshaft 74 84 mdash mdash 82 53 25
Overhead camshaft mdash 15 mdash mdash 0 6 mdash
Valve actuation
Fixed 50 16 mdash 2 11 86 78
VVT 44 84 mdash 98 89 12 16
VVL 6 mdash mdash mdash mdash 2 6
Fuel systems for gasoline vehicles
Multi‑point fuel injection 94 72 68 62 95 100 98
Gasoline direct injection 6 28 32 37 5 0 2
air induction systems for gasoline vehicles
Naturally aspirated 93 75 41 85 92 64 97
Supercharger turbocharger or twin‑turbo 7 25 59 15 8 36 3
47
ICCT white paper
AppENDix C NEW vEhiCLE ChArACTEriSTiCS AND TEChNOLOGy ADOpTiON DATA iN brAziL
Table C‑1 ndash Fleet characteristics of new Brazilian passenger vehicles by segment (2013)
parameters Subcompact Compact Medium Large Sports Off‑road SUV Minivan
Sales (thousands) 6785 6843 11790 1920 273 768 1997 23
Market share () 223 225 38 8 63 09 25 65 01
price (R$) $30103 $38732 $45496 $66508 $148834 $151284 $75164 $82284
No of cylinders 400 391 399 400 462 448 404 433
Displacement (cc) 1128 1293 1447 1794 2430 2586 1884 2244
Curb weight (kg) 940 1037 1102 1329 1561 1772 1395 1604
Length (mm) 3804 4026 4163 4499 4711 4516 4352 4658
Footprint (m2) 339 361 371 402 418 409 402 427
Engine power ndash gasoline (kw) 58 68 75 99 183 146 103 120
Engine power ndash ethanol (kw) 59 70 77 98 mdash 109 101 mdash
pTwR ndash gasoline (kwkg) 00614 00655 00671 00742 01173 00828 00731 00732
pTwR ndash ethanol (kwkg) 00630 00678 00697 00757 mdash 00766 00745 mdash
48
Brazil Passenger Vehicle Market statistics
Table C‑2 ndash Fleet characteristics of new Brazilian passenger vehicles by manufacturer (2013)
parameters Fiat
GM
Vo
lksw
agen
Ford
Ren
ault
hyu
ndai
ho
nda
Toyo
ta
pSa
Nis
san
Mit
sub
ishi
Kia
JaC
BM
w
Land
Rov
er
Mer
ced
es‑B
enz
Che
ry
aud
i
Suzu
ki
Jeep
Sales (thousands) 6087 5486 5448 3074 2207 2055 1392 1334 1163 621 368 255 158 141 106 94 80 67 63 36
Market share () 2002 1804 1792 1011 726 676 458 439 383 204 121 084 052 046 035 031 026 022 021 012
price (R$) $35017 $42259 $38701 $46174 $43447 $50112 $67078 $68922 $103001 $44035 $100696 $87009 $37654 $165111 $221943 $153281 $30821 $142799 $74769 $139039
No of cylinders 400 401 400 402 400 370 400 400 400 400 408 416 400 424 448 431 400 411 400 552
Displacement (cc) 1250 1340 1287 1497 1423 1495 1691 1808 1575 1579 2262 1856 1411 2095 2281 1934 1398 1912 1831 3182
Curb weight (kg) 1033 1060 1020 1156 1102 1122 1210 1201 1231 1069 1556 1377 1079 1624 1868 1598 1097 1551 1444 1945
Length (mm) 3965 4155 3993 4120 4127 4078 4319 4299 4116 4171 4401 4357 3956 4574 4487 4527 3896 4454 4234 4584
Footprint (m2) 345 370 354 368 378 383 397 387 376 379 395 407 351 429 433 429 349 417 323 420
Engine power ndash gasoline (kw) 64 71 65 79 73 86 96 90 80 82 120 112 83 151 179 138 71 136 94 162
Engine power ndash ethanol (kw) 65 72 65 79 76 85 97 90 81 82 107 106 95 mdash mdash mdash 75 mdash mdash mdash
pTwR ndash gasoline (kwkg)
00613 00662 00631 00674 00657 00739 00788 00745 00646 00766 00779 00792 00784 00921 00977 00856 00638 00870 00649 00835
pTwR ndash ethanol (kwkg) 00629 00681 00642 00693 00685 00781 00800 00795 00660 00768 00710 00798 00896 mdash mdash mdash 00659 mdash mdash mdash
49
ICCT white paper
Table C‑3 ndash Fleet characteristics of new Brazilian passenger vehicles by origin (2013)
parameters Domestic imported
Sales (thousands) 2537 504
Market share () 834 166
price (R$) $41739 $76049
No of cylinders 397 412
Displacement (cc) 1359 1791
Curb weight (kg) 1070 1289
Length (mm) 4063 4285
Footprint (m2) 362 390
Engine power ndash gasoline (kw) 70 102
Engine power ndash ethanol (kw) 73 84
pTwR ndash gasoline (kwkg) 0065 0076
pTwR ndash ethanol (kwkg) 0068 0074
50
Brazil Passenger Vehicle Market statistics
Table C‑4 ndash technology adoption in new Brazilian passenger vehicles by segment (2013)
Technology adoption Subcompact Compact Medium Large SportOff‑road SUV Minivan
Fuel type
Flex 982 988 982 837 00 134 826 00
Gasoline 18 12 17 163 996 540 174 1000
hybrid 0000 0000 0028 0000 0396 0001 0000 0000
Diesel 00 00 00 00 00 326 00 00
No of cylinders
Three 01 91 10 00 00 00 00 00
Four 999 909 990 998 758 775 979 833
Five 00 00 00 02 03 00 00 00
Six 00 00 00 00 175 211 21 167
Eight or more 00 00 00 00 63 13 00 00
Transmission
Manual 993 944 826 622 62 174 505 641
automatic 07 55 161 283 629 707 451 359
CVT 00 00 12 89 09 93 34 00
DCT 00 01 02 06 299 25 10 00
No of gear ratios
Four or fewer 04 47 72 51 00 34 247 193
Five 984 943 848 378 15 392 516 641
Six 12 09 73 515 796 462 225 167
Seven 00 01 06 23 87 53 12 00
Eight or more 00 00 01 32 102 59 00 00
Drivetrain
FwD 998 1000 997 688 550 00 916 1000
RwD 02 00 03 311 221 00 84 00
awD 00 00 00 01 229 1000 00 00
No of valves per cylinder
Two 806 694 584 195 00 00 258 00
Multi valve 194 306 416 805 1000 1000 742 1000
Valve camshaft configuration
Single overhead camshaft 839 786 709 309 00 212 375 00
Dual overhead camshaft 24 158 161 546 880 517 446 255
Valve actuation
Fixed 982 729 807 461 49 493 664 868
VVT 18 211 115 470 827 367 252 132
VVT+VVL 00 61 78 68 124 140 84 00
Fuel systems for gasoline vehicles
Multi‑point fuel injection 999 998 997 949 979 143 766 1000
Gasoline direct injection 01 02 03 51 21 857 234 00
air induction systems for gasoline vehicles
Naturally aspirated 999 997 995 943 974 369 543 1000
Supercharger turbocharger or twin‑turbo 01 03 05 57 26 631 457 00
51
ICCT white paper
Table C‑5 ndash technology adoption in new Brazilian passenger vehicles by manufacturer (2013)
Technology adoption Fi
aT
GM
VO
LKSw
aG
EN
FOR
D
REN
aU
LT
hY
UN
Da
i
hO
ND
a
TOYO
Ta
pSa
NiS
SaN
MiT
SUB
iSh
i
Kia
JaC
BM
w
LaN
D R
OV
ER
MER
CED
ES
Fuel type
Flex 990 987 965 966 997 921 999 886 928 998 283 739 31 42 00 00
Gasoline 10 09 35 34 03 79 01 35 72 02 557 255 969 957 663 950
hybrid 00 00 00 00 00 00 00 02 00 00 00 00 00 00 00 00
Diesel 00 04 00 00 00 00 00 77 00 00 160 06 00 00 337 50
No of cylinders
Three 00 00 05 00 00 348 00 00 00 00 00 00 00 00 00 00
Four 1000 996 994 989 1000 626 999 998 1000 1000 958 922 1000 906 787 878
Five 00 00 00 00 00 00 00 00 00 00 00 00 00 00 00 00
Six 00 02 01 11 00 26 01 02 00 00 42 78 00 68 185 87
Eight or more 00 02 00 00 00 00 00 00 00 00 00 00 00 26 28 35
Transmission
Manual 992 878 985 846 853 632 566 565 703 785 493 120 1000 02 00 151
automatic 08 103 00 137 62 285 355 160 297 121 118 793 00 575 18 14
CVT 00 19 15 16 41 70 01 246 00 00 139 87 00 423 982 836
DCT 00 00 00 00 43 13 78 30 00 94 251 00 00 00 00 00
No of gear ratios
Four or fewer 02 04 00 55 104 237 00 323 249 132 17 133 00 00 00 00
Five 981 811 963 839 797 623 861 643 684 828 530 107 1000 00 00 64
Six 17 185 29 106 99 140 139 07 67 40 453 754 00 217 800 00
Seven 00 00 07 00 00 00 00 27 00 00 00 00 00 08 00 936
Eight or more 00 00 00 00 00 00 00 00 00 00 00 06 00 775 200 00
Drivetrain
FwD 1000 902 989 972 987 985 990 892 1000 1000 496 623 1000 00 00 00
RwD 00 91 00 00 00 00 00 16 00 00 00 370 00 882 00 900
awD 00 06 11 28 13 15 10 92 00 00 504 07 00 118 1000 100
No of valves per cylinder
Two 811 864 988 745 220 00 00 00 00 00 00 00 00 00 00 00
Multi Valve 189 136 12 255 780 1000 1000 1000 1000 1000 1000 1000 1000 1000 1000 1000
Valve camshaft configuration
SOhC 836 755 914 675 832 00 04 00 497 398 331 00 00 00 00 00
DOhC 07 108 56 50 168 992 786 875 352 428 477 1000 907 810 860 453
Valve actuation
Fixed 1000 898 965 966 940 29 00 574 736 573 435 76 124 187 18 55
VVT 00 102 35 34 60 971 00 426 264 427 00 924 876 00 982 945
VVT+VVL 00 00 00 00 00 00 1000 00 00 00 565 00 00 813 00 00
air induction System
Naturally aspirated 997 994 966 977 997 988 1000 923 922 1000 835 936 1000 97 37 101
Supercharger turbocharger or twin‑turbo
03 06 34 23 03 12 00 77 78 00 165 64 00 903 963 899
Fuel systems for gasoline vehicles
Multipoint fuel injection 1000 995 965 972 1000 989 1000 1000 967 1000 994 1000 1000 78 15 158
Gasoline Direct injection 00 05 35 28 00 11 00 00 33 00 06 00 00 922 985 842
note Difference between 100 and summation of sohc and Dohc market share values corresponds to data not available
52
Brazil Passenger Vehicle Market statistics
AppENDix D DATA SOurCES AND COMpLETENESS
the basis of the statistics shown in this report is a database compiled by the icct with vehicle sales technical information (eg fleet characteristics technology content) and energy consumption (converted from either co2 emissions or fuel economy) from various data sources outlined in table D-1
Table D‑1 ndash Brazilian data sources
parameters Sales TechnicalEnergy
consumption
aDK (2014 2015) x x
MarkLines (2015) x
iBaMa (2014) x
iNMETRO (2014) x
UOL (2014) x
icarroscom (2014) x
this analysis examined energy consumption data from two public sources the nota Verde Program by the Brazilian institute of the environment and renewable natural resources (iBaMa) and the Brazilian Vehicle labeling Program (PBeV) by the national institute of Metrology standardization and industrial Quality (inMetro) table D-2 summarizes key differences between these two data sources
Table D‑2 ndash energy consumption data sources
iBaMa iNMETRO
program nota Verde1 Brazilian Vehicle labeling Program (PBeV)2
program description
Mandatory program that reports emissions of co2 co nox and nMhc as part of emissions certification program
Voluntary program since 2009 that allows the comparison of fuel economy across vehicle models
Unit gco2 km kml
Test cycle chassis testing under urban (FtP) driving cycle based on nBr 66012005
chassis testing under urban (FtP) and highway (hWYFe) driving cycles based on nBr 702420103
adjustment
no adjustment for real-world driving conditions Because reported co2 emissions are assumed to be zero for ethanol adjustments were made to account for tailpipe co2 emissions for vehicles running on ethanol
since 2010 published values include real-world adjustment factors to chassis test data a method adopted by the us ePa in 2008
Conversion to MJkm
iBaMarsquos data are reported as FtP (city test) co2 data in gco2 km conversion to caFe test cycle and to a different metric (Mjkm) involves four steps as presented in Figure D-1
inMetrorsquos data in kml are presented separately by fuel type (e22 e100) and driving cycle (urban highway) conversion to Mjkm was done by applying a conversion factor (2167 gco2 l for e22 and 1428gco2l for e00) caFe values are obtained by using a 5545 weighting for the urban (FtP) and highway cycles respectively
1 iBaMa (2014) nota Verde program available at httpwwwmmagovbrcidades-sustentaveisqualidade-do-arcontrole-de-emissoes-veicularesnota-verde
2 inMetro (2014) Programa Brasileiro de etiquetagem Veicular (PBeV) available at httpwwwinmetrogovbrconsumidortabelas_pbe_veicularasp
3 inMetro (2014) Metodologia Para Divulgaccedilatildeo De Dados De consumo Veicular available at httpwwwinmetrogovbrconsumidorpbeMetodologia_consumo_Veicularpdf
53
ICCT white paper
Step 1 Correcting the original IBAMA CO2 reported data ndash FTP CO2 gkm
IBAMArsquos CO2 reported values are corrected to account for tailpipe emissions from ethanol (tailpipe CO2 emissions are reported as zero in IBAMArsquos data)
bull E22 FTP reported CO2 data are reduced by 177bull E100 FTP reported CO2 data are reduced by 100
Flex fuel vehicles are tested with E22 and E00 the final values is calculated as the average of both fuelsCO2 IBAMA_Flex_FTP= 05(1-0177)CO2_E22_test_FTP + 050E100_FTP = 050823CO2_E22_FTPFor Gasoline only vehicles the tests are carried out only with Gasoline E22CO2 IBAMA_Gasoline_FTP = (1-0177) CO2_E22_Test_FTP
Where in the previous equations CO2_E22_FTP means CO2 emissions values obtained under FTP testingCO2 IBAMA_Flex_FTP means IBAMArsquos Corrected FTP values for flex vehiclesCO2 IBAMA_Gasoline_FTP means IBAMArsquos Corrected FTP values for gasoline only (E22) vehicles
INNOVAR AUTO is based on energy consumption data obtained as the combined CAFE test cycle This requires a weighted average of energy consumption data obtained from FTP testing (city driving ) and Highway fuel economy testing (HWFET) In mathematical form CAFE=f(FTPHWFET)
Given that IBAMA data is provided for only the first aprt the FTP testing then it is required to find a way to calculate CAFE combined values through FTP -75 only data A linear function was thus developed from data with FTP and HWY values (INMETRO data) is used to convert FTP only values to CAFE CO2 values ie CAFE=f(FTP) The function used for this conversion is
CO2_CAFE= (CO2_FTP+44756)11572
Step 2Convert FTP CO2 values to CAFE CO2 values
Converting CO2 values to MJkm values is done by using the energy density of E22 Note that all the previous calculations for CO2 come from E22-based data
bull The energy density of E22 is 2894 MJLE22bull E22 emits 2167gCO2LE22bull CAFE (MJkm) = CAFE (gCO2km) (2894 MJLE22 2167 gCO2LE22)
Step 3 Convert US CAFE CO2 values to MJkm values
Figure D‑1 ndash conversion of emission to energy consumption data
energy consumption values calculated from iBaMa and inMetro data differ greatly Figure D-1 illustrates energy consumption data for those models in both databases iBaMa data are on average 126 higher than inMetro data with a standard deviation of 89 and a maximum deviation of 39
54
Brazil Passenger Vehicle Market statistics
0
05
1
15
2
25
3
0 05 1 15 2 25 3
Ene
rgy
cons
ump
tio
n IB
AM
A (
MJ
km)
Energy consumption INMETRO (MJkm)
n=151
Figure D‑2 ndash comparison between energy consumption data from inMetro and iBaMa
151 vehicles tested under both programs
although inMetro data are more transparent as it breaks down fuel economy by fuel and test cycle it is still a voluntary program that allows manufacturers to select which models will participate in addition not all manufacturers participate in the program in turn iBaMa data only include co2 data for the urban cycle and thus energy consumption in the combined cycle had to be estimated from correlations using international data in addition corrections had to be made for gasoline-only engines since it seems that a co2 discount in theory only applicable to flex-fuel engines was also applied to gasoline-only engines Despite these data quality issues iBaMa data were considered the most adequate data source for energy consumption because it is a mandatory program that requires data reporting by all vehicle models and manufacturers
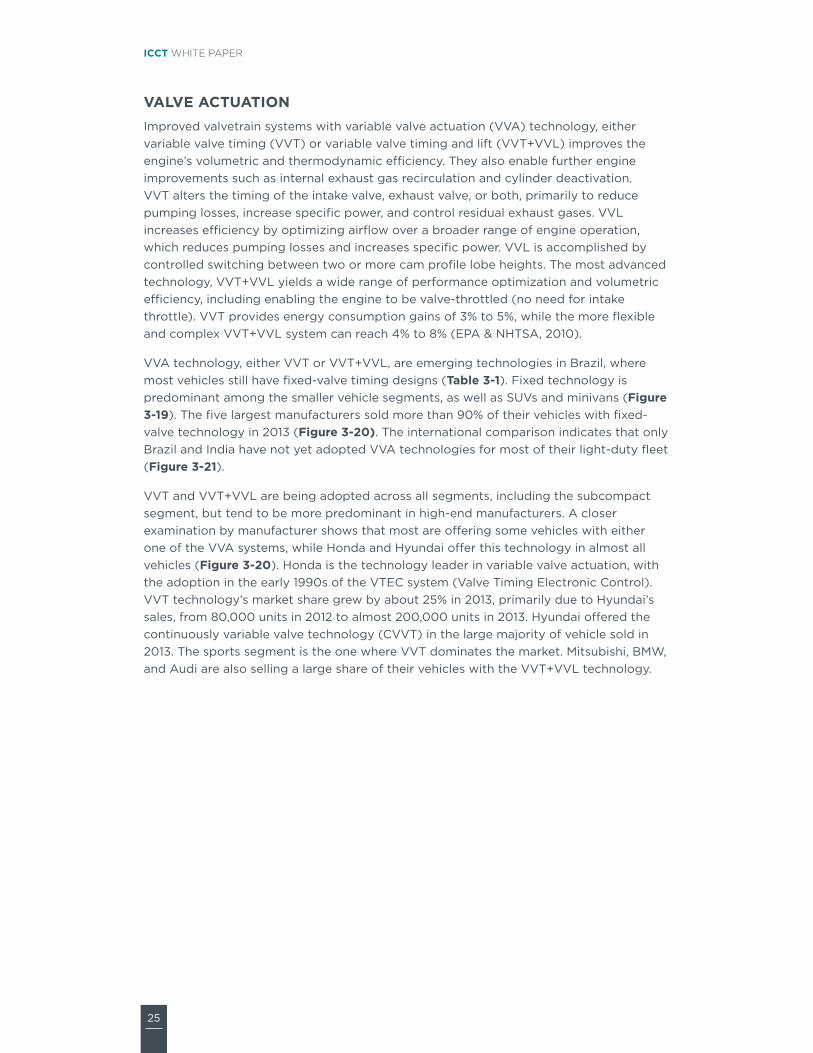
25
ICCT white paper
VaLVE aCTUaTiON improved valvetrain systems with variable valve actuation (VVa) technology either variable valve timing (VVt) or variable valve timing and lift (VVt+VVl) improves the enginersquos volumetric and thermodynamic efficiency they also enable further engine improvements such as internal exhaust gas recirculation and cylinder deactivation VVt alters the timing of the intake valve exhaust valve or both primarily to reduce pumping losses increase specific power and control residual exhaust gases VVl increases efficiency by optimizing airflow over a broader range of engine operation which reduces pumping losses and increases specific power VVl is accomplished by controlled switching between two or more cam profile lobe heights the most advanced technology VVt+VVl yields a wide range of performance optimization and volumetric efficiency including enabling the engine to be valve-throttled (no need for intake throttle) VVt provides energy consumption gains of 3 to 5 while the more flexible and complex VVt+VVl system can reach 4 to 8 (ePa amp nhtsa 2010)
VVa technology either VVt or VVt+VVl are emerging technologies in Brazil where most vehicles still have fixed-valve timing designs (Table 3‑1) Fixed technology is predominant among the smaller vehicle segments as well as suVs and minivans (Figure 3‑19) the five largest manufacturers sold more than 90 of their vehicles with fixed-valve technology in 2013 (Figure 3‑20) the international comparison indicates that only Brazil and india have not yet adopted VVa technologies for most of their light-duty fleet (Figure 3‑21)
VVt and VVt+VVl are being adopted across all segments including the subcompact segment but tend to be more predominant in high-end manufacturers a closer examination by manufacturer shows that most are offering some vehicles with either one of the VVa systems while honda and hyundai offer this technology in almost all vehicles (Figure 3‑20) honda is the technology leader in variable valve actuation with the adoption in the early 1990s of the Vtec system (Valve timing electronic control) VVt technologyrsquos market share grew by about 25 in 2013 primarily due to hyundairsquos sales from 80000 units in 2012 to almost 200000 units in 2013 hyundai offered the continuously variable valve technology (cVVt) in the large majority of vehicle sold in 2013 the sports segment is the one where VVt dominates the market Mitsubishi BMW and audi are also selling a large share of their vehicles with the VVt+VVl technology
26
Brazil Passenger Vehicle Market statistics
0
10
20
30
40
50
60
70
80
90
100
Subco
mpac
t
Compac
t
Medium
Larg
eSport
O-Road SUV
Miniva
nTo
tal
Tech
nolo
gy
shar
e
VVT+VVL VVT Fixed
Figure 3‑19 ndash Valve actuation by segment
0
10
20
30
40
50
60
70
80
90
100
Fiat GM
Volkswag
enFord
Renau
lt
Hyund
ai
Honda
Toyo
taPSA
Nissan
Mitsub
ishi
KIAJA
CBMW
Land
Rove
r
Merce
des-B
enz
Chery
Audi
Suzuk
iJe
epTo
tal
Tech
nolo
gy
shar
e
VVT+VVL VVT Fixed
Figure 3‑20 ndash Valve actuation by manufacturer
VVT+VVL VVT Fixed
0
10
20
30
40
50
60
70
80
90
100
China2010
Korea2011
US2013
Japan2011
India2012
Brazil2013
Tech
nolo
gy
shar
e
Figure 3‑21 ndash Valve actuation international comparison
27
ICCT white paper
FUEL SYSTEMS FOR GaSOLiNE VEhiCLESVehicle fuel systems describe the technology required to deliver fuel into the engine combustion chamber this section examines two gasolineflex technologies namely multi-point fuel injection (MPFi) and gasoline direct injection (gDi) MPFi is now the most common fuel-delivery system for gasoline engines used in passenger vehicles worldwide in sequential MPFi engines fuel is injected into the air stream next to the intake valve port while the intake valve is open to draw the air-fuel mixture into the cylinder some of the fuel is vaporized on the surface of the hot intake valve expanding and thus reduces the volumetric efficiency on gDi engines fuel is injected at high pressure directly into the combustion chamber improving volumetric efficiency and providing cooling of the airfuel charge within the cylinder which allows for higher compression ratios and increased thermodynamic efficiency gDi technology alone offers benefits of 2 to 5 with respect to MPFi engines but bigger benefits rely on the synergy between gDi turbocharging and downsizing which can reach 12 to 15 energy consumption reduction with respect to a MPFi naturally aspirated engine (ePa 2012)
Table 3‑1 illustrates that MPFi is still the most common fuel injection technology for gasolineflex vehicles in Brazil which is reflected in its dominant share across most segments except for sports and off-road vehicles in Brazil gDi has found a niche market in the sports and off-road segments with more than 90 of sport vehicles fitted with gDi technology (Figure 3‑22) Within the overall gasoline market the gDi technology is still an emerging technology representing just 24 of new sales gDirsquos market share increased by 31 in 2013 with all but 4000 units being imported among the 10 largest manufacturers the adoption of gDi is extremely low below 5 for Volkswagen Ford hyundai and Psa (Figure 3‑23) high-end european brands (audi land rover Mercedes-Benz and BMW) are the technology leaders in terms of gDi adoption rates echoing the trend of turbocharging technology sales Volkswagen vehicles with gDi systems account for less than 35 of their sales in 2013 but their absolute numbers (around 19000 vehicles) place the company as one of the leaders in gDi technology in the Brazilian market
From a global market perspective the penetration of gDi technology in Brazil is low compared to all other markets in Figure 3‑24 except for india and japan it should be noted that the later has the largest share of hybrid vehicles around the globe
28
Brazil Passenger Vehicle Market statistics
0
10
20
30
40
50
60
70
80
90
100
Compac
t
Subco
mpac
t
Medium
Larg
eSport
O-Road SUV
Miniva
nTo
tal
Tech
nolo
gy
shar
e
GDI MPFI
Figure 3‑22 ndash gasolineflex fuel system by segment
GDI MPFI
0102030405060708090
100
Fiat GM
Volkswag
enFord
Renau
lt
Hyund
ai
Honda
Toyo
taPSA
Nissan
Mitsub
ishi
KIAJA
CBMW
Land
Rove
r
Merce
des-B
enz
Chery
Audi
Suzuk
iJe
epTo
tal
Tech
nolo
gy
shar
e
Figure 3‑23 ndash gasolineflex fuel system by manufacturer
GDI MPFI
0
10
20
30
40
50
60
70
80
90
100
China2010
Korea2011
EU-272013
US2013
Japan2011
India2012
Brazil2013
Tech
nolo
gy
shar
e (n
on-
die
sel)
Figure 3‑24 ndash gasolineflex fuel system international comparison
29
ICCT white paper
TURBOChaRGiNGengine power is primarily limited by the rate at which the engine is able to draw air into the combustion chamber turbocharging and supercharging are two methods to increase the amount of air drawn into the engine above the level of what is possible with the naturally aspirated process (through the expansion of the cylinders) By increasing the amount of air into the engine the amount of fuel can be proportionally increased resulting in increased power output level and with it the ability to reduce engine displacement while maintaining performance the combination of turbocharging and downsizing in spark ignited (gasoline and flex-fuel) vehicles can provide energy consumption improvements between 2 to 6 with respect to a direct-injected gDi engine (ePa amp nhtsa 2010) turbocharging technology is the cornerstone for achieving better energy consumption in vehicles as the basis for downsizing and reducing the engine weight while keeping the same or better vehicle performance (ie acceleration or time to reach certain speed) although turbochargers are used in diesel and gasolineflex vehicles the analysis in this report focuses on turbocharging for spark-ignited gasolineflex vehicles only
turbocharging is one of the most important emerging technologies in Brazil where most vehicles are still naturally aspirated (na) (Table 3‑1) turbocharging technology has increased the market share significantly between 2012 and 2013 by more than 65 albeit from a small base (from about 49000 to 81000 vehicles)
Most vehicles with turbocharging are sold in the sports and off-road segments as this technology also produces superior engine power output (Figure 3‑25) among the 10 largest manufacturers turbocharging is still below 10 of their sales (Figure 3‑26) Volkswagen and Ford despite having small relative sales of vehicles with turbocharging (less than 35) are the manufacturers with the highest total sales of vehicles with turbocharging audi land rover Mercedes-Benz and BMW are the technology leaders with more than 90 of vehicle sales in 2013
the penetration of turbo and supercharging technologies in Brazil is lower than in other countries with a larger gasoline fleet such as the us china and japan (Figure 3‑27) in Brazil 95 of diesel passenger vehicle sales have turbocharging technology
30
Brazil Passenger Vehicle Market statistics
0
10
20
30
40
50
60
70
80
90
100
Compac
t
Subco
mpac
t
Medium
Larg
eSport
O-Road SUV
Miniva
nTo
tal
Tech
nolo
gy
shar
e (n
on-
Die
sel)
Turbo NA
Figure 3‑25 ndash turbocharging for gasolineflex fuel vehicles by segment (NA naturally aspirated)
0102030405060708090
100
Fiat GM
Volkswag
enFord
Renau
lt
Hyund
ai
Honda
Toyo
taPSA
Nissan
Mitsub
ishiKIA
JACBMW
Land
Rove
r
Merce
des-B
enz
Chery
Audi
Suzuk
iJe
epTo
tal
Tech
nolo
gy
shar
e (n
on-
Die
sel)
Turbo NA
Figure 3‑26 ndash turbocharging for gasolineflex fuel vehicles by manufacturer (NA naturally aspirated)
0
10
20
30
40
50
60
70
80
90
100
China2010
Korea2011
EU-272013
US2013
Japan2011
India2012
Brazil2013
Tech
nolo
gy
shar
e (n
on-
die
sel)
Turbo NA
Figure 3‑27 ndash turbocharging for gasolineflex fuel vehicles international comparison (NA naturally aspirated)
31
ICCT white paper
4 vEhiCLE ENErGy CONSuMpTiON
this section analyzes the Brazilian new passenger vehicle energy consumption in 2013 although other metrics are more common (see box) vehicle energy consumption is presented in megajoules per kilometer (Mjkm) for consistency with Brazilrsquos inovar-auto policy in 2012 Brazilrsquos Ministry of Development industry and Foreign trade (MDic) adopted the inovar-auto policy with the aim of fostering industrial competitiveness through technology investments the policy includes a target for corporate average energy consumption (in Mjkm with vehicle curb weight as the attribute parameter) for vehicles sold in 2017
in the us canada Mexico and saudi arabia fleet-average fuel economy standards are defined as a function of vehicle footprint in the eu china japan south Korea and india vehicle weight is the attribute for the calculation of fleet-average targets in Brazil inovar-auto has defined its fiscal targets for vehicle energy consumption measured in megajoules per kilometer (Mjkm) as a function of vehicle weight
VEhiCLE ENERGY MEaSUREMENT UNiTS
Many metrics can be used to describe the amount of fuel energy or emissions generated by unit of distance traveled
Fuel economy measures distance traveled per unit of fuel consumed in Brazil kilometers per liter (kml) is the most common metric to describe vehicle efficiency but other units are used in different countries such as miles per gallon (mpg) in the us
Fuel consumption is the reciprocal of fuel economy and measures fuel consumed per distance traveled it is usually expressed in liters per 100 kilometers (l100 km) and it is used in europe for example
GhGCO2 emissions measures ghg or co2 emissions per distance traveled expressed as grams of pollutant per kilometer or mile
Energy consumption (EC) measures the energy consumed per distance traveled for example in megajoules per kilometer Despite being a less common metric it is sometimes preferred for being a fuel-neutral metric across different types of fuel and vehicle technologies Vehicle energy consumption in Mjkm is the metric used in Brazilrsquos inovar-auto policy to quantify the corporate average energy consumption target for each manufacturer Values for energy consumption in Brazilian spark-ignited vehicles are provided for e22 since that is the fuel mixture used in vehicle tests
Vehicle energy consumption in this report is calculated from co2 emissions data in the Brazilian institute of environment and renewable natural resources (iBaMa) nota Verde program (iBaMa 2014) which reports official emissions data from homologation tests Data are limited to passenger cars sold by the top 10 manufacturers with light commercial vehicles being excluded appendix D presents a description of data sources
32
Brazil Passenger Vehicle Market statistics
and calculation methodologies as well as a discussion of vehicle energy consumption data quality and completeness in Brazil
not surprisingly vehicle energy consumption increases with vehicle footprint and engine rated power the two parameters that define vehicle segments in Brazil (Figure 4‑1) subcompact and compact vehicles which accounted for about 45 of new sales in 2013 have average energy consumption below the fleet average while medium-sized vehicles which hold the largest market share (388) have energy consumption just above the fleet average larger more powerful vehicles consume more energy than the fleet average but have a considerably smaller market share (combined share of 163) Data availability for these segments is not as extensive as the data available for the subcompact compact and medium segments which could affect the relative rankings of each segment
Ene
rgy
cons
ump
tio
n (M
Jkm
)
Subco
mpac
t
Compac
t
Medium
Larg
e
O-road SUV
4000
200000
400000
600000
850000
35
30
25
20
15
10
05
0
Sales
Total 202
Figure 4‑1 ndash new vehicle sales-weighted average energy consumption by segment (2013)
33
ICCT white paper
Figures 4‑2 and 4‑3 illustrate new vehicle energy consumption for multiple weight and footprint bins For each weight bin (in 100 kg increments) and footprint bin (in 01 m2 increments) sales-weighted averages of energy consumption for each vehicle version are presented (dashes) generating energy consumption ranges for each bin (cream areas) Vehicle sales by bin are presented for reference in the lower charts
the strong correlation between vehicle energy consumption and weight follows from the strong physical relationship between the weight of the vehicle and the energy required to accelerate it and overcome resistances9 (Figure 4‑2) Data dispersion within each bin suggests that energy consumption varies due to other vehicle characteristics that affect vehicle aerodynamics and rolling resistance as well as the adoption of technologies that affect engine and transmission efficiency (eg friction reduction technologies gDi VVt)
Curb weight (kg)
SubcompactCompactMediumLargeO-roadSUV
Ene
rgy
cons
ump
tio
n (M
Jkm
)Sa
les
5
6
4
3
2
1
600k
800k
400k
200k
0k800 900 1000 1100 1200 1300 1400 1500 1600 1700 1800 1900 2000 2100
Figure 4‑2 ndash new vehicle energy consumption by vehicle weight (2013)
9 on a plain surface the sum of resistances of a vehicle is acceleration resistance + rolling resistance + aerodynamic resistance = c1 m a + c2 frr m + c3 cw a v2 with mass (m) as an integral part of both acceleration and rolling resistance which are most relevant for inner-city driving situations other factors are acceleration (a) rolling resistance of tires (frr) aerodynamic coefficient of the vehicle (cw) frontal area of vehicle (a) velocity (v) and constants (cx)
34
Brazil Passenger Vehicle Market statistics
Footprint has a reasonable correlation with energy consumption (Figure 4‑3) ie larger vehicles tend to consume more fuel than smaller vehicles however the correlation is not as strong as with vehicle weight similar to the previous figure the broad spread of energy consumption values suggests a combination of different vehicle characteristics (eg weight engine displacement rated power) and technologies (eg transmissions fuel systems) as well as the presence of suVs and off-road vehicles among the medium- and large-sized footprint values respectively
Footprint (m2)
SubcompactCompactMediumLargeO-roadSUV
Ene
rgy
cons
ump
tio
n (M
Jkm
)Sa
les
5
6
4
3
2
1
400k
500k
300k
200k
100k
0k31 32 33 34 35 36 37 38 39 40 41 42 43 44 45 46 48 49
Figure 4‑3 ndash new vehicle energy consumption by vehicle footprint (2013)
35
ICCT white paper
Figure 4‑4 illustrates sales weighted average for new vehicle energy consumption by mass for the top 10 manufacturers in Brazil in 2013 Bubble sizes are proportional to total vehicle sales Manufacturers in the lower-left quadrant produce the lightest and most efficient vehicles with hyundai presenting the best overall average energy consumption renault in the upper-left quadrant produces vehicles that are equivalent in weight but on average with higher energy consumption in the lower-right quadrant are manufacturers that produce relatively heavier vehicles but with lower energy consumption in their weight class Despite producing heavier vehicles on average than many manufacturers honda achieves lower energy consumption on average in the upper-right quadrant are manufacturers that produce on average the heavier and least efficient vehicles with Psa (citroen and Peugeot) producing the heaviest and least efficient cars on average a regression line correlating vehicle energy consumption and mass highlights the best performers (hyundai honda and nissan) average performers (Fiat Volkswagen gM and toyota) and those performing worse than average (renault Ford and Psa)
FIA
GMVW
FORREN
HYU
HON
TOY
PSA
NIS
160
170
180
190
200
210
220
230
240
250
950 1000 1050 1100 1150 1200 1250 1300 1350
Ene
rgy
cons
ump
tio
n (M
Jkm
)
Curb weight (kg)
Fleet Ave
Figure 4‑4 ndashaverage new vehicle sales-weighted energy consumption by manufacturer (2013)
36
Brazil Passenger Vehicle Market statistics
Figure 4‑5 shows fleet-average energy consumption based on certification and type approval data for new vehicles in multiple countries converted to the us caFe combined driving cycle Bubble sizes represent total sales of new passenger cars Because of data availability in different countries the country comparison is based on different calendars years for different countries 2011 for south Korea and japan 2012 for china and india and 2013 for europe the us and Brazil given annual improvements in vehicle energy consumption triggered by regulatory efficiency standards and fiscal incentives those countries with older data could be at a slight disadvantage in this comparison
With the heaviest vehicles on average the us fleet is also the most energy consuming of all countries china and south Korea have similar average energy consumption but since south Korean vehicles are heavier on average they are relatively more efficient than chinese vehicles although Brazilrsquos fleet consumes less fuel on average than those from the us china and south Korea its fleet is relatively inefficient when compared to countries with vehicles of similar weight (japan and india) the average Brazilian vehicle consumes about 34 more energy than the average vehicle in japan whose fleet has a large penetration of gasoline hybrid and advanced fuel-efficiency technologies such as three-cylinder engines VVa Dohc and 6-plus speed transmissions european vehicles are the best performing on average despite being heavier than all countries with the exception of the us and south Korea the adoption of fuel-efficiency technologies (eg Dct 6-plus-speed transmissions gDi turbocharging) contributes to europersquos better than average performance
China2012
SKorea2011
Europe2013
US2013
Japan2011
India2012
Brazil2013
Sales5 MM10 MM
14
16
18
20
22
24
26
28
1000 1100 1200 1300 1400 1500 1600 1700
Ene
rgy
cons
ump
tio
n ndash
CA
FE
(M
Jkm
)
Curb weight (kg)
Type-approval and certification energy consumption data only (does not include o-cycle or real-world driving data)
Figure 4‑5 ndash international comparison of passenger car energy consumption
Country labels indicate the dataset year
Figure 4‑6 provides a more detailed country comparison by illustrating average vehicle energy consumption by vehicle (curb) weight bin Vehicle sales in each bin are shown for reference the us is not shown due to lack of detailed model-by-model data Brazilrsquos vehicles on average have the highest energy consumption in most weight
37
ICCT white paper
bins with china being the second highest in most bins Because china has higher fuel consumption than Brazil on the 1000 bin which represents the highest share of vehicle sales fleet-average energy consumption in china is still higher than in Brazil as illustrated in the previous figure europe consistently performs best in terms of vehicle energy consumption in most weight bins with japan also performing relatively well
Curb weight (kg)
BrazilChinaEuropeIndiaJapanSouth Korea
Ene
rgy
cons
ump
tio
n C
AF
E (
MJ
km)
Sale
s
40
35
25
20
15
10
6M
8M
4M
2M
0M600 800 1000 1200 1400 1600 1800 2000 2200 2400
Figure 4‑6 ndash international comparison of average vehicle energy consumption by vehicle weight
Type-approval and certification energy consumption data only (does not include off-cycle or real-world driving data)
38
Brazil Passenger Vehicle Market statistics
Figure 4‑7 illustrates the distribution of energy consumption data in Brazil for each vehicle version by mass and segment Bubble sizes represent total sales of each version Data were limited to flex-fuel vehicles in the subcompact compact medium and large segments due to its relatively better data quality and representativeness (ie they represented over 87 of sales in 2013) While most vehicles follow a predictable trend that correlates energy consumption and vehicle mass there are a large number of versions with energy consumption substantially higher than the trend line this suggests there is substantial room for improvements in their energy consumption since there are vehicles in similar weight classes with substantially superior energy consumption performance
Sales1000050000
140
160
180
200
220
240
260
280
700 800 900 1000 1100 1200 1300 1400 1500 1600
Ene
rgy
cons
ump
tio
n (M
Jkm
)
Curb weight (kg)
Subcompact Compact Medium Large Fleet average
Figure 4‑7 ndash Distribution of new Brazilian passenger vehicle energy consumption data by vehicle weight and segment (2013)
this chapter suggests that there are potential improvements in vehicle energy consumption for the Brazilian fleet For similar vehicles in terms of weight class footprint or engine rating there is substantial dispersion in energy consumption indicating that there are vehicles performing much worse than the average across manufacturers there is also a clear trend of some manufacturers performing much better than the average while others have a lot more room for improvement the international comparison clearly shows that Brazilian vehicles perform much worse in terms of energy consumption than vehicles of similar weight suggesting a delay in the adoption of energy efficient technologies among Brazilian vehicle manufacturers
Finally a more detailed analysis of vehicle versions clearly illustrates a considerable number of vehicle versions significantly above average thus indicating potential improvements in energy consumption that would place them on par with better performing vehicles with similar characteristics
39
ICCT white paper
Deficiencies in data quality and completeness prevent more definite conclusions about vehicle energy consumption gasoline-only vehicles in particular have poor energy consumption data quality although they represent a relatively small fraction (6) of total vehicles sold in 2013 Because some vehicle segments are primarily composed of gasoline-only vehicles (eg sports minivans) this chapter excludes these segments from the analysis there are also concerns about the gap between energy consumption data reported by iBaMarsquos nota Verde and Brazilrsquos national institute of Metrology standardization and industrial Qualityrsquos (inMetro) labeling program (PBeV using its acronym in Portuguese) with the latter reporting consistently lower values of vehicle energy consumption
Finally the availability of energy consumption data was not adequate for many manufacturers beyond the top 10 sales group which prevented their inclusion in this analysis Despite the data quality and lack of completeness the energy consumption data in this chapter include data that are reasonably accurate and representative thus supporting its interpretation
40
Brazil Passenger Vehicle Market statistics
rEfErENCES
aDK automotive consultoria de Marketing (2013) relatoacuterios de volumes de vendas do mercado brasileiro para veiacuteculos de passeio e comerciais leves referentes a 2013
alves l Wilbert M (2014) reduccedilatildeo do imposto sobre Produto industrializado e a Venda de automoacuteveis Xi congresso usP iniciaccedilatildeo cientiacutefica em contabilidade
associaccedilatildeo nacional de transportes Puacuteblicos (antP 2014) estudo mostra baixo efeito do desconto no iPi de veiacuteculos sobre PiB e emprego available at httpwwwantporgbrwebsitenoticiasshowaspnpgcode=a4DeeFe8-a7BF-48D3-B1F5-8eDe1447BF10
associaccedilatildeo nacional dos Fabricantes de Veiacuteculos automotores (anFaVea 2015) anuaacuterio da induacutestria automobiliacutestica Brasileira 2015 Brazilian automotive industry Yearbook 2015 satildeo Paulo available at wwwanfaveacombr
european environment agency (2014) Monitoring co2 emissions from new passenger cars in the eu summary of data for 2013 april 2014
instituto Brasileiro do Meio ambiente e dos recursos naturais renovaacuteveis (iBaMa 2014) consulta dos niacuteveis de emissatildeo dos veiacuteculos novos brasileiros available at httpsservicosibamagovbrctfpublicosel_marca_modelo_rvepphp
international council on clean transportation (icct 2015) global passenger vehicle standards available at httpwwwtheicctorginfo-toolsglobal-passenger-vehicle-standards
international energy agency (iea 2015) renewables Bioenergy available at httpswwwieaorgtopicsrenewablessubtopicsbioenergy
Korea energy Management corporation (KeMco 2014) Fuel economy regulation available at httpwwwkemcoorkrnew_engmainmainasp
Marklines (2015) Marklines automotive industry Portal available at httpwwwmarklinescomen
Mendonccedila M sachsida a (2014) Modelando a demanda de creacutedito para veiacuteculos no Brasil uma abordagem com mudanccedila de regime iPea
Ministeacuterio do Desenvolvimento induacutestria e comeacutercio exterior (MDic 2013) Programa de incentivo agrave inovaccedilatildeo tecnoloacutegica e adensamento da cadeia Produtiva de Veiacuteculos automotores mdash inovar-auto httpwwwplanaltogov brccivil_03_ato2011-20142012DecretoD7819htm
stein r anderson j and Wallington t (2013) an overview of the effects of ethanol-gasoline Blends on si engine Performance Fuel efficiency and emissions SAE Int J Engines 6(1)470-487 2013 doi1042712013-01-1635
us environmental Protection agency and national highway traffic safety administration (ePanhtsa 2010) Final rulemaking to establish light-Duty Vehicle greenhouse gas emission standards and corporate average Fuel economy standards ePa-420-r-10-901
us environmental Protection agency (ePa 2012) regulatory impact analysis Final rulemaking for 2017-2025 light-Duty Vehicle greenhouse gas emission standards and corporate average Fuel economy standards ePa-420-r-12-016
41
ICCT white paper
us national academy of sciences (nas 2011) assessment of Fuel economy technologies for light-Duty Vehicles available at httpwwwnapeducatalog12924assessment-of-fuel-economy-technologies-for-light-duty-vehicles
World Bank group (2015) World Development indicators available at httpdataworldbankorgdata-catalogworld-development-indicators
42
Brazil Passenger Vehicle Market statistics
LiST Of ACrONyMS
4wD Four-wheel drive
aNFaVEa Brazilian association of automobile Manufacturers
awD all-wheel drive
BRiC Brazil russia india china
CaFE corporate average fuel economy
CBG compressed biogas
CO2 carbon dioxide
CVT continuously variable transmission
CVVT continuously variable valve technology
DCT Dual-clutch transmission
DOhC Dual overhead camshaft
EC energy consumption
Epa us environmental Protection agency
EU european union
FFV Flex-fuel vehicle
FTp Federal test procedure
FwD Front-wheel drive
GDi gasoline direct injection
GDp gross domestic product
GhG greenhouse gas
GM general Motors
iBaMa Brazilian institute of the environment and renewable natural resources
iC internal combustion
iCCT international council on clean transportation
iNMETRO national institute of Metrology standardization and industrial Quality
Kg Kilogram
Km Kilometer
Kw Kilowatt
LDV light-duty vehicle
LpG liquified petroleum gas
MDiC Ministry of Development industry and Foreign trade
MJ Megajoule
MpFi Multi-point fuel injection
Mpg Miles per gallon
NaS us national academy of sciences
43
ICCT white paper
NhTSa us national highway transportation safety administration
OhV overhead valve
pBEV Brazilian Vehicle labeling Program
pSa Psa Peugeot citroeumln
pTwR Power-to-weight ratio
pV Passenger vehicle
RwD rear-wheel drive
SOhC single overhead camshaft
SUV sport utility vehicle
US united states
USD us dollar
VTEC Valve timing electronic control
VVa Variable valve actuation
VVL Variable valve lift
44
Brazil Passenger Vehicle Market statistics
AppENDix A SEGMENT DEfiNiTiONS
Table a‑1 ndash segment definitions
Segmentpower (kw)
pTwR (kwkg) area (m2)
Other characteristics Examples
Subcompact lt 140 lt 0075 le 65 mdash Mini cooper chevrolet celta smart Fortwo
Compact lt 140 lt 0075 65 lt area le 70 mdash honda Fit hyundai hB20 Volkswagen Polo
Medium lt 140 lt 0075 70 lt area le 80 mdash honda civic nissan tiida Peugeot 308
Large lt 140 lt 0075 gt 80 mdash audi a4 BMW 3 series Mercedes c-class
Sports gt 140 gt 0075 mdash 4 seats maxjaguar XF lamborghini gallardo Ferrari california
Off‑road mdash mdash lt 80 traction = 4WDjeep cherokee honda cr-V BMW X3 hyundai santa Fe
SUV mdash mdash lt 80Based on aDKrsquos default classification
BMW X1 Ford ecosport hyundai tucson
Minivan mdash mdash Passengers 6-12
citroen grand Picasso Kia carnival
45
ICCT white paper
AppENDix b iNTErNATiONAL MArKET DATA
Table B‑1 ndash international market comparison of new fleet characteristics
parameters China S Korea EU US Japan india Brazil
Year 2012 2011 2013 2013 2011 2012 2013
Sales (million) 155 13 118 156 352 256 304
price (USD) $21008 $21383 $24439 mdash $20637 $11717 $22015
No of cylinders mdash 43 40 47 38 36 40
Displacement (cc) 1605 1960 1613 2606 1425 1294 1430
Curb weight (kg) 1296 1421 1391 1623 1193 1059 1106
Length (mm) 4323 4531 4263 mdash 4013 3859 4100
Footprint (m2) 38 420 40 425 371 341 367
Engine power (kw) 86 120 89 148 78 55 76
pTwR (kwkg) 00664 00844 00640 00912 00654 00519 00671
Energy consumption ndash US CaFE (MJKm)[1] 235 206 169 250 171 183 202
[1] energy consumption data presented here for countries other than Brazil were obtained from local official sources in its original metric and drive cycle and then converted to Mjkm under the us caFe drive cycle using the methodology described in Yang (2015) Mode details and historical fuel consumption data on their original metrics is presented in the icctrsquos global PV standard website httpwwwtheicctorginfo-toolsglobal-passenger-vehicle-standards
Data Sources
China Ministry of industry and information technology (Miit 2014) corporate average Fuel efficiency accounting Method for Passenger cars available at httpwwwgovcngzdt2013-0320content_2358627htm
Baseline performance china automotive research and technology center through internal communication and icct internal 2010 database for chinese light-duty vehicles
S Korea internal communication with s Korean official and from greencarcongress available at httpwwwgreencarcongresscom200906korea-20090604html
EU european environment agency (2014) Monitoring co2 emissions from new passenger cars in the eu summary of data for 2013 april 2014
US us ePa (2014) light-duty automotive technology carbon dioxide emissions and fuel economy trends1975 through 2014 table 91 page 110 available at http httpwwwepagovfueleconomyfetrends1975-2014420r14023apdf
Japan jaMa (2010) the Motor industry of japan available at httpwwwjama-englishjppublicationsMVs2010pdf Mlit httpwwwmlitgojpcommon000990330pdf
india Bureau of energy efficiency white paper 2010-2012 calculation based on icct database
Brazil icct Brazil Vehicle Database (2013)
46
Brazil Passenger Vehicle Market statistics
Table B‑2 ndash international market comparison of technology adoption in new vehicles
Technology adoption China S Korea EU US Japan india Brazil
Year 2010 2011 2013 2013 2011 2012 2013
Fuel type
CBGLpGFlex 0 11 2 0 0 4 94
Gasoline 99 65 44 93 86 56 6
hybrid 0 1 1 5 13 0 0
Diesel 1 23 53 1 0 40 0
No of cylinders
Two 0 0 0 0 0 6 0
Three 4 0 7 0 36 28 3
Four 90 84 87 56 57 65 97
Five 0 0 1 0 0 0
Six 6 15 4 32 5 0 1
Eight or more 0 0 0 12 1 0 0
Transmission
Manual 60 3 83 5 1 98 83
automatic 34 90 9 75 34 2 15
CVT 5 7 2 18 65 0 1
DCT 1 0 6 2 mdash 0 1
Number of gear ratios
Four or fewer 13 16 1 7 mdash 10 6
Five 68 9 45 11 mdash 85 83
Six or more 19 75 54 82 mdash 5 11
Drivetrain
FwD 74 86 81 83 59 76 0
RwD 21 7 7 10 5 22 0
4wD and awD 5 7 12 7 36 2 100
No of valves per cylinder
Two 17 mdash mdash 2 4 25 60
Multi valve 83 mdash mdash 98 95 75 40
Valve camshaft configuration
Single overhead camshaft 26 1 mdash mdash 16 41 63
Dual overhead camshaft 74 84 mdash mdash 82 53 25
Overhead camshaft mdash 15 mdash mdash 0 6 mdash
Valve actuation
Fixed 50 16 mdash 2 11 86 78
VVT 44 84 mdash 98 89 12 16
VVL 6 mdash mdash mdash mdash 2 6
Fuel systems for gasoline vehicles
Multi‑point fuel injection 94 72 68 62 95 100 98
Gasoline direct injection 6 28 32 37 5 0 2
air induction systems for gasoline vehicles
Naturally aspirated 93 75 41 85 92 64 97
Supercharger turbocharger or twin‑turbo 7 25 59 15 8 36 3
47
ICCT white paper
AppENDix C NEW vEhiCLE ChArACTEriSTiCS AND TEChNOLOGy ADOpTiON DATA iN brAziL
Table C‑1 ndash Fleet characteristics of new Brazilian passenger vehicles by segment (2013)
parameters Subcompact Compact Medium Large Sports Off‑road SUV Minivan
Sales (thousands) 6785 6843 11790 1920 273 768 1997 23
Market share () 223 225 38 8 63 09 25 65 01
price (R$) $30103 $38732 $45496 $66508 $148834 $151284 $75164 $82284
No of cylinders 400 391 399 400 462 448 404 433
Displacement (cc) 1128 1293 1447 1794 2430 2586 1884 2244
Curb weight (kg) 940 1037 1102 1329 1561 1772 1395 1604
Length (mm) 3804 4026 4163 4499 4711 4516 4352 4658
Footprint (m2) 339 361 371 402 418 409 402 427
Engine power ndash gasoline (kw) 58 68 75 99 183 146 103 120
Engine power ndash ethanol (kw) 59 70 77 98 mdash 109 101 mdash
pTwR ndash gasoline (kwkg) 00614 00655 00671 00742 01173 00828 00731 00732
pTwR ndash ethanol (kwkg) 00630 00678 00697 00757 mdash 00766 00745 mdash
48
Brazil Passenger Vehicle Market statistics
Table C‑2 ndash Fleet characteristics of new Brazilian passenger vehicles by manufacturer (2013)
parameters Fiat
GM
Vo
lksw
agen
Ford
Ren
ault
hyu
ndai
ho
nda
Toyo
ta
pSa
Nis
san
Mit
sub
ishi
Kia
JaC
BM
w
Land
Rov
er
Mer
ced
es‑B
enz
Che
ry
aud
i
Suzu
ki
Jeep
Sales (thousands) 6087 5486 5448 3074 2207 2055 1392 1334 1163 621 368 255 158 141 106 94 80 67 63 36
Market share () 2002 1804 1792 1011 726 676 458 439 383 204 121 084 052 046 035 031 026 022 021 012
price (R$) $35017 $42259 $38701 $46174 $43447 $50112 $67078 $68922 $103001 $44035 $100696 $87009 $37654 $165111 $221943 $153281 $30821 $142799 $74769 $139039
No of cylinders 400 401 400 402 400 370 400 400 400 400 408 416 400 424 448 431 400 411 400 552
Displacement (cc) 1250 1340 1287 1497 1423 1495 1691 1808 1575 1579 2262 1856 1411 2095 2281 1934 1398 1912 1831 3182
Curb weight (kg) 1033 1060 1020 1156 1102 1122 1210 1201 1231 1069 1556 1377 1079 1624 1868 1598 1097 1551 1444 1945
Length (mm) 3965 4155 3993 4120 4127 4078 4319 4299 4116 4171 4401 4357 3956 4574 4487 4527 3896 4454 4234 4584
Footprint (m2) 345 370 354 368 378 383 397 387 376 379 395 407 351 429 433 429 349 417 323 420
Engine power ndash gasoline (kw) 64 71 65 79 73 86 96 90 80 82 120 112 83 151 179 138 71 136 94 162
Engine power ndash ethanol (kw) 65 72 65 79 76 85 97 90 81 82 107 106 95 mdash mdash mdash 75 mdash mdash mdash
pTwR ndash gasoline (kwkg)
00613 00662 00631 00674 00657 00739 00788 00745 00646 00766 00779 00792 00784 00921 00977 00856 00638 00870 00649 00835
pTwR ndash ethanol (kwkg) 00629 00681 00642 00693 00685 00781 00800 00795 00660 00768 00710 00798 00896 mdash mdash mdash 00659 mdash mdash mdash
49
ICCT white paper
Table C‑3 ndash Fleet characteristics of new Brazilian passenger vehicles by origin (2013)
parameters Domestic imported
Sales (thousands) 2537 504
Market share () 834 166
price (R$) $41739 $76049
No of cylinders 397 412
Displacement (cc) 1359 1791
Curb weight (kg) 1070 1289
Length (mm) 4063 4285
Footprint (m2) 362 390
Engine power ndash gasoline (kw) 70 102
Engine power ndash ethanol (kw) 73 84
pTwR ndash gasoline (kwkg) 0065 0076
pTwR ndash ethanol (kwkg) 0068 0074
50
Brazil Passenger Vehicle Market statistics
Table C‑4 ndash technology adoption in new Brazilian passenger vehicles by segment (2013)
Technology adoption Subcompact Compact Medium Large SportOff‑road SUV Minivan
Fuel type
Flex 982 988 982 837 00 134 826 00
Gasoline 18 12 17 163 996 540 174 1000
hybrid 0000 0000 0028 0000 0396 0001 0000 0000
Diesel 00 00 00 00 00 326 00 00
No of cylinders
Three 01 91 10 00 00 00 00 00
Four 999 909 990 998 758 775 979 833
Five 00 00 00 02 03 00 00 00
Six 00 00 00 00 175 211 21 167
Eight or more 00 00 00 00 63 13 00 00
Transmission
Manual 993 944 826 622 62 174 505 641
automatic 07 55 161 283 629 707 451 359
CVT 00 00 12 89 09 93 34 00
DCT 00 01 02 06 299 25 10 00
No of gear ratios
Four or fewer 04 47 72 51 00 34 247 193
Five 984 943 848 378 15 392 516 641
Six 12 09 73 515 796 462 225 167
Seven 00 01 06 23 87 53 12 00
Eight or more 00 00 01 32 102 59 00 00
Drivetrain
FwD 998 1000 997 688 550 00 916 1000
RwD 02 00 03 311 221 00 84 00
awD 00 00 00 01 229 1000 00 00
No of valves per cylinder
Two 806 694 584 195 00 00 258 00
Multi valve 194 306 416 805 1000 1000 742 1000
Valve camshaft configuration
Single overhead camshaft 839 786 709 309 00 212 375 00
Dual overhead camshaft 24 158 161 546 880 517 446 255
Valve actuation
Fixed 982 729 807 461 49 493 664 868
VVT 18 211 115 470 827 367 252 132
VVT+VVL 00 61 78 68 124 140 84 00
Fuel systems for gasoline vehicles
Multi‑point fuel injection 999 998 997 949 979 143 766 1000
Gasoline direct injection 01 02 03 51 21 857 234 00
air induction systems for gasoline vehicles
Naturally aspirated 999 997 995 943 974 369 543 1000
Supercharger turbocharger or twin‑turbo 01 03 05 57 26 631 457 00
51
ICCT white paper
Table C‑5 ndash technology adoption in new Brazilian passenger vehicles by manufacturer (2013)
Technology adoption Fi
aT
GM
VO
LKSw
aG
EN
FOR
D
REN
aU
LT
hY
UN
Da
i
hO
ND
a
TOYO
Ta
pSa
NiS
SaN
MiT
SUB
iSh
i
Kia
JaC
BM
w
LaN
D R
OV
ER
MER
CED
ES
Fuel type
Flex 990 987 965 966 997 921 999 886 928 998 283 739 31 42 00 00
Gasoline 10 09 35 34 03 79 01 35 72 02 557 255 969 957 663 950
hybrid 00 00 00 00 00 00 00 02 00 00 00 00 00 00 00 00
Diesel 00 04 00 00 00 00 00 77 00 00 160 06 00 00 337 50
No of cylinders
Three 00 00 05 00 00 348 00 00 00 00 00 00 00 00 00 00
Four 1000 996 994 989 1000 626 999 998 1000 1000 958 922 1000 906 787 878
Five 00 00 00 00 00 00 00 00 00 00 00 00 00 00 00 00
Six 00 02 01 11 00 26 01 02 00 00 42 78 00 68 185 87
Eight or more 00 02 00 00 00 00 00 00 00 00 00 00 00 26 28 35
Transmission
Manual 992 878 985 846 853 632 566 565 703 785 493 120 1000 02 00 151
automatic 08 103 00 137 62 285 355 160 297 121 118 793 00 575 18 14
CVT 00 19 15 16 41 70 01 246 00 00 139 87 00 423 982 836
DCT 00 00 00 00 43 13 78 30 00 94 251 00 00 00 00 00
No of gear ratios
Four or fewer 02 04 00 55 104 237 00 323 249 132 17 133 00 00 00 00
Five 981 811 963 839 797 623 861 643 684 828 530 107 1000 00 00 64
Six 17 185 29 106 99 140 139 07 67 40 453 754 00 217 800 00
Seven 00 00 07 00 00 00 00 27 00 00 00 00 00 08 00 936
Eight or more 00 00 00 00 00 00 00 00 00 00 00 06 00 775 200 00
Drivetrain
FwD 1000 902 989 972 987 985 990 892 1000 1000 496 623 1000 00 00 00
RwD 00 91 00 00 00 00 00 16 00 00 00 370 00 882 00 900
awD 00 06 11 28 13 15 10 92 00 00 504 07 00 118 1000 100
No of valves per cylinder
Two 811 864 988 745 220 00 00 00 00 00 00 00 00 00 00 00
Multi Valve 189 136 12 255 780 1000 1000 1000 1000 1000 1000 1000 1000 1000 1000 1000
Valve camshaft configuration
SOhC 836 755 914 675 832 00 04 00 497 398 331 00 00 00 00 00
DOhC 07 108 56 50 168 992 786 875 352 428 477 1000 907 810 860 453
Valve actuation
Fixed 1000 898 965 966 940 29 00 574 736 573 435 76 124 187 18 55
VVT 00 102 35 34 60 971 00 426 264 427 00 924 876 00 982 945
VVT+VVL 00 00 00 00 00 00 1000 00 00 00 565 00 00 813 00 00
air induction System
Naturally aspirated 997 994 966 977 997 988 1000 923 922 1000 835 936 1000 97 37 101
Supercharger turbocharger or twin‑turbo
03 06 34 23 03 12 00 77 78 00 165 64 00 903 963 899
Fuel systems for gasoline vehicles
Multipoint fuel injection 1000 995 965 972 1000 989 1000 1000 967 1000 994 1000 1000 78 15 158
Gasoline Direct injection 00 05 35 28 00 11 00 00 33 00 06 00 00 922 985 842
note Difference between 100 and summation of sohc and Dohc market share values corresponds to data not available
52
Brazil Passenger Vehicle Market statistics
AppENDix D DATA SOurCES AND COMpLETENESS
the basis of the statistics shown in this report is a database compiled by the icct with vehicle sales technical information (eg fleet characteristics technology content) and energy consumption (converted from either co2 emissions or fuel economy) from various data sources outlined in table D-1
Table D‑1 ndash Brazilian data sources
parameters Sales TechnicalEnergy
consumption
aDK (2014 2015) x x
MarkLines (2015) x
iBaMa (2014) x
iNMETRO (2014) x
UOL (2014) x
icarroscom (2014) x
this analysis examined energy consumption data from two public sources the nota Verde Program by the Brazilian institute of the environment and renewable natural resources (iBaMa) and the Brazilian Vehicle labeling Program (PBeV) by the national institute of Metrology standardization and industrial Quality (inMetro) table D-2 summarizes key differences between these two data sources
Table D‑2 ndash energy consumption data sources
iBaMa iNMETRO
program nota Verde1 Brazilian Vehicle labeling Program (PBeV)2
program description
Mandatory program that reports emissions of co2 co nox and nMhc as part of emissions certification program
Voluntary program since 2009 that allows the comparison of fuel economy across vehicle models
Unit gco2 km kml
Test cycle chassis testing under urban (FtP) driving cycle based on nBr 66012005
chassis testing under urban (FtP) and highway (hWYFe) driving cycles based on nBr 702420103
adjustment
no adjustment for real-world driving conditions Because reported co2 emissions are assumed to be zero for ethanol adjustments were made to account for tailpipe co2 emissions for vehicles running on ethanol
since 2010 published values include real-world adjustment factors to chassis test data a method adopted by the us ePa in 2008
Conversion to MJkm
iBaMarsquos data are reported as FtP (city test) co2 data in gco2 km conversion to caFe test cycle and to a different metric (Mjkm) involves four steps as presented in Figure D-1
inMetrorsquos data in kml are presented separately by fuel type (e22 e100) and driving cycle (urban highway) conversion to Mjkm was done by applying a conversion factor (2167 gco2 l for e22 and 1428gco2l for e00) caFe values are obtained by using a 5545 weighting for the urban (FtP) and highway cycles respectively
1 iBaMa (2014) nota Verde program available at httpwwwmmagovbrcidades-sustentaveisqualidade-do-arcontrole-de-emissoes-veicularesnota-verde
2 inMetro (2014) Programa Brasileiro de etiquetagem Veicular (PBeV) available at httpwwwinmetrogovbrconsumidortabelas_pbe_veicularasp
3 inMetro (2014) Metodologia Para Divulgaccedilatildeo De Dados De consumo Veicular available at httpwwwinmetrogovbrconsumidorpbeMetodologia_consumo_Veicularpdf
53
ICCT white paper
Step 1 Correcting the original IBAMA CO2 reported data ndash FTP CO2 gkm
IBAMArsquos CO2 reported values are corrected to account for tailpipe emissions from ethanol (tailpipe CO2 emissions are reported as zero in IBAMArsquos data)
bull E22 FTP reported CO2 data are reduced by 177bull E100 FTP reported CO2 data are reduced by 100
Flex fuel vehicles are tested with E22 and E00 the final values is calculated as the average of both fuelsCO2 IBAMA_Flex_FTP= 05(1-0177)CO2_E22_test_FTP + 050E100_FTP = 050823CO2_E22_FTPFor Gasoline only vehicles the tests are carried out only with Gasoline E22CO2 IBAMA_Gasoline_FTP = (1-0177) CO2_E22_Test_FTP
Where in the previous equations CO2_E22_FTP means CO2 emissions values obtained under FTP testingCO2 IBAMA_Flex_FTP means IBAMArsquos Corrected FTP values for flex vehiclesCO2 IBAMA_Gasoline_FTP means IBAMArsquos Corrected FTP values for gasoline only (E22) vehicles
INNOVAR AUTO is based on energy consumption data obtained as the combined CAFE test cycle This requires a weighted average of energy consumption data obtained from FTP testing (city driving ) and Highway fuel economy testing (HWFET) In mathematical form CAFE=f(FTPHWFET)
Given that IBAMA data is provided for only the first aprt the FTP testing then it is required to find a way to calculate CAFE combined values through FTP -75 only data A linear function was thus developed from data with FTP and HWY values (INMETRO data) is used to convert FTP only values to CAFE CO2 values ie CAFE=f(FTP) The function used for this conversion is
CO2_CAFE= (CO2_FTP+44756)11572
Step 2Convert FTP CO2 values to CAFE CO2 values
Converting CO2 values to MJkm values is done by using the energy density of E22 Note that all the previous calculations for CO2 come from E22-based data
bull The energy density of E22 is 2894 MJLE22bull E22 emits 2167gCO2LE22bull CAFE (MJkm) = CAFE (gCO2km) (2894 MJLE22 2167 gCO2LE22)
Step 3 Convert US CAFE CO2 values to MJkm values
Figure D‑1 ndash conversion of emission to energy consumption data
energy consumption values calculated from iBaMa and inMetro data differ greatly Figure D-1 illustrates energy consumption data for those models in both databases iBaMa data are on average 126 higher than inMetro data with a standard deviation of 89 and a maximum deviation of 39
54
Brazil Passenger Vehicle Market statistics
0
05
1
15
2
25
3
0 05 1 15 2 25 3
Ene
rgy
cons
ump
tio
n IB
AM
A (
MJ
km)
Energy consumption INMETRO (MJkm)
n=151
Figure D‑2 ndash comparison between energy consumption data from inMetro and iBaMa
151 vehicles tested under both programs
although inMetro data are more transparent as it breaks down fuel economy by fuel and test cycle it is still a voluntary program that allows manufacturers to select which models will participate in addition not all manufacturers participate in the program in turn iBaMa data only include co2 data for the urban cycle and thus energy consumption in the combined cycle had to be estimated from correlations using international data in addition corrections had to be made for gasoline-only engines since it seems that a co2 discount in theory only applicable to flex-fuel engines was also applied to gasoline-only engines Despite these data quality issues iBaMa data were considered the most adequate data source for energy consumption because it is a mandatory program that requires data reporting by all vehicle models and manufacturers
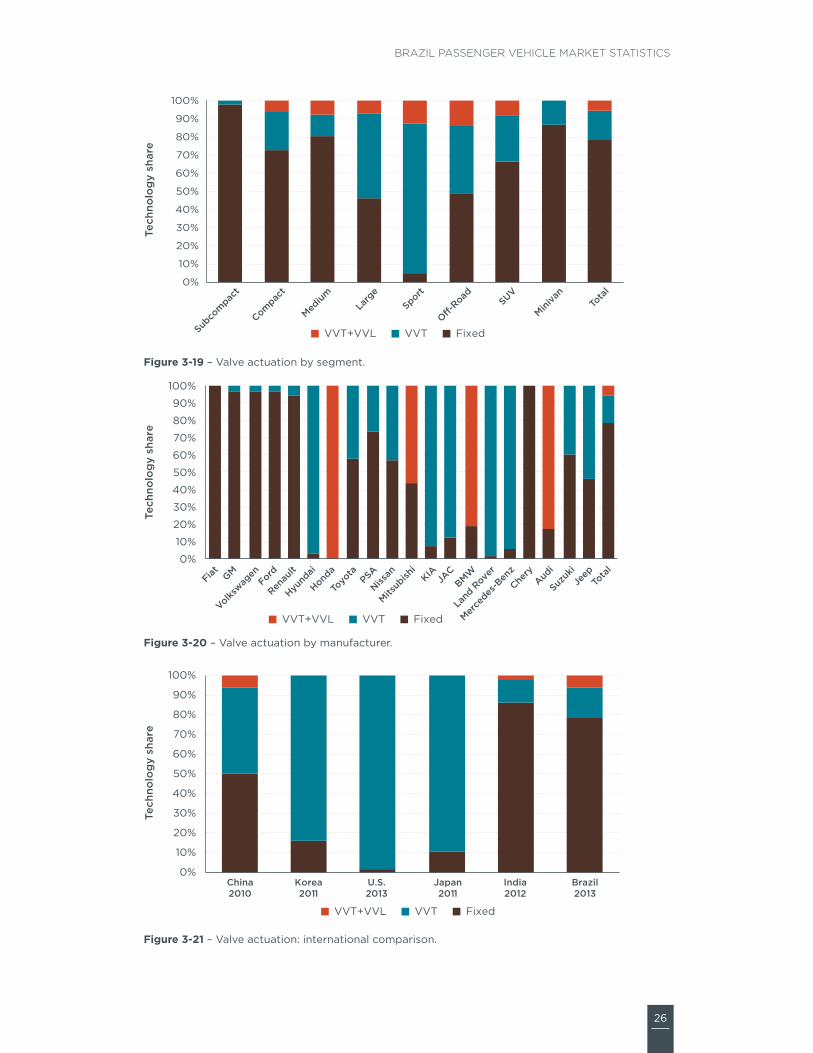
26
Brazil Passenger Vehicle Market statistics
0
10
20
30
40
50
60
70
80
90
100
Subco
mpac
t
Compac
t
Medium
Larg
eSport
O-Road SUV
Miniva
nTo
tal
Tech
nolo
gy
shar
e
VVT+VVL VVT Fixed
Figure 3‑19 ndash Valve actuation by segment
0
10
20
30
40
50
60
70
80
90
100
Fiat GM
Volkswag
enFord
Renau
lt
Hyund
ai
Honda
Toyo
taPSA
Nissan
Mitsub
ishi
KIAJA
CBMW
Land
Rove
r
Merce
des-B
enz
Chery
Audi
Suzuk
iJe
epTo
tal
Tech
nolo
gy
shar
e
VVT+VVL VVT Fixed
Figure 3‑20 ndash Valve actuation by manufacturer
VVT+VVL VVT Fixed
0
10
20
30
40
50
60
70
80
90
100
China2010
Korea2011
US2013
Japan2011
India2012
Brazil2013
Tech
nolo
gy
shar
e
Figure 3‑21 ndash Valve actuation international comparison
27
ICCT white paper
FUEL SYSTEMS FOR GaSOLiNE VEhiCLESVehicle fuel systems describe the technology required to deliver fuel into the engine combustion chamber this section examines two gasolineflex technologies namely multi-point fuel injection (MPFi) and gasoline direct injection (gDi) MPFi is now the most common fuel-delivery system for gasoline engines used in passenger vehicles worldwide in sequential MPFi engines fuel is injected into the air stream next to the intake valve port while the intake valve is open to draw the air-fuel mixture into the cylinder some of the fuel is vaporized on the surface of the hot intake valve expanding and thus reduces the volumetric efficiency on gDi engines fuel is injected at high pressure directly into the combustion chamber improving volumetric efficiency and providing cooling of the airfuel charge within the cylinder which allows for higher compression ratios and increased thermodynamic efficiency gDi technology alone offers benefits of 2 to 5 with respect to MPFi engines but bigger benefits rely on the synergy between gDi turbocharging and downsizing which can reach 12 to 15 energy consumption reduction with respect to a MPFi naturally aspirated engine (ePa 2012)
Table 3‑1 illustrates that MPFi is still the most common fuel injection technology for gasolineflex vehicles in Brazil which is reflected in its dominant share across most segments except for sports and off-road vehicles in Brazil gDi has found a niche market in the sports and off-road segments with more than 90 of sport vehicles fitted with gDi technology (Figure 3‑22) Within the overall gasoline market the gDi technology is still an emerging technology representing just 24 of new sales gDirsquos market share increased by 31 in 2013 with all but 4000 units being imported among the 10 largest manufacturers the adoption of gDi is extremely low below 5 for Volkswagen Ford hyundai and Psa (Figure 3‑23) high-end european brands (audi land rover Mercedes-Benz and BMW) are the technology leaders in terms of gDi adoption rates echoing the trend of turbocharging technology sales Volkswagen vehicles with gDi systems account for less than 35 of their sales in 2013 but their absolute numbers (around 19000 vehicles) place the company as one of the leaders in gDi technology in the Brazilian market
From a global market perspective the penetration of gDi technology in Brazil is low compared to all other markets in Figure 3‑24 except for india and japan it should be noted that the later has the largest share of hybrid vehicles around the globe
28
Brazil Passenger Vehicle Market statistics
0
10
20
30
40
50
60
70
80
90
100
Compac
t
Subco
mpac
t
Medium
Larg
eSport
O-Road SUV
Miniva
nTo
tal
Tech
nolo
gy
shar
e
GDI MPFI
Figure 3‑22 ndash gasolineflex fuel system by segment
GDI MPFI
0102030405060708090
100
Fiat GM
Volkswag
enFord
Renau
lt
Hyund
ai
Honda
Toyo
taPSA
Nissan
Mitsub
ishi
KIAJA
CBMW
Land
Rove
r
Merce
des-B
enz
Chery
Audi
Suzuk
iJe
epTo
tal
Tech
nolo
gy
shar
e
Figure 3‑23 ndash gasolineflex fuel system by manufacturer
GDI MPFI
0
10
20
30
40
50
60
70
80
90
100
China2010
Korea2011
EU-272013
US2013
Japan2011
India2012
Brazil2013
Tech
nolo
gy
shar
e (n
on-
die
sel)
Figure 3‑24 ndash gasolineflex fuel system international comparison
29
ICCT white paper
TURBOChaRGiNGengine power is primarily limited by the rate at which the engine is able to draw air into the combustion chamber turbocharging and supercharging are two methods to increase the amount of air drawn into the engine above the level of what is possible with the naturally aspirated process (through the expansion of the cylinders) By increasing the amount of air into the engine the amount of fuel can be proportionally increased resulting in increased power output level and with it the ability to reduce engine displacement while maintaining performance the combination of turbocharging and downsizing in spark ignited (gasoline and flex-fuel) vehicles can provide energy consumption improvements between 2 to 6 with respect to a direct-injected gDi engine (ePa amp nhtsa 2010) turbocharging technology is the cornerstone for achieving better energy consumption in vehicles as the basis for downsizing and reducing the engine weight while keeping the same or better vehicle performance (ie acceleration or time to reach certain speed) although turbochargers are used in diesel and gasolineflex vehicles the analysis in this report focuses on turbocharging for spark-ignited gasolineflex vehicles only
turbocharging is one of the most important emerging technologies in Brazil where most vehicles are still naturally aspirated (na) (Table 3‑1) turbocharging technology has increased the market share significantly between 2012 and 2013 by more than 65 albeit from a small base (from about 49000 to 81000 vehicles)
Most vehicles with turbocharging are sold in the sports and off-road segments as this technology also produces superior engine power output (Figure 3‑25) among the 10 largest manufacturers turbocharging is still below 10 of their sales (Figure 3‑26) Volkswagen and Ford despite having small relative sales of vehicles with turbocharging (less than 35) are the manufacturers with the highest total sales of vehicles with turbocharging audi land rover Mercedes-Benz and BMW are the technology leaders with more than 90 of vehicle sales in 2013
the penetration of turbo and supercharging technologies in Brazil is lower than in other countries with a larger gasoline fleet such as the us china and japan (Figure 3‑27) in Brazil 95 of diesel passenger vehicle sales have turbocharging technology
30
Brazil Passenger Vehicle Market statistics
0
10
20
30
40
50
60
70
80
90
100
Compac
t
Subco
mpac
t
Medium
Larg
eSport
O-Road SUV
Miniva
nTo
tal
Tech
nolo
gy
shar
e (n
on-
Die
sel)
Turbo NA
Figure 3‑25 ndash turbocharging for gasolineflex fuel vehicles by segment (NA naturally aspirated)
0102030405060708090
100
Fiat GM
Volkswag
enFord
Renau
lt
Hyund
ai
Honda
Toyo
taPSA
Nissan
Mitsub
ishiKIA
JACBMW
Land
Rove
r
Merce
des-B
enz
Chery
Audi
Suzuk
iJe
epTo
tal
Tech
nolo
gy
shar
e (n
on-
Die
sel)
Turbo NA
Figure 3‑26 ndash turbocharging for gasolineflex fuel vehicles by manufacturer (NA naturally aspirated)
0
10
20
30
40
50
60
70
80
90
100
China2010
Korea2011
EU-272013
US2013
Japan2011
India2012
Brazil2013
Tech
nolo
gy
shar
e (n
on-
die
sel)
Turbo NA
Figure 3‑27 ndash turbocharging for gasolineflex fuel vehicles international comparison (NA naturally aspirated)
31
ICCT white paper
4 vEhiCLE ENErGy CONSuMpTiON
this section analyzes the Brazilian new passenger vehicle energy consumption in 2013 although other metrics are more common (see box) vehicle energy consumption is presented in megajoules per kilometer (Mjkm) for consistency with Brazilrsquos inovar-auto policy in 2012 Brazilrsquos Ministry of Development industry and Foreign trade (MDic) adopted the inovar-auto policy with the aim of fostering industrial competitiveness through technology investments the policy includes a target for corporate average energy consumption (in Mjkm with vehicle curb weight as the attribute parameter) for vehicles sold in 2017
in the us canada Mexico and saudi arabia fleet-average fuel economy standards are defined as a function of vehicle footprint in the eu china japan south Korea and india vehicle weight is the attribute for the calculation of fleet-average targets in Brazil inovar-auto has defined its fiscal targets for vehicle energy consumption measured in megajoules per kilometer (Mjkm) as a function of vehicle weight
VEhiCLE ENERGY MEaSUREMENT UNiTS
Many metrics can be used to describe the amount of fuel energy or emissions generated by unit of distance traveled
Fuel economy measures distance traveled per unit of fuel consumed in Brazil kilometers per liter (kml) is the most common metric to describe vehicle efficiency but other units are used in different countries such as miles per gallon (mpg) in the us
Fuel consumption is the reciprocal of fuel economy and measures fuel consumed per distance traveled it is usually expressed in liters per 100 kilometers (l100 km) and it is used in europe for example
GhGCO2 emissions measures ghg or co2 emissions per distance traveled expressed as grams of pollutant per kilometer or mile
Energy consumption (EC) measures the energy consumed per distance traveled for example in megajoules per kilometer Despite being a less common metric it is sometimes preferred for being a fuel-neutral metric across different types of fuel and vehicle technologies Vehicle energy consumption in Mjkm is the metric used in Brazilrsquos inovar-auto policy to quantify the corporate average energy consumption target for each manufacturer Values for energy consumption in Brazilian spark-ignited vehicles are provided for e22 since that is the fuel mixture used in vehicle tests
Vehicle energy consumption in this report is calculated from co2 emissions data in the Brazilian institute of environment and renewable natural resources (iBaMa) nota Verde program (iBaMa 2014) which reports official emissions data from homologation tests Data are limited to passenger cars sold by the top 10 manufacturers with light commercial vehicles being excluded appendix D presents a description of data sources
32
Brazil Passenger Vehicle Market statistics
and calculation methodologies as well as a discussion of vehicle energy consumption data quality and completeness in Brazil
not surprisingly vehicle energy consumption increases with vehicle footprint and engine rated power the two parameters that define vehicle segments in Brazil (Figure 4‑1) subcompact and compact vehicles which accounted for about 45 of new sales in 2013 have average energy consumption below the fleet average while medium-sized vehicles which hold the largest market share (388) have energy consumption just above the fleet average larger more powerful vehicles consume more energy than the fleet average but have a considerably smaller market share (combined share of 163) Data availability for these segments is not as extensive as the data available for the subcompact compact and medium segments which could affect the relative rankings of each segment
Ene
rgy
cons
ump
tio
n (M
Jkm
)
Subco
mpac
t
Compac
t
Medium
Larg
e
O-road SUV
4000
200000
400000
600000
850000
35
30
25
20
15
10
05
0
Sales
Total 202
Figure 4‑1 ndash new vehicle sales-weighted average energy consumption by segment (2013)
33
ICCT white paper
Figures 4‑2 and 4‑3 illustrate new vehicle energy consumption for multiple weight and footprint bins For each weight bin (in 100 kg increments) and footprint bin (in 01 m2 increments) sales-weighted averages of energy consumption for each vehicle version are presented (dashes) generating energy consumption ranges for each bin (cream areas) Vehicle sales by bin are presented for reference in the lower charts
the strong correlation between vehicle energy consumption and weight follows from the strong physical relationship between the weight of the vehicle and the energy required to accelerate it and overcome resistances9 (Figure 4‑2) Data dispersion within each bin suggests that energy consumption varies due to other vehicle characteristics that affect vehicle aerodynamics and rolling resistance as well as the adoption of technologies that affect engine and transmission efficiency (eg friction reduction technologies gDi VVt)
Curb weight (kg)
SubcompactCompactMediumLargeO-roadSUV
Ene
rgy
cons
ump
tio
n (M
Jkm
)Sa
les
5
6
4
3
2
1
600k
800k
400k
200k
0k800 900 1000 1100 1200 1300 1400 1500 1600 1700 1800 1900 2000 2100
Figure 4‑2 ndash new vehicle energy consumption by vehicle weight (2013)
9 on a plain surface the sum of resistances of a vehicle is acceleration resistance + rolling resistance + aerodynamic resistance = c1 m a + c2 frr m + c3 cw a v2 with mass (m) as an integral part of both acceleration and rolling resistance which are most relevant for inner-city driving situations other factors are acceleration (a) rolling resistance of tires (frr) aerodynamic coefficient of the vehicle (cw) frontal area of vehicle (a) velocity (v) and constants (cx)
34
Brazil Passenger Vehicle Market statistics
Footprint has a reasonable correlation with energy consumption (Figure 4‑3) ie larger vehicles tend to consume more fuel than smaller vehicles however the correlation is not as strong as with vehicle weight similar to the previous figure the broad spread of energy consumption values suggests a combination of different vehicle characteristics (eg weight engine displacement rated power) and technologies (eg transmissions fuel systems) as well as the presence of suVs and off-road vehicles among the medium- and large-sized footprint values respectively
Footprint (m2)
SubcompactCompactMediumLargeO-roadSUV
Ene
rgy
cons
ump
tio
n (M
Jkm
)Sa
les
5
6
4
3
2
1
400k
500k
300k
200k
100k
0k31 32 33 34 35 36 37 38 39 40 41 42 43 44 45 46 48 49
Figure 4‑3 ndash new vehicle energy consumption by vehicle footprint (2013)
35
ICCT white paper
Figure 4‑4 illustrates sales weighted average for new vehicle energy consumption by mass for the top 10 manufacturers in Brazil in 2013 Bubble sizes are proportional to total vehicle sales Manufacturers in the lower-left quadrant produce the lightest and most efficient vehicles with hyundai presenting the best overall average energy consumption renault in the upper-left quadrant produces vehicles that are equivalent in weight but on average with higher energy consumption in the lower-right quadrant are manufacturers that produce relatively heavier vehicles but with lower energy consumption in their weight class Despite producing heavier vehicles on average than many manufacturers honda achieves lower energy consumption on average in the upper-right quadrant are manufacturers that produce on average the heavier and least efficient vehicles with Psa (citroen and Peugeot) producing the heaviest and least efficient cars on average a regression line correlating vehicle energy consumption and mass highlights the best performers (hyundai honda and nissan) average performers (Fiat Volkswagen gM and toyota) and those performing worse than average (renault Ford and Psa)
FIA
GMVW
FORREN
HYU
HON
TOY
PSA
NIS
160
170
180
190
200
210
220
230
240
250
950 1000 1050 1100 1150 1200 1250 1300 1350
Ene
rgy
cons
ump
tio
n (M
Jkm
)
Curb weight (kg)
Fleet Ave
Figure 4‑4 ndashaverage new vehicle sales-weighted energy consumption by manufacturer (2013)
36
Brazil Passenger Vehicle Market statistics
Figure 4‑5 shows fleet-average energy consumption based on certification and type approval data for new vehicles in multiple countries converted to the us caFe combined driving cycle Bubble sizes represent total sales of new passenger cars Because of data availability in different countries the country comparison is based on different calendars years for different countries 2011 for south Korea and japan 2012 for china and india and 2013 for europe the us and Brazil given annual improvements in vehicle energy consumption triggered by regulatory efficiency standards and fiscal incentives those countries with older data could be at a slight disadvantage in this comparison
With the heaviest vehicles on average the us fleet is also the most energy consuming of all countries china and south Korea have similar average energy consumption but since south Korean vehicles are heavier on average they are relatively more efficient than chinese vehicles although Brazilrsquos fleet consumes less fuel on average than those from the us china and south Korea its fleet is relatively inefficient when compared to countries with vehicles of similar weight (japan and india) the average Brazilian vehicle consumes about 34 more energy than the average vehicle in japan whose fleet has a large penetration of gasoline hybrid and advanced fuel-efficiency technologies such as three-cylinder engines VVa Dohc and 6-plus speed transmissions european vehicles are the best performing on average despite being heavier than all countries with the exception of the us and south Korea the adoption of fuel-efficiency technologies (eg Dct 6-plus-speed transmissions gDi turbocharging) contributes to europersquos better than average performance
China2012
SKorea2011
Europe2013
US2013
Japan2011
India2012
Brazil2013
Sales5 MM10 MM
14
16
18
20
22
24
26
28
1000 1100 1200 1300 1400 1500 1600 1700
Ene
rgy
cons
ump
tio
n ndash
CA
FE
(M
Jkm
)
Curb weight (kg)
Type-approval and certification energy consumption data only (does not include o-cycle or real-world driving data)
Figure 4‑5 ndash international comparison of passenger car energy consumption
Country labels indicate the dataset year
Figure 4‑6 provides a more detailed country comparison by illustrating average vehicle energy consumption by vehicle (curb) weight bin Vehicle sales in each bin are shown for reference the us is not shown due to lack of detailed model-by-model data Brazilrsquos vehicles on average have the highest energy consumption in most weight
37
ICCT white paper
bins with china being the second highest in most bins Because china has higher fuel consumption than Brazil on the 1000 bin which represents the highest share of vehicle sales fleet-average energy consumption in china is still higher than in Brazil as illustrated in the previous figure europe consistently performs best in terms of vehicle energy consumption in most weight bins with japan also performing relatively well
Curb weight (kg)
BrazilChinaEuropeIndiaJapanSouth Korea
Ene
rgy
cons
ump
tio
n C
AF
E (
MJ
km)
Sale
s
40
35
25
20
15
10
6M
8M
4M
2M
0M600 800 1000 1200 1400 1600 1800 2000 2200 2400
Figure 4‑6 ndash international comparison of average vehicle energy consumption by vehicle weight
Type-approval and certification energy consumption data only (does not include off-cycle or real-world driving data)
38
Brazil Passenger Vehicle Market statistics
Figure 4‑7 illustrates the distribution of energy consumption data in Brazil for each vehicle version by mass and segment Bubble sizes represent total sales of each version Data were limited to flex-fuel vehicles in the subcompact compact medium and large segments due to its relatively better data quality and representativeness (ie they represented over 87 of sales in 2013) While most vehicles follow a predictable trend that correlates energy consumption and vehicle mass there are a large number of versions with energy consumption substantially higher than the trend line this suggests there is substantial room for improvements in their energy consumption since there are vehicles in similar weight classes with substantially superior energy consumption performance
Sales1000050000
140
160
180
200
220
240
260
280
700 800 900 1000 1100 1200 1300 1400 1500 1600
Ene
rgy
cons
ump
tio
n (M
Jkm
)
Curb weight (kg)
Subcompact Compact Medium Large Fleet average
Figure 4‑7 ndash Distribution of new Brazilian passenger vehicle energy consumption data by vehicle weight and segment (2013)
this chapter suggests that there are potential improvements in vehicle energy consumption for the Brazilian fleet For similar vehicles in terms of weight class footprint or engine rating there is substantial dispersion in energy consumption indicating that there are vehicles performing much worse than the average across manufacturers there is also a clear trend of some manufacturers performing much better than the average while others have a lot more room for improvement the international comparison clearly shows that Brazilian vehicles perform much worse in terms of energy consumption than vehicles of similar weight suggesting a delay in the adoption of energy efficient technologies among Brazilian vehicle manufacturers
Finally a more detailed analysis of vehicle versions clearly illustrates a considerable number of vehicle versions significantly above average thus indicating potential improvements in energy consumption that would place them on par with better performing vehicles with similar characteristics
39
ICCT white paper
Deficiencies in data quality and completeness prevent more definite conclusions about vehicle energy consumption gasoline-only vehicles in particular have poor energy consumption data quality although they represent a relatively small fraction (6) of total vehicles sold in 2013 Because some vehicle segments are primarily composed of gasoline-only vehicles (eg sports minivans) this chapter excludes these segments from the analysis there are also concerns about the gap between energy consumption data reported by iBaMarsquos nota Verde and Brazilrsquos national institute of Metrology standardization and industrial Qualityrsquos (inMetro) labeling program (PBeV using its acronym in Portuguese) with the latter reporting consistently lower values of vehicle energy consumption
Finally the availability of energy consumption data was not adequate for many manufacturers beyond the top 10 sales group which prevented their inclusion in this analysis Despite the data quality and lack of completeness the energy consumption data in this chapter include data that are reasonably accurate and representative thus supporting its interpretation
40
Brazil Passenger Vehicle Market statistics
rEfErENCES
aDK automotive consultoria de Marketing (2013) relatoacuterios de volumes de vendas do mercado brasileiro para veiacuteculos de passeio e comerciais leves referentes a 2013
alves l Wilbert M (2014) reduccedilatildeo do imposto sobre Produto industrializado e a Venda de automoacuteveis Xi congresso usP iniciaccedilatildeo cientiacutefica em contabilidade
associaccedilatildeo nacional de transportes Puacuteblicos (antP 2014) estudo mostra baixo efeito do desconto no iPi de veiacuteculos sobre PiB e emprego available at httpwwwantporgbrwebsitenoticiasshowaspnpgcode=a4DeeFe8-a7BF-48D3-B1F5-8eDe1447BF10
associaccedilatildeo nacional dos Fabricantes de Veiacuteculos automotores (anFaVea 2015) anuaacuterio da induacutestria automobiliacutestica Brasileira 2015 Brazilian automotive industry Yearbook 2015 satildeo Paulo available at wwwanfaveacombr
european environment agency (2014) Monitoring co2 emissions from new passenger cars in the eu summary of data for 2013 april 2014
instituto Brasileiro do Meio ambiente e dos recursos naturais renovaacuteveis (iBaMa 2014) consulta dos niacuteveis de emissatildeo dos veiacuteculos novos brasileiros available at httpsservicosibamagovbrctfpublicosel_marca_modelo_rvepphp
international council on clean transportation (icct 2015) global passenger vehicle standards available at httpwwwtheicctorginfo-toolsglobal-passenger-vehicle-standards
international energy agency (iea 2015) renewables Bioenergy available at httpswwwieaorgtopicsrenewablessubtopicsbioenergy
Korea energy Management corporation (KeMco 2014) Fuel economy regulation available at httpwwwkemcoorkrnew_engmainmainasp
Marklines (2015) Marklines automotive industry Portal available at httpwwwmarklinescomen
Mendonccedila M sachsida a (2014) Modelando a demanda de creacutedito para veiacuteculos no Brasil uma abordagem com mudanccedila de regime iPea
Ministeacuterio do Desenvolvimento induacutestria e comeacutercio exterior (MDic 2013) Programa de incentivo agrave inovaccedilatildeo tecnoloacutegica e adensamento da cadeia Produtiva de Veiacuteculos automotores mdash inovar-auto httpwwwplanaltogov brccivil_03_ato2011-20142012DecretoD7819htm
stein r anderson j and Wallington t (2013) an overview of the effects of ethanol-gasoline Blends on si engine Performance Fuel efficiency and emissions SAE Int J Engines 6(1)470-487 2013 doi1042712013-01-1635
us environmental Protection agency and national highway traffic safety administration (ePanhtsa 2010) Final rulemaking to establish light-Duty Vehicle greenhouse gas emission standards and corporate average Fuel economy standards ePa-420-r-10-901
us environmental Protection agency (ePa 2012) regulatory impact analysis Final rulemaking for 2017-2025 light-Duty Vehicle greenhouse gas emission standards and corporate average Fuel economy standards ePa-420-r-12-016
41
ICCT white paper
us national academy of sciences (nas 2011) assessment of Fuel economy technologies for light-Duty Vehicles available at httpwwwnapeducatalog12924assessment-of-fuel-economy-technologies-for-light-duty-vehicles
World Bank group (2015) World Development indicators available at httpdataworldbankorgdata-catalogworld-development-indicators
42
Brazil Passenger Vehicle Market statistics
LiST Of ACrONyMS
4wD Four-wheel drive
aNFaVEa Brazilian association of automobile Manufacturers
awD all-wheel drive
BRiC Brazil russia india china
CaFE corporate average fuel economy
CBG compressed biogas
CO2 carbon dioxide
CVT continuously variable transmission
CVVT continuously variable valve technology
DCT Dual-clutch transmission
DOhC Dual overhead camshaft
EC energy consumption
Epa us environmental Protection agency
EU european union
FFV Flex-fuel vehicle
FTp Federal test procedure
FwD Front-wheel drive
GDi gasoline direct injection
GDp gross domestic product
GhG greenhouse gas
GM general Motors
iBaMa Brazilian institute of the environment and renewable natural resources
iC internal combustion
iCCT international council on clean transportation
iNMETRO national institute of Metrology standardization and industrial Quality
Kg Kilogram
Km Kilometer
Kw Kilowatt
LDV light-duty vehicle
LpG liquified petroleum gas
MDiC Ministry of Development industry and Foreign trade
MJ Megajoule
MpFi Multi-point fuel injection
Mpg Miles per gallon
NaS us national academy of sciences
43
ICCT white paper
NhTSa us national highway transportation safety administration
OhV overhead valve
pBEV Brazilian Vehicle labeling Program
pSa Psa Peugeot citroeumln
pTwR Power-to-weight ratio
pV Passenger vehicle
RwD rear-wheel drive
SOhC single overhead camshaft
SUV sport utility vehicle
US united states
USD us dollar
VTEC Valve timing electronic control
VVa Variable valve actuation
VVL Variable valve lift
44
Brazil Passenger Vehicle Market statistics
AppENDix A SEGMENT DEfiNiTiONS
Table a‑1 ndash segment definitions
Segmentpower (kw)
pTwR (kwkg) area (m2)
Other characteristics Examples
Subcompact lt 140 lt 0075 le 65 mdash Mini cooper chevrolet celta smart Fortwo
Compact lt 140 lt 0075 65 lt area le 70 mdash honda Fit hyundai hB20 Volkswagen Polo
Medium lt 140 lt 0075 70 lt area le 80 mdash honda civic nissan tiida Peugeot 308
Large lt 140 lt 0075 gt 80 mdash audi a4 BMW 3 series Mercedes c-class
Sports gt 140 gt 0075 mdash 4 seats maxjaguar XF lamborghini gallardo Ferrari california
Off‑road mdash mdash lt 80 traction = 4WDjeep cherokee honda cr-V BMW X3 hyundai santa Fe
SUV mdash mdash lt 80Based on aDKrsquos default classification
BMW X1 Ford ecosport hyundai tucson
Minivan mdash mdash Passengers 6-12
citroen grand Picasso Kia carnival
45
ICCT white paper
AppENDix b iNTErNATiONAL MArKET DATA
Table B‑1 ndash international market comparison of new fleet characteristics
parameters China S Korea EU US Japan india Brazil
Year 2012 2011 2013 2013 2011 2012 2013
Sales (million) 155 13 118 156 352 256 304
price (USD) $21008 $21383 $24439 mdash $20637 $11717 $22015
No of cylinders mdash 43 40 47 38 36 40
Displacement (cc) 1605 1960 1613 2606 1425 1294 1430
Curb weight (kg) 1296 1421 1391 1623 1193 1059 1106
Length (mm) 4323 4531 4263 mdash 4013 3859 4100
Footprint (m2) 38 420 40 425 371 341 367
Engine power (kw) 86 120 89 148 78 55 76
pTwR (kwkg) 00664 00844 00640 00912 00654 00519 00671
Energy consumption ndash US CaFE (MJKm)[1] 235 206 169 250 171 183 202
[1] energy consumption data presented here for countries other than Brazil were obtained from local official sources in its original metric and drive cycle and then converted to Mjkm under the us caFe drive cycle using the methodology described in Yang (2015) Mode details and historical fuel consumption data on their original metrics is presented in the icctrsquos global PV standard website httpwwwtheicctorginfo-toolsglobal-passenger-vehicle-standards
Data Sources
China Ministry of industry and information technology (Miit 2014) corporate average Fuel efficiency accounting Method for Passenger cars available at httpwwwgovcngzdt2013-0320content_2358627htm
Baseline performance china automotive research and technology center through internal communication and icct internal 2010 database for chinese light-duty vehicles
S Korea internal communication with s Korean official and from greencarcongress available at httpwwwgreencarcongresscom200906korea-20090604html
EU european environment agency (2014) Monitoring co2 emissions from new passenger cars in the eu summary of data for 2013 april 2014
US us ePa (2014) light-duty automotive technology carbon dioxide emissions and fuel economy trends1975 through 2014 table 91 page 110 available at http httpwwwepagovfueleconomyfetrends1975-2014420r14023apdf
Japan jaMa (2010) the Motor industry of japan available at httpwwwjama-englishjppublicationsMVs2010pdf Mlit httpwwwmlitgojpcommon000990330pdf
india Bureau of energy efficiency white paper 2010-2012 calculation based on icct database
Brazil icct Brazil Vehicle Database (2013)
46
Brazil Passenger Vehicle Market statistics
Table B‑2 ndash international market comparison of technology adoption in new vehicles
Technology adoption China S Korea EU US Japan india Brazil
Year 2010 2011 2013 2013 2011 2012 2013
Fuel type
CBGLpGFlex 0 11 2 0 0 4 94
Gasoline 99 65 44 93 86 56 6
hybrid 0 1 1 5 13 0 0
Diesel 1 23 53 1 0 40 0
No of cylinders
Two 0 0 0 0 0 6 0
Three 4 0 7 0 36 28 3
Four 90 84 87 56 57 65 97
Five 0 0 1 0 0 0
Six 6 15 4 32 5 0 1
Eight or more 0 0 0 12 1 0 0
Transmission
Manual 60 3 83 5 1 98 83
automatic 34 90 9 75 34 2 15
CVT 5 7 2 18 65 0 1
DCT 1 0 6 2 mdash 0 1
Number of gear ratios
Four or fewer 13 16 1 7 mdash 10 6
Five 68 9 45 11 mdash 85 83
Six or more 19 75 54 82 mdash 5 11
Drivetrain
FwD 74 86 81 83 59 76 0
RwD 21 7 7 10 5 22 0
4wD and awD 5 7 12 7 36 2 100
No of valves per cylinder
Two 17 mdash mdash 2 4 25 60
Multi valve 83 mdash mdash 98 95 75 40
Valve camshaft configuration
Single overhead camshaft 26 1 mdash mdash 16 41 63
Dual overhead camshaft 74 84 mdash mdash 82 53 25
Overhead camshaft mdash 15 mdash mdash 0 6 mdash
Valve actuation
Fixed 50 16 mdash 2 11 86 78
VVT 44 84 mdash 98 89 12 16
VVL 6 mdash mdash mdash mdash 2 6
Fuel systems for gasoline vehicles
Multi‑point fuel injection 94 72 68 62 95 100 98
Gasoline direct injection 6 28 32 37 5 0 2
air induction systems for gasoline vehicles
Naturally aspirated 93 75 41 85 92 64 97
Supercharger turbocharger or twin‑turbo 7 25 59 15 8 36 3
47
ICCT white paper
AppENDix C NEW vEhiCLE ChArACTEriSTiCS AND TEChNOLOGy ADOpTiON DATA iN brAziL
Table C‑1 ndash Fleet characteristics of new Brazilian passenger vehicles by segment (2013)
parameters Subcompact Compact Medium Large Sports Off‑road SUV Minivan
Sales (thousands) 6785 6843 11790 1920 273 768 1997 23
Market share () 223 225 38 8 63 09 25 65 01
price (R$) $30103 $38732 $45496 $66508 $148834 $151284 $75164 $82284
No of cylinders 400 391 399 400 462 448 404 433
Displacement (cc) 1128 1293 1447 1794 2430 2586 1884 2244
Curb weight (kg) 940 1037 1102 1329 1561 1772 1395 1604
Length (mm) 3804 4026 4163 4499 4711 4516 4352 4658
Footprint (m2) 339 361 371 402 418 409 402 427
Engine power ndash gasoline (kw) 58 68 75 99 183 146 103 120
Engine power ndash ethanol (kw) 59 70 77 98 mdash 109 101 mdash
pTwR ndash gasoline (kwkg) 00614 00655 00671 00742 01173 00828 00731 00732
pTwR ndash ethanol (kwkg) 00630 00678 00697 00757 mdash 00766 00745 mdash
48
Brazil Passenger Vehicle Market statistics
Table C‑2 ndash Fleet characteristics of new Brazilian passenger vehicles by manufacturer (2013)
parameters Fiat
GM
Vo
lksw
agen
Ford
Ren
ault
hyu
ndai
ho
nda
Toyo
ta
pSa
Nis
san
Mit
sub
ishi
Kia
JaC
BM
w
Land
Rov
er
Mer
ced
es‑B
enz
Che
ry
aud
i
Suzu
ki
Jeep
Sales (thousands) 6087 5486 5448 3074 2207 2055 1392 1334 1163 621 368 255 158 141 106 94 80 67 63 36
Market share () 2002 1804 1792 1011 726 676 458 439 383 204 121 084 052 046 035 031 026 022 021 012
price (R$) $35017 $42259 $38701 $46174 $43447 $50112 $67078 $68922 $103001 $44035 $100696 $87009 $37654 $165111 $221943 $153281 $30821 $142799 $74769 $139039
No of cylinders 400 401 400 402 400 370 400 400 400 400 408 416 400 424 448 431 400 411 400 552
Displacement (cc) 1250 1340 1287 1497 1423 1495 1691 1808 1575 1579 2262 1856 1411 2095 2281 1934 1398 1912 1831 3182
Curb weight (kg) 1033 1060 1020 1156 1102 1122 1210 1201 1231 1069 1556 1377 1079 1624 1868 1598 1097 1551 1444 1945
Length (mm) 3965 4155 3993 4120 4127 4078 4319 4299 4116 4171 4401 4357 3956 4574 4487 4527 3896 4454 4234 4584
Footprint (m2) 345 370 354 368 378 383 397 387 376 379 395 407 351 429 433 429 349 417 323 420
Engine power ndash gasoline (kw) 64 71 65 79 73 86 96 90 80 82 120 112 83 151 179 138 71 136 94 162
Engine power ndash ethanol (kw) 65 72 65 79 76 85 97 90 81 82 107 106 95 mdash mdash mdash 75 mdash mdash mdash
pTwR ndash gasoline (kwkg)
00613 00662 00631 00674 00657 00739 00788 00745 00646 00766 00779 00792 00784 00921 00977 00856 00638 00870 00649 00835
pTwR ndash ethanol (kwkg) 00629 00681 00642 00693 00685 00781 00800 00795 00660 00768 00710 00798 00896 mdash mdash mdash 00659 mdash mdash mdash
49
ICCT white paper
Table C‑3 ndash Fleet characteristics of new Brazilian passenger vehicles by origin (2013)
parameters Domestic imported
Sales (thousands) 2537 504
Market share () 834 166
price (R$) $41739 $76049
No of cylinders 397 412
Displacement (cc) 1359 1791
Curb weight (kg) 1070 1289
Length (mm) 4063 4285
Footprint (m2) 362 390
Engine power ndash gasoline (kw) 70 102
Engine power ndash ethanol (kw) 73 84
pTwR ndash gasoline (kwkg) 0065 0076
pTwR ndash ethanol (kwkg) 0068 0074
50
Brazil Passenger Vehicle Market statistics
Table C‑4 ndash technology adoption in new Brazilian passenger vehicles by segment (2013)
Technology adoption Subcompact Compact Medium Large SportOff‑road SUV Minivan
Fuel type
Flex 982 988 982 837 00 134 826 00
Gasoline 18 12 17 163 996 540 174 1000
hybrid 0000 0000 0028 0000 0396 0001 0000 0000
Diesel 00 00 00 00 00 326 00 00
No of cylinders
Three 01 91 10 00 00 00 00 00
Four 999 909 990 998 758 775 979 833
Five 00 00 00 02 03 00 00 00
Six 00 00 00 00 175 211 21 167
Eight or more 00 00 00 00 63 13 00 00
Transmission
Manual 993 944 826 622 62 174 505 641
automatic 07 55 161 283 629 707 451 359
CVT 00 00 12 89 09 93 34 00
DCT 00 01 02 06 299 25 10 00
No of gear ratios
Four or fewer 04 47 72 51 00 34 247 193
Five 984 943 848 378 15 392 516 641
Six 12 09 73 515 796 462 225 167
Seven 00 01 06 23 87 53 12 00
Eight or more 00 00 01 32 102 59 00 00
Drivetrain
FwD 998 1000 997 688 550 00 916 1000
RwD 02 00 03 311 221 00 84 00
awD 00 00 00 01 229 1000 00 00
No of valves per cylinder
Two 806 694 584 195 00 00 258 00
Multi valve 194 306 416 805 1000 1000 742 1000
Valve camshaft configuration
Single overhead camshaft 839 786 709 309 00 212 375 00
Dual overhead camshaft 24 158 161 546 880 517 446 255
Valve actuation
Fixed 982 729 807 461 49 493 664 868
VVT 18 211 115 470 827 367 252 132
VVT+VVL 00 61 78 68 124 140 84 00
Fuel systems for gasoline vehicles
Multi‑point fuel injection 999 998 997 949 979 143 766 1000
Gasoline direct injection 01 02 03 51 21 857 234 00
air induction systems for gasoline vehicles
Naturally aspirated 999 997 995 943 974 369 543 1000
Supercharger turbocharger or twin‑turbo 01 03 05 57 26 631 457 00
51
ICCT white paper
Table C‑5 ndash technology adoption in new Brazilian passenger vehicles by manufacturer (2013)
Technology adoption Fi
aT
GM
VO
LKSw
aG
EN
FOR
D
REN
aU
LT
hY
UN
Da
i
hO
ND
a
TOYO
Ta
pSa
NiS
SaN
MiT
SUB
iSh
i
Kia
JaC
BM
w
LaN
D R
OV
ER
MER
CED
ES
Fuel type
Flex 990 987 965 966 997 921 999 886 928 998 283 739 31 42 00 00
Gasoline 10 09 35 34 03 79 01 35 72 02 557 255 969 957 663 950
hybrid 00 00 00 00 00 00 00 02 00 00 00 00 00 00 00 00
Diesel 00 04 00 00 00 00 00 77 00 00 160 06 00 00 337 50
No of cylinders
Three 00 00 05 00 00 348 00 00 00 00 00 00 00 00 00 00
Four 1000 996 994 989 1000 626 999 998 1000 1000 958 922 1000 906 787 878
Five 00 00 00 00 00 00 00 00 00 00 00 00 00 00 00 00
Six 00 02 01 11 00 26 01 02 00 00 42 78 00 68 185 87
Eight or more 00 02 00 00 00 00 00 00 00 00 00 00 00 26 28 35
Transmission
Manual 992 878 985 846 853 632 566 565 703 785 493 120 1000 02 00 151
automatic 08 103 00 137 62 285 355 160 297 121 118 793 00 575 18 14
CVT 00 19 15 16 41 70 01 246 00 00 139 87 00 423 982 836
DCT 00 00 00 00 43 13 78 30 00 94 251 00 00 00 00 00
No of gear ratios
Four or fewer 02 04 00 55 104 237 00 323 249 132 17 133 00 00 00 00
Five 981 811 963 839 797 623 861 643 684 828 530 107 1000 00 00 64
Six 17 185 29 106 99 140 139 07 67 40 453 754 00 217 800 00
Seven 00 00 07 00 00 00 00 27 00 00 00 00 00 08 00 936
Eight or more 00 00 00 00 00 00 00 00 00 00 00 06 00 775 200 00
Drivetrain
FwD 1000 902 989 972 987 985 990 892 1000 1000 496 623 1000 00 00 00
RwD 00 91 00 00 00 00 00 16 00 00 00 370 00 882 00 900
awD 00 06 11 28 13 15 10 92 00 00 504 07 00 118 1000 100
No of valves per cylinder
Two 811 864 988 745 220 00 00 00 00 00 00 00 00 00 00 00
Multi Valve 189 136 12 255 780 1000 1000 1000 1000 1000 1000 1000 1000 1000 1000 1000
Valve camshaft configuration
SOhC 836 755 914 675 832 00 04 00 497 398 331 00 00 00 00 00
DOhC 07 108 56 50 168 992 786 875 352 428 477 1000 907 810 860 453
Valve actuation
Fixed 1000 898 965 966 940 29 00 574 736 573 435 76 124 187 18 55
VVT 00 102 35 34 60 971 00 426 264 427 00 924 876 00 982 945
VVT+VVL 00 00 00 00 00 00 1000 00 00 00 565 00 00 813 00 00
air induction System
Naturally aspirated 997 994 966 977 997 988 1000 923 922 1000 835 936 1000 97 37 101
Supercharger turbocharger or twin‑turbo
03 06 34 23 03 12 00 77 78 00 165 64 00 903 963 899
Fuel systems for gasoline vehicles
Multipoint fuel injection 1000 995 965 972 1000 989 1000 1000 967 1000 994 1000 1000 78 15 158
Gasoline Direct injection 00 05 35 28 00 11 00 00 33 00 06 00 00 922 985 842
note Difference between 100 and summation of sohc and Dohc market share values corresponds to data not available
52
Brazil Passenger Vehicle Market statistics
AppENDix D DATA SOurCES AND COMpLETENESS
the basis of the statistics shown in this report is a database compiled by the icct with vehicle sales technical information (eg fleet characteristics technology content) and energy consumption (converted from either co2 emissions or fuel economy) from various data sources outlined in table D-1
Table D‑1 ndash Brazilian data sources
parameters Sales TechnicalEnergy
consumption
aDK (2014 2015) x x
MarkLines (2015) x
iBaMa (2014) x
iNMETRO (2014) x
UOL (2014) x
icarroscom (2014) x
this analysis examined energy consumption data from two public sources the nota Verde Program by the Brazilian institute of the environment and renewable natural resources (iBaMa) and the Brazilian Vehicle labeling Program (PBeV) by the national institute of Metrology standardization and industrial Quality (inMetro) table D-2 summarizes key differences between these two data sources
Table D‑2 ndash energy consumption data sources
iBaMa iNMETRO
program nota Verde1 Brazilian Vehicle labeling Program (PBeV)2
program description
Mandatory program that reports emissions of co2 co nox and nMhc as part of emissions certification program
Voluntary program since 2009 that allows the comparison of fuel economy across vehicle models
Unit gco2 km kml
Test cycle chassis testing under urban (FtP) driving cycle based on nBr 66012005
chassis testing under urban (FtP) and highway (hWYFe) driving cycles based on nBr 702420103
adjustment
no adjustment for real-world driving conditions Because reported co2 emissions are assumed to be zero for ethanol adjustments were made to account for tailpipe co2 emissions for vehicles running on ethanol
since 2010 published values include real-world adjustment factors to chassis test data a method adopted by the us ePa in 2008
Conversion to MJkm
iBaMarsquos data are reported as FtP (city test) co2 data in gco2 km conversion to caFe test cycle and to a different metric (Mjkm) involves four steps as presented in Figure D-1
inMetrorsquos data in kml are presented separately by fuel type (e22 e100) and driving cycle (urban highway) conversion to Mjkm was done by applying a conversion factor (2167 gco2 l for e22 and 1428gco2l for e00) caFe values are obtained by using a 5545 weighting for the urban (FtP) and highway cycles respectively
1 iBaMa (2014) nota Verde program available at httpwwwmmagovbrcidades-sustentaveisqualidade-do-arcontrole-de-emissoes-veicularesnota-verde
2 inMetro (2014) Programa Brasileiro de etiquetagem Veicular (PBeV) available at httpwwwinmetrogovbrconsumidortabelas_pbe_veicularasp
3 inMetro (2014) Metodologia Para Divulgaccedilatildeo De Dados De consumo Veicular available at httpwwwinmetrogovbrconsumidorpbeMetodologia_consumo_Veicularpdf
53
ICCT white paper
Step 1 Correcting the original IBAMA CO2 reported data ndash FTP CO2 gkm
IBAMArsquos CO2 reported values are corrected to account for tailpipe emissions from ethanol (tailpipe CO2 emissions are reported as zero in IBAMArsquos data)
bull E22 FTP reported CO2 data are reduced by 177bull E100 FTP reported CO2 data are reduced by 100
Flex fuel vehicles are tested with E22 and E00 the final values is calculated as the average of both fuelsCO2 IBAMA_Flex_FTP= 05(1-0177)CO2_E22_test_FTP + 050E100_FTP = 050823CO2_E22_FTPFor Gasoline only vehicles the tests are carried out only with Gasoline E22CO2 IBAMA_Gasoline_FTP = (1-0177) CO2_E22_Test_FTP
Where in the previous equations CO2_E22_FTP means CO2 emissions values obtained under FTP testingCO2 IBAMA_Flex_FTP means IBAMArsquos Corrected FTP values for flex vehiclesCO2 IBAMA_Gasoline_FTP means IBAMArsquos Corrected FTP values for gasoline only (E22) vehicles
INNOVAR AUTO is based on energy consumption data obtained as the combined CAFE test cycle This requires a weighted average of energy consumption data obtained from FTP testing (city driving ) and Highway fuel economy testing (HWFET) In mathematical form CAFE=f(FTPHWFET)
Given that IBAMA data is provided for only the first aprt the FTP testing then it is required to find a way to calculate CAFE combined values through FTP -75 only data A linear function was thus developed from data with FTP and HWY values (INMETRO data) is used to convert FTP only values to CAFE CO2 values ie CAFE=f(FTP) The function used for this conversion is
CO2_CAFE= (CO2_FTP+44756)11572
Step 2Convert FTP CO2 values to CAFE CO2 values
Converting CO2 values to MJkm values is done by using the energy density of E22 Note that all the previous calculations for CO2 come from E22-based data
bull The energy density of E22 is 2894 MJLE22bull E22 emits 2167gCO2LE22bull CAFE (MJkm) = CAFE (gCO2km) (2894 MJLE22 2167 gCO2LE22)
Step 3 Convert US CAFE CO2 values to MJkm values
Figure D‑1 ndash conversion of emission to energy consumption data
energy consumption values calculated from iBaMa and inMetro data differ greatly Figure D-1 illustrates energy consumption data for those models in both databases iBaMa data are on average 126 higher than inMetro data with a standard deviation of 89 and a maximum deviation of 39
54
Brazil Passenger Vehicle Market statistics
0
05
1
15
2
25
3
0 05 1 15 2 25 3
Ene
rgy
cons
ump
tio
n IB
AM
A (
MJ
km)
Energy consumption INMETRO (MJkm)
n=151
Figure D‑2 ndash comparison between energy consumption data from inMetro and iBaMa
151 vehicles tested under both programs
although inMetro data are more transparent as it breaks down fuel economy by fuel and test cycle it is still a voluntary program that allows manufacturers to select which models will participate in addition not all manufacturers participate in the program in turn iBaMa data only include co2 data for the urban cycle and thus energy consumption in the combined cycle had to be estimated from correlations using international data in addition corrections had to be made for gasoline-only engines since it seems that a co2 discount in theory only applicable to flex-fuel engines was also applied to gasoline-only engines Despite these data quality issues iBaMa data were considered the most adequate data source for energy consumption because it is a mandatory program that requires data reporting by all vehicle models and manufacturers
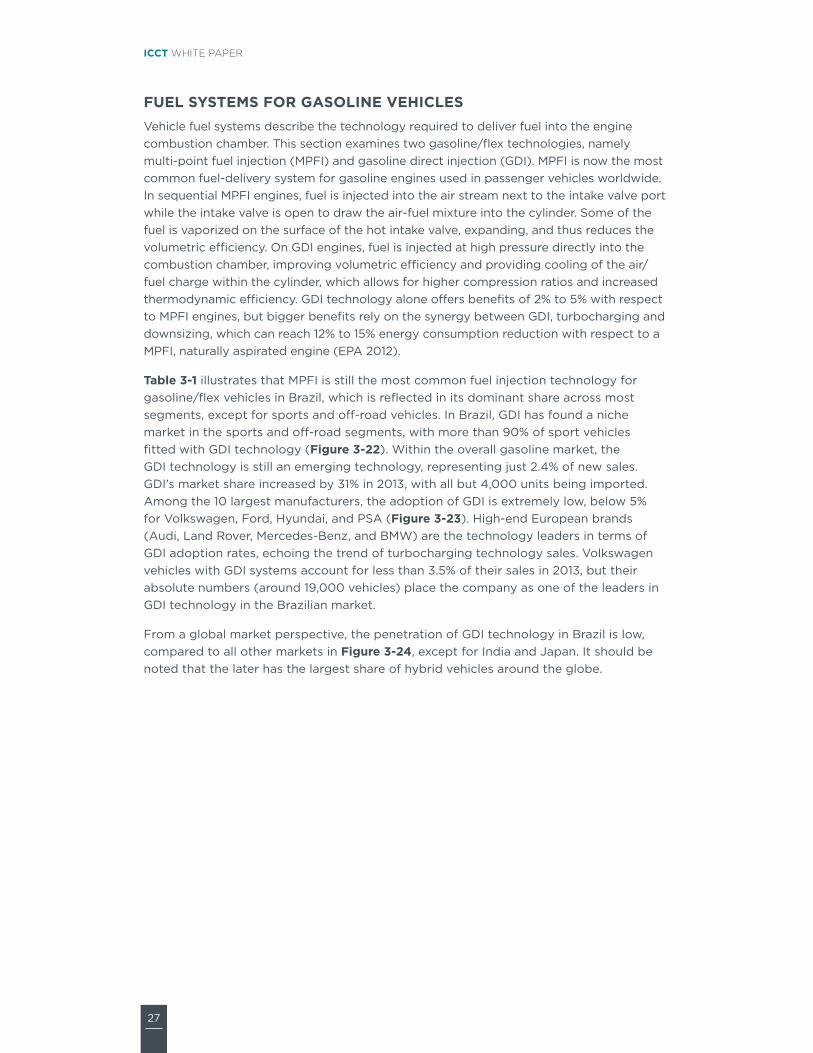
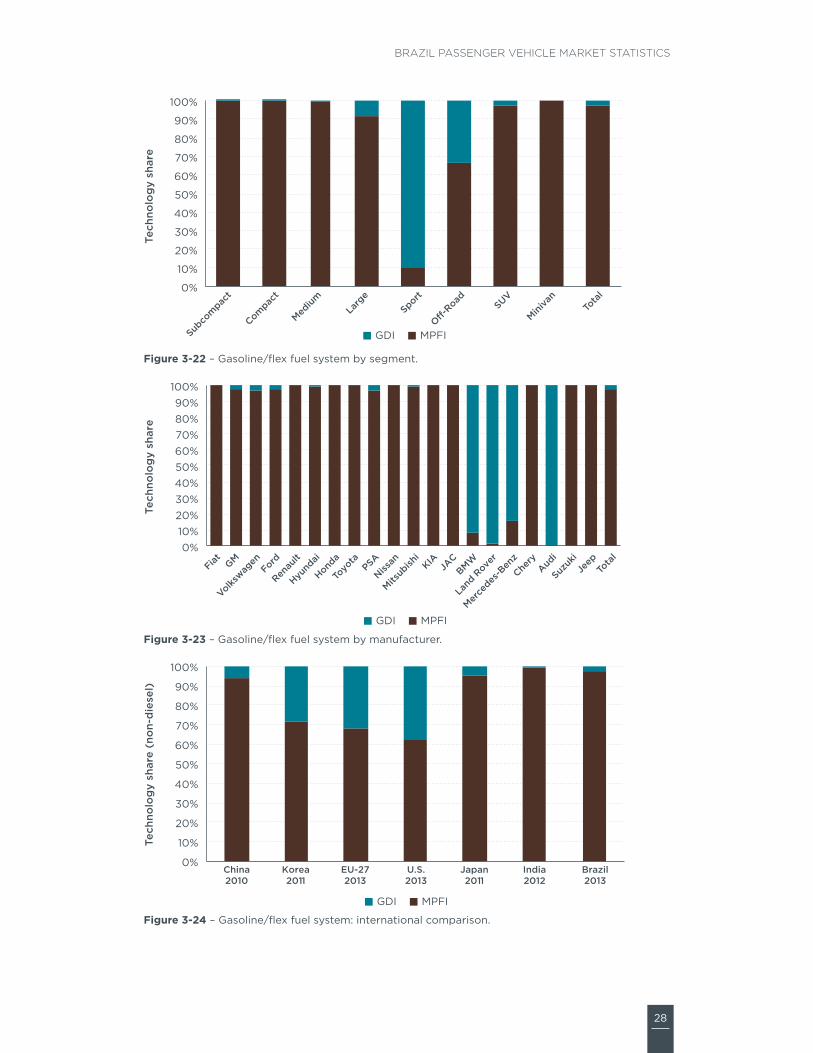
28
Brazil Passenger Vehicle Market statistics
0
10
20
30
40
50
60
70
80
90
100
Compac
t
Subco
mpac
t
Medium
Larg
eSport
O-Road SUV
Miniva
nTo
tal
Tech
nolo
gy
shar
e
GDI MPFI
Figure 3‑22 ndash gasolineflex fuel system by segment
GDI MPFI
0102030405060708090
100
Fiat GM
Volkswag
enFord
Renau
lt
Hyund
ai
Honda
Toyo
taPSA
Nissan
Mitsub
ishi
KIAJA
CBMW
Land
Rove
r
Merce
des-B
enz
Chery
Audi
Suzuk
iJe
epTo
tal
Tech
nolo
gy
shar
e
Figure 3‑23 ndash gasolineflex fuel system by manufacturer
GDI MPFI
0
10
20
30
40
50
60
70
80
90
100
China2010
Korea2011
EU-272013
US2013
Japan2011
India2012
Brazil2013
Tech
nolo
gy
shar
e (n
on-
die
sel)
Figure 3‑24 ndash gasolineflex fuel system international comparison
29
ICCT white paper
TURBOChaRGiNGengine power is primarily limited by the rate at which the engine is able to draw air into the combustion chamber turbocharging and supercharging are two methods to increase the amount of air drawn into the engine above the level of what is possible with the naturally aspirated process (through the expansion of the cylinders) By increasing the amount of air into the engine the amount of fuel can be proportionally increased resulting in increased power output level and with it the ability to reduce engine displacement while maintaining performance the combination of turbocharging and downsizing in spark ignited (gasoline and flex-fuel) vehicles can provide energy consumption improvements between 2 to 6 with respect to a direct-injected gDi engine (ePa amp nhtsa 2010) turbocharging technology is the cornerstone for achieving better energy consumption in vehicles as the basis for downsizing and reducing the engine weight while keeping the same or better vehicle performance (ie acceleration or time to reach certain speed) although turbochargers are used in diesel and gasolineflex vehicles the analysis in this report focuses on turbocharging for spark-ignited gasolineflex vehicles only
turbocharging is one of the most important emerging technologies in Brazil where most vehicles are still naturally aspirated (na) (Table 3‑1) turbocharging technology has increased the market share significantly between 2012 and 2013 by more than 65 albeit from a small base (from about 49000 to 81000 vehicles)
Most vehicles with turbocharging are sold in the sports and off-road segments as this technology also produces superior engine power output (Figure 3‑25) among the 10 largest manufacturers turbocharging is still below 10 of their sales (Figure 3‑26) Volkswagen and Ford despite having small relative sales of vehicles with turbocharging (less than 35) are the manufacturers with the highest total sales of vehicles with turbocharging audi land rover Mercedes-Benz and BMW are the technology leaders with more than 90 of vehicle sales in 2013
the penetration of turbo and supercharging technologies in Brazil is lower than in other countries with a larger gasoline fleet such as the us china and japan (Figure 3‑27) in Brazil 95 of diesel passenger vehicle sales have turbocharging technology
30
Brazil Passenger Vehicle Market statistics
0
10
20
30
40
50
60
70
80
90
100
Compac
t
Subco
mpac
t
Medium
Larg
eSport
O-Road SUV
Miniva
nTo
tal
Tech
nolo
gy
shar
e (n
on-
Die
sel)
Turbo NA
Figure 3‑25 ndash turbocharging for gasolineflex fuel vehicles by segment (NA naturally aspirated)
0102030405060708090
100
Fiat GM
Volkswag
enFord
Renau
lt
Hyund
ai
Honda
Toyo
taPSA
Nissan
Mitsub
ishiKIA
JACBMW
Land
Rove
r
Merce
des-B
enz
Chery
Audi
Suzuk
iJe
epTo
tal
Tech
nolo
gy
shar
e (n
on-
Die
sel)
Turbo NA
Figure 3‑26 ndash turbocharging for gasolineflex fuel vehicles by manufacturer (NA naturally aspirated)
0
10
20
30
40
50
60
70
80
90
100
China2010
Korea2011
EU-272013
US2013
Japan2011
India2012
Brazil2013
Tech
nolo
gy
shar
e (n
on-
die
sel)
Turbo NA
Figure 3‑27 ndash turbocharging for gasolineflex fuel vehicles international comparison (NA naturally aspirated)
31
ICCT white paper
4 vEhiCLE ENErGy CONSuMpTiON
this section analyzes the Brazilian new passenger vehicle energy consumption in 2013 although other metrics are more common (see box) vehicle energy consumption is presented in megajoules per kilometer (Mjkm) for consistency with Brazilrsquos inovar-auto policy in 2012 Brazilrsquos Ministry of Development industry and Foreign trade (MDic) adopted the inovar-auto policy with the aim of fostering industrial competitiveness through technology investments the policy includes a target for corporate average energy consumption (in Mjkm with vehicle curb weight as the attribute parameter) for vehicles sold in 2017
in the us canada Mexico and saudi arabia fleet-average fuel economy standards are defined as a function of vehicle footprint in the eu china japan south Korea and india vehicle weight is the attribute for the calculation of fleet-average targets in Brazil inovar-auto has defined its fiscal targets for vehicle energy consumption measured in megajoules per kilometer (Mjkm) as a function of vehicle weight
VEhiCLE ENERGY MEaSUREMENT UNiTS
Many metrics can be used to describe the amount of fuel energy or emissions generated by unit of distance traveled
Fuel economy measures distance traveled per unit of fuel consumed in Brazil kilometers per liter (kml) is the most common metric to describe vehicle efficiency but other units are used in different countries such as miles per gallon (mpg) in the us
Fuel consumption is the reciprocal of fuel economy and measures fuel consumed per distance traveled it is usually expressed in liters per 100 kilometers (l100 km) and it is used in europe for example
GhGCO2 emissions measures ghg or co2 emissions per distance traveled expressed as grams of pollutant per kilometer or mile
Energy consumption (EC) measures the energy consumed per distance traveled for example in megajoules per kilometer Despite being a less common metric it is sometimes preferred for being a fuel-neutral metric across different types of fuel and vehicle technologies Vehicle energy consumption in Mjkm is the metric used in Brazilrsquos inovar-auto policy to quantify the corporate average energy consumption target for each manufacturer Values for energy consumption in Brazilian spark-ignited vehicles are provided for e22 since that is the fuel mixture used in vehicle tests
Vehicle energy consumption in this report is calculated from co2 emissions data in the Brazilian institute of environment and renewable natural resources (iBaMa) nota Verde program (iBaMa 2014) which reports official emissions data from homologation tests Data are limited to passenger cars sold by the top 10 manufacturers with light commercial vehicles being excluded appendix D presents a description of data sources
32
Brazil Passenger Vehicle Market statistics
and calculation methodologies as well as a discussion of vehicle energy consumption data quality and completeness in Brazil
not surprisingly vehicle energy consumption increases with vehicle footprint and engine rated power the two parameters that define vehicle segments in Brazil (Figure 4‑1) subcompact and compact vehicles which accounted for about 45 of new sales in 2013 have average energy consumption below the fleet average while medium-sized vehicles which hold the largest market share (388) have energy consumption just above the fleet average larger more powerful vehicles consume more energy than the fleet average but have a considerably smaller market share (combined share of 163) Data availability for these segments is not as extensive as the data available for the subcompact compact and medium segments which could affect the relative rankings of each segment
Ene
rgy
cons
ump
tio
n (M
Jkm
)
Subco
mpac
t
Compac
t
Medium
Larg
e
O-road SUV
4000
200000
400000
600000
850000
35
30
25
20
15
10
05
0
Sales
Total 202
Figure 4‑1 ndash new vehicle sales-weighted average energy consumption by segment (2013)
33
ICCT white paper
Figures 4‑2 and 4‑3 illustrate new vehicle energy consumption for multiple weight and footprint bins For each weight bin (in 100 kg increments) and footprint bin (in 01 m2 increments) sales-weighted averages of energy consumption for each vehicle version are presented (dashes) generating energy consumption ranges for each bin (cream areas) Vehicle sales by bin are presented for reference in the lower charts
the strong correlation between vehicle energy consumption and weight follows from the strong physical relationship between the weight of the vehicle and the energy required to accelerate it and overcome resistances9 (Figure 4‑2) Data dispersion within each bin suggests that energy consumption varies due to other vehicle characteristics that affect vehicle aerodynamics and rolling resistance as well as the adoption of technologies that affect engine and transmission efficiency (eg friction reduction technologies gDi VVt)
Curb weight (kg)
SubcompactCompactMediumLargeO-roadSUV
Ene
rgy
cons
ump
tio
n (M
Jkm
)Sa
les
5
6
4
3
2
1
600k
800k
400k
200k
0k800 900 1000 1100 1200 1300 1400 1500 1600 1700 1800 1900 2000 2100
Figure 4‑2 ndash new vehicle energy consumption by vehicle weight (2013)
9 on a plain surface the sum of resistances of a vehicle is acceleration resistance + rolling resistance + aerodynamic resistance = c1 m a + c2 frr m + c3 cw a v2 with mass (m) as an integral part of both acceleration and rolling resistance which are most relevant for inner-city driving situations other factors are acceleration (a) rolling resistance of tires (frr) aerodynamic coefficient of the vehicle (cw) frontal area of vehicle (a) velocity (v) and constants (cx)
34
Brazil Passenger Vehicle Market statistics
Footprint has a reasonable correlation with energy consumption (Figure 4‑3) ie larger vehicles tend to consume more fuel than smaller vehicles however the correlation is not as strong as with vehicle weight similar to the previous figure the broad spread of energy consumption values suggests a combination of different vehicle characteristics (eg weight engine displacement rated power) and technologies (eg transmissions fuel systems) as well as the presence of suVs and off-road vehicles among the medium- and large-sized footprint values respectively
Footprint (m2)
SubcompactCompactMediumLargeO-roadSUV
Ene
rgy
cons
ump
tio
n (M
Jkm
)Sa
les
5
6
4
3
2
1
400k
500k
300k
200k
100k
0k31 32 33 34 35 36 37 38 39 40 41 42 43 44 45 46 48 49
Figure 4‑3 ndash new vehicle energy consumption by vehicle footprint (2013)
35
ICCT white paper
Figure 4‑4 illustrates sales weighted average for new vehicle energy consumption by mass for the top 10 manufacturers in Brazil in 2013 Bubble sizes are proportional to total vehicle sales Manufacturers in the lower-left quadrant produce the lightest and most efficient vehicles with hyundai presenting the best overall average energy consumption renault in the upper-left quadrant produces vehicles that are equivalent in weight but on average with higher energy consumption in the lower-right quadrant are manufacturers that produce relatively heavier vehicles but with lower energy consumption in their weight class Despite producing heavier vehicles on average than many manufacturers honda achieves lower energy consumption on average in the upper-right quadrant are manufacturers that produce on average the heavier and least efficient vehicles with Psa (citroen and Peugeot) producing the heaviest and least efficient cars on average a regression line correlating vehicle energy consumption and mass highlights the best performers (hyundai honda and nissan) average performers (Fiat Volkswagen gM and toyota) and those performing worse than average (renault Ford and Psa)
FIA
GMVW
FORREN
HYU
HON
TOY
PSA
NIS
160
170
180
190
200
210
220
230
240
250
950 1000 1050 1100 1150 1200 1250 1300 1350
Ene
rgy
cons
ump
tio
n (M
Jkm
)
Curb weight (kg)
Fleet Ave
Figure 4‑4 ndashaverage new vehicle sales-weighted energy consumption by manufacturer (2013)
36
Brazil Passenger Vehicle Market statistics
Figure 4‑5 shows fleet-average energy consumption based on certification and type approval data for new vehicles in multiple countries converted to the us caFe combined driving cycle Bubble sizes represent total sales of new passenger cars Because of data availability in different countries the country comparison is based on different calendars years for different countries 2011 for south Korea and japan 2012 for china and india and 2013 for europe the us and Brazil given annual improvements in vehicle energy consumption triggered by regulatory efficiency standards and fiscal incentives those countries with older data could be at a slight disadvantage in this comparison
With the heaviest vehicles on average the us fleet is also the most energy consuming of all countries china and south Korea have similar average energy consumption but since south Korean vehicles are heavier on average they are relatively more efficient than chinese vehicles although Brazilrsquos fleet consumes less fuel on average than those from the us china and south Korea its fleet is relatively inefficient when compared to countries with vehicles of similar weight (japan and india) the average Brazilian vehicle consumes about 34 more energy than the average vehicle in japan whose fleet has a large penetration of gasoline hybrid and advanced fuel-efficiency technologies such as three-cylinder engines VVa Dohc and 6-plus speed transmissions european vehicles are the best performing on average despite being heavier than all countries with the exception of the us and south Korea the adoption of fuel-efficiency technologies (eg Dct 6-plus-speed transmissions gDi turbocharging) contributes to europersquos better than average performance
China2012
SKorea2011
Europe2013
US2013
Japan2011
India2012
Brazil2013
Sales5 MM10 MM
14
16
18
20
22
24
26
28
1000 1100 1200 1300 1400 1500 1600 1700
Ene
rgy
cons
ump
tio
n ndash
CA
FE
(M
Jkm
)
Curb weight (kg)
Type-approval and certification energy consumption data only (does not include o-cycle or real-world driving data)
Figure 4‑5 ndash international comparison of passenger car energy consumption
Country labels indicate the dataset year
Figure 4‑6 provides a more detailed country comparison by illustrating average vehicle energy consumption by vehicle (curb) weight bin Vehicle sales in each bin are shown for reference the us is not shown due to lack of detailed model-by-model data Brazilrsquos vehicles on average have the highest energy consumption in most weight
37
ICCT white paper
bins with china being the second highest in most bins Because china has higher fuel consumption than Brazil on the 1000 bin which represents the highest share of vehicle sales fleet-average energy consumption in china is still higher than in Brazil as illustrated in the previous figure europe consistently performs best in terms of vehicle energy consumption in most weight bins with japan also performing relatively well
Curb weight (kg)
BrazilChinaEuropeIndiaJapanSouth Korea
Ene
rgy
cons
ump
tio
n C
AF
E (
MJ
km)
Sale
s
40
35
25
20
15
10
6M
8M
4M
2M
0M600 800 1000 1200 1400 1600 1800 2000 2200 2400
Figure 4‑6 ndash international comparison of average vehicle energy consumption by vehicle weight
Type-approval and certification energy consumption data only (does not include off-cycle or real-world driving data)
38
Brazil Passenger Vehicle Market statistics
Figure 4‑7 illustrates the distribution of energy consumption data in Brazil for each vehicle version by mass and segment Bubble sizes represent total sales of each version Data were limited to flex-fuel vehicles in the subcompact compact medium and large segments due to its relatively better data quality and representativeness (ie they represented over 87 of sales in 2013) While most vehicles follow a predictable trend that correlates energy consumption and vehicle mass there are a large number of versions with energy consumption substantially higher than the trend line this suggests there is substantial room for improvements in their energy consumption since there are vehicles in similar weight classes with substantially superior energy consumption performance
Sales1000050000
140
160
180
200
220
240
260
280
700 800 900 1000 1100 1200 1300 1400 1500 1600
Ene
rgy
cons
ump
tio
n (M
Jkm
)
Curb weight (kg)
Subcompact Compact Medium Large Fleet average
Figure 4‑7 ndash Distribution of new Brazilian passenger vehicle energy consumption data by vehicle weight and segment (2013)
this chapter suggests that there are potential improvements in vehicle energy consumption for the Brazilian fleet For similar vehicles in terms of weight class footprint or engine rating there is substantial dispersion in energy consumption indicating that there are vehicles performing much worse than the average across manufacturers there is also a clear trend of some manufacturers performing much better than the average while others have a lot more room for improvement the international comparison clearly shows that Brazilian vehicles perform much worse in terms of energy consumption than vehicles of similar weight suggesting a delay in the adoption of energy efficient technologies among Brazilian vehicle manufacturers
Finally a more detailed analysis of vehicle versions clearly illustrates a considerable number of vehicle versions significantly above average thus indicating potential improvements in energy consumption that would place them on par with better performing vehicles with similar characteristics
39
ICCT white paper
Deficiencies in data quality and completeness prevent more definite conclusions about vehicle energy consumption gasoline-only vehicles in particular have poor energy consumption data quality although they represent a relatively small fraction (6) of total vehicles sold in 2013 Because some vehicle segments are primarily composed of gasoline-only vehicles (eg sports minivans) this chapter excludes these segments from the analysis there are also concerns about the gap between energy consumption data reported by iBaMarsquos nota Verde and Brazilrsquos national institute of Metrology standardization and industrial Qualityrsquos (inMetro) labeling program (PBeV using its acronym in Portuguese) with the latter reporting consistently lower values of vehicle energy consumption
Finally the availability of energy consumption data was not adequate for many manufacturers beyond the top 10 sales group which prevented their inclusion in this analysis Despite the data quality and lack of completeness the energy consumption data in this chapter include data that are reasonably accurate and representative thus supporting its interpretation
40
Brazil Passenger Vehicle Market statistics
rEfErENCES
aDK automotive consultoria de Marketing (2013) relatoacuterios de volumes de vendas do mercado brasileiro para veiacuteculos de passeio e comerciais leves referentes a 2013
alves l Wilbert M (2014) reduccedilatildeo do imposto sobre Produto industrializado e a Venda de automoacuteveis Xi congresso usP iniciaccedilatildeo cientiacutefica em contabilidade
associaccedilatildeo nacional de transportes Puacuteblicos (antP 2014) estudo mostra baixo efeito do desconto no iPi de veiacuteculos sobre PiB e emprego available at httpwwwantporgbrwebsitenoticiasshowaspnpgcode=a4DeeFe8-a7BF-48D3-B1F5-8eDe1447BF10
associaccedilatildeo nacional dos Fabricantes de Veiacuteculos automotores (anFaVea 2015) anuaacuterio da induacutestria automobiliacutestica Brasileira 2015 Brazilian automotive industry Yearbook 2015 satildeo Paulo available at wwwanfaveacombr
european environment agency (2014) Monitoring co2 emissions from new passenger cars in the eu summary of data for 2013 april 2014
instituto Brasileiro do Meio ambiente e dos recursos naturais renovaacuteveis (iBaMa 2014) consulta dos niacuteveis de emissatildeo dos veiacuteculos novos brasileiros available at httpsservicosibamagovbrctfpublicosel_marca_modelo_rvepphp
international council on clean transportation (icct 2015) global passenger vehicle standards available at httpwwwtheicctorginfo-toolsglobal-passenger-vehicle-standards
international energy agency (iea 2015) renewables Bioenergy available at httpswwwieaorgtopicsrenewablessubtopicsbioenergy
Korea energy Management corporation (KeMco 2014) Fuel economy regulation available at httpwwwkemcoorkrnew_engmainmainasp
Marklines (2015) Marklines automotive industry Portal available at httpwwwmarklinescomen
Mendonccedila M sachsida a (2014) Modelando a demanda de creacutedito para veiacuteculos no Brasil uma abordagem com mudanccedila de regime iPea
Ministeacuterio do Desenvolvimento induacutestria e comeacutercio exterior (MDic 2013) Programa de incentivo agrave inovaccedilatildeo tecnoloacutegica e adensamento da cadeia Produtiva de Veiacuteculos automotores mdash inovar-auto httpwwwplanaltogov brccivil_03_ato2011-20142012DecretoD7819htm
stein r anderson j and Wallington t (2013) an overview of the effects of ethanol-gasoline Blends on si engine Performance Fuel efficiency and emissions SAE Int J Engines 6(1)470-487 2013 doi1042712013-01-1635
us environmental Protection agency and national highway traffic safety administration (ePanhtsa 2010) Final rulemaking to establish light-Duty Vehicle greenhouse gas emission standards and corporate average Fuel economy standards ePa-420-r-10-901
us environmental Protection agency (ePa 2012) regulatory impact analysis Final rulemaking for 2017-2025 light-Duty Vehicle greenhouse gas emission standards and corporate average Fuel economy standards ePa-420-r-12-016
41
ICCT white paper
us national academy of sciences (nas 2011) assessment of Fuel economy technologies for light-Duty Vehicles available at httpwwwnapeducatalog12924assessment-of-fuel-economy-technologies-for-light-duty-vehicles
World Bank group (2015) World Development indicators available at httpdataworldbankorgdata-catalogworld-development-indicators
42
Brazil Passenger Vehicle Market statistics
LiST Of ACrONyMS
4wD Four-wheel drive
aNFaVEa Brazilian association of automobile Manufacturers
awD all-wheel drive
BRiC Brazil russia india china
CaFE corporate average fuel economy
CBG compressed biogas
CO2 carbon dioxide
CVT continuously variable transmission
CVVT continuously variable valve technology
DCT Dual-clutch transmission
DOhC Dual overhead camshaft
EC energy consumption
Epa us environmental Protection agency
EU european union
FFV Flex-fuel vehicle
FTp Federal test procedure
FwD Front-wheel drive
GDi gasoline direct injection
GDp gross domestic product
GhG greenhouse gas
GM general Motors
iBaMa Brazilian institute of the environment and renewable natural resources
iC internal combustion
iCCT international council on clean transportation
iNMETRO national institute of Metrology standardization and industrial Quality
Kg Kilogram
Km Kilometer
Kw Kilowatt
LDV light-duty vehicle
LpG liquified petroleum gas
MDiC Ministry of Development industry and Foreign trade
MJ Megajoule
MpFi Multi-point fuel injection
Mpg Miles per gallon
NaS us national academy of sciences
43
ICCT white paper
NhTSa us national highway transportation safety administration
OhV overhead valve
pBEV Brazilian Vehicle labeling Program
pSa Psa Peugeot citroeumln
pTwR Power-to-weight ratio
pV Passenger vehicle
RwD rear-wheel drive
SOhC single overhead camshaft
SUV sport utility vehicle
US united states
USD us dollar
VTEC Valve timing electronic control
VVa Variable valve actuation
VVL Variable valve lift
44
Brazil Passenger Vehicle Market statistics
AppENDix A SEGMENT DEfiNiTiONS
Table a‑1 ndash segment definitions
Segmentpower (kw)
pTwR (kwkg) area (m2)
Other characteristics Examples
Subcompact lt 140 lt 0075 le 65 mdash Mini cooper chevrolet celta smart Fortwo
Compact lt 140 lt 0075 65 lt area le 70 mdash honda Fit hyundai hB20 Volkswagen Polo
Medium lt 140 lt 0075 70 lt area le 80 mdash honda civic nissan tiida Peugeot 308
Large lt 140 lt 0075 gt 80 mdash audi a4 BMW 3 series Mercedes c-class
Sports gt 140 gt 0075 mdash 4 seats maxjaguar XF lamborghini gallardo Ferrari california
Off‑road mdash mdash lt 80 traction = 4WDjeep cherokee honda cr-V BMW X3 hyundai santa Fe
SUV mdash mdash lt 80Based on aDKrsquos default classification
BMW X1 Ford ecosport hyundai tucson
Minivan mdash mdash Passengers 6-12
citroen grand Picasso Kia carnival
45
ICCT white paper
AppENDix b iNTErNATiONAL MArKET DATA
Table B‑1 ndash international market comparison of new fleet characteristics
parameters China S Korea EU US Japan india Brazil
Year 2012 2011 2013 2013 2011 2012 2013
Sales (million) 155 13 118 156 352 256 304
price (USD) $21008 $21383 $24439 mdash $20637 $11717 $22015
No of cylinders mdash 43 40 47 38 36 40
Displacement (cc) 1605 1960 1613 2606 1425 1294 1430
Curb weight (kg) 1296 1421 1391 1623 1193 1059 1106
Length (mm) 4323 4531 4263 mdash 4013 3859 4100
Footprint (m2) 38 420 40 425 371 341 367
Engine power (kw) 86 120 89 148 78 55 76
pTwR (kwkg) 00664 00844 00640 00912 00654 00519 00671
Energy consumption ndash US CaFE (MJKm)[1] 235 206 169 250 171 183 202
[1] energy consumption data presented here for countries other than Brazil were obtained from local official sources in its original metric and drive cycle and then converted to Mjkm under the us caFe drive cycle using the methodology described in Yang (2015) Mode details and historical fuel consumption data on their original metrics is presented in the icctrsquos global PV standard website httpwwwtheicctorginfo-toolsglobal-passenger-vehicle-standards
Data Sources
China Ministry of industry and information technology (Miit 2014) corporate average Fuel efficiency accounting Method for Passenger cars available at httpwwwgovcngzdt2013-0320content_2358627htm
Baseline performance china automotive research and technology center through internal communication and icct internal 2010 database for chinese light-duty vehicles
S Korea internal communication with s Korean official and from greencarcongress available at httpwwwgreencarcongresscom200906korea-20090604html
EU european environment agency (2014) Monitoring co2 emissions from new passenger cars in the eu summary of data for 2013 april 2014
US us ePa (2014) light-duty automotive technology carbon dioxide emissions and fuel economy trends1975 through 2014 table 91 page 110 available at http httpwwwepagovfueleconomyfetrends1975-2014420r14023apdf
Japan jaMa (2010) the Motor industry of japan available at httpwwwjama-englishjppublicationsMVs2010pdf Mlit httpwwwmlitgojpcommon000990330pdf
india Bureau of energy efficiency white paper 2010-2012 calculation based on icct database
Brazil icct Brazil Vehicle Database (2013)
46
Brazil Passenger Vehicle Market statistics
Table B‑2 ndash international market comparison of technology adoption in new vehicles
Technology adoption China S Korea EU US Japan india Brazil
Year 2010 2011 2013 2013 2011 2012 2013
Fuel type
CBGLpGFlex 0 11 2 0 0 4 94
Gasoline 99 65 44 93 86 56 6
hybrid 0 1 1 5 13 0 0
Diesel 1 23 53 1 0 40 0
No of cylinders
Two 0 0 0 0 0 6 0
Three 4 0 7 0 36 28 3
Four 90 84 87 56 57 65 97
Five 0 0 1 0 0 0
Six 6 15 4 32 5 0 1
Eight or more 0 0 0 12 1 0 0
Transmission
Manual 60 3 83 5 1 98 83
automatic 34 90 9 75 34 2 15
CVT 5 7 2 18 65 0 1
DCT 1 0 6 2 mdash 0 1
Number of gear ratios
Four or fewer 13 16 1 7 mdash 10 6
Five 68 9 45 11 mdash 85 83
Six or more 19 75 54 82 mdash 5 11
Drivetrain
FwD 74 86 81 83 59 76 0
RwD 21 7 7 10 5 22 0
4wD and awD 5 7 12 7 36 2 100
No of valves per cylinder
Two 17 mdash mdash 2 4 25 60
Multi valve 83 mdash mdash 98 95 75 40
Valve camshaft configuration
Single overhead camshaft 26 1 mdash mdash 16 41 63
Dual overhead camshaft 74 84 mdash mdash 82 53 25
Overhead camshaft mdash 15 mdash mdash 0 6 mdash
Valve actuation
Fixed 50 16 mdash 2 11 86 78
VVT 44 84 mdash 98 89 12 16
VVL 6 mdash mdash mdash mdash 2 6
Fuel systems for gasoline vehicles
Multi‑point fuel injection 94 72 68 62 95 100 98
Gasoline direct injection 6 28 32 37 5 0 2
air induction systems for gasoline vehicles
Naturally aspirated 93 75 41 85 92 64 97
Supercharger turbocharger or twin‑turbo 7 25 59 15 8 36 3
47
ICCT white paper
AppENDix C NEW vEhiCLE ChArACTEriSTiCS AND TEChNOLOGy ADOpTiON DATA iN brAziL
Table C‑1 ndash Fleet characteristics of new Brazilian passenger vehicles by segment (2013)
parameters Subcompact Compact Medium Large Sports Off‑road SUV Minivan
Sales (thousands) 6785 6843 11790 1920 273 768 1997 23
Market share () 223 225 38 8 63 09 25 65 01
price (R$) $30103 $38732 $45496 $66508 $148834 $151284 $75164 $82284
No of cylinders 400 391 399 400 462 448 404 433
Displacement (cc) 1128 1293 1447 1794 2430 2586 1884 2244
Curb weight (kg) 940 1037 1102 1329 1561 1772 1395 1604
Length (mm) 3804 4026 4163 4499 4711 4516 4352 4658
Footprint (m2) 339 361 371 402 418 409 402 427
Engine power ndash gasoline (kw) 58 68 75 99 183 146 103 120
Engine power ndash ethanol (kw) 59 70 77 98 mdash 109 101 mdash
pTwR ndash gasoline (kwkg) 00614 00655 00671 00742 01173 00828 00731 00732
pTwR ndash ethanol (kwkg) 00630 00678 00697 00757 mdash 00766 00745 mdash
48
Brazil Passenger Vehicle Market statistics
Table C‑2 ndash Fleet characteristics of new Brazilian passenger vehicles by manufacturer (2013)
parameters Fiat
GM
Vo
lksw
agen
Ford
Ren
ault
hyu
ndai
ho
nda
Toyo
ta
pSa
Nis
san
Mit
sub
ishi
Kia
JaC
BM
w
Land
Rov
er
Mer
ced
es‑B
enz
Che
ry
aud
i
Suzu
ki
Jeep
Sales (thousands) 6087 5486 5448 3074 2207 2055 1392 1334 1163 621 368 255 158 141 106 94 80 67 63 36
Market share () 2002 1804 1792 1011 726 676 458 439 383 204 121 084 052 046 035 031 026 022 021 012
price (R$) $35017 $42259 $38701 $46174 $43447 $50112 $67078 $68922 $103001 $44035 $100696 $87009 $37654 $165111 $221943 $153281 $30821 $142799 $74769 $139039
No of cylinders 400 401 400 402 400 370 400 400 400 400 408 416 400 424 448 431 400 411 400 552
Displacement (cc) 1250 1340 1287 1497 1423 1495 1691 1808 1575 1579 2262 1856 1411 2095 2281 1934 1398 1912 1831 3182
Curb weight (kg) 1033 1060 1020 1156 1102 1122 1210 1201 1231 1069 1556 1377 1079 1624 1868 1598 1097 1551 1444 1945
Length (mm) 3965 4155 3993 4120 4127 4078 4319 4299 4116 4171 4401 4357 3956 4574 4487 4527 3896 4454 4234 4584
Footprint (m2) 345 370 354 368 378 383 397 387 376 379 395 407 351 429 433 429 349 417 323 420
Engine power ndash gasoline (kw) 64 71 65 79 73 86 96 90 80 82 120 112 83 151 179 138 71 136 94 162
Engine power ndash ethanol (kw) 65 72 65 79 76 85 97 90 81 82 107 106 95 mdash mdash mdash 75 mdash mdash mdash
pTwR ndash gasoline (kwkg)
00613 00662 00631 00674 00657 00739 00788 00745 00646 00766 00779 00792 00784 00921 00977 00856 00638 00870 00649 00835
pTwR ndash ethanol (kwkg) 00629 00681 00642 00693 00685 00781 00800 00795 00660 00768 00710 00798 00896 mdash mdash mdash 00659 mdash mdash mdash
49
ICCT white paper
Table C‑3 ndash Fleet characteristics of new Brazilian passenger vehicles by origin (2013)
parameters Domestic imported
Sales (thousands) 2537 504
Market share () 834 166
price (R$) $41739 $76049
No of cylinders 397 412
Displacement (cc) 1359 1791
Curb weight (kg) 1070 1289
Length (mm) 4063 4285
Footprint (m2) 362 390
Engine power ndash gasoline (kw) 70 102
Engine power ndash ethanol (kw) 73 84
pTwR ndash gasoline (kwkg) 0065 0076
pTwR ndash ethanol (kwkg) 0068 0074
50
Brazil Passenger Vehicle Market statistics
Table C‑4 ndash technology adoption in new Brazilian passenger vehicles by segment (2013)
Technology adoption Subcompact Compact Medium Large SportOff‑road SUV Minivan
Fuel type
Flex 982 988 982 837 00 134 826 00
Gasoline 18 12 17 163 996 540 174 1000
hybrid 0000 0000 0028 0000 0396 0001 0000 0000
Diesel 00 00 00 00 00 326 00 00
No of cylinders
Three 01 91 10 00 00 00 00 00
Four 999 909 990 998 758 775 979 833
Five 00 00 00 02 03 00 00 00
Six 00 00 00 00 175 211 21 167
Eight or more 00 00 00 00 63 13 00 00
Transmission
Manual 993 944 826 622 62 174 505 641
automatic 07 55 161 283 629 707 451 359
CVT 00 00 12 89 09 93 34 00
DCT 00 01 02 06 299 25 10 00
No of gear ratios
Four or fewer 04 47 72 51 00 34 247 193
Five 984 943 848 378 15 392 516 641
Six 12 09 73 515 796 462 225 167
Seven 00 01 06 23 87 53 12 00
Eight or more 00 00 01 32 102 59 00 00
Drivetrain
FwD 998 1000 997 688 550 00 916 1000
RwD 02 00 03 311 221 00 84 00
awD 00 00 00 01 229 1000 00 00
No of valves per cylinder
Two 806 694 584 195 00 00 258 00
Multi valve 194 306 416 805 1000 1000 742 1000
Valve camshaft configuration
Single overhead camshaft 839 786 709 309 00 212 375 00
Dual overhead camshaft 24 158 161 546 880 517 446 255
Valve actuation
Fixed 982 729 807 461 49 493 664 868
VVT 18 211 115 470 827 367 252 132
VVT+VVL 00 61 78 68 124 140 84 00
Fuel systems for gasoline vehicles
Multi‑point fuel injection 999 998 997 949 979 143 766 1000
Gasoline direct injection 01 02 03 51 21 857 234 00
air induction systems for gasoline vehicles
Naturally aspirated 999 997 995 943 974 369 543 1000
Supercharger turbocharger or twin‑turbo 01 03 05 57 26 631 457 00
51
ICCT white paper
Table C‑5 ndash technology adoption in new Brazilian passenger vehicles by manufacturer (2013)
Technology adoption Fi
aT
GM
VO
LKSw
aG
EN
FOR
D
REN
aU
LT
hY
UN
Da
i
hO
ND
a
TOYO
Ta
pSa
NiS
SaN
MiT
SUB
iSh
i
Kia
JaC
BM
w
LaN
D R
OV
ER
MER
CED
ES
Fuel type
Flex 990 987 965 966 997 921 999 886 928 998 283 739 31 42 00 00
Gasoline 10 09 35 34 03 79 01 35 72 02 557 255 969 957 663 950
hybrid 00 00 00 00 00 00 00 02 00 00 00 00 00 00 00 00
Diesel 00 04 00 00 00 00 00 77 00 00 160 06 00 00 337 50
No of cylinders
Three 00 00 05 00 00 348 00 00 00 00 00 00 00 00 00 00
Four 1000 996 994 989 1000 626 999 998 1000 1000 958 922 1000 906 787 878
Five 00 00 00 00 00 00 00 00 00 00 00 00 00 00 00 00
Six 00 02 01 11 00 26 01 02 00 00 42 78 00 68 185 87
Eight or more 00 02 00 00 00 00 00 00 00 00 00 00 00 26 28 35
Transmission
Manual 992 878 985 846 853 632 566 565 703 785 493 120 1000 02 00 151
automatic 08 103 00 137 62 285 355 160 297 121 118 793 00 575 18 14
CVT 00 19 15 16 41 70 01 246 00 00 139 87 00 423 982 836
DCT 00 00 00 00 43 13 78 30 00 94 251 00 00 00 00 00
No of gear ratios
Four or fewer 02 04 00 55 104 237 00 323 249 132 17 133 00 00 00 00
Five 981 811 963 839 797 623 861 643 684 828 530 107 1000 00 00 64
Six 17 185 29 106 99 140 139 07 67 40 453 754 00 217 800 00
Seven 00 00 07 00 00 00 00 27 00 00 00 00 00 08 00 936
Eight or more 00 00 00 00 00 00 00 00 00 00 00 06 00 775 200 00
Drivetrain
FwD 1000 902 989 972 987 985 990 892 1000 1000 496 623 1000 00 00 00
RwD 00 91 00 00 00 00 00 16 00 00 00 370 00 882 00 900
awD 00 06 11 28 13 15 10 92 00 00 504 07 00 118 1000 100
No of valves per cylinder
Two 811 864 988 745 220 00 00 00 00 00 00 00 00 00 00 00
Multi Valve 189 136 12 255 780 1000 1000 1000 1000 1000 1000 1000 1000 1000 1000 1000
Valve camshaft configuration
SOhC 836 755 914 675 832 00 04 00 497 398 331 00 00 00 00 00
DOhC 07 108 56 50 168 992 786 875 352 428 477 1000 907 810 860 453
Valve actuation
Fixed 1000 898 965 966 940 29 00 574 736 573 435 76 124 187 18 55
VVT 00 102 35 34 60 971 00 426 264 427 00 924 876 00 982 945
VVT+VVL 00 00 00 00 00 00 1000 00 00 00 565 00 00 813 00 00
air induction System
Naturally aspirated 997 994 966 977 997 988 1000 923 922 1000 835 936 1000 97 37 101
Supercharger turbocharger or twin‑turbo
03 06 34 23 03 12 00 77 78 00 165 64 00 903 963 899
Fuel systems for gasoline vehicles
Multipoint fuel injection 1000 995 965 972 1000 989 1000 1000 967 1000 994 1000 1000 78 15 158
Gasoline Direct injection 00 05 35 28 00 11 00 00 33 00 06 00 00 922 985 842
note Difference between 100 and summation of sohc and Dohc market share values corresponds to data not available
52
Brazil Passenger Vehicle Market statistics
AppENDix D DATA SOurCES AND COMpLETENESS
the basis of the statistics shown in this report is a database compiled by the icct with vehicle sales technical information (eg fleet characteristics technology content) and energy consumption (converted from either co2 emissions or fuel economy) from various data sources outlined in table D-1
Table D‑1 ndash Brazilian data sources
parameters Sales TechnicalEnergy
consumption
aDK (2014 2015) x x
MarkLines (2015) x
iBaMa (2014) x
iNMETRO (2014) x
UOL (2014) x
icarroscom (2014) x
this analysis examined energy consumption data from two public sources the nota Verde Program by the Brazilian institute of the environment and renewable natural resources (iBaMa) and the Brazilian Vehicle labeling Program (PBeV) by the national institute of Metrology standardization and industrial Quality (inMetro) table D-2 summarizes key differences between these two data sources
Table D‑2 ndash energy consumption data sources
iBaMa iNMETRO
program nota Verde1 Brazilian Vehicle labeling Program (PBeV)2
program description
Mandatory program that reports emissions of co2 co nox and nMhc as part of emissions certification program
Voluntary program since 2009 that allows the comparison of fuel economy across vehicle models
Unit gco2 km kml
Test cycle chassis testing under urban (FtP) driving cycle based on nBr 66012005
chassis testing under urban (FtP) and highway (hWYFe) driving cycles based on nBr 702420103
adjustment
no adjustment for real-world driving conditions Because reported co2 emissions are assumed to be zero for ethanol adjustments were made to account for tailpipe co2 emissions for vehicles running on ethanol
since 2010 published values include real-world adjustment factors to chassis test data a method adopted by the us ePa in 2008
Conversion to MJkm
iBaMarsquos data are reported as FtP (city test) co2 data in gco2 km conversion to caFe test cycle and to a different metric (Mjkm) involves four steps as presented in Figure D-1
inMetrorsquos data in kml are presented separately by fuel type (e22 e100) and driving cycle (urban highway) conversion to Mjkm was done by applying a conversion factor (2167 gco2 l for e22 and 1428gco2l for e00) caFe values are obtained by using a 5545 weighting for the urban (FtP) and highway cycles respectively
1 iBaMa (2014) nota Verde program available at httpwwwmmagovbrcidades-sustentaveisqualidade-do-arcontrole-de-emissoes-veicularesnota-verde
2 inMetro (2014) Programa Brasileiro de etiquetagem Veicular (PBeV) available at httpwwwinmetrogovbrconsumidortabelas_pbe_veicularasp
3 inMetro (2014) Metodologia Para Divulgaccedilatildeo De Dados De consumo Veicular available at httpwwwinmetrogovbrconsumidorpbeMetodologia_consumo_Veicularpdf
53
ICCT white paper
Step 1 Correcting the original IBAMA CO2 reported data ndash FTP CO2 gkm
IBAMArsquos CO2 reported values are corrected to account for tailpipe emissions from ethanol (tailpipe CO2 emissions are reported as zero in IBAMArsquos data)
bull E22 FTP reported CO2 data are reduced by 177bull E100 FTP reported CO2 data are reduced by 100
Flex fuel vehicles are tested with E22 and E00 the final values is calculated as the average of both fuelsCO2 IBAMA_Flex_FTP= 05(1-0177)CO2_E22_test_FTP + 050E100_FTP = 050823CO2_E22_FTPFor Gasoline only vehicles the tests are carried out only with Gasoline E22CO2 IBAMA_Gasoline_FTP = (1-0177) CO2_E22_Test_FTP
Where in the previous equations CO2_E22_FTP means CO2 emissions values obtained under FTP testingCO2 IBAMA_Flex_FTP means IBAMArsquos Corrected FTP values for flex vehiclesCO2 IBAMA_Gasoline_FTP means IBAMArsquos Corrected FTP values for gasoline only (E22) vehicles
INNOVAR AUTO is based on energy consumption data obtained as the combined CAFE test cycle This requires a weighted average of energy consumption data obtained from FTP testing (city driving ) and Highway fuel economy testing (HWFET) In mathematical form CAFE=f(FTPHWFET)
Given that IBAMA data is provided for only the first aprt the FTP testing then it is required to find a way to calculate CAFE combined values through FTP -75 only data A linear function was thus developed from data with FTP and HWY values (INMETRO data) is used to convert FTP only values to CAFE CO2 values ie CAFE=f(FTP) The function used for this conversion is
CO2_CAFE= (CO2_FTP+44756)11572
Step 2Convert FTP CO2 values to CAFE CO2 values
Converting CO2 values to MJkm values is done by using the energy density of E22 Note that all the previous calculations for CO2 come from E22-based data
bull The energy density of E22 is 2894 MJLE22bull E22 emits 2167gCO2LE22bull CAFE (MJkm) = CAFE (gCO2km) (2894 MJLE22 2167 gCO2LE22)
Step 3 Convert US CAFE CO2 values to MJkm values
Figure D‑1 ndash conversion of emission to energy consumption data
energy consumption values calculated from iBaMa and inMetro data differ greatly Figure D-1 illustrates energy consumption data for those models in both databases iBaMa data are on average 126 higher than inMetro data with a standard deviation of 89 and a maximum deviation of 39
54
Brazil Passenger Vehicle Market statistics
0
05
1
15
2
25
3
0 05 1 15 2 25 3
Ene
rgy
cons
ump
tio
n IB
AM
A (
MJ
km)
Energy consumption INMETRO (MJkm)
n=151
Figure D‑2 ndash comparison between energy consumption data from inMetro and iBaMa
151 vehicles tested under both programs
although inMetro data are more transparent as it breaks down fuel economy by fuel and test cycle it is still a voluntary program that allows manufacturers to select which models will participate in addition not all manufacturers participate in the program in turn iBaMa data only include co2 data for the urban cycle and thus energy consumption in the combined cycle had to be estimated from correlations using international data in addition corrections had to be made for gasoline-only engines since it seems that a co2 discount in theory only applicable to flex-fuel engines was also applied to gasoline-only engines Despite these data quality issues iBaMa data were considered the most adequate data source for energy consumption because it is a mandatory program that requires data reporting by all vehicle models and manufacturers
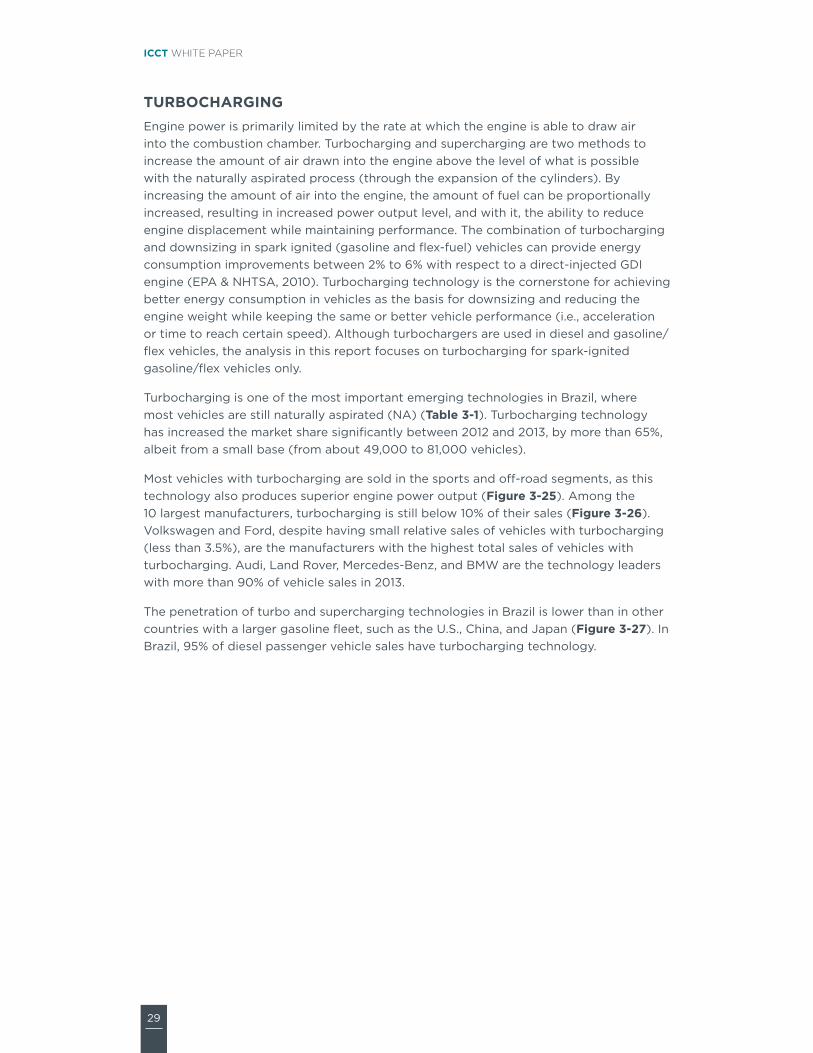
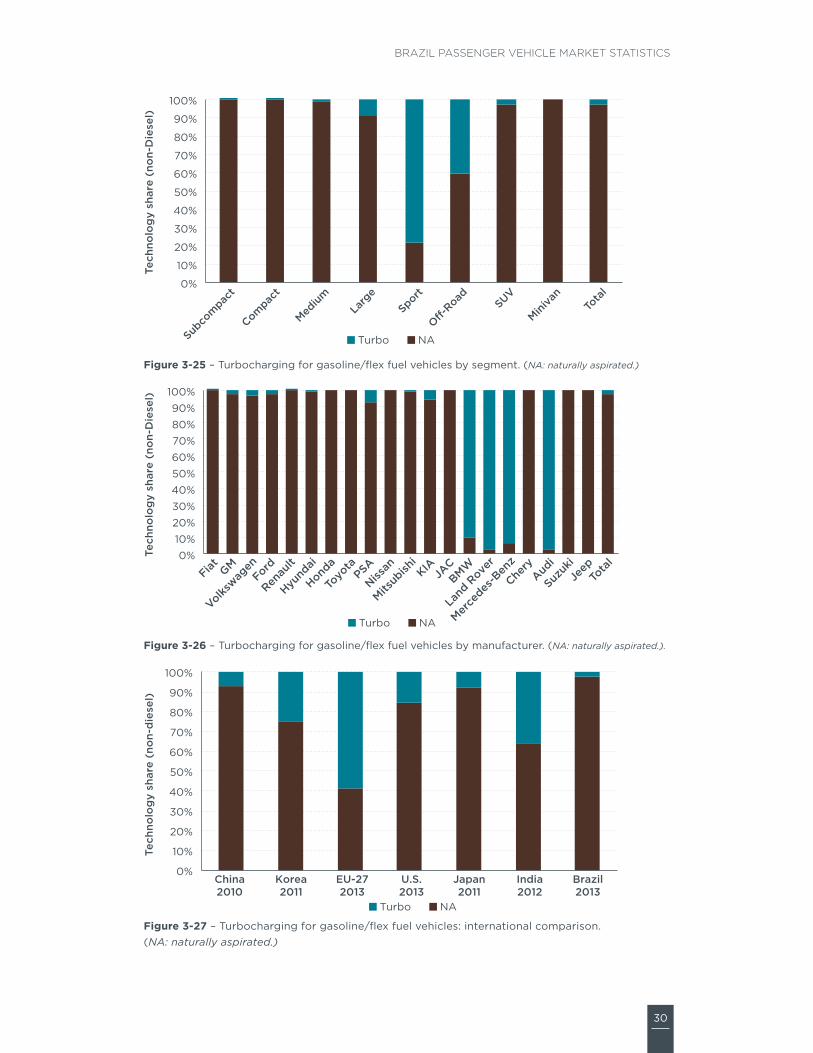
30
Brazil Passenger Vehicle Market statistics
0
10
20
30
40
50
60
70
80
90
100
Compac
t
Subco
mpac
t
Medium
Larg
eSport
O-Road SUV
Miniva
nTo
tal
Tech
nolo
gy
shar
e (n
on-
Die
sel)
Turbo NA
Figure 3‑25 ndash turbocharging for gasolineflex fuel vehicles by segment (NA naturally aspirated)
0102030405060708090
100
Fiat GM
Volkswag
enFord
Renau
lt
Hyund
ai
Honda
Toyo
taPSA
Nissan
Mitsub
ishiKIA
JACBMW
Land
Rove
r
Merce
des-B
enz
Chery
Audi
Suzuk
iJe
epTo
tal
Tech
nolo
gy
shar
e (n
on-
Die
sel)
Turbo NA
Figure 3‑26 ndash turbocharging for gasolineflex fuel vehicles by manufacturer (NA naturally aspirated)
0
10
20
30
40
50
60
70
80
90
100
China2010
Korea2011
EU-272013
US2013
Japan2011
India2012
Brazil2013
Tech
nolo
gy
shar
e (n
on-
die
sel)
Turbo NA
Figure 3‑27 ndash turbocharging for gasolineflex fuel vehicles international comparison (NA naturally aspirated)
31
ICCT white paper
4 vEhiCLE ENErGy CONSuMpTiON
this section analyzes the Brazilian new passenger vehicle energy consumption in 2013 although other metrics are more common (see box) vehicle energy consumption is presented in megajoules per kilometer (Mjkm) for consistency with Brazilrsquos inovar-auto policy in 2012 Brazilrsquos Ministry of Development industry and Foreign trade (MDic) adopted the inovar-auto policy with the aim of fostering industrial competitiveness through technology investments the policy includes a target for corporate average energy consumption (in Mjkm with vehicle curb weight as the attribute parameter) for vehicles sold in 2017
in the us canada Mexico and saudi arabia fleet-average fuel economy standards are defined as a function of vehicle footprint in the eu china japan south Korea and india vehicle weight is the attribute for the calculation of fleet-average targets in Brazil inovar-auto has defined its fiscal targets for vehicle energy consumption measured in megajoules per kilometer (Mjkm) as a function of vehicle weight
VEhiCLE ENERGY MEaSUREMENT UNiTS
Many metrics can be used to describe the amount of fuel energy or emissions generated by unit of distance traveled
Fuel economy measures distance traveled per unit of fuel consumed in Brazil kilometers per liter (kml) is the most common metric to describe vehicle efficiency but other units are used in different countries such as miles per gallon (mpg) in the us
Fuel consumption is the reciprocal of fuel economy and measures fuel consumed per distance traveled it is usually expressed in liters per 100 kilometers (l100 km) and it is used in europe for example
GhGCO2 emissions measures ghg or co2 emissions per distance traveled expressed as grams of pollutant per kilometer or mile
Energy consumption (EC) measures the energy consumed per distance traveled for example in megajoules per kilometer Despite being a less common metric it is sometimes preferred for being a fuel-neutral metric across different types of fuel and vehicle technologies Vehicle energy consumption in Mjkm is the metric used in Brazilrsquos inovar-auto policy to quantify the corporate average energy consumption target for each manufacturer Values for energy consumption in Brazilian spark-ignited vehicles are provided for e22 since that is the fuel mixture used in vehicle tests
Vehicle energy consumption in this report is calculated from co2 emissions data in the Brazilian institute of environment and renewable natural resources (iBaMa) nota Verde program (iBaMa 2014) which reports official emissions data from homologation tests Data are limited to passenger cars sold by the top 10 manufacturers with light commercial vehicles being excluded appendix D presents a description of data sources
32
Brazil Passenger Vehicle Market statistics
and calculation methodologies as well as a discussion of vehicle energy consumption data quality and completeness in Brazil
not surprisingly vehicle energy consumption increases with vehicle footprint and engine rated power the two parameters that define vehicle segments in Brazil (Figure 4‑1) subcompact and compact vehicles which accounted for about 45 of new sales in 2013 have average energy consumption below the fleet average while medium-sized vehicles which hold the largest market share (388) have energy consumption just above the fleet average larger more powerful vehicles consume more energy than the fleet average but have a considerably smaller market share (combined share of 163) Data availability for these segments is not as extensive as the data available for the subcompact compact and medium segments which could affect the relative rankings of each segment
Ene
rgy
cons
ump
tio
n (M
Jkm
)
Subco
mpac
t
Compac
t
Medium
Larg
e
O-road SUV
4000
200000
400000
600000
850000
35
30
25
20
15
10
05
0
Sales
Total 202
Figure 4‑1 ndash new vehicle sales-weighted average energy consumption by segment (2013)
33
ICCT white paper
Figures 4‑2 and 4‑3 illustrate new vehicle energy consumption for multiple weight and footprint bins For each weight bin (in 100 kg increments) and footprint bin (in 01 m2 increments) sales-weighted averages of energy consumption for each vehicle version are presented (dashes) generating energy consumption ranges for each bin (cream areas) Vehicle sales by bin are presented for reference in the lower charts
the strong correlation between vehicle energy consumption and weight follows from the strong physical relationship between the weight of the vehicle and the energy required to accelerate it and overcome resistances9 (Figure 4‑2) Data dispersion within each bin suggests that energy consumption varies due to other vehicle characteristics that affect vehicle aerodynamics and rolling resistance as well as the adoption of technologies that affect engine and transmission efficiency (eg friction reduction technologies gDi VVt)
Curb weight (kg)
SubcompactCompactMediumLargeO-roadSUV
Ene
rgy
cons
ump
tio
n (M
Jkm
)Sa
les
5
6
4
3
2
1
600k
800k
400k
200k
0k800 900 1000 1100 1200 1300 1400 1500 1600 1700 1800 1900 2000 2100
Figure 4‑2 ndash new vehicle energy consumption by vehicle weight (2013)
9 on a plain surface the sum of resistances of a vehicle is acceleration resistance + rolling resistance + aerodynamic resistance = c1 m a + c2 frr m + c3 cw a v2 with mass (m) as an integral part of both acceleration and rolling resistance which are most relevant for inner-city driving situations other factors are acceleration (a) rolling resistance of tires (frr) aerodynamic coefficient of the vehicle (cw) frontal area of vehicle (a) velocity (v) and constants (cx)
34
Brazil Passenger Vehicle Market statistics
Footprint has a reasonable correlation with energy consumption (Figure 4‑3) ie larger vehicles tend to consume more fuel than smaller vehicles however the correlation is not as strong as with vehicle weight similar to the previous figure the broad spread of energy consumption values suggests a combination of different vehicle characteristics (eg weight engine displacement rated power) and technologies (eg transmissions fuel systems) as well as the presence of suVs and off-road vehicles among the medium- and large-sized footprint values respectively
Footprint (m2)
SubcompactCompactMediumLargeO-roadSUV
Ene
rgy
cons
ump
tio
n (M
Jkm
)Sa
les
5
6
4
3
2
1
400k
500k
300k
200k
100k
0k31 32 33 34 35 36 37 38 39 40 41 42 43 44 45 46 48 49
Figure 4‑3 ndash new vehicle energy consumption by vehicle footprint (2013)
35
ICCT white paper
Figure 4‑4 illustrates sales weighted average for new vehicle energy consumption by mass for the top 10 manufacturers in Brazil in 2013 Bubble sizes are proportional to total vehicle sales Manufacturers in the lower-left quadrant produce the lightest and most efficient vehicles with hyundai presenting the best overall average energy consumption renault in the upper-left quadrant produces vehicles that are equivalent in weight but on average with higher energy consumption in the lower-right quadrant are manufacturers that produce relatively heavier vehicles but with lower energy consumption in their weight class Despite producing heavier vehicles on average than many manufacturers honda achieves lower energy consumption on average in the upper-right quadrant are manufacturers that produce on average the heavier and least efficient vehicles with Psa (citroen and Peugeot) producing the heaviest and least efficient cars on average a regression line correlating vehicle energy consumption and mass highlights the best performers (hyundai honda and nissan) average performers (Fiat Volkswagen gM and toyota) and those performing worse than average (renault Ford and Psa)
FIA
GMVW
FORREN
HYU
HON
TOY
PSA
NIS
160
170
180
190
200
210
220
230
240
250
950 1000 1050 1100 1150 1200 1250 1300 1350
Ene
rgy
cons
ump
tio
n (M
Jkm
)
Curb weight (kg)
Fleet Ave
Figure 4‑4 ndashaverage new vehicle sales-weighted energy consumption by manufacturer (2013)
36
Brazil Passenger Vehicle Market statistics
Figure 4‑5 shows fleet-average energy consumption based on certification and type approval data for new vehicles in multiple countries converted to the us caFe combined driving cycle Bubble sizes represent total sales of new passenger cars Because of data availability in different countries the country comparison is based on different calendars years for different countries 2011 for south Korea and japan 2012 for china and india and 2013 for europe the us and Brazil given annual improvements in vehicle energy consumption triggered by regulatory efficiency standards and fiscal incentives those countries with older data could be at a slight disadvantage in this comparison
With the heaviest vehicles on average the us fleet is also the most energy consuming of all countries china and south Korea have similar average energy consumption but since south Korean vehicles are heavier on average they are relatively more efficient than chinese vehicles although Brazilrsquos fleet consumes less fuel on average than those from the us china and south Korea its fleet is relatively inefficient when compared to countries with vehicles of similar weight (japan and india) the average Brazilian vehicle consumes about 34 more energy than the average vehicle in japan whose fleet has a large penetration of gasoline hybrid and advanced fuel-efficiency technologies such as three-cylinder engines VVa Dohc and 6-plus speed transmissions european vehicles are the best performing on average despite being heavier than all countries with the exception of the us and south Korea the adoption of fuel-efficiency technologies (eg Dct 6-plus-speed transmissions gDi turbocharging) contributes to europersquos better than average performance
China2012
SKorea2011
Europe2013
US2013
Japan2011
India2012
Brazil2013
Sales5 MM10 MM
14
16
18
20
22
24
26
28
1000 1100 1200 1300 1400 1500 1600 1700
Ene
rgy
cons
ump
tio
n ndash
CA
FE
(M
Jkm
)
Curb weight (kg)
Type-approval and certification energy consumption data only (does not include o-cycle or real-world driving data)
Figure 4‑5 ndash international comparison of passenger car energy consumption
Country labels indicate the dataset year
Figure 4‑6 provides a more detailed country comparison by illustrating average vehicle energy consumption by vehicle (curb) weight bin Vehicle sales in each bin are shown for reference the us is not shown due to lack of detailed model-by-model data Brazilrsquos vehicles on average have the highest energy consumption in most weight
37
ICCT white paper
bins with china being the second highest in most bins Because china has higher fuel consumption than Brazil on the 1000 bin which represents the highest share of vehicle sales fleet-average energy consumption in china is still higher than in Brazil as illustrated in the previous figure europe consistently performs best in terms of vehicle energy consumption in most weight bins with japan also performing relatively well
Curb weight (kg)
BrazilChinaEuropeIndiaJapanSouth Korea
Ene
rgy
cons
ump
tio
n C
AF
E (
MJ
km)
Sale
s
40
35
25
20
15
10
6M
8M
4M
2M
0M600 800 1000 1200 1400 1600 1800 2000 2200 2400
Figure 4‑6 ndash international comparison of average vehicle energy consumption by vehicle weight
Type-approval and certification energy consumption data only (does not include off-cycle or real-world driving data)
38
Brazil Passenger Vehicle Market statistics
Figure 4‑7 illustrates the distribution of energy consumption data in Brazil for each vehicle version by mass and segment Bubble sizes represent total sales of each version Data were limited to flex-fuel vehicles in the subcompact compact medium and large segments due to its relatively better data quality and representativeness (ie they represented over 87 of sales in 2013) While most vehicles follow a predictable trend that correlates energy consumption and vehicle mass there are a large number of versions with energy consumption substantially higher than the trend line this suggests there is substantial room for improvements in their energy consumption since there are vehicles in similar weight classes with substantially superior energy consumption performance
Sales1000050000
140
160
180
200
220
240
260
280
700 800 900 1000 1100 1200 1300 1400 1500 1600
Ene
rgy
cons
ump
tio
n (M
Jkm
)
Curb weight (kg)
Subcompact Compact Medium Large Fleet average
Figure 4‑7 ndash Distribution of new Brazilian passenger vehicle energy consumption data by vehicle weight and segment (2013)
this chapter suggests that there are potential improvements in vehicle energy consumption for the Brazilian fleet For similar vehicles in terms of weight class footprint or engine rating there is substantial dispersion in energy consumption indicating that there are vehicles performing much worse than the average across manufacturers there is also a clear trend of some manufacturers performing much better than the average while others have a lot more room for improvement the international comparison clearly shows that Brazilian vehicles perform much worse in terms of energy consumption than vehicles of similar weight suggesting a delay in the adoption of energy efficient technologies among Brazilian vehicle manufacturers
Finally a more detailed analysis of vehicle versions clearly illustrates a considerable number of vehicle versions significantly above average thus indicating potential improvements in energy consumption that would place them on par with better performing vehicles with similar characteristics
39
ICCT white paper
Deficiencies in data quality and completeness prevent more definite conclusions about vehicle energy consumption gasoline-only vehicles in particular have poor energy consumption data quality although they represent a relatively small fraction (6) of total vehicles sold in 2013 Because some vehicle segments are primarily composed of gasoline-only vehicles (eg sports minivans) this chapter excludes these segments from the analysis there are also concerns about the gap between energy consumption data reported by iBaMarsquos nota Verde and Brazilrsquos national institute of Metrology standardization and industrial Qualityrsquos (inMetro) labeling program (PBeV using its acronym in Portuguese) with the latter reporting consistently lower values of vehicle energy consumption
Finally the availability of energy consumption data was not adequate for many manufacturers beyond the top 10 sales group which prevented their inclusion in this analysis Despite the data quality and lack of completeness the energy consumption data in this chapter include data that are reasonably accurate and representative thus supporting its interpretation
40
Brazil Passenger Vehicle Market statistics
rEfErENCES
aDK automotive consultoria de Marketing (2013) relatoacuterios de volumes de vendas do mercado brasileiro para veiacuteculos de passeio e comerciais leves referentes a 2013
alves l Wilbert M (2014) reduccedilatildeo do imposto sobre Produto industrializado e a Venda de automoacuteveis Xi congresso usP iniciaccedilatildeo cientiacutefica em contabilidade
associaccedilatildeo nacional de transportes Puacuteblicos (antP 2014) estudo mostra baixo efeito do desconto no iPi de veiacuteculos sobre PiB e emprego available at httpwwwantporgbrwebsitenoticiasshowaspnpgcode=a4DeeFe8-a7BF-48D3-B1F5-8eDe1447BF10
associaccedilatildeo nacional dos Fabricantes de Veiacuteculos automotores (anFaVea 2015) anuaacuterio da induacutestria automobiliacutestica Brasileira 2015 Brazilian automotive industry Yearbook 2015 satildeo Paulo available at wwwanfaveacombr
european environment agency (2014) Monitoring co2 emissions from new passenger cars in the eu summary of data for 2013 april 2014
instituto Brasileiro do Meio ambiente e dos recursos naturais renovaacuteveis (iBaMa 2014) consulta dos niacuteveis de emissatildeo dos veiacuteculos novos brasileiros available at httpsservicosibamagovbrctfpublicosel_marca_modelo_rvepphp
international council on clean transportation (icct 2015) global passenger vehicle standards available at httpwwwtheicctorginfo-toolsglobal-passenger-vehicle-standards
international energy agency (iea 2015) renewables Bioenergy available at httpswwwieaorgtopicsrenewablessubtopicsbioenergy
Korea energy Management corporation (KeMco 2014) Fuel economy regulation available at httpwwwkemcoorkrnew_engmainmainasp
Marklines (2015) Marklines automotive industry Portal available at httpwwwmarklinescomen
Mendonccedila M sachsida a (2014) Modelando a demanda de creacutedito para veiacuteculos no Brasil uma abordagem com mudanccedila de regime iPea
Ministeacuterio do Desenvolvimento induacutestria e comeacutercio exterior (MDic 2013) Programa de incentivo agrave inovaccedilatildeo tecnoloacutegica e adensamento da cadeia Produtiva de Veiacuteculos automotores mdash inovar-auto httpwwwplanaltogov brccivil_03_ato2011-20142012DecretoD7819htm
stein r anderson j and Wallington t (2013) an overview of the effects of ethanol-gasoline Blends on si engine Performance Fuel efficiency and emissions SAE Int J Engines 6(1)470-487 2013 doi1042712013-01-1635
us environmental Protection agency and national highway traffic safety administration (ePanhtsa 2010) Final rulemaking to establish light-Duty Vehicle greenhouse gas emission standards and corporate average Fuel economy standards ePa-420-r-10-901
us environmental Protection agency (ePa 2012) regulatory impact analysis Final rulemaking for 2017-2025 light-Duty Vehicle greenhouse gas emission standards and corporate average Fuel economy standards ePa-420-r-12-016
41
ICCT white paper
us national academy of sciences (nas 2011) assessment of Fuel economy technologies for light-Duty Vehicles available at httpwwwnapeducatalog12924assessment-of-fuel-economy-technologies-for-light-duty-vehicles
World Bank group (2015) World Development indicators available at httpdataworldbankorgdata-catalogworld-development-indicators
42
Brazil Passenger Vehicle Market statistics
LiST Of ACrONyMS
4wD Four-wheel drive
aNFaVEa Brazilian association of automobile Manufacturers
awD all-wheel drive
BRiC Brazil russia india china
CaFE corporate average fuel economy
CBG compressed biogas
CO2 carbon dioxide
CVT continuously variable transmission
CVVT continuously variable valve technology
DCT Dual-clutch transmission
DOhC Dual overhead camshaft
EC energy consumption
Epa us environmental Protection agency
EU european union
FFV Flex-fuel vehicle
FTp Federal test procedure
FwD Front-wheel drive
GDi gasoline direct injection
GDp gross domestic product
GhG greenhouse gas
GM general Motors
iBaMa Brazilian institute of the environment and renewable natural resources
iC internal combustion
iCCT international council on clean transportation
iNMETRO national institute of Metrology standardization and industrial Quality
Kg Kilogram
Km Kilometer
Kw Kilowatt
LDV light-duty vehicle
LpG liquified petroleum gas
MDiC Ministry of Development industry and Foreign trade
MJ Megajoule
MpFi Multi-point fuel injection
Mpg Miles per gallon
NaS us national academy of sciences
43
ICCT white paper
NhTSa us national highway transportation safety administration
OhV overhead valve
pBEV Brazilian Vehicle labeling Program
pSa Psa Peugeot citroeumln
pTwR Power-to-weight ratio
pV Passenger vehicle
RwD rear-wheel drive
SOhC single overhead camshaft
SUV sport utility vehicle
US united states
USD us dollar
VTEC Valve timing electronic control
VVa Variable valve actuation
VVL Variable valve lift
44
Brazil Passenger Vehicle Market statistics
AppENDix A SEGMENT DEfiNiTiONS
Table a‑1 ndash segment definitions
Segmentpower (kw)
pTwR (kwkg) area (m2)
Other characteristics Examples
Subcompact lt 140 lt 0075 le 65 mdash Mini cooper chevrolet celta smart Fortwo
Compact lt 140 lt 0075 65 lt area le 70 mdash honda Fit hyundai hB20 Volkswagen Polo
Medium lt 140 lt 0075 70 lt area le 80 mdash honda civic nissan tiida Peugeot 308
Large lt 140 lt 0075 gt 80 mdash audi a4 BMW 3 series Mercedes c-class
Sports gt 140 gt 0075 mdash 4 seats maxjaguar XF lamborghini gallardo Ferrari california
Off‑road mdash mdash lt 80 traction = 4WDjeep cherokee honda cr-V BMW X3 hyundai santa Fe
SUV mdash mdash lt 80Based on aDKrsquos default classification
BMW X1 Ford ecosport hyundai tucson
Minivan mdash mdash Passengers 6-12
citroen grand Picasso Kia carnival
45
ICCT white paper
AppENDix b iNTErNATiONAL MArKET DATA
Table B‑1 ndash international market comparison of new fleet characteristics
parameters China S Korea EU US Japan india Brazil
Year 2012 2011 2013 2013 2011 2012 2013
Sales (million) 155 13 118 156 352 256 304
price (USD) $21008 $21383 $24439 mdash $20637 $11717 $22015
No of cylinders mdash 43 40 47 38 36 40
Displacement (cc) 1605 1960 1613 2606 1425 1294 1430
Curb weight (kg) 1296 1421 1391 1623 1193 1059 1106
Length (mm) 4323 4531 4263 mdash 4013 3859 4100
Footprint (m2) 38 420 40 425 371 341 367
Engine power (kw) 86 120 89 148 78 55 76
pTwR (kwkg) 00664 00844 00640 00912 00654 00519 00671
Energy consumption ndash US CaFE (MJKm)[1] 235 206 169 250 171 183 202
[1] energy consumption data presented here for countries other than Brazil were obtained from local official sources in its original metric and drive cycle and then converted to Mjkm under the us caFe drive cycle using the methodology described in Yang (2015) Mode details and historical fuel consumption data on their original metrics is presented in the icctrsquos global PV standard website httpwwwtheicctorginfo-toolsglobal-passenger-vehicle-standards
Data Sources
China Ministry of industry and information technology (Miit 2014) corporate average Fuel efficiency accounting Method for Passenger cars available at httpwwwgovcngzdt2013-0320content_2358627htm
Baseline performance china automotive research and technology center through internal communication and icct internal 2010 database for chinese light-duty vehicles
S Korea internal communication with s Korean official and from greencarcongress available at httpwwwgreencarcongresscom200906korea-20090604html
EU european environment agency (2014) Monitoring co2 emissions from new passenger cars in the eu summary of data for 2013 april 2014
US us ePa (2014) light-duty automotive technology carbon dioxide emissions and fuel economy trends1975 through 2014 table 91 page 110 available at http httpwwwepagovfueleconomyfetrends1975-2014420r14023apdf
Japan jaMa (2010) the Motor industry of japan available at httpwwwjama-englishjppublicationsMVs2010pdf Mlit httpwwwmlitgojpcommon000990330pdf
india Bureau of energy efficiency white paper 2010-2012 calculation based on icct database
Brazil icct Brazil Vehicle Database (2013)
46
Brazil Passenger Vehicle Market statistics
Table B‑2 ndash international market comparison of technology adoption in new vehicles
Technology adoption China S Korea EU US Japan india Brazil
Year 2010 2011 2013 2013 2011 2012 2013
Fuel type
CBGLpGFlex 0 11 2 0 0 4 94
Gasoline 99 65 44 93 86 56 6
hybrid 0 1 1 5 13 0 0
Diesel 1 23 53 1 0 40 0
No of cylinders
Two 0 0 0 0 0 6 0
Three 4 0 7 0 36 28 3
Four 90 84 87 56 57 65 97
Five 0 0 1 0 0 0
Six 6 15 4 32 5 0 1
Eight or more 0 0 0 12 1 0 0
Transmission
Manual 60 3 83 5 1 98 83
automatic 34 90 9 75 34 2 15
CVT 5 7 2 18 65 0 1
DCT 1 0 6 2 mdash 0 1
Number of gear ratios
Four or fewer 13 16 1 7 mdash 10 6
Five 68 9 45 11 mdash 85 83
Six or more 19 75 54 82 mdash 5 11
Drivetrain
FwD 74 86 81 83 59 76 0
RwD 21 7 7 10 5 22 0
4wD and awD 5 7 12 7 36 2 100
No of valves per cylinder
Two 17 mdash mdash 2 4 25 60
Multi valve 83 mdash mdash 98 95 75 40
Valve camshaft configuration
Single overhead camshaft 26 1 mdash mdash 16 41 63
Dual overhead camshaft 74 84 mdash mdash 82 53 25
Overhead camshaft mdash 15 mdash mdash 0 6 mdash
Valve actuation
Fixed 50 16 mdash 2 11 86 78
VVT 44 84 mdash 98 89 12 16
VVL 6 mdash mdash mdash mdash 2 6
Fuel systems for gasoline vehicles
Multi‑point fuel injection 94 72 68 62 95 100 98
Gasoline direct injection 6 28 32 37 5 0 2
air induction systems for gasoline vehicles
Naturally aspirated 93 75 41 85 92 64 97
Supercharger turbocharger or twin‑turbo 7 25 59 15 8 36 3
47
ICCT white paper
AppENDix C NEW vEhiCLE ChArACTEriSTiCS AND TEChNOLOGy ADOpTiON DATA iN brAziL
Table C‑1 ndash Fleet characteristics of new Brazilian passenger vehicles by segment (2013)
parameters Subcompact Compact Medium Large Sports Off‑road SUV Minivan
Sales (thousands) 6785 6843 11790 1920 273 768 1997 23
Market share () 223 225 38 8 63 09 25 65 01
price (R$) $30103 $38732 $45496 $66508 $148834 $151284 $75164 $82284
No of cylinders 400 391 399 400 462 448 404 433
Displacement (cc) 1128 1293 1447 1794 2430 2586 1884 2244
Curb weight (kg) 940 1037 1102 1329 1561 1772 1395 1604
Length (mm) 3804 4026 4163 4499 4711 4516 4352 4658
Footprint (m2) 339 361 371 402 418 409 402 427
Engine power ndash gasoline (kw) 58 68 75 99 183 146 103 120
Engine power ndash ethanol (kw) 59 70 77 98 mdash 109 101 mdash
pTwR ndash gasoline (kwkg) 00614 00655 00671 00742 01173 00828 00731 00732
pTwR ndash ethanol (kwkg) 00630 00678 00697 00757 mdash 00766 00745 mdash
48
Brazil Passenger Vehicle Market statistics
Table C‑2 ndash Fleet characteristics of new Brazilian passenger vehicles by manufacturer (2013)
parameters Fiat
GM
Vo
lksw
agen
Ford
Ren
ault
hyu
ndai
ho
nda
Toyo
ta
pSa
Nis
san
Mit
sub
ishi
Kia
JaC
BM
w
Land
Rov
er
Mer
ced
es‑B
enz
Che
ry
aud
i
Suzu
ki
Jeep
Sales (thousands) 6087 5486 5448 3074 2207 2055 1392 1334 1163 621 368 255 158 141 106 94 80 67 63 36
Market share () 2002 1804 1792 1011 726 676 458 439 383 204 121 084 052 046 035 031 026 022 021 012
price (R$) $35017 $42259 $38701 $46174 $43447 $50112 $67078 $68922 $103001 $44035 $100696 $87009 $37654 $165111 $221943 $153281 $30821 $142799 $74769 $139039
No of cylinders 400 401 400 402 400 370 400 400 400 400 408 416 400 424 448 431 400 411 400 552
Displacement (cc) 1250 1340 1287 1497 1423 1495 1691 1808 1575 1579 2262 1856 1411 2095 2281 1934 1398 1912 1831 3182
Curb weight (kg) 1033 1060 1020 1156 1102 1122 1210 1201 1231 1069 1556 1377 1079 1624 1868 1598 1097 1551 1444 1945
Length (mm) 3965 4155 3993 4120 4127 4078 4319 4299 4116 4171 4401 4357 3956 4574 4487 4527 3896 4454 4234 4584
Footprint (m2) 345 370 354 368 378 383 397 387 376 379 395 407 351 429 433 429 349 417 323 420
Engine power ndash gasoline (kw) 64 71 65 79 73 86 96 90 80 82 120 112 83 151 179 138 71 136 94 162
Engine power ndash ethanol (kw) 65 72 65 79 76 85 97 90 81 82 107 106 95 mdash mdash mdash 75 mdash mdash mdash
pTwR ndash gasoline (kwkg)
00613 00662 00631 00674 00657 00739 00788 00745 00646 00766 00779 00792 00784 00921 00977 00856 00638 00870 00649 00835
pTwR ndash ethanol (kwkg) 00629 00681 00642 00693 00685 00781 00800 00795 00660 00768 00710 00798 00896 mdash mdash mdash 00659 mdash mdash mdash
49
ICCT white paper
Table C‑3 ndash Fleet characteristics of new Brazilian passenger vehicles by origin (2013)
parameters Domestic imported
Sales (thousands) 2537 504
Market share () 834 166
price (R$) $41739 $76049
No of cylinders 397 412
Displacement (cc) 1359 1791
Curb weight (kg) 1070 1289
Length (mm) 4063 4285
Footprint (m2) 362 390
Engine power ndash gasoline (kw) 70 102
Engine power ndash ethanol (kw) 73 84
pTwR ndash gasoline (kwkg) 0065 0076
pTwR ndash ethanol (kwkg) 0068 0074
50
Brazil Passenger Vehicle Market statistics
Table C‑4 ndash technology adoption in new Brazilian passenger vehicles by segment (2013)
Technology adoption Subcompact Compact Medium Large SportOff‑road SUV Minivan
Fuel type
Flex 982 988 982 837 00 134 826 00
Gasoline 18 12 17 163 996 540 174 1000
hybrid 0000 0000 0028 0000 0396 0001 0000 0000
Diesel 00 00 00 00 00 326 00 00
No of cylinders
Three 01 91 10 00 00 00 00 00
Four 999 909 990 998 758 775 979 833
Five 00 00 00 02 03 00 00 00
Six 00 00 00 00 175 211 21 167
Eight or more 00 00 00 00 63 13 00 00
Transmission
Manual 993 944 826 622 62 174 505 641
automatic 07 55 161 283 629 707 451 359
CVT 00 00 12 89 09 93 34 00
DCT 00 01 02 06 299 25 10 00
No of gear ratios
Four or fewer 04 47 72 51 00 34 247 193
Five 984 943 848 378 15 392 516 641
Six 12 09 73 515 796 462 225 167
Seven 00 01 06 23 87 53 12 00
Eight or more 00 00 01 32 102 59 00 00
Drivetrain
FwD 998 1000 997 688 550 00 916 1000
RwD 02 00 03 311 221 00 84 00
awD 00 00 00 01 229 1000 00 00
No of valves per cylinder
Two 806 694 584 195 00 00 258 00
Multi valve 194 306 416 805 1000 1000 742 1000
Valve camshaft configuration
Single overhead camshaft 839 786 709 309 00 212 375 00
Dual overhead camshaft 24 158 161 546 880 517 446 255
Valve actuation
Fixed 982 729 807 461 49 493 664 868
VVT 18 211 115 470 827 367 252 132
VVT+VVL 00 61 78 68 124 140 84 00
Fuel systems for gasoline vehicles
Multi‑point fuel injection 999 998 997 949 979 143 766 1000
Gasoline direct injection 01 02 03 51 21 857 234 00
air induction systems for gasoline vehicles
Naturally aspirated 999 997 995 943 974 369 543 1000
Supercharger turbocharger or twin‑turbo 01 03 05 57 26 631 457 00
51
ICCT white paper
Table C‑5 ndash technology adoption in new Brazilian passenger vehicles by manufacturer (2013)
Technology adoption Fi
aT
GM
VO
LKSw
aG
EN
FOR
D
REN
aU
LT
hY
UN
Da
i
hO
ND
a
TOYO
Ta
pSa
NiS
SaN
MiT
SUB
iSh
i
Kia
JaC
BM
w
LaN
D R
OV
ER
MER
CED
ES
Fuel type
Flex 990 987 965 966 997 921 999 886 928 998 283 739 31 42 00 00
Gasoline 10 09 35 34 03 79 01 35 72 02 557 255 969 957 663 950
hybrid 00 00 00 00 00 00 00 02 00 00 00 00 00 00 00 00
Diesel 00 04 00 00 00 00 00 77 00 00 160 06 00 00 337 50
No of cylinders
Three 00 00 05 00 00 348 00 00 00 00 00 00 00 00 00 00
Four 1000 996 994 989 1000 626 999 998 1000 1000 958 922 1000 906 787 878
Five 00 00 00 00 00 00 00 00 00 00 00 00 00 00 00 00
Six 00 02 01 11 00 26 01 02 00 00 42 78 00 68 185 87
Eight or more 00 02 00 00 00 00 00 00 00 00 00 00 00 26 28 35
Transmission
Manual 992 878 985 846 853 632 566 565 703 785 493 120 1000 02 00 151
automatic 08 103 00 137 62 285 355 160 297 121 118 793 00 575 18 14
CVT 00 19 15 16 41 70 01 246 00 00 139 87 00 423 982 836
DCT 00 00 00 00 43 13 78 30 00 94 251 00 00 00 00 00
No of gear ratios
Four or fewer 02 04 00 55 104 237 00 323 249 132 17 133 00 00 00 00
Five 981 811 963 839 797 623 861 643 684 828 530 107 1000 00 00 64
Six 17 185 29 106 99 140 139 07 67 40 453 754 00 217 800 00
Seven 00 00 07 00 00 00 00 27 00 00 00 00 00 08 00 936
Eight or more 00 00 00 00 00 00 00 00 00 00 00 06 00 775 200 00
Drivetrain
FwD 1000 902 989 972 987 985 990 892 1000 1000 496 623 1000 00 00 00
RwD 00 91 00 00 00 00 00 16 00 00 00 370 00 882 00 900
awD 00 06 11 28 13 15 10 92 00 00 504 07 00 118 1000 100
No of valves per cylinder
Two 811 864 988 745 220 00 00 00 00 00 00 00 00 00 00 00
Multi Valve 189 136 12 255 780 1000 1000 1000 1000 1000 1000 1000 1000 1000 1000 1000
Valve camshaft configuration
SOhC 836 755 914 675 832 00 04 00 497 398 331 00 00 00 00 00
DOhC 07 108 56 50 168 992 786 875 352 428 477 1000 907 810 860 453
Valve actuation
Fixed 1000 898 965 966 940 29 00 574 736 573 435 76 124 187 18 55
VVT 00 102 35 34 60 971 00 426 264 427 00 924 876 00 982 945
VVT+VVL 00 00 00 00 00 00 1000 00 00 00 565 00 00 813 00 00
air induction System
Naturally aspirated 997 994 966 977 997 988 1000 923 922 1000 835 936 1000 97 37 101
Supercharger turbocharger or twin‑turbo
03 06 34 23 03 12 00 77 78 00 165 64 00 903 963 899
Fuel systems for gasoline vehicles
Multipoint fuel injection 1000 995 965 972 1000 989 1000 1000 967 1000 994 1000 1000 78 15 158
Gasoline Direct injection 00 05 35 28 00 11 00 00 33 00 06 00 00 922 985 842
note Difference between 100 and summation of sohc and Dohc market share values corresponds to data not available
52
Brazil Passenger Vehicle Market statistics
AppENDix D DATA SOurCES AND COMpLETENESS
the basis of the statistics shown in this report is a database compiled by the icct with vehicle sales technical information (eg fleet characteristics technology content) and energy consumption (converted from either co2 emissions or fuel economy) from various data sources outlined in table D-1
Table D‑1 ndash Brazilian data sources
parameters Sales TechnicalEnergy
consumption
aDK (2014 2015) x x
MarkLines (2015) x
iBaMa (2014) x
iNMETRO (2014) x
UOL (2014) x
icarroscom (2014) x
this analysis examined energy consumption data from two public sources the nota Verde Program by the Brazilian institute of the environment and renewable natural resources (iBaMa) and the Brazilian Vehicle labeling Program (PBeV) by the national institute of Metrology standardization and industrial Quality (inMetro) table D-2 summarizes key differences between these two data sources
Table D‑2 ndash energy consumption data sources
iBaMa iNMETRO
program nota Verde1 Brazilian Vehicle labeling Program (PBeV)2
program description
Mandatory program that reports emissions of co2 co nox and nMhc as part of emissions certification program
Voluntary program since 2009 that allows the comparison of fuel economy across vehicle models
Unit gco2 km kml
Test cycle chassis testing under urban (FtP) driving cycle based on nBr 66012005
chassis testing under urban (FtP) and highway (hWYFe) driving cycles based on nBr 702420103
adjustment
no adjustment for real-world driving conditions Because reported co2 emissions are assumed to be zero for ethanol adjustments were made to account for tailpipe co2 emissions for vehicles running on ethanol
since 2010 published values include real-world adjustment factors to chassis test data a method adopted by the us ePa in 2008
Conversion to MJkm
iBaMarsquos data are reported as FtP (city test) co2 data in gco2 km conversion to caFe test cycle and to a different metric (Mjkm) involves four steps as presented in Figure D-1
inMetrorsquos data in kml are presented separately by fuel type (e22 e100) and driving cycle (urban highway) conversion to Mjkm was done by applying a conversion factor (2167 gco2 l for e22 and 1428gco2l for e00) caFe values are obtained by using a 5545 weighting for the urban (FtP) and highway cycles respectively
1 iBaMa (2014) nota Verde program available at httpwwwmmagovbrcidades-sustentaveisqualidade-do-arcontrole-de-emissoes-veicularesnota-verde
2 inMetro (2014) Programa Brasileiro de etiquetagem Veicular (PBeV) available at httpwwwinmetrogovbrconsumidortabelas_pbe_veicularasp
3 inMetro (2014) Metodologia Para Divulgaccedilatildeo De Dados De consumo Veicular available at httpwwwinmetrogovbrconsumidorpbeMetodologia_consumo_Veicularpdf
53
ICCT white paper
Step 1 Correcting the original IBAMA CO2 reported data ndash FTP CO2 gkm
IBAMArsquos CO2 reported values are corrected to account for tailpipe emissions from ethanol (tailpipe CO2 emissions are reported as zero in IBAMArsquos data)
bull E22 FTP reported CO2 data are reduced by 177bull E100 FTP reported CO2 data are reduced by 100
Flex fuel vehicles are tested with E22 and E00 the final values is calculated as the average of both fuelsCO2 IBAMA_Flex_FTP= 05(1-0177)CO2_E22_test_FTP + 050E100_FTP = 050823CO2_E22_FTPFor Gasoline only vehicles the tests are carried out only with Gasoline E22CO2 IBAMA_Gasoline_FTP = (1-0177) CO2_E22_Test_FTP
Where in the previous equations CO2_E22_FTP means CO2 emissions values obtained under FTP testingCO2 IBAMA_Flex_FTP means IBAMArsquos Corrected FTP values for flex vehiclesCO2 IBAMA_Gasoline_FTP means IBAMArsquos Corrected FTP values for gasoline only (E22) vehicles
INNOVAR AUTO is based on energy consumption data obtained as the combined CAFE test cycle This requires a weighted average of energy consumption data obtained from FTP testing (city driving ) and Highway fuel economy testing (HWFET) In mathematical form CAFE=f(FTPHWFET)
Given that IBAMA data is provided for only the first aprt the FTP testing then it is required to find a way to calculate CAFE combined values through FTP -75 only data A linear function was thus developed from data with FTP and HWY values (INMETRO data) is used to convert FTP only values to CAFE CO2 values ie CAFE=f(FTP) The function used for this conversion is
CO2_CAFE= (CO2_FTP+44756)11572
Step 2Convert FTP CO2 values to CAFE CO2 values
Converting CO2 values to MJkm values is done by using the energy density of E22 Note that all the previous calculations for CO2 come from E22-based data
bull The energy density of E22 is 2894 MJLE22bull E22 emits 2167gCO2LE22bull CAFE (MJkm) = CAFE (gCO2km) (2894 MJLE22 2167 gCO2LE22)
Step 3 Convert US CAFE CO2 values to MJkm values
Figure D‑1 ndash conversion of emission to energy consumption data
energy consumption values calculated from iBaMa and inMetro data differ greatly Figure D-1 illustrates energy consumption data for those models in both databases iBaMa data are on average 126 higher than inMetro data with a standard deviation of 89 and a maximum deviation of 39
54
Brazil Passenger Vehicle Market statistics
0
05
1
15
2
25
3
0 05 1 15 2 25 3
Ene
rgy
cons
ump
tio
n IB
AM
A (
MJ
km)
Energy consumption INMETRO (MJkm)
n=151
Figure D‑2 ndash comparison between energy consumption data from inMetro and iBaMa
151 vehicles tested under both programs
although inMetro data are more transparent as it breaks down fuel economy by fuel and test cycle it is still a voluntary program that allows manufacturers to select which models will participate in addition not all manufacturers participate in the program in turn iBaMa data only include co2 data for the urban cycle and thus energy consumption in the combined cycle had to be estimated from correlations using international data in addition corrections had to be made for gasoline-only engines since it seems that a co2 discount in theory only applicable to flex-fuel engines was also applied to gasoline-only engines Despite these data quality issues iBaMa data were considered the most adequate data source for energy consumption because it is a mandatory program that requires data reporting by all vehicle models and manufacturers
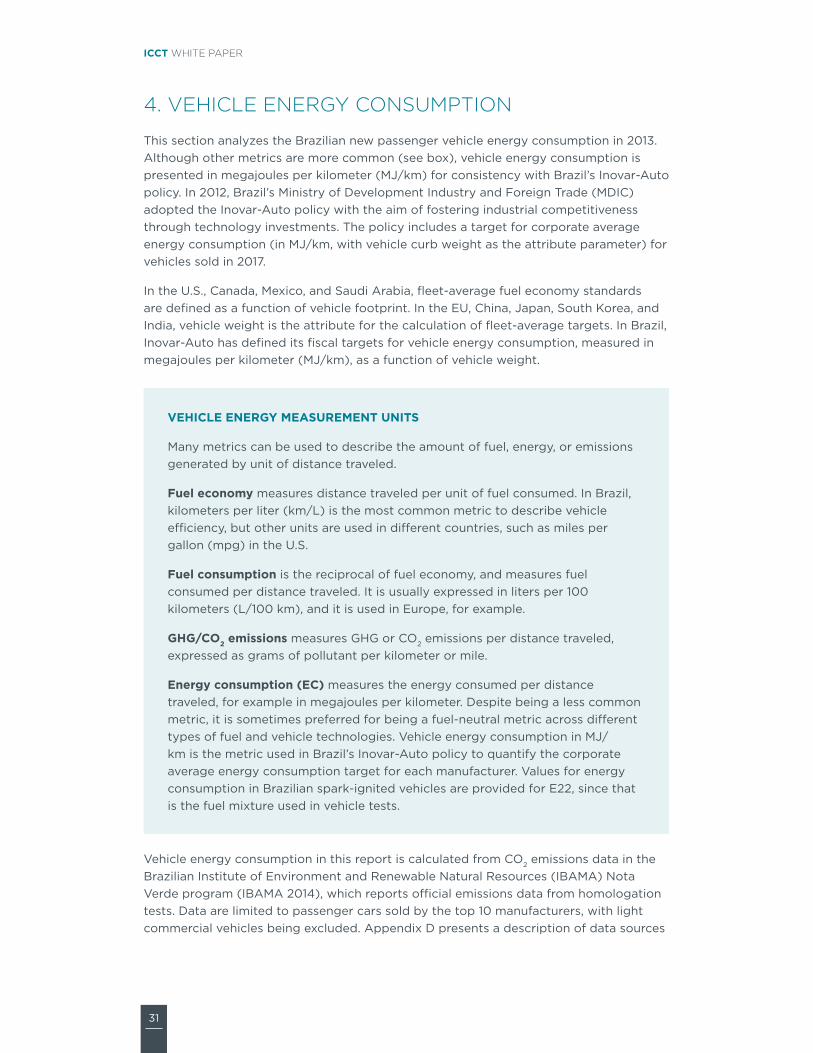
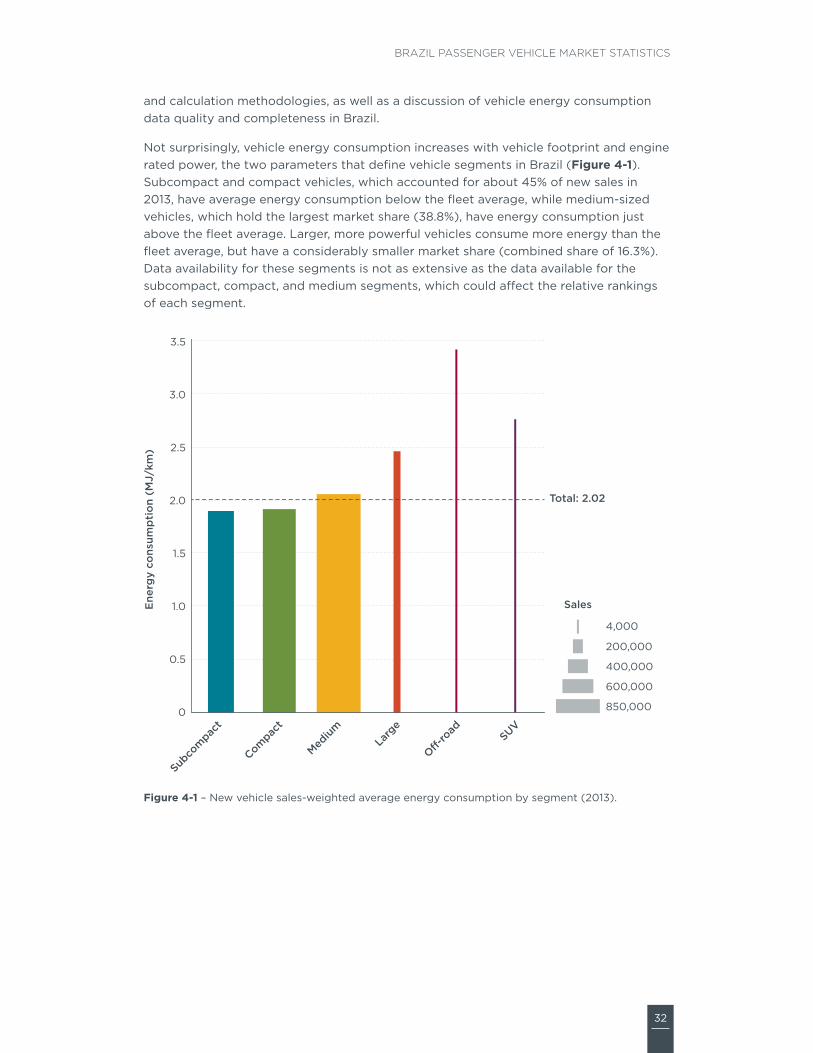
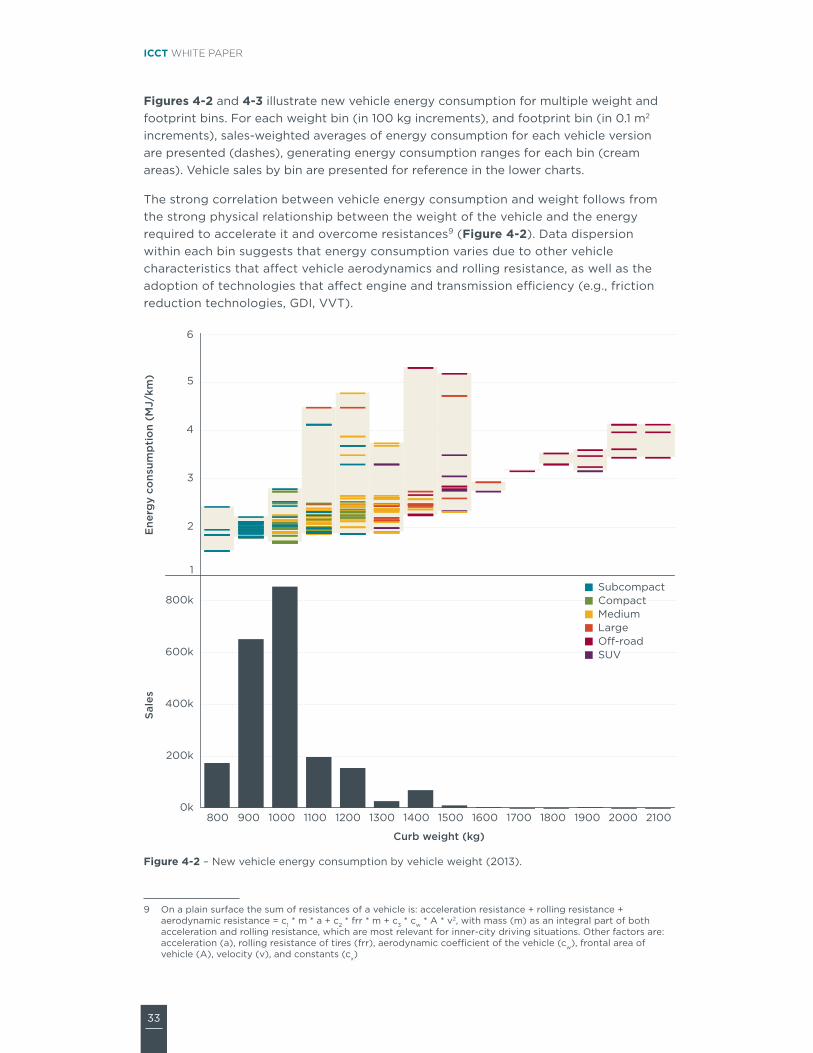
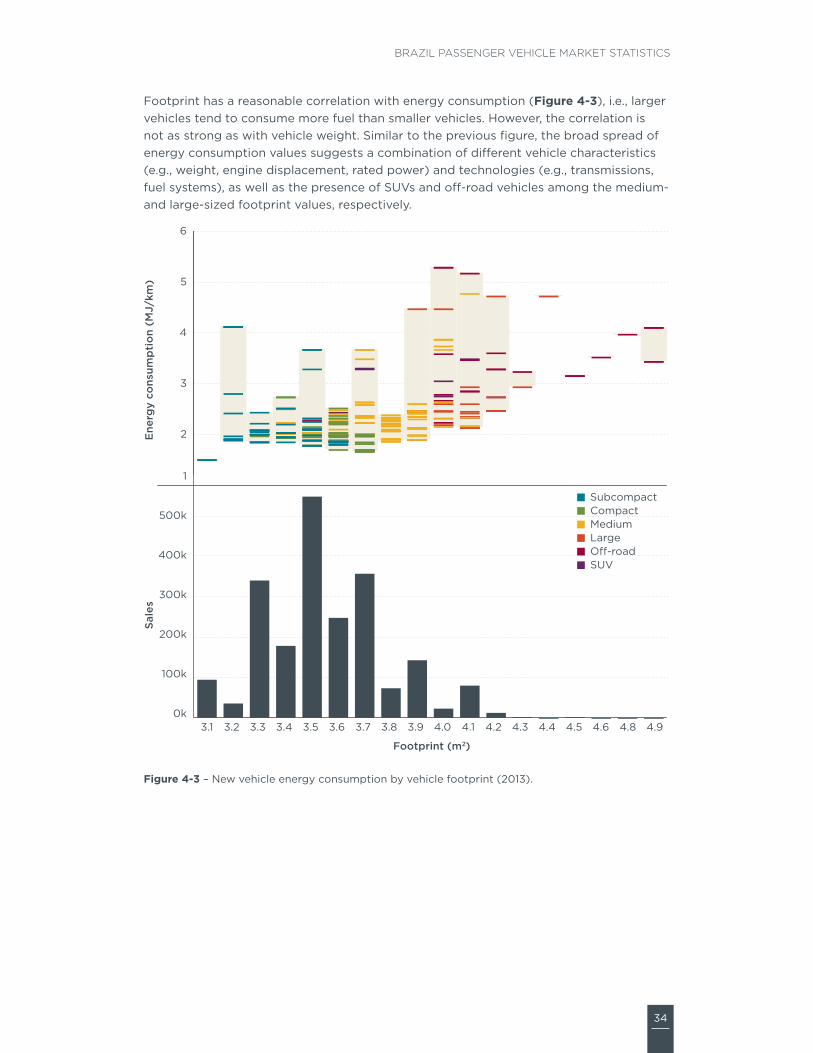
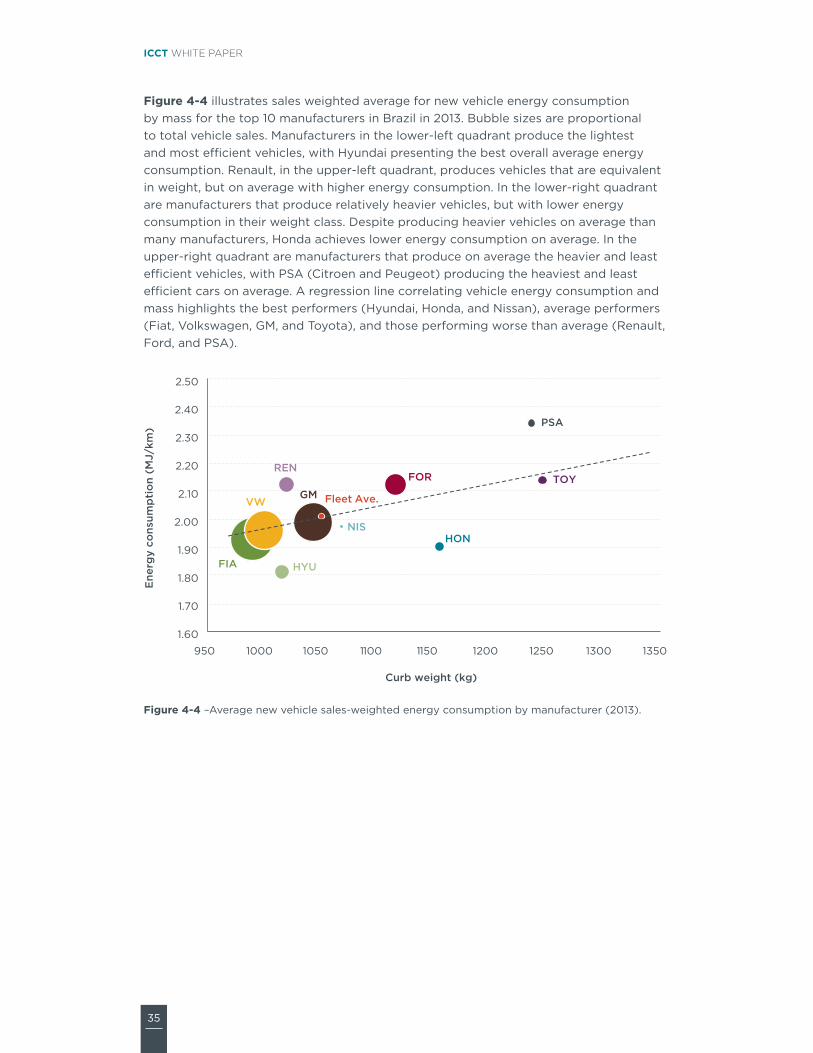
35
ICCT white paper
Figure 4‑4 illustrates sales weighted average for new vehicle energy consumption by mass for the top 10 manufacturers in Brazil in 2013 Bubble sizes are proportional to total vehicle sales Manufacturers in the lower-left quadrant produce the lightest and most efficient vehicles with hyundai presenting the best overall average energy consumption renault in the upper-left quadrant produces vehicles that are equivalent in weight but on average with higher energy consumption in the lower-right quadrant are manufacturers that produce relatively heavier vehicles but with lower energy consumption in their weight class Despite producing heavier vehicles on average than many manufacturers honda achieves lower energy consumption on average in the upper-right quadrant are manufacturers that produce on average the heavier and least efficient vehicles with Psa (citroen and Peugeot) producing the heaviest and least efficient cars on average a regression line correlating vehicle energy consumption and mass highlights the best performers (hyundai honda and nissan) average performers (Fiat Volkswagen gM and toyota) and those performing worse than average (renault Ford and Psa)
FIA
GMVW
FORREN
HYU
HON
TOY
PSA
NIS
160
170
180
190
200
210
220
230
240
250
950 1000 1050 1100 1150 1200 1250 1300 1350
Ene
rgy
cons
ump
tio
n (M
Jkm
)
Curb weight (kg)
Fleet Ave
Figure 4‑4 ndashaverage new vehicle sales-weighted energy consumption by manufacturer (2013)
36
Brazil Passenger Vehicle Market statistics
Figure 4‑5 shows fleet-average energy consumption based on certification and type approval data for new vehicles in multiple countries converted to the us caFe combined driving cycle Bubble sizes represent total sales of new passenger cars Because of data availability in different countries the country comparison is based on different calendars years for different countries 2011 for south Korea and japan 2012 for china and india and 2013 for europe the us and Brazil given annual improvements in vehicle energy consumption triggered by regulatory efficiency standards and fiscal incentives those countries with older data could be at a slight disadvantage in this comparison
With the heaviest vehicles on average the us fleet is also the most energy consuming of all countries china and south Korea have similar average energy consumption but since south Korean vehicles are heavier on average they are relatively more efficient than chinese vehicles although Brazilrsquos fleet consumes less fuel on average than those from the us china and south Korea its fleet is relatively inefficient when compared to countries with vehicles of similar weight (japan and india) the average Brazilian vehicle consumes about 34 more energy than the average vehicle in japan whose fleet has a large penetration of gasoline hybrid and advanced fuel-efficiency technologies such as three-cylinder engines VVa Dohc and 6-plus speed transmissions european vehicles are the best performing on average despite being heavier than all countries with the exception of the us and south Korea the adoption of fuel-efficiency technologies (eg Dct 6-plus-speed transmissions gDi turbocharging) contributes to europersquos better than average performance
China2012
SKorea2011
Europe2013
US2013
Japan2011
India2012
Brazil2013
Sales5 MM10 MM
14
16
18
20
22
24
26
28
1000 1100 1200 1300 1400 1500 1600 1700
Ene
rgy
cons
ump
tio
n ndash
CA
FE
(M
Jkm
)
Curb weight (kg)
Type-approval and certification energy consumption data only (does not include o-cycle or real-world driving data)
Figure 4‑5 ndash international comparison of passenger car energy consumption
Country labels indicate the dataset year
Figure 4‑6 provides a more detailed country comparison by illustrating average vehicle energy consumption by vehicle (curb) weight bin Vehicle sales in each bin are shown for reference the us is not shown due to lack of detailed model-by-model data Brazilrsquos vehicles on average have the highest energy consumption in most weight
37
ICCT white paper
bins with china being the second highest in most bins Because china has higher fuel consumption than Brazil on the 1000 bin which represents the highest share of vehicle sales fleet-average energy consumption in china is still higher than in Brazil as illustrated in the previous figure europe consistently performs best in terms of vehicle energy consumption in most weight bins with japan also performing relatively well
Curb weight (kg)
BrazilChinaEuropeIndiaJapanSouth Korea
Ene
rgy
cons
ump
tio
n C
AF
E (
MJ
km)
Sale
s
40
35
25
20
15
10
6M
8M
4M
2M
0M600 800 1000 1200 1400 1600 1800 2000 2200 2400
Figure 4‑6 ndash international comparison of average vehicle energy consumption by vehicle weight
Type-approval and certification energy consumption data only (does not include off-cycle or real-world driving data)
38
Brazil Passenger Vehicle Market statistics
Figure 4‑7 illustrates the distribution of energy consumption data in Brazil for each vehicle version by mass and segment Bubble sizes represent total sales of each version Data were limited to flex-fuel vehicles in the subcompact compact medium and large segments due to its relatively better data quality and representativeness (ie they represented over 87 of sales in 2013) While most vehicles follow a predictable trend that correlates energy consumption and vehicle mass there are a large number of versions with energy consumption substantially higher than the trend line this suggests there is substantial room for improvements in their energy consumption since there are vehicles in similar weight classes with substantially superior energy consumption performance
Sales1000050000
140
160
180
200
220
240
260
280
700 800 900 1000 1100 1200 1300 1400 1500 1600
Ene
rgy
cons
ump
tio
n (M
Jkm
)
Curb weight (kg)
Subcompact Compact Medium Large Fleet average
Figure 4‑7 ndash Distribution of new Brazilian passenger vehicle energy consumption data by vehicle weight and segment (2013)
this chapter suggests that there are potential improvements in vehicle energy consumption for the Brazilian fleet For similar vehicles in terms of weight class footprint or engine rating there is substantial dispersion in energy consumption indicating that there are vehicles performing much worse than the average across manufacturers there is also a clear trend of some manufacturers performing much better than the average while others have a lot more room for improvement the international comparison clearly shows that Brazilian vehicles perform much worse in terms of energy consumption than vehicles of similar weight suggesting a delay in the adoption of energy efficient technologies among Brazilian vehicle manufacturers
Finally a more detailed analysis of vehicle versions clearly illustrates a considerable number of vehicle versions significantly above average thus indicating potential improvements in energy consumption that would place them on par with better performing vehicles with similar characteristics
39
ICCT white paper
Deficiencies in data quality and completeness prevent more definite conclusions about vehicle energy consumption gasoline-only vehicles in particular have poor energy consumption data quality although they represent a relatively small fraction (6) of total vehicles sold in 2013 Because some vehicle segments are primarily composed of gasoline-only vehicles (eg sports minivans) this chapter excludes these segments from the analysis there are also concerns about the gap between energy consumption data reported by iBaMarsquos nota Verde and Brazilrsquos national institute of Metrology standardization and industrial Qualityrsquos (inMetro) labeling program (PBeV using its acronym in Portuguese) with the latter reporting consistently lower values of vehicle energy consumption
Finally the availability of energy consumption data was not adequate for many manufacturers beyond the top 10 sales group which prevented their inclusion in this analysis Despite the data quality and lack of completeness the energy consumption data in this chapter include data that are reasonably accurate and representative thus supporting its interpretation
40
Brazil Passenger Vehicle Market statistics
rEfErENCES
aDK automotive consultoria de Marketing (2013) relatoacuterios de volumes de vendas do mercado brasileiro para veiacuteculos de passeio e comerciais leves referentes a 2013
alves l Wilbert M (2014) reduccedilatildeo do imposto sobre Produto industrializado e a Venda de automoacuteveis Xi congresso usP iniciaccedilatildeo cientiacutefica em contabilidade
associaccedilatildeo nacional de transportes Puacuteblicos (antP 2014) estudo mostra baixo efeito do desconto no iPi de veiacuteculos sobre PiB e emprego available at httpwwwantporgbrwebsitenoticiasshowaspnpgcode=a4DeeFe8-a7BF-48D3-B1F5-8eDe1447BF10
associaccedilatildeo nacional dos Fabricantes de Veiacuteculos automotores (anFaVea 2015) anuaacuterio da induacutestria automobiliacutestica Brasileira 2015 Brazilian automotive industry Yearbook 2015 satildeo Paulo available at wwwanfaveacombr
european environment agency (2014) Monitoring co2 emissions from new passenger cars in the eu summary of data for 2013 april 2014
instituto Brasileiro do Meio ambiente e dos recursos naturais renovaacuteveis (iBaMa 2014) consulta dos niacuteveis de emissatildeo dos veiacuteculos novos brasileiros available at httpsservicosibamagovbrctfpublicosel_marca_modelo_rvepphp
international council on clean transportation (icct 2015) global passenger vehicle standards available at httpwwwtheicctorginfo-toolsglobal-passenger-vehicle-standards
international energy agency (iea 2015) renewables Bioenergy available at httpswwwieaorgtopicsrenewablessubtopicsbioenergy
Korea energy Management corporation (KeMco 2014) Fuel economy regulation available at httpwwwkemcoorkrnew_engmainmainasp
Marklines (2015) Marklines automotive industry Portal available at httpwwwmarklinescomen
Mendonccedila M sachsida a (2014) Modelando a demanda de creacutedito para veiacuteculos no Brasil uma abordagem com mudanccedila de regime iPea
Ministeacuterio do Desenvolvimento induacutestria e comeacutercio exterior (MDic 2013) Programa de incentivo agrave inovaccedilatildeo tecnoloacutegica e adensamento da cadeia Produtiva de Veiacuteculos automotores mdash inovar-auto httpwwwplanaltogov brccivil_03_ato2011-20142012DecretoD7819htm
stein r anderson j and Wallington t (2013) an overview of the effects of ethanol-gasoline Blends on si engine Performance Fuel efficiency and emissions SAE Int J Engines 6(1)470-487 2013 doi1042712013-01-1635
us environmental Protection agency and national highway traffic safety administration (ePanhtsa 2010) Final rulemaking to establish light-Duty Vehicle greenhouse gas emission standards and corporate average Fuel economy standards ePa-420-r-10-901
us environmental Protection agency (ePa 2012) regulatory impact analysis Final rulemaking for 2017-2025 light-Duty Vehicle greenhouse gas emission standards and corporate average Fuel economy standards ePa-420-r-12-016
41
ICCT white paper
us national academy of sciences (nas 2011) assessment of Fuel economy technologies for light-Duty Vehicles available at httpwwwnapeducatalog12924assessment-of-fuel-economy-technologies-for-light-duty-vehicles
World Bank group (2015) World Development indicators available at httpdataworldbankorgdata-catalogworld-development-indicators
42
Brazil Passenger Vehicle Market statistics
LiST Of ACrONyMS
4wD Four-wheel drive
aNFaVEa Brazilian association of automobile Manufacturers
awD all-wheel drive
BRiC Brazil russia india china
CaFE corporate average fuel economy
CBG compressed biogas
CO2 carbon dioxide
CVT continuously variable transmission
CVVT continuously variable valve technology
DCT Dual-clutch transmission
DOhC Dual overhead camshaft
EC energy consumption
Epa us environmental Protection agency
EU european union
FFV Flex-fuel vehicle
FTp Federal test procedure
FwD Front-wheel drive
GDi gasoline direct injection
GDp gross domestic product
GhG greenhouse gas
GM general Motors
iBaMa Brazilian institute of the environment and renewable natural resources
iC internal combustion
iCCT international council on clean transportation
iNMETRO national institute of Metrology standardization and industrial Quality
Kg Kilogram
Km Kilometer
Kw Kilowatt
LDV light-duty vehicle
LpG liquified petroleum gas
MDiC Ministry of Development industry and Foreign trade
MJ Megajoule
MpFi Multi-point fuel injection
Mpg Miles per gallon
NaS us national academy of sciences
43
ICCT white paper
NhTSa us national highway transportation safety administration
OhV overhead valve
pBEV Brazilian Vehicle labeling Program
pSa Psa Peugeot citroeumln
pTwR Power-to-weight ratio
pV Passenger vehicle
RwD rear-wheel drive
SOhC single overhead camshaft
SUV sport utility vehicle
US united states
USD us dollar
VTEC Valve timing electronic control
VVa Variable valve actuation
VVL Variable valve lift
44
Brazil Passenger Vehicle Market statistics
AppENDix A SEGMENT DEfiNiTiONS
Table a‑1 ndash segment definitions
Segmentpower (kw)
pTwR (kwkg) area (m2)
Other characteristics Examples
Subcompact lt 140 lt 0075 le 65 mdash Mini cooper chevrolet celta smart Fortwo
Compact lt 140 lt 0075 65 lt area le 70 mdash honda Fit hyundai hB20 Volkswagen Polo
Medium lt 140 lt 0075 70 lt area le 80 mdash honda civic nissan tiida Peugeot 308
Large lt 140 lt 0075 gt 80 mdash audi a4 BMW 3 series Mercedes c-class
Sports gt 140 gt 0075 mdash 4 seats maxjaguar XF lamborghini gallardo Ferrari california
Off‑road mdash mdash lt 80 traction = 4WDjeep cherokee honda cr-V BMW X3 hyundai santa Fe
SUV mdash mdash lt 80Based on aDKrsquos default classification
BMW X1 Ford ecosport hyundai tucson
Minivan mdash mdash Passengers 6-12
citroen grand Picasso Kia carnival
45
ICCT white paper
AppENDix b iNTErNATiONAL MArKET DATA
Table B‑1 ndash international market comparison of new fleet characteristics
parameters China S Korea EU US Japan india Brazil
Year 2012 2011 2013 2013 2011 2012 2013
Sales (million) 155 13 118 156 352 256 304
price (USD) $21008 $21383 $24439 mdash $20637 $11717 $22015
No of cylinders mdash 43 40 47 38 36 40
Displacement (cc) 1605 1960 1613 2606 1425 1294 1430
Curb weight (kg) 1296 1421 1391 1623 1193 1059 1106
Length (mm) 4323 4531 4263 mdash 4013 3859 4100
Footprint (m2) 38 420 40 425 371 341 367
Engine power (kw) 86 120 89 148 78 55 76
pTwR (kwkg) 00664 00844 00640 00912 00654 00519 00671
Energy consumption ndash US CaFE (MJKm)[1] 235 206 169 250 171 183 202
[1] energy consumption data presented here for countries other than Brazil were obtained from local official sources in its original metric and drive cycle and then converted to Mjkm under the us caFe drive cycle using the methodology described in Yang (2015) Mode details and historical fuel consumption data on their original metrics is presented in the icctrsquos global PV standard website httpwwwtheicctorginfo-toolsglobal-passenger-vehicle-standards
Data Sources
China Ministry of industry and information technology (Miit 2014) corporate average Fuel efficiency accounting Method for Passenger cars available at httpwwwgovcngzdt2013-0320content_2358627htm
Baseline performance china automotive research and technology center through internal communication and icct internal 2010 database for chinese light-duty vehicles
S Korea internal communication with s Korean official and from greencarcongress available at httpwwwgreencarcongresscom200906korea-20090604html
EU european environment agency (2014) Monitoring co2 emissions from new passenger cars in the eu summary of data for 2013 april 2014
US us ePa (2014) light-duty automotive technology carbon dioxide emissions and fuel economy trends1975 through 2014 table 91 page 110 available at http httpwwwepagovfueleconomyfetrends1975-2014420r14023apdf
Japan jaMa (2010) the Motor industry of japan available at httpwwwjama-englishjppublicationsMVs2010pdf Mlit httpwwwmlitgojpcommon000990330pdf
india Bureau of energy efficiency white paper 2010-2012 calculation based on icct database
Brazil icct Brazil Vehicle Database (2013)
46
Brazil Passenger Vehicle Market statistics
Table B‑2 ndash international market comparison of technology adoption in new vehicles
Technology adoption China S Korea EU US Japan india Brazil
Year 2010 2011 2013 2013 2011 2012 2013
Fuel type
CBGLpGFlex 0 11 2 0 0 4 94
Gasoline 99 65 44 93 86 56 6
hybrid 0 1 1 5 13 0 0
Diesel 1 23 53 1 0 40 0
No of cylinders
Two 0 0 0 0 0 6 0
Three 4 0 7 0 36 28 3
Four 90 84 87 56 57 65 97
Five 0 0 1 0 0 0
Six 6 15 4 32 5 0 1
Eight or more 0 0 0 12 1 0 0
Transmission
Manual 60 3 83 5 1 98 83
automatic 34 90 9 75 34 2 15
CVT 5 7 2 18 65 0 1
DCT 1 0 6 2 mdash 0 1
Number of gear ratios
Four or fewer 13 16 1 7 mdash 10 6
Five 68 9 45 11 mdash 85 83
Six or more 19 75 54 82 mdash 5 11
Drivetrain
FwD 74 86 81 83 59 76 0
RwD 21 7 7 10 5 22 0
4wD and awD 5 7 12 7 36 2 100
No of valves per cylinder
Two 17 mdash mdash 2 4 25 60
Multi valve 83 mdash mdash 98 95 75 40
Valve camshaft configuration
Single overhead camshaft 26 1 mdash mdash 16 41 63
Dual overhead camshaft 74 84 mdash mdash 82 53 25
Overhead camshaft mdash 15 mdash mdash 0 6 mdash
Valve actuation
Fixed 50 16 mdash 2 11 86 78
VVT 44 84 mdash 98 89 12 16
VVL 6 mdash mdash mdash mdash 2 6
Fuel systems for gasoline vehicles
Multi‑point fuel injection 94 72 68 62 95 100 98
Gasoline direct injection 6 28 32 37 5 0 2
air induction systems for gasoline vehicles
Naturally aspirated 93 75 41 85 92 64 97
Supercharger turbocharger or twin‑turbo 7 25 59 15 8 36 3
47
ICCT white paper
AppENDix C NEW vEhiCLE ChArACTEriSTiCS AND TEChNOLOGy ADOpTiON DATA iN brAziL
Table C‑1 ndash Fleet characteristics of new Brazilian passenger vehicles by segment (2013)
parameters Subcompact Compact Medium Large Sports Off‑road SUV Minivan
Sales (thousands) 6785 6843 11790 1920 273 768 1997 23
Market share () 223 225 38 8 63 09 25 65 01
price (R$) $30103 $38732 $45496 $66508 $148834 $151284 $75164 $82284
No of cylinders 400 391 399 400 462 448 404 433
Displacement (cc) 1128 1293 1447 1794 2430 2586 1884 2244
Curb weight (kg) 940 1037 1102 1329 1561 1772 1395 1604
Length (mm) 3804 4026 4163 4499 4711 4516 4352 4658
Footprint (m2) 339 361 371 402 418 409 402 427
Engine power ndash gasoline (kw) 58 68 75 99 183 146 103 120
Engine power ndash ethanol (kw) 59 70 77 98 mdash 109 101 mdash
pTwR ndash gasoline (kwkg) 00614 00655 00671 00742 01173 00828 00731 00732
pTwR ndash ethanol (kwkg) 00630 00678 00697 00757 mdash 00766 00745 mdash
48
Brazil Passenger Vehicle Market statistics
Table C‑2 ndash Fleet characteristics of new Brazilian passenger vehicles by manufacturer (2013)
parameters Fiat
GM
Vo
lksw
agen
Ford
Ren
ault
hyu
ndai
ho
nda
Toyo
ta
pSa
Nis
san
Mit
sub
ishi
Kia
JaC
BM
w
Land
Rov
er
Mer
ced
es‑B
enz
Che
ry
aud
i
Suzu
ki
Jeep
Sales (thousands) 6087 5486 5448 3074 2207 2055 1392 1334 1163 621 368 255 158 141 106 94 80 67 63 36
Market share () 2002 1804 1792 1011 726 676 458 439 383 204 121 084 052 046 035 031 026 022 021 012
price (R$) $35017 $42259 $38701 $46174 $43447 $50112 $67078 $68922 $103001 $44035 $100696 $87009 $37654 $165111 $221943 $153281 $30821 $142799 $74769 $139039
No of cylinders 400 401 400 402 400 370 400 400 400 400 408 416 400 424 448 431 400 411 400 552
Displacement (cc) 1250 1340 1287 1497 1423 1495 1691 1808 1575 1579 2262 1856 1411 2095 2281 1934 1398 1912 1831 3182
Curb weight (kg) 1033 1060 1020 1156 1102 1122 1210 1201 1231 1069 1556 1377 1079 1624 1868 1598 1097 1551 1444 1945
Length (mm) 3965 4155 3993 4120 4127 4078 4319 4299 4116 4171 4401 4357 3956 4574 4487 4527 3896 4454 4234 4584
Footprint (m2) 345 370 354 368 378 383 397 387 376 379 395 407 351 429 433 429 349 417 323 420
Engine power ndash gasoline (kw) 64 71 65 79 73 86 96 90 80 82 120 112 83 151 179 138 71 136 94 162
Engine power ndash ethanol (kw) 65 72 65 79 76 85 97 90 81 82 107 106 95 mdash mdash mdash 75 mdash mdash mdash
pTwR ndash gasoline (kwkg)
00613 00662 00631 00674 00657 00739 00788 00745 00646 00766 00779 00792 00784 00921 00977 00856 00638 00870 00649 00835
pTwR ndash ethanol (kwkg) 00629 00681 00642 00693 00685 00781 00800 00795 00660 00768 00710 00798 00896 mdash mdash mdash 00659 mdash mdash mdash
49
ICCT white paper
Table C‑3 ndash Fleet characteristics of new Brazilian passenger vehicles by origin (2013)
parameters Domestic imported
Sales (thousands) 2537 504
Market share () 834 166
price (R$) $41739 $76049
No of cylinders 397 412
Displacement (cc) 1359 1791
Curb weight (kg) 1070 1289
Length (mm) 4063 4285
Footprint (m2) 362 390
Engine power ndash gasoline (kw) 70 102
Engine power ndash ethanol (kw) 73 84
pTwR ndash gasoline (kwkg) 0065 0076
pTwR ndash ethanol (kwkg) 0068 0074
50
Brazil Passenger Vehicle Market statistics
Table C‑4 ndash technology adoption in new Brazilian passenger vehicles by segment (2013)
Technology adoption Subcompact Compact Medium Large SportOff‑road SUV Minivan
Fuel type
Flex 982 988 982 837 00 134 826 00
Gasoline 18 12 17 163 996 540 174 1000
hybrid 0000 0000 0028 0000 0396 0001 0000 0000
Diesel 00 00 00 00 00 326 00 00
No of cylinders
Three 01 91 10 00 00 00 00 00
Four 999 909 990 998 758 775 979 833
Five 00 00 00 02 03 00 00 00
Six 00 00 00 00 175 211 21 167
Eight or more 00 00 00 00 63 13 00 00
Transmission
Manual 993 944 826 622 62 174 505 641
automatic 07 55 161 283 629 707 451 359
CVT 00 00 12 89 09 93 34 00
DCT 00 01 02 06 299 25 10 00
No of gear ratios
Four or fewer 04 47 72 51 00 34 247 193
Five 984 943 848 378 15 392 516 641
Six 12 09 73 515 796 462 225 167
Seven 00 01 06 23 87 53 12 00
Eight or more 00 00 01 32 102 59 00 00
Drivetrain
FwD 998 1000 997 688 550 00 916 1000
RwD 02 00 03 311 221 00 84 00
awD 00 00 00 01 229 1000 00 00
No of valves per cylinder
Two 806 694 584 195 00 00 258 00
Multi valve 194 306 416 805 1000 1000 742 1000
Valve camshaft configuration
Single overhead camshaft 839 786 709 309 00 212 375 00
Dual overhead camshaft 24 158 161 546 880 517 446 255
Valve actuation
Fixed 982 729 807 461 49 493 664 868
VVT 18 211 115 470 827 367 252 132
VVT+VVL 00 61 78 68 124 140 84 00
Fuel systems for gasoline vehicles
Multi‑point fuel injection 999 998 997 949 979 143 766 1000
Gasoline direct injection 01 02 03 51 21 857 234 00
air induction systems for gasoline vehicles
Naturally aspirated 999 997 995 943 974 369 543 1000
Supercharger turbocharger or twin‑turbo 01 03 05 57 26 631 457 00
51
ICCT white paper
Table C‑5 ndash technology adoption in new Brazilian passenger vehicles by manufacturer (2013)
Technology adoption Fi
aT
GM
VO
LKSw
aG
EN
FOR
D
REN
aU
LT
hY
UN
Da
i
hO
ND
a
TOYO
Ta
pSa
NiS
SaN
MiT
SUB
iSh
i
Kia
JaC
BM
w
LaN
D R
OV
ER
MER
CED
ES
Fuel type
Flex 990 987 965 966 997 921 999 886 928 998 283 739 31 42 00 00
Gasoline 10 09 35 34 03 79 01 35 72 02 557 255 969 957 663 950
hybrid 00 00 00 00 00 00 00 02 00 00 00 00 00 00 00 00
Diesel 00 04 00 00 00 00 00 77 00 00 160 06 00 00 337 50
No of cylinders
Three 00 00 05 00 00 348 00 00 00 00 00 00 00 00 00 00
Four 1000 996 994 989 1000 626 999 998 1000 1000 958 922 1000 906 787 878
Five 00 00 00 00 00 00 00 00 00 00 00 00 00 00 00 00
Six 00 02 01 11 00 26 01 02 00 00 42 78 00 68 185 87
Eight or more 00 02 00 00 00 00 00 00 00 00 00 00 00 26 28 35
Transmission
Manual 992 878 985 846 853 632 566 565 703 785 493 120 1000 02 00 151
automatic 08 103 00 137 62 285 355 160 297 121 118 793 00 575 18 14
CVT 00 19 15 16 41 70 01 246 00 00 139 87 00 423 982 836
DCT 00 00 00 00 43 13 78 30 00 94 251 00 00 00 00 00
No of gear ratios
Four or fewer 02 04 00 55 104 237 00 323 249 132 17 133 00 00 00 00
Five 981 811 963 839 797 623 861 643 684 828 530 107 1000 00 00 64
Six 17 185 29 106 99 140 139 07 67 40 453 754 00 217 800 00
Seven 00 00 07 00 00 00 00 27 00 00 00 00 00 08 00 936
Eight or more 00 00 00 00 00 00 00 00 00 00 00 06 00 775 200 00
Drivetrain
FwD 1000 902 989 972 987 985 990 892 1000 1000 496 623 1000 00 00 00
RwD 00 91 00 00 00 00 00 16 00 00 00 370 00 882 00 900
awD 00 06 11 28 13 15 10 92 00 00 504 07 00 118 1000 100
No of valves per cylinder
Two 811 864 988 745 220 00 00 00 00 00 00 00 00 00 00 00
Multi Valve 189 136 12 255 780 1000 1000 1000 1000 1000 1000 1000 1000 1000 1000 1000
Valve camshaft configuration
SOhC 836 755 914 675 832 00 04 00 497 398 331 00 00 00 00 00
DOhC 07 108 56 50 168 992 786 875 352 428 477 1000 907 810 860 453
Valve actuation
Fixed 1000 898 965 966 940 29 00 574 736 573 435 76 124 187 18 55
VVT 00 102 35 34 60 971 00 426 264 427 00 924 876 00 982 945
VVT+VVL 00 00 00 00 00 00 1000 00 00 00 565 00 00 813 00 00
air induction System
Naturally aspirated 997 994 966 977 997 988 1000 923 922 1000 835 936 1000 97 37 101
Supercharger turbocharger or twin‑turbo
03 06 34 23 03 12 00 77 78 00 165 64 00 903 963 899
Fuel systems for gasoline vehicles
Multipoint fuel injection 1000 995 965 972 1000 989 1000 1000 967 1000 994 1000 1000 78 15 158
Gasoline Direct injection 00 05 35 28 00 11 00 00 33 00 06 00 00 922 985 842
note Difference between 100 and summation of sohc and Dohc market share values corresponds to data not available
52
Brazil Passenger Vehicle Market statistics
AppENDix D DATA SOurCES AND COMpLETENESS
the basis of the statistics shown in this report is a database compiled by the icct with vehicle sales technical information (eg fleet characteristics technology content) and energy consumption (converted from either co2 emissions or fuel economy) from various data sources outlined in table D-1
Table D‑1 ndash Brazilian data sources
parameters Sales TechnicalEnergy
consumption
aDK (2014 2015) x x
MarkLines (2015) x
iBaMa (2014) x
iNMETRO (2014) x
UOL (2014) x
icarroscom (2014) x
this analysis examined energy consumption data from two public sources the nota Verde Program by the Brazilian institute of the environment and renewable natural resources (iBaMa) and the Brazilian Vehicle labeling Program (PBeV) by the national institute of Metrology standardization and industrial Quality (inMetro) table D-2 summarizes key differences between these two data sources
Table D‑2 ndash energy consumption data sources
iBaMa iNMETRO
program nota Verde1 Brazilian Vehicle labeling Program (PBeV)2
program description
Mandatory program that reports emissions of co2 co nox and nMhc as part of emissions certification program
Voluntary program since 2009 that allows the comparison of fuel economy across vehicle models
Unit gco2 km kml
Test cycle chassis testing under urban (FtP) driving cycle based on nBr 66012005
chassis testing under urban (FtP) and highway (hWYFe) driving cycles based on nBr 702420103
adjustment
no adjustment for real-world driving conditions Because reported co2 emissions are assumed to be zero for ethanol adjustments were made to account for tailpipe co2 emissions for vehicles running on ethanol
since 2010 published values include real-world adjustment factors to chassis test data a method adopted by the us ePa in 2008
Conversion to MJkm
iBaMarsquos data are reported as FtP (city test) co2 data in gco2 km conversion to caFe test cycle and to a different metric (Mjkm) involves four steps as presented in Figure D-1
inMetrorsquos data in kml are presented separately by fuel type (e22 e100) and driving cycle (urban highway) conversion to Mjkm was done by applying a conversion factor (2167 gco2 l for e22 and 1428gco2l for e00) caFe values are obtained by using a 5545 weighting for the urban (FtP) and highway cycles respectively
1 iBaMa (2014) nota Verde program available at httpwwwmmagovbrcidades-sustentaveisqualidade-do-arcontrole-de-emissoes-veicularesnota-verde
2 inMetro (2014) Programa Brasileiro de etiquetagem Veicular (PBeV) available at httpwwwinmetrogovbrconsumidortabelas_pbe_veicularasp
3 inMetro (2014) Metodologia Para Divulgaccedilatildeo De Dados De consumo Veicular available at httpwwwinmetrogovbrconsumidorpbeMetodologia_consumo_Veicularpdf
53
ICCT white paper
Step 1 Correcting the original IBAMA CO2 reported data ndash FTP CO2 gkm
IBAMArsquos CO2 reported values are corrected to account for tailpipe emissions from ethanol (tailpipe CO2 emissions are reported as zero in IBAMArsquos data)
bull E22 FTP reported CO2 data are reduced by 177bull E100 FTP reported CO2 data are reduced by 100
Flex fuel vehicles are tested with E22 and E00 the final values is calculated as the average of both fuelsCO2 IBAMA_Flex_FTP= 05(1-0177)CO2_E22_test_FTP + 050E100_FTP = 050823CO2_E22_FTPFor Gasoline only vehicles the tests are carried out only with Gasoline E22CO2 IBAMA_Gasoline_FTP = (1-0177) CO2_E22_Test_FTP
Where in the previous equations CO2_E22_FTP means CO2 emissions values obtained under FTP testingCO2 IBAMA_Flex_FTP means IBAMArsquos Corrected FTP values for flex vehiclesCO2 IBAMA_Gasoline_FTP means IBAMArsquos Corrected FTP values for gasoline only (E22) vehicles
INNOVAR AUTO is based on energy consumption data obtained as the combined CAFE test cycle This requires a weighted average of energy consumption data obtained from FTP testing (city driving ) and Highway fuel economy testing (HWFET) In mathematical form CAFE=f(FTPHWFET)
Given that IBAMA data is provided for only the first aprt the FTP testing then it is required to find a way to calculate CAFE combined values through FTP -75 only data A linear function was thus developed from data with FTP and HWY values (INMETRO data) is used to convert FTP only values to CAFE CO2 values ie CAFE=f(FTP) The function used for this conversion is
CO2_CAFE= (CO2_FTP+44756)11572
Step 2Convert FTP CO2 values to CAFE CO2 values
Converting CO2 values to MJkm values is done by using the energy density of E22 Note that all the previous calculations for CO2 come from E22-based data
bull The energy density of E22 is 2894 MJLE22bull E22 emits 2167gCO2LE22bull CAFE (MJkm) = CAFE (gCO2km) (2894 MJLE22 2167 gCO2LE22)
Step 3 Convert US CAFE CO2 values to MJkm values
Figure D‑1 ndash conversion of emission to energy consumption data
energy consumption values calculated from iBaMa and inMetro data differ greatly Figure D-1 illustrates energy consumption data for those models in both databases iBaMa data are on average 126 higher than inMetro data with a standard deviation of 89 and a maximum deviation of 39
54
Brazil Passenger Vehicle Market statistics
0
05
1
15
2
25
3
0 05 1 15 2 25 3
Ene
rgy
cons
ump
tio
n IB
AM
A (
MJ
km)
Energy consumption INMETRO (MJkm)
n=151
Figure D‑2 ndash comparison between energy consumption data from inMetro and iBaMa
151 vehicles tested under both programs
although inMetro data are more transparent as it breaks down fuel economy by fuel and test cycle it is still a voluntary program that allows manufacturers to select which models will participate in addition not all manufacturers participate in the program in turn iBaMa data only include co2 data for the urban cycle and thus energy consumption in the combined cycle had to be estimated from correlations using international data in addition corrections had to be made for gasoline-only engines since it seems that a co2 discount in theory only applicable to flex-fuel engines was also applied to gasoline-only engines Despite these data quality issues iBaMa data were considered the most adequate data source for energy consumption because it is a mandatory program that requires data reporting by all vehicle models and manufacturers
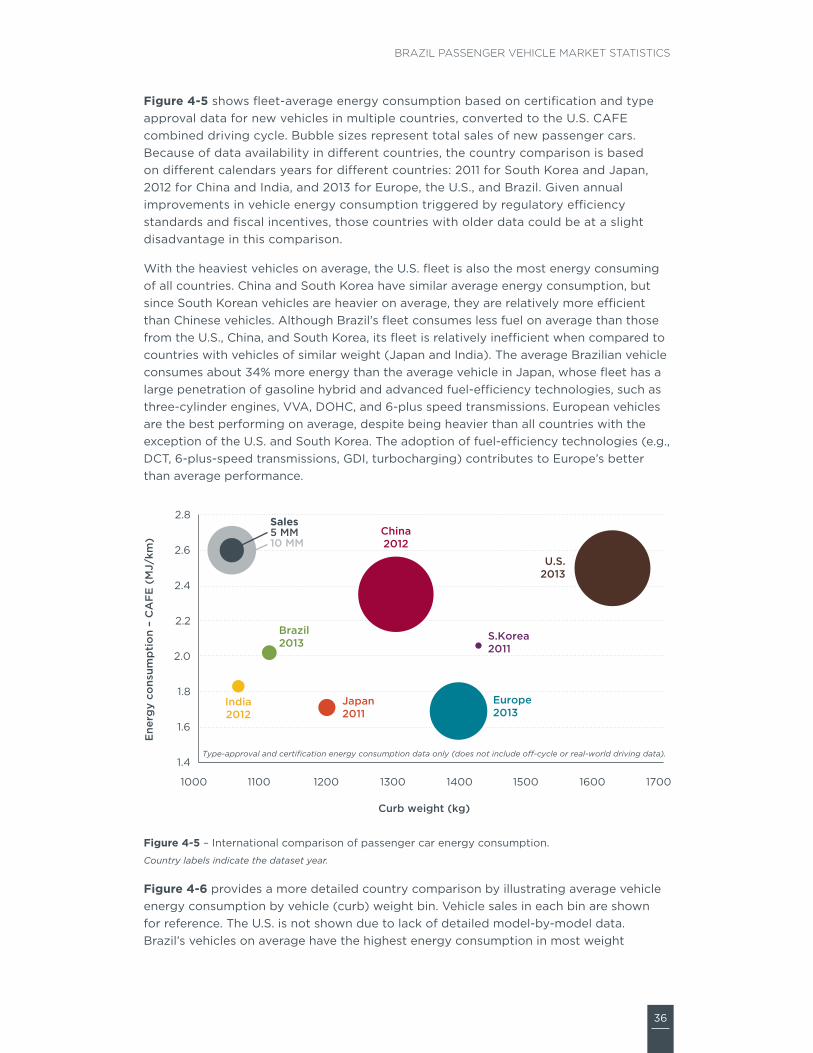
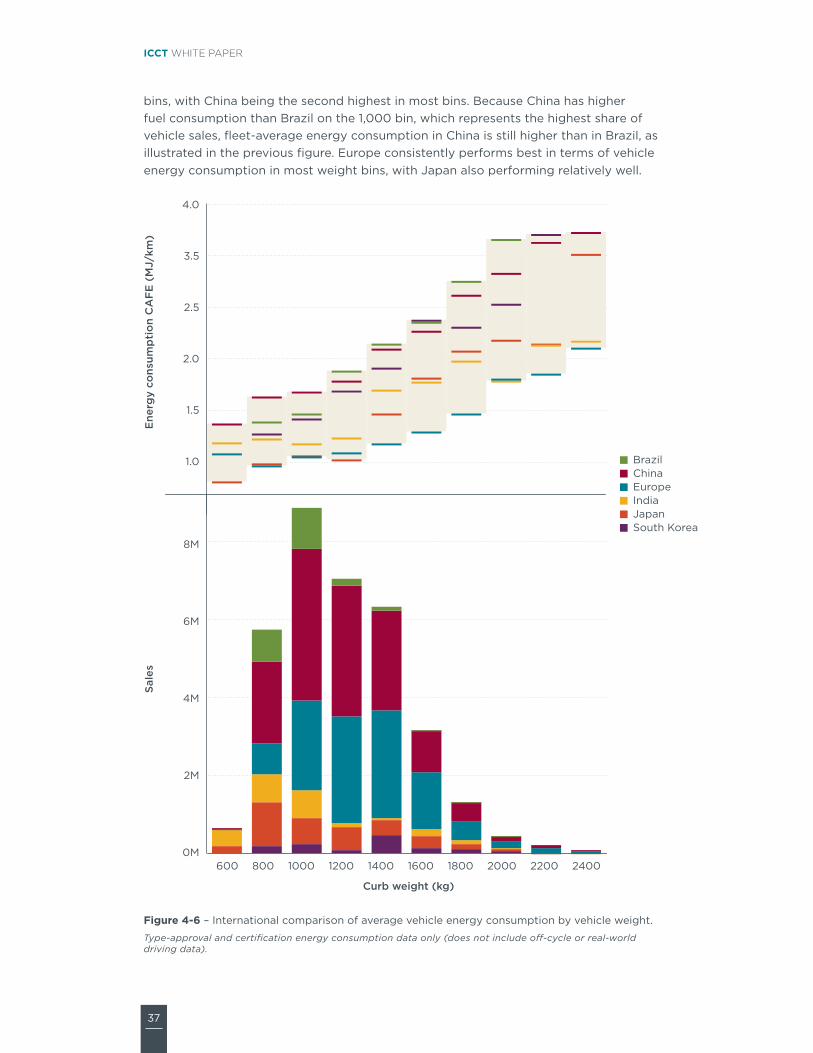
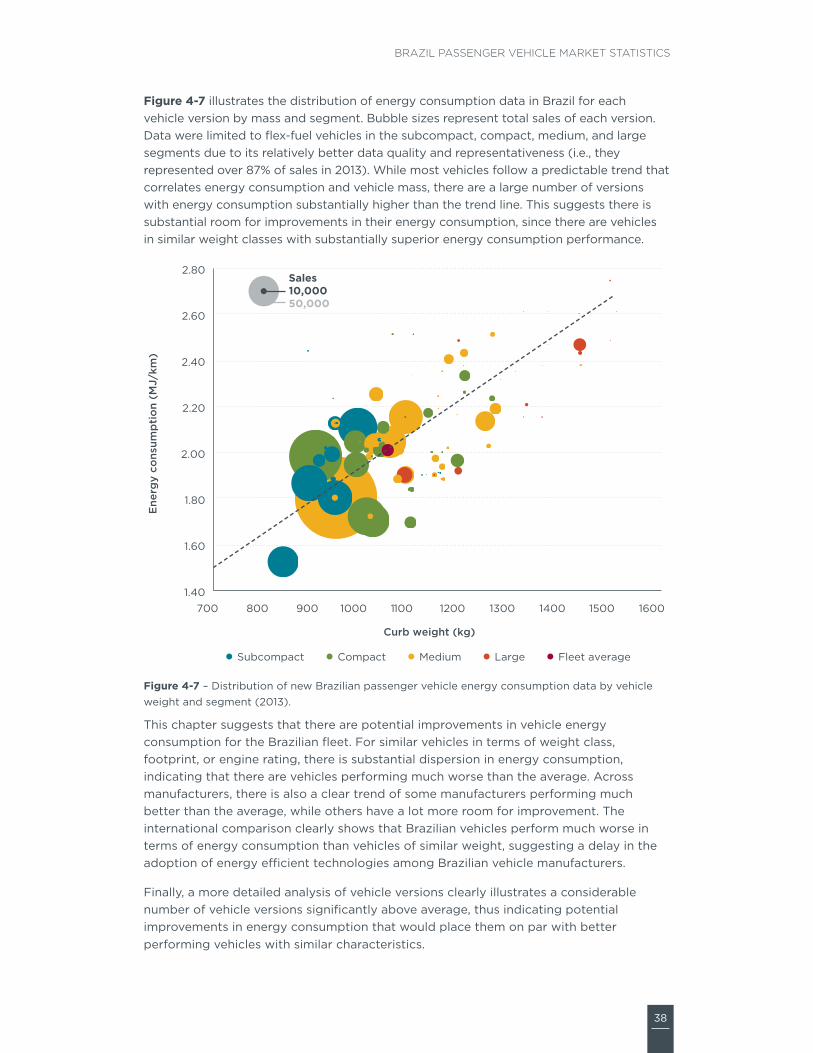
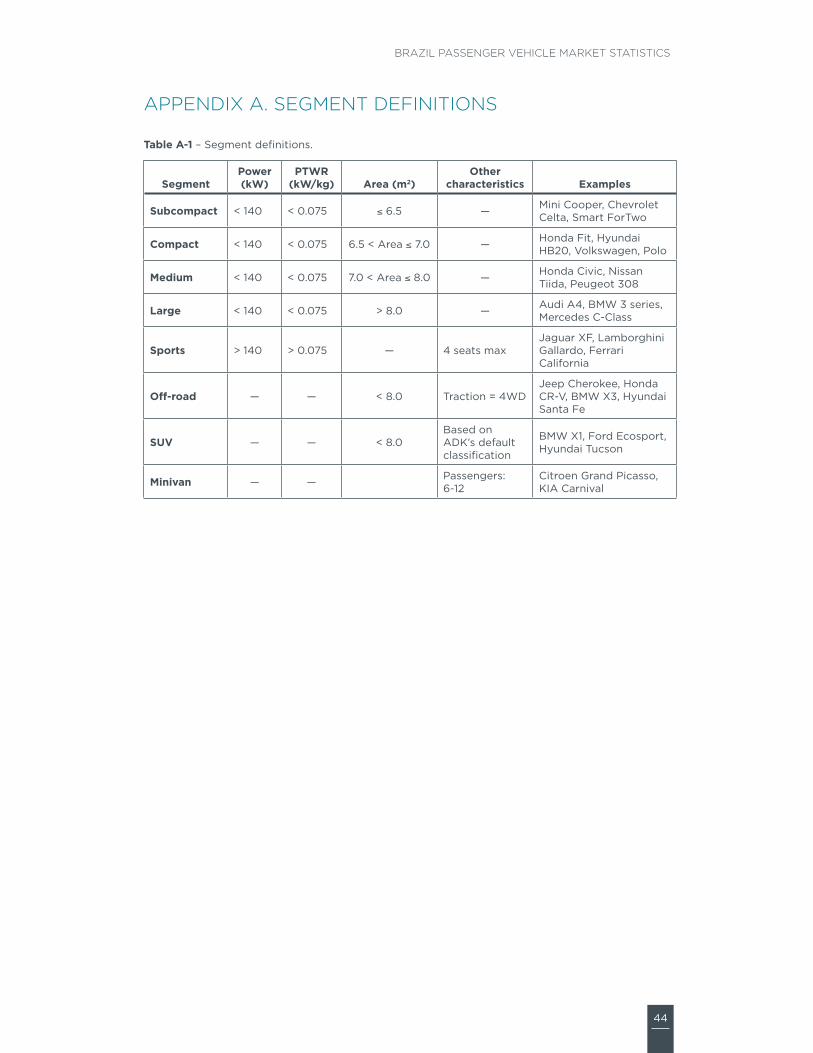
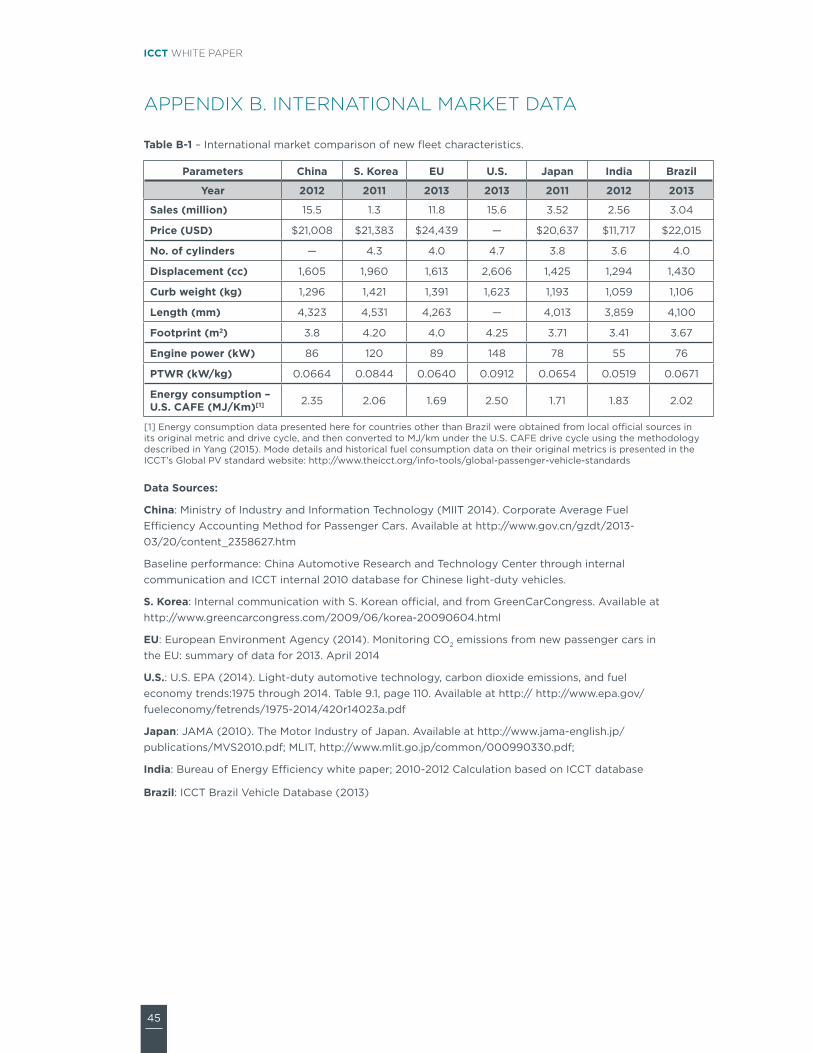
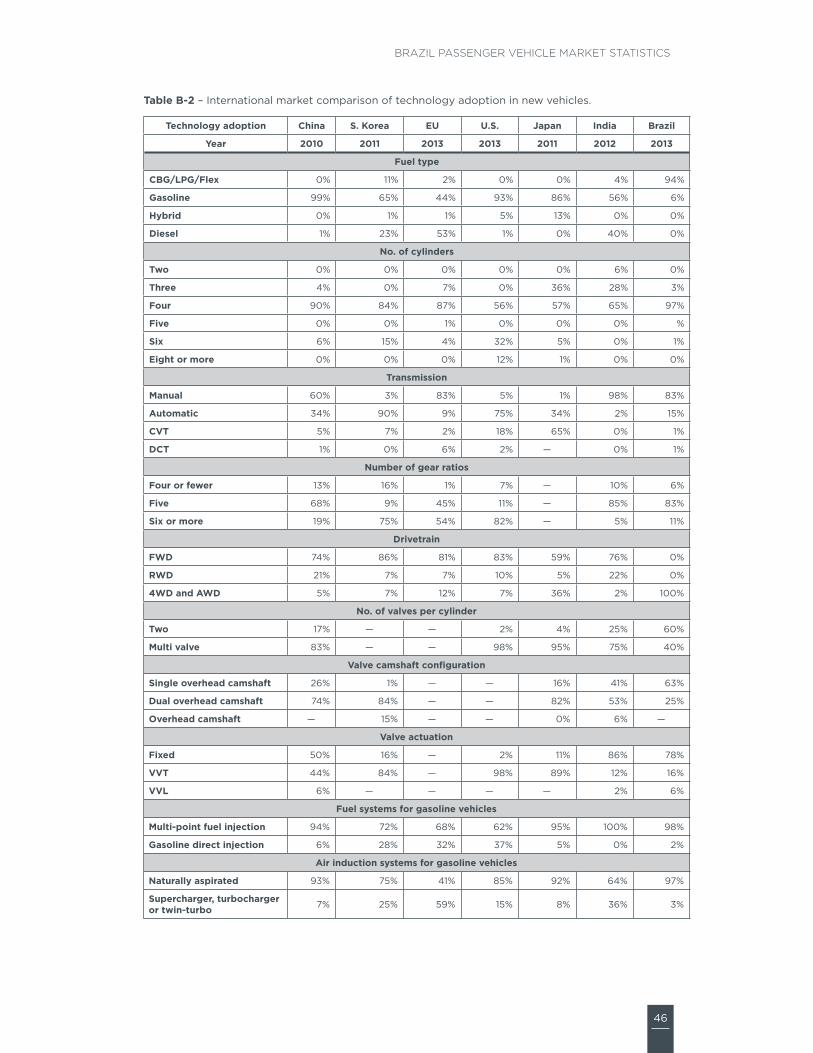
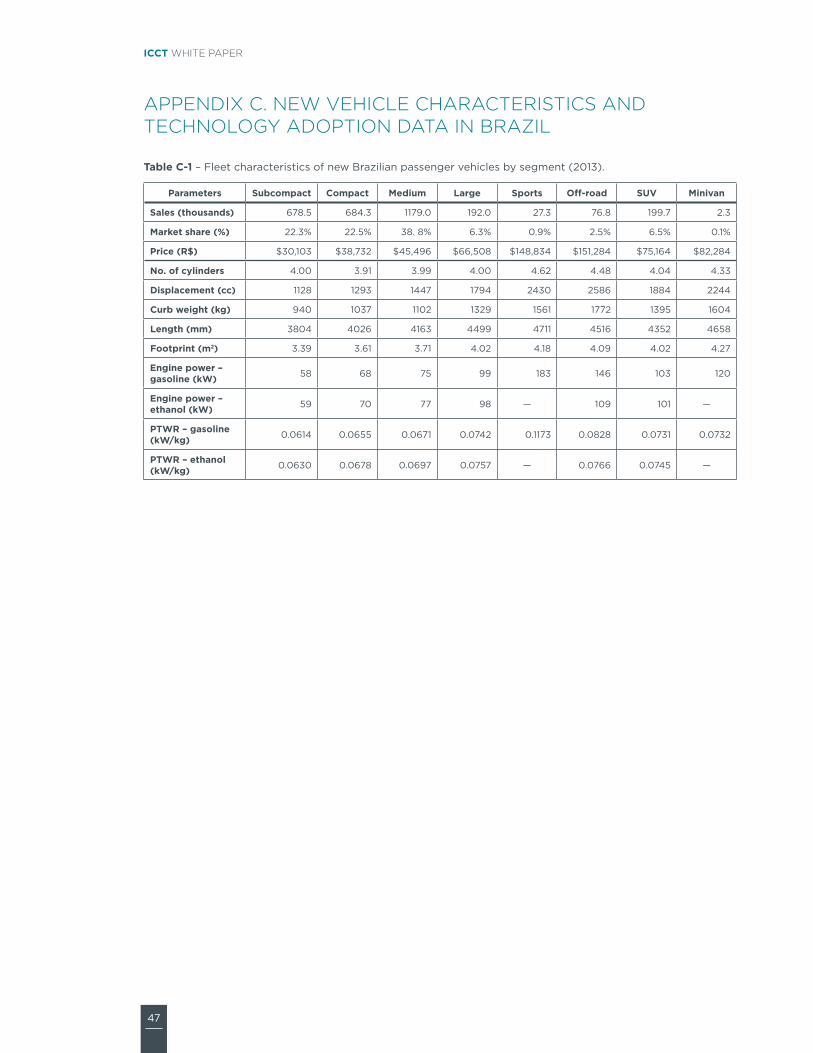
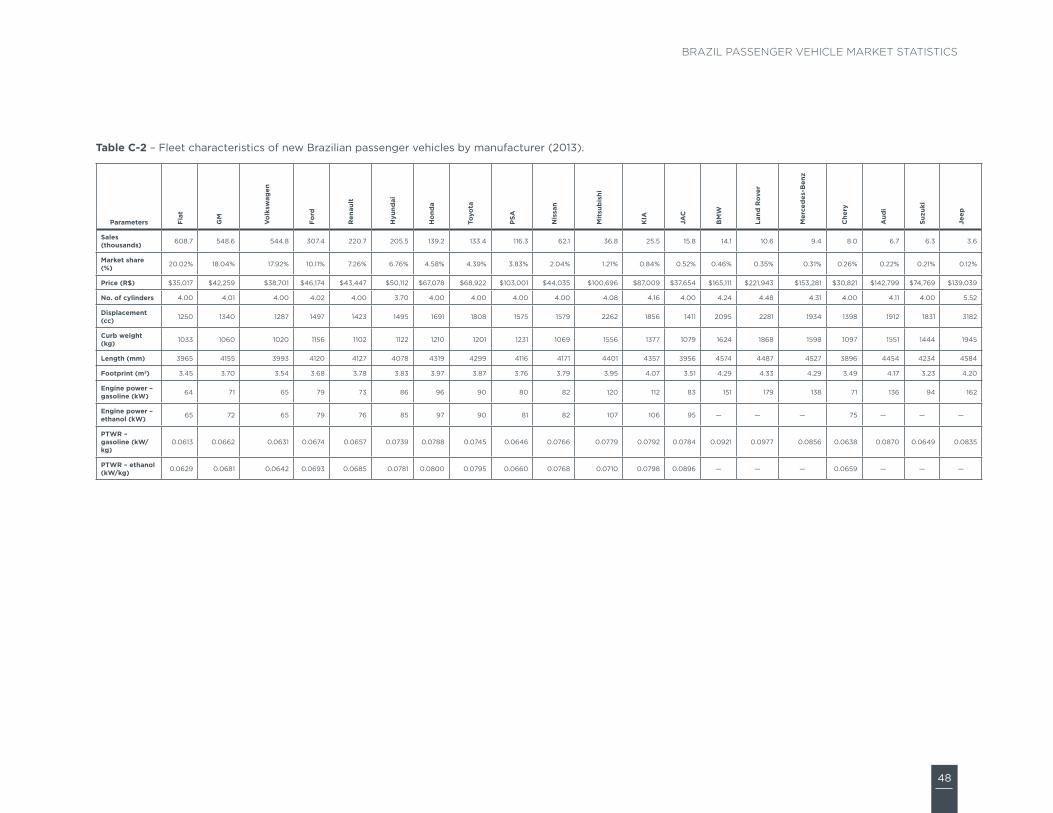
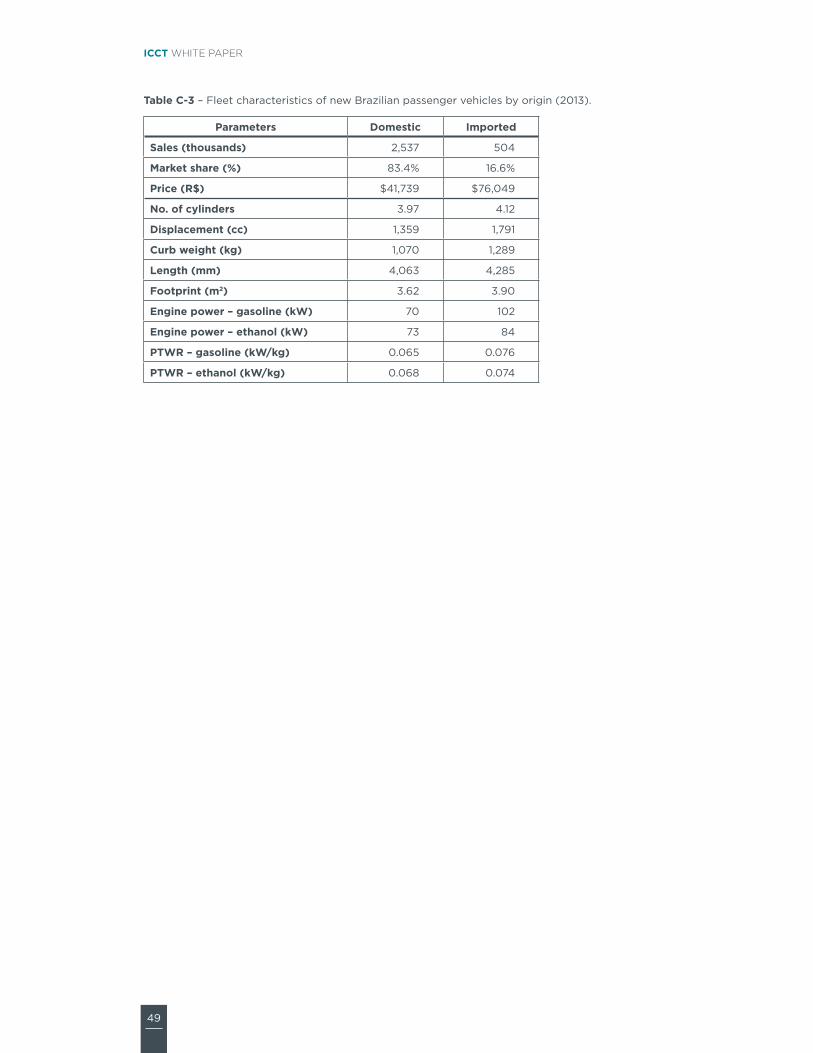
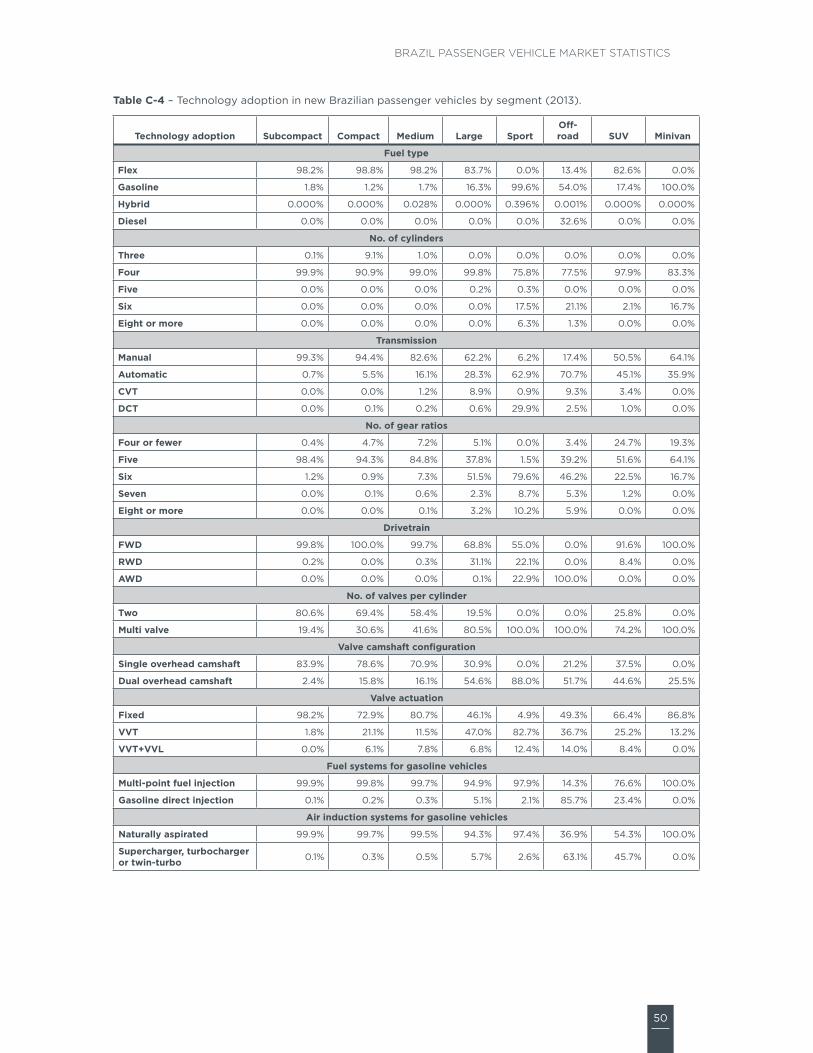
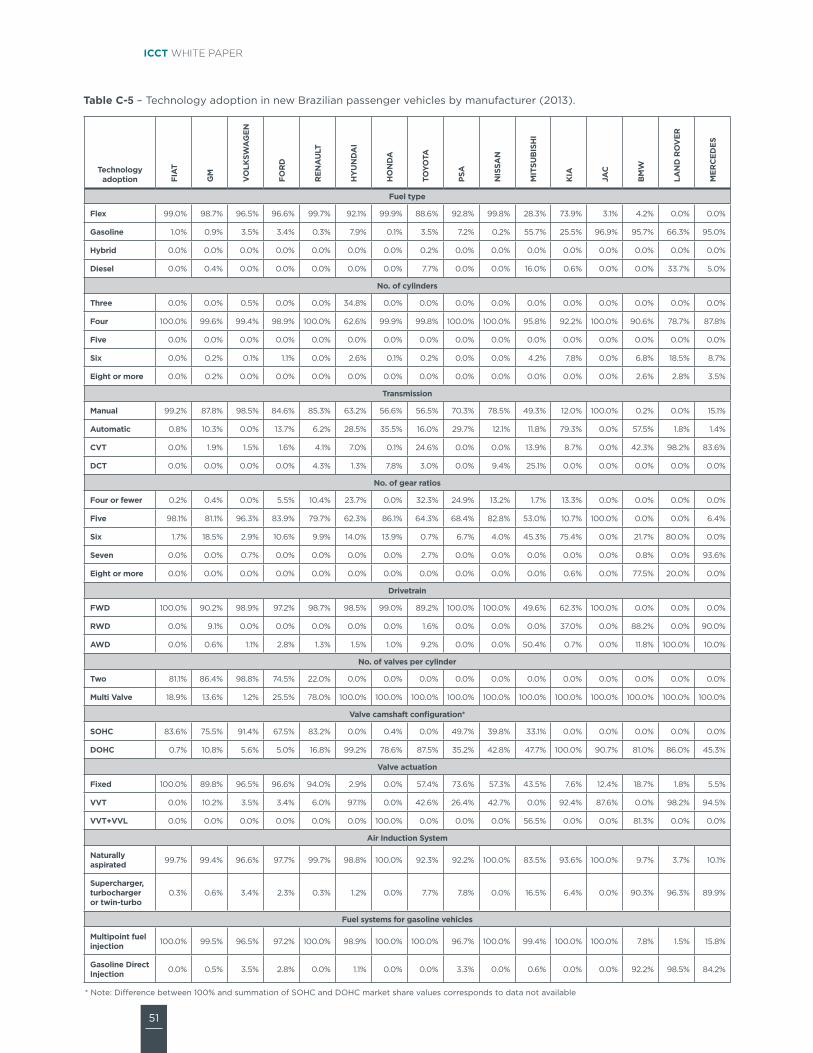
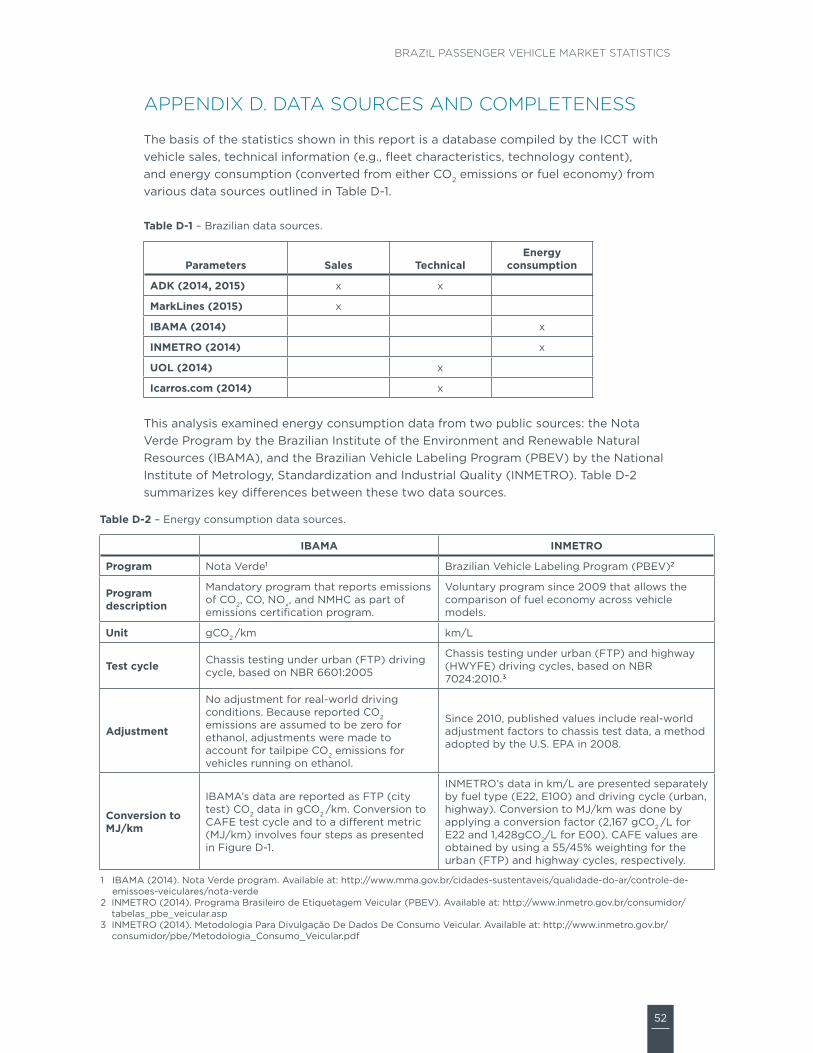
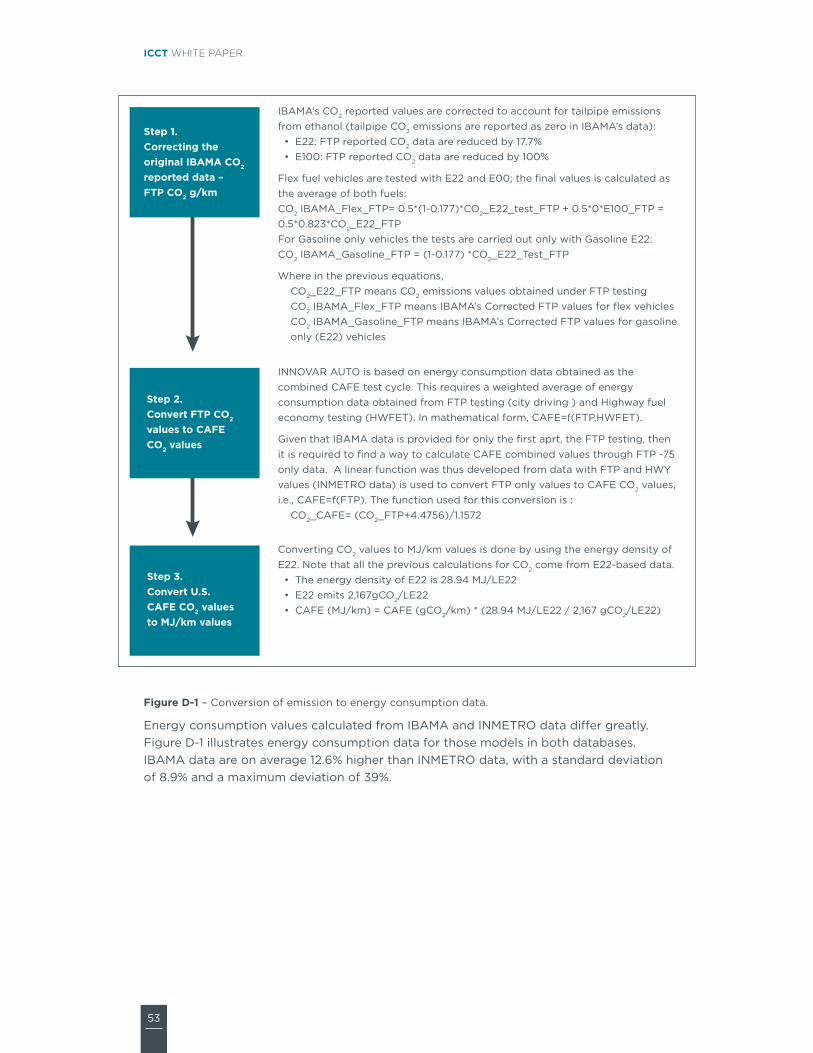
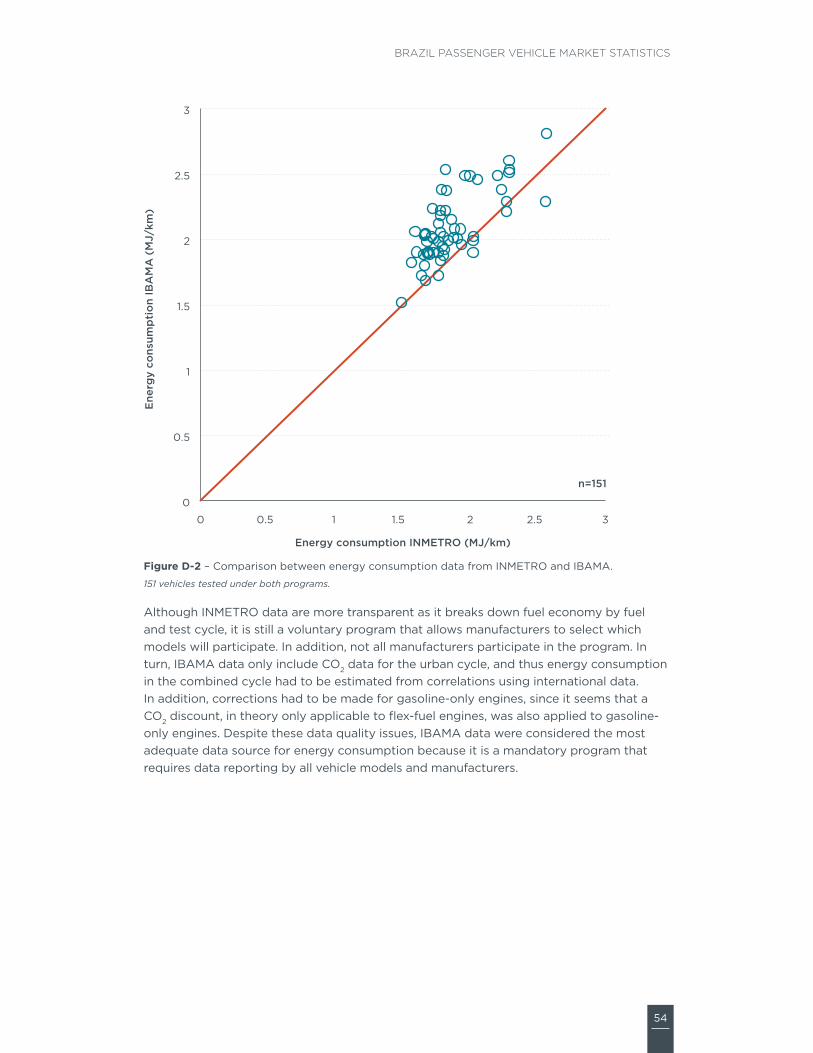