Embed Size (px)
Citation preview

i
BRIDGE ANALYSIS AND EVALUATION OF EFFECTS UNDER OVERLOAD VEHICLES (PHASE 1) CFIRE 02-03 December 2009
National Center for Freight & Infrastructure Research & Education College of Engineering Department of Civil and Environmental Engineering University of Wisconsin, Madison
Authors: Han-Ug Bae and Michael Oliva; University of Wisconsin-Madison, Madison, WI. Principal Investigator: Michael Oliva; Professor, Department of Civil and Environmental Engineering, University of Wisconsin-Madison

ii
DISCLAIMER This research was funded by the National Center for Freight and Infrastructure Research and Education. The contents of this report reflect the views of the authors, who are responsible for the facts and the accuracy of the information presented herein. This document is disseminated under the sponsorship of the Department of Transportation, University Transportation Centers Program, in the interest of information exchange. The U.S. Government assumes no liability for the contents or use thereof. The contents do not necessarily reflect the official views of the National Center for Freight and Infrastructure Research and Education, the University of Wisconsin, the Wisconsin Department of Transportation, or the USDOT’s RITA at the time of publication. The United States Government assumes no liability for its contents or use thereof. This report does not constitute a standard, specification, or regulation. The United States Government does not endorse products or manufacturers. Trade and manufacturers names appear in this report only because they are considered essential to the object of the document.

iii
TECHNICAL REPORT DOCUMENTATION PAGE
1. Report No.: CFIRE 02-03
2. Government Accession No. 3. Recipient’s Catalog No. CFDA 20.701
4. Title and Subtitle
BRIDGE ANALYSIS AND EVALUATION OF EFFECTS UNDER OVERLOAD VEHICLES (Phase 1)
5. Report Date December, 2009 6. Performing Organization Code
7. Author/s
Han-Ug Bae and Michael Oliva
8. Performing Organization Report No. CFIRE 02-03
9. Performing Organization Name and Address
Department of Civil and Environmental Engineering
University of Wisconsin-Madison
- and-
National Center for Freight and Infrastructure Research and Education (CFIRE)
University of Wisconsin-Madison
1415 Engineering Drive, 2205 EH
Madison, WI 53706
10. Work Unit No. (TRAIS) 11. Contract or Grant No.
12. Sponsoring Organization Name and Address
13. Type of Report and Period Covered
Final Report [09/01/08 – 12/31/09] 14. Sponsoring Agency Code
15. Supplementary Notes Project completed for the CFIRE with support from the Wisconsin Department of Transportation. 16. Abstract Movement of industrial freight infrequently requires special overload vehicles weighing 5 to 6 times the normal legal truck weight to move across highway systems. The gross vehicle weight of the overload vehicles frequently exceeds 400 kips while the normal interstate legal limit for gross vehicle weight is 80 kips. Examples of the loads carried by the vehicles are pressure vessels and transformers used in power plants, huge boilers, military hardware, beams and barges. Transportation agencies are asked to provide special permits for these vehicles along a specified pathway. Because of the unusual configuration of the vehicles it is difficult for those agencies to evaluate the effect of the vehicles on highway bridges. It is a time consuming job for the local agency since simple analysis methods for determining effects on bridges subjected to those overloads are not well established and the possibility of errors in estimating the impact of the loads on these structures could affect safety. This research aims to help agencies in evaluating the impact of these vehicles on structures. The following results were found from the research. 1) Finite element analyses of 118 multi-girder bridges and 16 load cases of overload vehicles for each multi-girder bridge were performed and the girder distribution factor equations for the multi-girder bridges under overload vehicles were developed based on the analysis results. The developed equations were found to be capable of replacing the time consuming 3D finite element analysis rationally and conservatively. 2) Investigation of the intermediate diaphragms to check the safety of the intermediate diaphragms under overload vehicles was performed and it was found that the safety of the intermediate diaphragms under overload vehicles is not of a concern from the investigation since relatively weak intermediate diaphragms were safe under the severe overload vehicles. 3) An equation to limit the weight of a single wheel set in overload vehicles to ensure the safety of the decks was developed. 4) Two detailed analysis examples of ‘complex bridges’ were performed and the results showed that it is necessary to perform three dimensional finite analysis to find effects of overload vehicles on complex bridges since each complex bridge has a unique configuration with special structural components. 17. Key Words
Overload vehicle, bridge analysis, deck analysis, girder analysis, diaphragm analysis, complex bridge
18. Distribution Statement
No restrictions. This report is available through the Transportation Research Information Services of the National Transportation Library.
19. Security Classification (of this report) Unclassified
20. Security Classification (of this page) Unclassified
21. No. Of Pages 105
22. Price -0-
Form DOT F 1700.7 (8-72) Reproduction of form and completed page is authorized.
iv
BRIDGE ANALYSIS AND EVALUATION OF EFFECTS UNDER OVERLOAD VEHICLES (PHASE 1)
REPORT SUMMARY
Movement of industrial freight infrequently requires special overload vehicles weighing 5 to 6 times the normal legal truck weight to move across highway systems. The gross vehicle weight of the special overload vehicles frequently exceeds 400 kips while the normal interstate legal limit for gross vehicle weight is 80 kips. Examples of the loads carried by the vehicles are pressure vessels and transformers used in power plants, huge boilers, military hardware, beams and barges. Transportation agencies are asked to provide special permits for these vehicles along a specified pathway. Because of the unusual configuration of the vehicles it is difficult for those agencies to evaluate the effect of the vehicles on highway bridges. It is a time consuming job for the local agency since simple analysis methods for determining the effects on bridges subjected to those overloads are not well established and the possibility of errors in estimating the impact of the loads on these structures could affect safety. This research aims to help agencies in evaluating the impact of these vehicles on structures by providing simple analysis tool to analyze bridges loaded by the vehicles and allowable limits of the configurations of the vehicles. This simplified analysis method consists of a quick method for determining the portion of the force from an overload vehicle that is resisted by a single element, such as a girder, in a bridge. Thus, equations are developed for girder distribution factors for moment and shear in multi-girder bridges. Using the proposed equations to check common bridge capacities for overload vehicle permits will allow up to 20% more load on bridges as compared to a capacity check using current American Association of Highway and Transportation Officials (AASHTO) methods for estimating the forces in bridge girders. Simplified analysis of bridges with overloads: Quick calculation of interior girder distribution factors (GDFs) are shown in Equations 1&2 with information from the accompanying tables. These factors are appropriate for use with common overload vehicles and bridge configurations as described in Section 3.1 of the report. Overload vehicles may have either a single trailer or dual trailers (dual lane). The quick GDFs for moment and shear are given as:
Single lane trailer: d
gcba KtLSCR × (AASHTO equation) (1)
Dual lane trailer: e
wd
gcba SKtLSCR × (AASHTO equation) (2)
The “(AASHTO equation)” refers to the standard AASHTO LRFD distribution factor equations taken from AASHTO Table T4.6.2.2.2b-1 for moment and Table 4.6.2.2.3a-1 for shear. The AASHTO single lane loaded equation is used with the single lane
v
trailer factors and the AASHTO two or more lane loaded equation is used with the dual lane trailer factors in Eqs. 1&2. The variables in the equations are identical to those used in the AASHTO equations for moment distribution factors (AASHTO LRFD T4.6.2.2.2b-1) S = Girder spacing (ft),
L = Span (ft), t = Deck depth (in),
)( gg AeInK = Longitudinal stiffness parameter (in4),
DB EEn / , I = Moment of inertia of girder (in4),
A = Cross-sectional area of girder (in2),
ge = Distance between the centers of gravity of the basic girder and
deck (in), and
wS = Spacing of interior wheels for dual lane overload vehicle (ft.).
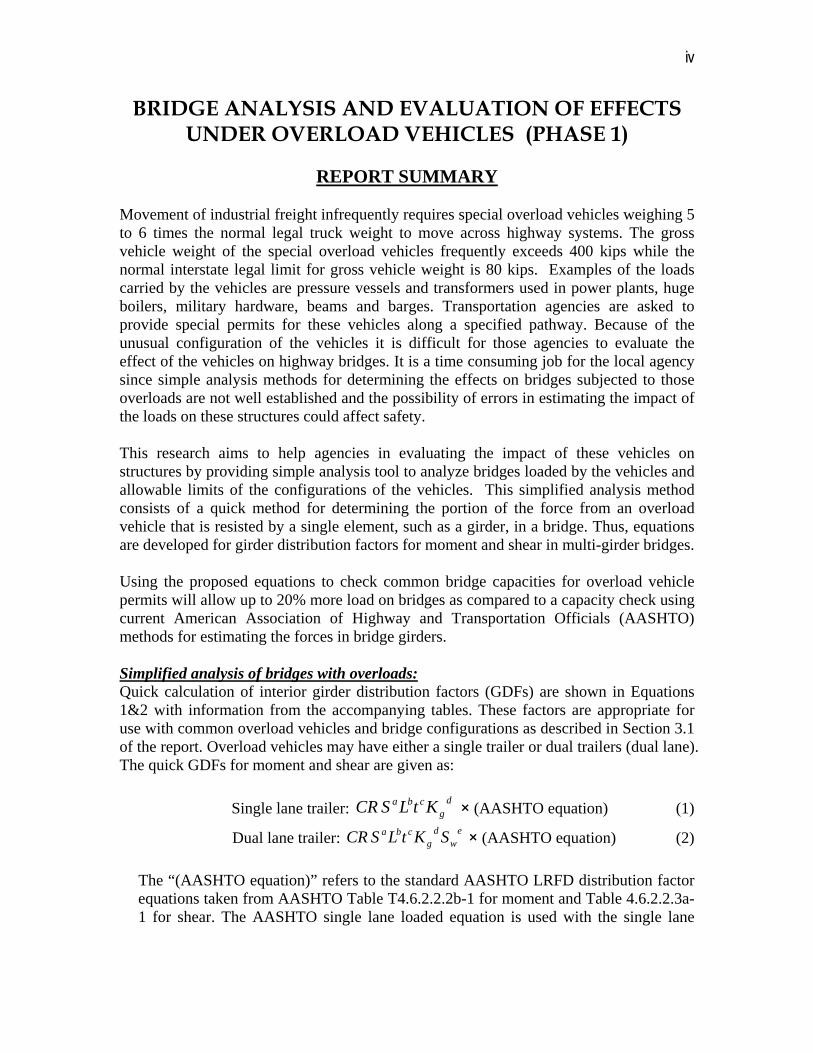
Exponents for new GDF equations for overload vehicles
Exponent: C a b c d e Single lane
loading Moment 1.61 -0.21 0.02 0.02 -0.03 -
Shear 0.72 0.14 -0.09 -0.08 0.03 - Dual lane loading
Moment 1.70 -0.22 0.04 0.19 -0.08 -0.14 Shear 2.03 0.06 -0.25 -0.12 0.03 -0.28
R factor for new GDF equation for overload vehicles
R Negative moment GDF
(for single lane and dual lane loading) 1.3
Bridges with Skew
( = skew angle)*
Moment GDF for single lane loading 2tan05.01
Shear GDF for single lane loading tan23.01
Moment GDF for dual lane loading tan55.0tan19.01 2
Shear GDF for dual lane loading tan76.0tan25.01 2 All other cases 1.0
* Valid for 60~0
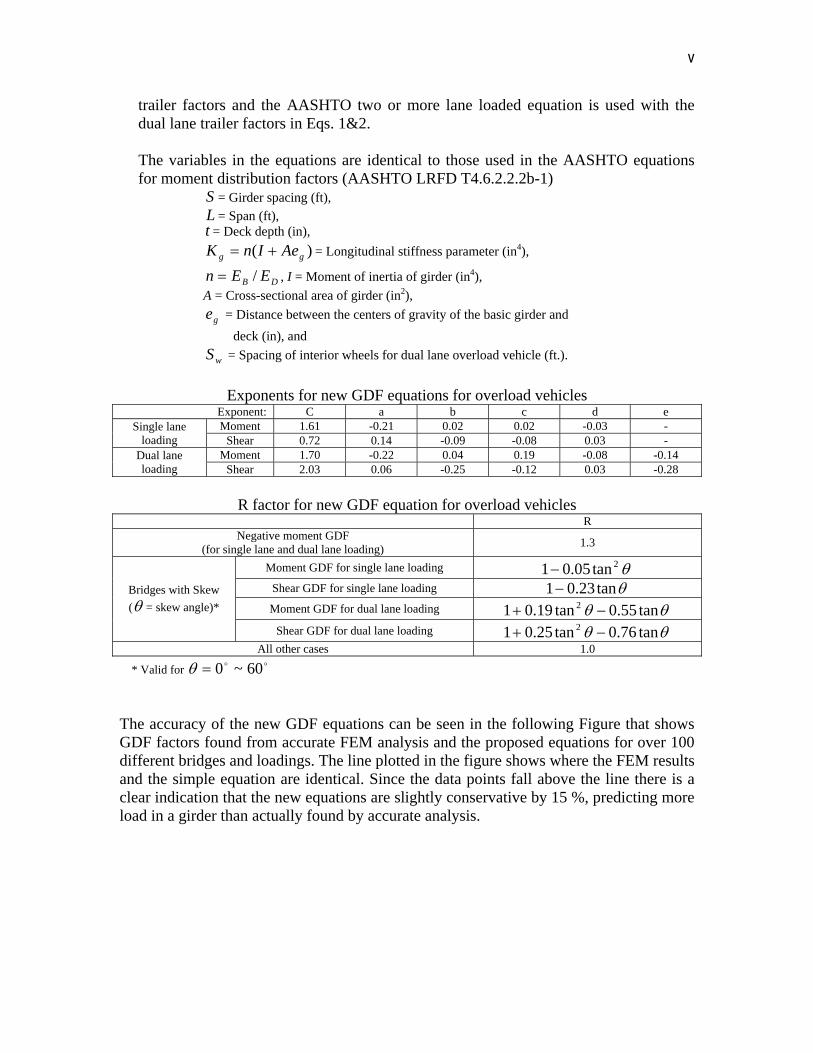
The accuracy of the new GDF equations can be seen in the following Figure that shows GDF factors found from accurate FEM analysis and the proposed equations for over 100 different bridges and loadings. The line plotted in the figure shows where the FEM results and the simple equation are identical. Since the data points fall above the line there is a clear indication that the new equations are slightly conservative by 15 %, predicting more load in a girder than actually found by accurate analysis.
vi
Comparison of GDFs from the new equations and an accurate FEM analysis.
The impact of using the proposed GDF equation, versus using typical AASHTO defined GDFs, is illustrated in the following results from an 80 ft span multi-girder bridge with girders spaced at 8 ft apart and a single lane overload vehicle. The moment distribution factors (GDFs) are shown on the y-axis for different deck thicknesses on the x-axis. The girder moment estimates using the new GDFs may be 20 % less than would be obtained from the normal AASHTO estimates, allowing larger freight loads to be safely transported across the bridge.
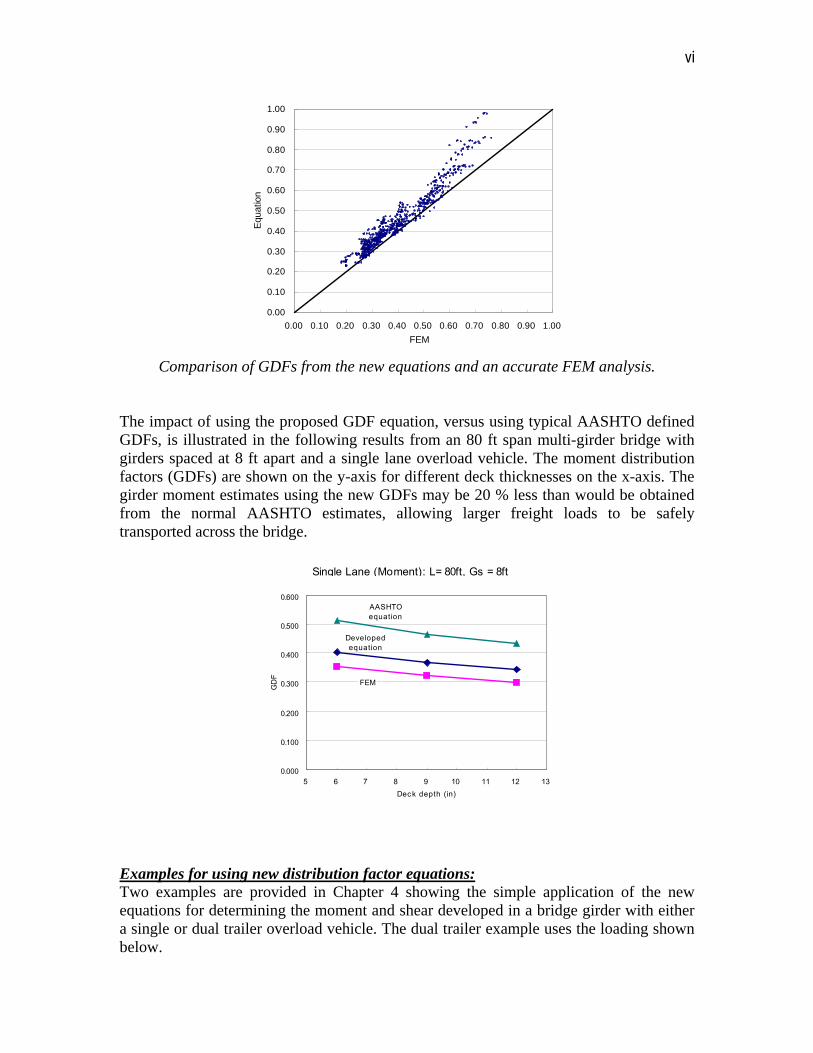
Examples for using new distribution factor equations: Two examples are provided in Chapter 4 showing the simple application of the new equations for determining the moment and shear developed in a bridge girder with either a single or dual trailer overload vehicle. The dual trailer example uses the loading shown below.
0.00
0.10
0.20
0.30
0.40
0.50
0.60
0.70
0.80
0.90
1.00
0.00 0.10 0.20 0.30 0.40 0.50 0.60 0.70 0.80 0.90 1.00
FEM
Equ
atio
n
Single Lane (Moment): L= 80ft, Gs = 8ft
Developedequation
FEM
AASHTOequation
0.000
0.100
0.200
0.300
0.400
0.500
0.600
5 6 7 8 9 10 11 12 13Deck depth (in)
GD
F
vii
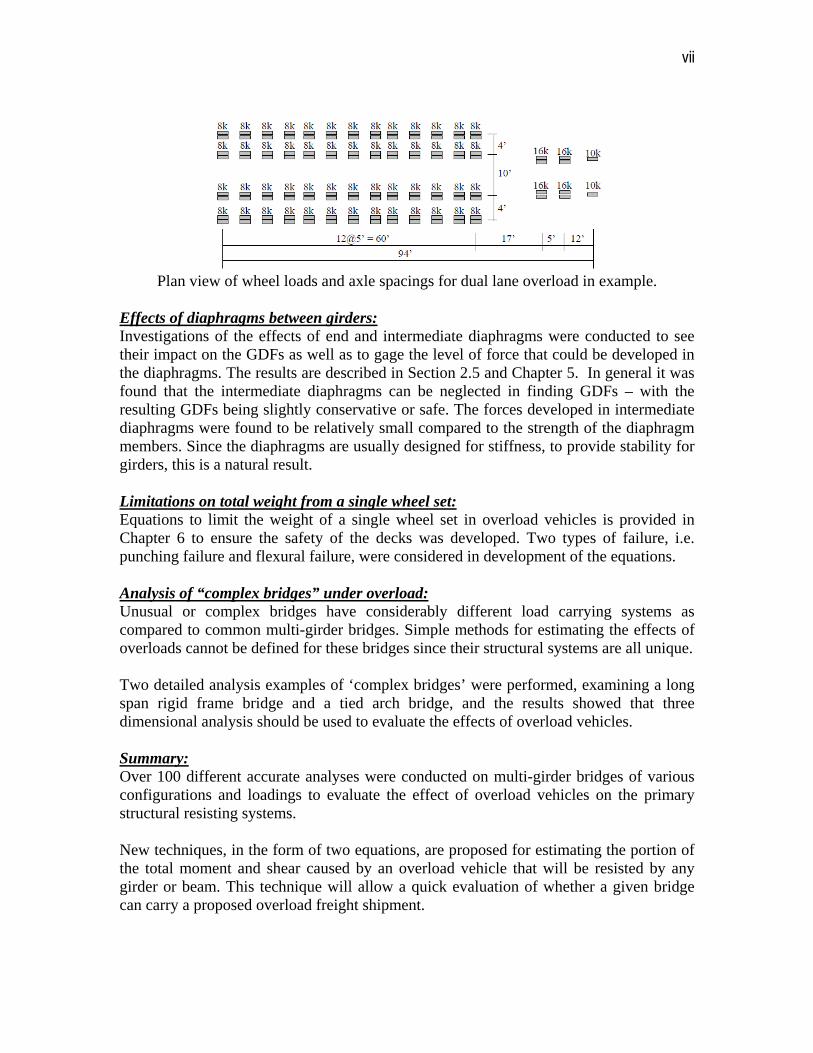
Plan view of wheel loads and axle spacings for dual lane overload in example. Effects of diaphragms between girders: Investigations of the effects of end and intermediate diaphragms were conducted to see their impact on the GDFs as well as to gage the level of force that could be developed in the diaphragms. The results are described in Section 2.5 and Chapter 5. In general it was found that the intermediate diaphragms can be neglected in finding GDFs – with the resulting GDFs being slightly conservative or safe. The forces developed in intermediate diaphragms were found to be relatively small compared to the strength of the diaphragm members. Since the diaphragms are usually designed for stiffness, to provide stability for girders, this is a natural result. Limitations on total weight from a single wheel set: Equations to limit the weight of a single wheel set in overload vehicles is provided in Chapter 6 to ensure the safety of the decks was developed. Two types of failure, i.e. punching failure and flexural failure, were considered in development of the equations. Analysis of “complex bridges” under overload: Unusual or complex bridges have considerably different load carrying systems as compared to common multi-girder bridges. Simple methods for estimating the effects of overloads cannot be defined for these bridges since their structural systems are all unique. Two detailed analysis examples of ‘complex bridges’ were performed, examining a long span rigid frame bridge and a tied arch bridge, and the results showed that three dimensional analysis should be used to evaluate the effects of overload vehicles. Summary: Over 100 different accurate analyses were conducted on multi-girder bridges of various configurations and loadings to evaluate the effect of overload vehicles on the primary structural resisting systems. New techniques, in the form of two equations, are proposed for estimating the portion of the total moment and shear caused by an overload vehicle that will be resisted by any girder or beam. This technique will allow a quick evaluation of whether a given bridge can carry a proposed overload freight shipment.

viii
Examples are provided to show how the new evaluation methods can easily be used to estimate the forces in bridge girders. The impact of overload vehicles on diaphragms between girders and on floor deck systems is also described. Finally, analyses are described for two unusual or “complex” bridges, where the forces in members cannot be easily obtained from generalized simple equations.
ix
CONTENTS
EXECUTIVE SUMMARY iv 1. INTRODUCTION 1
1.1 Background 1 1.2 Research objectives 2 1.3 Research tasks 2
2. MULTI-GIRDER BRIDGE ANALYSIS 3
2.1 Categorization of bridge types 3 2.2 Selection of prototype bridges for analysis and development of simplified
analysis method 3 2.3 Selection of a representative set of overload configurations 8 2.4 Development of 3D finite element analysis technique and validation 9 2.5 Analysis of multi-girder prototype bridges 12
3. DEVELOPMENT OF A SIMPLIFIED ANALYSIS METHOD 27
3.1 Limitations for using the developed GDF equations 27 3.2 Developed GDF equations for overload 27
4. ANALYSIS PROCEDURE AND EXAMPLES USING THE PROPOSED
GDF EQUATION FOR MULTI-GIRDER BRIDGES 41 4.1 Analysis procedure 41 4.2 Example for a single lane overload vehicle 42 4.3 Example for a dual lane overload vehicle 47
5. INVESTIGATION OF INTERMEDIATE DIAPHRAGMS 51 6. INVESTIGATION OF DECKS 57 7. COMPLEX BRIDGE ANALYSIS 59
7.1 Mirror Lake Bridge 60 7.2 Bong Bridge 68
8. SUMMARY 77 9. REFERENCES 79 APPENDIX Results for Multi-girder FEM Analysis 81
1
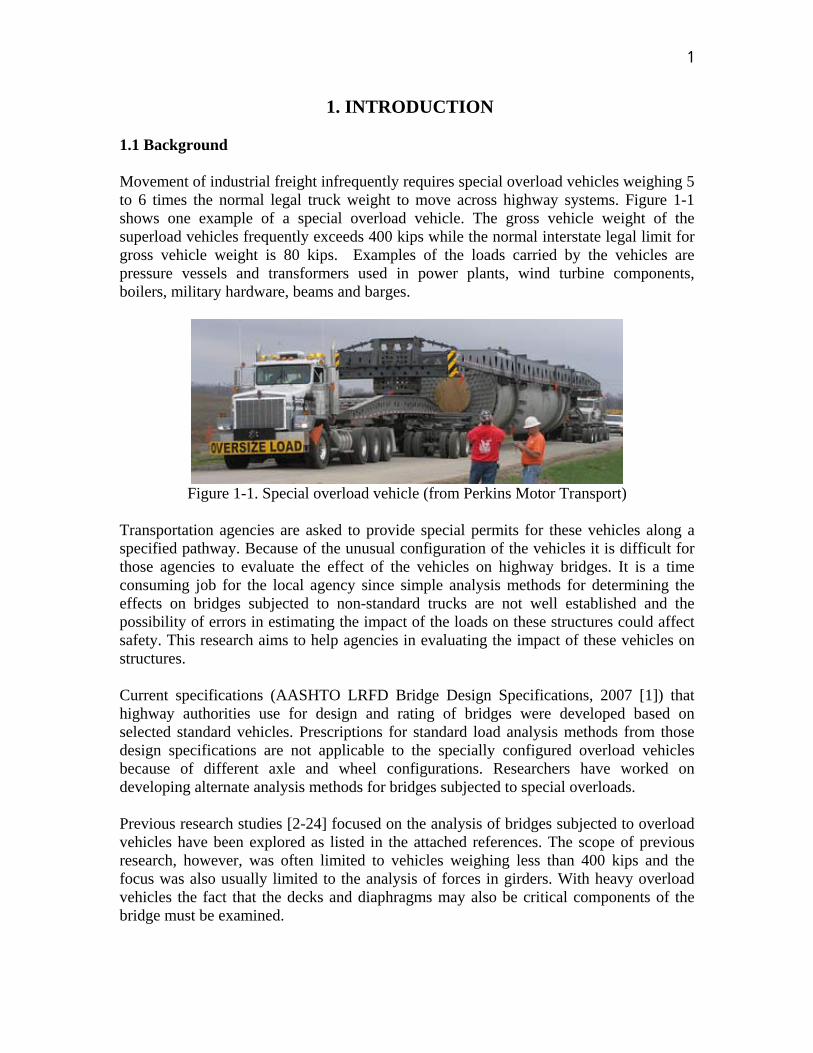
1. INTRODUCTION 1.1 Background Movement of industrial freight infrequently requires special overload vehicles weighing 5 to 6 times the normal legal truck weight to move across highway systems. Figure 1-1 shows one example of a special overload vehicle. The gross vehicle weight of the superload vehicles frequently exceeds 400 kips while the normal interstate legal limit for gross vehicle weight is 80 kips. Examples of the loads carried by the vehicles are pressure vessels and transformers used in power plants, wind turbine components, boilers, military hardware, beams and barges.
Figure 1-1. Special overload vehicle (from Perkins Motor Transport)
Transportation agencies are asked to provide special permits for these vehicles along a specified pathway. Because of the unusual configuration of the vehicles it is difficult for those agencies to evaluate the effect of the vehicles on highway bridges. It is a time consuming job for the local agency since simple analysis methods for determining the effects on bridges subjected to non-standard trucks are not well established and the possibility of errors in estimating the impact of the loads on these structures could affect safety. This research aims to help agencies in evaluating the impact of these vehicles on structures. Current specifications (AASHTO LRFD Bridge Design Specifications, 2007 [1]) that highway authorities use for design and rating of bridges were developed based on selected standard vehicles. Prescriptions for standard load analysis methods from those design specifications are not applicable to the specially configured overload vehicles because of different axle and wheel configurations. Researchers have worked on developing alternate analysis methods for bridges subjected to special overloads. Previous research studies [2-24] focused on the analysis of bridges subjected to overload vehicles have been explored as listed in the attached references. The scope of previous research, however, was often limited to vehicles weighing less than 400 kips and the focus was also usually limited to the analysis of forces in girders. With heavy overload vehicles the fact that the decks and diaphragms may also be critical components of the bridge must be examined.
2
1.2. Research objectives
The research objective of this Phase-1 study focuses on development of a simplified analysis method to predict the effects of overload vehicles on parts of a bridge system – including deck, girders, diaphragms, and other major components. 1.3. Research tasks
1) Reference study: closely examine previous work on medium and large overload
situations, special 3-D analysis techniques, and existing overload vehicle geometries and weights.
2) Categorize bridge types for focus of the study and select prototype bridges for detailed modeling and analysis.
3) Select a representative set of overload configurations to use in developing a simplified analysis method.
4) Develop 3D finite element analysis techniques to analyze bridges under overload vehicles and then validate the developed analysis technique using existing experimental result.
5) Conduct detailed analyses of multi-girder prototype bridges as a basis for developing a simplified analysis method.
6) Develop simplified analysis methods for predicting overload vehicle effects on bridge girders.
7) Provide examples of applying the developed simplified methods for predicting overload vehicle effects on bridge girders.
8) Investigate effects of overload vehicles on intermediate diaphragms between girders.
9) Develop prescriptions for the configurations of the special overload vehicles to ensure the safety of decks.
10) Conduct detailed analyses of a set of “complex” bridges including tied arch and rigid frame bridges.
3
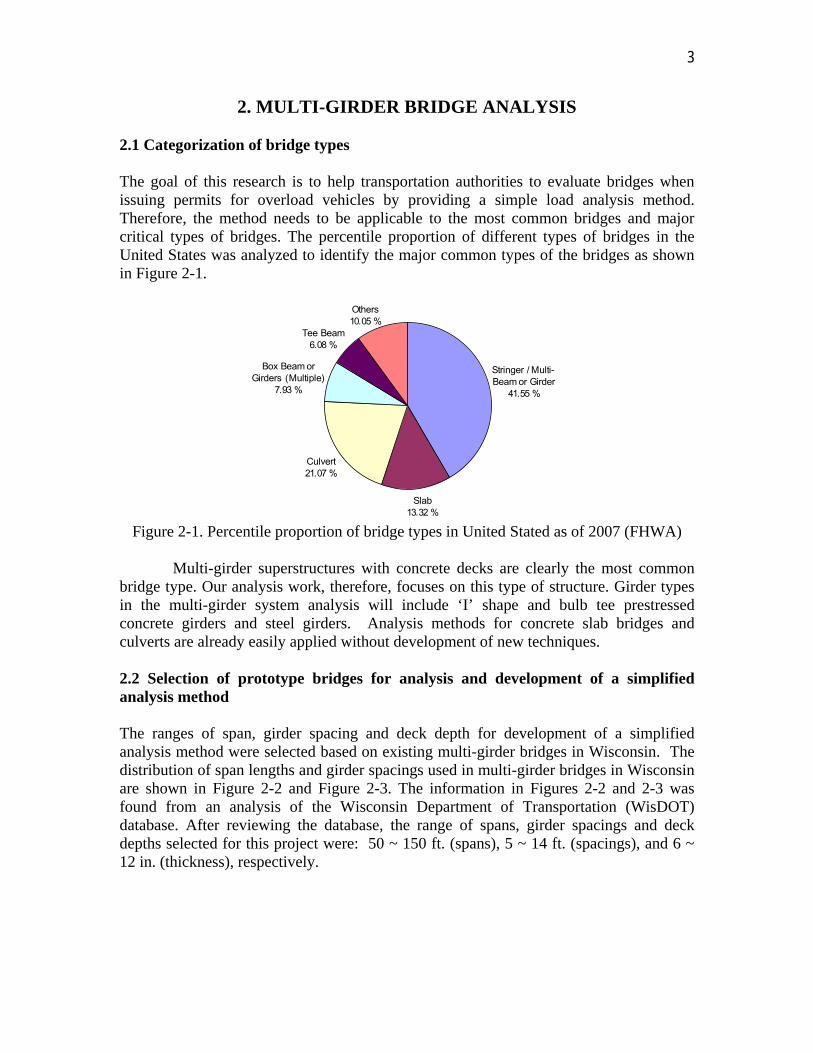
2. MULTI-GIRDER BRIDGE ANALYSIS 2.1 Categorization of bridge types The goal of this research is to help transportation authorities to evaluate bridges when issuing permits for overload vehicles by providing a simple load analysis method. Therefore, the method needs to be applicable to the most common bridges and major critical types of bridges. The percentile proportion of different types of bridges in the United States was analyzed to identify the major common types of the bridges as shown in Figure 2-1.
Stringer / Multi-Beam or Girder
41.55 %
Slab13.32 %
Culvert21.07 %
Box Beam orGirders (Multiple)
7.93 %
Tee Beam6.08 %
Others10.05 %
Figure 2-1. Percentile proportion of bridge types in United Stated as of 2007 (FHWA)
Multi-girder superstructures with concrete decks are clearly the most common
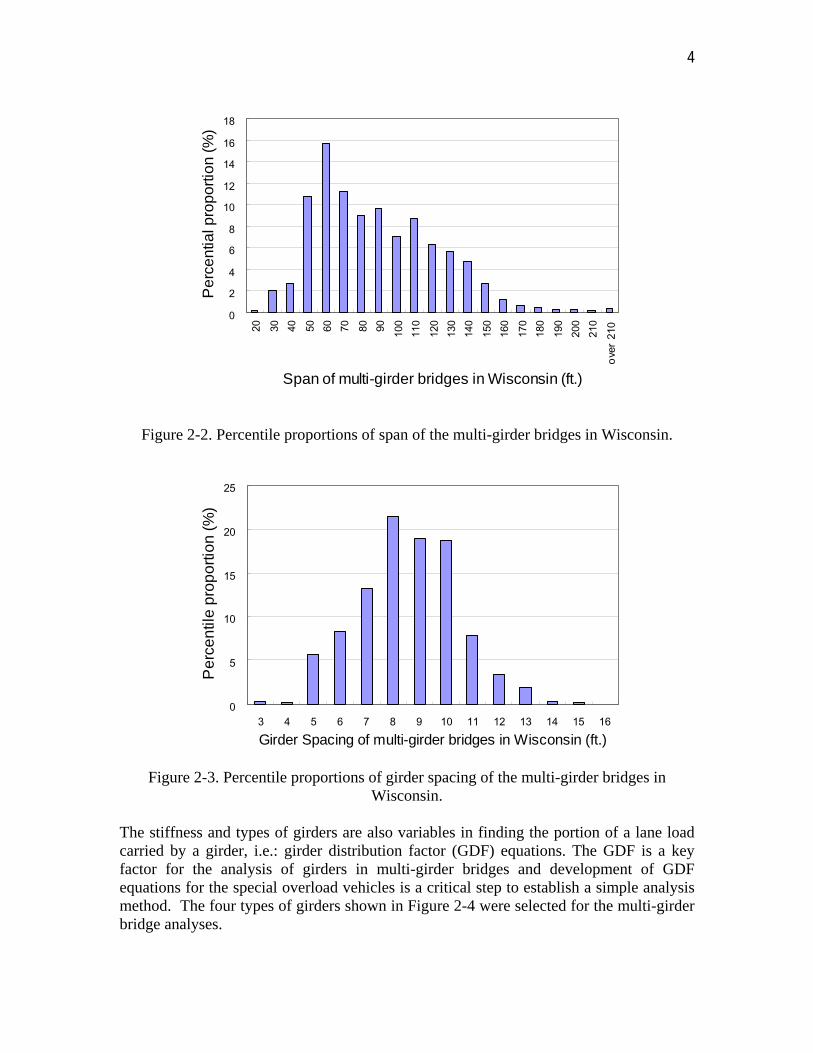
bridge type. Our analysis work, therefore, focuses on this type of structure. Girder types in the multi-girder system analysis will include ‘I’ shape and bulb tee prestressed concrete girders and steel girders. Analysis methods for concrete slab bridges and culverts are already easily applied without development of new techniques. 2.2 Selection of prototype bridges for analysis and development of a simplified analysis method The ranges of span, girder spacing and deck depth for development of a simplified analysis method were selected based on existing multi-girder bridges in Wisconsin. The distribution of span lengths and girder spacings used in multi-girder bridges in Wisconsin are shown in Figure 2-2 and Figure 2-3. The information in Figures 2-2 and 2-3 was found from an analysis of the Wisconsin Department of Transportation (WisDOT) database. After reviewing the database, the range of spans, girder spacings and deck depths selected for this project were: 50 ~ 150 ft. (spans), 5 ~ 14 ft. (spacings), and 6 ~ 12 in. (thickness), respectively.
4
0
2
4
6
8
10
12
14
16
18
20 30 40 50 60 70 80 90 100
110
120
130
140
150
160
170
180
190
200
210
over
210
Span of multi-girder bridges in Wisconsin (ft.)
Pe
rce
ntia
l pro
po
rtio
n (
%)
Figure 2-2. Percentile proportions of span of the multi-girder bridges in Wisconsin.
0
5
10
15
20
25
3 4 5 6 7 8 9 10 11 12 13 14 15 16
Girder Spacing of multi-girder bridges in Wisconsin (ft.)
Pe
rce
ntil
e p
rop
ort
ion
(%
)
Figure 2-3. Percentile proportions of girder spacing of the multi-girder bridges in
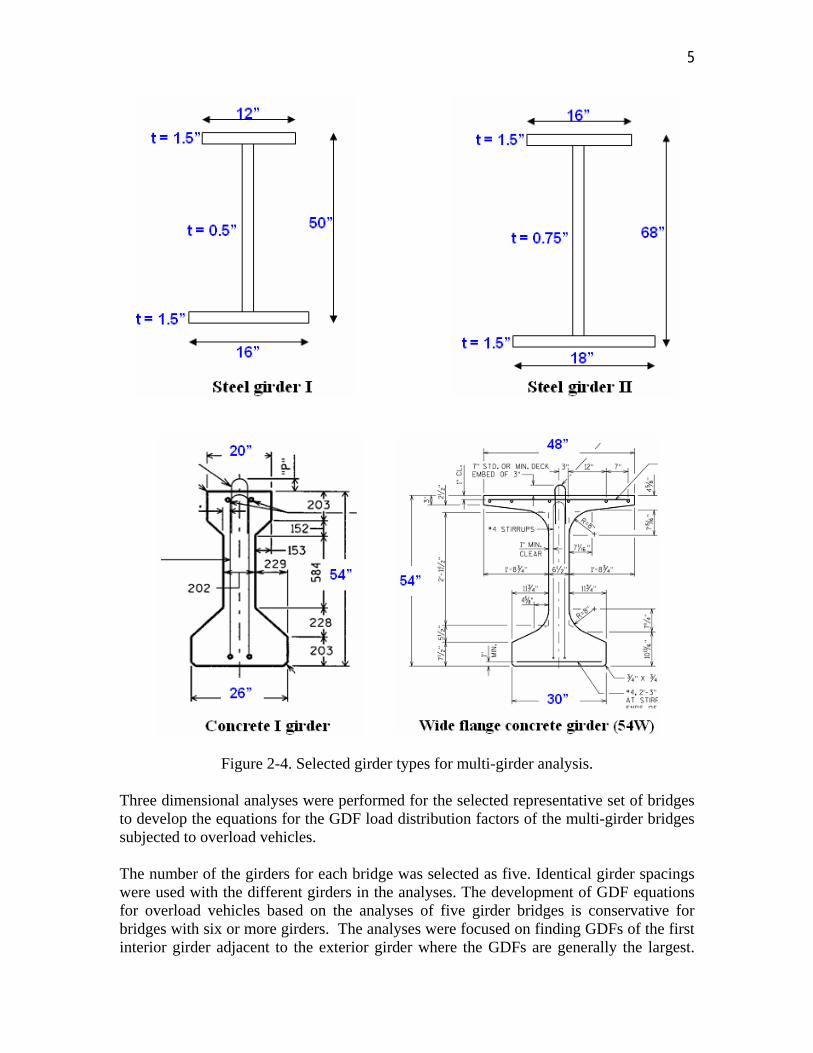
Wisconsin. The stiffness and types of girders are also variables in finding the portion of a lane load carried by a girder, i.e.: girder distribution factor (GDF) equations. The GDF is a key factor for the analysis of girders in multi-girder bridges and development of GDF equations for the special overload vehicles is a critical step to establish a simple analysis method. The four types of girders shown in Figure 2-4 were selected for the multi-girder bridge analyses.
5
Figure 2-4. Selected girder types for multi-girder analysis. Three dimensional analyses were performed for the selected representative set of bridges to develop the equations for the GDF load distribution factors of the multi-girder bridges subjected to overload vehicles. The number of the girders for each bridge was selected as five. Identical girder spacings were used with the different girders in the analyses. The development of GDF equations for overload vehicles based on the analyses of five girder bridges is conservative for bridges with six or more girders. The analyses were focused on finding GDFs of the first interior girder adjacent to the exterior girder where the GDFs are generally the largest.

6
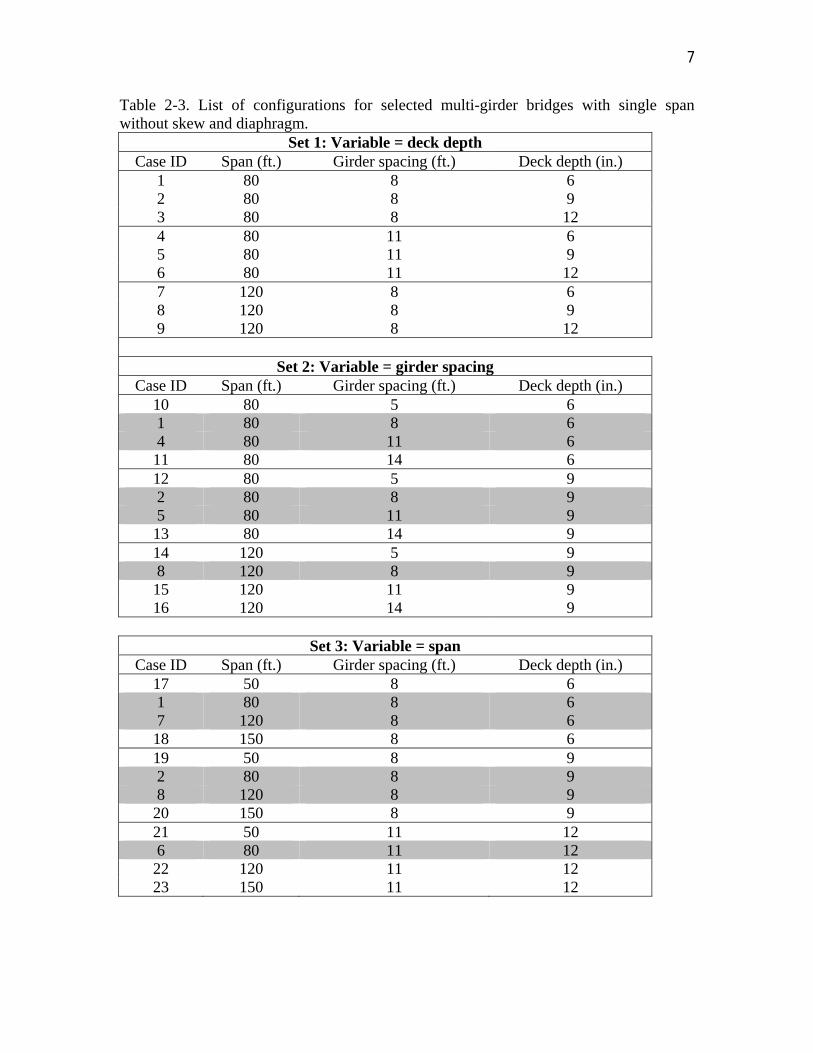
Adding more interior girders would have little effect. The exterior girder GDFs were excluded in the development of the GDF equations since they can be calculated using a simple lever rule and they are highly dependent on the length of the roadway overhang. The selected sets of bridge configurations for a specific girder type are listed in Table 2-1. 118 bridges were analyzed using the combinations listed. Detailed configurations of the selected bridges are shown in Tables 2-2 and 2-3. Table 2-1. Selected configuration sets for bridges in the finite element analyses
Span (ft.) 50, 80, 120 and 150 Girder spacing (ft.) 5, 8, 11 and 14
Deck depth (in.) 6, 9 and 12 Girder type 4 types
Skew (degree) 0, 20, 40, 50 and 60 # of Span 1 and 2
End diaphragm with end diaphragm and without end diaphragm Total number of bridges 118 bridges
Table 2-2: List of selected multi-girder bridges for analysis 1. Single span bridges without skew and without diaphragm
23 cases (listed in Table 2-3) 4 cases of girder types (in Figure 2-4)
23 x 4 = 92 Bridges 2. Single span concrete I girder bridges with skew
1) Case 8 in Table 2-3 4 cases of skew angles (20, 40, 50, 60 degree) 2 Cases for end diaphragm (with and without end diaphragm)
4 x 2 = 8 Bridges 2) Case 14 in Table 2-3 2 Cases of Skew angles (40, 60 degrees) 1 Cases of end diaphragm (without end diaphragm)
2 x 1 = 2 Bridges 3. 2 span concrete I girder bridges without skew
4 Cases (Case 19, 2, 8, 20 in Table 2-3) 2 Cases for end diaphragm (with and without end diaphragm)
4 x 2 = 8 Bridges 4. Single span concrete I girder bridges with end diaphragm
8 Cases (Case 19, 2, 8, 20, 21, 6, 22, 23 in Table 2-3) 1 Cases of end diaphragm (with end diaphragm)
8 x 1 = 8 Bridges Total number of bridges: 92 + 8 + 2 + 8 + 8 = 118 Bridges
7
Table 2-3. List of configurations for selected multi-girder bridges with single span without skew and diaphragm.
Set 1: Variable = deck depth Case ID Span (ft.) Girder spacing (ft.) Deck depth (in.)
1 80 8 6 2 80 8 9 3 80 8 12 4 80 11 6 5 80 11 9 6 80 11 12 7 120 8 6 8 120 8 9 9 120 8 12
Set 2: Variable = girder spacing Case ID Span (ft.) Girder spacing (ft.) Deck depth (in.)
10 80 5 6 1 80 8 6 4 80 11 6 11 80 14 6 12 80 5 9 2 80 8 9 5 80 11 9 13 80 14 9 14 120 5 9 8 120 8 9 15 120 11 9 16 120 14 9
Set 3: Variable = span
Case ID Span (ft.) Girder spacing (ft.) Deck depth (in.) 17 50 8 6 1 80 8 6 7 120 8 6 18 150 8 6 19 50 8 9 2 80 8 9 8 120 8 9 20 150 8 9 21 50 11 12 6 80 11 12 22 120 11 12 23 150 11 12
8
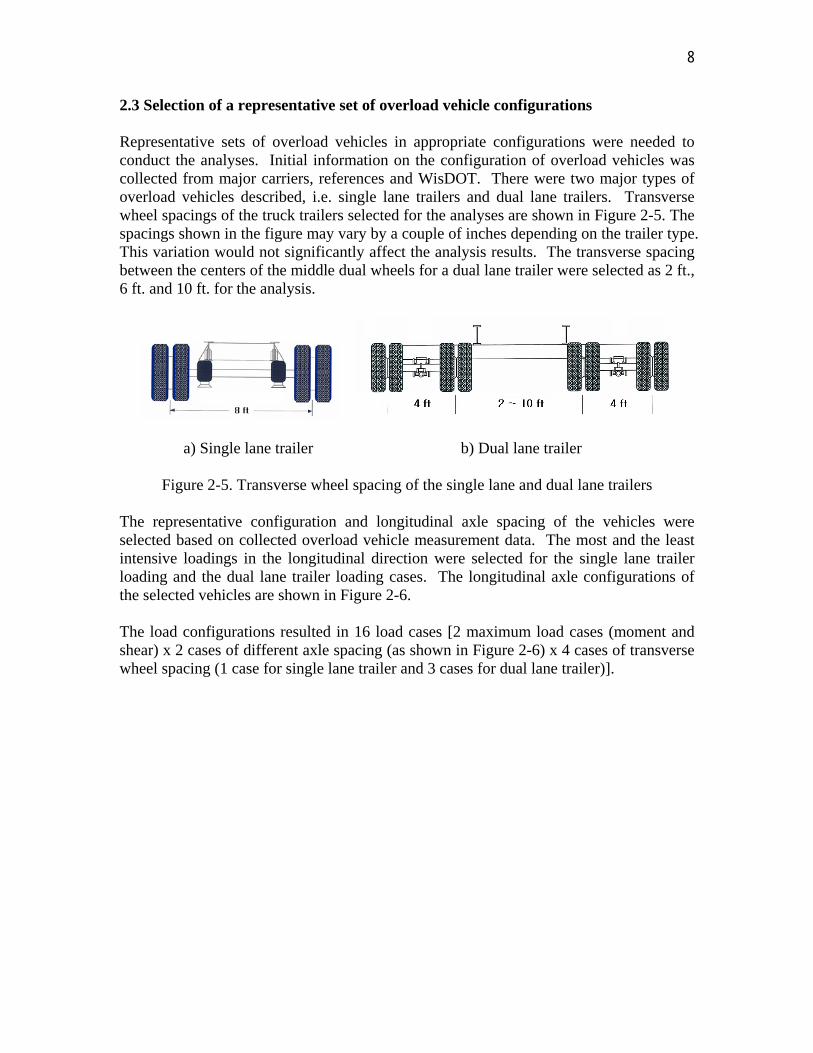
2.3 Selection of a representative set of overload vehicle configurations Representative sets of overload vehicles in appropriate configurations were needed to conduct the analyses. Initial information on the configuration of overload vehicles was collected from major carriers, references and WisDOT. There were two major types of overload vehicles described, i.e. single lane trailers and dual lane trailers. Transverse wheel spacings of the truck trailers selected for the analyses are shown in Figure 2-5. The spacings shown in the figure may vary by a couple of inches depending on the trailer type. This variation would not significantly affect the analysis results. The transverse spacing between the centers of the middle dual wheels for a dual lane trailer were selected as 2 ft., 6 ft. and 10 ft. for the analysis.
a) Single lane trailer b) Dual lane trailer
Figure 2-5. Transverse wheel spacing of the single lane and dual lane trailers
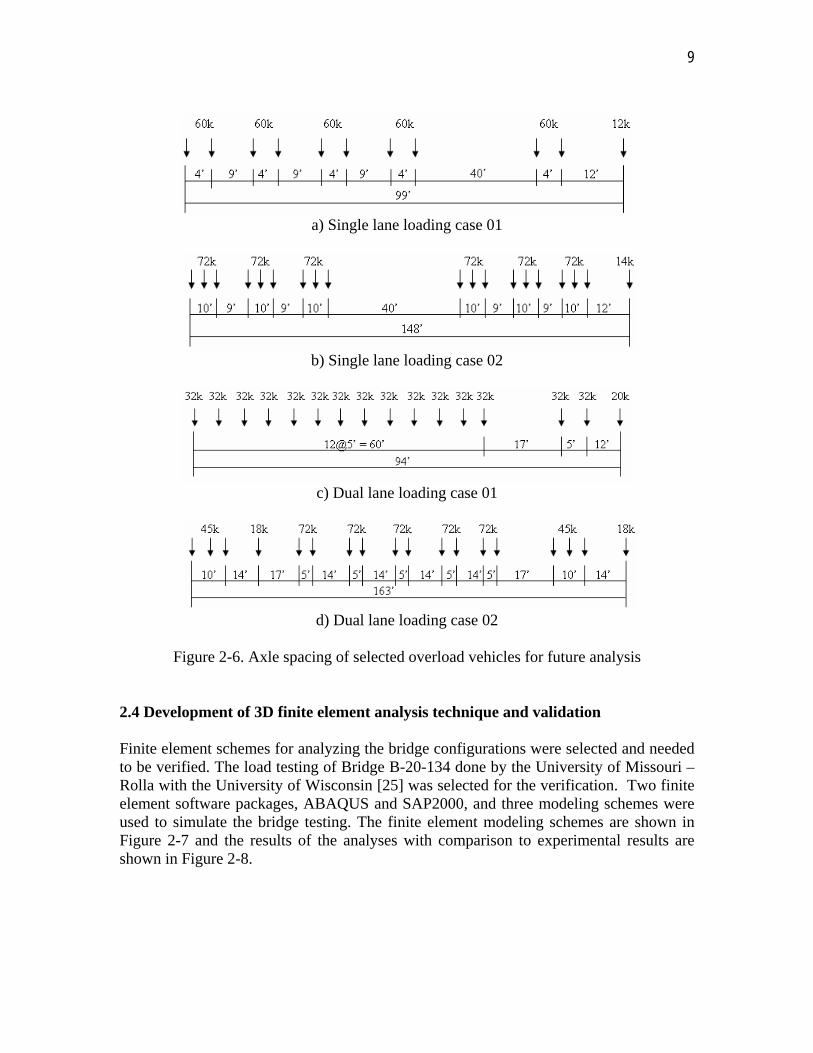
The representative configuration and longitudinal axle spacing of the vehicles were selected based on collected overload vehicle measurement data. The most and the least intensive loadings in the longitudinal direction were selected for the single lane trailer loading and the dual lane trailer loading cases. The longitudinal axle configurations of the selected vehicles are shown in Figure 2-6. The load configurations resulted in 16 load cases [2 maximum load cases (moment and shear) x 2 cases of different axle spacing (as shown in Figure 2-6) x 4 cases of transverse wheel spacing (1 case for single lane trailer and 3 cases for dual lane trailer)].
9
a) Single lane loading case 01
b) Single lane loading case 02
c) Dual lane loading case 01
d) Dual lane loading case 02
Figure 2-6. Axle spacing of selected overload vehicles for future analysis
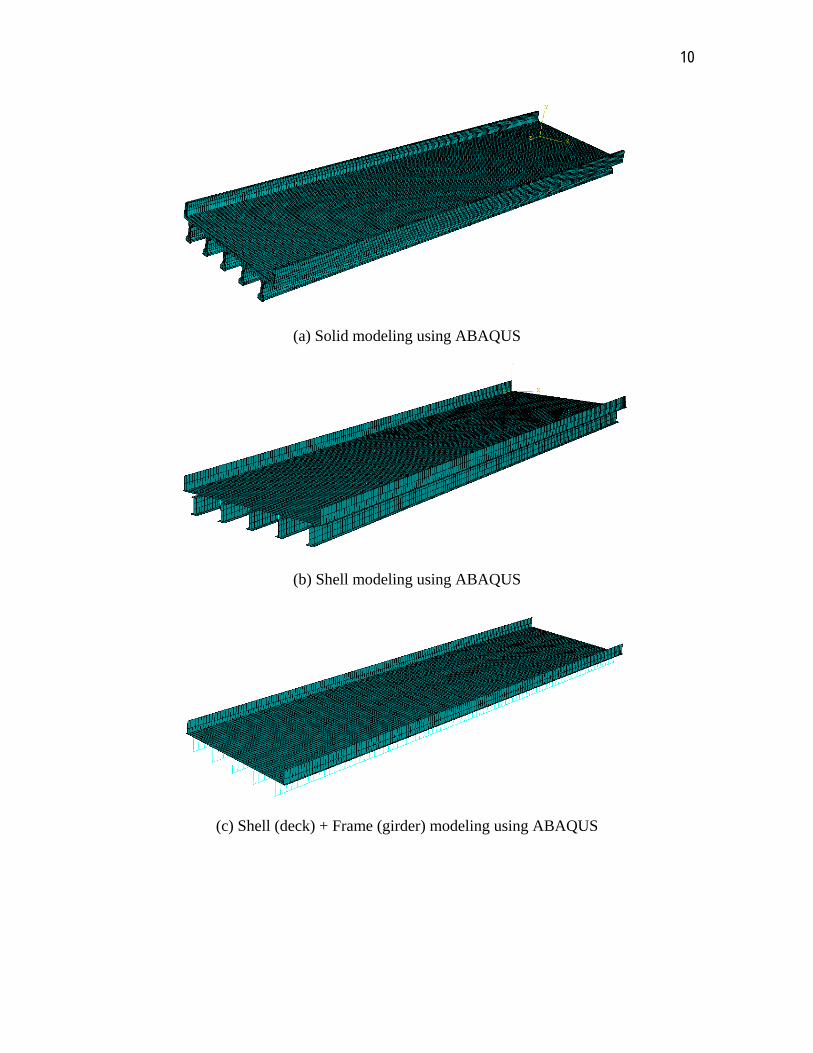
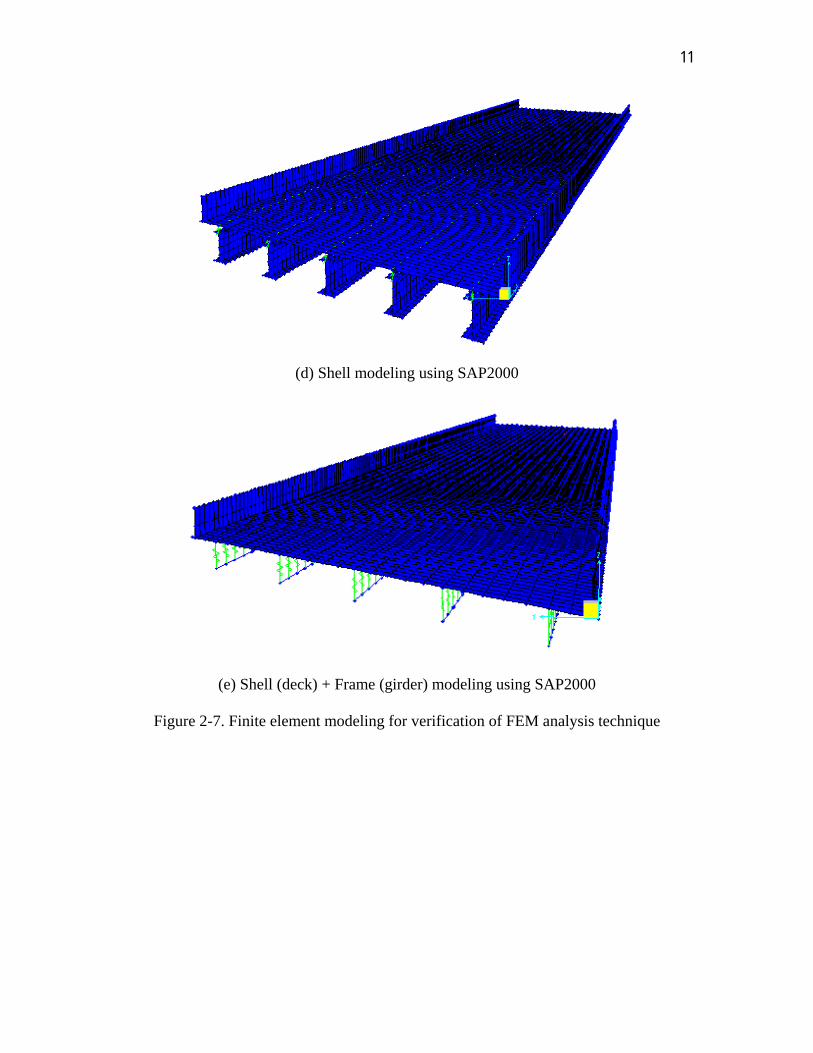
2.4 Development of 3D finite element analysis technique and validation Finite element schemes for analyzing the bridge configurations were selected and needed to be verified. The load testing of Bridge B-20-134 done by the University of Missouri – Rolla with the University of Wisconsin [25] was selected for the verification. Two finite element software packages, ABAQUS and SAP2000, and three modeling schemes were used to simulate the bridge testing. The finite element modeling schemes are shown in Figure 2-7 and the results of the analyses with comparison to experimental results are shown in Figure 2-8.
10
(a) Solid modeling using ABAQUS
(b) Shell modeling using ABAQUS
(c) Shell (deck) + Frame (girder) modeling using ABAQUS
11
(d) Shell modeling using SAP2000
(e) Shell (deck) + Frame (girder) modeling using SAP2000
Figure 2-7. Finite element modeling for verification of FEM analysis technique
12
- 0.40
- 0.35
- 0.30
- 0.25
- 0.20
- 0.15
- 0.10
- 0.05
0.00G1 G2 G3 G4 G5
Girder #
Def
lect
ion
(in)
Experiment ABAQUS (Shell- Shell) ABAQUS (Sol- Sol)SAP (Shell- Frame) SAP (Shell- Shell)
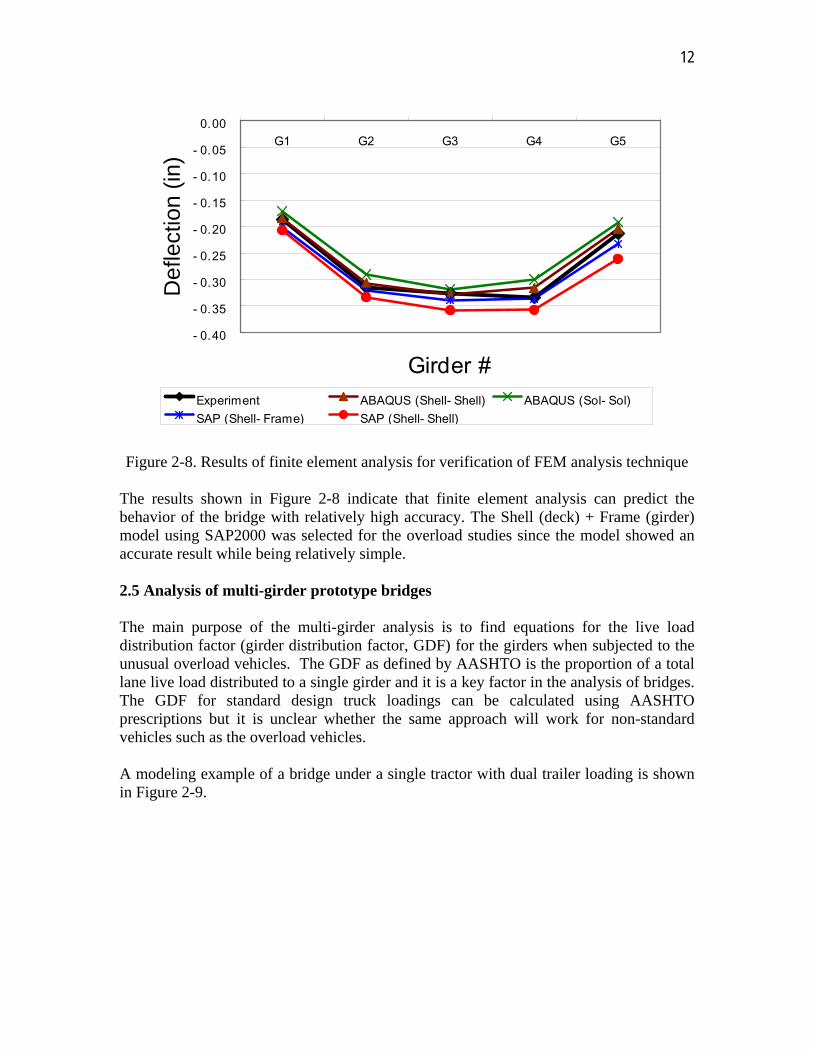
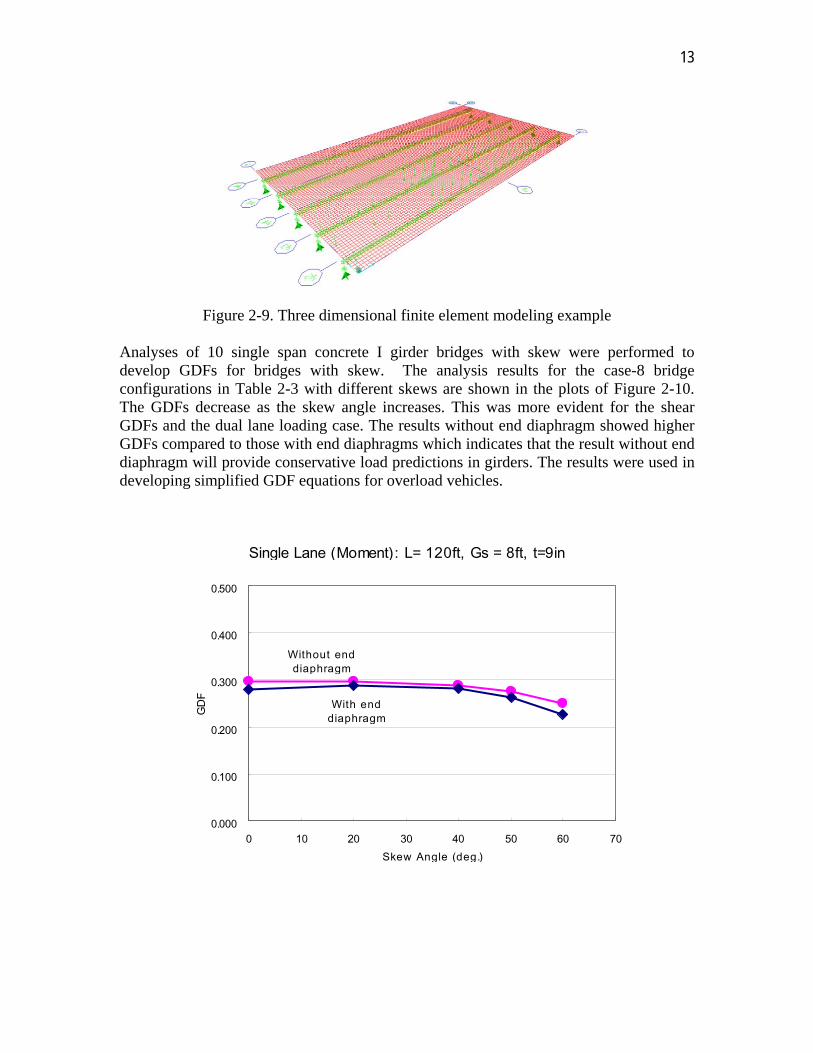
Figure 2-8. Results of finite element analysis for verification of FEM analysis technique The results shown in Figure 2-8 indicate that finite element analysis can predict the behavior of the bridge with relatively high accuracy. The Shell (deck) + Frame (girder) model using SAP2000 was selected for the overload studies since the model showed an accurate result while being relatively simple. 2.5 Analysis of multi-girder prototype bridges The main purpose of the multi-girder analysis is to find equations for the live load distribution factor (girder distribution factor, GDF) for the girders when subjected to the unusual overload vehicles. The GDF as defined by AASHTO is the proportion of a total lane live load distributed to a single girder and it is a key factor in the analysis of bridges. The GDF for standard design truck loadings can be calculated using AASHTO prescriptions but it is unclear whether the same approach will work for non-standard vehicles such as the overload vehicles. A modeling example of a bridge under a single tractor with dual trailer loading is shown in Figure 2-9.
13
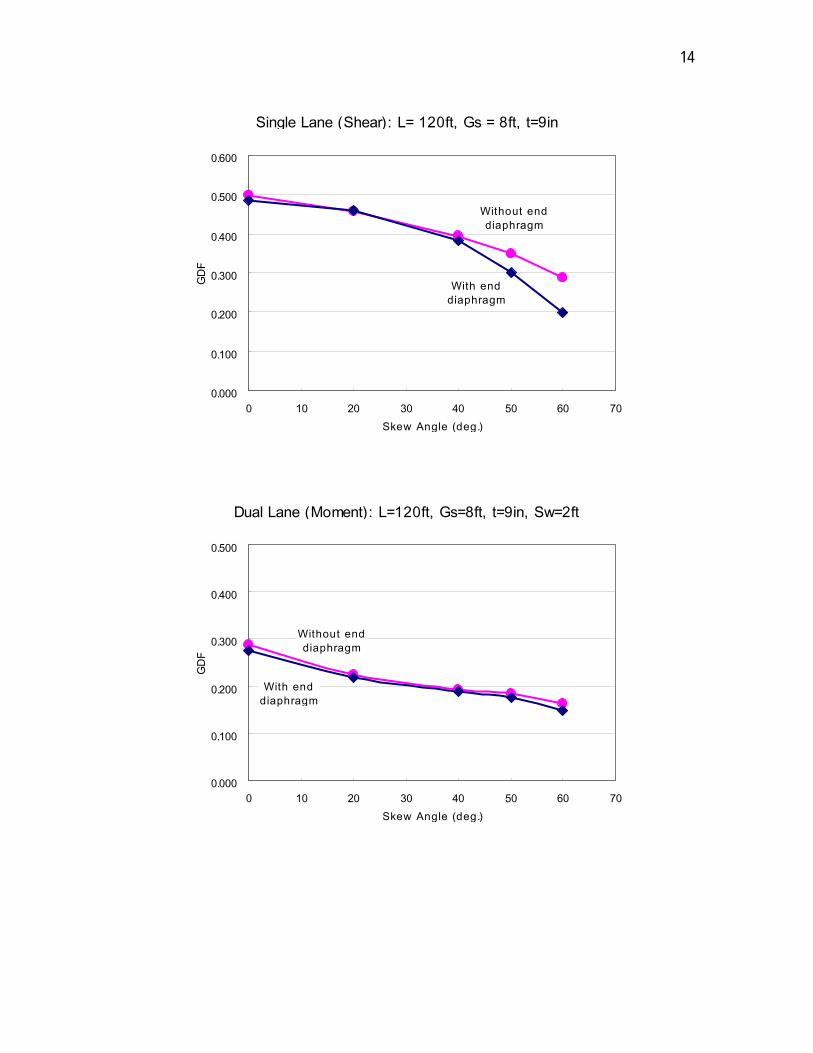
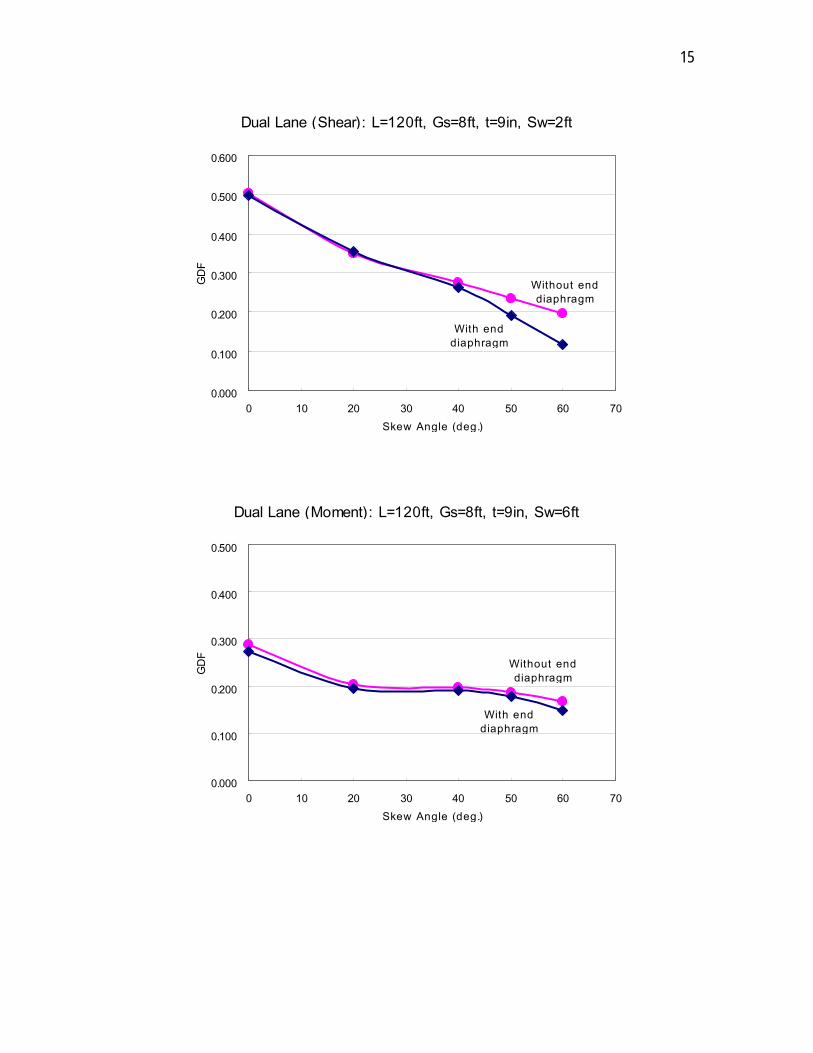
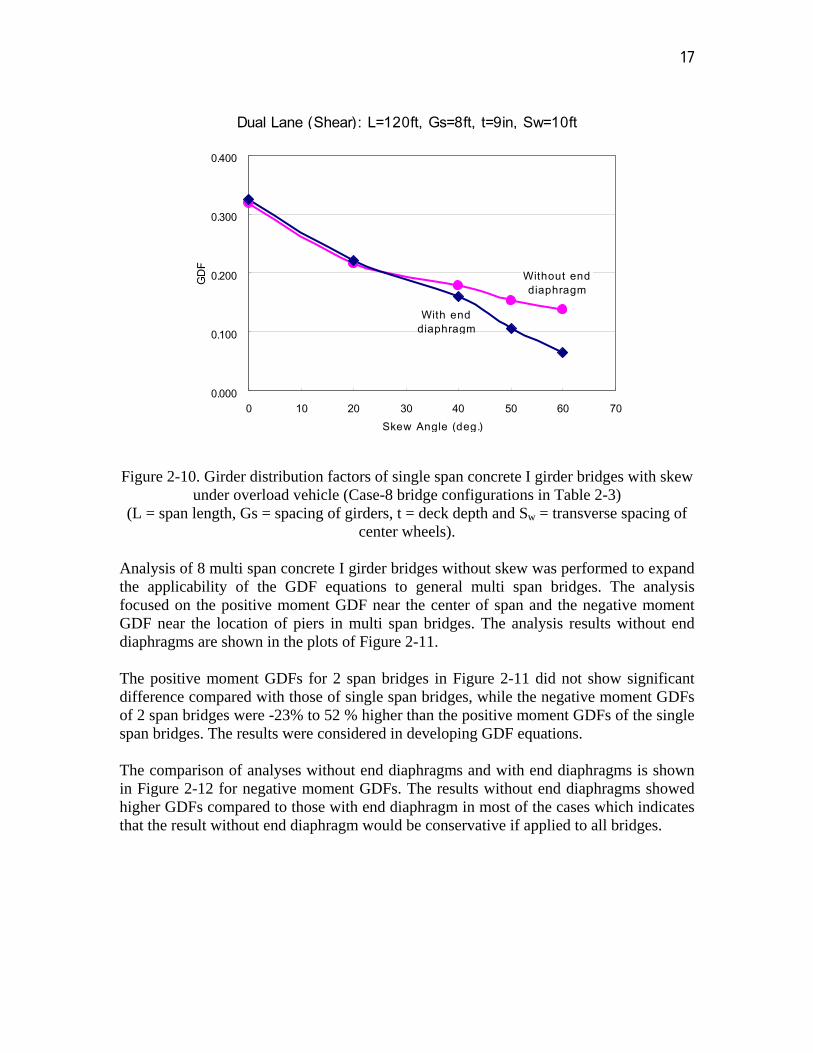
Figure 2-9. Three dimensional finite element modeling example Analyses of 10 single span concrete I girder bridges with skew were performed to develop GDFs for bridges with skew. The analysis results for the case-8 bridge configurations in Table 2-3 with different skews are shown in the plots of Figure 2-10. The GDFs decrease as the skew angle increases. This was more evident for the shear GDFs and the dual lane loading case. The results without end diaphragm showed higher GDFs compared to those with end diaphragms which indicates that the result without end diaphragm will provide conservative load predictions in girders. The results were used in developing simplified GDF equations for overload vehicles.
Single Lane (Moment): L= 120ft, Gs = 8ft, t=9in
Without enddiaphragm
With enddiaphragm
0.000
0.100
0.200
0.300
0.400
0.500
0 10 20 30 40 50 60 70Skew Angle (deg.)
GD
F
14
Single Lane (Shear): L= 120ft, Gs = 8ft, t=9in
With enddiaphragm
Without enddiaphragm
0.000
0.100
0.200
0.300
0.400
0.500
0.600
0 10 20 30 40 50 60 70Skew Angle (deg.)
GD
F
Dual Lane (Moment): L=120ft, Gs=8ft, t=9in, Sw=2ft
With enddiaphragm
Without enddiaphragm
0.000
0.100
0.200
0.300
0.400
0.500
0 10 20 30 40 50 60 70Skew Angle (deg.)
GD
F
15
Dual Lane (Shear): L=120ft, Gs=8ft, t=9in, Sw=2ft
Without enddiaphragm
With enddiaphragm
0.000
0.100
0.200
0.300
0.400
0.500
0.600
0 10 20 30 40 50 60 70Skew Angle (deg.)
GD
F
Dual Lane (Moment): L=120ft, Gs=8ft, t=9in, Sw=6ft
Without enddiaphragm
With enddiaphragm
0.000
0.100
0.200
0.300
0.400
0.500
0 10 20 30 40 50 60 70Skew Angle (deg.)
GD
F

16
Dual Lane (Shear): L=120ft, Gs=8ft, t=9in, Sw=6ft
With enddiaphragm
Without enddiaphragm
0.000
0.100
0.200
0.300
0.400
0.500
0 10 20 30 40 50 60 70Skew Angle (deg.)
GD
F
Dual Lane (Moment): L=120ft, Gs=8ft, t=9in, Sw=10ft
With enddiaphragm
Without enddiaphragm
0.000
0.100
0.200
0.300
0.400
0.500
0 10 20 30 40 50 60 70Skew Angle (deg.)
GD
F
17
Dual Lane (Shear): L=120ft, Gs=8ft, t=9in, Sw=10ft
Without enddiaphragm
With enddiaphragm
0.000
0.100
0.200
0.300
0.400
0 10 20 30 40 50 60 70Skew Angle (deg.)
GD
F
Figure 2-10. Girder distribution factors of single span concrete I girder bridges with skew under overload vehicle (Case-8 bridge configurations in Table 2-3)
(L = span length, Gs = spacing of girders, t = deck depth and Sw = transverse spacing of center wheels).
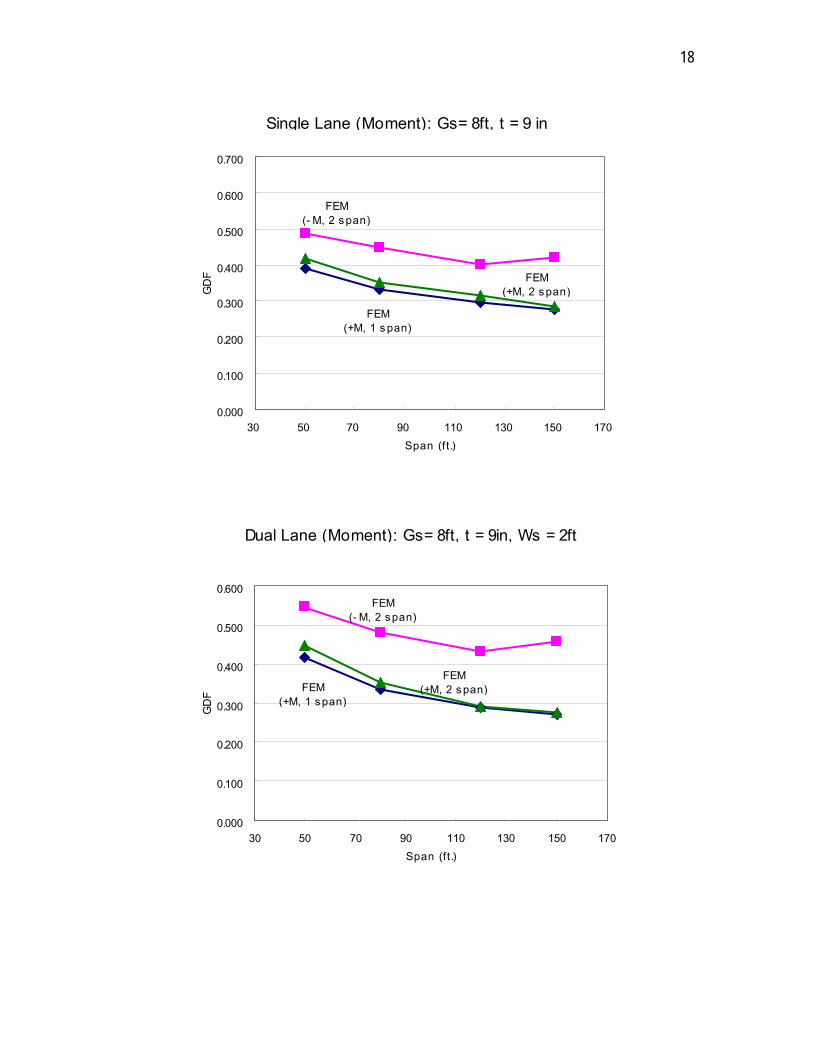
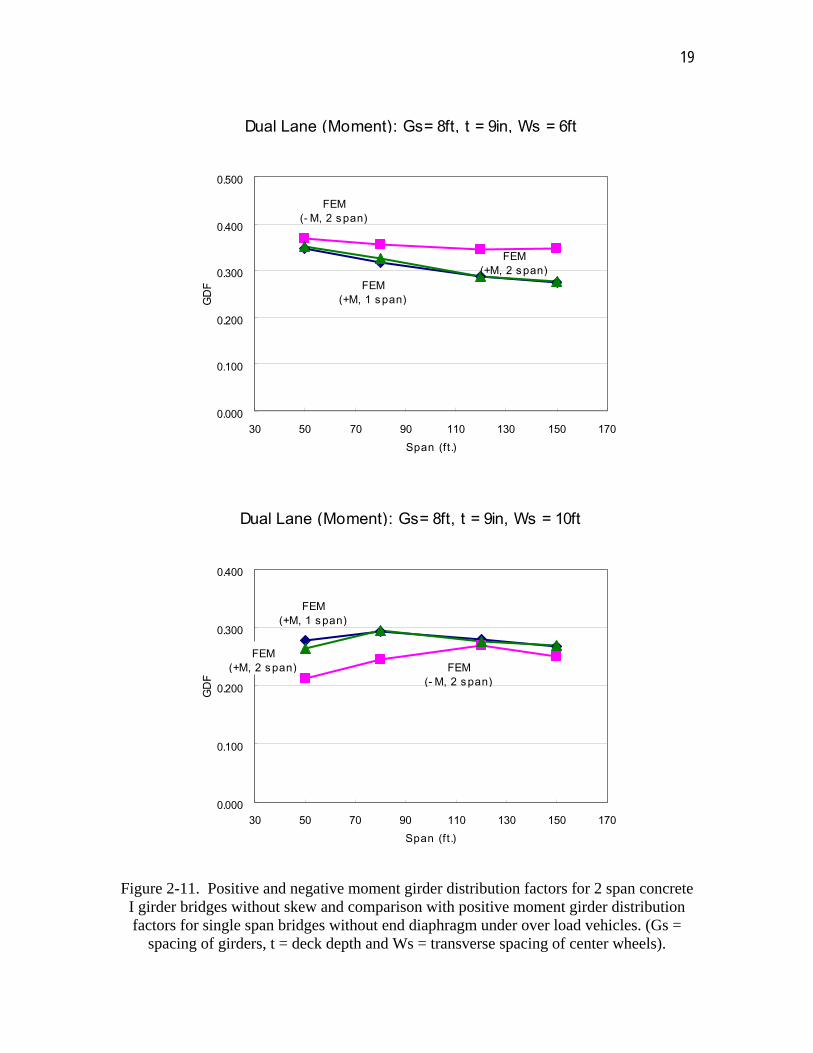
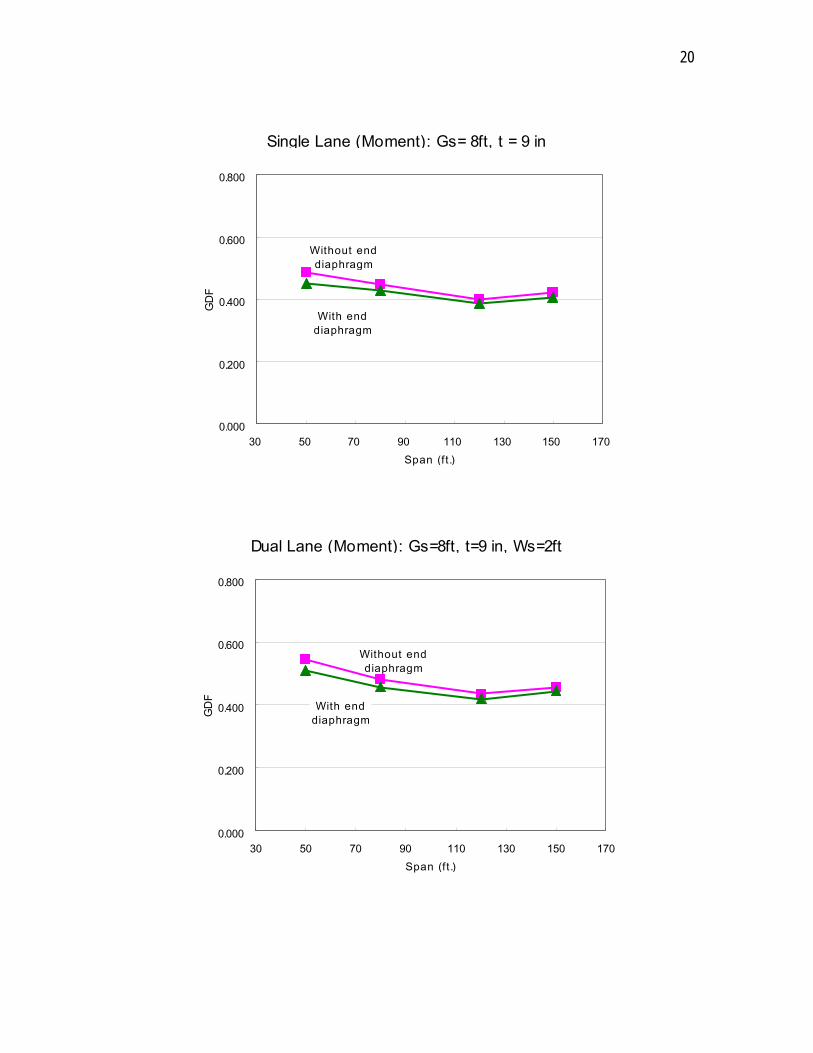
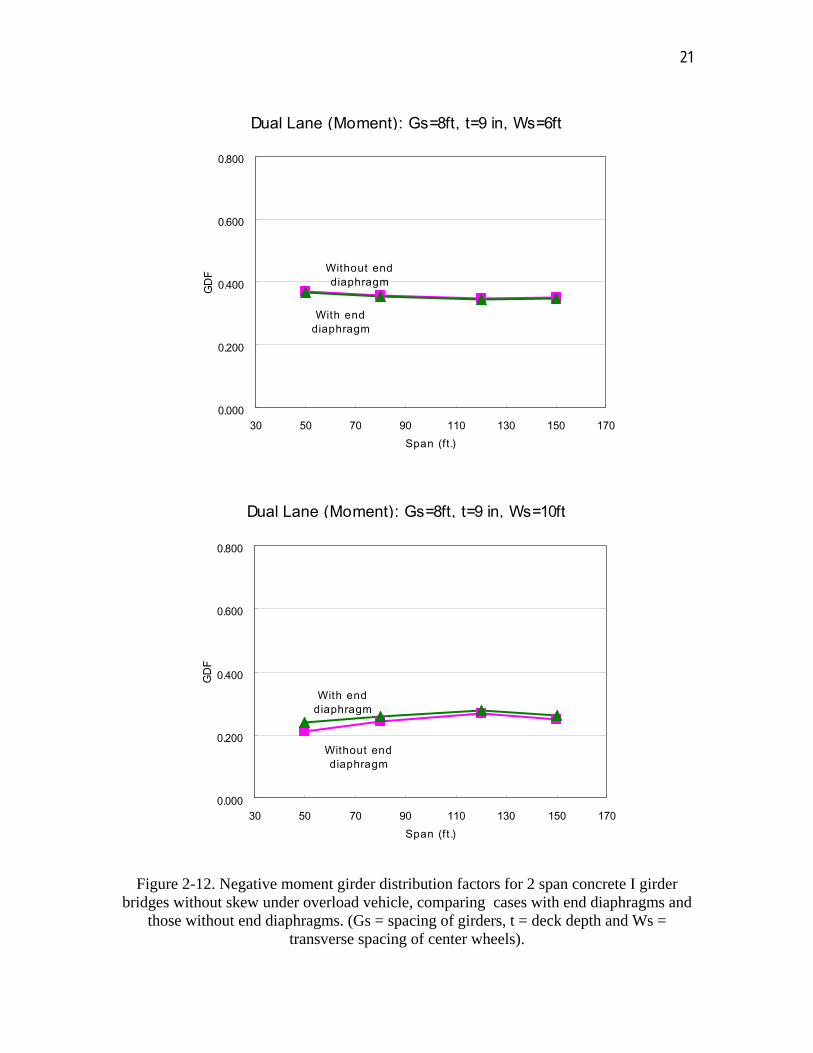
Analysis of 8 multi span concrete I girder bridges without skew was performed to expand the applicability of the GDF equations to general multi span bridges. The analysis focused on the positive moment GDF near the center of span and the negative moment GDF near the location of piers in multi span bridges. The analysis results without end diaphragms are shown in the plots of Figure 2-11. The positive moment GDFs for 2 span bridges in Figure 2-11 did not show significant difference compared with those of single span bridges, while the negative moment GDFs of 2 span bridges were -23% to 52 % higher than the positive moment GDFs of the single span bridges. The results were considered in developing GDF equations. The comparison of analyses without end diaphragms and with end diaphragms is shown in Figure 2-12 for negative moment GDFs. The results without end diaphragms showed higher GDFs compared to those with end diaphragm in most of the cases which indicates that the result without end diaphragm would be conservative if applied to all bridges.
18
Single Lane (Moment): Gs= 8ft, t = 9 in
FEM(+M, 1 s pan)
FEM(- M, 2 span)
FEM(+M, 2 span)
0.000
0.100
0.200
0.300
0.400
0.500
0.600
0.700
30 50 70 90 110 130 150 170Span (ft.)
GD
F
Dual Lane (Moment): Gs= 8ft, t = 9in, Ws = 2ft
FEM(+M, 1 span)
FEM(- M, 2 span)
FEM(+M, 2 span)
0.000
0.100
0.200
0.300
0.400
0.500
0.600
30 50 70 90 110 130 150 170Span (ft.)
GD
F
19
Dual Lane (Moment): Gs= 8ft, t = 9in, Ws = 6ft
FEM(+M, 1 span)
FEM(- M, 2 span)
FEM(+M, 2 span)
0.000
0.100
0.200
0.300
0.400
0.500
30 50 70 90 110 130 150 170Span (ft.)
GD
F
Dual Lane (Moment): Gs= 8ft, t = 9in, Ws = 10ft
FEM(+M, 1 span)
FEM(- M, 2 span)
FEM(+M, 2 span)
0.000
0.100
0.200
0.300
0.400
30 50 70 90 110 130 150 170Span (f t.)
GD
F
Figure 2-11. Positive and negative moment girder distribution factors for 2 span concrete I girder bridges without skew and comparison with positive moment girder distribution factors for single span bridges without end diaphragm under over load vehicles. (Gs =
spacing of girders, t = deck depth and Ws = transverse spacing of center wheels).
20
Single Lane (Moment): Gs= 8ft, t = 9 in
Without enddiaphragm
With enddiaphragm
0.000
0.200
0.400
0.600
0.800
30 50 70 90 110 130 150 170Span (ft.)
GD
F
Dual Lane (Moment): Gs=8ft, t=9 in, Ws=2ft
Without enddiaphragm
With enddiaphragm
0.000
0.200
0.400
0.600
0.800
30 50 70 90 110 130 150 170Span (ft.)
GD
F
21
Dual Lane (Moment): Gs=8ft, t=9 in, Ws=6ft
Without enddiaphragm
With enddiaphragm
0.000
0.200
0.400
0.600
0.800
30 50 70 90 110 130 150 170Span (ft.)
GD
F
Dual Lane (Moment): Gs=8ft, t=9 in, Ws=10ft
Without enddiaphragm
With enddiaphragm
0.000
0.200
0.400
0.600
0.800
30 50 70 90 110 130 150 170Span (ft.)
GD
F
Figure 2-12. Negative moment girder distribution factors for 2 span concrete I girder bridges without skew under overload vehicle, comparing cases with end diaphragms and
those without end diaphragms. (Gs = spacing of girders, t = deck depth and Ws = transverse spacing of center wheels).
22
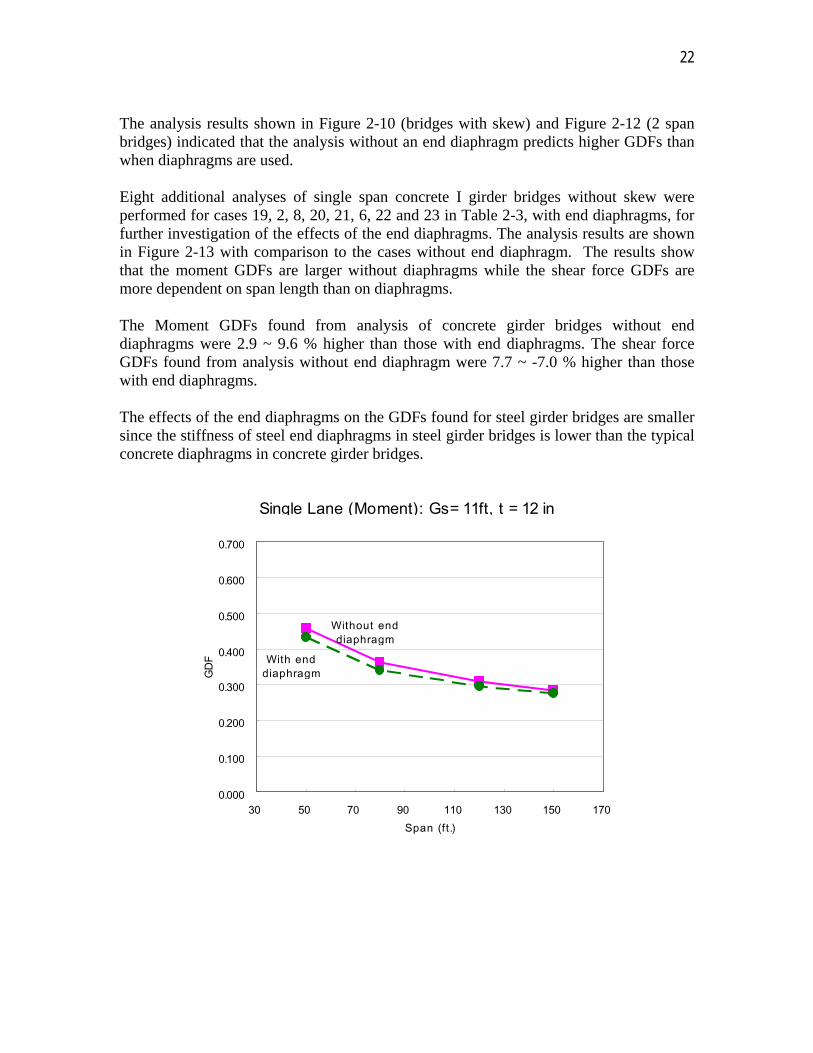
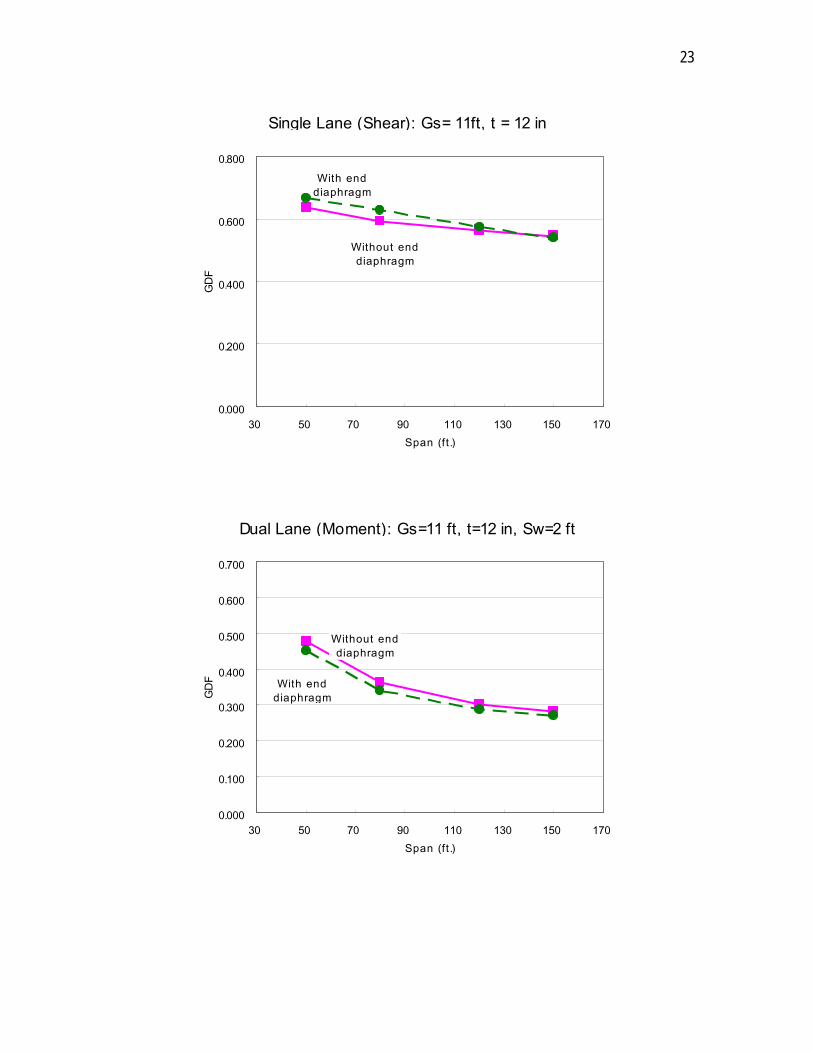
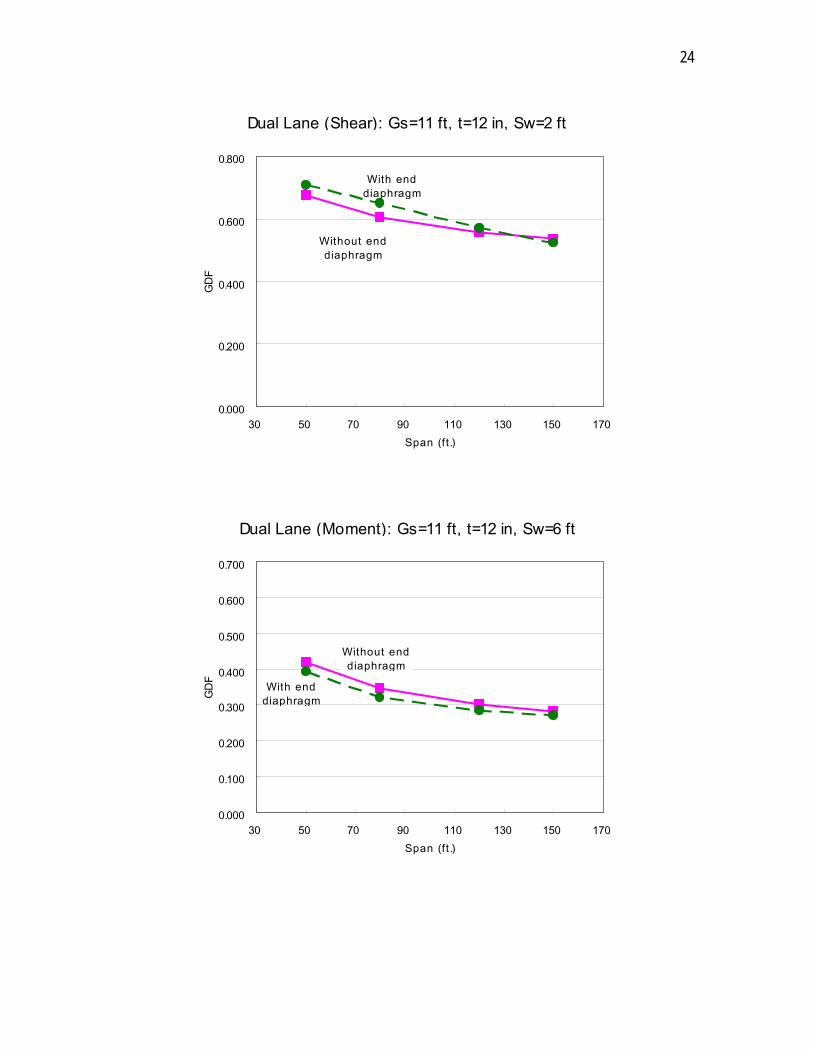
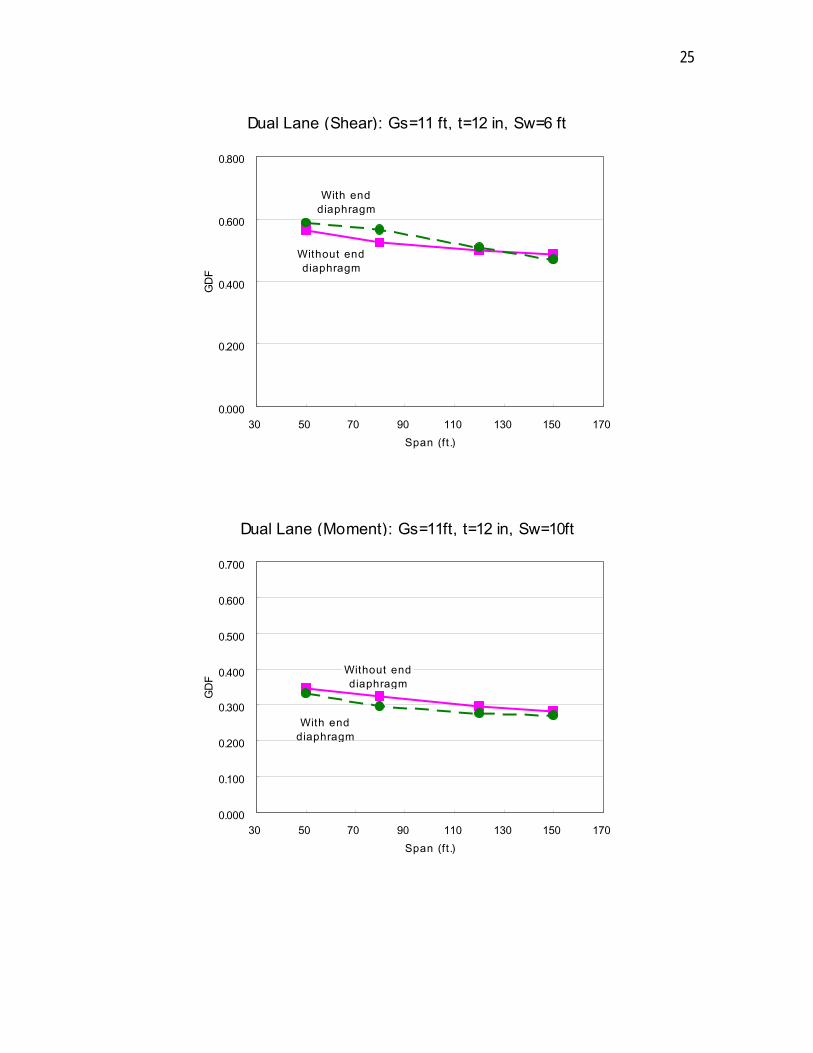
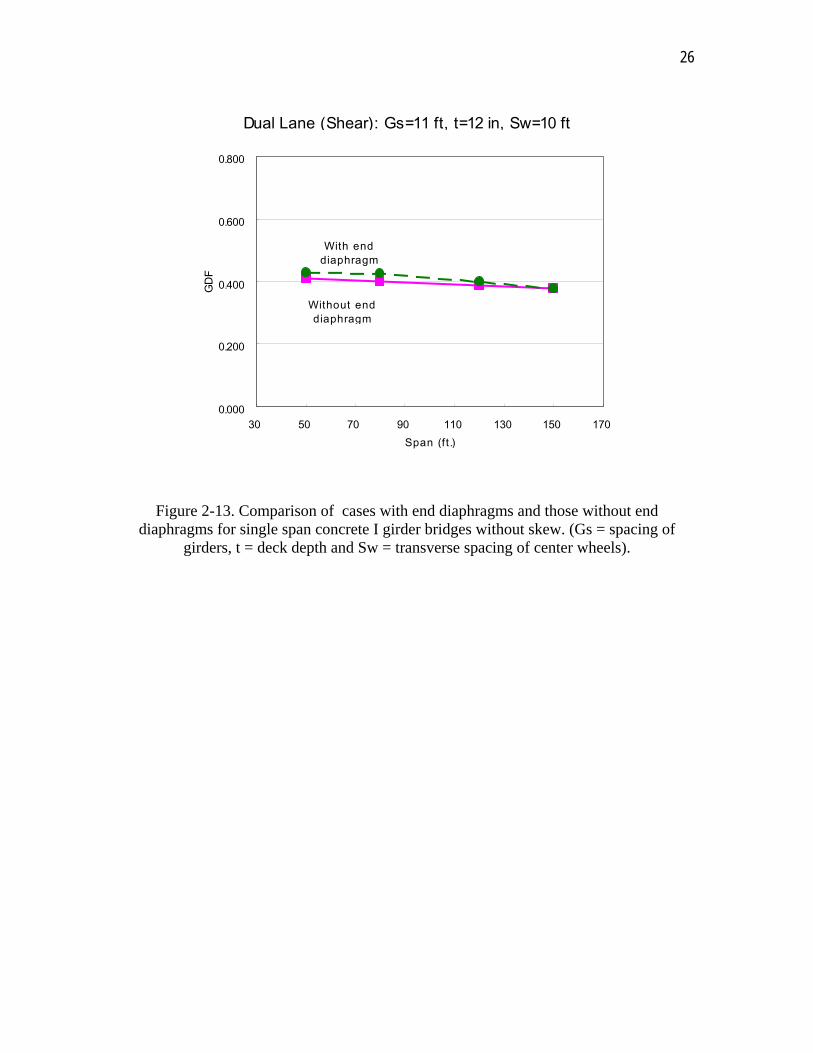
The analysis results shown in Figure 2-10 (bridges with skew) and Figure 2-12 (2 span bridges) indicated that the analysis without an end diaphragm predicts higher GDFs than when diaphragms are used. Eight additional analyses of single span concrete I girder bridges without skew were performed for cases 19, 2, 8, 20, 21, 6, 22 and 23 in Table 2-3, with end diaphragms, for further investigation of the effects of the end diaphragms. The analysis results are shown in Figure 2-13 with comparison to the cases without end diaphragm. The results show that the moment GDFs are larger without diaphragms while the shear force GDFs are more dependent on span length than on diaphragms. The Moment GDFs found from analysis of concrete girder bridges without end diaphragms were 2.9 ~ 9.6 % higher than those with end diaphragms. The shear force GDFs found from analysis without end diaphragm were 7.7 ~ -7.0 % higher than those with end diaphragms. The effects of the end diaphragms on the GDFs found for steel girder bridges are smaller since the stiffness of steel end diaphragms in steel girder bridges is lower than the typical concrete diaphragms in concrete girder bridges.
Single Lane (Moment): Gs= 11ft, t = 12 in
Without enddiaphragm
With enddiaphragm
0.000
0.100
0.200
0.300
0.400
0.500
0.600
0.700
30 50 70 90 110 130 150 170Span (ft.)
GD
F
23
Single Lane (Shear): Gs= 11ft, t = 12 in
Without enddiaphragm
With enddiaphragm
0.000
0.200
0.400
0.600
0.800
30 50 70 90 110 130 150 170Span (ft.)
GD
F
Dual Lane (Moment): Gs=11 ft, t=12 in, Sw=2 ft
Without enddiaphragm
With enddiaphragm
0.000
0.100
0.200
0.300
0.400
0.500
0.600
0.700
30 50 70 90 110 130 150 170Span (ft.)
GD
F
24
Dual Lane (Shear): Gs=11 ft, t=12 in, Sw=2 ft
Without enddiaphragm
With enddiaphragm
0.000
0.200
0.400
0.600
0.800
30 50 70 90 110 130 150 170Span (ft.)
GD
F
Dual Lane (Moment): Gs=11 ft, t=12 in, Sw=6 ft
Without enddiaphragm
With enddiaphragm
0.000
0.100
0.200
0.300
0.400
0.500
0.600
0.700
30 50 70 90 110 130 150 170Span (ft.)
GD
F
25
Dual Lane (Shear): Gs=11 ft, t=12 in, Sw=6 ft
Without enddiaphragm
With enddiaphragm
0.000
0.200
0.400
0.600
0.800
30 50 70 90 110 130 150 170Span (ft.)
GD
F
Dual Lane (Moment): Gs=11ft, t=12 in, Sw=10ft
Without enddiaphragm
With enddiaphragm
0.000
0.100
0.200
0.300
0.400
0.500
0.600
0.700
30 50 70 90 110 130 150 170Span (ft.)
GD
F
26
Dual Lane (Shear): Gs=11 ft, t=12 in, Sw=10 ft
Without enddiaphragm
With enddiaphragm
0.000
0.200
0.400
0.600
0.800
30 50 70 90 110 130 150 170Span (ft.)
GD
F
Figure 2-13. Comparison of cases with end diaphragms and those without end diaphragms for single span concrete I girder bridges without skew. (Gs = spacing of
girders, t = deck depth and Sw = transverse spacing of center wheels).
27
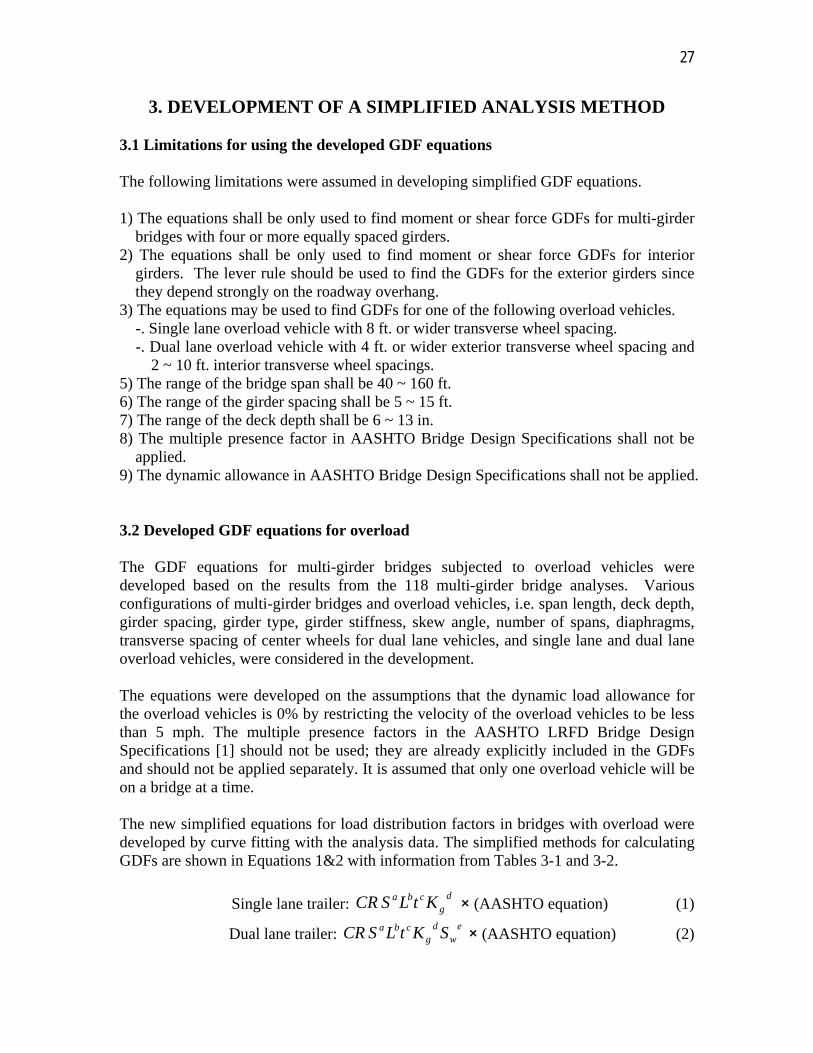
3. DEVELOPMENT OF A SIMPLIFIED ANALYSIS METHOD 3.1 Limitations for using the developed GDF equations The following limitations were assumed in developing simplified GDF equations. 1) The equations shall be only used to find moment or shear force GDFs for multi-girder
bridges with four or more equally spaced girders. 2) The equations shall be only used to find moment or shear force GDFs for interior
girders. The lever rule should be used to find the GDFs for the exterior girders since they depend strongly on the roadway overhang.
3) The equations may be used to find GDFs for one of the following overload vehicles. -. Single lane overload vehicle with 8 ft. or wider transverse wheel spacing. -. Dual lane overload vehicle with 4 ft. or wider exterior transverse wheel spacing and
2 ~ 10 ft. interior transverse wheel spacings. 5) The range of the bridge span shall be 40 ~ 160 ft. 6) The range of the girder spacing shall be 5 ~ 15 ft. 7) The range of the deck depth shall be 6 ~ 13 in. 8) The multiple presence factor in AASHTO Bridge Design Specifications shall not be
applied. 9) The dynamic allowance in AASHTO Bridge Design Specifications shall not be applied. 3.2 Developed GDF equations for overload The GDF equations for multi-girder bridges subjected to overload vehicles were developed based on the results from the 118 multi-girder bridge analyses. Various configurations of multi-girder bridges and overload vehicles, i.e. span length, deck depth, girder spacing, girder type, girder stiffness, skew angle, number of spans, diaphragms, transverse spacing of center wheels for dual lane vehicles, and single lane and dual lane overload vehicles, were considered in the development. The equations were developed on the assumptions that the dynamic load allowance for the overload vehicles is 0% by restricting the velocity of the overload vehicles to be less than 5 mph. The multiple presence factors in the AASHTO LRFD Bridge Design Specifications [1] should not be used; they are already explicitly included in the GDFs and should not be applied separately. It is assumed that only one overload vehicle will be on a bridge at a time. The new simplified equations for load distribution factors in bridges with overload were developed by curve fitting with the analysis data. The simplified methods for calculating GDFs are shown in Equations 1&2 with information from Tables 3-1 and 3-2.
Single lane trailer: d
gcba KtLSCR × (AASHTO equation) (1)
Dual lane trailer: e
wd
gcba SKtLSCR × (AASHTO equation) (2)
28
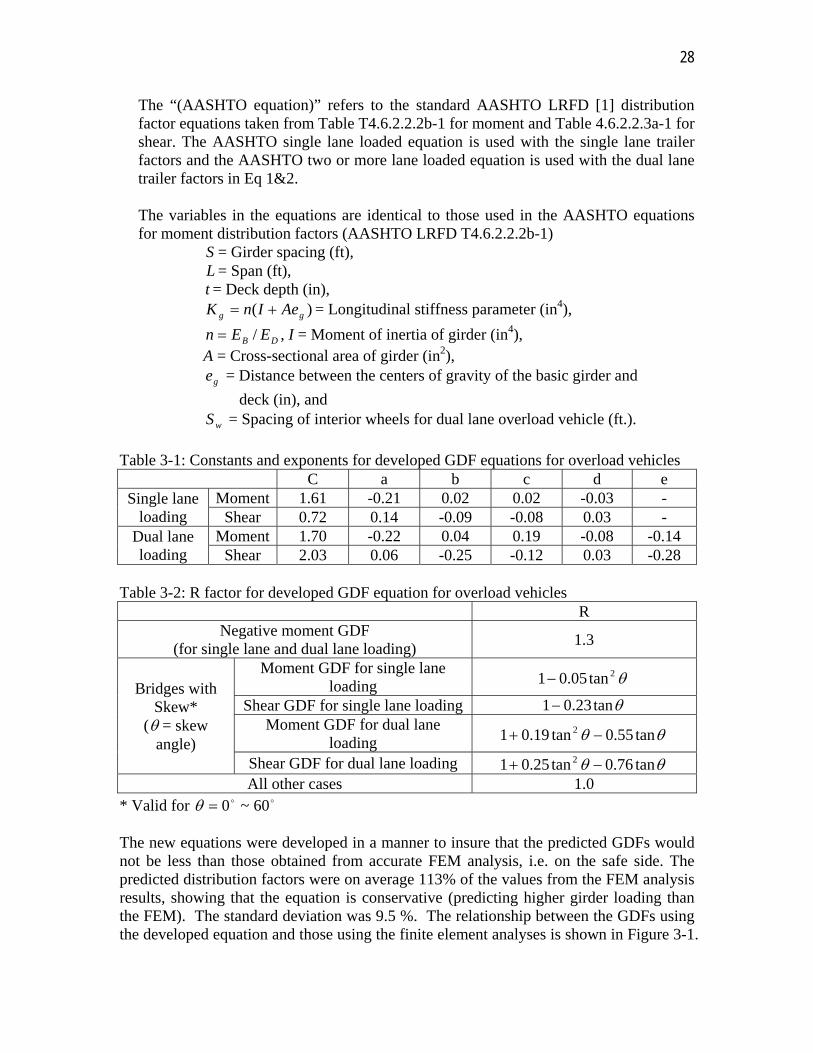
The “(AASHTO equation)” refers to the standard AASHTO LRFD [1] distribution factor equations taken from Table T4.6.2.2.2b-1 for moment and Table 4.6.2.2.3a-1 for shear. The AASHTO single lane loaded equation is used with the single lane trailer factors and the AASHTO two or more lane loaded equation is used with the dual lane trailer factors in Eq 1&2. The variables in the equations are identical to those used in the AASHTO equations for moment distribution factors (AASHTO LRFD T4.6.2.2.2b-1) S = Girder spacing (ft),
L = Span (ft), t = Deck depth (in), )( gg AeInK = Longitudinal stiffness parameter (in4),
DB EEn / , I = Moment of inertia of girder (in4), A = Cross-sectional area of girder (in2), ge = Distance between the centers of gravity of the basic girder and
deck (in), and wS = Spacing of interior wheels for dual lane overload vehicle (ft.).
Table 3-1: Constants and exponents for developed GDF equations for overload vehicles
C a b c d e Single lane
loading Moment 1.61 -0.21 0.02 0.02 -0.03 -
Shear 0.72 0.14 -0.09 -0.08 0.03 - Dual lane loading
Moment 1.70 -0.22 0.04 0.19 -0.08 -0.14 Shear 2.03 0.06 -0.25 -0.12 0.03 -0.28
Table 3-2: R factor for developed GDF equation for overload vehicles
R Negative moment GDF
(for single lane and dual lane loading) 1.3
Bridges with Skew*
( = skew angle)
Moment GDF for single lane loading 2tan05.01
Shear GDF for single lane loading tan23.01 Moment GDF for dual lane
loading tan55.0tan19.01 2
Shear GDF for dual lane loading tan76.0tan25.01 2 All other cases 1.0
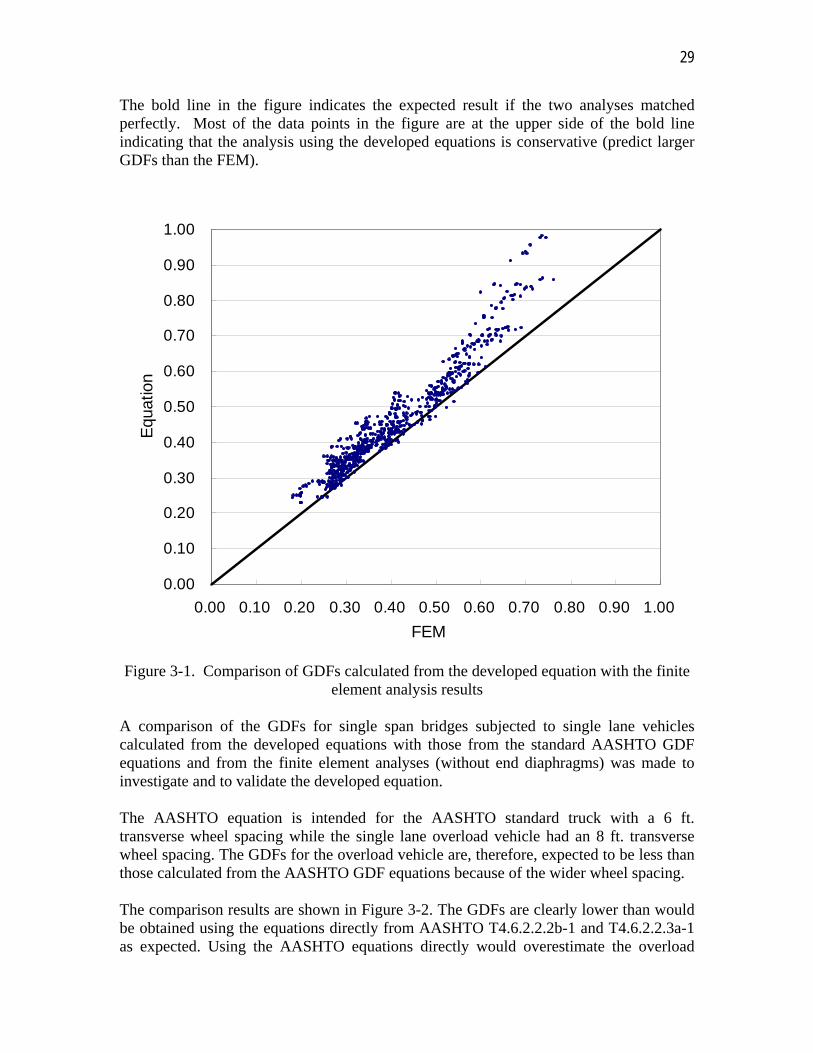
* Valid for 60~0 The new equations were developed in a manner to insure that the predicted GDFs would not be less than those obtained from accurate FEM analysis, i.e. on the safe side. The predicted distribution factors were on average 113% of the values from the FEM analysis results, showing that the equation is conservative (predicting higher girder loading than the FEM). The standard deviation was 9.5 %. The relationship between the GDFs using the developed equation and those using the finite element analyses is shown in Figure 3-1.
29
The bold line in the figure indicates the expected result if the two analyses matched perfectly. Most of the data points in the figure are at the upper side of the bold line indicating that the analysis using the developed equations is conservative (predict larger GDFs than the FEM).
0.00
0.10
0.20
0.30
0.40
0.50
0.60
0.70
0.80
0.90
1.00
0.00 0.10 0.20 0.30 0.40 0.50 0.60 0.70 0.80 0.90 1.00
FEM
Equ
atio
n
Figure 3-1. Comparison of GDFs calculated from the developed equation with the finite
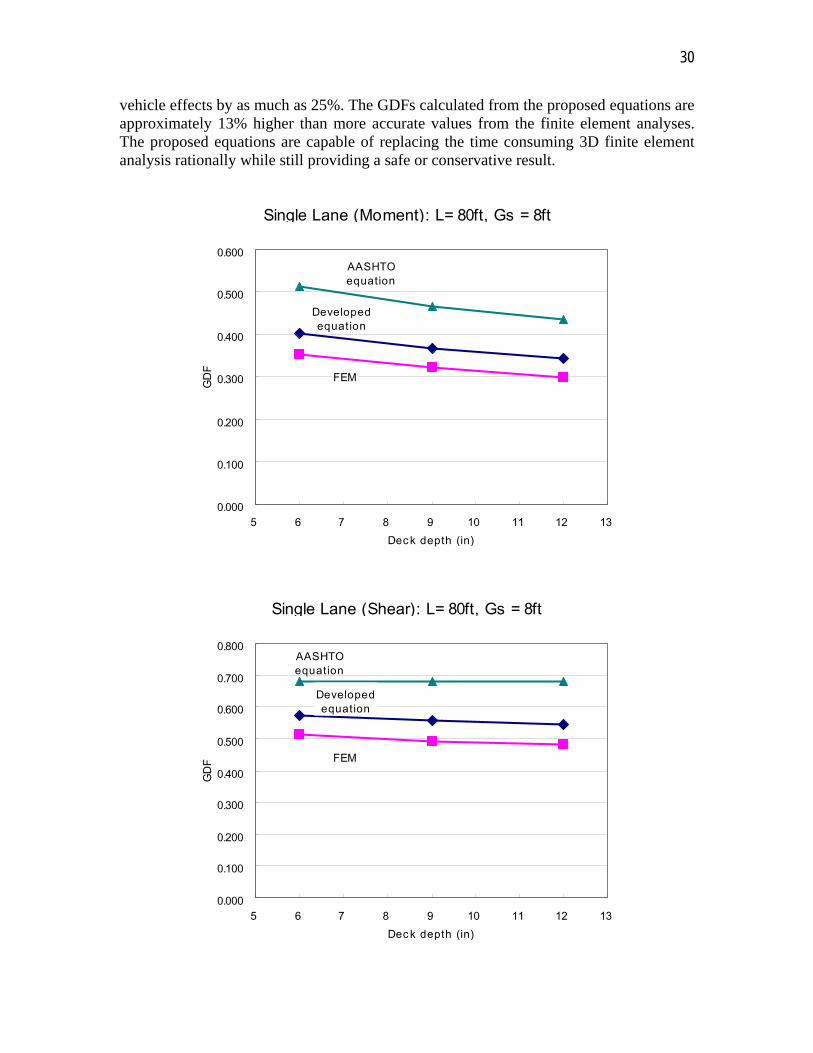
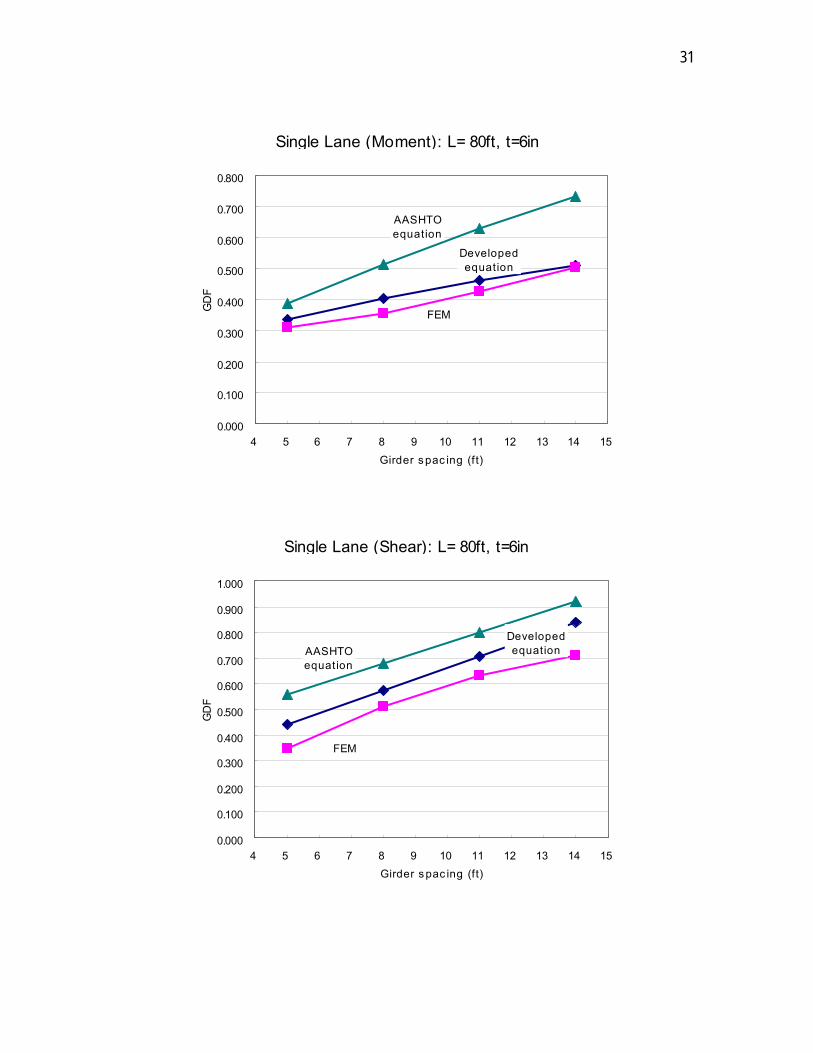
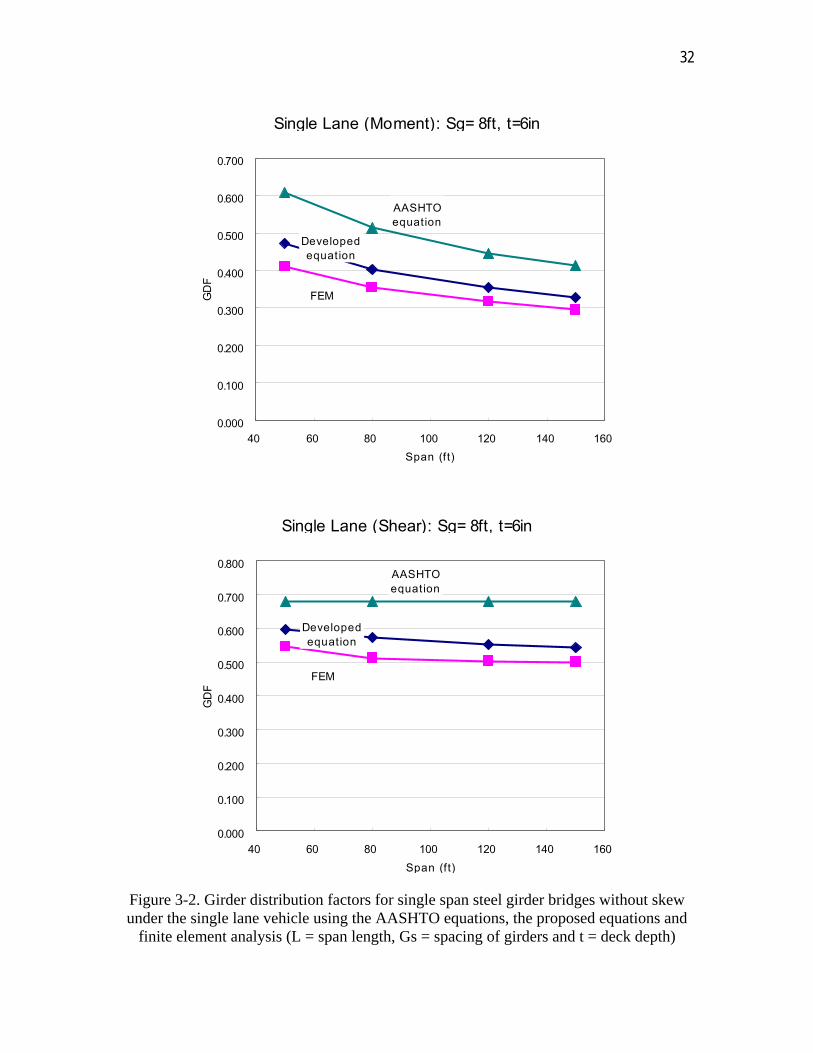
element analysis results A comparison of the GDFs for single span bridges subjected to single lane vehicles calculated from the developed equations with those from the standard AASHTO GDF equations and from the finite element analyses (without end diaphragms) was made to investigate and to validate the developed equation. The AASHTO equation is intended for the AASHTO standard truck with a 6 ft. transverse wheel spacing while the single lane overload vehicle had an 8 ft. transverse wheel spacing. The GDFs for the overload vehicle are, therefore, expected to be less than those calculated from the AASHTO GDF equations because of the wider wheel spacing. The comparison results are shown in Figure 3-2. The GDFs are clearly lower than would be obtained using the equations directly from AASHTO T4.6.2.2.2b-1 and T4.6.2.2.3a-1 as expected. Using the AASHTO equations directly would overestimate the overload
30
vehicle effects by as much as 25%. The GDFs calculated from the proposed equations are approximately 13% higher than more accurate values from the finite element analyses. The proposed equations are capable of replacing the time consuming 3D finite element analysis rationally while still providing a safe or conservative result.
Single Lane (Moment): L= 80ft, Gs = 8ft
Developedequation
FEM
AASHTOequation
0.000
0.100
0.200
0.300
0.400
0.500
0.600
5 6 7 8 9 10 11 12 13Dec k depth (in)
GD
F
Single Lane (Shear): L= 80ft, Gs = 8ft
Developedequation
FEM
AASHTOequation
0.000
0.100
0.200
0.300
0.400
0.500
0.600
0.700
0.800
5 6 7 8 9 10 11 12 13Dec k depth (in)
GD
F
31
Single Lane (Moment): L= 80ft, t=6in
Developedequation
FEM
AASHTOequation
0.000
0.100
0.200
0.300
0.400
0.500
0.600
0.700
0.800
4 5 6 7 8 9 10 11 12 13 14 15Girder spac ing (ft)
GD
F
Single Lane (Shear): L= 80ft, t=6in
Developedequation
FEM
AASHTOequation
0.000
0.100
0.200
0.300
0.400
0.500
0.600
0.700
0.800
0.900
1.000
4 5 6 7 8 9 10 11 12 13 14 15Girder spac ing (ft)
GD
F
32
Single Lane (Moment): Sg= 8ft, t=6in
Developedequation
FEM
AASHTOequation
0.000
0.100
0.200
0.300
0.400
0.500
0.600
0.700
40 60 80 100 120 140 160Span (ft)
GD
F
Single Lane (Shear): Sg= 8ft, t=6in
Developedequation
FEM
AASHTOequation
0.000
0.100
0.200
0.300
0.400
0.500
0.600
0.700
0.800
40 60 80 100 120 140 160Span (ft)
GD
F
Figure 3-2. Girder distribution factors for single span steel girder bridges without skew under the single lane vehicle using the AASHTO equations, the proposed equations and
finite element analysis (L = span length, Gs = spacing of girders and t = deck depth)
33
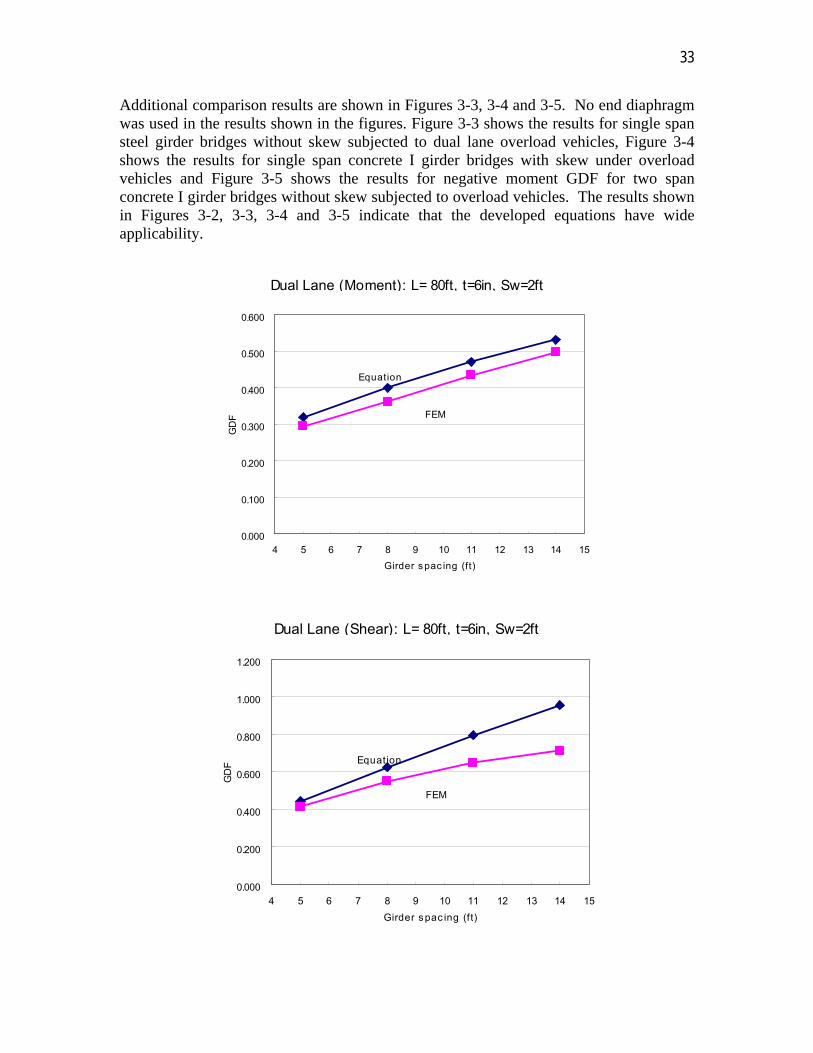
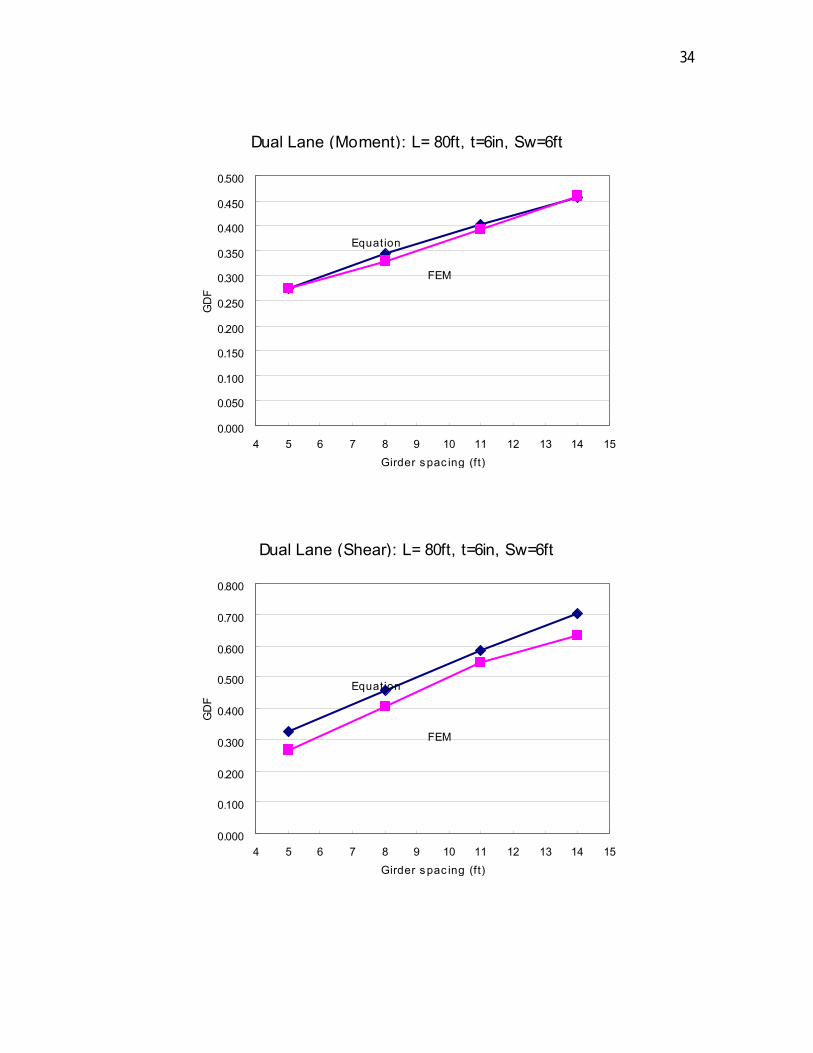
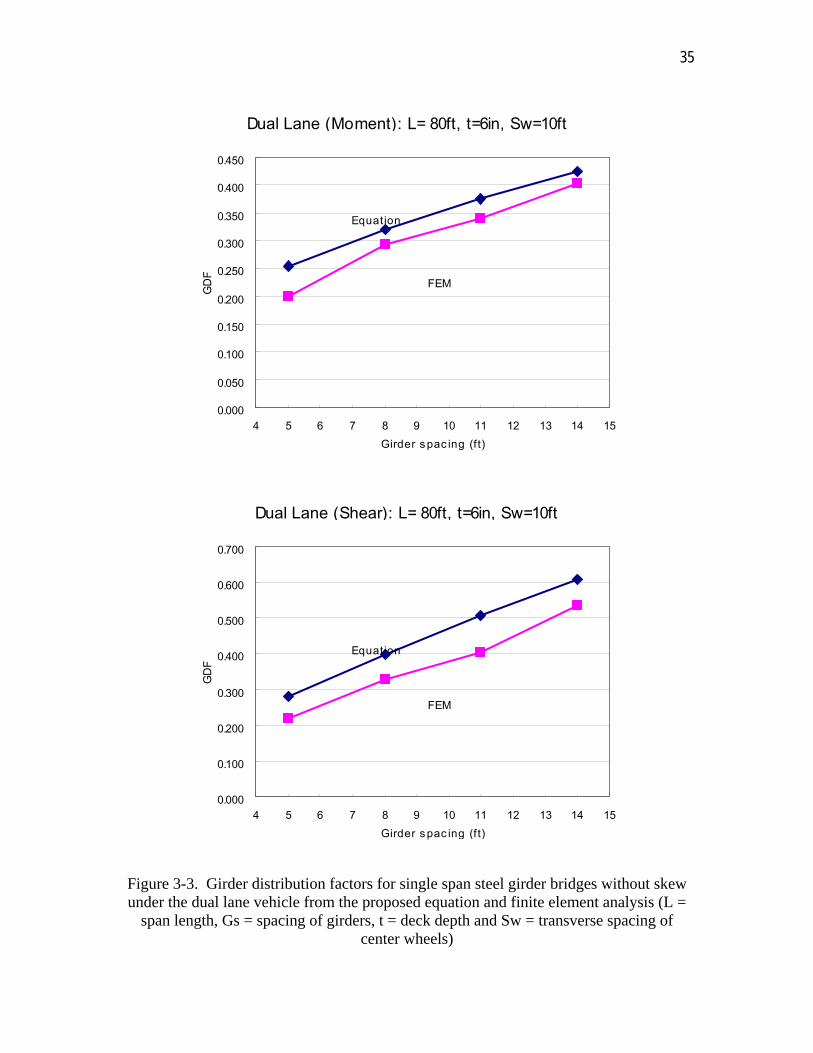
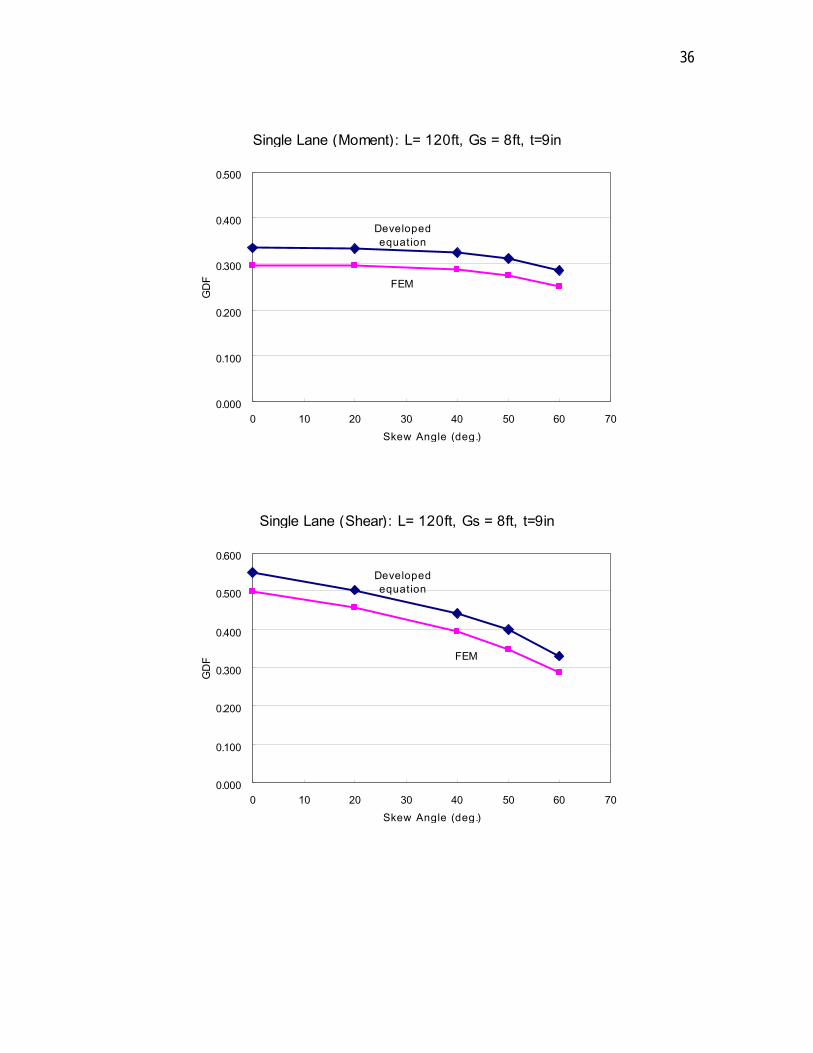
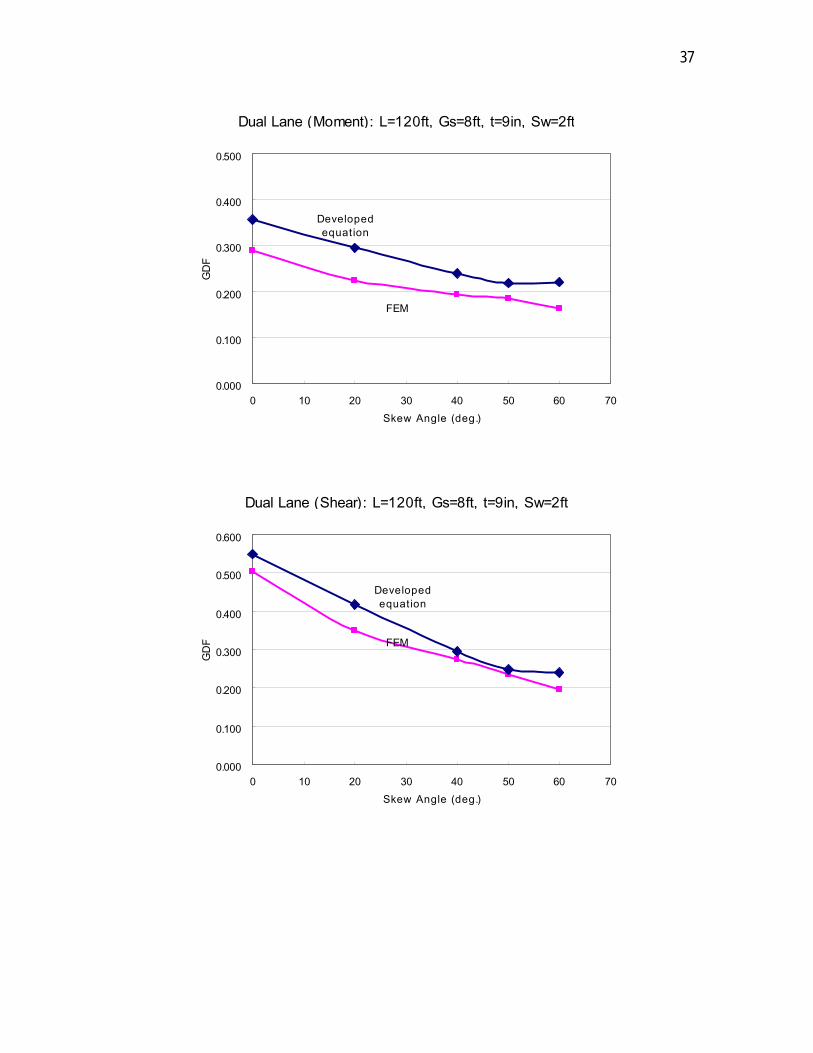
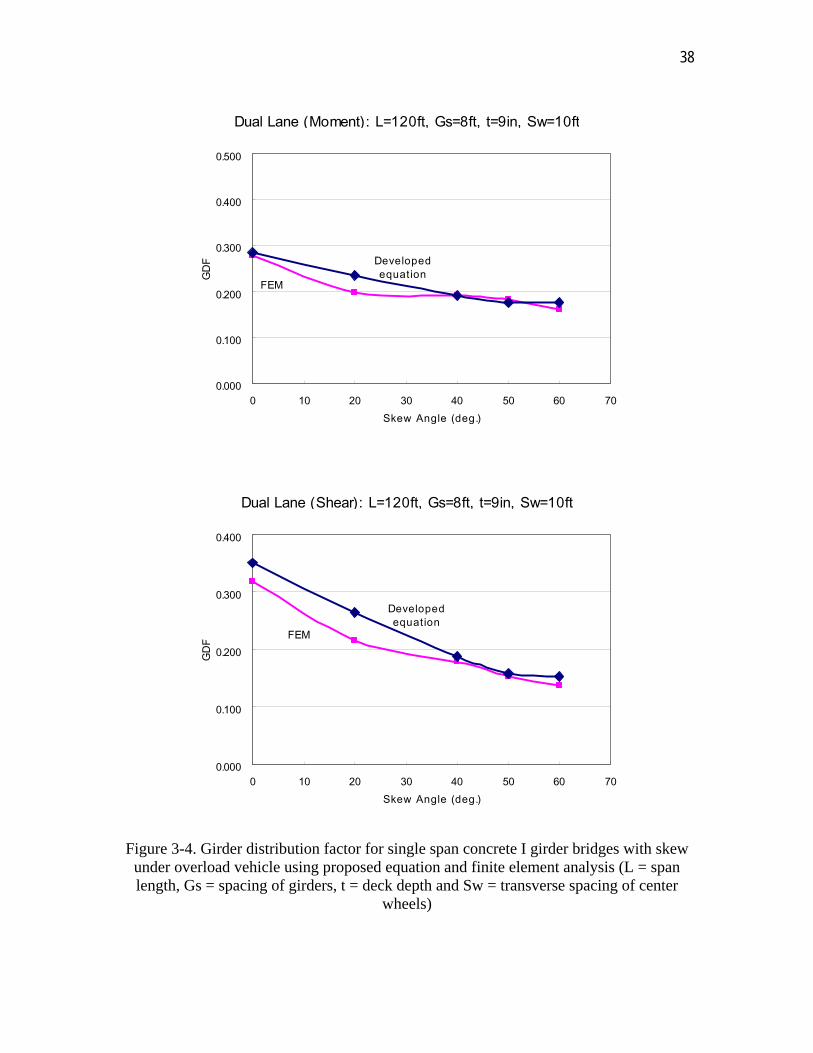
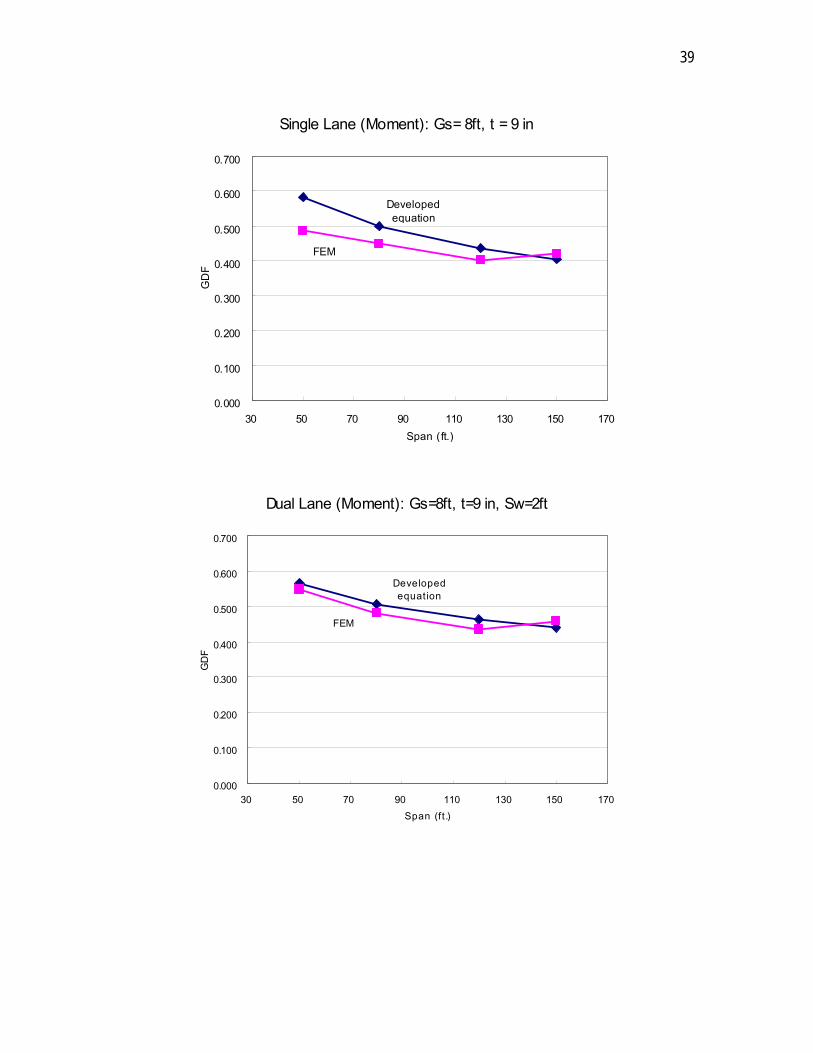
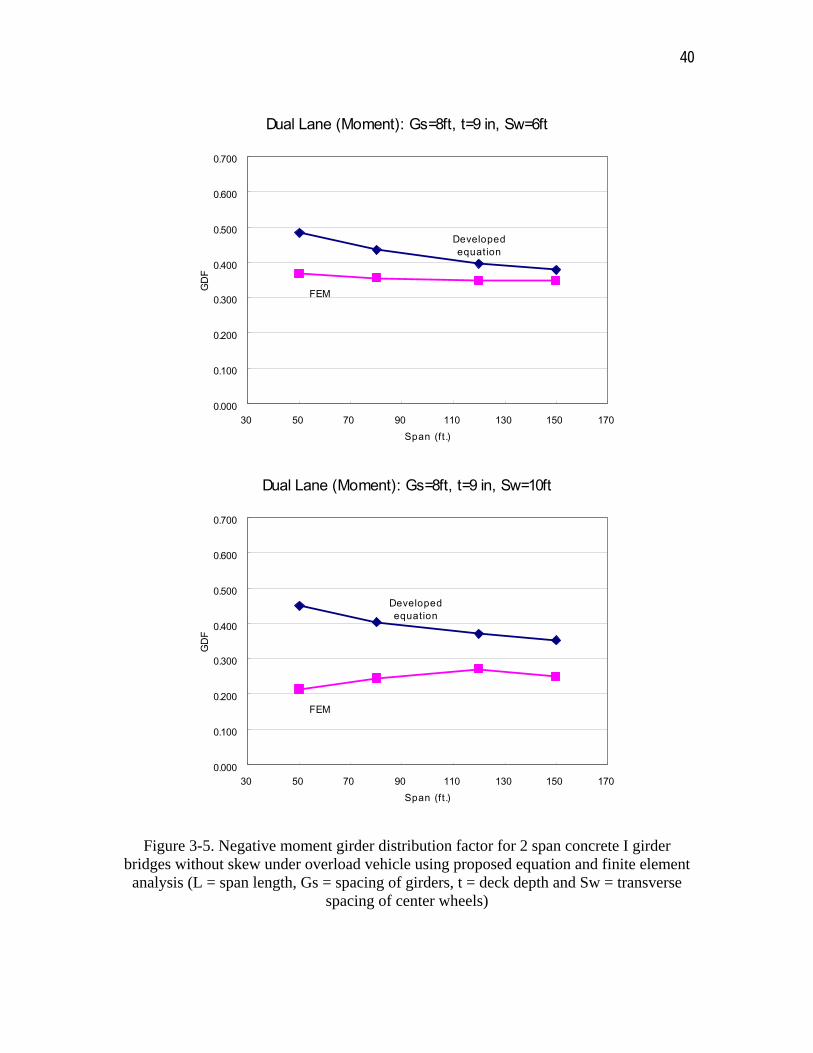
Additional comparison results are shown in Figures 3-3, 3-4 and 3-5. No end diaphragm was used in the results shown in the figures. Figure 3-3 shows the results for single span steel girder bridges without skew subjected to dual lane overload vehicles, Figure 3-4 shows the results for single span concrete I girder bridges with skew under overload vehicles and Figure 3-5 shows the results for negative moment GDF for two span concrete I girder bridges without skew subjected to overload vehicles. The results shown in Figures 3-2, 3-3, 3-4 and 3-5 indicate that the developed equations have wide applicability.
Dual Lane (Moment): L= 80ft, t=6in, Sw=2ft
Equation
FEM
0.000
0.100
0.200
0.300
0.400
0.500
0.600
4 5 6 7 8 9 10 11 12 13 14 15Girder spac ing (ft)
GD
F
Dual Lane (Shear): L= 80ft, t=6in, Sw=2ft
Equation
FEM
0.000
0.200
0.400
0.600
0.800
1.000
1.200
4 5 6 7 8 9 10 11 12 13 14 15Girder spac ing (ft)
GD
F
34
Dual Lane (Moment): L= 80ft, t=6in, Sw=6ft
Equation
FEM
0.000
0.050
0.100
0.150
0.200
0.250
0.300
0.350
0.400
0.450
0.500
4 5 6 7 8 9 10 11 12 13 14 15Girder spac ing (ft)
GD
F
Dual Lane (Shear): L= 80ft, t=6in, Sw=6ft
Equation
FEM
0.000
0.100
0.200
0.300
0.400
0.500
0.600
0.700
0.800
4 5 6 7 8 9 10 11 12 13 14 15Girder spac ing (ft)
GD
F
35
Dual Lane (Moment): L= 80ft, t=6in, Sw=10ft
Equation
FEM
0.000
0.050
0.100
0.150
0.200
0.250
0.300
0.350
0.400
0.450
4 5 6 7 8 9 10 11 12 13 14 15Girder spac ing (ft)
GD
F
Dual Lane (Shear): L= 80ft, t=6in, Sw=10ft
Equation
FEM
0.000
0.100
0.200
0.300
0.400
0.500
0.600
0.700
4 5 6 7 8 9 10 11 12 13 14 15Girder spac ing (ft)
GD
F
Figure 3-3. Girder distribution factors for single span steel girder bridges without skew under the dual lane vehicle from the proposed equation and finite element analysis (L =
span length, Gs = spacing of girders, t = deck depth and Sw = transverse spacing of center wheels)
36
Single Lane (Moment): L= 120ft, Gs = 8ft, t=9in
Developedequation
FEM
0.000
0.100
0.200
0.300
0.400
0.500
0 10 20 30 40 50 60 70Skew Angle (deg.)
GD
F
Single Lane (Shear): L= 120ft, Gs = 8ft, t=9in
FEM
Developedequation
0.000
0.100
0.200
0.300
0.400
0.500
0.600
0 10 20 30 40 50 60 70Skew Angle (deg.)
GD
F
37
Dual Lane (Moment): L=120ft, Gs=8ft, t=9in, Sw=2ft
FEM
Developedequation
0.000
0.100
0.200
0.300
0.400
0.500
0 10 20 30 40 50 60 70Skew Angle (deg.)
GD
F
Dual Lane (Shear): L=120ft, Gs=8ft, t=9in, Sw=2ft
Developedequation
FEM
0.000
0.100
0.200
0.300
0.400
0.500
0.600
0 10 20 30 40 50 60 70Skew Angle (deg.)
GD
F
38
Dual Lane (Moment): L=120ft, Gs=8ft, t=9in, Sw=10ft
FEM
Developedequation
0.000
0.100
0.200
0.300
0.400
0.500
0 10 20 30 40 50 60 70Skew Angle (deg.)
GD
F
Dual Lane (Shear): L=120ft, Gs=8ft, t=9in, Sw=10ft
Developedequation
FEM
0.000
0.100
0.200
0.300
0.400
0 10 20 30 40 50 60 70Skew Angle (deg.)
GD
F
Figure 3-4. Girder distribution factor for single span concrete I girder bridges with skew under overload vehicle using proposed equation and finite element analysis (L = span length, Gs = spacing of girders, t = deck depth and Sw = transverse spacing of center
wheels)
39
Single Lane (Moment): Gs= 8ft, t = 9 in
Developedequation
FEM
0.000
0.100
0.200
0.300
0.400
0.500
0.600
0.700
30 50 70 90 110 130 150 170Span (ft.)
GD
F
Dual Lane (Moment): Gs=8ft, t=9 in, Sw=2ft
Developedequation
FEM
0.000
0.100
0.200
0.300
0.400
0.500
0.600
0.700
30 50 70 90 110 130 150 170Span (ft.)
GD
F
40
Dual Lane (Moment): Gs=8ft, t=9 in, Sw=6ft
Developedequation
FEM
0.000
0.100
0.200
0.300
0.400
0.500
0.600
0.700
30 50 70 90 110 130 150 170Span (ft.)
GD
F
Dual Lane (Moment): Gs=8ft, t=9 in, Sw=10ft
Developedequation
FEM
0.000
0.100
0.200
0.300
0.400
0.500
0.600
0.700
30 50 70 90 110 130 150 170Span (ft.)
GD
F
Figure 3-5. Negative moment girder distribution factor for 2 span concrete I girder bridges without skew under overload vehicle using proposed equation and finite element
analysis (L = span length, Gs = spacing of girders, t = deck depth and Sw = transverse spacing of center wheels)
41
4. ANALYSIS PROCEDURE AND EXAMPLES USING THE PROPOSED GDF EQUATION FOR MULTI-GIRDER BRIDGES
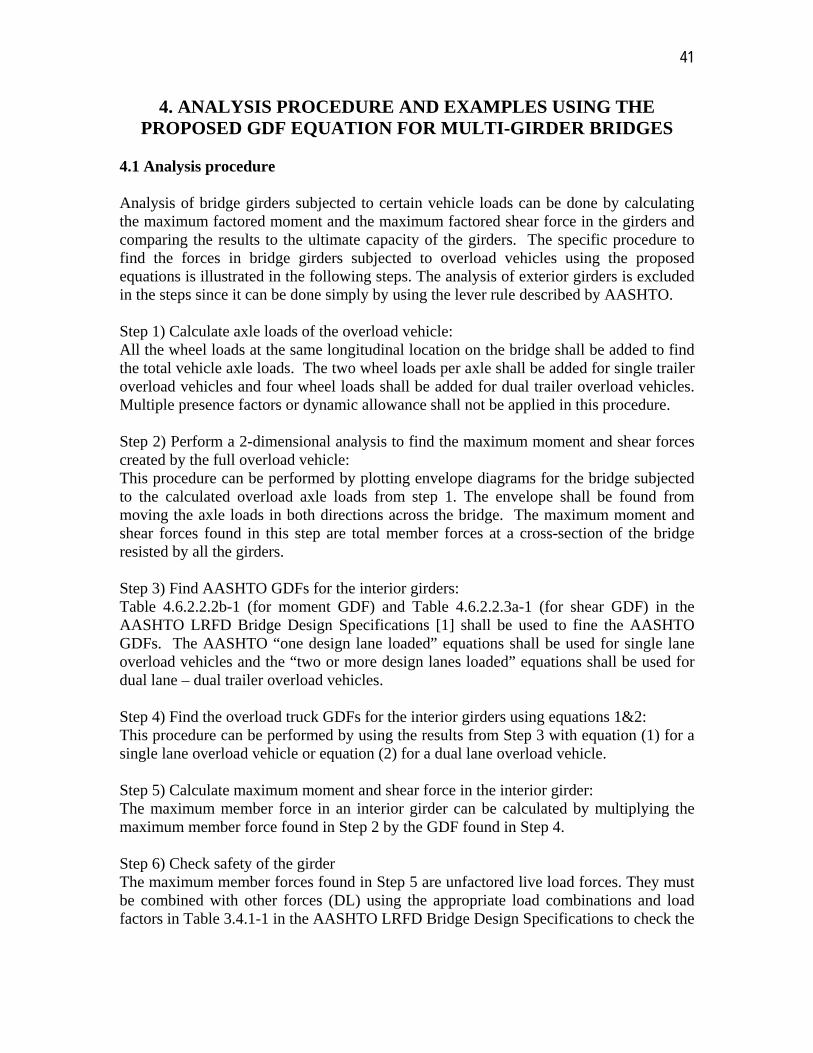
4.1 Analysis procedure Analysis of bridge girders subjected to certain vehicle loads can be done by calculating the maximum factored moment and the maximum factored shear force in the girders and comparing the results to the ultimate capacity of the girders. The specific procedure to find the forces in bridge girders subjected to overload vehicles using the proposed equations is illustrated in the following steps. The analysis of exterior girders is excluded in the steps since it can be done simply by using the lever rule described by AASHTO. Step 1) Calculate axle loads of the overload vehicle: All the wheel loads at the same longitudinal location on the bridge shall be added to find the total vehicle axle loads. The two wheel loads per axle shall be added for single trailer overload vehicles and four wheel loads shall be added for dual trailer overload vehicles. Multiple presence factors or dynamic allowance shall not be applied in this procedure. Step 2) Perform a 2-dimensional analysis to find the maximum moment and shear forces created by the full overload vehicle: This procedure can be performed by plotting envelope diagrams for the bridge subjected to the calculated overload axle loads from step 1. The envelope shall be found from moving the axle loads in both directions across the bridge. The maximum moment and shear forces found in this step are total member forces at a cross-section of the bridge resisted by all the girders. Step 3) Find AASHTO GDFs for the interior girders: Table 4.6.2.2.2b-1 (for moment GDF) and Table 4.6.2.2.3a-1 (for shear GDF) in the AASHTO LRFD Bridge Design Specifications [1] shall be used to fine the AASHTO GDFs. The AASHTO “one design lane loaded” equations shall be used for single lane overload vehicles and the “two or more design lanes loaded” equations shall be used for dual lane – dual trailer overload vehicles. Step 4) Find the overload truck GDFs for the interior girders using equations 1&2: This procedure can be performed by using the results from Step 3 with equation (1) for a single lane overload vehicle or equation (2) for a dual lane overload vehicle. Step 5) Calculate maximum moment and shear force in the interior girder: The maximum member force in an interior girder can be calculated by multiplying the maximum member force found in Step 2 by the GDF found in Step 4. Step 6) Check safety of the girder The maximum member forces found in Step 5 are unfactored live load forces. They must be combined with other forces (DL) using the appropriate load combinations and load factors in Table 3.4.1-1 in the AASHTO LRFD Bridge Design Specifications to check the
42
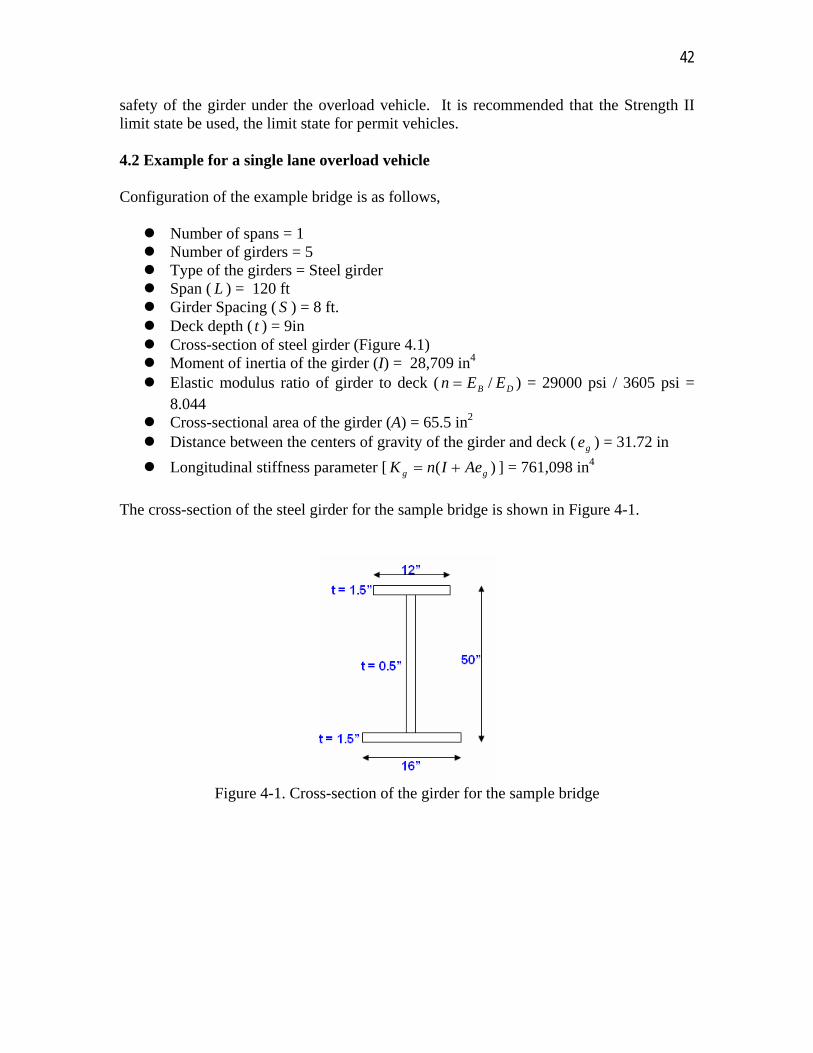
safety of the girder under the overload vehicle. It is recommended that the Strength II limit state be used, the limit state for permit vehicles. 4.2 Example for a single lane overload vehicle Configuration of the example bridge is as follows, Number of spans = 1 Number of girders = 5 Type of the girders = Steel girder Span ( L ) = 120 ft Girder Spacing ( S ) = 8 ft. Deck depth ( t ) = 9in Cross-section of steel girder (Figure 4.1) Moment of inertia of the girder (I) = 28,709 in4 Elastic modulus ratio of girder to deck ( DB EEn / ) = 29000 psi / 3605 psi =
8.044 Cross-sectional area of the girder (A) = 65.5 in2 Distance between the centers of gravity of the girder and deck ( ge ) = 31.72 in
Longitudinal stiffness parameter [ )( gg AeInK ] = 761,098 in4
The cross-section of the steel girder for the sample bridge is shown in Figure 4-1.
Figure 4-1. Cross-section of the girder for the sample bridge
43
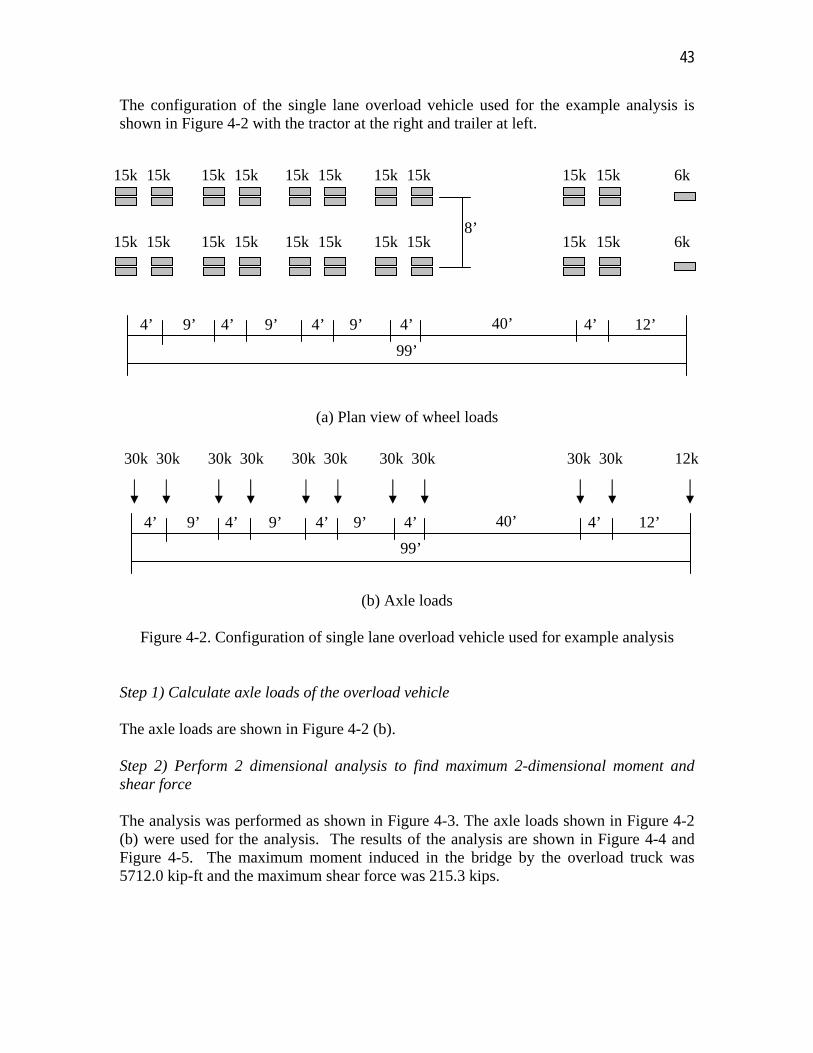
The configuration of the single lane overload vehicle used for the example analysis is shown in Figure 4-2 with the tractor at the right and trailer at left.
(a) Plan view of wheel loads
(b) Axle loads
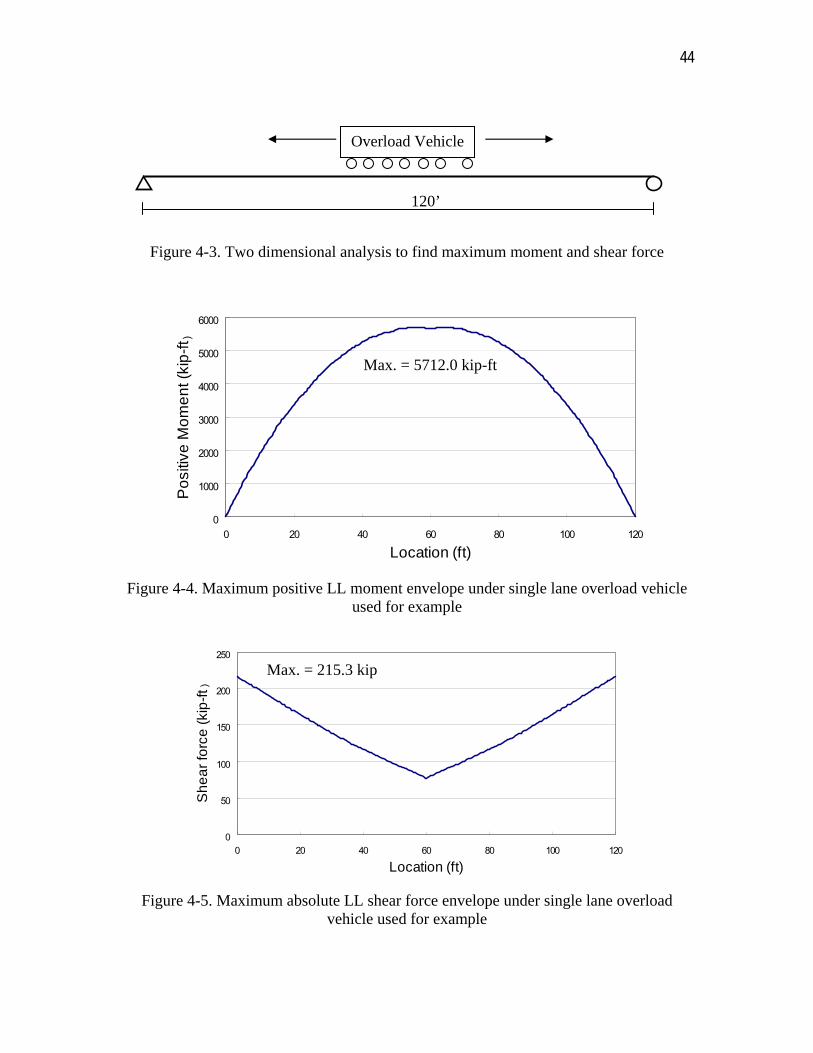
Figure 4-2. Configuration of single lane overload vehicle used for example analysis Step 1) Calculate axle loads of the overload vehicle The axle loads are shown in Figure 4-2 (b). Step 2) Perform 2 dimensional analysis to find maximum 2-dimensional moment and shear force The analysis was performed as shown in Figure 4-3. The axle loads shown in Figure 4-2 (b) were used for the analysis. The results of the analysis are shown in Figure 4-4 and Figure 4-5. The maximum moment induced in the bridge by the overload truck was 5712.0 kip-ft and the maximum shear force was 215.3 kips.
30k 30k 30k 30k 30k 30k 30k 30k 30k 30k 12k
40’ 9’ 9’ 9’ 12’ 4’ 4’ 4’ 4’ 4’
99’
40’ 9’ 9’ 9’ 12’ 4’ 4’ 4’ 4’ 4’
99’
8’
15k
15k
15k
15k
15k
15k
15k
15k
15k
15k
15k
15k
15k
15k
15k
15k
15k
15k
15k
15k
6k
6k
44
Figure 4-3. Two dimensional analysis to find maximum moment and shear force
0
1000
2000
3000
4000
5000
6000
0 20 40 60 80 100 120
Location (ft)
Po
sitiv
e M
om
en
t (ki
p-f
t )
Figure 4-4. Maximum positive LL moment envelope under single lane overload vehicle
used for example
0
50
100
150
200
250
0 20 40 60 80 100 120
Location (ft)
Sh
ea
r fo
rce
(ki
p-f
t )
Figure 4-5. Maximum absolute LL shear force envelope under single lane overload
vehicle used for example
Max. = 5712.0 kip-ft
Max. = 215.3 kip
Overload Vehicle
120’
45
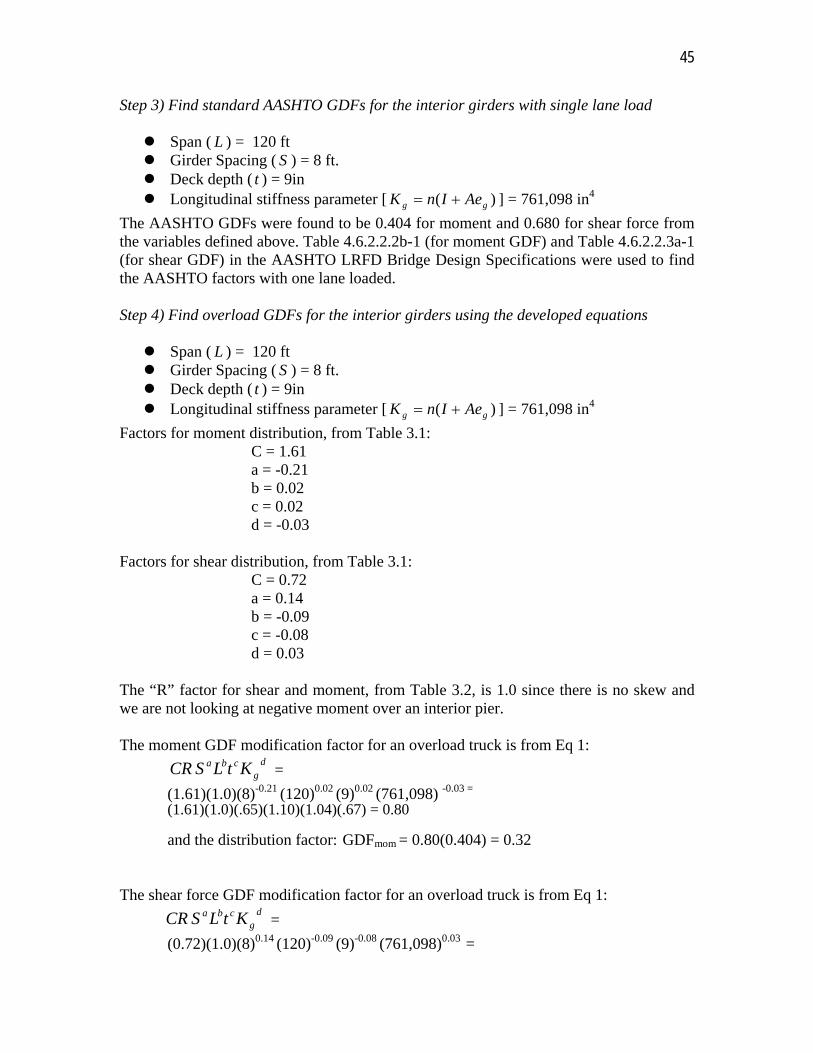
Step 3) Find standard AASHTO GDFs for the interior girders with single lane load Span ( L ) = 120 ft Girder Spacing ( S ) = 8 ft. Deck depth ( t ) = 9in Longitudinal stiffness parameter [ )( gg AeInK ] = 761,098 in4
The AASHTO GDFs were found to be 0.404 for moment and 0.680 for shear force from the variables defined above. Table 4.6.2.2.2b-1 (for moment GDF) and Table 4.6.2.2.3a-1 (for shear GDF) in the AASHTO LRFD Bridge Design Specifications were used to find the AASHTO factors with one lane loaded. Step 4) Find overload GDFs for the interior girders using the developed equations Span ( L ) = 120 ft Girder Spacing ( S ) = 8 ft. Deck depth ( t ) = 9in Longitudinal stiffness parameter [ )( gg AeInK ] = 761,098 in4
Factors for moment distribution, from Table 3.1: C = 1.61 a = -0.21 b = 0.02 c = 0.02 d = -0.03 Factors for shear distribution, from Table 3.1: C = 0.72 a = 0.14 b = -0.09 c = -0.08 d = 0.03 The “R” factor for shear and moment, from Table 3.2, is 1.0 since there is no skew and we are not looking at negative moment over an interior pier. The moment GDF modification factor for an overload truck is from Eq 1:
dg
cba KtLSCR =
(1.61)(1.0)(8)-0.21 (120)0.02 (9)0.02 (761,098) -0.03 =
(1.61)(1.0)(.65)(1.10)(1.04)(.67) = 0.80
and the distribution factor: GDFmom = 0.80(0.404) = 0.32
The shear force GDF modification factor for an overload truck is from Eq 1:
d
gcba KtLSCR =
(0.72)(1.0)(8)0.14 (120)-0.09 (9)-0.08 (761,098)0.03 =

46
(0.72)(1.0)(1.34)(0.65)(0.84)(1.50) = 0.79 and the distribution factor: GDFshear = 0.79(0.68) = 0.54 The overload GDFs for the interior girder were found to be 0.32 for moment and 0.54 for shear force using Equation 1. Step 5) Calculate maximum moment and shear force in an interior girder Maximum moment in an interior girder = (0.32) (5712.0 kip-ft) = 1839 kip-ft Maximum shear force in an interior girder = (0.54) (215.3 kips) = 115 kips Step 6) Check safety of the girder Use Strength II limit state to combine the maximum moment or shear force with all other loads to check safety of the interior girder as follows.
All other factored loads + (1.35)(Member force found in Step 5) ≤ Girder M Capacity
All other factored loads + (1.35)(Member force found in Step 5) ≤ Girder V Capacity
47
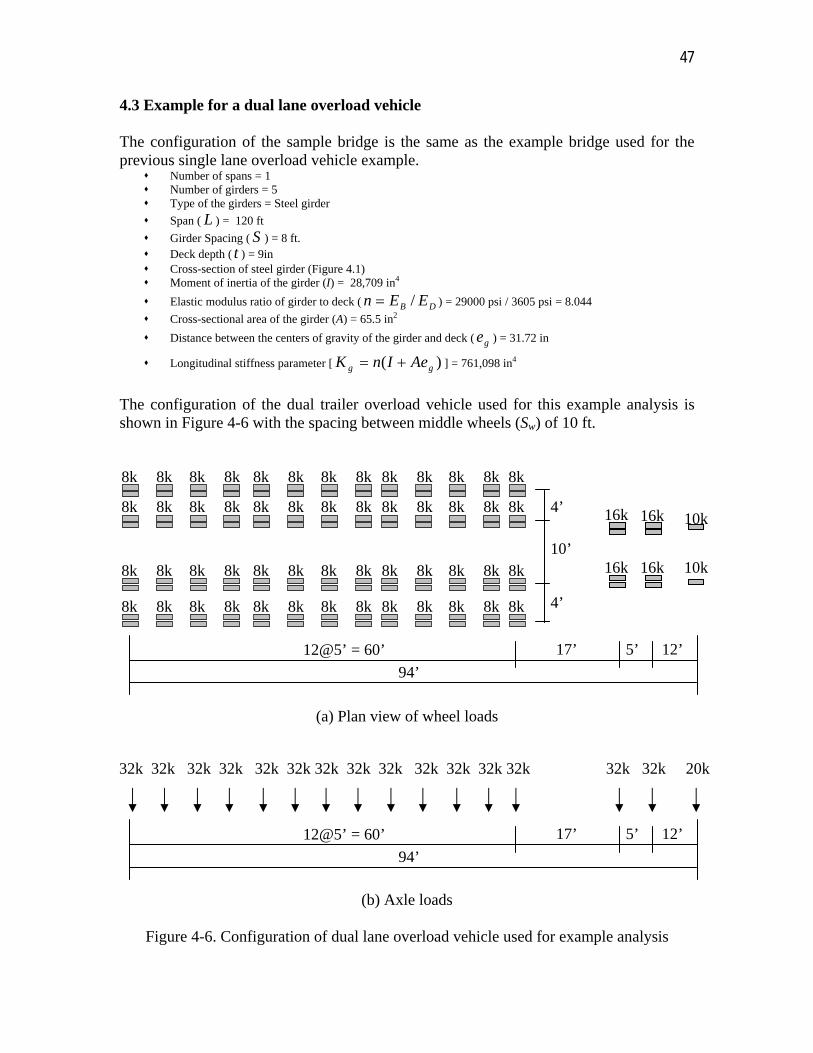
4.3 Example for a dual lane overload vehicle The configuration of the sample bridge is the same as the example bridge used for the previous single lane overload vehicle example.
Number of spans = 1 Number of girders = 5 Type of the girders = Steel girder
Span ( L ) = 120 ft
Girder Spacing ( S ) = 8 ft. Deck depth ( t ) = 9in Cross-section of steel girder (Figure 4.1) Moment of inertia of the girder (I) = 28,709 in4
Elastic modulus ratio of girder to deck ( DB EEn / ) = 29000 psi / 3605 psi = 8.044
Cross-sectional area of the girder (A) = 65.5 in2
Distance between the centers of gravity of the girder and deck ( ge ) = 31.72 in
Longitudinal stiffness parameter [ )( gg AeInK ] = 761,098 in4
The configuration of the dual trailer overload vehicle used for this example analysis is shown in Figure 4-6 with the spacing between middle wheels (Sw) of 10 ft.
(a) Plan view of wheel loads
(b) Axle loads
Figure 4-6. Configuration of dual lane overload vehicle used for example analysis
32k 32k 32k 32k 32k 32k 32k 32k 32k 32k 32k 32k 32k 32k 32k 20k
12@5’ = 60’ 17’ 5’ 12’
94’
8k
8k
8k
8k
8k
8k
8k
8k
8k
8k
8k
8k
8k
8k
8k
8k
8k
8k
8k
8k
8k
8k
8k
8k
8k
8k
8k
8k
8k
8k
8k
8k
8k
8k
8k
8k
8k
8k
8k
8k
8k
8k
8k
8k
8k
8k
8k
8k
8k
8k
8k
8k
16k
16k 16k
16k
10k
10k
12@5’ = 60’ 17’ 5’ 12’
94’
4’
4’
10’
48
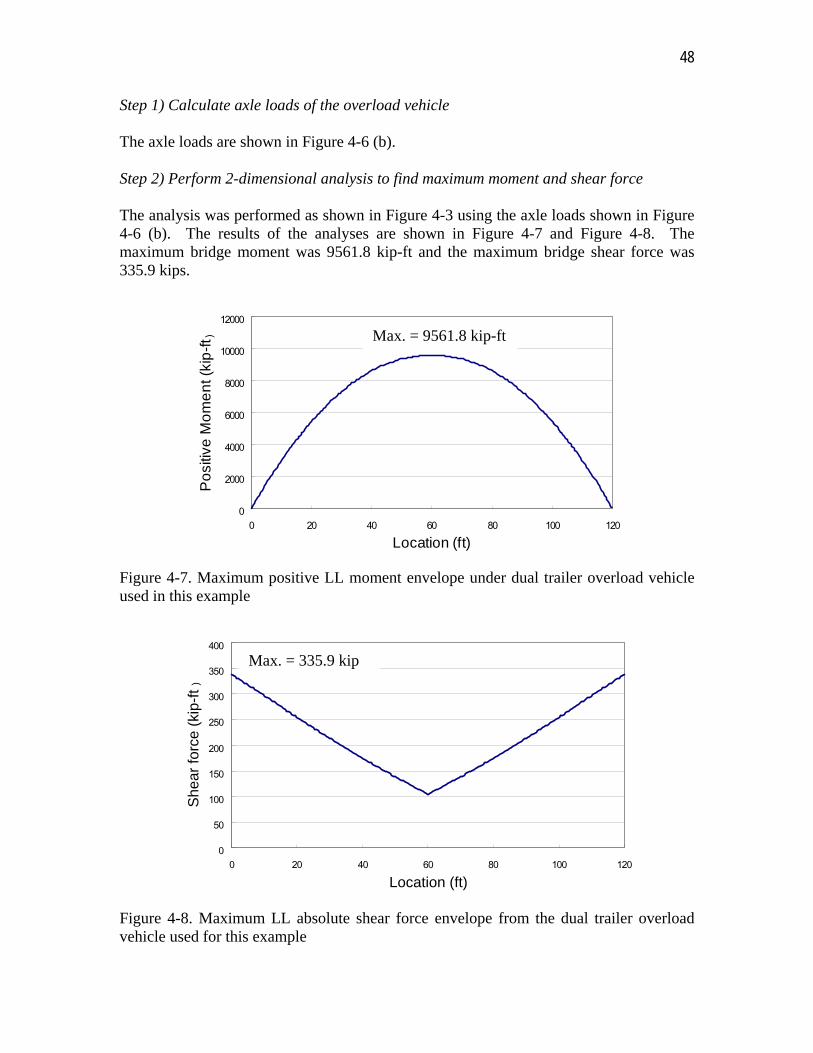
Step 1) Calculate axle loads of the overload vehicle The axle loads are shown in Figure 4-6 (b). Step 2) Perform 2-dimensional analysis to find maximum moment and shear force The analysis was performed as shown in Figure 4-3 using the axle loads shown in Figure 4-6 (b). The results of the analyses are shown in Figure 4-7 and Figure 4-8. The maximum bridge moment was 9561.8 kip-ft and the maximum bridge shear force was 335.9 kips.
0
2000
4000
6000
8000
10000
12000
0 20 40 60 80 100 120
Location (ft)
Po
sitiv
e M
om
en
t (ki
p-f
t )
Figure 4-7. Maximum positive LL moment envelope under dual trailer overload vehicle used in this example
0
50
100
150
200
250
300
350
400
0 20 40 60 80 100 120
Location (ft)
She
ar fo
rce
(ki
p-ft
)
Figure 4-8. Maximum LL absolute shear force envelope from the dual trailer overload vehicle used for this example
Max. = 9561.8 kip-ft
Max. = 335.9 kip

49
Step 3) Find AASHTO GDFs for the interior girders, two lanes loaded Span ( L ) = 120 ft Girder Spacing ( S ) = 8 ft. Deck depth ( t ) = 9in Longitudinal stiffness parameter [ )( gg AeInK ] = 761,098 in4
The AASHTO GDFs were found to be 0.583 for moment and 0.814 for shear force from the variables defined above. Table 4.6.2.2.2b-1 (for moment GDF) and Table 4.6.2.2.3a-1 (for shear GDF) with “two or more lanes loaded” were used from AASHTO. Step 4) Find overload GDFs for the interior girders using the developed equations Span ( L ) = 120 ft Girder Spacing ( S ) = 8 ft. Deck depth ( t ) = 9 in Longitudinal stiffness parameter [ )( gg AeInK ] = 761,098 in4
Spacing of center wheels ( wS ) = 10 ft
Factors for two lane moment distribution, from Table 3.1: C = 1.70 a = -0.22 b = 0.04 c = 0.19 d = -.08 e = -0.14 Factors for two lane shear distribution, from Table 3.1: C = 2.03 a = 0.06 b = -0.25 c = -0.12 d = 0.03 e = -0.28 The “R” factor for shear and moment, from Table 3.2, is 1.0 since there is no skew and we are not looking at negative moment over an interior pier. The moment GDF modification factor for an overload truck with Sw of 10ft is from Eq 1:
e
wd
gcba SKtLSCR =
(1.70)(1.0)(8)-0.22 (120)0.04 (9)0.19 (761,098) -0.08 (10)-0.14 =
(1.70)(1.0)(.63)(1.21)(1.52)(.34)(.97) = 0.49
and the distribution factor: GDFmom = 0.49(0.583) = 0.28

50
The shear force GDF modification factor for an overload truck is from Eq 1:
e
wd
gcba SKtLSCR =
(2.03)(1.0)(8)0.06 (120)-0.25 (9)-0.12 (761,098)0.03(10)-0.28 = (2.03)(1.0)(1.13)(0.30)(0.77)(1.50)(0.52) = 0.41 and the distribution factor: GDFshear = 0.41(0.814) = 0.34 The overload GDFs for an interior girder were found to be 0.28 for moment and 0.34 for shear force using Equation 2 for the dual lane two trailer loading. Step 5) Calculate maximum moment and shear force at the interior girder Maximum LL moment in the interior girder = (0.28) (9561.8 kip-ft) = 2706kip-ft Maximum LL shear force in the interior girder = (0.34) (335.9 kips) = 115 kips Step 6) Check safety of the girder Use Strength II limit state to combine the maximum moment or shear force with all other loads to check safety of the interior girder as follows.
All other factored loads + (1.35)(Member force found in Step 5) ≤ Girder Capacity
All other factored loads + (1.35)(Member force found in Step 5) ≤ Girder Capacity
51
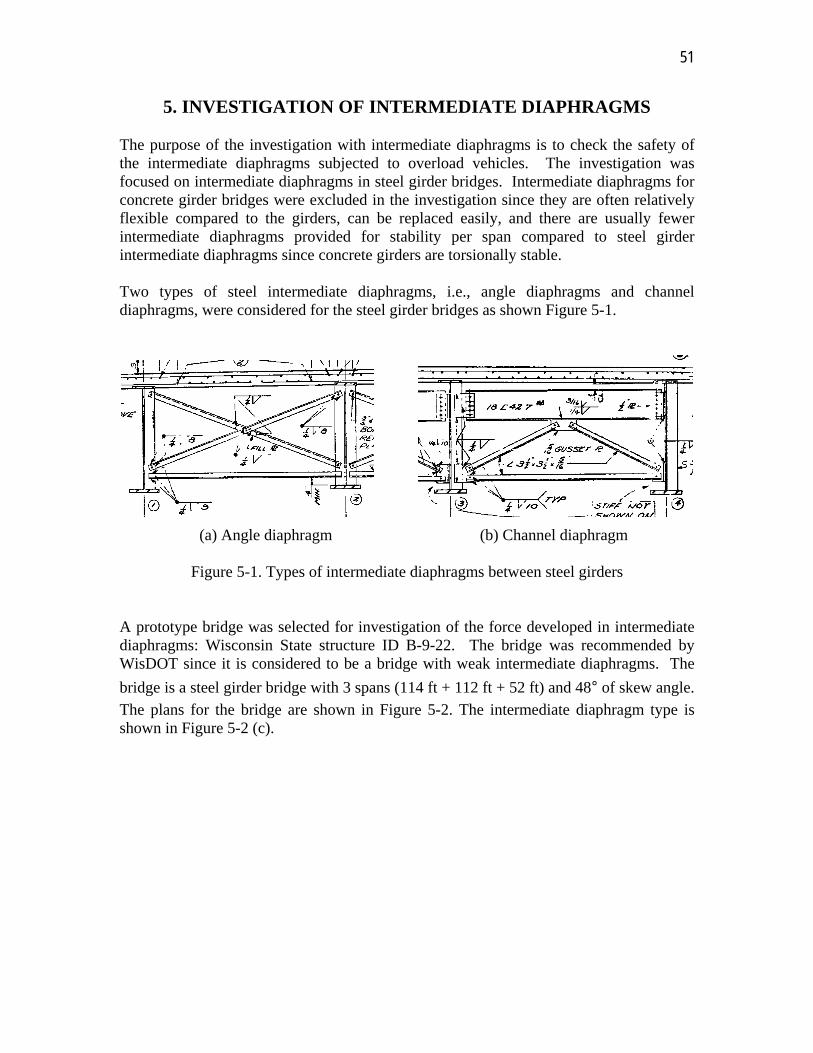
5. INVESTIGATION OF INTERMEDIATE DIAPHRAGMS The purpose of the investigation with intermediate diaphragms is to check the safety of the intermediate diaphragms subjected to overload vehicles. The investigation was focused on intermediate diaphragms in steel girder bridges. Intermediate diaphragms for concrete girder bridges were excluded in the investigation since they are often relatively flexible compared to the girders, can be replaced easily, and there are usually fewer intermediate diaphragms provided for stability per span compared to steel girder intermediate diaphragms since concrete girders are torsionally stable. Two types of steel intermediate diaphragms, i.e., angle diaphragms and channel diaphragms, were considered for the steel girder bridges as shown Figure 5-1.
(a) Angle diaphragm (b) Channel diaphragm
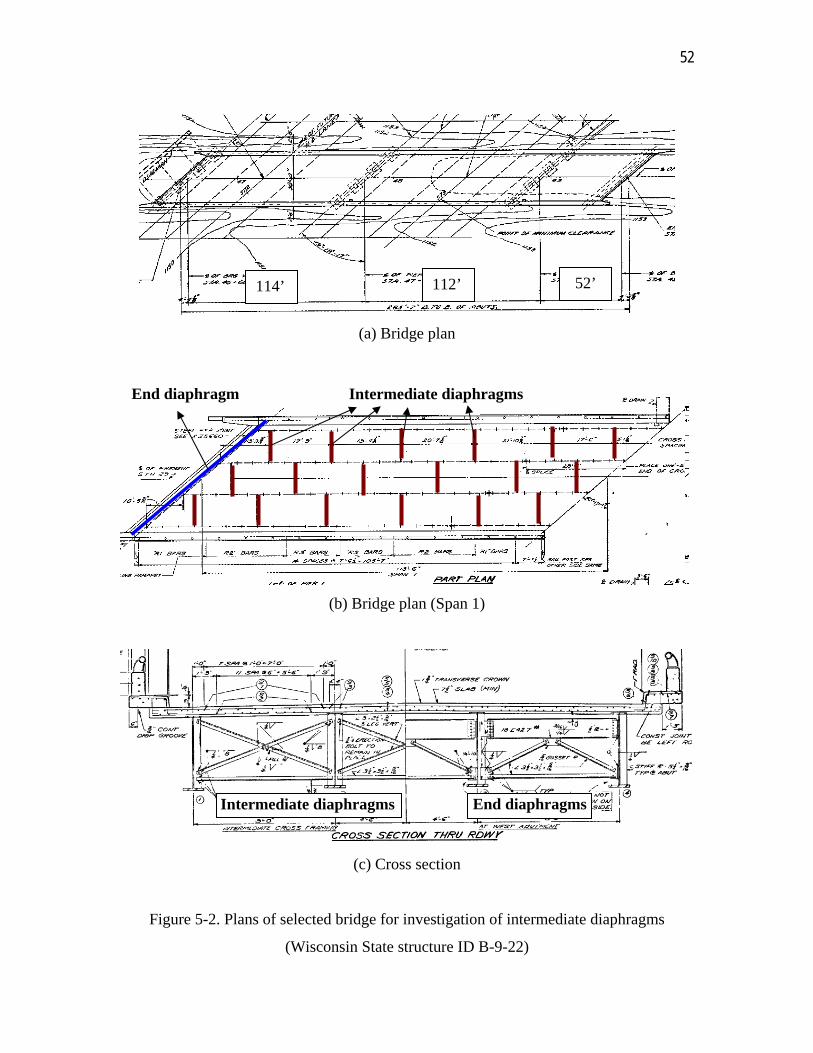
Figure 5-1. Types of intermediate diaphragms between steel girders A prototype bridge was selected for investigation of the force developed in intermediate diaphragms: Wisconsin State structure ID B-9-22. The bridge was recommended by WisDOT since it is considered to be a bridge with weak intermediate diaphragms. The
bridge is a steel girder bridge with 3 spans (114 ft + 112 ft + 52 ft) and 48° of skew angle.
The plans for the bridge are shown in Figure 5-2. The intermediate diaphragm type is shown in Figure 5-2 (c).
52
(a) Bridge plan
(b) Bridge plan (Span 1)
(c) Cross section
Figure 5-2. Plans of selected bridge for investigation of intermediate diaphragms
(Wisconsin State structure ID B-9-22)
114’ 112’ 52’
End diaphragm Intermediate diaphragms
Intermediate diaphragms End diaphragms
53
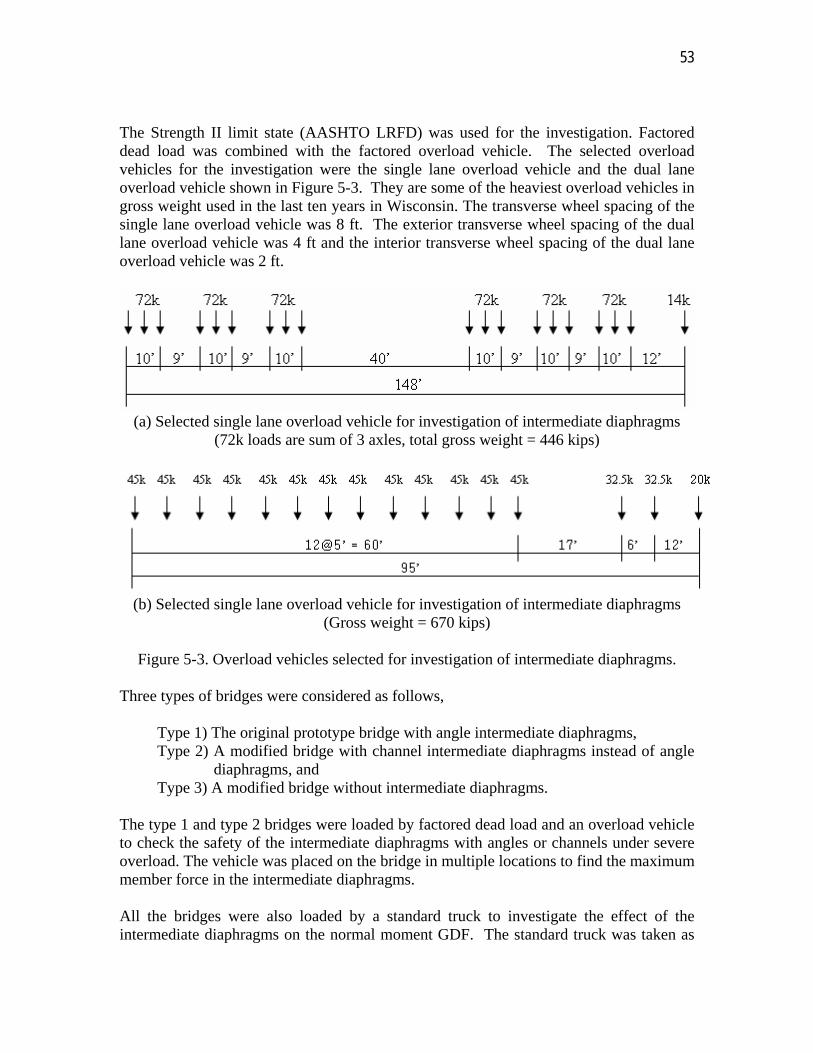
The Strength II limit state (AASHTO LRFD) was used for the investigation. Factored dead load was combined with the factored overload vehicle. The selected overload vehicles for the investigation were the single lane overload vehicle and the dual lane overload vehicle shown in Figure 5-3. They are some of the heaviest overload vehicles in gross weight used in the last ten years in Wisconsin. The transverse wheel spacing of the single lane overload vehicle was 8 ft. The exterior transverse wheel spacing of the dual lane overload vehicle was 4 ft and the interior transverse wheel spacing of the dual lane overload vehicle was 2 ft.
(a) Selected single lane overload vehicle for investigation of intermediate diaphragms
(72k loads are sum of 3 axles, total gross weight = 446 kips)
(b) Selected single lane overload vehicle for investigation of intermediate diaphragms
(Gross weight = 670 kips)
Figure 5-3. Overload vehicles selected for investigation of intermediate diaphragms. Three types of bridges were considered as follows,
Type 1) The original prototype bridge with angle intermediate diaphragms, Type 2) A modified bridge with channel intermediate diaphragms instead of angle
diaphragms, and Type 3) A modified bridge without intermediate diaphragms.
The type 1 and type 2 bridges were loaded by factored dead load and an overload vehicle to check the safety of the intermediate diaphragms with angles or channels under severe overload. The vehicle was placed on the bridge in multiple locations to find the maximum member force in the intermediate diaphragms. All the bridges were also loaded by a standard truck to investigate the effect of the intermediate diaphragms on the normal moment GDF. The standard truck was taken as
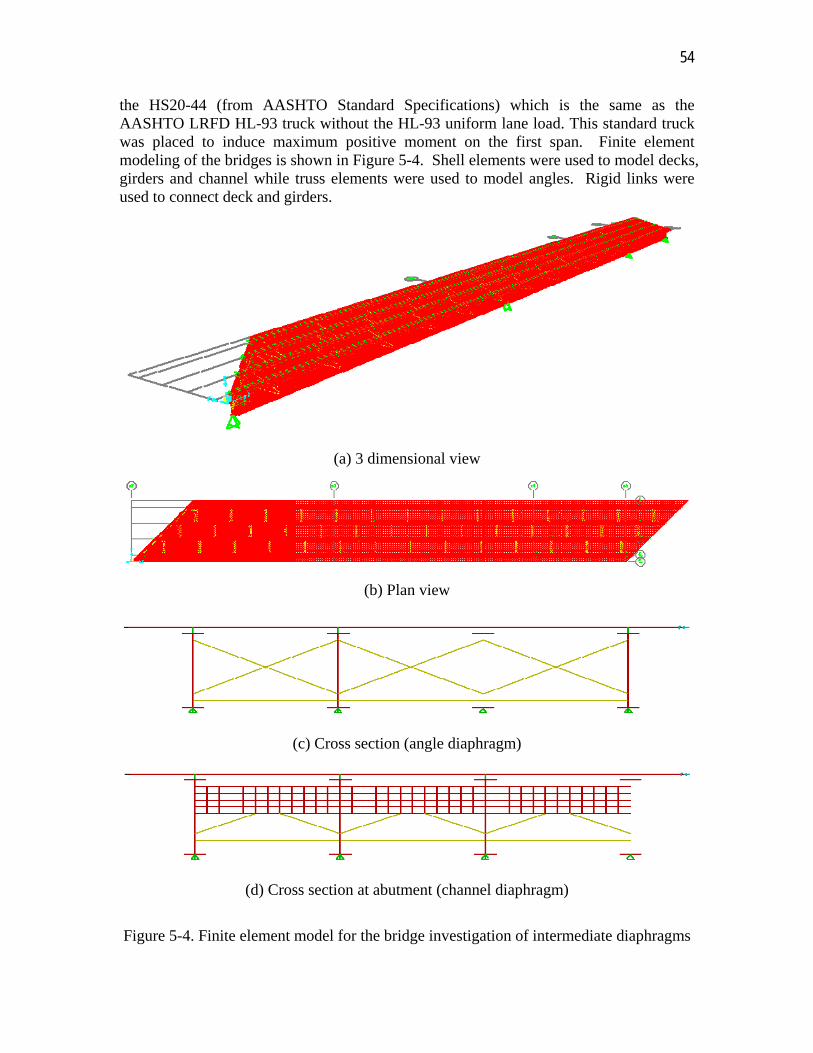
54
the HS20-44 (from AASHTO Standard Specifications) which is the same as the AASHTO LRFD HL-93 truck without the HL-93 uniform lane load. This standard truck was placed to induce maximum positive moment on the first span. Finite element modeling of the bridges is shown in Figure 5-4. Shell elements were used to model decks, girders and channel while truss elements were used to model angles. Rigid links were used to connect deck and girders.
(a) 3 dimensional view
(b) Plan view
(c) Cross section (angle diaphragm)
(d) Cross section at abutment (channel diaphragm)
Figure 5-4. Finite element model for the bridge investigation of intermediate diaphragms
55
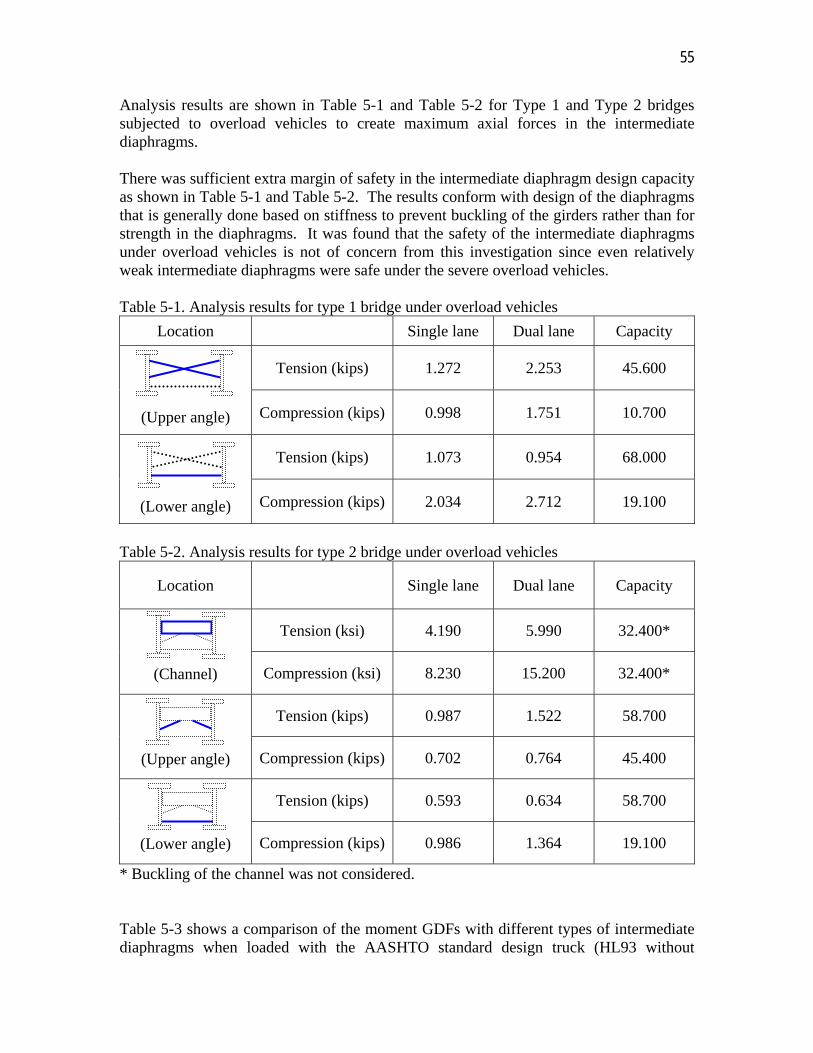
Analysis results are shown in Table 5-1 and Table 5-2 for Type 1 and Type 2 bridges subjected to overload vehicles to create maximum axial forces in the intermediate diaphragms. There was sufficient extra margin of safety in the intermediate diaphragm design capacity as shown in Table 5-1 and Table 5-2. The results conform with design of the diaphragms that is generally done based on stiffness to prevent buckling of the girders rather than for strength in the diaphragms. It was found that the safety of the intermediate diaphragms under overload vehicles is not of concern from this investigation since even relatively weak intermediate diaphragms were safe under the severe overload vehicles. Table 5-1. Analysis results for type 1 bridge under overload vehicles
Location Single lane Dual lane Capacity
(Upper angle)
Tension (kips) 1.272 2.253 45.600
Compression (kips) 0.998 1.751 10.700
(Lower angle)
Tension (kips) 1.073 0.954 68.000
Compression (kips) 2.034 2.712 19.100
Table 5-2. Analysis results for type 2 bridge under overload vehicles
Location Single lane Dual lane Capacity
(Channel)
Tension (ksi) 4.190 5.990 32.400*
Compression (ksi) 8.230 15.200 32.400*
(Upper angle)
Tension (kips) 0.987 1.522 58.700
Compression (kips) 0.702 0.764 45.400
(Lower angle)
Tension (kips) 0.593 0.634 58.700
Compression (kips) 0.986 1.364 19.100
* Buckling of the channel was not considered.
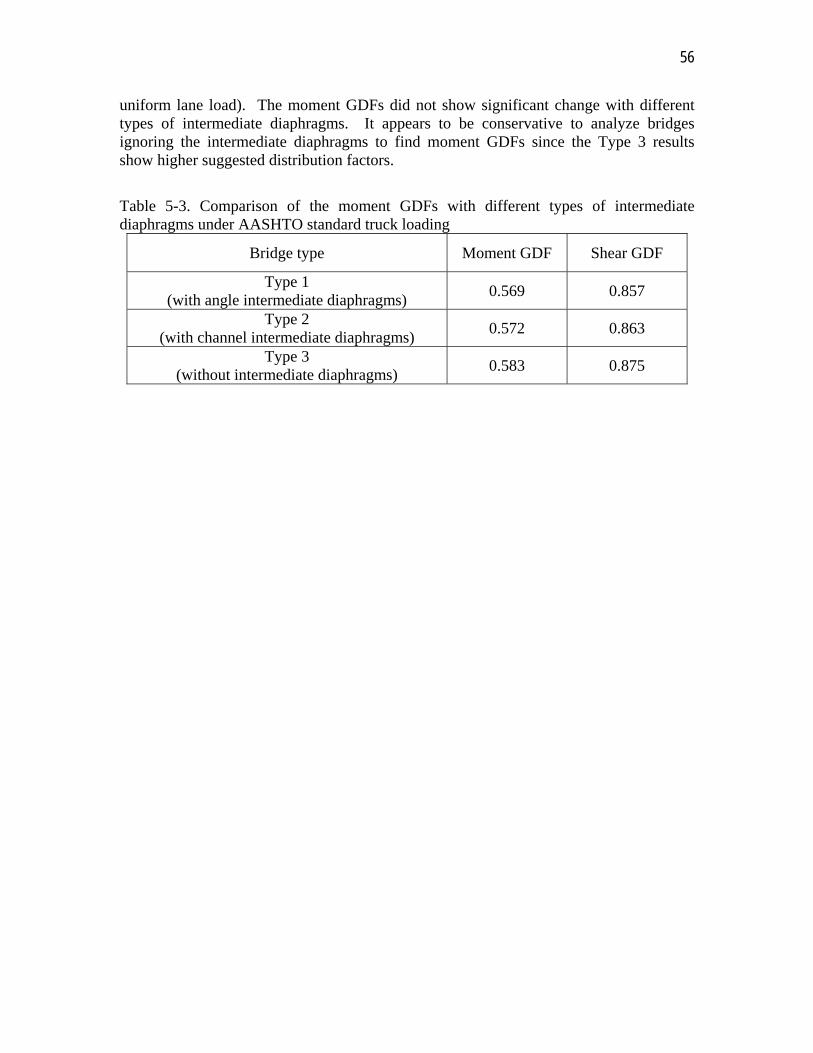
Table 5-3 shows a comparison of the moment GDFs with different types of intermediate diaphragms when loaded with the AASHTO standard design truck (HL93 without
56
uniform lane load). The moment GDFs did not show significant change with different types of intermediate diaphragms. It appears to be conservative to analyze bridges ignoring the intermediate diaphragms to find moment GDFs since the Type 3 results show higher suggested distribution factors.
Table 5-3. Comparison of the moment GDFs with different types of intermediate diaphragms under AASHTO standard truck loading
Bridge type Moment GDF Shear GDF
Type 1 (with angle intermediate diaphragms)
0.569 0.857
Type 2 (with channel intermediate diaphragms)
0.572 0.863
Type 3 (without intermediate diaphragms)
0.583 0.875
57
6. INVESTIGATION OF DECKS Two types of failure, i.e. punching failure and flexural failure, need to be considered for investigating loading of decks on multi-girder bridges. Shear and punching failure is not usually included in designing decks according to AASHTO LRFD (C4.6.2.1.6). Overload vehicles may, however, have closer longitudinal or transverse wheel spacing compared to the AASHTO standard truck with 32k axles. It is, therefore, suggested that consideration be given to the wheel spacing of the overload vehicles when checking safety of the bridge for punching failure of the deck. The closer wheel spacing of the overload vehicles may induce premature punching failure and the weight of the single wheel of an overload vehicle might be limited to ensure safety of the deck in punching. An equation to limit non-factored weight of a single wheel set of an overload vehicle to ensure safety of the deck for punching failure is developed as shown in Equation 3. The equation reflects an interpolation between the condition with a single wheel set and two wheel sets spaced 6ft apart as in the AASHTO design truck.
DTpunchingall PkkP 21_ 5.1 (3)
where punchingallP _ = Allowable non-factored single wheel load for overload vehicle only considering punching failure of deck.
1k = A factor related to minimum longitudinal wheel spacing of overload vehicle
= 1.0 (when ft61 S ) , 12
61 S (when ft61 S )
2k = A factor related to minimum transverse wheel spacing of overload vehicle
= 1.0 (when ft62 S ) , 12
62 S (when ft62 S )
1S = Minimum longitudinal wheel spacing of overload vehicle (ft)
2S = Minimum transverse wheel spacing of overload vehicle (ft)
DTP = Maximum non-factored single wheel load of design truck (for HL93 and HS20:
DTP = 16 kips) The constant ‘1.5’ in equation (3) is used to consider the difference of the dynamic allowance (33% for AASHTO standard HL-93 trucks and 0% for overload vehicle) and load factor (1.75 for AASHTO standard trucks and 1.35 for overload vehicle). [(1.33)(1.75)/(1.35)] is equal to 1.72 and it is reduced to ‘1.5’ for safety. The variables k1 and k2 in equation (3) are used to consider reduction of punching capacity of the deck when the minimum wheel spacing of the overload vehicle is closer than the minimum wheel spacing of the AASHTO standard truck.
58
Flexural failure is considered in design of decks subjected to AASHTO HL-93 standard truck loads using the strip method (AASHTO LRFD T4.6.2.1.3-1). A strip of the deck is considered to resist a single axle load. Overload vehicles may, however, have closer transverse wheel spacing compared to the AASHTO standard truck and it is required to consider the wheel spacing of the overload vehicles when checking safety of the bridge for flexural failure of the deck. The AASHTO LRFD Appendix A-4 moments should not be used. The longitudinal wheel spacing of the AASHTO standard truck is generally wider than the AASHTO equivalent strip width, while the longitudinal wheel spacing of the overload vehicle may be narrower than the AASHTO equivalent strip. Steps to determine flexural strength:
Perform moment analysis on the transverse deck strip under a line of the overload vehicle’s axles.
Select the max + and - LL moments. Combine the LL moments and DL moments using Strength 2 load factors. Do not add dynamic allowance to the LL. Design the strip (AASHTO LRFD T4.6.2.1.3-1) for the combined factored LL
and DL moments. If the truck axle spacing is greater than the AASHTO T4.6.2.1.3-1 strip width use that width. If the truck axle spacing, S1, is less than the AASHTO strip width use S1 as the effective strip width.
Deck analysis should be combined with the additional analyses described in this project to ensure safety of the entire bridge.
59
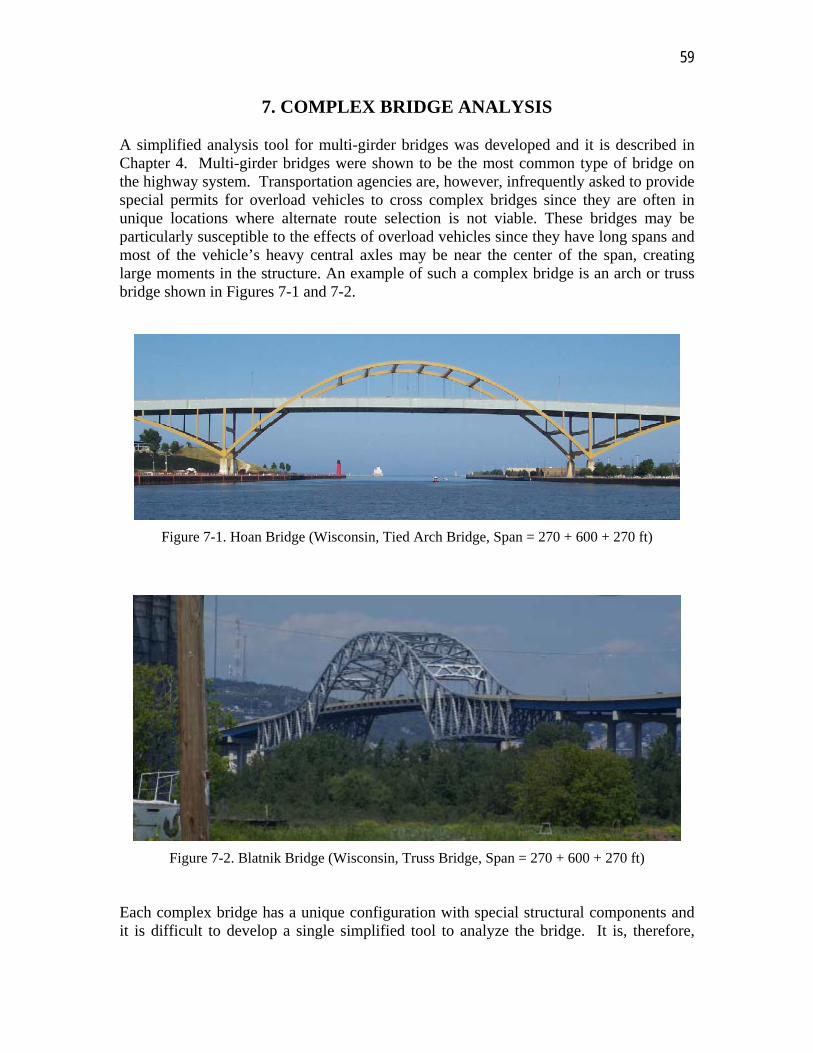
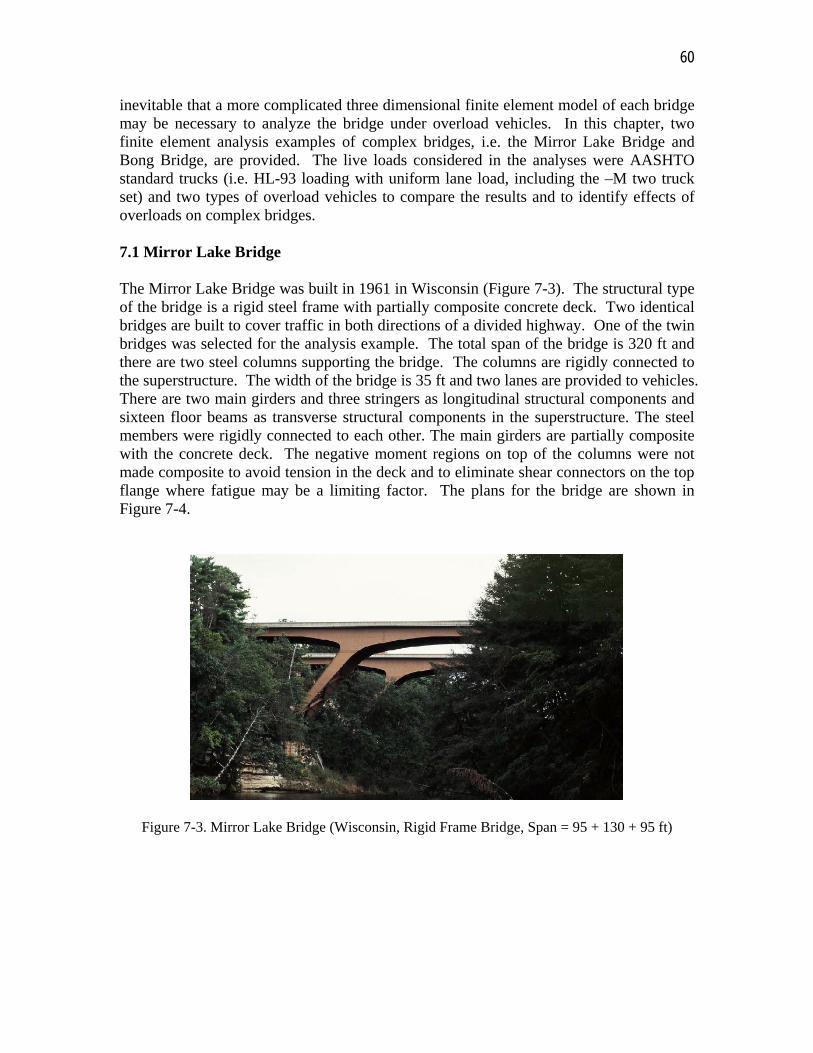
7. COMPLEX BRIDGE ANALYSIS A simplified analysis tool for multi-girder bridges was developed and it is described in Chapter 4. Multi-girder bridges were shown to be the most common type of bridge on the highway system. Transportation agencies are, however, infrequently asked to provide special permits for overload vehicles to cross complex bridges since they are often in unique locations where alternate route selection is not viable. These bridges may be particularly susceptible to the effects of overload vehicles since they have long spans and most of the vehicle’s heavy central axles may be near the center of the span, creating large moments in the structure. An example of such a complex bridge is an arch or truss bridge shown in Figures 7-1 and 7-2.
Figure 7-1. Hoan Bridge (Wisconsin, Tied Arch Bridge, Span = 270 + 600 + 270 ft)
Figure 7-2. Blatnik Bridge (Wisconsin, Truss Bridge, Span = 270 + 600 + 270 ft) Each complex bridge has a unique configuration with special structural components and it is difficult to develop a single simplified tool to analyze the bridge. It is, therefore,
60
inevitable that a more complicated three dimensional finite element model of each bridge may be necessary to analyze the bridge under overload vehicles. In this chapter, two finite element analysis examples of complex bridges, i.e. the Mirror Lake Bridge and Bong Bridge, are provided. The live loads considered in the analyses were AASHTO standard trucks (i.e. HL-93 loading with uniform lane load, including the –M two truck set) and two types of overload vehicles to compare the results and to identify effects of overloads on complex bridges. 7.1 Mirror Lake Bridge The Mirror Lake Bridge was built in 1961 in Wisconsin (Figure 7-3). The structural type of the bridge is a rigid steel frame with partially composite concrete deck. Two identical bridges are built to cover traffic in both directions of a divided highway. One of the twin bridges was selected for the analysis example. The total span of the bridge is 320 ft and there are two steel columns supporting the bridge. The columns are rigidly connected to the superstructure. The width of the bridge is 35 ft and two lanes are provided to vehicles. There are two main girders and three stringers as longitudinal structural components and sixteen floor beams as transverse structural components in the superstructure. The steel members were rigidly connected to each other. The main girders are partially composite with the concrete deck. The negative moment regions on top of the columns were not made composite to avoid tension in the deck and to eliminate shear connectors on the top flange where fatigue may be a limiting factor. The plans for the bridge are shown in Figure 7-4.
Figure 7-3. Mirror Lake Bridge (Wisconsin, Rigid Frame Bridge, Span = 95 + 130 + 95 ft)
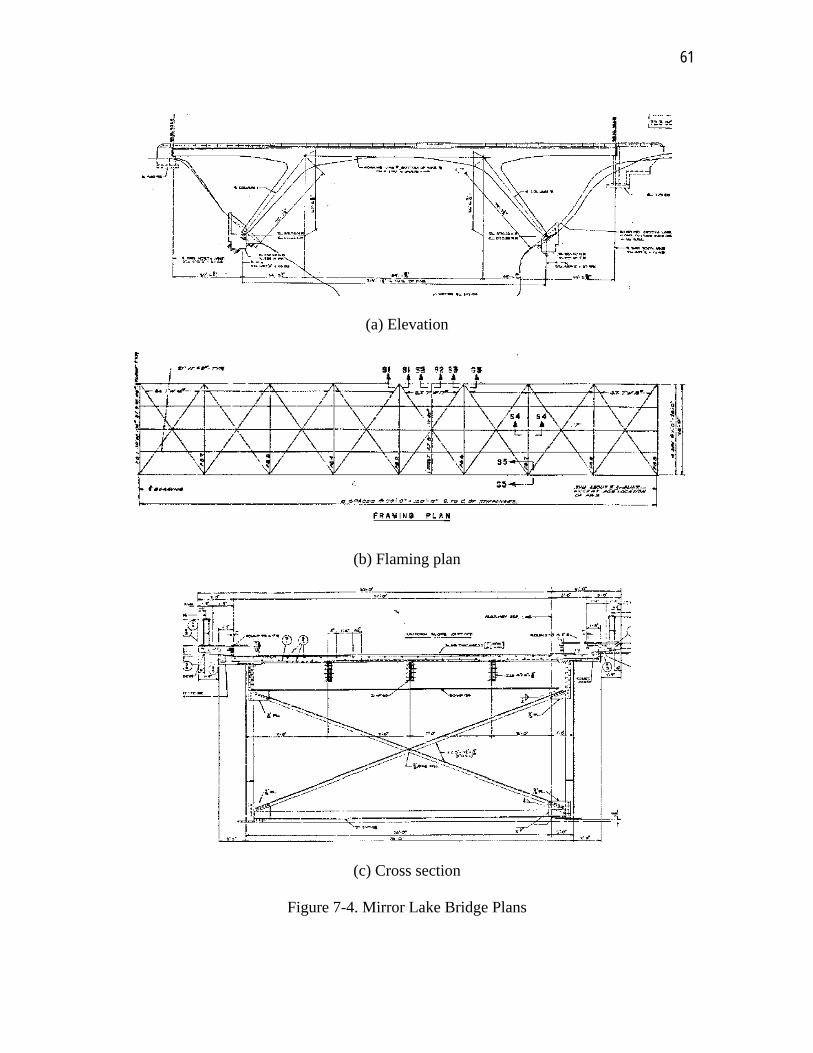
61
(a) Elevation
(b) Flaming plan
(c) Cross section
Figure 7-4. Mirror Lake Bridge Plans
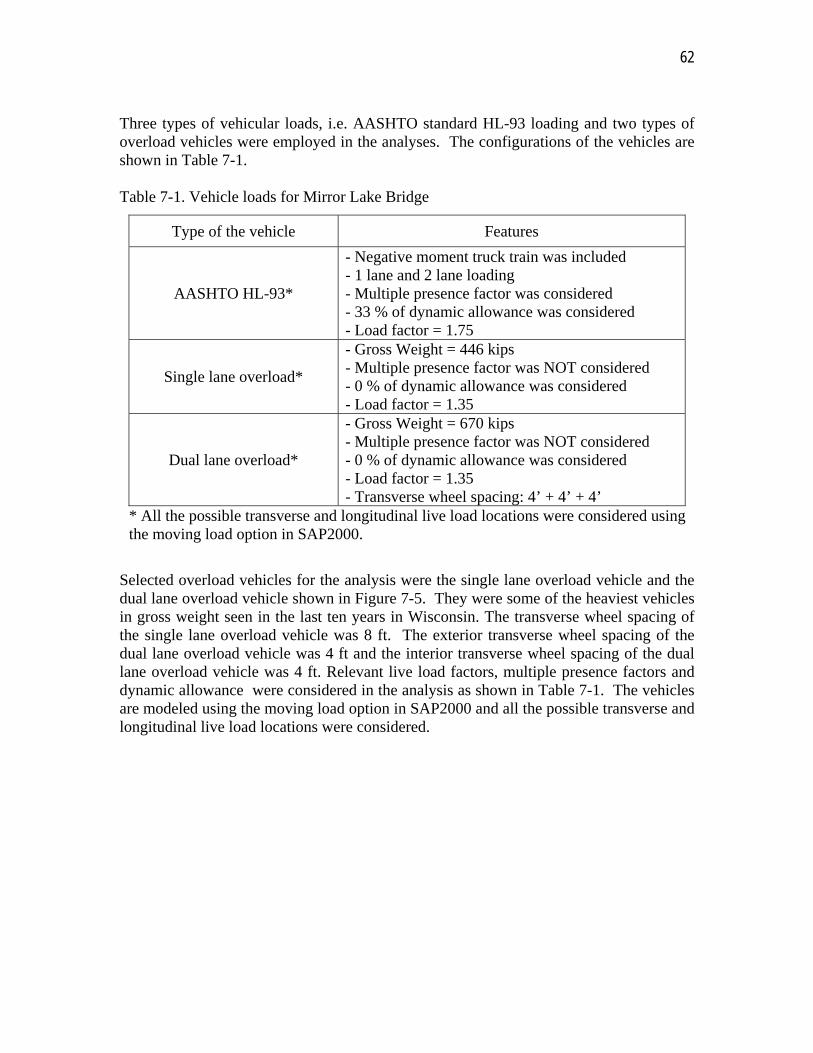
62
Three types of vehicular loads, i.e. AASHTO standard HL-93 loading and two types of overload vehicles were employed in the analyses. The configurations of the vehicles are shown in Table 7-1. Table 7-1. Vehicle loads for Mirror Lake Bridge
Type of the vehicle Features
AASHTO HL-93*
- Negative moment truck train was included - 1 lane and 2 lane loading - Multiple presence factor was considered - 33 % of dynamic allowance was considered - Load factor = 1.75
Single lane overload*
- Gross Weight = 446 kips - Multiple presence factor was NOT considered - 0 % of dynamic allowance was considered - Load factor = 1.35
Dual lane overload*
- Gross Weight = 670 kips - Multiple presence factor was NOT considered - 0 % of dynamic allowance was considered - Load factor = 1.35 - Transverse wheel spacing: 4’ + 4’ + 4’
* All the possible transverse and longitudinal live load locations were considered using the moving load option in SAP2000.
Selected overload vehicles for the analysis were the single lane overload vehicle and the dual lane overload vehicle shown in Figure 7-5. They were some of the heaviest vehicles in gross weight seen in the last ten years in Wisconsin. The transverse wheel spacing of the single lane overload vehicle was 8 ft. The exterior transverse wheel spacing of the dual lane overload vehicle was 4 ft and the interior transverse wheel spacing of the dual lane overload vehicle was 4 ft. Relevant live load factors, multiple presence factors and dynamic allowance were considered in the analysis as shown in Table 7-1. The vehicles are modeled using the moving load option in SAP2000 and all the possible transverse and longitudinal live load locations were considered.
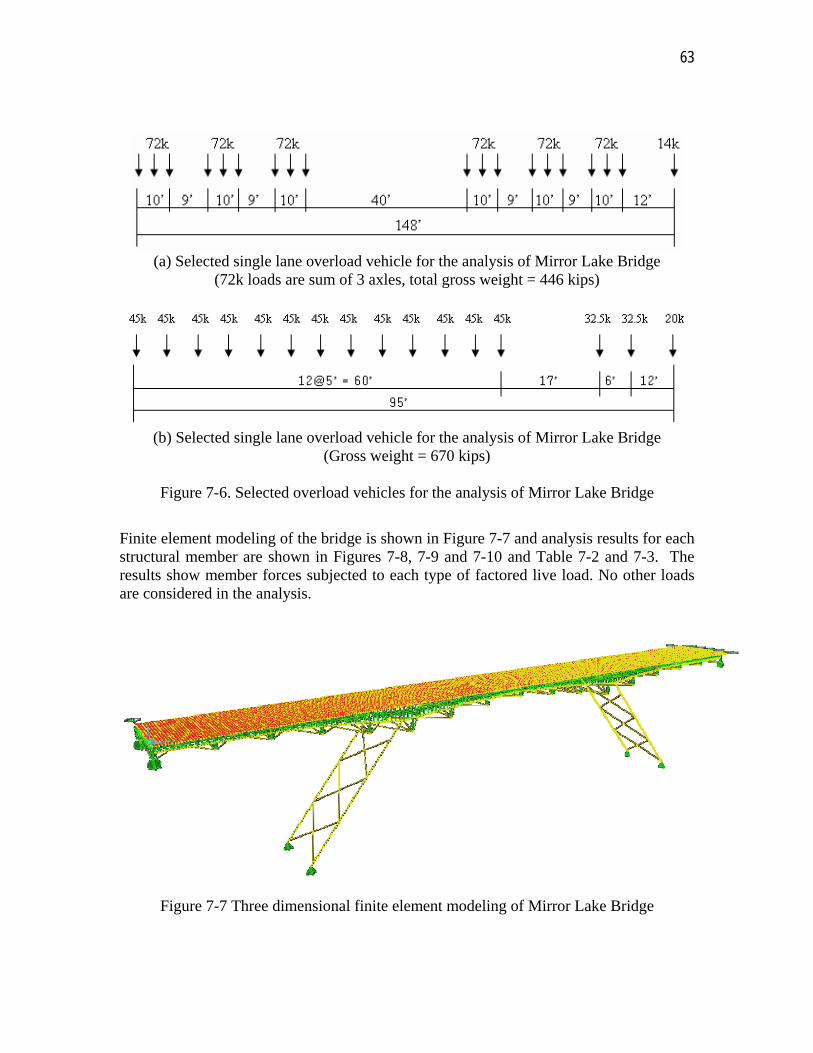
63
(a) Selected single lane overload vehicle for the analysis of Mirror Lake Bridge
(72k loads are sum of 3 axles, total gross weight = 446 kips)
(b) Selected single lane overload vehicle for the analysis of Mirror Lake Bridge
(Gross weight = 670 kips)
Figure 7-6. Selected overload vehicles for the analysis of Mirror Lake Bridge
Finite element modeling of the bridge is shown in Figure 7-7 and analysis results for each structural member are shown in Figures 7-8, 7-9 and 7-10 and Table 7-2 and 7-3. The results show member forces subjected to each type of factored live load. No other loads are considered in the analysis.
Figure 7-7 Three dimensional finite element modeling of Mirror Lake Bridge
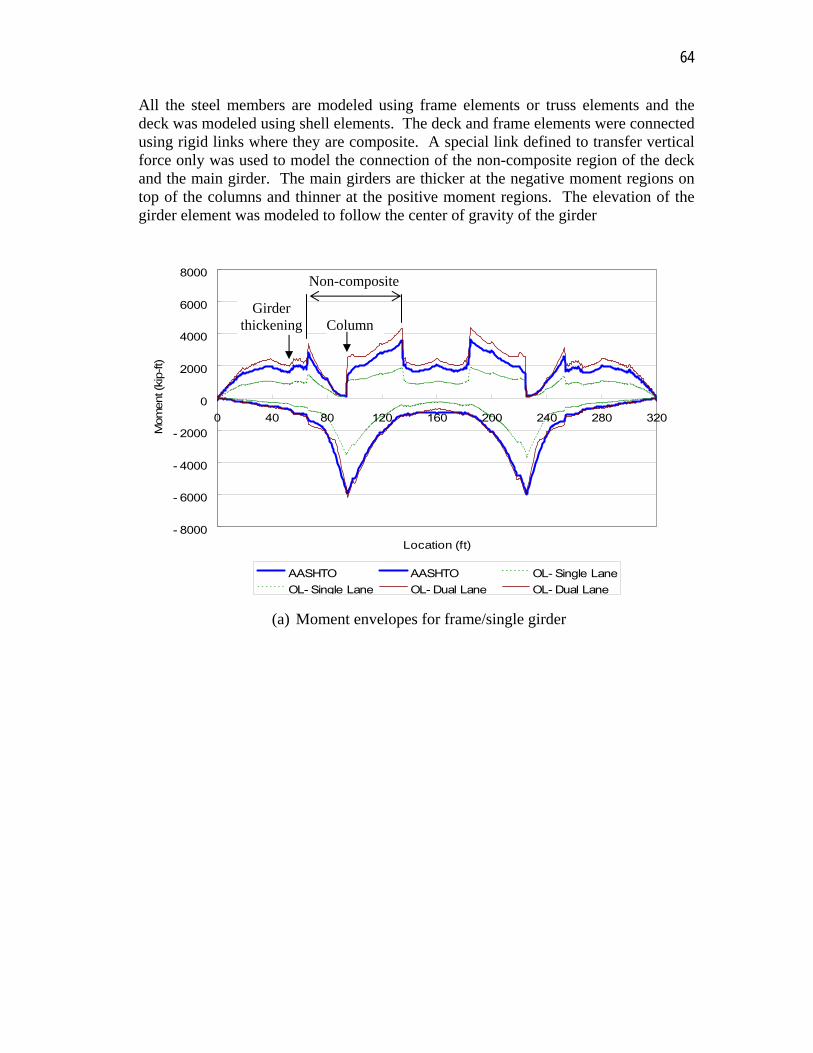
64
All the steel members are modeled using frame elements or truss elements and the deck was modeled using shell elements. The deck and frame elements were connected using rigid links where they are composite. A special link defined to transfer vertical force only was used to model the connection of the non-composite region of the deck and the main girder. The main girders are thicker at the negative moment regions on top of the columns and thinner at the positive moment regions. The elevation of the girder element was modeled to follow the center of gravity of the girder
- 8000
- 6000
- 4000
- 2000
0
2000
4000
6000
8000
0 40 80 120 160 200 240 280 320
Location (ft)
Mom
ent (
kip-ft)
AASHTO AASHTO OL- Single LaneOL- Single Lane OL- Dual Lane OL- Dual Lane
(a) Moment envelopes for frame/single girder
Girder thickening Column
Non-composite
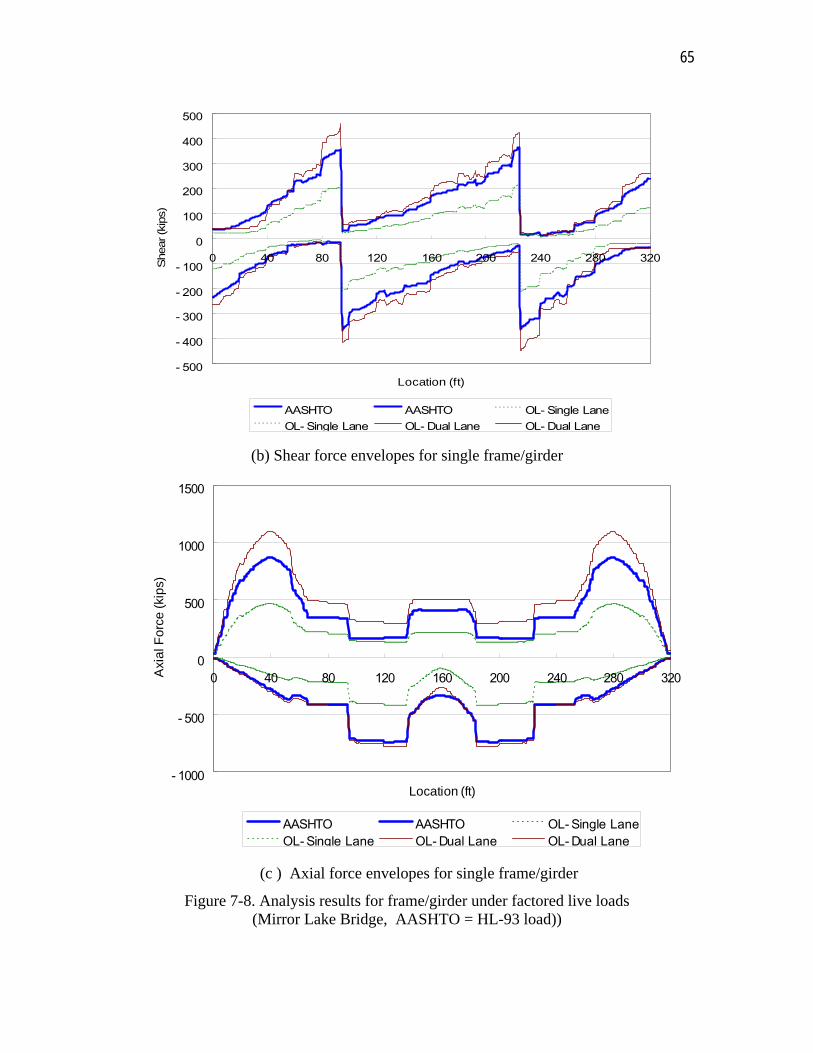
65
- 500
- 400
- 300
- 200
- 100
0
100
200
300
400
500
0 40 80 120 160 200 240 280 320
Location (ft)
Shear (k
ips)
AASHTO AASHTO OL- Single LaneOL- Single Lane OL- Dual Lane OL- Dual Lane
(b) Shear force envelopes for single frame/girder
- 1000
- 500
0
500
1000
1500
0 40 80 120 160 200 240 280 320
Location (ft)
Axi
al F
orc
e (
kip
s)
AASHTO AASHTO OL- Single LaneOL- Single Lane OL- Dual Lane OL- Dual Lane
(c ) Axial force envelopes for single frame/girder
Figure 7-8. Analysis results for frame/girder under factored live loads (Mirror Lake Bridge, AASHTO = HL-93 load))
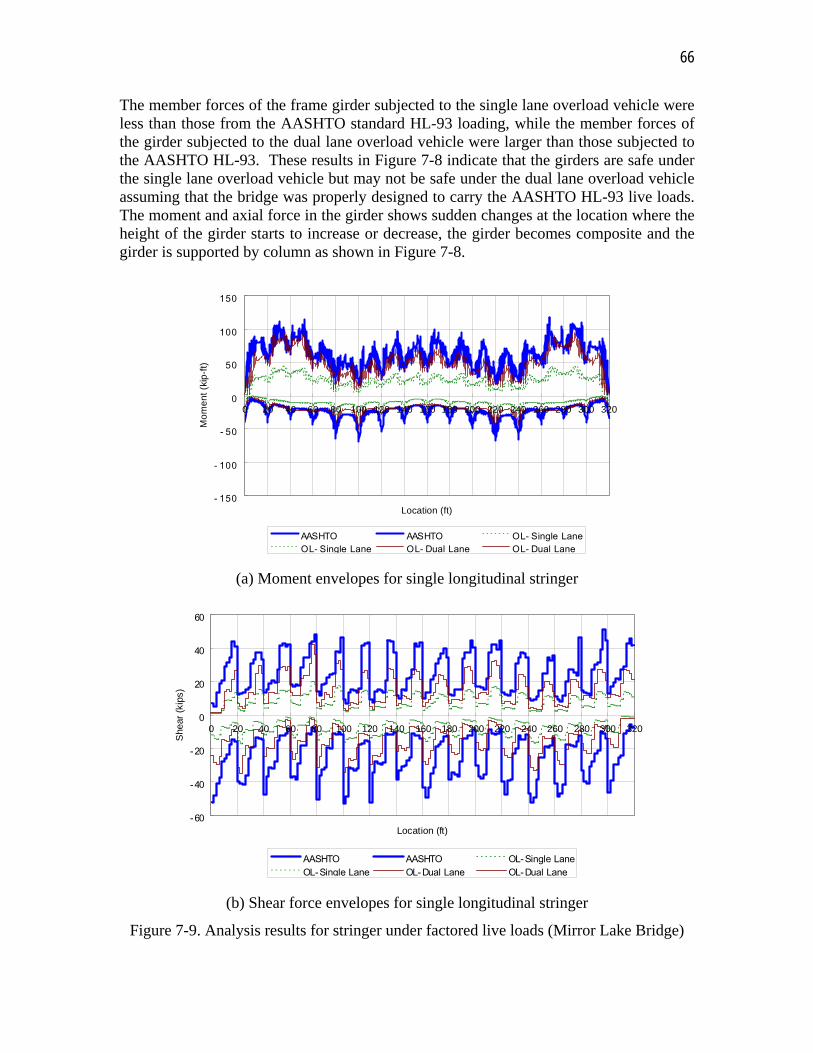
66
The member forces of the frame girder subjected to the single lane overload vehicle were less than those from the AASHTO standard HL-93 loading, while the member forces of the girder subjected to the dual lane overload vehicle were larger than those subjected to the AASHTO HL-93. These results in Figure 7-8 indicate that the girders are safe under the single lane overload vehicle but may not be safe under the dual lane overload vehicle assuming that the bridge was properly designed to carry the AASHTO HL-93 live loads. The moment and axial force in the girder shows sudden changes at the location where the height of the girder starts to increase or decrease, the girder becomes composite and the girder is supported by column as shown in Figure 7-8.
- 150
- 100
- 50
0
50
100
150
0 20 40 60 80 100 120 140 160 180 200 220 240 260 280 300 320
Location (ft)
Mo
me
nt
(kip
-ft)
AASHTO AASHTO OL- Single LaneOL- Single Lane OL- Dual Lane OL- Dual Lane
(a) Moment envelopes for single longitudinal stringer
-60
-40
-20
0
20
40
60
0 20 40 60 80 100 120 140 160 180 200 220 240 260 280 300 320
Location (ft)
She
ar (
kips
)
AASHTO AASHTO OL-Single LaneOL-Single Lane OL-Dual Lane OL-Dual Lane
(b) Shear force envelopes for single longitudinal stringer
Figure 7-9. Analysis results for stringer under factored live loads (Mirror Lake Bridge)
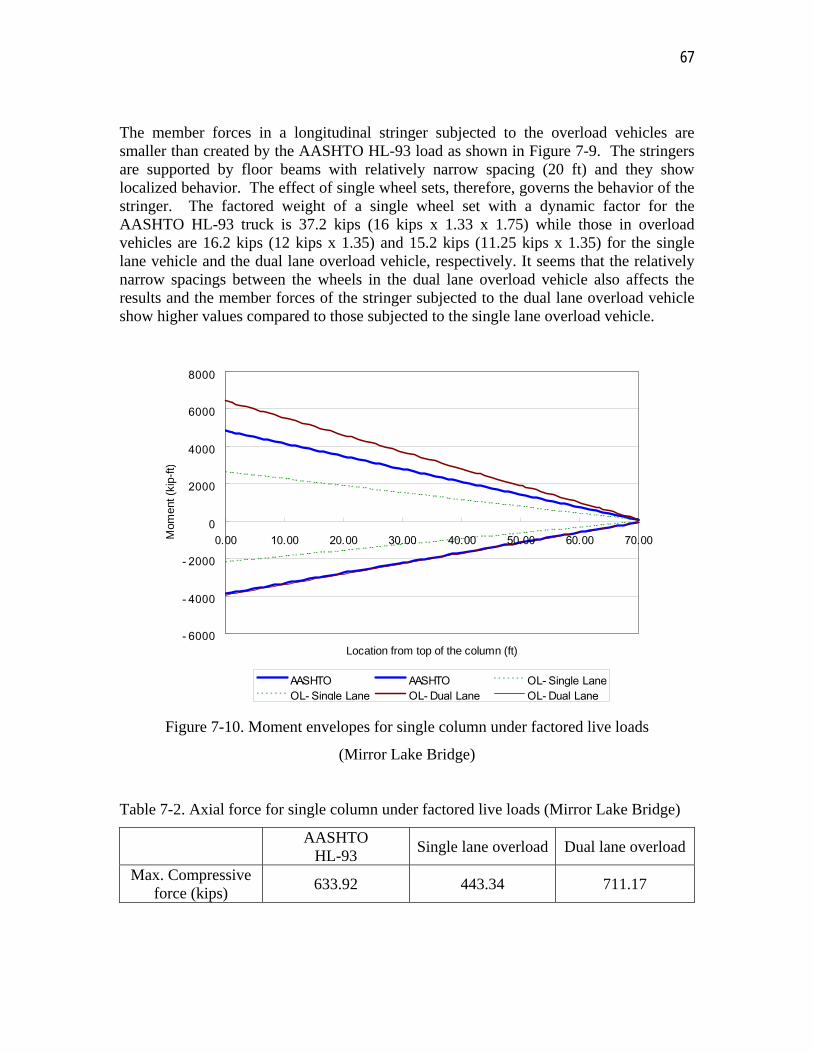
67
The member forces in a longitudinal stringer subjected to the overload vehicles are smaller than created by the AASHTO HL-93 load as shown in Figure 7-9. The stringers are supported by floor beams with relatively narrow spacing (20 ft) and they show localized behavior. The effect of single wheel sets, therefore, governs the behavior of the stringer. The factored weight of a single wheel set with a dynamic factor for the AASHTO HL-93 truck is 37.2 kips (16 kips x 1.33 x 1.75) while those in overload vehicles are 16.2 kips (12 kips x 1.35) and 15.2 kips (11.25 kips x 1.35) for the single lane vehicle and the dual lane overload vehicle, respectively. It seems that the relatively narrow spacings between the wheels in the dual lane overload vehicle also affects the results and the member forces of the stringer subjected to the dual lane overload vehicle show higher values compared to those subjected to the single lane overload vehicle.
- 6000
- 4000
- 2000
0
2000
4000
6000
8000
0.00 10.00 20.00 30.00 40.00 50.00 60.00 70.00
Location from top of the column (ft)
Mom
ent (
kip-
ft)
AASHTO AASHTO OL- Single LaneOL- Single Lane OL- Dual Lane OL- Dual Lane
Figure 7-10. Moment envelopes for single column under factored live loads
(Mirror Lake Bridge)
Table 7-2. Axial force for single column under factored live loads (Mirror Lake Bridge)
AASHTO
HL-93 Single lane overload Dual lane overload
Max. Compressive force (kips)
633.92 443.34 711.17
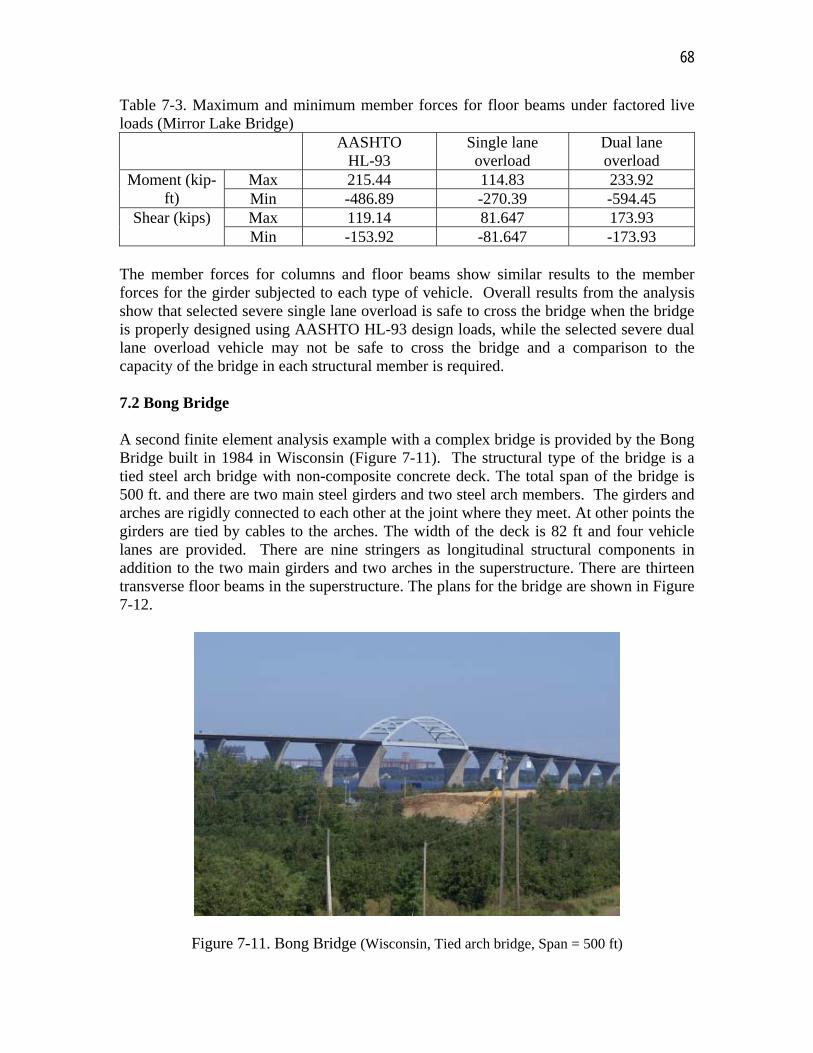
68
Table 7-3. Maximum and minimum member forces for floor beams under factored live loads (Mirror Lake Bridge)
AASHTO HL-93
Single lane overload
Dual lane overload
Moment (kip-ft)
Max 215.44 114.83 233.92 Min -486.89 -270.39 -594.45
Shear (kips) Max 119.14 81.647 173.93 Min -153.92 -81.647 -173.93
The member forces for columns and floor beams show similar results to the member forces for the girder subjected to each type of vehicle. Overall results from the analysis show that selected severe single lane overload is safe to cross the bridge when the bridge is properly designed using AASHTO HL-93 design loads, while the selected severe dual lane overload vehicle may not be safe to cross the bridge and a comparison to the capacity of the bridge in each structural member is required. 7.2 Bong Bridge A second finite element analysis example with a complex bridge is provided by the Bong Bridge built in 1984 in Wisconsin (Figure 7-11). The structural type of the bridge is a tied steel arch bridge with non-composite concrete deck. The total span of the bridge is 500 ft. and there are two main steel girders and two steel arch members. The girders and arches are rigidly connected to each other at the joint where they meet. At other points the girders are tied by cables to the arches. The width of the deck is 82 ft and four vehicle lanes are provided. There are nine stringers as longitudinal structural components in addition to the two main girders and two arches in the superstructure. There are thirteen transverse floor beams in the superstructure. The plans for the bridge are shown in Figure 7-12.
Figure 7-11. Bong Bridge (Wisconsin, Tied arch bridge, Span = 500 ft)
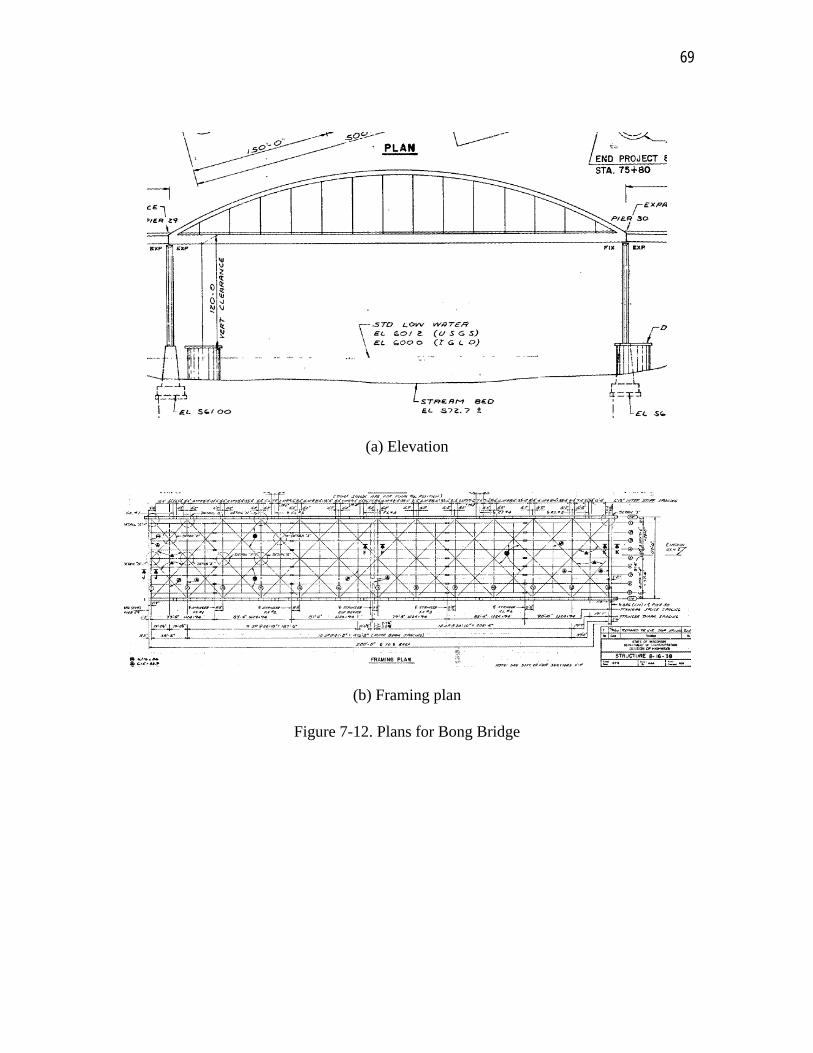
69
(a) Elevation
(b) Framing plan
Figure 7-12. Plans for Bong Bridge
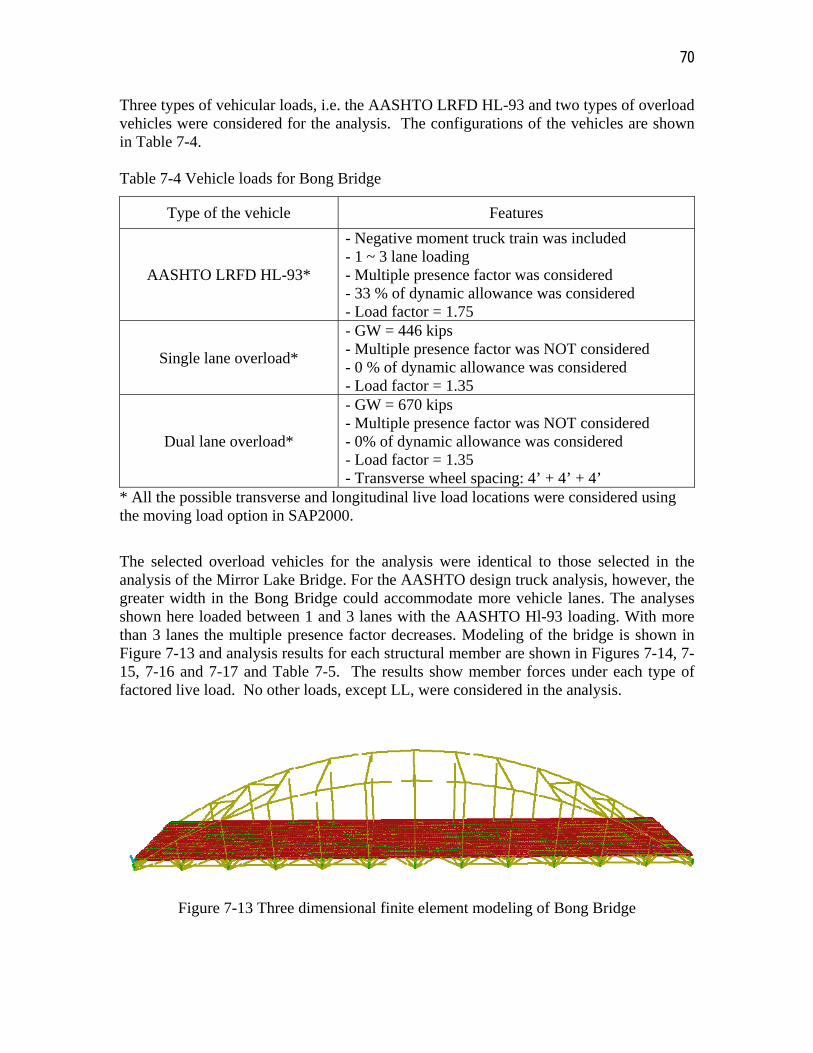
70
Three types of vehicular loads, i.e. the AASHTO LRFD HL-93 and two types of overload vehicles were considered for the analysis. The configurations of the vehicles are shown in Table 7-4. Table 7-4 Vehicle loads for Bong Bridge
Type of the vehicle Features
AASHTO LRFD HL-93*
- Negative moment truck train was included - 1 ~ 3 lane loading - Multiple presence factor was considered - 33 % of dynamic allowance was considered - Load factor = 1.75
Single lane overload*
- GW = 446 kips - Multiple presence factor was NOT considered - 0 % of dynamic allowance was considered - Load factor = 1.35
Dual lane overload*
- GW = 670 kips - Multiple presence factor was NOT considered - 0% of dynamic allowance was considered - Load factor = 1.35 - Transverse wheel spacing: 4’ + 4’ + 4’
* All the possible transverse and longitudinal live load locations were considered using the moving load option in SAP2000.
The selected overload vehicles for the analysis were identical to those selected in the analysis of the Mirror Lake Bridge. For the AASHTO design truck analysis, however, the greater width in the Bong Bridge could accommodate more vehicle lanes. The analyses shown here loaded between 1 and 3 lanes with the AASHTO Hl-93 loading. With more than 3 lanes the multiple presence factor decreases. Modeling of the bridge is shown in Figure 7-13 and analysis results for each structural member are shown in Figures 7-14, 7-15, 7-16 and 7-17 and Table 7-5. The results show member forces under each type of factored live load. No other loads, except LL, were considered in the analysis.
Figure 7-13 Three dimensional finite element modeling of Bong Bridge
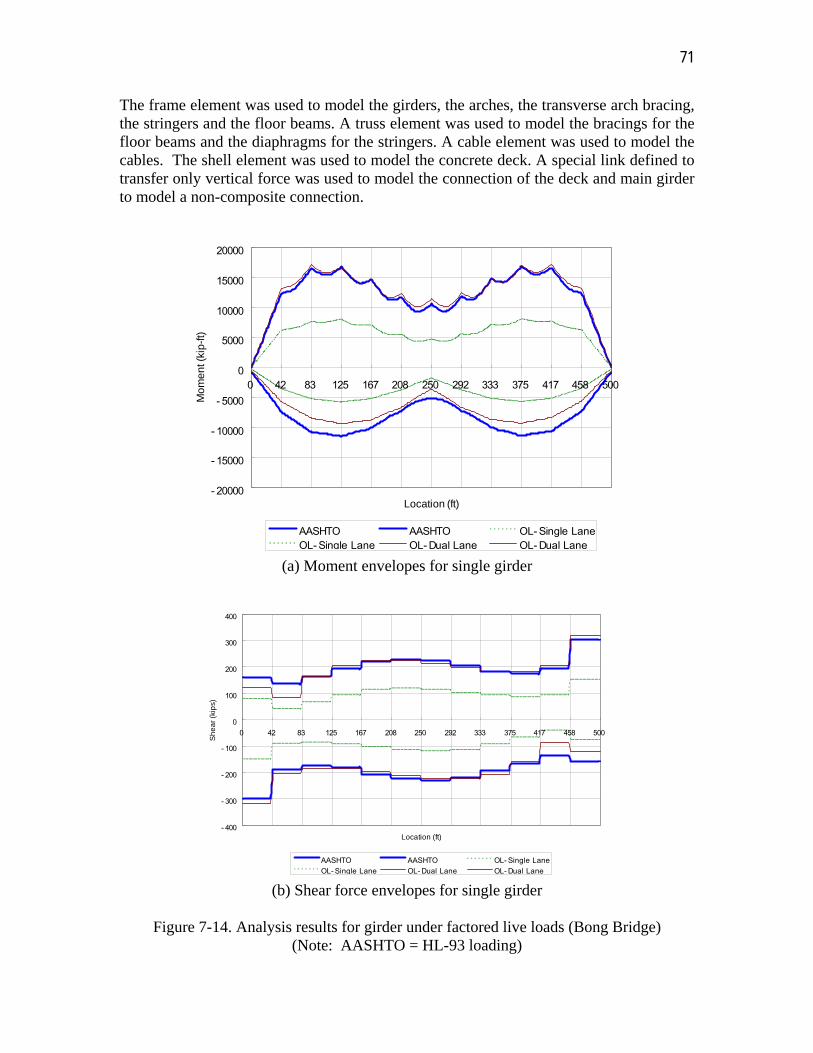
71
The frame element was used to model the girders, the arches, the transverse arch bracing, the stringers and the floor beams. A truss element was used to model the bracings for the floor beams and the diaphragms for the stringers. A cable element was used to model the cables. The shell element was used to model the concrete deck. A special link defined to transfer only vertical force was used to model the connection of the deck and main girder to model a non-composite connection.
- 20000
- 15000
- 10000
- 5000
0
5000
10000
15000
20000
0 42 83 125 167 208 250 292 333 375 417 458 500
Location (ft)
Mo
me
nt (
kip-
ft)
AASHTO AASHTO OL- Single LaneOL- Single Lane OL- Dual Lane OL- Dual Lane
(a) Moment envelopes for single girder
- 400
- 300
- 200
- 100
0
100
200
300
400
0 42 83 125 167 208 250 292 333 375 417 458 500
Location (ft)
Sh
ea
r (k
ips)
AASHTO AASHTO OL- Single LaneOL- Single Lane OL- Dual Lane OL- Dual Lane
(b) Shear force envelopes for single girder
Figure 7-14. Analysis results for girder under factored live loads (Bong Bridge) (Note: AASHTO = HL-93 loading)
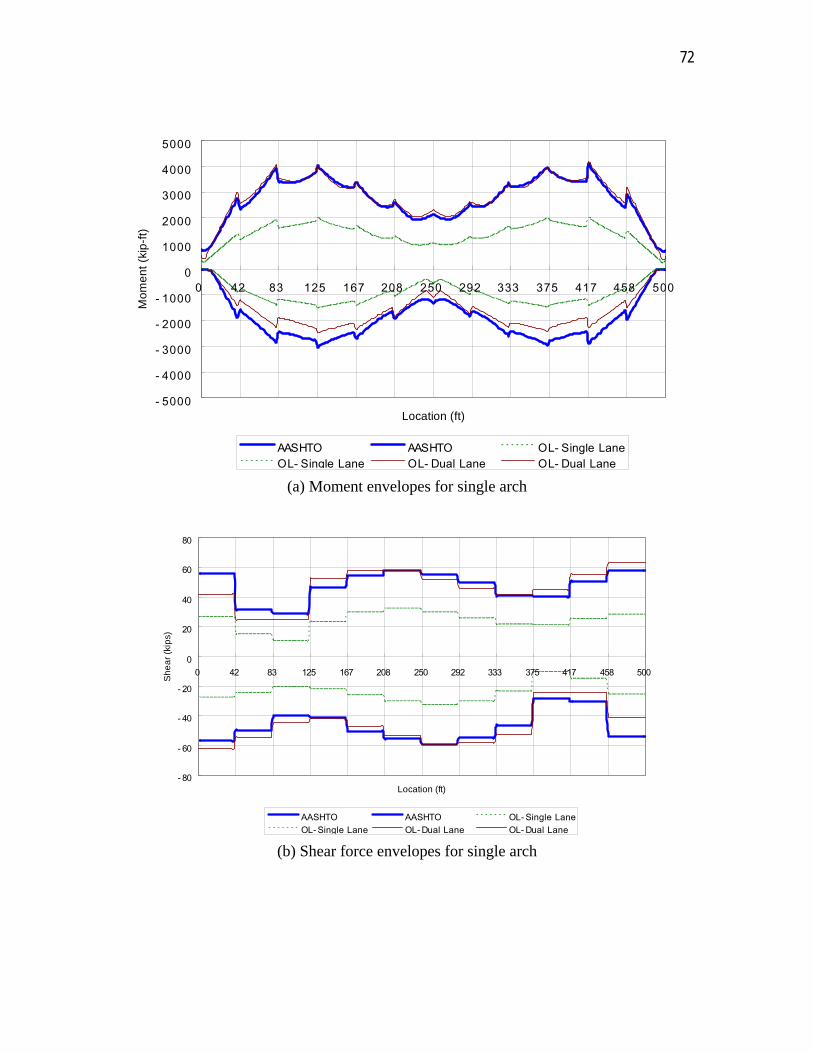
72
- 5000
- 4000
- 3000
- 2000
- 1000
0
1000
2000
3000
4000
5000
0 42 83 125 167 208 250 292 333 375 417 458 500
Location (ft)
Mo
me
nt
(kip
-ft)
AASHTO AASHTO OL- Single LaneOL- Single Lane OL- Dual Lane OL- Dual Lane
(a) Moment envelopes for single arch
- 80
- 60
- 40
- 20
0
20
40
60
80
0 42 83 125 167 208 250 292 333 375 417 458 500
Location (ft)
Sh
ea
r (k
ips)
AASHTO AASHTO OL- Single LaneOL- Single Lane OL- Dual Lane OL- Dual Lane
(b) Shear force envelopes for single arch
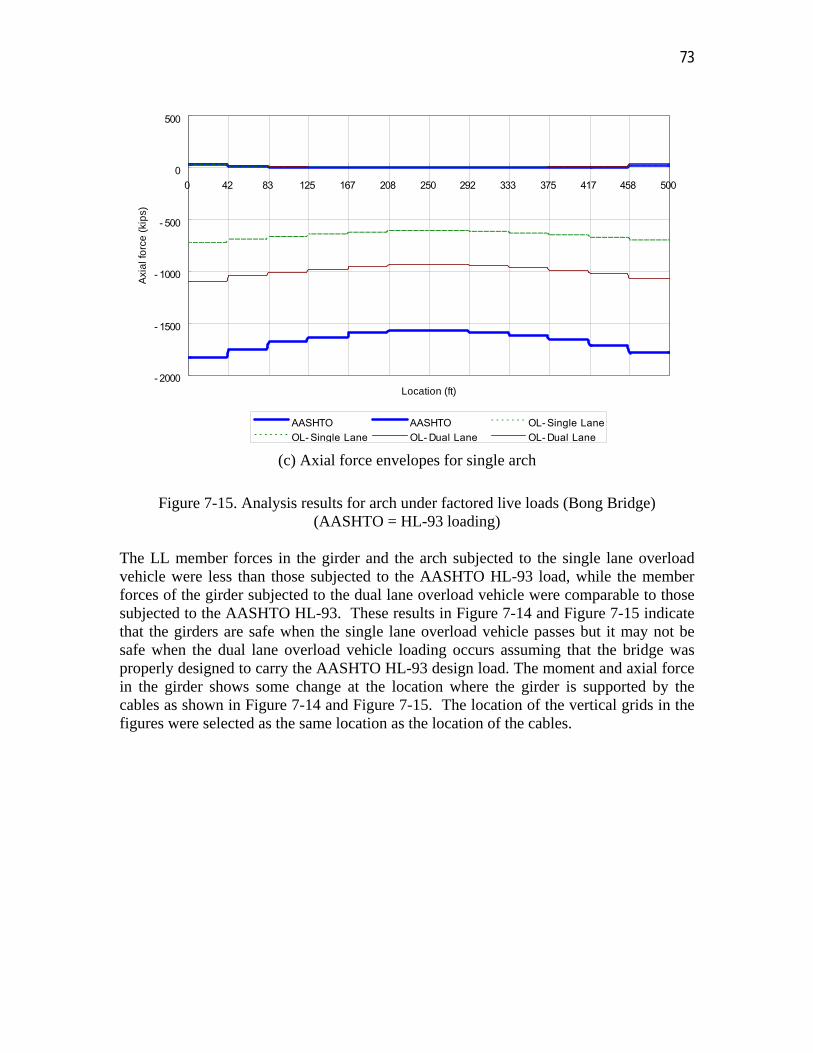
73
- 2000
- 1500
- 1000
- 500
0
500
0 42 83 125 167 208 250 292 333 375 417 458 500
Location (ft)
Axi
al f
orc
e (
kip
s)
AASHTO AASHTO OL- Single LaneOL- Single Lane OL- Dual Lane OL- Dual Lane
(c) Axial force envelopes for single arch
Figure 7-15. Analysis results for arch under factored live loads (Bong Bridge) (AASHTO = HL-93 loading)
The LL member forces in the girder and the arch subjected to the single lane overload vehicle were less than those subjected to the AASHTO HL-93 load, while the member forces of the girder subjected to the dual lane overload vehicle were comparable to those subjected to the AASHTO HL-93. These results in Figure 7-14 and Figure 7-15 indicate that the girders are safe when the single lane overload vehicle passes but it may not be safe when the dual lane overload vehicle loading occurs assuming that the bridge was properly designed to carry the AASHTO HL-93 design load. The moment and axial force in the girder shows some change at the location where the girder is supported by the cables as shown in Figure 7-14 and Figure 7-15. The location of the vertical grids in the figures were selected as the same location as the location of the cables.
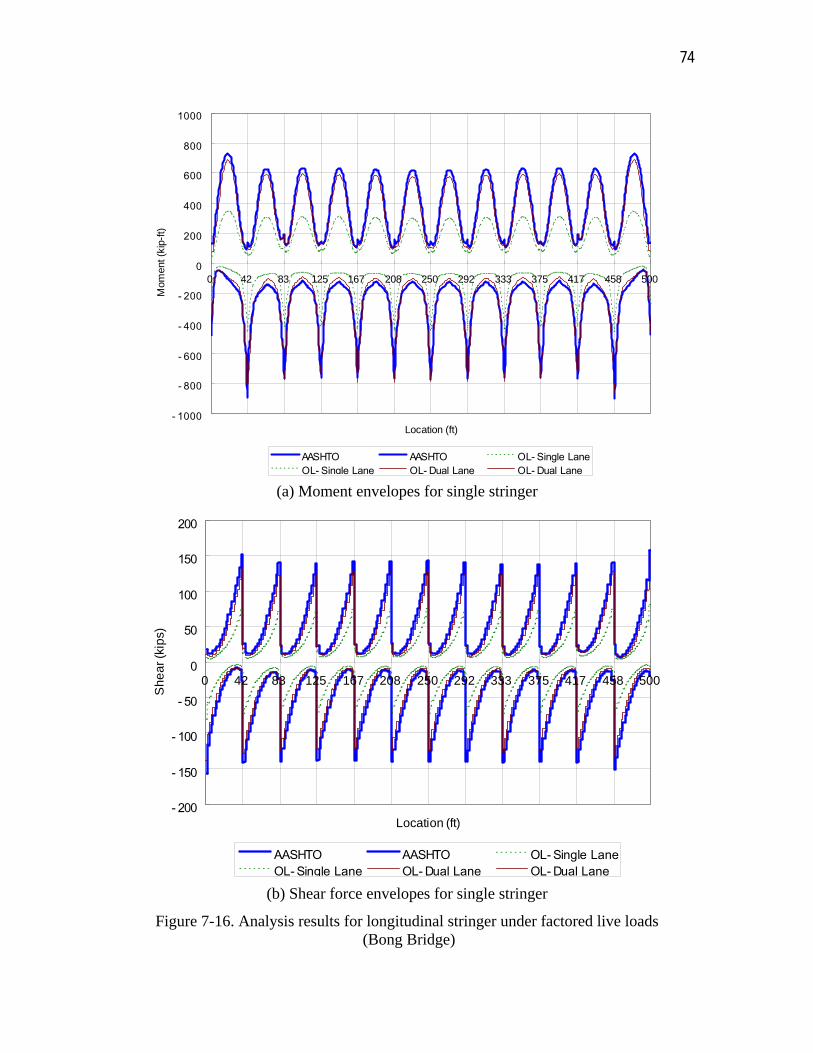
74
- 1000
- 800
- 600
- 400
- 200
0
200
400
600
800
1000
0 42 83 125 167 208 250 292 333 375 417 458 500
Location (ft)
Mom
ent (
kip-
ft)
AASHTO AASHTO OL- Single LaneOL- Single Lane OL- Dual Lane OL- Dual Lane
(a) Moment envelopes for single stringer
- 200
- 150
- 100
- 50
0
50
100
150
200
0 42 83 125 167 208 250 292 333 375 417 458 500
Location (ft)
Sh
ea
r (k
ips)
AASHTO AASHTO OL- Single LaneOL- Single Lane OL- Dual Lane OL- Dual Lane
(b) Shear force envelopes for single stringer
Figure 7-16. Analysis results for longitudinal stringer under factored live loads (Bong Bridge)
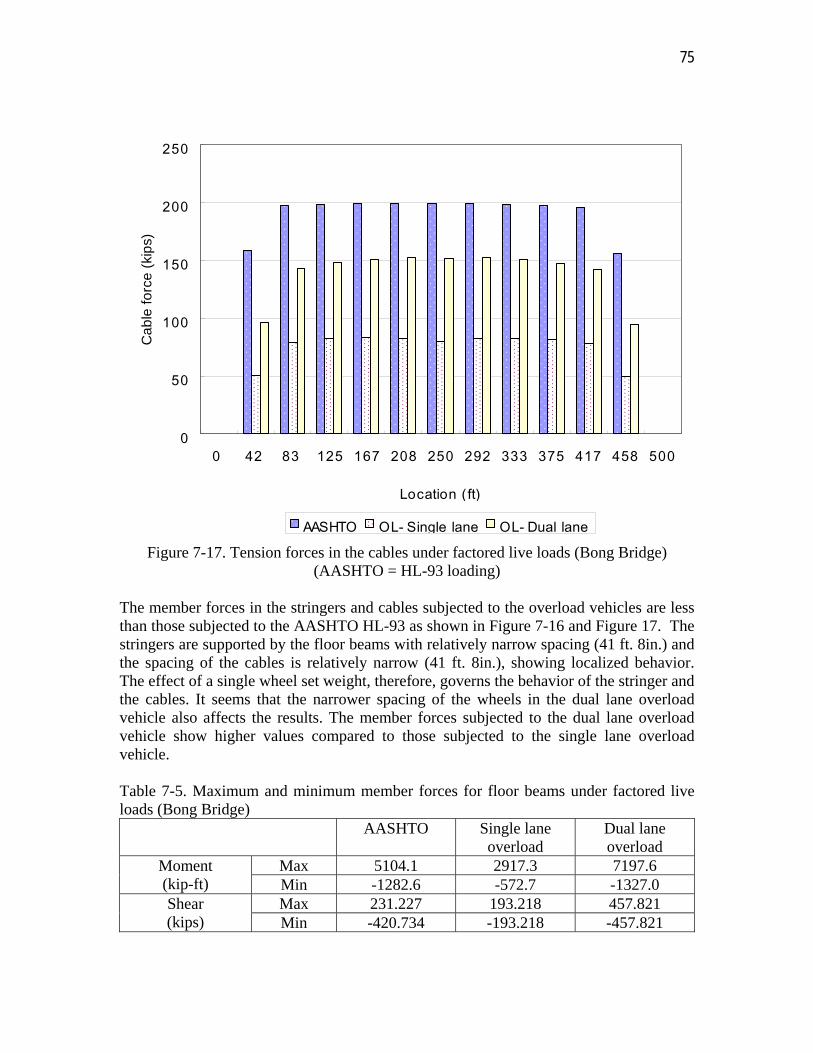
75
0
50
100
150
200
250
0 42 83 125 167 208 250 292 333 375 417 458 500
Location (ft)
Ca
ble
fo
rce
(ki
ps)
AASHTO OL- Single lane OL- Dual lane
Figure 7-17. Tension forces in the cables under factored live loads (Bong Bridge) (AASHTO = HL-93 loading)
The member forces in the stringers and cables subjected to the overload vehicles are less than those subjected to the AASHTO HL-93 as shown in Figure 7-16 and Figure 17. The stringers are supported by the floor beams with relatively narrow spacing (41 ft. 8in.) and the spacing of the cables is relatively narrow (41 ft. 8in.), showing localized behavior. The effect of a single wheel set weight, therefore, governs the behavior of the stringer and the cables. It seems that the narrower spacing of the wheels in the dual lane overload vehicle also affects the results. The member forces subjected to the dual lane overload vehicle show higher values compared to those subjected to the single lane overload vehicle.
Table 7-5. Maximum and minimum member forces for floor beams under factored live loads (Bong Bridge)
AASHTO Single lane overload
Dual lane overload
Moment (kip-ft)
Max 5104.1 2917.3 7197.6 Min -1282.6 -572.7 -1327.0
Shear (kips)
Max 231.227 193.218 457.821 Min -420.734 -193.218 -457.821
76
The member forces in the floor beam subjected to the single lane overload vehicle were less than those subjected to the AASHTO HL-93 load, while the member forces of the girder subjected to the dual lane overload vehicle were larger than those subjected to AASHTO HL-93. The closer transverse wheel spacing of the dual lane overload vehicle seems to be responsible for the results. The intensive set of wheels near the center span of the floor beams, the main girders, and the stringers create larger moment or shear forces. Overall results from the analysis are similar to those of the Mirror Lake bridge that showed a severe single lane overload could safely cross the bridge when the bridge is properly designed using the AASHTO HL-93 loads, while a severe dual lane overload vehicle may not be safe and a check of the capacity of the bridge in each structural member is required.
77
8. SUMMARY The primary research objective focused on development of a simplified analysis method to predict the effects of overload vehicles on a bridge system – including deck, girders, diaphragms, and other major components. Multi-girder bridges were selected for the development of the simplified bridge analysis method since they are the most common bridge type in the U.S. Accurate 3-D finite element (FEM) analysis techniques were used to analyze a large series of bridges under overload vehicles. The FEM technique was validated using existing experimental result before the bridge series was analyzed. 118 multi-girder bridges with 16 load cases of overload vehicles for each bridge were used in the finite element analyses. The variables in configuration of the bridges included span length, deck depth, girder spacing, girder type, girder stiffness, skew angle, number of spans, and use of diaphragms. The overload vehicle types varied with single lane and dual lane/trailer vehicles, and in the transverse spacing of interior wheels for dual lane vehicles. Resulting shear and moments in girders were both examined. Girder distribution factor (GDF) equations for the multi-girder bridges under overload vehicles were developed based on the FEM analysis results. The equations are for determining the amount of shear and moment induced in a girder due to the passage of the overload vehicles. The equations were found to be capable of replacing the time consuming 3D finite element analysis rationally and conservatively. The equations can be used for single and multi-span bridges and bridges with skew. Two examples of the application of the proposed simplified method for obtaining GDFs with two different overload vehicle cases are provided to help in the practical application of the analysis method. Further investigations, with intermediate diaphragms between girders, were conducted to check whether the diaphragms might be endangered under overload vehicles. Analyses results showed that there was a sufficient extra margin of safety in the intermediate diaphragm design to prevent damage. The design of the diaphragms is generally done based on stiffness to prevent buckling of the girders rather than on strength, as a result extra strength may be present. The safety of the intermediate diaphragms under overload vehicles, therefore, is not of a concern since even relatively weak intermediate diaphragms were found to be safe under the severe overload vehicles. An equation to limit the weight of a single wheel set in overload vehicles is provided to ensure the safety of the bridge decks. Two types of failure, i.e. punching failure and flexural failure, were considered in development of the equation. Two detailed analyses were conducted on ‘complex bridges’ as an example of the method. The results showed that accurate 3-D finite analysis will generally be needed to

78
find the effects of overload vehicles in these bridges. Each complex bridge has a unique configuration with special structural components and a general simplified analysis is not appropriate. In summary, the simplified method provided for analysis of multi-girder may help transportation agencies in evaluating impact of special overload vehicles on bridges. Complex bridges, however, should be carefully modeled to evaluate the impact of overload vehicles.
79
9. REFERENCES
1. AASHTO, (2009), “AASHTO LRFD Bridge Design Specifications, 2009 Interims”, 4th Ed., American Association of State Highway and Transportation Officials, 2009
2. Chou, C. J., (1996), “Effect of Overloaded Heavy Vehicles on Pavement and Bridge Design” Transportation Research Record N1539, pp. 58-65.
3. Chou, K. C., Deatherage. J. H., Letherwood, T. D., and Khayat, A. J., (1999), “Innovative Method for Evaluating Overweight Vehicle Permits”, Journal of Bridge Engineering, Vol. 4, No. 3, pp. 221-227.
4. Correia, J. R., and Branco, F. A., (2006), “New Methodology: Permit Checking of Vehicular Overloads”, Journal of Bridge Engineering, Vol. 11, No. 3, pp. 274-281.
5. Correia, J. R., Branco, F. A., Franco, g., and Matos, j., (2006), “Permit Checking of Vehicular Overloads a New Methodology”, Structures and Extreme Events, IABSE Symposium, Lisbon 2005, pp. 228-229.
6. Dept. of Transportation, (2000), “U.S. Department of Transportation’s Comprehensive Truck Size and Weight Study”, United Stated, Dept. of Transportation, Washington, D.C., Vol 1~4.
7. Dicleli, M., and Bruneau, M., (1995), “Fatigue-Based Methodology for Managing Impact of Heavy-Permit Trucks on Steel Highway Bridges”, Journal of Structural Engineering, Vol. 121, No. 11, pp. 1651-1659.
8. Fu, G., and Fu, C., (2006) “NCHRP Synthesis of Highway Practice 359: Bridge Rating practices and Policies for overweight Vehicles”, Transportation Research Board, Washington, D.C., 109 pp.
9. Fu, g., and Hag-Elsafi, O., (1996), “A Bridge Live Load Model including Overloads”, Probabilistic Mechanics and Structural and Geotechnical Reliability, Proceedings of the Seventh Specialty Conference, Worcester, MA, August 7-9, pp. 34-37.
10. Fu, G., and Hag-Elsafi, O., (1996), “New Safety-Based Checking Procedure for Overloads on Highway Bridges”, Transportation Research Record N1541, pp. 22-28.
11. Fu, G., and Hag-Elsafi, O., (2000), “Vehicular Overloads: Load Model, Bridge Safety and Permit Checking”, Journal of Bridge Engineering, Vol. 5, No. 1, pp. 49-57.
12. Ghosn, M., and Moses, F., (1978), “ Calibration of a Bridge of a Bridge Rating Formula for Overload Permits”, Bridges and Transmission Line Structures Proceedings of the Sessions at Structures Congress ‘87 related to Bridges and Transmission Line Structures, Orlando, Florida, August 17-20, pp. 15-25.
13. Hays, C. O. JR., (1984), “Evaluating Bridge Overloads using the Finite Element Method”, Official Proceedings - International Bridge Conference., Pittsburgh, PA, USA, pp. 232-238.
14. Kim, S., Sokolik, A. F., and Nowak, A. S., (1996), “Measurement of Truck Load on Bridges in Detroit, Michigan Area”, Transportation Research Record N1541, pp. 58-63.
80
15. Mertz, D. R., (2007), “NCHRP Report 592:Simplified Live Load Distribution Factor Equations”, Transportation Research Board, Washington, D.C., 137 pp.
16. Mohammadi, J., and Polepeddi, R., (2000), “Bridge Rating with Consideration for Fatigue Damage from Overloads” Journal of Bridge Engineering, Vol. 5, No. 3, pp. 259-265.
17. Mohammadi, J., and Shah, N., (1992), “Statistical Evaluation of Truck Overloads”, Journal of Transportation Engineering, Vol.118, No. 5. pp. 651-665.
18. Sadeghi, J. M., and Fathali, M., (2007), “Deterioration Analysis of Concrete Bridges under Inadmissible Loads from the Fatigue Point of View”, Scientia Iranica, Vol. 14, No. 3, pp. 185-192.
19. Sanders, W. W. JR., (1984), “NCHRP Report 111: Distribution of Wheel Loads on Highway bridges”, Transportation Research Board, National Research Council, Washington, D.C., 22 pp.
20. Sanders, W. W. JR., and Elleby, H. A., (1970), “NCHRP Report 83: Distribution of Wheel Loads on Highway bridges”, Highway Research Board, National Research Council, Washington, D.C., 56 pp.
21. Tabsh, S. W., and Tabatabai, M., (2001), “Live Load Distribution in Girder Bridges Subject to Oversized Trucks”, Journal of Bridge Engineering, Vol. 6, No. 1, pp. 9-16.
22. Westergaard, H. M., (1930), “Computation of Stress in Bridge Slabs due to Wheel Loads”, Public Roads, Vol. 11, No. 1, pp.1-23.
23. White, K. R., and Minor, J., (1979), “Evaluation of Bridge Overloads”, Transportation Engineering Journal, ASCE, Vol. 105, No. 1, pp. 15-21.
24. Zokaie, T., (1992), “NCHRP Digest of the Findings from the Final Report on NCHRP Project 12-26: Distribution of Wheel Loads on Highway Bridges”, Transportation Research Board, Washington, D.C., 31 pp.
25. Conachen, M., (2005), “Modular 3-D FRP Reinforcing System for a Bridge Deck in Fond du Lac, Wisconsin,” MS Thesis, Dept. of Civil and Environmental Engineering, University of Wisconsin, 2005, 395pp
81
APPENDIX
(Results for Multi-girder FEM Analysis)
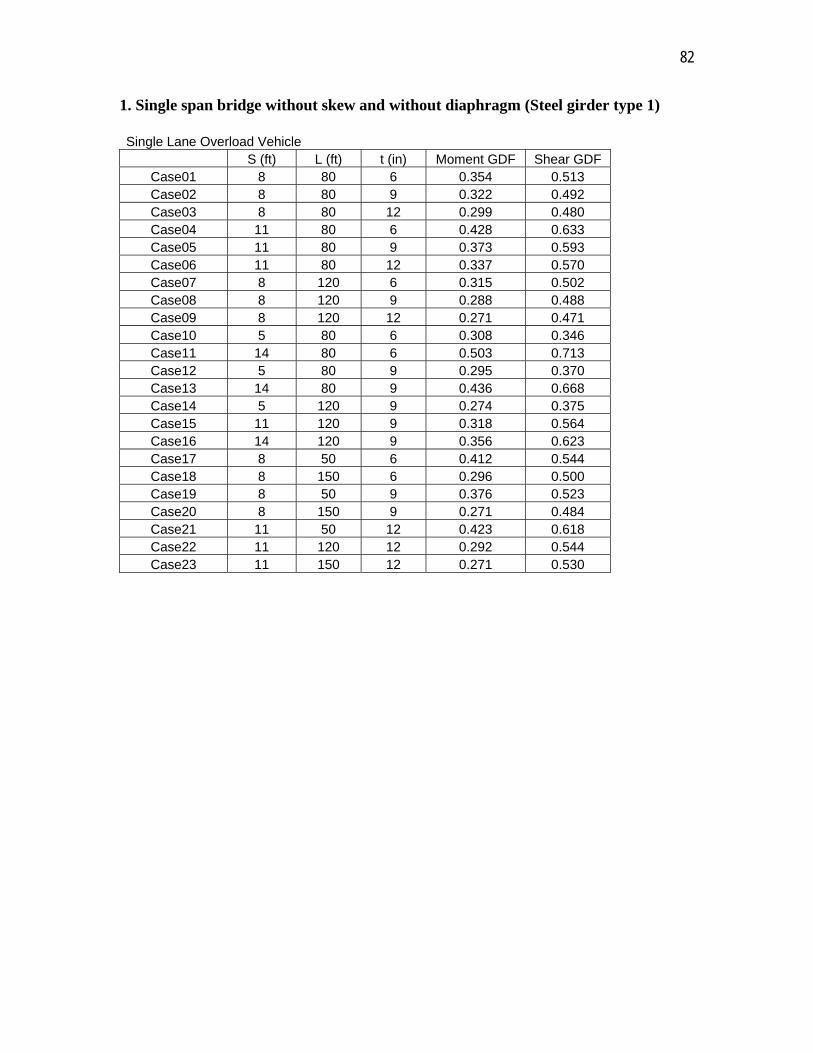
82
1. Single span bridge without skew and without diaphragm (Steel girder type 1) Single Lane Overload Vehicle
S (ft) L (ft) t (in) Moment GDF Shear GDF Case01 8 80 6 0.354 0.513 Case02 8 80 9 0.322 0.492 Case03 8 80 12 0.299 0.480 Case04 11 80 6 0.428 0.633 Case05 11 80 9 0.373 0.593 Case06 11 80 12 0.337 0.570 Case07 8 120 6 0.315 0.502 Case08 8 120 9 0.288 0.488 Case09 8 120 12 0.271 0.471 Case10 5 80 6 0.308 0.346 Case11 14 80 6 0.503 0.713 Case12 5 80 9 0.295 0.370 Case13 14 80 9 0.436 0.668 Case14 5 120 9 0.274 0.375 Case15 11 120 9 0.318 0.564 Case16 14 120 9 0.356 0.623 Case17 8 50 6 0.412 0.544 Case18 8 150 6 0.296 0.500 Case19 8 50 9 0.376 0.523 Case20 8 150 9 0.271 0.484 Case21 11 50 12 0.423 0.618 Case22 11 120 12 0.292 0.544 Case23 11 150 12 0.271 0.530

83
Dual Lane Overload Vehicle
S (ft) L (ft) t (in) Sw (ft) Moment
GDF Shear GDF
Case01-1 8 80 6 2 0.361 0.553 Case01-2 8 80 6 6 0.329 0.407 Case01-3 8 80 6 10 0.294 0.329 Case02-1 8 80 9 2 0.321 0.532 Case02-2 8 80 9 6 0.310 0.400 Case02-3 8 80 9 10 0.292 0.327 Case03-1 8 80 12 2 0.296 0.524 Case03-2 8 80 12 6 0.294 0.397 Case03-3 8 80 12 10 0.284 0.325 Case04-1 11 80 6 2 0.433 0.647 Case04-2 11 80 6 6 0.392 0.547 Case04-3 11 80 6 10 0.340 0.405 Case05-1 11 80 9 2 0.374 0.607 Case05-2 11 80 9 6 0.353 0.524 Case05-3 11 80 9 10 0.326 0.398 Case06-1 11 80 12 2 0.337 0.588 Case06-2 11 80 12 6 0.326 0.514 Case06-3 11 80 12 10 0.313 0.394 Case07-1 8 120 6 2 0.309 0.520 Case07-2 8 120 6 6 0.304 0.396 Case07-3 8 120 6 10 0.290 0.323 Case08-1 8 120 9 2 0.280 0.506 Case08-2 8 120 9 6 0.283 0.389 Case08-3 8 120 9 10 0.276 0.319 Case09-1 8 120 12 2 0.262 0.490 Case09-2 8 120 12 6 0.268 0.379 Case09-3 8 120 12 10 0.264 0.313 Case10-1 5 80 6 2 0.295 0.413 Case10-2 5 80 6 6 0.275 0.268 Case10-3 5 80 6 10 0.200 0.218 Case11-1 14 80 6 2 0.497 0.710 Case11-2 14 80 6 6 0.459 0.635 Case11-3 14 80 6 10 0.402 0.534 Case12-1 5 80 9 2 0.275 0.409 Case12-2 5 80 9 6 0.266 0.258 Case12-3 5 80 9 10 0.200 0.198 Case13-1 14 80 9 2 0.430 0.667 Case13-2 14 80 9 6 0.406 0.602 Case13-3 14 80 9 10 0.370 0.516 Case14-1 5 120 9 2 0.252 0.381 Case14-2 5 120 9 6 0.248 0.242 Case14-3 5 120 9 10 0.200 0.181 Case15-1 11 120 9 2 0.310 0.559 Case15-2 11 120 9 6 0.307 0.499 Case15-3 11 120 9 10 0.301 0.386
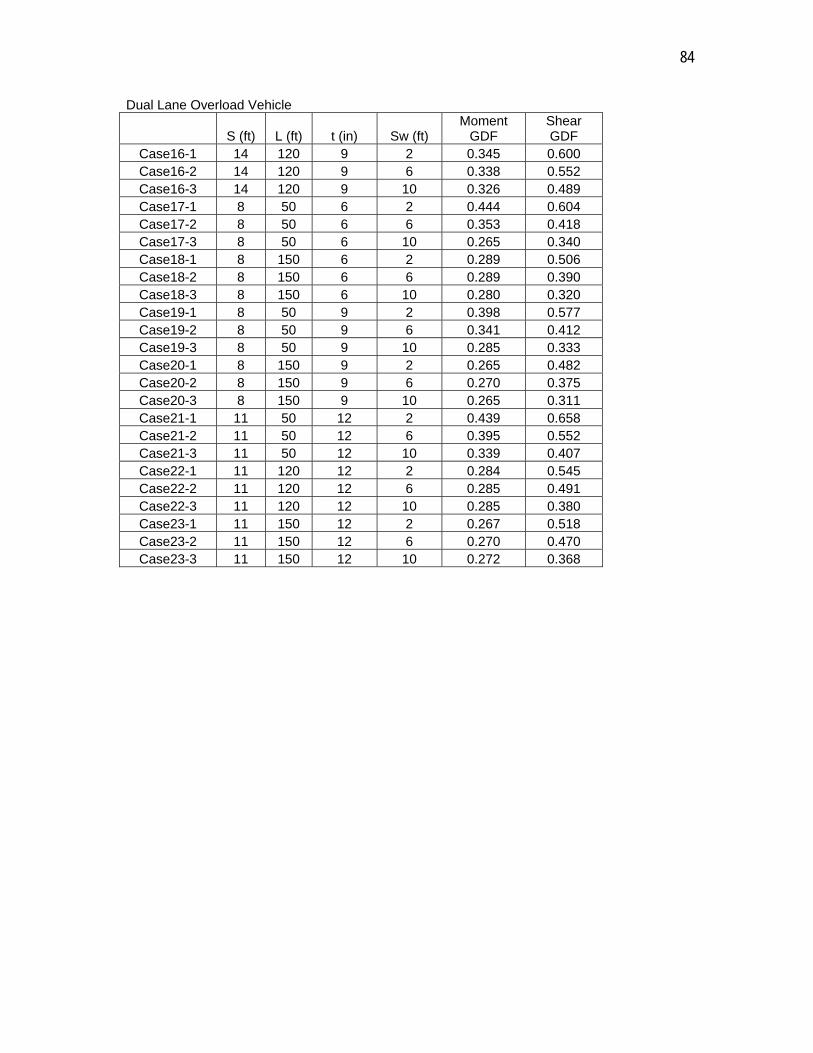
84
Dual Lane Overload Vehicle
S (ft) L (ft) t (in) Sw (ft) Moment
GDF Shear GDF
Case16-1 14 120 9 2 0.345 0.600 Case16-2 14 120 9 6 0.338 0.552 Case16-3 14 120 9 10 0.326 0.489 Case17-1 8 50 6 2 0.444 0.604 Case17-2 8 50 6 6 0.353 0.418 Case17-3 8 50 6 10 0.265 0.340 Case18-1 8 150 6 2 0.289 0.506 Case18-2 8 150 6 6 0.289 0.390 Case18-3 8 150 6 10 0.280 0.320 Case19-1 8 50 9 2 0.398 0.577 Case19-2 8 50 9 6 0.341 0.412 Case19-3 8 50 9 10 0.285 0.333 Case20-1 8 150 9 2 0.265 0.482 Case20-2 8 150 9 6 0.270 0.375 Case20-3 8 150 9 10 0.265 0.311 Case21-1 11 50 12 2 0.439 0.658 Case21-2 11 50 12 6 0.395 0.552 Case21-3 11 50 12 10 0.339 0.407 Case22-1 11 120 12 2 0.284 0.545 Case22-2 11 120 12 6 0.285 0.491 Case22-3 11 120 12 10 0.285 0.380 Case23-1 11 150 12 2 0.267 0.518 Case23-2 11 150 12 6 0.270 0.470 Case23-3 11 150 12 10 0.272 0.368
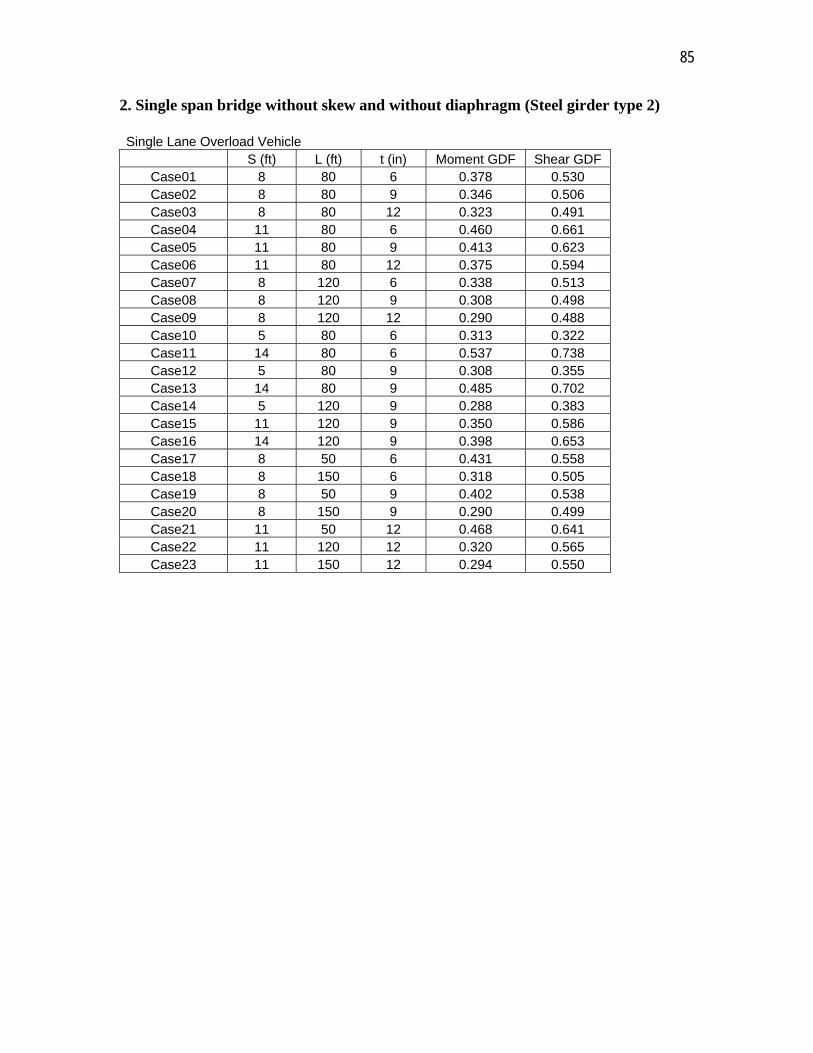
85
2. Single span bridge without skew and without diaphragm (Steel girder type 2) Single Lane Overload Vehicle
S (ft) L (ft) t (in) Moment GDF Shear GDF Case01 8 80 6 0.378 0.530 Case02 8 80 9 0.346 0.506 Case03 8 80 12 0.323 0.491 Case04 11 80 6 0.460 0.661 Case05 11 80 9 0.413 0.623 Case06 11 80 12 0.375 0.594 Case07 8 120 6 0.338 0.513 Case08 8 120 9 0.308 0.498 Case09 8 120 12 0.290 0.488 Case10 5 80 6 0.313 0.322 Case11 14 80 6 0.537 0.738 Case12 5 80 9 0.308 0.355 Case13 14 80 9 0.485 0.702 Case14 5 120 9 0.288 0.383 Case15 11 120 9 0.350 0.586 Case16 14 120 9 0.398 0.653 Case17 8 50 6 0.431 0.558 Case18 8 150 6 0.318 0.505 Case19 8 50 9 0.402 0.538 Case20 8 150 9 0.290 0.499 Case21 11 50 12 0.468 0.641 Case22 11 120 12 0.320 0.565 Case23 11 150 12 0.294 0.550

86
Dual Lane Overload Vehicle
S (ft) L (ft) t (in) Sw (ft) Moment
GDF Shear GDF
Case01-1 8 80 6 2 0.390 0.576 Case01-2 8 80 6 6 0.340 0.412 Case01-3 8 80 6 10 0.288 0.333 Case02-1 8 80 9 2 0.350 0.545 Case02-2 8 80 9 6 0.325 0.404 Case02-3 8 80 9 10 0.280 0.328 Case03-1 8 80 12 2 0.322 0.531 Case03-2 8 80 12 6 0.312 0.400 Case03-3 8 80 12 10 0.293 0.326 Case04-1 11 80 6 2 0.469 0.676 Case04-2 11 80 6 6 0.416 0.564 Case04-3 11 80 6 10 0.346 0.409 Case05-1 11 80 9 2 0.417 0.635 Case05-2 11 80 9 6 0.382 0.540 Case05-3 11 80 9 10 0.337 0.403 Case06-1 11 80 12 2 0.376 0.607 Case06-2 11 80 12 6 0.355 0.524 Case06-3 11 80 12 10 0.327 0.397 Case07-1 8 120 6 2 0.335 0.534 Case07-2 8 120 6 6 0.319 0.402 Case07-3 8 120 6 10 0.296 0.325 Case08-1 8 120 9 2 0.302 0.516 Case08-2 8 120 9 6 0.299 0.395 Case08-3 8 120 9 10 0.288 0.322 Case09-1 8 120 12 2 0.281 0.507 Case09-2 8 120 12 6 0.285 0.390 Case09-3 8 120 12 10 0.278 0.320 Case10-1 5 80 6 2 0.310 0.416 Case10-2 5 80 6 6 0.277 0.275 Case10-3 5 80 6 10 0.202 0.239 Case11-1 14 80 6 2 0.533 0.737 Case11-2 14 80 6 6 0.487 0.655 Case11-3 14 80 6 10 0.419 0.545 Case12-1 5 80 9 2 0.290 0.412 Case12-2 5 80 9 6 0.274 0.265 Case12-3 5 80 9 10 0.200 0.211 Case13-1 14 80 9 2 0.480 0.699 Case13-2 14 80 9 6 0.445 0.626 Case13-3 14 80 9 10 0.395 0.530 Case14-1 5 120 9 2 0.265 0.400 Case14-2 5 120 9 6 0.258 0.248 Case14-3 5 120 9 10 0.200 0.182 Case15-1 11 120 9 2 0.343 0.576 Case15-2 11 120 9 6 0.332 0.506 Case15-3 11 120 9 10 0.317 0.391
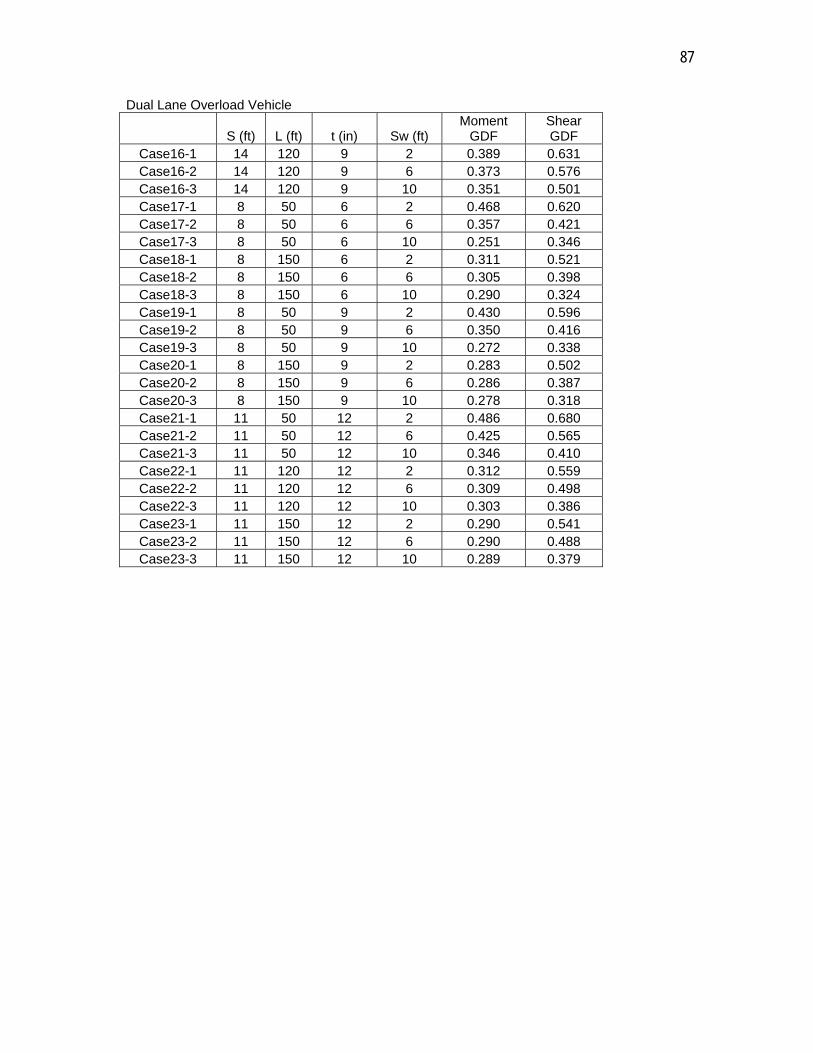
87
Dual Lane Overload Vehicle
S (ft) L (ft) t (in) Sw (ft) Moment
GDF Shear GDF
Case16-1 14 120 9 2 0.389 0.631 Case16-2 14 120 9 6 0.373 0.576 Case16-3 14 120 9 10 0.351 0.501 Case17-1 8 50 6 2 0.468 0.620 Case17-2 8 50 6 6 0.357 0.421 Case17-3 8 50 6 10 0.251 0.346 Case18-1 8 150 6 2 0.311 0.521 Case18-2 8 150 6 6 0.305 0.398 Case18-3 8 150 6 10 0.290 0.324 Case19-1 8 50 9 2 0.430 0.596 Case19-2 8 50 9 6 0.350 0.416 Case19-3 8 50 9 10 0.272 0.338 Case20-1 8 150 9 2 0.283 0.502 Case20-2 8 150 9 6 0.286 0.387 Case20-3 8 150 9 10 0.278 0.318 Case21-1 11 50 12 2 0.486 0.680 Case21-2 11 50 12 6 0.425 0.565 Case21-3 11 50 12 10 0.346 0.410 Case22-1 11 120 12 2 0.312 0.559 Case22-2 11 120 12 6 0.309 0.498 Case22-3 11 120 12 10 0.303 0.386 Case23-1 11 150 12 2 0.290 0.541 Case23-2 11 150 12 6 0.290 0.488 Case23-3 11 150 12 10 0.289 0.379

88
3. Single span bridge without skew and without diaphragm (Concrete I girder) Single Lane Overload Vehicle
S (ft) L (ft) t (in) Moment GDF Shear GDF Case01 8 80 6 0.360 0.527 Case02 8 80 9 0.333 0.506 Case03 8 80 12 0.305 0.488 Case04 11 80 6 0.436 0.655 Case05 11 80 9 0.395 0.619 Case06 11 80 12 0.362 0.592 Case07 8 120 6 0.318 0.514 Case08 8 120 9 0.296 0.497 Case09 8 120 12 0.281 0.484 Case10 5 80 6 0.305 0.324 Case11 14 80 6 0.514 0.732 Case12 5 80 9 0.296 0.350 Case13 14 80 9 0.467 0.697 Case14 5 120 9 0.271 0.354 Case15 11 120 9 0.334 0.585 Case16 14 120 9 0.380 0.650 Case17 8 50 6 0.418 0.554 Case18 8 150 6 0.297 0.503 Case19 8 50 9 0.391 0.536 Case20 8 150 9 0.277 0.490 Case21 11 50 12 0.458 0.637 Case22 11 120 12 0.309 0.563 Case23 11 150 12 0.285 0.546

89
Dual Lane Overload Vehicle
S (ft) L (ft) t (in) Sw (ft) Moment
GDF Shear GDF
Case01-1 8 80 6 2 0.369 0.575 Case01-2 8 80 6 6 0.332 0.413 Case01-3 8 80 6 10 0.290 0.333 Case02-1 8 80 9 2 0.335 0.548 Case02-2 8 80 9 6 0.318 0.406 Case02-3 8 80 9 10 0.293 0.329 Case03-1 8 80 12 2 0.303 0.531 Case03-2 8 80 12 6 0.299 0.401 Case03-3 8 80 12 10 0.286 0.327 Case04-1 11 80 6 2 0.445 0.672 Case04-2 11 80 6 6 0.400 0.561 Case04-3 11 80 6 10 0.342 0.408 Case05-1 11 80 9 2 0.399 0.633 Case05-2 11 80 9 6 0.370 0.539 Case05-3 11 80 9 10 0.332 0.403 Case06-1 11 80 12 2 0.363 0.607 Case06-2 11 80 12 6 0.345 0.524 Case06-3 11 80 12 10 0.323 0.398 Case07-1 8 120 6 2 0.314 0.536 Case07-2 8 120 6 6 0.305 0.403 Case07-3 8 120 6 10 0.288 0.325 Case08-1 8 120 9 2 0.288 0.515 Case08-2 8 120 9 6 0.289 0.395 Case08-3 8 120 9 10 0.279 0.322 Case09-1 8 120 12 2 0.272 0.502 Case09-2 8 120 12 6 0.276 0.387 Case09-3 8 120 12 10 0.270 0.318 Case10-1 5 80 6 2 0.294 0.418 Case10-2 5 80 6 6 0.270 0.275 Case10-3 5 80 6 10 0.201 0.239 Case11-1 14 80 6 2 0.511 0.732 Case11-2 14 80 6 6 0.470 0.650 Case11-3 14 80 6 10 0.409 0.542 Case12-1 5 80 9 2 0.278 0.412 Case12-2 5 80 9 6 0.265 0.265 Case12-3 5 80 9 10 0.200 0.212 Case13-1 14 80 9 2 0.461 0.694 Case13-2 14 80 9 6 0.431 0.623 Case13-3 14 80 9 10 0.386 0.528 Case14-1 5 120 9 2 0.251 0.385 Case14-2 5 120 9 6 0.246 0.248 Case14-3 5 120 9 10 0.200 0.190 Case15-1 11 120 9 2 0.327 0.578 Case15-2 11 120 9 6 0.320 0.509 Case15-3 11 120 9 10 0.310 0.392
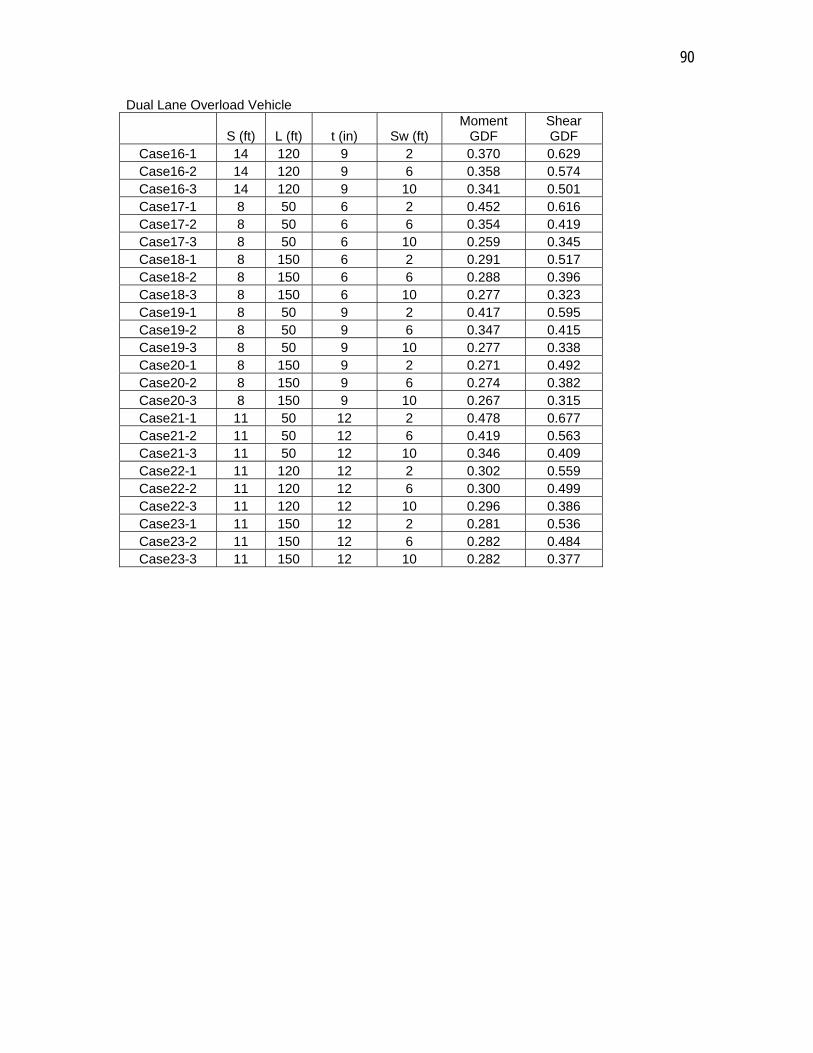
90
Dual Lane Overload Vehicle
S (ft) L (ft) t (in) Sw (ft) Moment
GDF Shear GDF
Case16-1 14 120 9 2 0.370 0.629 Case16-2 14 120 9 6 0.358 0.574 Case16-3 14 120 9 10 0.341 0.501 Case17-1 8 50 6 2 0.452 0.616 Case17-2 8 50 6 6 0.354 0.419 Case17-3 8 50 6 10 0.259 0.345 Case18-1 8 150 6 2 0.291 0.517 Case18-2 8 150 6 6 0.288 0.396 Case18-3 8 150 6 10 0.277 0.323 Case19-1 8 50 9 2 0.417 0.595 Case19-2 8 50 9 6 0.347 0.415 Case19-3 8 50 9 10 0.277 0.338 Case20-1 8 150 9 2 0.271 0.492 Case20-2 8 150 9 6 0.274 0.382 Case20-3 8 150 9 10 0.267 0.315 Case21-1 11 50 12 2 0.478 0.677 Case21-2 11 50 12 6 0.419 0.563 Case21-3 11 50 12 10 0.346 0.409 Case22-1 11 120 12 2 0.302 0.559 Case22-2 11 120 12 6 0.300 0.499 Case22-3 11 120 12 10 0.296 0.386 Case23-1 11 150 12 2 0.281 0.536 Case23-2 11 150 12 6 0.282 0.484 Case23-3 11 150 12 10 0.282 0.377
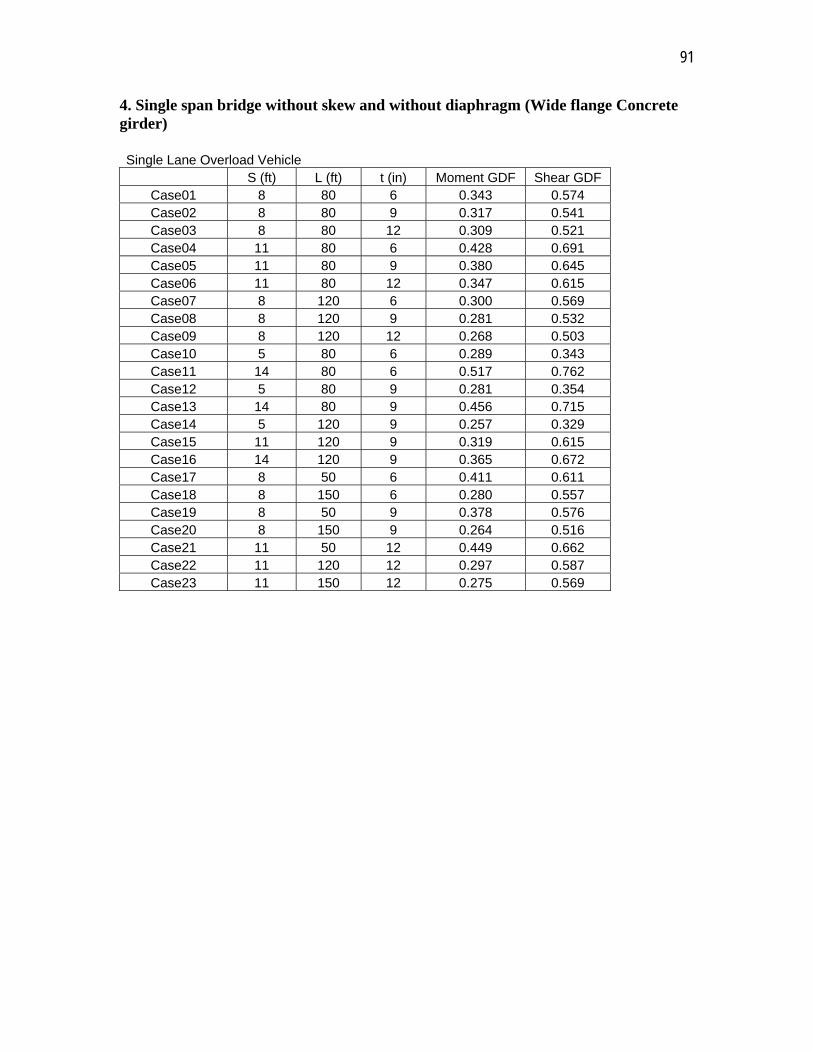
91
4. Single span bridge without skew and without diaphragm (Wide flange Concrete girder) Single Lane Overload Vehicle
S (ft) L (ft) t (in) Moment GDF Shear GDF Case01 8 80 6 0.343 0.574 Case02 8 80 9 0.317 0.541 Case03 8 80 12 0.309 0.521 Case04 11 80 6 0.428 0.691 Case05 11 80 9 0.380 0.645 Case06 11 80 12 0.347 0.615 Case07 8 120 6 0.300 0.569 Case08 8 120 9 0.281 0.532 Case09 8 120 12 0.268 0.503 Case10 5 80 6 0.289 0.343 Case11 14 80 6 0.517 0.762 Case12 5 80 9 0.281 0.354 Case13 14 80 9 0.456 0.715 Case14 5 120 9 0.257 0.329 Case15 11 120 9 0.319 0.615 Case16 14 120 9 0.365 0.672 Case17 8 50 6 0.411 0.611 Case18 8 150 6 0.280 0.557 Case19 8 50 9 0.378 0.576 Case20 8 150 9 0.264 0.516 Case21 11 50 12 0.449 0.662 Case22 11 120 12 0.297 0.587 Case23 11 150 12 0.275 0.569
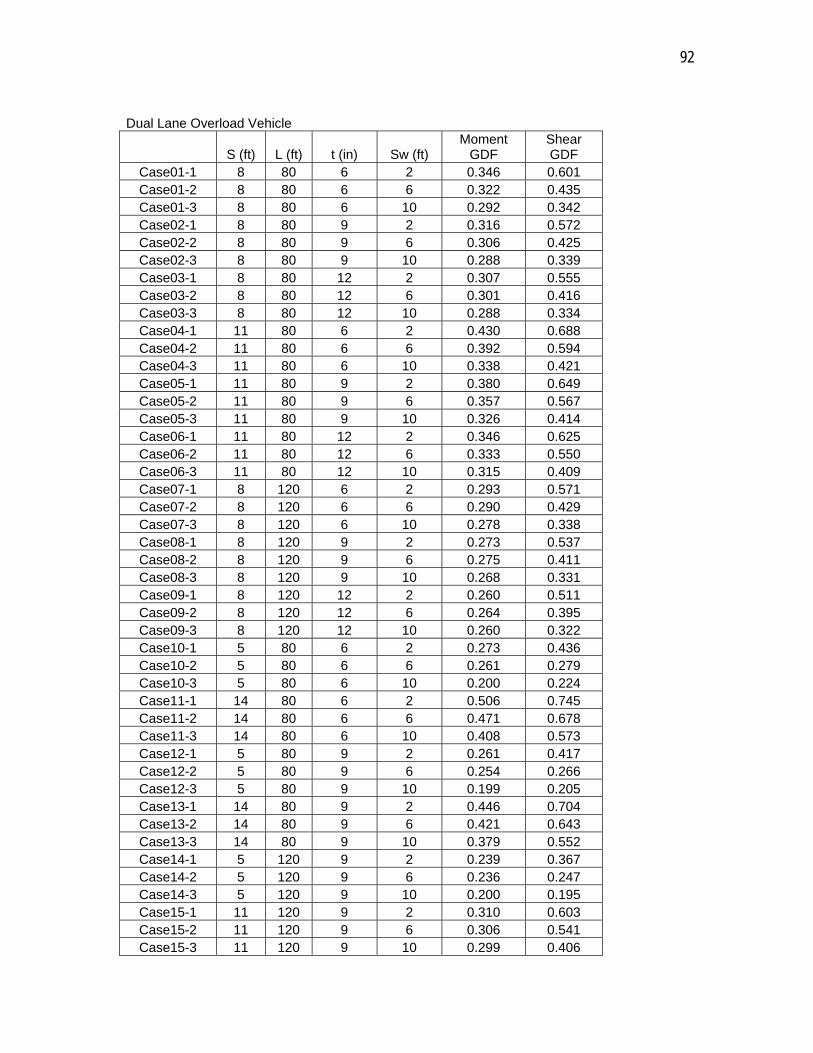
92
Dual Lane Overload Vehicle
S (ft) L (ft) t (in) Sw (ft) Moment
GDF Shear GDF
Case01-1 8 80 6 2 0.346 0.601 Case01-2 8 80 6 6 0.322 0.435 Case01-3 8 80 6 10 0.292 0.342 Case02-1 8 80 9 2 0.316 0.572 Case02-2 8 80 9 6 0.306 0.425 Case02-3 8 80 9 10 0.288 0.339 Case03-1 8 80 12 2 0.307 0.555 Case03-2 8 80 12 6 0.301 0.416 Case03-3 8 80 12 10 0.288 0.334 Case04-1 11 80 6 2 0.430 0.688 Case04-2 11 80 6 6 0.392 0.594 Case04-3 11 80 6 10 0.338 0.421 Case05-1 11 80 9 2 0.380 0.649 Case05-2 11 80 9 6 0.357 0.567 Case05-3 11 80 9 10 0.326 0.414 Case06-1 11 80 12 2 0.346 0.625 Case06-2 11 80 12 6 0.333 0.550 Case06-3 11 80 12 10 0.315 0.409 Case07-1 8 120 6 2 0.293 0.571 Case07-2 8 120 6 6 0.290 0.429 Case07-3 8 120 6 10 0.278 0.338 Case08-1 8 120 9 2 0.273 0.537 Case08-2 8 120 9 6 0.275 0.411 Case08-3 8 120 9 10 0.268 0.331 Case09-1 8 120 12 2 0.260 0.511 Case09-2 8 120 12 6 0.264 0.395 Case09-3 8 120 12 10 0.260 0.322 Case10-1 5 80 6 2 0.273 0.436 Case10-2 5 80 6 6 0.261 0.279 Case10-3 5 80 6 10 0.200 0.224 Case11-1 14 80 6 2 0.506 0.745 Case11-2 14 80 6 6 0.471 0.678 Case11-3 14 80 6 10 0.408 0.573 Case12-1 5 80 9 2 0.261 0.417 Case12-2 5 80 9 6 0.254 0.266 Case12-3 5 80 9 10 0.199 0.205 Case13-1 14 80 9 2 0.446 0.704 Case13-2 14 80 9 6 0.421 0.643 Case13-3 14 80 9 10 0.379 0.552 Case14-1 5 120 9 2 0.239 0.367 Case14-2 5 120 9 6 0.236 0.247 Case14-3 5 120 9 10 0.200 0.195 Case15-1 11 120 9 2 0.310 0.603 Case15-2 11 120 9 6 0.306 0.541 Case15-3 11 120 9 10 0.299 0.406
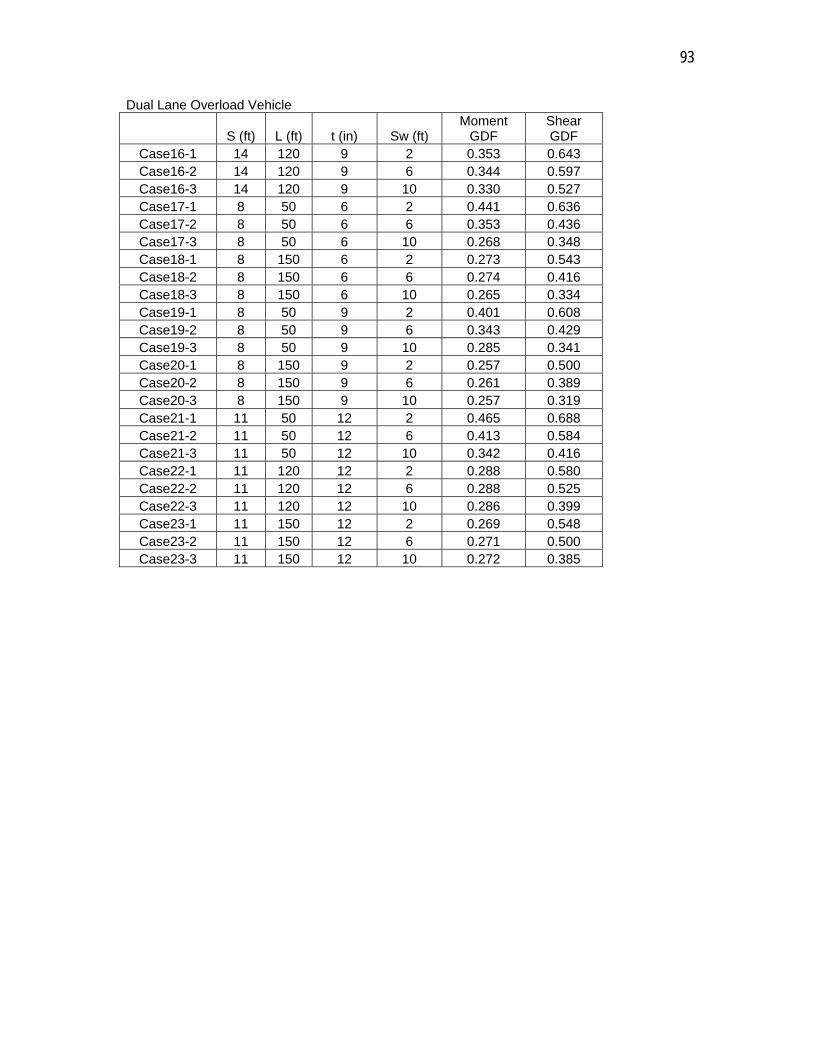
93
Dual Lane Overload Vehicle
S (ft) L (ft) t (in) Sw (ft) Moment
GDF Shear GDF
Case16-1 14 120 9 2 0.353 0.643 Case16-2 14 120 9 6 0.344 0.597 Case16-3 14 120 9 10 0.330 0.527 Case17-1 8 50 6 2 0.441 0.636 Case17-2 8 50 6 6 0.353 0.436 Case17-3 8 50 6 10 0.268 0.348 Case18-1 8 150 6 2 0.273 0.543 Case18-2 8 150 6 6 0.274 0.416 Case18-3 8 150 6 10 0.265 0.334 Case19-1 8 50 9 2 0.401 0.608 Case19-2 8 50 9 6 0.343 0.429 Case19-3 8 50 9 10 0.285 0.341 Case20-1 8 150 9 2 0.257 0.500 Case20-2 8 150 9 6 0.261 0.389 Case20-3 8 150 9 10 0.257 0.319 Case21-1 11 50 12 2 0.465 0.688 Case21-2 11 50 12 6 0.413 0.584 Case21-3 11 50 12 10 0.342 0.416 Case22-1 11 120 12 2 0.288 0.580 Case22-2 11 120 12 6 0.288 0.525 Case22-3 11 120 12 10 0.286 0.399 Case23-1 11 150 12 2 0.269 0.548 Case23-2 11 150 12 6 0.271 0.500 Case23-3 11 150 12 10 0.272 0.385
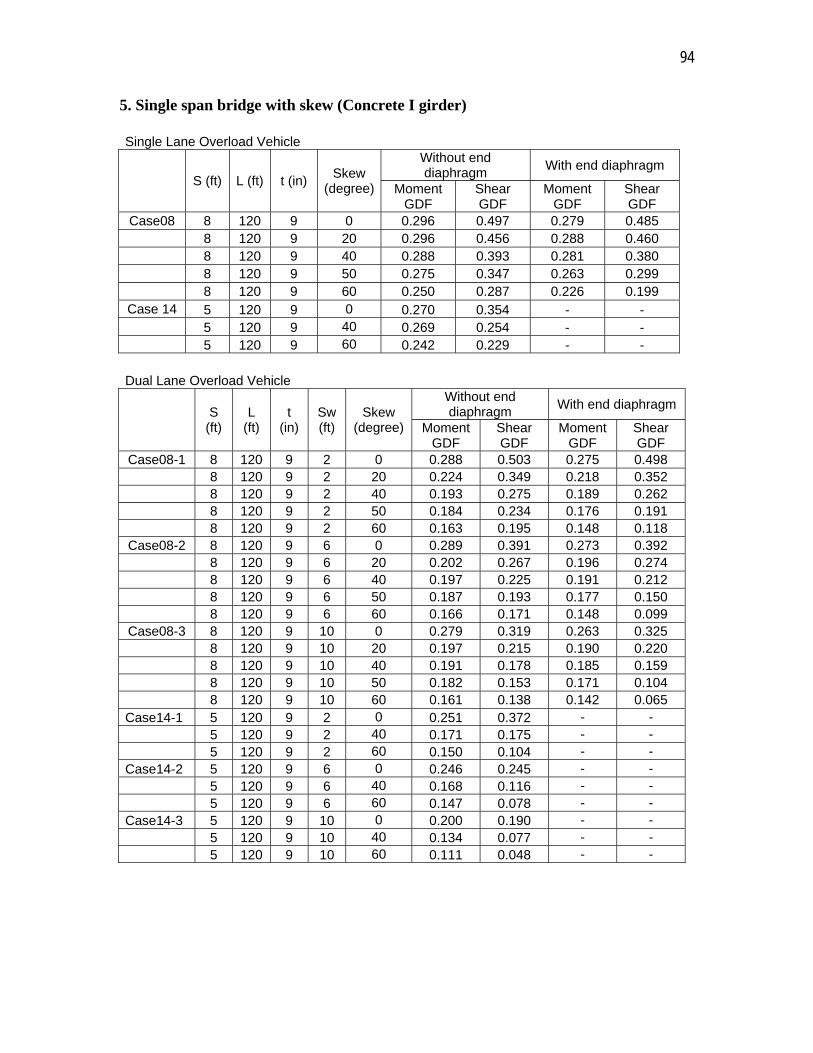
94
5. Single span bridge with skew (Concrete I girder) Single Lane Overload Vehicle
S (ft) L (ft) t (in) Skew
(degree)
Without end diaphragm
With end diaphragm
Moment GDF
Shear GDF
Moment GDF
Shear GDF
Case08 8 120 9 0 0.296 0.497 0.279 0.485 8 120 9 20 0.296 0.456 0.288 0.460 8 120 9 40 0.288 0.393 0.281 0.380 8 120 9 50 0.275 0.347 0.263 0.299 8 120 9 60 0.250 0.287 0.226 0.199
Case 14 5 120 9 0 0.270 0.354 - - 5 120 9 40 0.269 0.254 - - 5 120 9 60 0.242 0.229 - -
Dual Lane Overload Vehicle
S
(ft) L
(ft) t
(in) Sw (ft)
Skew (degree)
Without end diaphragm
With end diaphragm
Moment GDF
Shear GDF
Moment GDF
Shear GDF
Case08-1 8 120 9 2 0 0.288 0.503 0.275 0.498 8 120 9 2 20 0.224 0.349 0.218 0.352 8 120 9 2 40 0.193 0.275 0.189 0.262 8 120 9 2 50 0.184 0.234 0.176 0.191 8 120 9 2 60 0.163 0.195 0.148 0.118
Case08-2 8 120 9 6 0 0.289 0.391 0.273 0.392 8 120 9 6 20 0.202 0.267 0.196 0.274 8 120 9 6 40 0.197 0.225 0.191 0.212 8 120 9 6 50 0.187 0.193 0.177 0.150 8 120 9 6 60 0.166 0.171 0.148 0.099
Case08-3 8 120 9 10 0 0.279 0.319 0.263 0.325 8 120 9 10 20 0.197 0.215 0.190 0.220 8 120 9 10 40 0.191 0.178 0.185 0.159 8 120 9 10 50 0.182 0.153 0.171 0.104 8 120 9 10 60 0.161 0.138 0.142 0.065
Case14-1 5 120 9 2 0 0.251 0.372 - - 5 120 9 2 40 0.171 0.175 - - 5 120 9 2 60 0.150 0.104 - - Case14-2 5 120 9 6 0 0.246 0.245 - - 5 120 9 6 40 0.168 0.116 - - 5 120 9 6 60 0.147 0.078 - - Case14-3 5 120 9 10 0 0.200 0.190 - - 5 120 9 10 40 0.134 0.077 - - 5 120 9 10 60 0.111 0.048 - -
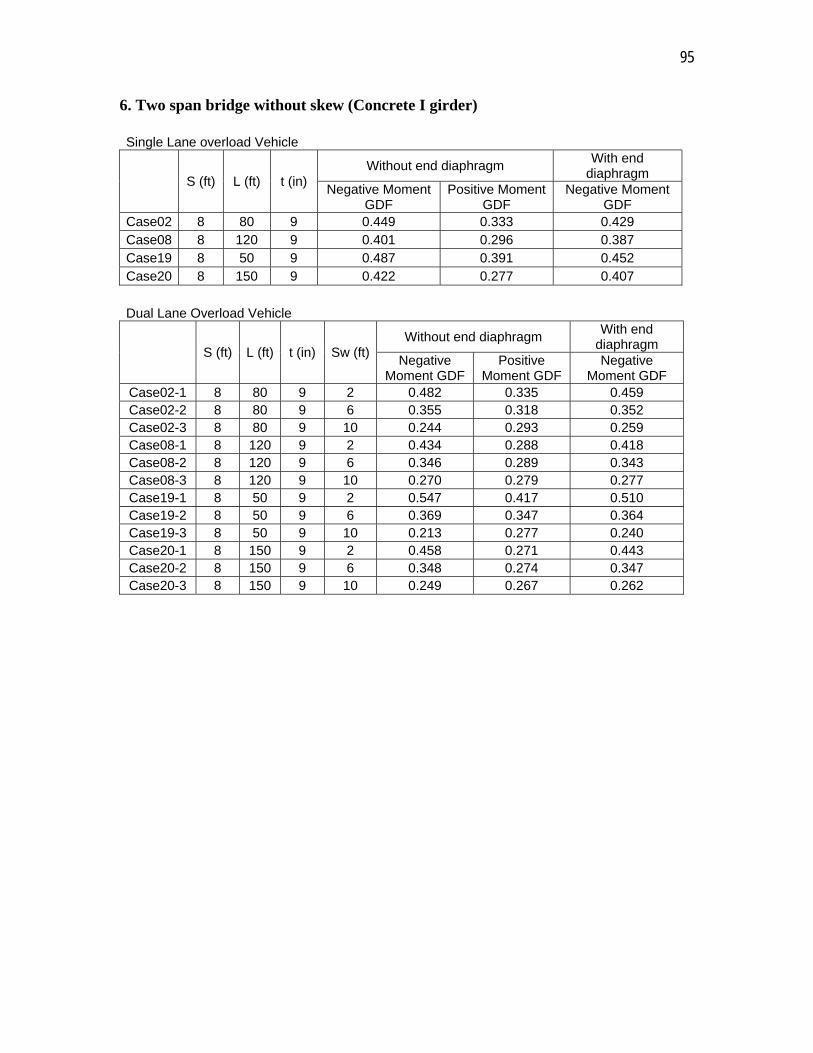
95
6. Two span bridge without skew (Concrete I girder) Single Lane overload Vehicle
S (ft) L (ft) t (in) Without end diaphragm
With end diaphragm
Negative Moment GDF
Positive Moment GDF
Negative Moment GDF
Case02 8 80 9 0.449 0.333 0.429 Case08 8 120 9 0.401 0.296 0.387 Case19 8 50 9 0.487 0.391 0.452 Case20 8 150 9 0.422 0.277 0.407
Dual Lane Overload Vehicle
S (ft) L (ft) t (in) Sw (ft)Without end diaphragm
With end diaphragm
Negative Moment GDF
Positive Moment GDF
Negative Moment GDF
Case02-1 8 80 9 2 0.482 0.335 0.459 Case02-2 8 80 9 6 0.355 0.318 0.352 Case02-3 8 80 9 10 0.244 0.293 0.259 Case08-1 8 120 9 2 0.434 0.288 0.418 Case08-2 8 120 9 6 0.346 0.289 0.343 Case08-3 8 120 9 10 0.270 0.279 0.277 Case19-1 8 50 9 2 0.547 0.417 0.510 Case19-2 8 50 9 6 0.369 0.347 0.364 Case19-3 8 50 9 10 0.213 0.277 0.240 Case20-1 8 150 9 2 0.458 0.271 0.443 Case20-2 8 150 9 6 0.348 0.274 0.347 Case20-3 8 150 9 10 0.249 0.267 0.262
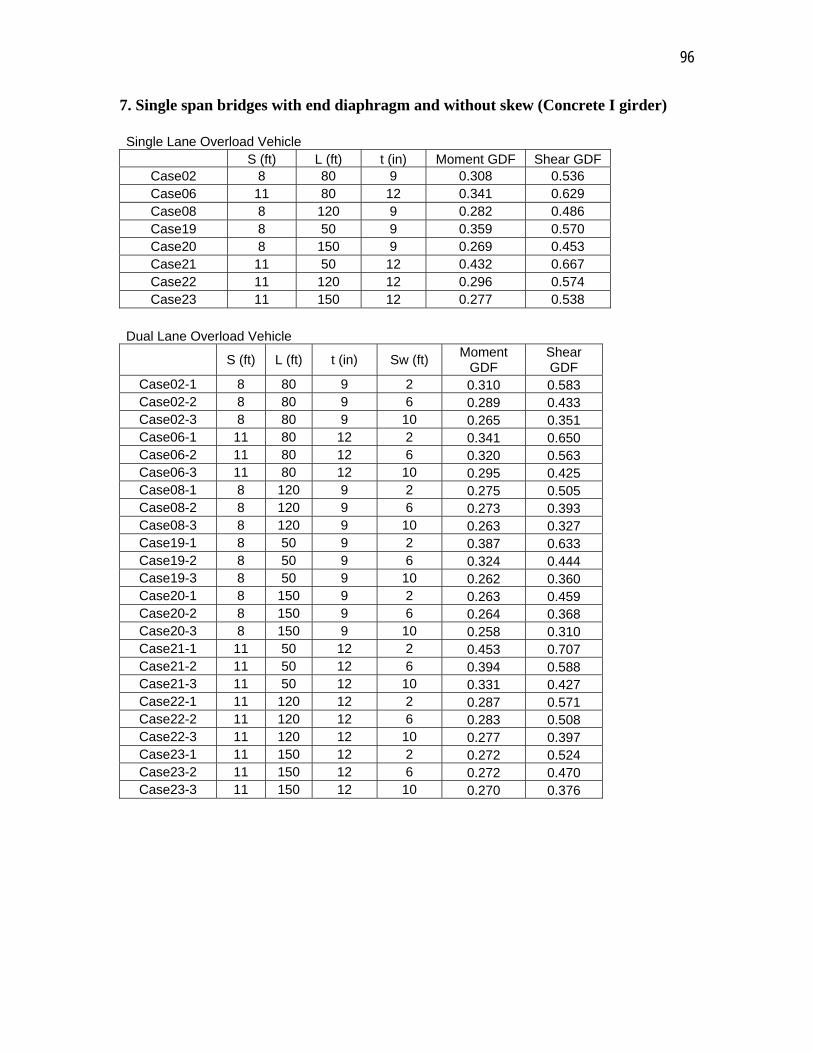
96
7. Single span bridges with end diaphragm and without skew (Concrete I girder) Single Lane Overload Vehicle
S (ft) L (ft) t (in) Moment GDF Shear GDF Case02 8 80 9 0.308 0.536 Case06 11 80 12 0.341 0.629 Case08 8 120 9 0.282 0.486 Case19 8 50 9 0.359 0.570 Case20 8 150 9 0.269 0.453 Case21 11 50 12 0.432 0.667 Case22 11 120 12 0.296 0.574 Case23 11 150 12 0.277 0.538
Dual Lane Overload Vehicle
S (ft) L (ft) t (in) Sw (ft) Moment
GDF Shear GDF
Case02-1 8 80 9 2 0.310 0.583 Case02-2 8 80 9 6 0.289 0.433 Case02-3 8 80 9 10 0.265 0.351 Case06-1 11 80 12 2 0.341 0.650 Case06-2 11 80 12 6 0.320 0.563 Case06-3 11 80 12 10 0.295 0.425 Case08-1 8 120 9 2 0.275 0.505 Case08-2 8 120 9 6 0.273 0.393 Case08-3 8 120 9 10 0.263 0.327 Case19-1 8 50 9 2 0.387 0.633 Case19-2 8 50 9 6 0.324 0.444 Case19-3 8 50 9 10 0.262 0.360 Case20-1 8 150 9 2 0.263 0.459 Case20-2 8 150 9 6 0.264 0.368 Case20-3 8 150 9 10 0.258 0.310 Case21-1 11 50 12 2 0.453 0.707 Case21-2 11 50 12 6 0.394 0.588 Case21-3 11 50 12 10 0.331 0.427 Case22-1 11 120 12 2 0.287 0.571 Case22-2 11 120 12 6 0.283 0.508 Case22-3 11 120 12 10 0.277 0.397 Case23-1 11 150 12 2 0.272 0.524 Case23-2 11 150 12 6 0.272 0.470 Case23-3 11 150 12 10 0.270 0.376