Embed Size (px)
Citation preview
NATIONAL CENTER FOR EDUCATION STATISTICS
Statistical Analysis Report May 2001
Postsecondary Education Descriptive Analysis Reports
Bridging the GapAcademic Preparation andPostsecondary Success ofFirst-Generation Students
Edward C. WarburtonRosio BugarinAnne-Marie NuñezMPR Associates, Inc.
C. Dennis CarrollProject OfficerNational Center for Education Statistics
U.S. Department of EducationOffice of Educational Research and Improvement NCES 2001–153
U.S. Department of EducationRod PaigeSecretary
National Center for Education StatisticsGary W. PhillipsActing Commissioner
The National Center for Education Statistics (NCES) is the primary federal entity for collecting, analyzing,and reporting data related to education in the United States and other nations. It fulfills a congressionalmandate to collect, collate, analyze, and report full and complete statistics on the condition of education inthe United States; conduct and publish reports and specialized analyses of the meaning and significanceof such statistics; assist state and local education agencies in improving their statistical systems; andreview and report on education activities in foreign countries.
NCES activities are designed to address high priority education data needs; provide consistent, reliable,complete, and accurate indicators of education status and trends; and report timely, useful, and highquality data to the U.S. Department of Education, the Congress, the states, other education policymakers,practitioners, data users, and the general public.
We strive to make our products available in a variety of formats and in language that is appropriate to avariety of audiences. You, as our customer, are the best judge of our success in communicating informa-tion effectively. If you have any comments or suggestions about this or any other NCES product or report,we would like to hear from you. Please direct your comments to:
National Center for Education StatisticsOffice of Educational Research and ImprovementU.S. Department of Education1990 K Street NWWashington, DC 20006-5574
May 2001
The NCES World Wide Web Home Page is: http://nces.ed.govThe NCES World Wide Web Electronic Catalog is: http://nces.ed.gov/pubsearch/index.asp
Suggested CitationU.S. Department of Education. National Center for Education Statistics. Bridging the Gap: AcademicPreparation and Postsecondary Success of First-Generation Students, NCES 2001–153, by Edward C.Warburton, Rosio Bugarin, and Anne-Marie Nuñez. Project Officer: C. Dennis Carroll. Washington, DC:2001.
For ordering information on this report, write:U.S. Department of EducationED PubsP.O. Box 1398Jessup, MD 20794-1398
or call toll free 1-877-4ED-PUBS or go to the Internet: http://www.ed.gov/pubs/edpubs.html
Contact:Aurora D’Amico(202) 502-7334
iii
Executive Summary
This report examines the high school prepara-tion and postsecondary persistence of first-generation students—those students whose par-ents had no education beyond high school—andcompares them with students whose parents wentto college. Previous research has demonstratedthat first-generation students exhibit differentcollege enrollment and persistence behaviors thantheir counterparts whose parents have more edu-cation. Such studies found that first-generationstudents were less likely than their peers to com-plete advanced mathematics classes in highschool. Even among those qualified for college,first-generation students were less likely to enrollin 4-year institutions (Horn and Nuñez 2000). In-dependent of other relevant demographic, enroll-ment, and college involvement factors, first-generation status was also found to be negativelyassociated with students’ persistence and attain-ment (Nuñez and Cuccaro-Alamin 1998).
What has not been well understood, however,is the extent to which the academic preparation offirst-generation students in high school affectstheir persistence and attainment in postsecondaryeducation. The purpose of this report is to exam-ine whether first-generation students who wereotherwise equally prepared academically werecomparable to students whose parents went tocollege in terms of their grade-point averages(GPAs), number of remedial courses in post-secondary education, and rates of persistence (thatis, whether they were retained at their first institu-tion, had stayed on a persistence track toward the
bachelor’s degree,1 or had attained a degree). Thisanalysis focuses on a subset of 1995–96 beginningpostsecondary students who started their post-secondary education in 4-year institutions.
High School Coursetaking
The academic rigor of students’ high schoolcurriculum2 was strongly associated with theirpostsecondary GPA, the amount of remedialcoursework they took, and with their rates of per-sistence and attainment. As overall high schoolacademic rigor increased, so did students’ GPA.Students who did not exceed the requirements ofthe core New Basics curriculum had a lower GPAthan did those who exceeded them (2.5 points ver-sus 3.1 points). The rigor of students’ high schoolcurriculum was also related to the number of re-medial courses they took during their first year ofpostsecondary education. As the rigor of the sec-ondary curriculum increased, the proportion ofstudents who took one or more remedial coursesdecreased from 21 percent to 3 percent.
1Students’ status with respect to the “persistence track to abachelor’s degree” is defined by three values: stayed on thepersistence track (i.e., stayed in the same 4-year institution ormade a lateral transfer to a different 4-year institution), leftthe persistence track (“stopped out” for more than 4 monthsor made an immediate or delayed downward transfer), or leftpostsecondary education (was neither still enrolled at theinitial institution nor had transferred to another postsecondaryinstitution).2“Academic rigor” is defined by four variables that describethe overall difficulty of students’ high school coursework:core New Basics or below, beyond New Basics I (somewhatexceeded core New Basics), beyond New Basics II (substan-tially exceeded core New Basics), and rigorous (maximallyexceeded core New Basics).
Executive Summary
iv
High school academic preparation was also re-lated to students’ likelihood of remaining enrolledin postsecondary education. In general, the morerigorous their high school curriculum, the morelikely students were to persist (or to attain a de-gree) at the initial postsecondary institution inwhich they enrolled. While 62 percent of studentswho did not exceed the core New Basics require-ments were still enrolled or had attained a degreein spring 1998, 84 percent of students who ex-ceeded the requirements did so. Likewise, themore rigorous the students’ high school curricu-lum, the higher their likelihood of staying on thepersistence track to a bachelor’s degree: 87 per-cent of students who took rigorous academiccoursework in high school stayed on the persis-tence track, compared with 62 percent of studentswho did not take such coursework. Finally, stu-dents whose curriculum was rigorous were morelikely to still be enrolled and working for a degreethan students who did not exceed the core NewBasics requirements (93 percent versus 75 percent).
Effect of First-Generation Status
This study found a relationship between par-ents’ education level and the likelihood that stu-dents would undertake a more rigorous highschool curriculum and, consequently, enroll, per-form well, and persist in 4-year postsecondaryinstitutions. Overall, first-generation status wasshown to have a negative association with stu-dents’ academic preparation and persistence.
Preparation for Postsecondary EducationCompared with students whose parents were
college graduates,3 first-generation students wereless likely to have taken calculus in high school(20 percent versus 34 percent). A full 40 percent
3Whenever the term “college graduates” is used, it means thatat least one parent had attained a bachelor’s degree.
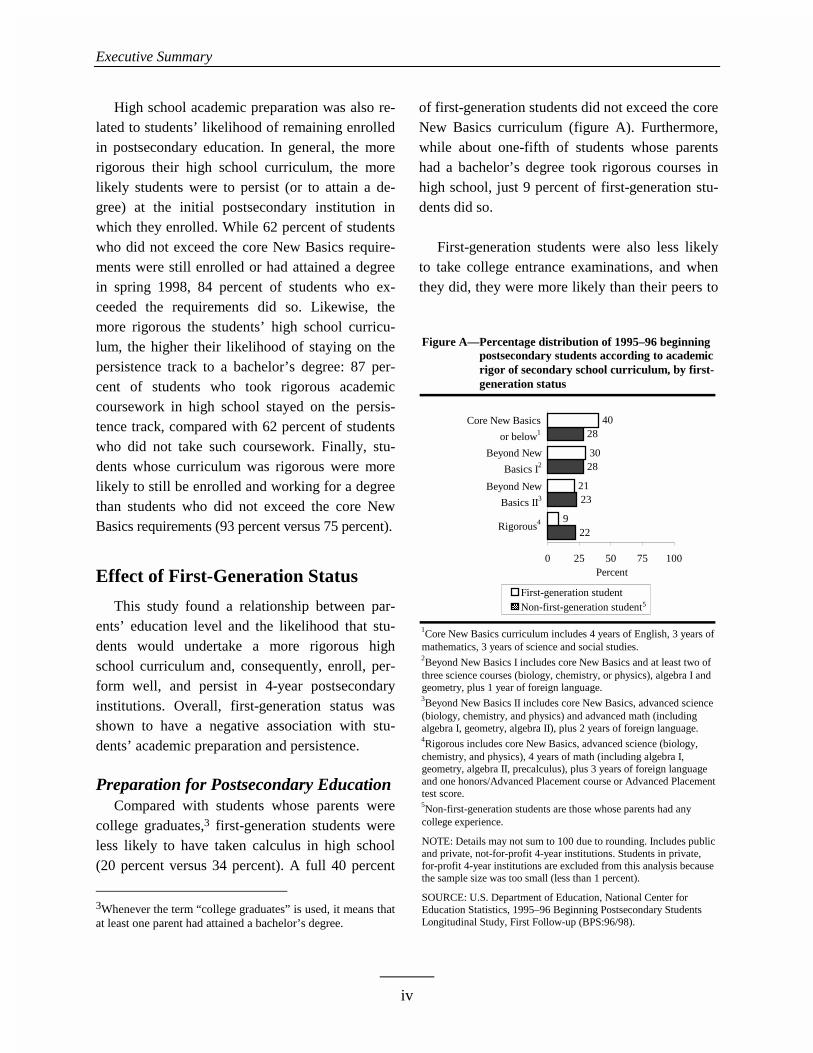
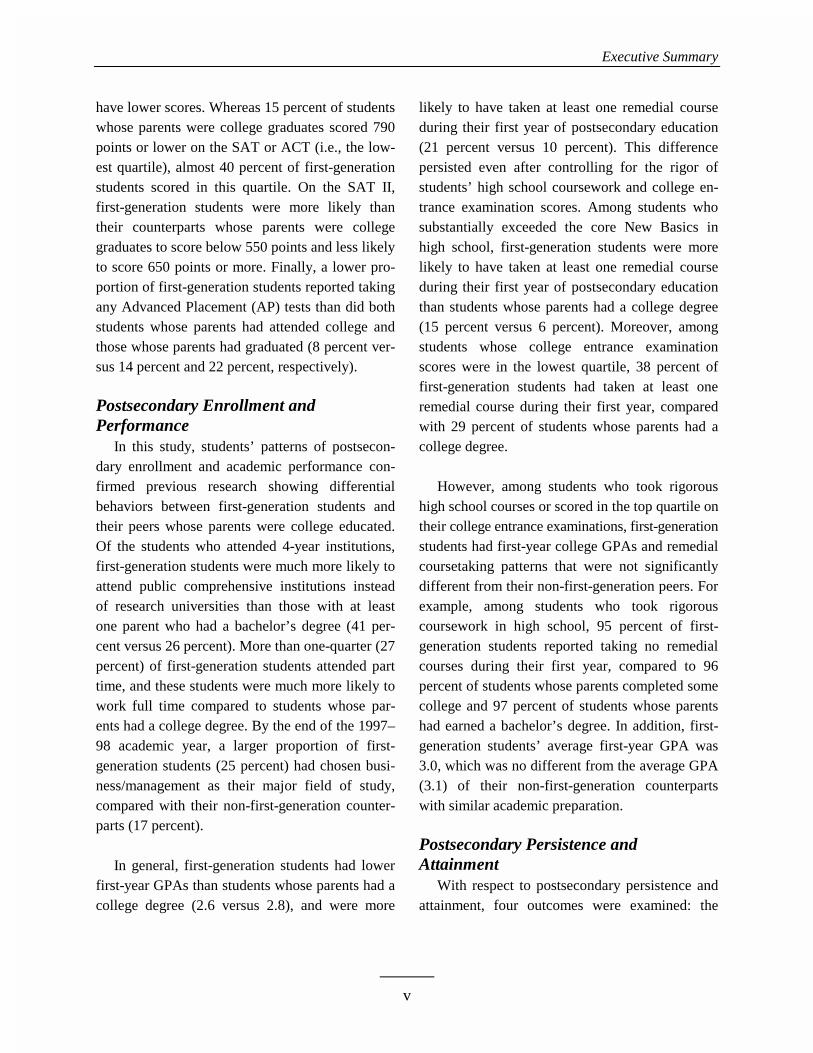
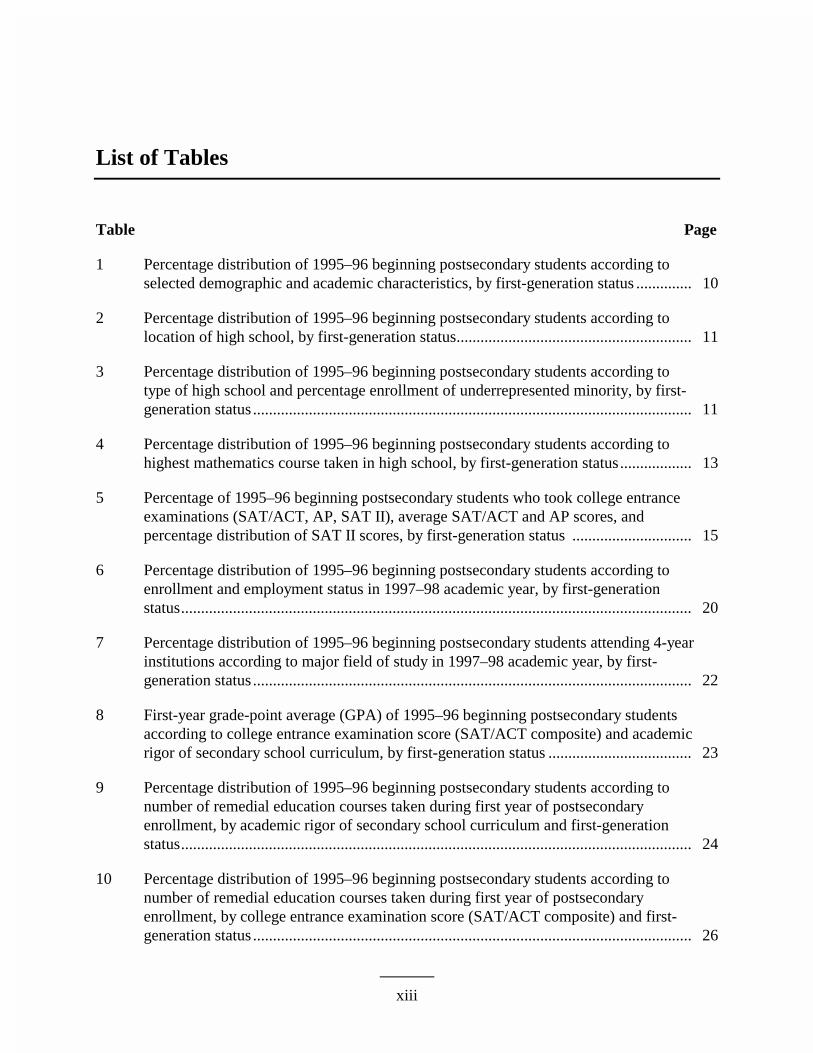
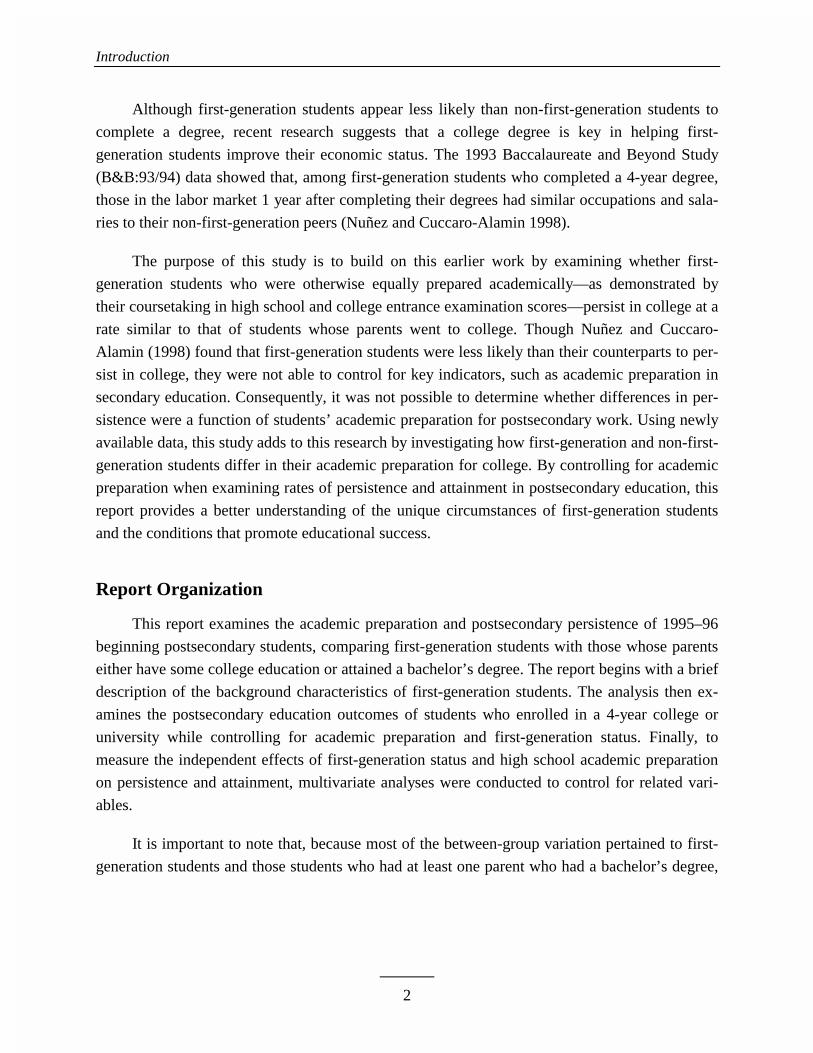
of first-generation students did not exceed the coreNew Basics curriculum (figure A). Furthermore,while about one-fifth of students whose parentshad a bachelor’s degree took rigorous courses inhigh school, just 9 percent of first-generation stu-dents did so.
First-generation students were also less likelyto take college entrance examinations, and whenthey did, they were more likely than their peers to
Figure A—Percentage distribution of 1995–96 beginningFigure A—postsecondary students according to academicFigure A—rigor of secondary school curriculum, by first-Figure A—generation status
1Core New Basics curriculum includes 4 years of English, 3 years ofmathematics, 3 years of science and social studies.2Beyond New Basics I includes core New Basics and at least two ofthree science courses (biology, chemistry, or physics), algebra I andgeometry, plus 1 year of foreign language.3Beyond New Basics II includes core New Basics, advanced science(biology, chemistry, and physics) and advanced math (includingalgebra I, geometry, algebra II), plus 2 years of foreign language.4Rigorous includes core New Basics, advanced science (biology,chemistry, and physics), 4 years of math (including algebra I,geometry, algebra II, precalculus), plus 3 years of foreign languageand one honors/Advanced Placement course or Advanced Placementtest score.5Non-first-generation students are those whose parents had anycollege experience.
NOTE: Details may not sum to 100 due to rounding. Includes publicand private, not-for-profit 4-year institutions. Students in private,for-profit 4-year institutions are excluded from this analysis becausethe sample size was too small (less than 1 percent).
SOURCE: U.S. Department of Education, National Center forEducation Statistics, 1995–96 Beginning Postsecondary StudentsLongitudinal Study, First Follow-up (BPS:96/98).
22
23
28
28
9
21
30
40
0 25 50 75 100
Rigorous
Beyond New Basics II
Beyond New Basics I
Core New Basics or below
Percent
First-generation studentNon-first-generation student
Core New Basics
or below1
Rigorous4
Beyond New
Basics II3
Beyond New
Basics I2
5
Executive Summary
v
have lower scores. Whereas 15 percent of studentswhose parents were college graduates scored 790points or lower on the SAT or ACT (i.e., the low-est quartile), almost 40 percent of first-generationstudents scored in this quartile. On the SAT II,first-generation students were more likely thantheir counterparts whose parents were collegegraduates to score below 550 points and less likelyto score 650 points or more. Finally, a lower pro-portion of first-generation students reported takingany Advanced Placement (AP) tests than did bothstudents whose parents had attended college andthose whose parents had graduated (8 percent ver-sus 14 percent and 22 percent, respectively).
Postsecondary Enrollment andPerformance
In this study, students’ patterns of postsecon-dary enrollment and academic performance con-firmed previous research showing differentialbehaviors between first-generation students andtheir peers whose parents were college educated.Of the students who attended 4-year institutions,first-generation students were much more likely toattend public comprehensive institutions insteadof research universities than those with at leastone parent who had a bachelor’s degree (41 per-cent versus 26 percent). More than one-quarter (27percent) of first-generation students attended parttime, and these students were much more likely towork full time compared to students whose par-ents had a college degree. By the end of the 1997–98 academic year, a larger proportion of first-generation students (25 percent) had chosen busi-ness/management as their major field of study,compared with their non-first-generation counter-parts (17 percent).
In general, first-generation students had lowerfirst-year GPAs than students whose parents had acollege degree (2.6 versus 2.8), and were more
likely to have taken at least one remedial courseduring their first year of postsecondary education(21 percent versus 10 percent). This differencepersisted even after controlling for the rigor ofstudents’ high school coursework and college en-trance examination scores. Among students whosubstantially exceeded the core New Basics inhigh school, first-generation students were morelikely to have taken at least one remedial courseduring their first year of postsecondary educationthan students whose parents had a college degree(15 percent versus 6 percent). Moreover, amongstudents whose college entrance examinationscores were in the lowest quartile, 38 percent offirst-generation students had taken at least oneremedial course during their first year, comparedwith 29 percent of students whose parents had acollege degree.
However, among students who took rigoroushigh school courses or scored in the top quartile ontheir college entrance examinations, first-generationstudents had first-year college GPAs and remedialcoursetaking patterns that were not significantlydifferent from their non-first-generation peers. Forexample, among students who took rigorouscoursework in high school, 95 percent of first-generation students reported taking no remedialcourses during their first year, compared to 96percent of students whose parents completed somecollege and 97 percent of students whose parentshad earned a bachelor’s degree. In addition, first-generation students’ average first-year GPA was3.0, which was no different from the average GPA(3.1) of their non-first-generation counterpartswith similar academic preparation.
Postsecondary Persistence andAttainment
With respect to postsecondary persistence andattainment, four outcomes were examined: the
Executive Summary
vi
number of enrollment spells,4 retention at the ini-tial 4-year institution, persistence track to abachelor’s degree, and attainment or last academicyear of enrollment through 1998.
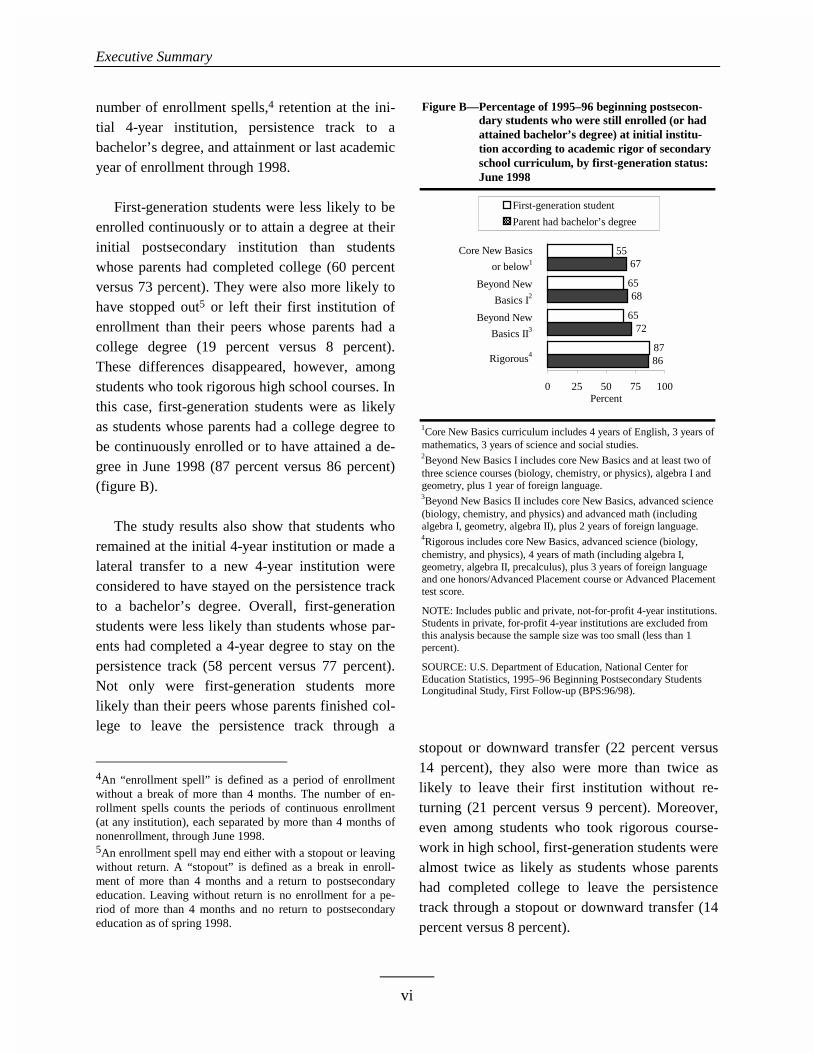
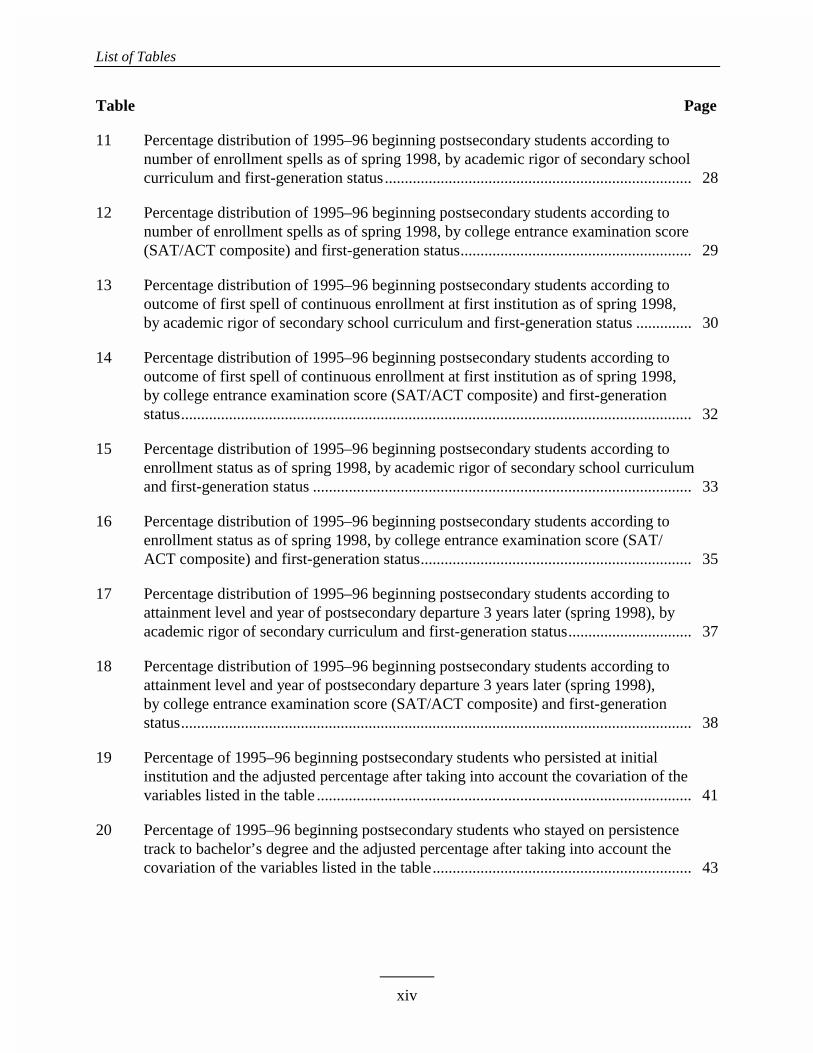
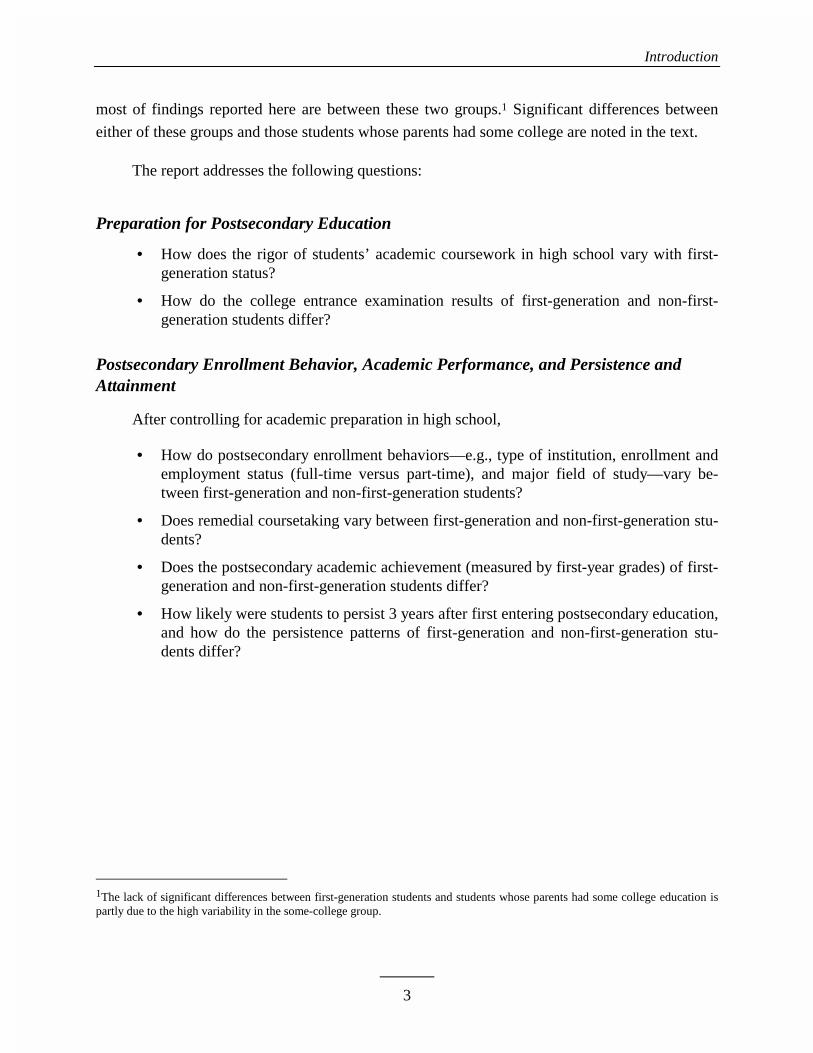
First-generation students were less likely to beenrolled continuously or to attain a degree at theirinitial postsecondary institution than studentswhose parents had completed college (60 percentversus 73 percent). They were also more likely tohave stopped out5 or left their first institution ofenrollment than their peers whose parents had acollege degree (19 percent versus 8 percent).These differences disappeared, however, amongstudents who took rigorous high school courses. Inthis case, first-generation students were as likelyas students whose parents had a college degree tobe continuously enrolled or to have attained a de-gree in June 1998 (87 percent versus 86 percent)(figure B).
The study results also show that students whoremained at the initial 4-year institution or made alateral transfer to a new 4-year institution wereconsidered to have stayed on the persistence trackto a bachelor’s degree. Overall, first-generationstudents were less likely than students whose par-ents had completed a 4-year degree to stay on thepersistence track (58 percent versus 77 percent).Not only were first-generation students morelikely than their peers whose parents finished col-lege to leave the persistence track through a
4An “enrollment spell” is defined as a period of enrollmentwithout a break of more than 4 months. The number of en-rollment spells counts the periods of continuous enrollment(at any institution), each separated by more than 4 months ofnonenrollment, through June 1998.5An enrollment spell may end either with a stopout or leavingwithout return. A “stopout” is defined as a break in enroll-ment of more than 4 months and a return to postsecondaryeducation. Leaving without return is no enrollment for a pe-riod of more than 4 months and no return to postsecondaryeducation as of spring 1998.
Figure B—Percentage of 1995–96 beginning postsecon-Figure B—dary students who were still enrolled (or hadFigure B—attained bachelor’s degree) at initial institu-Figure B—tion according to academic rigor of secondaryFigure B—school curriculum, by first-generation status:Figure B—June 1998
1Core New Basics curriculum includes 4 years of English, 3 years ofmathematics, 3 years of science and social studies.2Beyond New Basics I includes core New Basics and at least two ofthree science courses (biology, chemistry, or physics), algebra I andgeometry, plus 1 year of foreign language.3Beyond New Basics II includes core New Basics, advanced science(biology, chemistry, and physics) and advanced math (includingalgebra I, geometry, algebra II), plus 2 years of foreign language.4Rigorous includes core New Basics, advanced science (biology,chemistry, and physics), 4 years of math (including algebra I,geometry, algebra II, precalculus), plus 3 years of foreign languageand one honors/Advanced Placement course or Advanced Placementtest score.
NOTE: Includes public and private, not-for-profit 4-year institutions.Students in private, for-profit 4-year institutions are excluded fromthis analysis because the sample size was too small (less than 1percent).
SOURCE: U.S. Department of Education, National Center forEducation Statistics, 1995–96 Beginning Postsecondary StudentsLongitudinal Study, First Follow-up (BPS:96/98).
86
72
68
67
87
65
65
55
0 25 50 75 100
Rigorous
Beyond New Basics II
Beyond New Basics I
Core New Basics or below
Percent
First-generation student
Parent had bachelor’s degree
Core New Basics
or below1
Rigorous4
Beyond New
Basics II3
Beyond New
Basics I2
stopout or downward transfer (22 percent versus14 percent), they also were more than twice aslikely to leave their first institution without re-turning (21 percent versus 9 percent). Moreover,even among students who took rigorous course-work in high school, first-generation students werealmost twice as likely as students whose parentshad completed college to leave the persistencetrack through a stopout or downward transfer (14percent versus 8 percent).
Executive Summary
vii
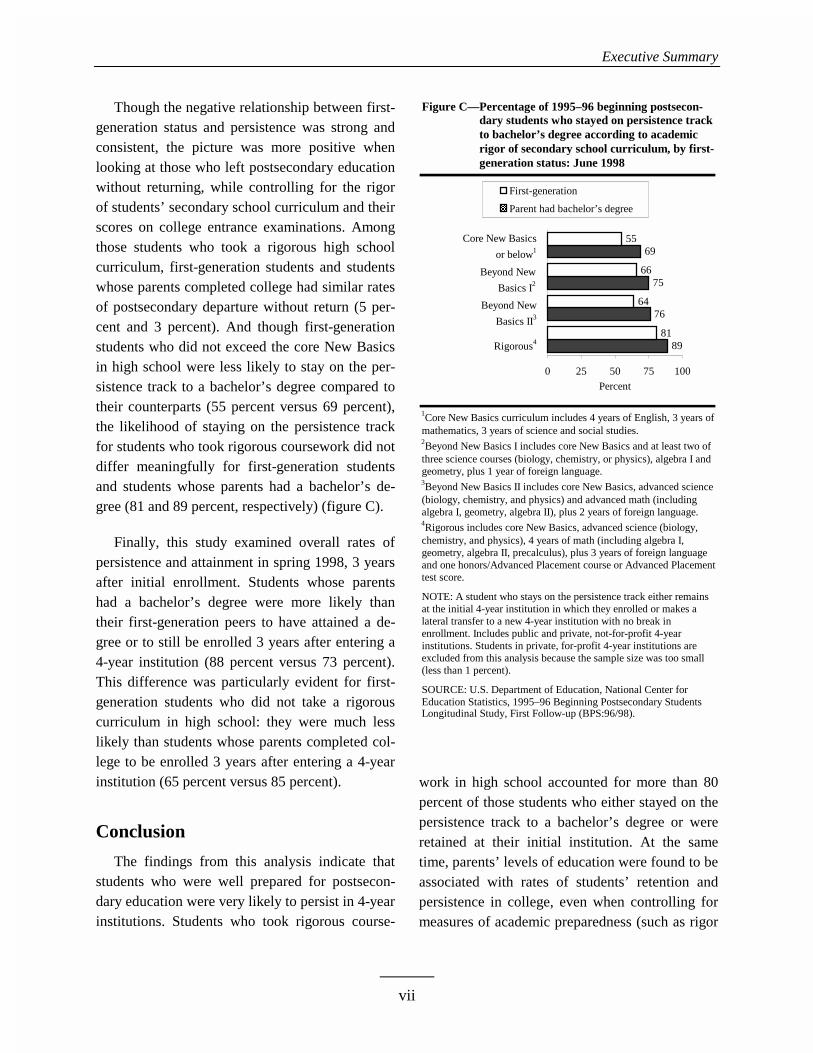
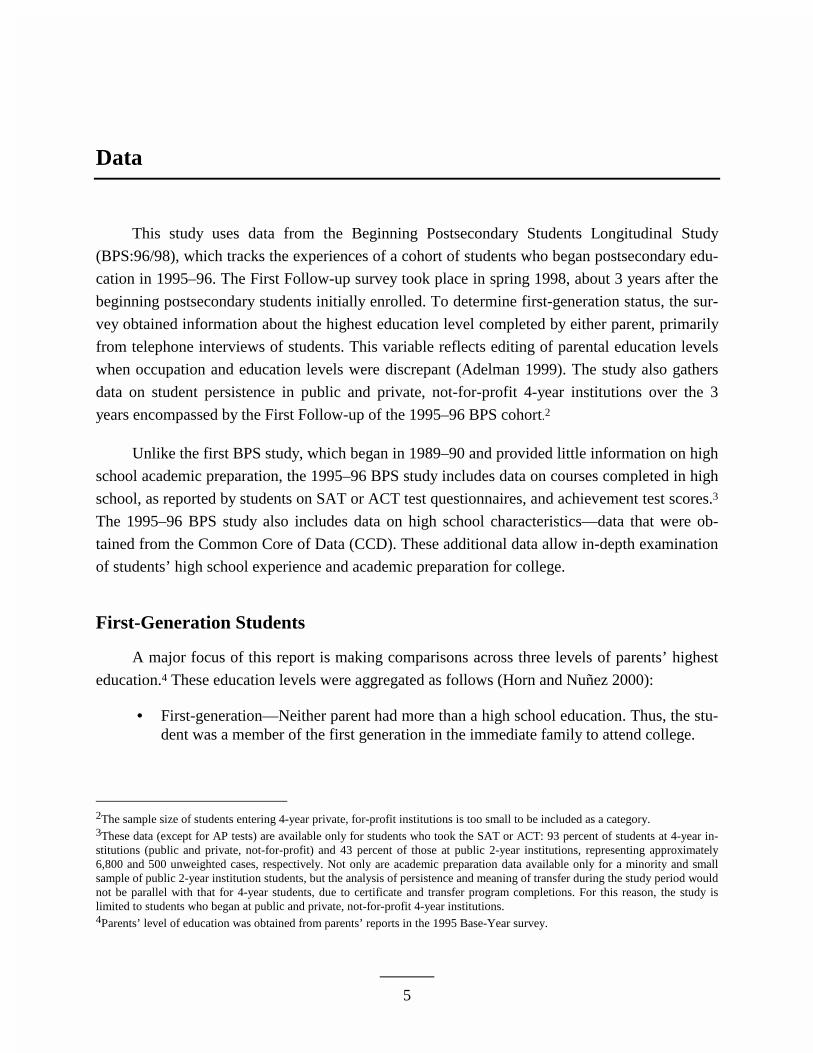
Though the negative relationship between first-generation status and persistence was strong andconsistent, the picture was more positive whenlooking at those who left postsecondary educationwithout returning, while controlling for the rigorof students’ secondary school curriculum and theirscores on college entrance examinations. Amongthose students who took a rigorous high schoolcurriculum, first-generation students and studentswhose parents completed college had similar ratesof postsecondary departure without return (5 per-cent and 3 percent). And though first-generationstudents who did not exceed the core New Basicsin high school were less likely to stay on the per-sistence track to a bachelor’s degree compared totheir counterparts (55 percent versus 69 percent),the likelihood of staying on the persistence trackfor students who took rigorous coursework did notdiffer meaningfully for first-generation studentsand students whose parents had a bachelor’s de-gree (81 and 89 percent, respectively) (figure C).
Finally, this study examined overall rates ofpersistence and attainment in spring 1998, 3 yearsafter initial enrollment. Students whose parentshad a bachelor’s degree were more likely thantheir first-generation peers to have attained a de-gree or to still be enrolled 3 years after entering a4-year institution (88 percent versus 73 percent).This difference was particularly evident for first-generation students who did not take a rigorouscurriculum in high school: they were much lesslikely than students whose parents completed col-lege to be enrolled 3 years after entering a 4-yearinstitution (65 percent versus 85 percent).
Conclusion
The findings from this analysis indicate thatstudents who were well prepared for postsecon-dary education were very likely to persist in 4-yearinstitutions. Students who took rigorous course-
Figure C—Percentage of 1995–96 beginning postsecon-Figure C—dary students who stayed on persistence trackFigure C—to bachelor’s degree according to academicFigure C—rigor of secondary school curriculum, by first-Figure C—generation status: June 1998
1Core New Basics curriculum includes 4 years of English, 3 years ofmathematics, 3 years of science and social studies.2Beyond New Basics I includes core New Basics and at least two ofthree science courses (biology, chemistry, or physics), algebra I andgeometry, plus 1 year of foreign language.3Beyond New Basics II includes core New Basics, advanced science(biology, chemistry, and physics) and advanced math (includingalgebra I, geometry, algebra II), plus 2 years of foreign language.4Rigorous includes core New Basics, advanced science (biology,chemistry, and physics), 4 years of math (including algebra I,geometry, algebra II, precalculus), plus 3 years of foreign languageand one honors/Advanced Placement course or Advanced Placementtest score.
NOTE: A student who stays on the persistence track either remainsat the initial 4-year institution in which they enrolled or makes alateral transfer to a new 4-year institution with no break inenrollment. Includes public and private, not-for-profit 4-yearinstitutions. Students in private, for-profit 4-year institutions areexcluded from this analysis because the sample size was too small(less than 1 percent).
SOURCE: U.S. Department of Education, National Center forEducation Statistics, 1995–96 Beginning Postsecondary StudentsLongitudinal Study, First Follow-up (BPS:96/98).
89
76
75
69
81
64
66
55
0 25 50 75 100
Rigorous
Beyond New Basics II
Beyond New Basics I
Core New Basics or below
Percent
First-generation
Parent had bachelor’s degree
Core New Basics
or below1
Rigorous4
Beyond New
Basics II3
Beyond New
Basics I2
work in high school accounted for more than 80percent of those students who either stayed on thepersistence track to a bachelor’s degree or wereretained at their initial institution. At the sametime, parents’ levels of education were found to beassociated with rates of students’ retention andpersistence in college, even when controlling formeasures of academic preparedness (such as rigor
Executive Summary
viii
of secondary curriculum and college entrance ex-amination scores).
These findings hold true even when other re-lated variables are held constant. That is, evenafter controlling for variables such as academicpreparation and postsecondary achievement, par-ents’ education continued to be a significant factorin determining whether students persisted, wereenrolled at their initial institution 3 years afterentering, or stayed on the persistence track. Stu-dents whose parents attained a bachelor’s degreewere more likely than first-generation students toremain enrolled at their initial 4-year institution.Likewise, after controlling for related variables,students whose parents attained a bachelor’s de-
gree or higher were more likely to stay on the per-sistence track to a bachelor’s degree than first-generation students.
At the same time, after holding all other vari-ables constant, students who took rigorouscoursework in high school significantly increasedtheir chances of staying on the persistence track toa bachelor’s degree. Taken together, these resultssuggest that, while first-generation status is animportant predictor of success in postsecondaryeducation, rigorous preparation in high schoolsubstantially narrows the gap in postsecondaryoutcomes between first-generation students andtheir peers whose parents graduated from college.
ix
Foreword
This report describes the experiences of a subset of 1995–96 beginning postsecondary stu-
dents. It examines the high school preparation and postsecondary education persistence of first-
generation students—that is, students whose parents never enrolled in college—and compares
them with students whose parents attended or graduated from college.
This report uses data from the 1995–96 Beginning Postsecondary Students Longitudinal
Study (BPS:96/98), First Follow-up, which tracks the experiences of a cohort of students who
began postsecondary education in 1995–96. The First Follow-up was conducted in spring 1998,
about 3 years after this cohort of students first enrolled. Unlike the original BPS study, which
was administered in 1989–90 and provided little information on students’ high school academic
preparation, the BPS:96/98 First Follow-up includes data on courses completed in high school, as
reported by students on SAT or ACT test questionnaires and student achievement test scores.
The estimates presented in the report (mostly percentages) were produced using the NCES
Data Analysis System (DAS), a microcomputer application that allows users to specify and gen-
erate tables, for the BPS:96/98 study. The DAS produces the design-adjusted standard errors
necessary for testing the statistical significance of differences in the estimates. For more infor-
mation on the DAS, readers should consult appendix B of this report.
x
Acknowledgments
The authors wish to thank the many individuals who contributed to this report. At NCES
Paula Knepper provided a comprehensive technical review of the methods and content. The final
draft was reviewed by an adjudication panel lead by Karen O’Conor (NCES, Office of the Dep-
uty Commissioner) who chaired the panel. Also from NCES were Ilona Berkovits (El/Sec Sam-
ple Survey Studies Program) and John Wirt (Annual Reports Program). Other Department of
Education reviewers included Elaine Gilby (Planning and Evaluation Service, Office of the Un-
der Secretary), Ann Mullen (OERI), and John Oberg (Office of Vocational and Adult Education).
A special thanks to Ken Redd from the National Association of Student Financial Aid Adminis-
trators (NASFAA) for his thorough review of the final report.
At MPR Associates, special thanks go to Barbara Kridl for overseeing the production proc-
ess, Francesca Tussing for formatting the tables and preparing the final layout, and Andrea
Livingston for editing and proofreading the report. Helen Jang provided invaluable administra-
tive and technical support at all stages of development and production. Laura Horn reviewed the
report and made helpful suggestions from the early planning stages through the final report.
xi
Table of Contents
PageExecutive Summary .................................................................................................................. iii
Foreword .................................................................................................................................... ix
Acknowledgments...................................................................................................................... x
List of Tables ............................................................................................................................. xiii
List of Figures ............................................................................................................................ xvi
Introduction ............................................................................................................................... 1Report Organization .............................................................................................................. 2
Data............................................................................................................................................. 5First-Generation Students...................................................................................................... 5Preparation for Postsecondary Education.............................................................................. 6Postsecondary Enrollment and Performance......................................................................... 7Persistence and Attainment ................................................................................................... 8
Profile of First-Generation Students ....................................................................................... 9High School Location and Type............................................................................................ 9
Preparation for Postsecondary Education .............................................................................. 13Academic Preparation ........................................................................................................... 13Advanced Placement and College Entrance Examinations................................................... 14
Postsecondary Education.......................................................................................................... 19Academic Performance ......................................................................................................... 21
Persistence and Attainment ...................................................................................................... 27Number of Enrollment Spells................................................................................................ 27Enrollment at Initial Institution 3 Years Later ...................................................................... 29Persistence Track to a Bachelor’s Degree ............................................................................. 32Who Leaves Postsecondary Education.................................................................................. 35
Table of Contents
xii
Page
Controlling for Related Variables ........................................................................................... 39Enrollment at Initial Institution 3 Years Later ...................................................................... 40Persistence Track to a Bachelor’s Degree ............................................................................. 42
Conclusions ................................................................................................................................ 45
References .................................................................................................................................. 47
Appendix A—Glossary ............................................................................................................. 49
Appendix B—Technical Notes and Methodology .................................................................. 59
xiii
List of Tables
Table Page
1 Percentage distribution of 1995–96 beginning postsecondary students according toselected demographic and academic characteristics, by first-generation status .............. 10
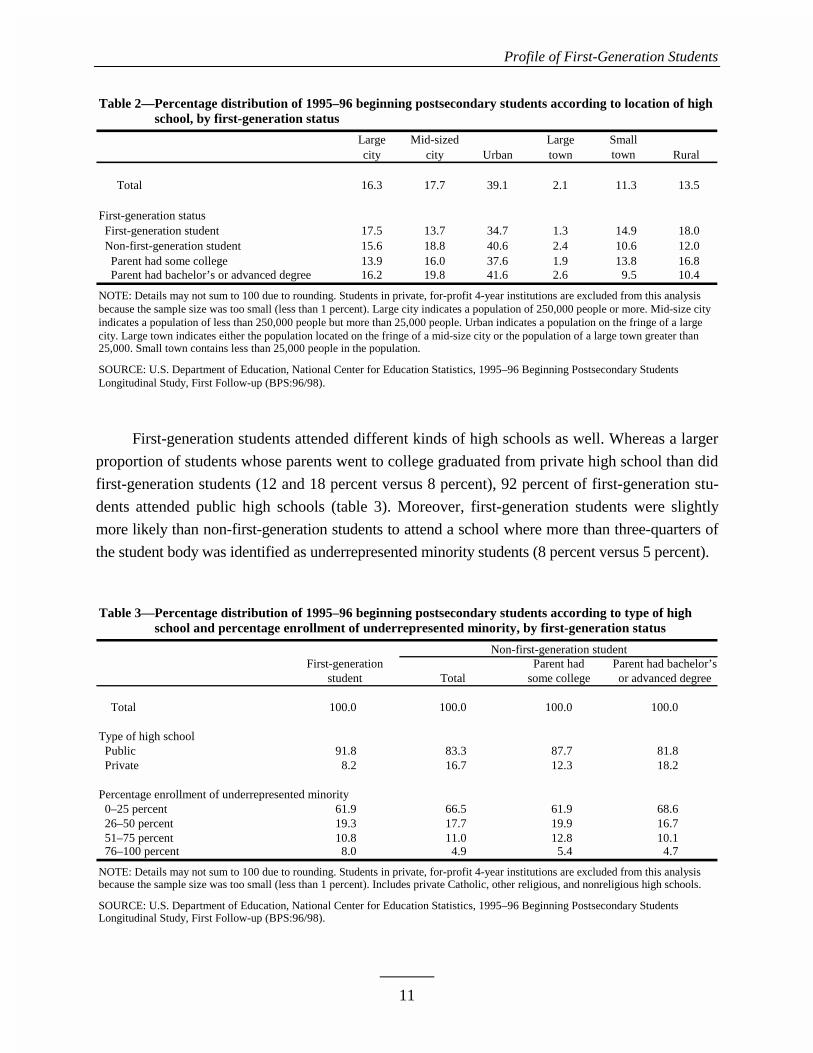
2 Percentage distribution of 1995–96 beginning postsecondary students according tolocation of high school, by first-generation status........................................................... 11
3 Percentage distribution of 1995–96 beginning postsecondary students according totype of high school and percentage enrollment of underrepresented minority, by first-generation status .............................................................................................................. 11
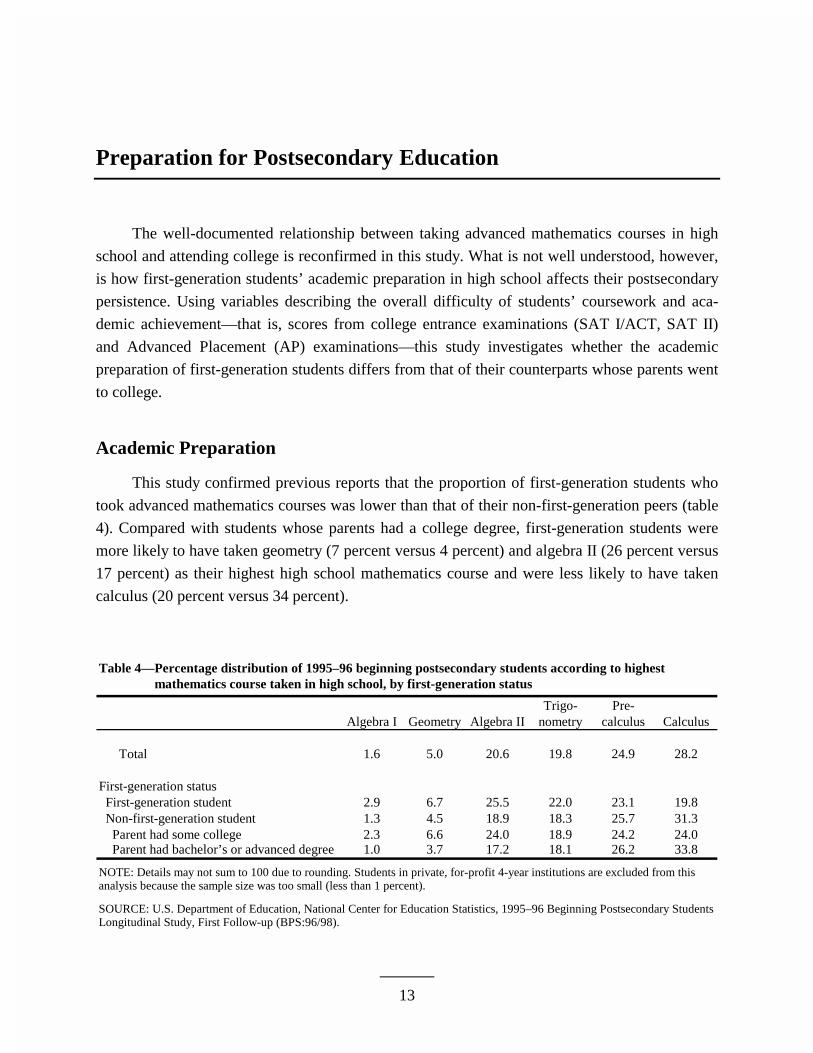
4 Percentage distribution of 1995–96 beginning postsecondary students according tohighest mathematics course taken in high school, by first-generation status.................. 13
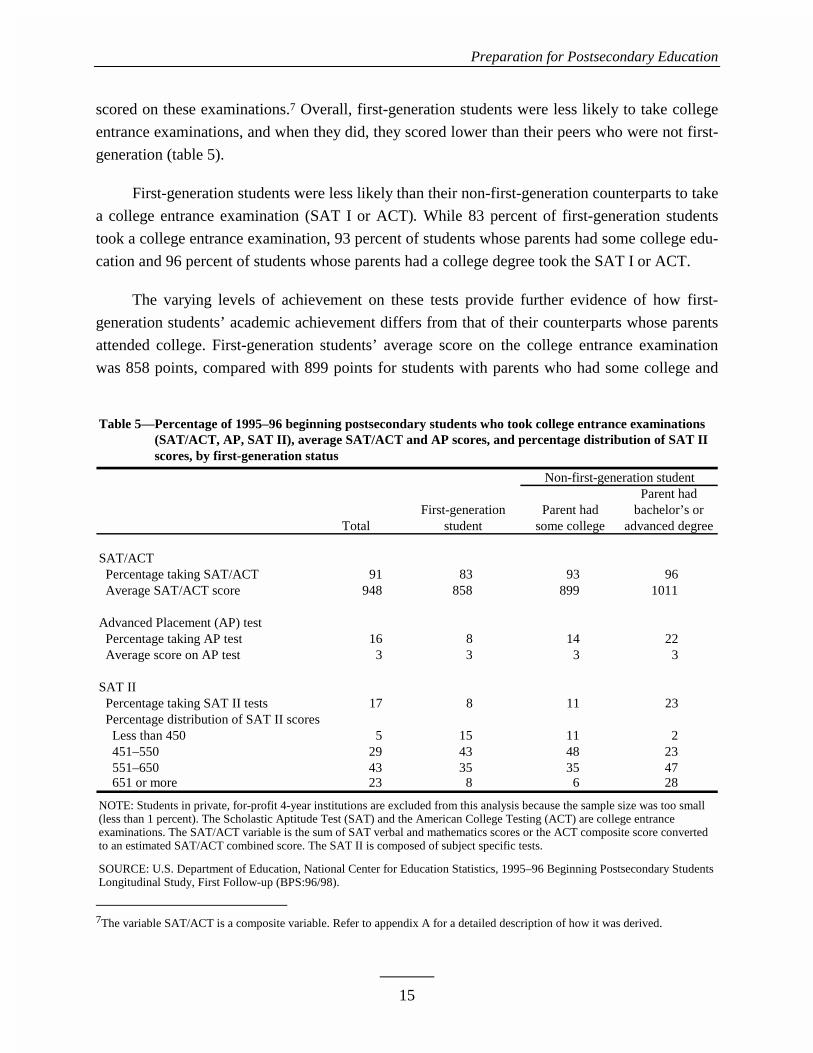
5 Percentage of 1995–96 beginning postsecondary students who took college entranceexaminations (SAT/ACT, AP, SAT II), average SAT/ACT and AP scores, andpercentage distribution of SAT II scores, by first-generation status .............................. 15
6 Percentage distribution of 1995–96 beginning postsecondary students according toenrollment and employment status in 1997–98 academic year, by first-generationstatus................................................................................................................................ 20
7 Percentage distribution of 1995–96 beginning postsecondary students attending 4-yearinstitutions according to major field of study in 1997–98 academic year, by first-generation status .............................................................................................................. 22
8 First-year grade-point average (GPA) of 1995–96 beginning postsecondary studentsaccording to college entrance examination score (SAT/ACT composite) and academicrigor of secondary school curriculum, by first-generation status .................................... 23
9 Percentage distribution of 1995–96 beginning postsecondary students according tonumber of remedial education courses taken during first year of postsecondaryenrollment, by academic rigor of secondary school curriculum and first-generationstatus................................................................................................................................ 24
10 Percentage distribution of 1995–96 beginning postsecondary students according tonumber of remedial education courses taken during first year of postsecondaryenrollment, by college entrance examination score (SAT/ACT composite) and first-generation status .............................................................................................................. 26
List of Tables
xiv
Table Page
11 Percentage distribution of 1995–96 beginning postsecondary students according tonumber of enrollment spells as of spring 1998, by academic rigor of secondary schoolcurriculum and first-generation status............................................................................. 28
12 Percentage distribution of 1995–96 beginning postsecondary students according tonumber of enrollment spells as of spring 1998, by college entrance examination score(SAT/ACT composite) and first-generation status.......................................................... 29
13 Percentage distribution of 1995–96 beginning postsecondary students according tooutcome of first spell of continuous enrollment at first institution as of spring 1998,by academic rigor of secondary school curriculum and first-generation status .............. 30
14 Percentage distribution of 1995–96 beginning postsecondary students according tooutcome of first spell of continuous enrollment at first institution as of spring 1998,by college entrance examination score (SAT/ACT composite) and first-generationstatus................................................................................................................................ 32
15 Percentage distribution of 1995–96 beginning postsecondary students according toenrollment status as of spring 1998, by academic rigor of secondary school curriculumand first-generation status ............................................................................................... 33
16 Percentage distribution of 1995–96 beginning postsecondary students according toenrollment status as of spring 1998, by college entrance examination score (SAT/ACT composite) and first-generation status.................................................................... 35
17 Percentage distribution of 1995–96 beginning postsecondary students according toattainment level and year of postsecondary departure 3 years later (spring 1998), byacademic rigor of secondary curriculum and first-generation status............................... 37
18 Percentage distribution of 1995–96 beginning postsecondary students according toattainment level and year of postsecondary departure 3 years later (spring 1998),by college entrance examination score (SAT/ACT composite) and first-generationstatus................................................................................................................................ 38
19 Percentage of 1995–96 beginning postsecondary students who persisted at initialinstitution and the adjusted percentage after taking into account the covariation of thevariables listed in the table .............................................................................................. 41
20 Percentage of 1995–96 beginning postsecondary students who stayed on persistencetrack to bachelor’s degree and the adjusted percentage after taking into account thecovariation of the variables listed in the table................................................................. 43

List of Tables
xv
Table Page
B1 Standard errors for table 15: Percentage distribution of 1995–96 beginning post-secondary students according to enrollment status as of spring 1998, by academicrigor of secondary school curriculum and first-generation status ................................... 61
xvi
List of Figures
Figure Page
Executive Summary Figures
A Percentage distribution of 1995–96 beginning postsecondary students according toacademic rigor of secondary school curriculum, by first-generation status .................... iv
B Percentage of 1995–96 beginning postsecondary students who were still enrolled (orhad attained bachelor’s degree) at initial institution according to academic rigor ofsecondary school curriculum, by first-generation status: June 1998............................... vi
C Percentage of 1995–96 beginning postsecondary students who stayed on persistencetrack to bachelor’s degree according to academic rigor of secondary schoolcurriculum, by first-generation status: June 1998 ........................................................... vii
Text Figures
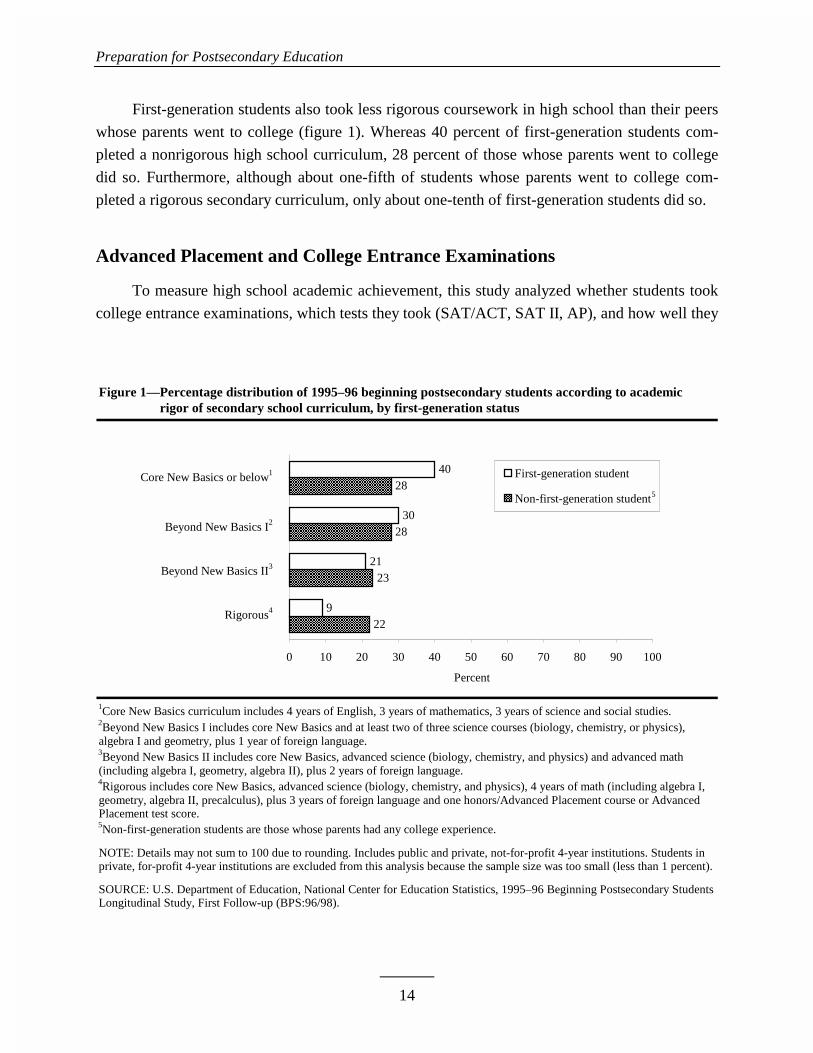
1 Percentage distribution of 1995–96 beginning postsecondary students according toacademic rigor of secondary school curriculum, by first-generation status .................... 14
2 Percentage distribution of 1995–96 beginning postsecondary students according tocollege entrance examination score (SAT/ACT composite), by first-generationstatus................................................................................................................................ 16
3 Percentage distribution of 1995–96 beginning postsecondary students according totype of initial 4-year institution attended, by first-generation status ............................... 19
4 Percentage distribution of 1995–96 beginning postsecondary students according toCarnegie classification of initial institution, by first-generation status........................... 20
1
Introduction
For a majority of high school graduates, the next step in their social, intellectual, and eco-
nomic development is postsecondary education. Between 1972 and 1998, the percentage of 16-
to 24-year-old high school graduates immediately entering college increased from 49 to 66 per-
cent (U.S. Department of Education 2000). For some high school students, especially those
whose parents have less education, the transition to college requires more consideration, because
it offers both opportunity and risk. Among these students are those who are the first members of
their immediate families to enroll in postsecondary education, often referred to as “first-
generation students.”
First-generation students exhibit different college enrollment behaviors than their counter-
parts whose parents have more education (Levine and Nidiffer 1996; Nuñez and Cuccaro-Alamin
1998; Terenzini et al. 1996). A recent analysis of data from the Third Follow-up of the National
Education Longitudinal Study of 1988 (NELS:88/94) supports this finding. Among students who
were highly proficient in mathematics in 8th grade (as measured by a NELS proficiency test),
first-generation students were less likely than their peers whose parents held college degrees to
have completed advanced mathematics classes in high school; similarly, among those who were
qualified for college, first-generation students were less likely than non-first-generation students
to enroll in 4-year institutions (Horn and Nuñez 2000). These differences persisted even when
controlling for demographic characteristics, academic preparation, and college planning activi-
ties.
First-generation status is also negatively associated with persistence and attainment in post-
secondary education. Persistence of beginning postsecondary students is affected by a variety of
factors, including income, race/ethnicity, delayed entry, and financial aid. While financial aid in
the form of grants appears to lower the probability of low-income and minority students’ drop-
ping out of college (U.S. General Accounting Office 1994, 1995), among undergraduates who
began their postsecondary education in 1995–96, low-income students were less likely than their
non-low-income counterparts to have attained or be enrolled 3 years later, even after controlling
for student background and loan assistance (Choy 2000). In addition to financial aid, parents’
education level has been shown to be an important factor in postsecondary persistence. First-
generation students who entered college in 1989–90 were less likely than other students to be still
enrolled or to have completed their education 5 years later (Nuñez and Cuccaro-Alamin 1998).
Introduction
2
Although first-generation students appear less likely than non-first-generation students to
complete a degree, recent research suggests that a college degree is key in helping first-
generation students improve their economic status. The 1993 Baccalaureate and Beyond Study
(B&B:93/94) data showed that, among first-generation students who completed a 4-year degree,
those in the labor market 1 year after completing their degrees had similar occupations and sala-
ries to their non-first-generation peers (Nuñez and Cuccaro-Alamin 1998).
The purpose of this study is to build on this earlier work by examining whether first-
generation students who were otherwise equally prepared academically—as demonstrated by
their coursetaking in high school and college entrance examination scores—persist in college at a
rate similar to that of students whose parents went to college. Though Nuñez and Cuccaro-
Alamin (1998) found that first-generation students were less likely than their counterparts to per-
sist in college, they were not able to control for key indicators, such as academic preparation in
secondary education. Consequently, it was not possible to determine whether differences in per-
sistence were a function of students’ academic preparation for postsecondary work. Using newly
available data, this study adds to this research by investigating how first-generation and non-first-
generation students differ in their academic preparation for college. By controlling for academic
preparation when examining rates of persistence and attainment in postsecondary education, this
report provides a better understanding of the unique circumstances of first-generation students
and the conditions that promote educational success.
Report Organization
This report examines the academic preparation and postsecondary persistence of 1995–96
beginning postsecondary students, comparing first-generation students with those whose parents
either have some college education or attained a bachelor’s degree. The report begins with a brief
description of the background characteristics of first-generation students. The analysis then ex-
amines the postsecondary education outcomes of students who enrolled in a 4-year college or
university while controlling for academic preparation and first-generation status. Finally, to
measure the independent effects of first-generation status and high school academic preparation
on persistence and attainment, multivariate analyses were conducted to control for related vari-
ables.
It is important to note that, because most of the between-group variation pertained to first-
generation students and those students who had at least one parent who had a bachelor’s degree,
Introduction
3
most of findings reported here are between these two groups.1 Significant differences between
either of these groups and those students whose parents had some college are noted in the text.
The report addresses the following questions:
Preparation for Postsecondary Education
• How does the rigor of students’ academic coursework in high school vary with first-generation status?
• How do the college entrance examination results of first-generation and non-first-generation students differ?
Postsecondary Enrollment Behavior, Academic Performance, and Persistence andAttainment
After controlling for academic preparation in high school,
• How do postsecondary enrollment behaviors—e.g., type of institution, enrollment andemployment status (full-time versus part-time), and major field of study—vary be-tween first-generation and non-first-generation students?
• Does remedial coursetaking vary between first-generation and non-first-generation stu-dents?
• Does the postsecondary academic achievement (measured by first-year grades) of first-generation and non-first-generation students differ?
• How likely were students to persist 3 years after first entering postsecondary education,and how do the persistence patterns of first-generation and non-first-generation stu-dents differ?
1The lack of significant differences between first-generation students and students whose parents had some college education ispartly due to the high variability in the some-college group.

THIS PAGE INTENTIONALLY LEFT BLANK
5
Data
This study uses data from the Beginning Postsecondary Students Longitudinal Study
(BPS:96/98), which tracks the experiences of a cohort of students who began postsecondary edu-
cation in 1995–96. The First Follow-up survey took place in spring 1998, about 3 years after the
beginning postsecondary students initially enrolled. To determine first-generation status, the sur-
vey obtained information about the highest education level completed by either parent, primarily
from telephone interviews of students. This variable reflects editing of parental education levels
when occupation and education levels were discrepant (Adelman 1999). The study also gathers
data on student persistence in public and private, not-for-profit 4-year institutions over the 3
years encompassed by the First Follow-up of the 1995–96 BPS cohort.2
Unlike the first BPS study, which began in 1989–90 and provided little information on high
school academic preparation, the 1995–96 BPS study includes data on courses completed in high
school, as reported by students on SAT or ACT test questionnaires, and achievement test scores.3
The 1995–96 BPS study also includes data on high school characteristics—data that were ob-
tained from the Common Core of Data (CCD). These additional data allow in-depth examination
of students’ high school experience and academic preparation for college.
First-Generation Students
A major focus of this report is making comparisons across three levels of parents’ highest
education.4 These education levels were aggregated as follows (Horn and Nuñez 2000):
• First-generation—Neither parent had more than a high school education. Thus, the stu-dent was a member of the first generation in the immediate family to attend college.
2The sample size of students entering 4-year private, for-profit institutions is too small to be included as a category.3These data (except for AP tests) are available only for students who took the SAT or ACT: 93 percent of students at 4-year in-stitutions (public and private, not-for-profit) and 43 percent of those at public 2-year institutions, representing approximately6,800 and 500 unweighted cases, respectively. Not only are academic preparation data available only for a minority and smallsample of public 2-year institution students, but the analysis of persistence and meaning of transfer during the study period wouldnot be parallel with that for 4-year students, due to certificate and transfer program completions. For this reason, the study islimited to students who began at public and private, not-for-profit 4-year institutions.4Parents’ level of education was obtained from parents’ reports in the 1995 Base-Year survey.
Data
6
• Some college—One or both parents had some postsecondary education, but neither hadattained a bachelor’s degree. This category includes parents who attained no more thanvocational certificates and associate’s degrees.
• College graduate—One or both parents earned a bachelor’s degree or higher.
Preparation for Postsecondary Education
High School Mathematics
The level of mathematics coursetaking in high school is a significant predictor of students’
postsecondary enrollment and of attaining a college degree (Adelman 1999; Horn and Nuñez
2000; Riley 1997). This analysis uses a standardized mathematics coursetaking variable that pre-
sents the highest level of mathematics coursework completed, as reported by students on the ap-
plication for the SAT/ACT test.
Academic Rigor of High School Courses
Another indicator of high school academic preparation is the overall difficulty of students’
coursework. Using previous research as a guide, the variable “academic rigor” was created
(Adelman 1999; Burkam, Lee, and Smerdon 1996). Academic rigor takes into account 1) the
number of courses that students completed in academic subjects (mathematics, science, English,
social studies, and foreign language); 2) the level of courses students took in mathematics and
science; and 3) whether students took any honors or Advanced Placement (AP) courses. In cases
in which information on honors/AP coursetaking was missing, this study used AP test-taking as
supplementary data. If AP records indicated that students had taken an AP test, it was assumed
that they had taken an honors/AP course. For this analysis, coursetaking was aggregated into the
following four levels (listed in order from least to most advanced):
• Core New Basics5 and below (did not exceed core New Basics threshold)—Studentcompleted core New Basics curriculum: 4 years of English and 3 years each of science,mathematics, and social studies;
• Beyond New Basics I (somewhat exceeded the core New Basics threshold)—Studentcompleted core New Basics curriculum that included at least two of the following threescience courses—biology, chemistry, or physics—and algebra I and geometry, plus 1year of foreign language.
5The core “New Basics” curriculum was first advocated by the National Commission on Excellence in Education in A Nation atRisk (1983). The commission recommended that high school students take a more rigorous sequence of courses.
Data
7
• Beyond New Basics II (substantially exceeded the core New Basics threshold)—Stu-dent completed core New Basics curriculum that included advanced science (biology,chemistry, and physics) and advanced mathematics (algebra I, geometry, and algebraII), plus 2 years of foreign language.
• Rigorous (maximally exceeded the core New Basics threshold)—Student completedcore New Basics curriculum that included advanced science (biology, chemistry, andphysics), 4 years of mathematics (algebra I, geometry, algebra II, pre-calculus), plus 3years of foreign language and one honors/Advanced Placement course or AdvancedPlacement test score.
As indicated above, students were classified as having taken “rigorous” coursework in high
school only if they fulfilled all the course requirements for that category. For example, some stu-
dents may have completed more rigorous coursework than what is listed in the category “beyond
New Basics I,” but they remained in this category unless they met all the criteria for the next
higher category, “beyond New Basics II.”
Other Indicators of High School Academic Preparation
The final indicators of high school academic preparation are the students’ scores on college
entrance examinations. These data include students’ SAT I (or equivalent ACT) composite scores
and SAT II scores. In addition to supplementing missing data from students’ self-reports about
honors/AP coursetaking, data concerning students’ AP test-taking (that is, whether students took
two or more, one, or no AP test) were included in the analysis.
Additionally, newly available CCD data, including the racial/ethnic composition and loca-
tion of students’ high schools, were included in the analysis. Together, the coursetaking,
achievement/test-taking, and other variables related to students’ high school experiences allow
one to examine whether, as previous research has suggested, first-generation students are less
academically prepared than others for college-level work. If they are, these data allow one to
study how this relative lack of preparation may be related to their postsecondary outcomes.
In addition to the academic preparation and background variables described above, key in-
dependent variables include demographic factors such as gender, age, socioeconomic status
(SES), and race/ethnicity. First-generation status is the primary independent variable of the
analysis.
Postsecondary Enrollment and Performance
Postsecondary enrollment and academic performance are key dependent variables. These
variables include the type of 4-year postsecondary institution in which students first enrolled, the
Data
8
number of remedial courses taken by students in their first year of college, and students’ post-
secondary grade-point averages (GPAs) during their first year of enrollment.
Persistence and Attainment
In this analysis, persistence was defined as students’ status in relation to their enrollment in
the initial 4-year institution. Three primary variables were used to examine persistence: 1) reten-
tion—that is, whether a student is still enrolled in the same institution 3 years later; 2) persistence
track to bachelor’s degree—that is, whether a student stays at the initial 4-year institution or
makes a lateral transfer to a new 4-year institution; and 3) persistence/attainment in postsecon-
dary education—that is, whether students left without attaining their degree, remained enrolled,
or had attained a degree. In addition, this study examined persistence behavior by noting the
number of enrollment spells a student took since entering a 4-year institution in 1995–96.
Retention at initial institution is composed of the following three values:
• Student still enrolled in or attained a degree at the initial institution (including studentswho stopped out and later returned to their initial institution).
• Student transferred to another postsecondary institution (still enrolled, the type oftransfer destination reflects the institution to which students transferred)
• Student left postsecondary education (neither still enrolled at the initial institution nortransferred to another postsecondary institution).
Persistence track to bachelor’s degree is composed of the following three values:
• Student did not leave persistence track (stayed enrolled in the same institution or madea lateral transfer to a different 4-year institution).
• Student left persistence track (stopout, immediate or delayed transfer from 4-year toless-than-4-year postsecondary institution).
• Student left postsecondary education (neither still enrolled at the initial institution nortransferred to another postsecondary institution).
Persistence and attainment in postsecondary education is composed of the following three
values:
• Student left without attaining a bachelor’s degree in any of the 3 years following initialenrollment.
• Student remained enrolled in a 4-year postsecondary institution by June 1998.
• Student had attained a bachelor’s degree from a 4-year postsecondary institution byJune 1998.
9
Profile of First-Generation Students
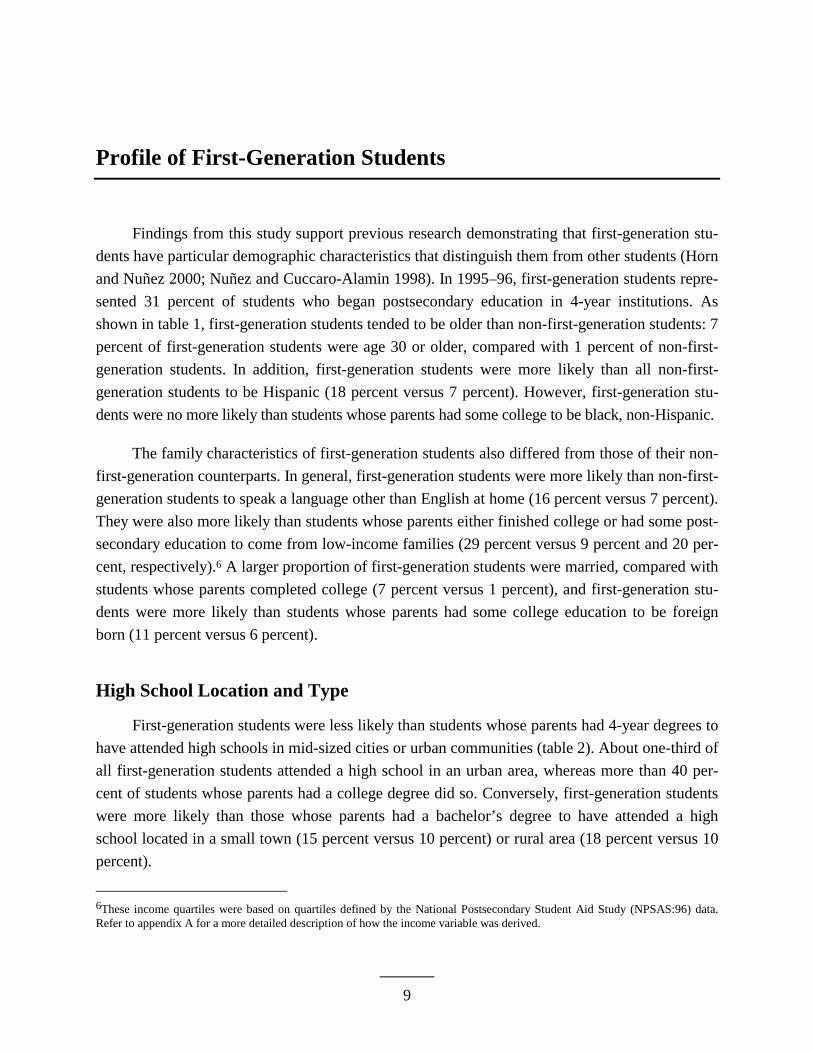
Findings from this study support previous research demonstrating that first-generation stu-
dents have particular demographic characteristics that distinguish them from other students (Horn
and Nuñez 2000; Nuñez and Cuccaro-Alamin 1998). In 1995–96, first-generation students repre-
sented 31 percent of students who began postsecondary education in 4-year institutions. As
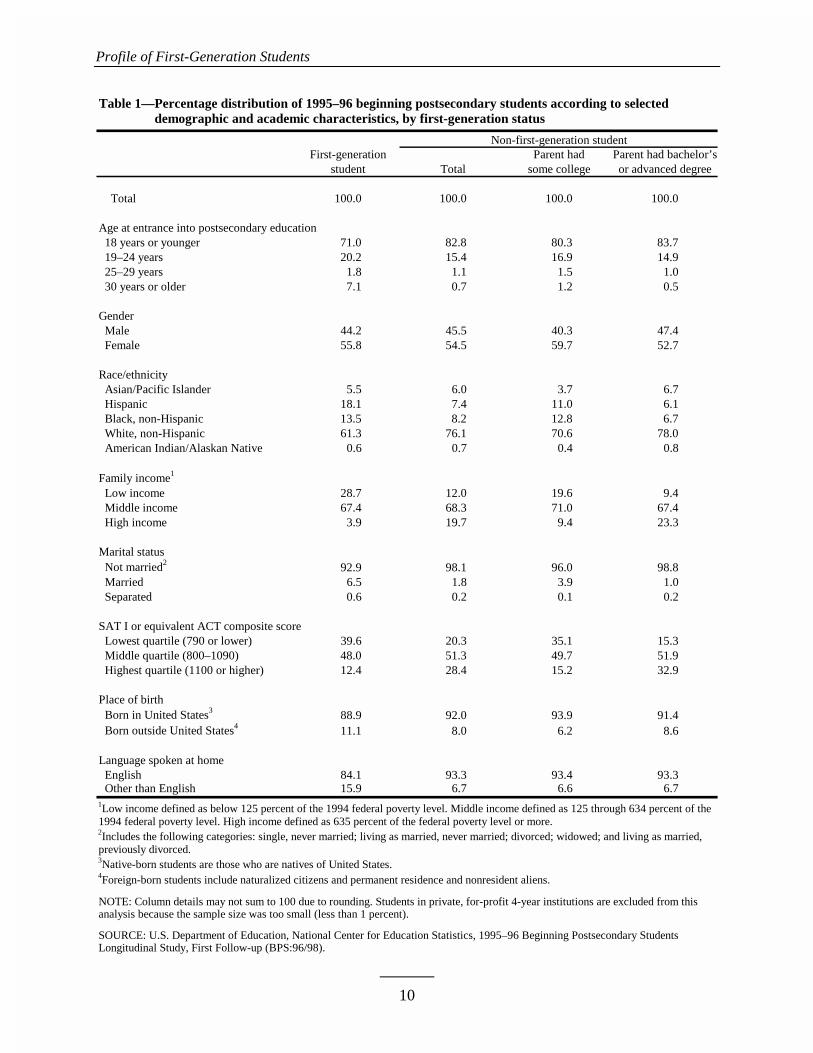
shown in table 1, first-generation students tended to be older than non-first-generation students: 7
percent of first-generation students were age 30 or older, compared with 1 percent of non-first-
generation students. In addition, first-generation students were more likely than all non-first-
generation students to be Hispanic (18 percent versus 7 percent). However, first-generation stu-
dents were no more likely than students whose parents had some college to be black, non-Hispanic.
The family characteristics of first-generation students also differed from those of their non-
first-generation counterparts. In general, first-generation students were more likely than non-first-
generation students to speak a language other than English at home (16 percent versus 7 percent).
They were also more likely than students whose parents either finished college or had some post-
secondary education to come from low-income families (29 percent versus 9 percent and 20 per-
cent, respectively).6 A larger proportion of first-generation students were married, compared with
students whose parents completed college (7 percent versus 1 percent), and first-generation stu-
dents were more likely than students whose parents had some college education to be foreign
born (11 percent versus 6 percent).
High School Location and Type
First-generation students were less likely than students whose parents had 4-year degrees to
have attended high schools in mid-sized cities or urban communities (table 2). About one-third of
all first-generation students attended a high school in an urban area, whereas more than 40 per-
cent of students whose parents had a college degree did so. Conversely, first-generation students
were more likely than those whose parents had a bachelor’s degree to have attended a high
school located in a small town (15 percent versus 10 percent) or rural area (18 percent versus 10
percent).
6These income quartiles were based on quartiles defined by the National Postsecondary Student Aid Study (NPSAS:96) data.Refer to appendix A for a more detailed description of how the income variable was derived.
Profile of First-Generation Students
10
Table 1—Percentage distribution of 1995–96 beginning postsecondary students according to selectedTable 1—demographic and academic characteristics, by first-generation status
First-generation Parent had Parent had bachelor’sstudent Total some college or advanced degree
Total 100.0 100.0 100.0 100.0
Age at entrance into postsecondary education 18 years or younger 71.0 82.8 80.3 83.7 19–24 years 20.2 15.4 16.9 14.9 25–29 years 1.8 1.1 1.5 1.0 30 years or older 7.1 0.7 1.2 0.5
Gender Male 44.2 45.5 40.3 47.4 Female 55.8 54.5 59.7 52.7
Race/ethnicity Asian/Pacific Islander 5.5 6.0 3.7 6.7 Hispanic 18.1 7.4 11.0 6.1 Black, non-Hispanic 13.5 8.2 12.8 6.7 White, non-Hispanic 61.3 76.1 70.6 78.0 American Indian/Alaskan Native 0.6 0.7 0.4 0.8
Family income1
Low income 28.7 12.0 19.6 9.4 Middle income 67.4 68.3 71.0 67.4 High income 3.9 19.7 9.4 23.3
Marital status Not married2 92.9 98.1 96.0 98.8 Married 6.5 1.8 3.9 1.0 Separated 0.6 0.2 0.1 0.2
SAT I or equivalent ACT composite score Lowest quartile (790 or lower) 39.6 20.3 35.1 15.3 Middle quartile (800–1090) 48.0 51.3 49.7 51.9 Highest quartile (1100 or higher) 12.4 28.4 15.2 32.9
Place of birth Born in United States3 88.9 92.0 93.9 91.4 Born outside United States4 11.1 8.0 6.2 8.6
Language spoken at home English 84.1 93.3 93.4 93.3 Other than English 15.9 6.7 6.6 6.7 1Low income defined as below 125 percent of the 1994 federal poverty level. Middle income defined as 125 through 634 percent of the1994 federal poverty level. High income defined as 635 percent of the federal poverty level or more.2Includes the following categories: single, never married; living as married, never married; divorced; widowed; and living as married,previously divorced.3Native-born students are those who are natives of United States.4Foreign-born students include naturalized citizens and permanent residence and nonresident aliens.
NOTE: Column details may not sum to 100 due to rounding. Students in private, for-profit 4-year institutions are excluded from thisanalysis because the sample size was too small (less than 1 percent).
SOURCE: U.S. Department of Education, National Center for Education Statistics, 1995–96 Beginning Postsecondary StudentsLongitudinal Study, First Follow-up (BPS:96/98).
Non-first-generation student
Profile of First-Generation Students
11
Table 2—Percentage distribution of 1995–96 beginning postsecondary students according to location of highTable 2—school, by first-generation status
Large Mid-sized Large Smallcity city Urban town town Rural
Total 16.3 17.7 39.1 2.1 11.3 13.5
First-generation status First-generation student 17.5 13.7 34.7 1.3 14.9 18.0 Non-first-generation student 15.6 18.8 40.6 2.4 10.6 12.0 Parent had some college 13.9 16.0 37.6 1.9 13.8 16.8 Parent had bachelor’s or advanced degree 16.2 19.8 41.6 2.6 9.5 10.4
NOTE: Details may not sum to 100 due to rounding. Students in private, for-profit 4-year institutions are excluded from this analysisbecause the sample size was too small (less than 1 percent). Large city indicates a population of 250,000 people or more. Mid-size cityindicates a population of less than 250,000 people but more than 25,000 people. Urban indicates a population on the fringe of a largecity. Large town indicates either the population located on the fringe of a mid-size city or the population of a large town greater than25,000. Small town contains less than 25,000 people in the population.
SOURCE: U.S. Department of Education, National Center for Education Statistics, 1995–96 Beginning Postsecondary StudentsLongitudinal Study, First Follow-up (BPS:96/98).
First-generation students attended different kinds of high schools as well. Whereas a larger
proportion of students whose parents went to college graduated from private high school than did
first-generation students (12 and 18 percent versus 8 percent), 92 percent of first-generation stu-
dents attended public high schools (table 3). Moreover, first-generation students were slightly
more likely than non-first-generation students to attend a school where more than three-quarters of
the student body was identified as underrepresented minority students (8 percent versus 5 percent).
Table 3—Percentage distribution of 1995–96 beginning postsecondary students according to type of high Table 3—school and percentage enrollment of underrepresented minority, by first-generation status
First-generation Parent had Parent had bachelor’sstudent Total some college or advanced degree
Total 100.0 100.0 100.0 100.0
Type of high school Public 91.8 83.3 87.7 81.8 Private 8.2 16.7 12.3 18.2
Percentage enrollment of underrepresented minority 0–25 percent 61.9 66.5 61.9 68.6 26–50 percent 19.3 17.7 19.9 16.7 51–75 percent 10.8 11.0 12.8 10.1 76–100 percent 8.0 4.9 5.4 4.7
NOTE: Details may not sum to 100 due to rounding. Students in private, for-profit 4-year institutions are excluded from this analysisbecause the sample size was too small (less than 1 percent). Includes private Catholic, other religious, and nonreligious high schools.
SOURCE: U.S. Department of Education, National Center for Education Statistics, 1995–96 Beginning Postsecondary StudentsLongitudinal Study, First Follow-up (BPS:96/98).
Non-first-generation student

THIS PAGE INTENTIONALLY LEFT BLANK
13
Preparation for Postsecondary Education
The well-documented relationship between taking advanced mathematics courses in high
school and attending college is reconfirmed in this study. What is not well understood, however,
is how first-generation students’ academic preparation in high school affects their postsecondary
persistence. Using variables describing the overall difficulty of students’ coursework and aca-
demic achievement—that is, scores from college entrance examinations (SAT I/ACT, SAT II)
and Advanced Placement (AP) examinations—this study investigates whether the academic
preparation of first-generation students differs from that of their counterparts whose parents went
to college.
Academic Preparation
This study confirmed previous reports that the proportion of first-generation students who
took advanced mathematics courses was lower than that of their non-first-generation peers (table
4). Compared with students whose parents had a college degree, first-generation students were
more likely to have taken geometry (7 percent versus 4 percent) and algebra II (26 percent versus
17 percent) as their highest high school mathematics course and were less likely to have taken
calculus (20 percent versus 34 percent).
Table 4—Percentage distribution of 1995–96 beginning postsecondary students according to highestTable 4—mathematics course taken in high school, by first-generation status
Trigo- Pre-Algebra I Geometry Algebra II nometry calculus Calculus
Total 1.6 5.0 20.6 19.8 24.9 28.2
First-generation status First-generation student 2.9 6.7 25.5 22.0 23.1 19.8 Non-first-generation student 1.3 4.5 18.9 18.3 25.7 31.3 Parent had some college 2.3 6.6 24.0 18.9 24.2 24.0 Parent had bachelor’s or advanced degree 1.0 3.7 17.2 18.1 26.2 33.8
NOTE: Details may not sum to 100 due to rounding. Students in private, for-profit 4-year institutions are excluded from thisanalysis because the sample size was too small (less than 1 percent).
SOURCE: U.S. Department of Education, National Center for Education Statistics, 1995–96 Beginning Postsecondary StudentsLongitudinal Study, First Follow-up (BPS:96/98).
Preparation for Postsecondary Education
14
First-generation students also took less rigorous coursework in high school than their peers
whose parents went to college (figure 1). Whereas 40 percent of first-generation students com-
pleted a nonrigorous high school curriculum, 28 percent of those whose parents went to college
did so. Furthermore, although about one-fifth of students whose parents went to college com-
pleted a rigorous secondary curriculum, only about one-tenth of first-generation students did so.
Advanced Placement and College Entrance Examinations
To measure high school academic achievement, this study analyzed whether students took
college entrance examinations, which tests they took (SAT/ACT, SAT II, AP), and how well they
Figure 1—Percentage distribution of 1995–96 beginning postsecondary students according to academicFigure 1—rigor of secondary school curriculum, by first-generation status
1Core New Basics curriculum includes 4 years of English, 3 years of mathematics, 3 years of science and social studies.2Beyond New Basics I includes core New Basics and at least two of three science courses (biology, chemistry, or physics),algebra I and geometry, plus 1 year of foreign language.3Beyond New Basics II includes core New Basics, advanced science (biology, chemistry, and physics) and advanced math(including algebra I, geometry, algebra II), plus 2 years of foreign language.4Rigorous includes core New Basics, advanced science (biology, chemistry, and physics), 4 years of math (including algebra I,geometry, algebra II, precalculus), plus 3 years of foreign language and one honors/Advanced Placement course or AdvancedPlacement test score.5Non-first-generation students are those whose parents had any college experience.
NOTE: Details may not sum to 100 due to rounding. Includes public and private, not-for-profit 4-year institutions. Students inprivate, for-profit 4-year institutions are excluded from this analysis because the sample size was too small (less than 1 percent).
SOURCE: U.S. Department of Education, National Center for Education Statistics, 1995–96 Beginning Postsecondary StudentsLongitudinal Study, First Follow-up (BPS:96/98).
22
23
28
28
9
21
30
40
0 10 20 30 40 50 60 70 80 90 100
Rigorous
Beyond New Basics II
Beyond New Basics I
Core New Basics orbelow
Percent
First-generation student
Non-first-generation student
Core New Basics or below1
Rigorous4
Beyond New Basics II3
Beyond New Basics I2
5
Preparation for Postsecondary Education
15
scored on these examinations.7 Overall, first-generation students were less likely to take college
entrance examinations, and when they did, they scored lower than their peers who were not first-
generation (table 5).
First-generation students were less likely than their non-first-generation counterparts to take
a college entrance examination (SAT I or ACT). While 83 percent of first-generation students
took a college entrance examination, 93 percent of students whose parents had some college edu-
cation and 96 percent of students whose parents had a college degree took the SAT I or ACT.
The varying levels of achievement on these tests provide further evidence of how first-
generation students’ academic achievement differs from that of their counterparts whose parents
attended college. First-generation students’ average score on the college entrance examination
was 858 points, compared with 899 points for students with parents who had some college and
Table 5—Percentage of 1995–96 beginning postsecondary students who took college entrance examinationsTable 5—(SAT/ACT, AP, SAT II), average SAT/ACT and AP scores, and percentage distribution of SAT IITable 5—scores, by first-generation status
Parent hadFirst-generation Parent had bachelor’s or
Total student some college advanced degree
SAT/ACT Percentage taking SAT/ACT 91 83 93 96 Average SAT/ACT score 948 858 899 1011
Advanced Placement (AP) test Percentage taking AP test 16 8 14 22 Average score on AP test 3 3 3 3
SAT II Percentage taking SAT II tests 17 8 11 23 Percentage distribution of SAT II scores Less than 450 5 15 11 2 451–550 29 43 48 23 551–650 43 35 35 47 651 or more 23 8 6 28
NOTE: Students in private, for-profit 4-year institutions are excluded from this analysis because the sample size was too small(less than 1 percent). The Scholastic Aptitude Test (SAT) and the American College Testing (ACT) are college entranceexaminations. The SAT/ACT variable is the sum of SAT verbal and mathematics scores or the ACT composite score convertedto an estimated SAT/ACT combined score. The SAT II is composed of subject specific tests.
SOURCE: U.S. Department of Education, National Center for Education Statistics, 1995–96 Beginning Postsecondary StudentsLongitudinal Study, First Follow-up (BPS:96/98).
Non-first-generation student
7The variable SAT/ACT is a composite variable. Refer to appendix A for a detailed description of how it was derived.
Preparation for Postsecondary Education
16
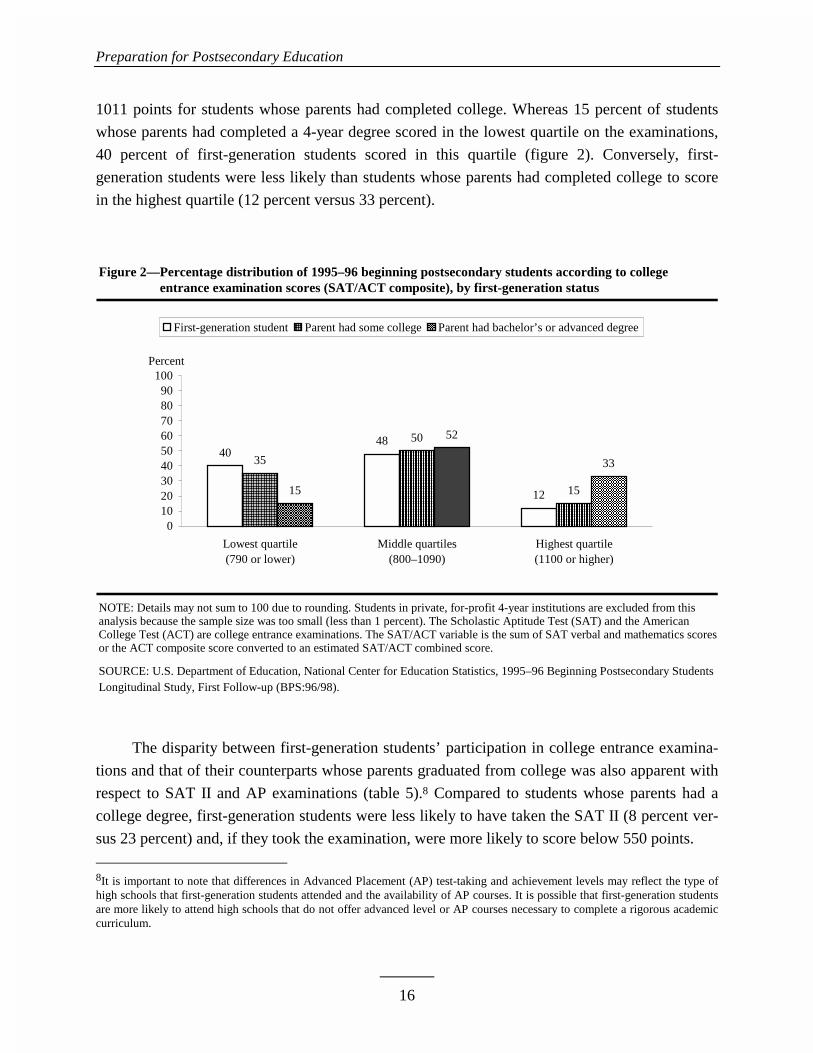
1011 points for students whose parents had completed college. Whereas 15 percent of students
whose parents had completed a 4-year degree scored in the lowest quartile on the examinations,
40 percent of first-generation students scored in this quartile (figure 2). Conversely, first-
generation students were less likely than students whose parents had completed college to score
in the highest quartile (12 percent versus 33 percent).
Figure 2—Percentage distribution of 1995–96 beginning postsecondary students according to collegeFigure 2—entrance examination scores (SAT/ACT composite), by first-generation status
NOTE: Details may not sum to 100 due to rounding. Students in private, for-profit 4-year institutions are excluded from thisanalysis because the sample size was too small (less than 1 percent). The Scholastic Aptitude Test (SAT) and the AmericanCollege Test (ACT) are college entrance examinations. The SAT/ACT variable is the sum of SAT verbal and mathematics scoresor the ACT composite score converted to an estimated SAT/ACT combined score.
SOURCE: U.S. Department of Education, National Center for Education Statistics, 1995–96 Beginning Postsecondary StudentsLongitudinal Study, First Follow-up (BPS:96/98).
4048
12
50
1515
52
3335
0102030405060708090
100
Lowest quartile(790 or lower)
Middle quartiles(800–1090)
Highest quartile(1100 or higher)
Percent
First-generation student Parent had some college Parent had bachelor’s or advanced degree
The disparity between first-generation students’ participation in college entrance examina-
tions and that of their counterparts whose parents graduated from college was also apparent with
respect to SAT II and AP examinations (table 5).8 Compared to students whose parents had a
college degree, first-generation students were less likely to have taken the SAT II (8 percent ver-
sus 23 percent) and, if they took the examination, were more likely to score below 550 points.
8It is important to note that differences in Advanced Placement (AP) test-taking and achievement levels may reflect the type ofhigh schools that first-generation students attended and the availability of AP courses. It is possible that first-generation studentsare more likely to attend high schools that do not offer advanced level or AP courses necessary to complete a rigorous academiccurriculum.
Preparation for Postsecondary Education
17
First-generation students were less likely than both students whose parents had attended
some college and those whose parents had finished college to report taking any AP test (8 percent
versus 14 percent and 22 percent, respectively). Finally, although first-generation students’ aver-
age AP score did not differ from that of students whose parents had some college education, first-
generation students’ scores were, on average, lower than those of students whose parents had
graduated from college (2.7 points versus 3.0 points).

THIS PAGE INTENTIONALLY LEFT BLANK
19
Postsecondary Education
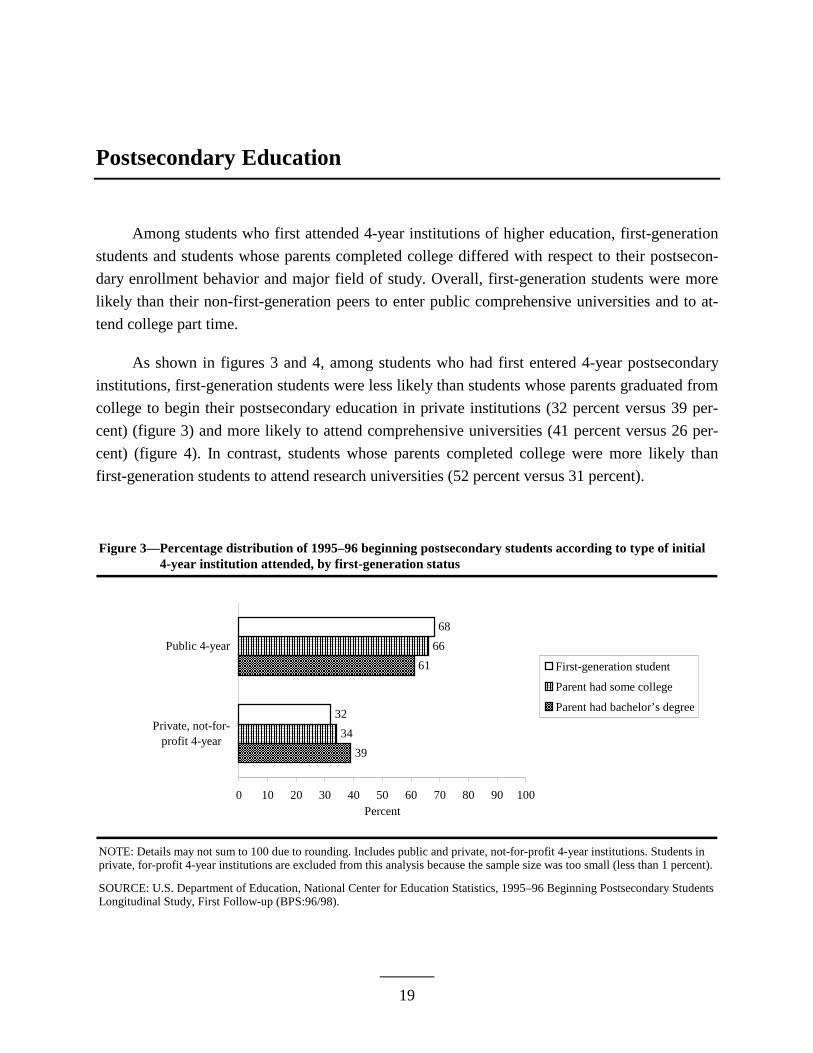
Among students who first attended 4-year institutions of higher education, first-generation
students and students whose parents completed college differed with respect to their postsecon-
dary enrollment behavior and major field of study. Overall, first-generation students were more
likely than their non-first-generation peers to enter public comprehensive universities and to at-
tend college part time.
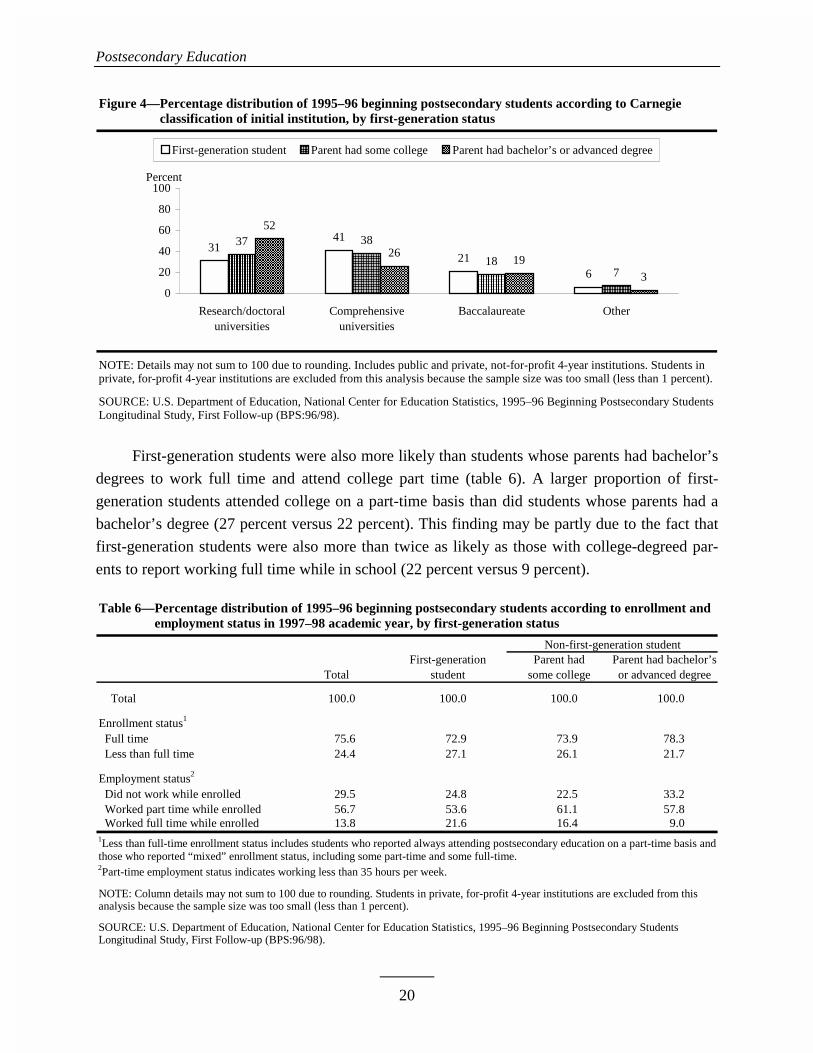
As shown in figures 3 and 4, among students who had first entered 4-year postsecondary
institutions, first-generation students were less likely than students whose parents graduated from
college to begin their postsecondary education in private institutions (32 percent versus 39 per-
cent) (figure 3) and more likely to attend comprehensive universities (41 percent versus 26 per-
cent) (figure 4). In contrast, students whose parents completed college were more likely than
first-generation students to attend research universities (52 percent versus 31 percent).
Figure 3—Percentage distribution of 1995–96 beginning postsecondary students according to type of initialFigure 3—4-year institution attended, by first-generation status
NOTE: Details may not sum to 100 due to rounding. Includes public and private, not-for-profit 4-year institutions. Students inprivate, for-profit 4-year institutions are excluded from this analysis because the sample size was too small (less than 1 percent).
SOURCE: U.S. Department of Education, National Center for Education Statistics, 1995–96 Beginning Postsecondary StudentsLongitudinal Study, First Follow-up (BPS:96/98).
39
61
34
66
32
68
0 10 20 30 40 50 60 70 80 90 100
Private, not-for-profit 4-year
Public 4-year
Percent
First-generation student
Parent had some college
Parent had bachelor’s degree
Postsecondary Education
20
Figure 4—Percentage distribution of 1995–96 beginning postsecondary students according to CarnegieFigure 4—classification of initial institution, by first-generation status
NOTE: Details may not sum to 100 due to rounding. Includes public and private, not-for-profit 4-year institutions. Students inprivate, for-profit 4-year institutions are excluded from this analysis because the sample size was too small (less than 1 percent).
SOURCE: U.S. Department of Education, National Center for Education Statistics, 1995–96 Beginning Postsecondary StudentsLongitudinal Study, First Follow-up (BPS:96/98).
3141
216
37 38
187
52
2619
30
20
40
60
80
100
Research/doctoraluniversities
Comprehensiveuniversities
Baccalaureate Other
Percent
First-generation student Parent had some college Parent had bachelor’s or advanced degree
First-generation students were also more likely than students whose parents had bachelor’s
degrees to work full time and attend college part time (table 6). A larger proportion of first-
generation students attended college on a part-time basis than did students whose parents had a
bachelor’s degree (27 percent versus 22 percent). This finding may be partly due to the fact that
first-generation students were also more than twice as likely as those with college-degreed par-
ents to report working full time while in school (22 percent versus 9 percent).
Table 6—Percentage distribution of 1995–96 beginning postsecondary students according to enrollment andTable 6—employment status in 1997–98 academic year, by first-generation status
First-generation Parent had Parent had bachelor’sTotal student some college or advanced degree
Total 100.0 100.0 100.0 100.0
Enrollment status1
Full time 75.6 72.9 73.9 78.3 Less than full time 24.4 27.1 26.1 21.7
Employment status2
Did not work while enrolled 29.5 24.8 22.5 33.2 Worked part time while enrolled 56.7 53.6 61.1 57.8 Worked full time while enrolled 13.8 21.6 16.4 9.0 1Less than full-time enrollment status includes students who reported always attending postsecondary education on a part-time basis andthose who reported “mixed” enrollment status, including some part-time and some full-time.2Part-time employment status indicates working less than 35 hours per week.
NOTE: Column details may not sum to 100 due to rounding. Students in private, for-profit 4-year institutions are excluded from thisanalysis because the sample size was too small (less than 1 percent).
SOURCE: U.S. Department of Education, National Center for Education Statistics, 1995–96 Beginning Postsecondary StudentsLongitudinal Study, First Follow-up (BPS:96/98).
Non-first-generation student
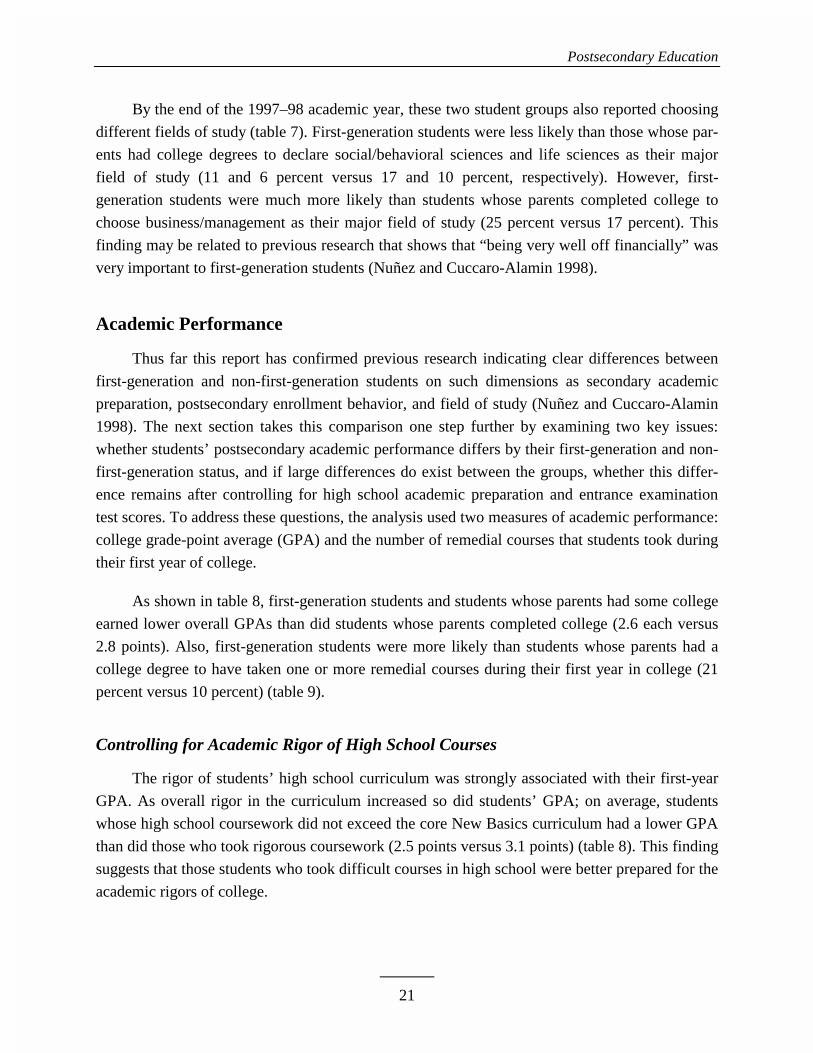
Postsecondary Education
21
By the end of the 1997–98 academic year, these two student groups also reported choosing
different fields of study (table 7). First-generation students were less likely than those whose par-
ents had college degrees to declare social/behavioral sciences and life sciences as their major
field of study (11 and 6 percent versus 17 and 10 percent, respectively). However, first-
generation students were much more likely than students whose parents completed college to
choose business/management as their major field of study (25 percent versus 17 percent). This
finding may be related to previous research that shows that “being very well off financially” was
very important to first-generation students (Nuñez and Cuccaro-Alamin 1998).
Academic Performance
Thus far this report has confirmed previous research indicating clear differences between
first-generation and non-first-generation students on such dimensions as secondary academic
preparation, postsecondary enrollment behavior, and field of study (Nuñez and Cuccaro-Alamin
1998). The next section takes this comparison one step further by examining two key issues:
whether students’ postsecondary academic performance differs by their first-generation and non-
first-generation status, and if large differences do exist between the groups, whether this differ-
ence remains after controlling for high school academic preparation and entrance examination
test scores. To address these questions, the analysis used two measures of academic performance:
college grade-point average (GPA) and the number of remedial courses that students took during
their first year of college.
As shown in table 8, first-generation students and students whose parents had some college
earned lower overall GPAs than did students whose parents completed college (2.6 each versus
2.8 points). Also, first-generation students were more likely than students whose parents had a
college degree to have taken one or more remedial courses during their first year in college (21
percent versus 10 percent) (table 9).
Controlling for Academic Rigor of High School Courses
The rigor of students’ high school curriculum was strongly associated with their first-year
GPA. As overall rigor in the curriculum increased so did students’ GPA; on average, students
whose high school coursework did not exceed the core New Basics curriculum had a lower GPA
than did those who took rigorous coursework (2.5 points versus 3.1 points) (table 8). This finding
suggests that those students who took difficult courses in high school were better prepared for the
academic rigors of college.
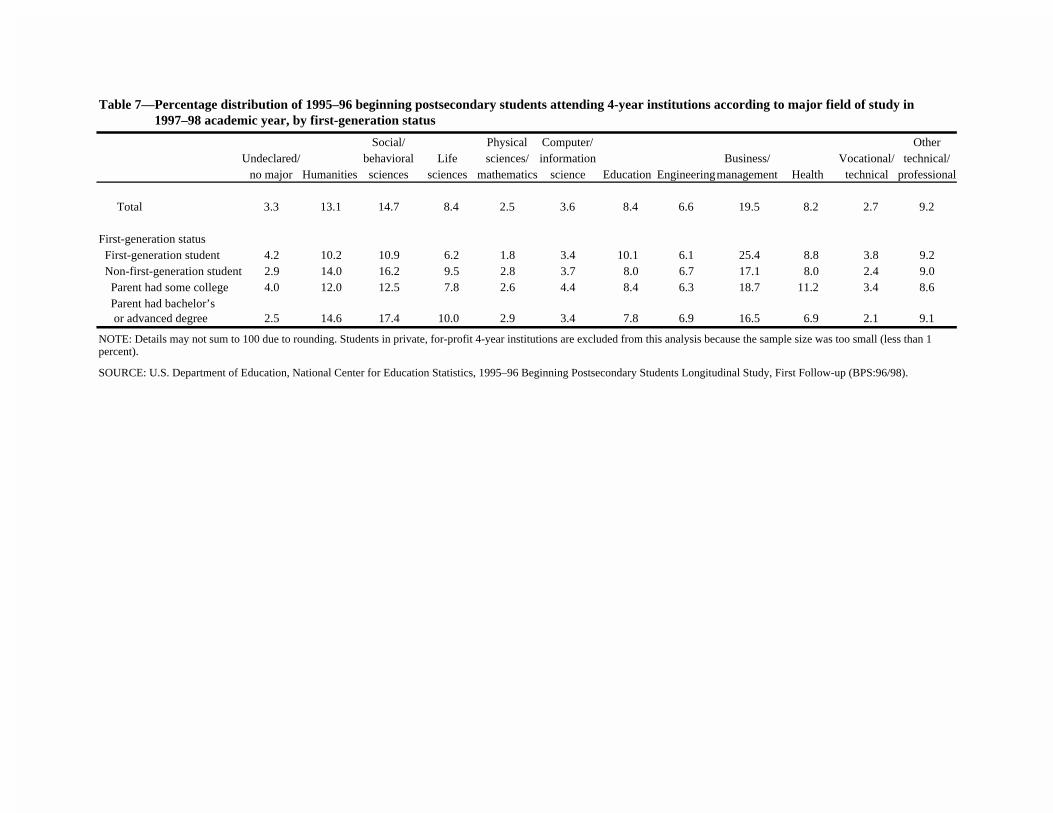
Table 7—Percentage distribution of 1995–96 beginning postsecondary students attending 4-year institutions according to major field of study inTable 7—1997–98 academic year, by first-generation status
Social/ Physical Computer/ OtherUndeclared/ behavioral Life sciences/ information Business/ Vocational/ technical/
no major Humanities sciences sciences mathematics science Education Engineeringmanagement Health technical professional
Total 3.3 13.1 14.7 8.4 2.5 3.6 8.4 6.6 19.5 8.2 2.7 9.2
First-generation status First-generation student 4.2 10.2 10.9 6.2 1.8 3.4 10.1 6.1 25.4 8.8 3.8 9.2 Non-first-generation student 2.9 14.0 16.2 9.5 2.8 3.7 8.0 6.7 17.1 8.0 2.4 9.0 Parent had some college 4.0 12.0 12.5 7.8 2.6 4.4 8.4 6.3 18.7 11.2 3.4 8.6 Parent had bachelor’s or advanced degree 2.5 14.6 17.4 10.0 2.9 3.4 7.8 6.9 16.5 6.9 2.1 9.1
NOTE: Details may not sum to 100 due to rounding. Students in private, for-profit 4-year institutions are excluded from this analysis because the sample size was too small (less than 1percent).
SOURCE: U.S. Department of Education, National Center for Education Statistics, 1995–96 Beginning Postsecondary Students Longitudinal Study, First Follow-up (BPS:96/98).
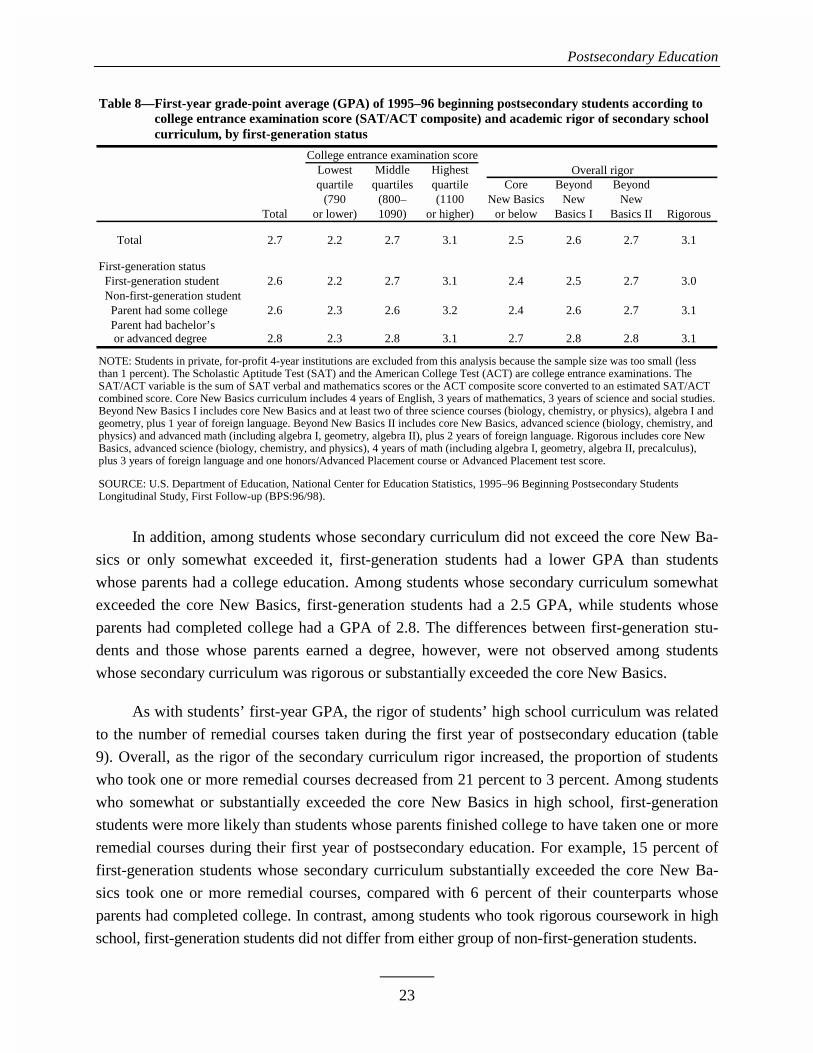
Postsecondary Education
23
Table 8—First-year grade-point average (GPA) of 1995–96 beginning postsecondary students according toTable 8—college entrance examination score (SAT/ACT composite) and academic rigor of secondary schoolTable 8—curriculum, by first-generation status
College entrance examination scoreLowest Middle Highestquartile quartiles quartile Core Beyond Beyond
(790 (800– (1100 New Basics New NewTotal or lower) 1090) or higher) or below Basics I Basics II Rigorous
Total 2.7 2.2 2.7 3.1 2.5 2.6 2.7 3.1
First-generation status First-generation student 2.6 2.2 2.7 3.1 2.4 2.5 2.7 3.0 Non-first-generation student Parent had some college 2.6 2.3 2.6 3.2 2.4 2.6 2.7 3.1 Parent had bachelor’s or advanced degree 2.8 2.3 2.8 3.1 2.7 2.8 2.8 3.1
NOTE: Students in private, for-profit 4-year institutions are excluded from this analysis because the sample size was too small (lessthan 1 percent). The Scholastic Aptitude Test (SAT) and the American College Test (ACT) are college entrance examinations. TheSAT/ACT variable is the sum of SAT verbal and mathematics scores or the ACT composite score converted to an estimated SAT/ACTcombined score. Core New Basics curriculum includes 4 years of English, 3 years of mathematics, 3 years of science and social studies.Beyond New Basics I includes core New Basics and at least two of three science courses (biology, chemistry, or physics), algebra I andgeometry, plus 1 year of foreign language. Beyond New Basics II includes core New Basics, advanced science (biology, chemistry, andphysics) and advanced math (including algebra I, geometry, algebra II), plus 2 years of foreign language. Rigorous includes core NewBasics, advanced science (biology, chemistry, and physics), 4 years of math (including algebra I, geometry, algebra II, precalculus),plus 3 years of foreign language and one honors/Advanced Placement course or Advanced Placement test score.
SOURCE: U.S. Department of Education, National Center for Education Statistics, 1995–96 Beginning Postsecondary Students Longitudinal Study, First Follow-up (BPS:96/98).
Overall rigor
In addition, among students whose secondary curriculum did not exceed the core New Ba-
sics or only somewhat exceeded it, first-generation students had a lower GPA than students
whose parents had a college education. Among students whose secondary curriculum somewhat
exceeded the core New Basics, first-generation students had a 2.5 GPA, while students whose
parents had completed college had a GPA of 2.8. The differences between first-generation stu-
dents and those whose parents earned a degree, however, were not observed among students
whose secondary curriculum was rigorous or substantially exceeded the core New Basics.
As with students’ first-year GPA, the rigor of students’ high school curriculum was related
to the number of remedial courses taken during the first year of postsecondary education (table
9). Overall, as the rigor of the secondary curriculum rigor increased, the proportion of students
who took one or more remedial courses decreased from 21 percent to 3 percent. Among students
who somewhat or substantially exceeded the core New Basics in high school, first-generation
students were more likely than students whose parents finished college to have taken one or more
remedial courses during their first year of postsecondary education. For example, 15 percent of
first-generation students whose secondary curriculum substantially exceeded the core New Ba-
sics took one or more remedial courses, compared with 6 percent of their counterparts whose
parents had completed college. In contrast, among students who took rigorous coursework in high
school, first-generation students did not differ from either group of non-first-generation students.
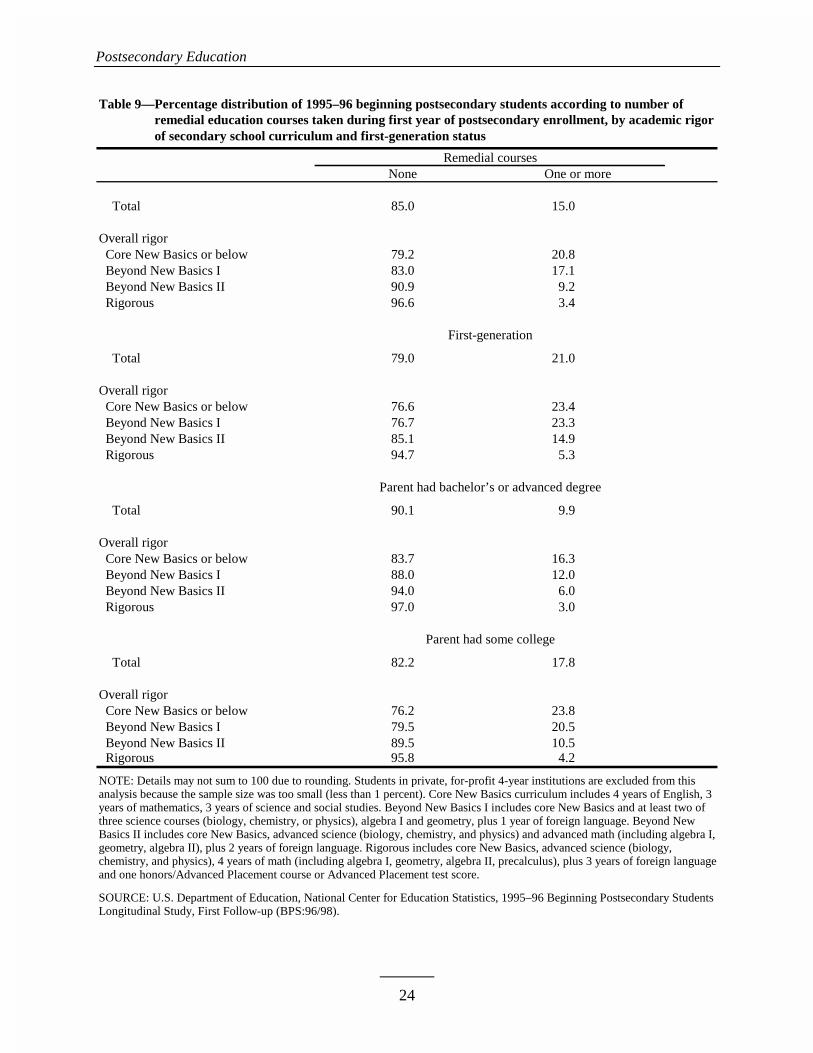
Postsecondary Education
24
Table 9—Percentage distribution of 1995–96 beginning postsecondary students according to number ofTable 9—remedial education courses taken during first year of postsecondary enrollment, by academic rigorTable 9—of secondary school curriculum and first-generation status
None One or more
Total 85.0 15.0
Overall rigor Core New Basics or below 79.2 20.8 Beyond New Basics I 83.0 17.1 Beyond New Basics II 90.9 9.2 Rigorous 96.6 3.4
Total 79.0 21.0
Overall rigor Core New Basics or below 76.6 23.4 Beyond New Basics I 76.7 23.3 Beyond New Basics II 85.1 14.9 Rigorous 94.7 5.3
Total 90.1 9.9
Overall rigor Core New Basics or below 83.7 16.3 Beyond New Basics I 88.0 12.0 Beyond New Basics II 94.0 6.0 Rigorous 97.0 3.0
Total 82.2 17.8
Overall rigor Core New Basics or below 76.2 23.8 Beyond New Basics I 79.5 20.5 Beyond New Basics II 89.5 10.5 Rigorous 95.8 4.2
NOTE: Details may not sum to 100 due to rounding. Students in private, for-profit 4-year institutions are excluded from this analysis because the sample size was too small (less than 1 percent). Core New Basics curriculum includes 4 years of English, 3years of mathematics, 3 years of science and social studies. Beyond New Basics I includes core New Basics and at least two ofthree science courses (biology, chemistry, or physics), algebra I and geometry, plus 1 year of foreign language. Beyond New Basics II includes core New Basics, advanced science (biology, chemistry, and physics) and advanced math (including algebra I,geometry, algebra II), plus 2 years of foreign language. Rigorous includes core New Basics, advanced science (biology,chemistry, and physics), 4 years of math (including algebra I, geometry, algebra II, precalculus), plus 3 years of foreign languageand one honors/Advanced Placement course or Advanced Placement test score.
SOURCE: U.S. Department of Education, National Center for Education Statistics, 1995–96 Beginning Postsecondary StudentsLongitudinal Study, First Follow-up (BPS:96/98).
Parent had bachelor’s or advanced degree
Remedial courses
Parent had some college
First-generation
Postsecondary Education
25
Controlling for College Entrance Examinations
As with the rigor of students’ high school curriculum, students’ college entrance examina-
tion scores were strongly associated with their first-year GPAs. Students with higher college en-
trance examination scores tended also to have higher first-year GPAs (table 8). For example, on
average, first-generation students who scored 790 points or lower on the SAT/ACT earned lower
grades in the first year of college than their counterparts who scored at least 1100 points on the
college entrance examination (2.2 GPA versus 3.1 GPA).
Taking this relationship between high school achievement and postsecondary performance
into account, there was little variation between the two groups. That is, after controlling for en-
trance examination scores, no significant differences were found between the GPAs of first-
generation and non-first-generation students. In addition, though a seemingly large proportion of
all students took remedial courses during their first year of postsecondary education (15 percent),
this was related to their entrance examination scores. As college entrance examination scores in-
creased, the percentage of students taking one or more remedial classes during their first year of
postsecondary education decreased from 35 percent to 2 percent (table 10).
Students’ scores on entrance examinations were also related to differences between first-
generation and non-first-generation students in remedial coursetaking. Among those in the lowest
quartile, first-generation students were more likely than students whose parents had earned a
bachelor’s degree (but not those whose parents had some college education) to have taken one or
more remedial classes during their first year of postsecondary education (38 percent versus 29
percent and 36 percent, respectively). Among students who scored in the middle or highest col-
lege entrance examination quartile, first-generation students were no more likely than their non-
first-generation counterparts to have taken one or more remedial courses at this time.
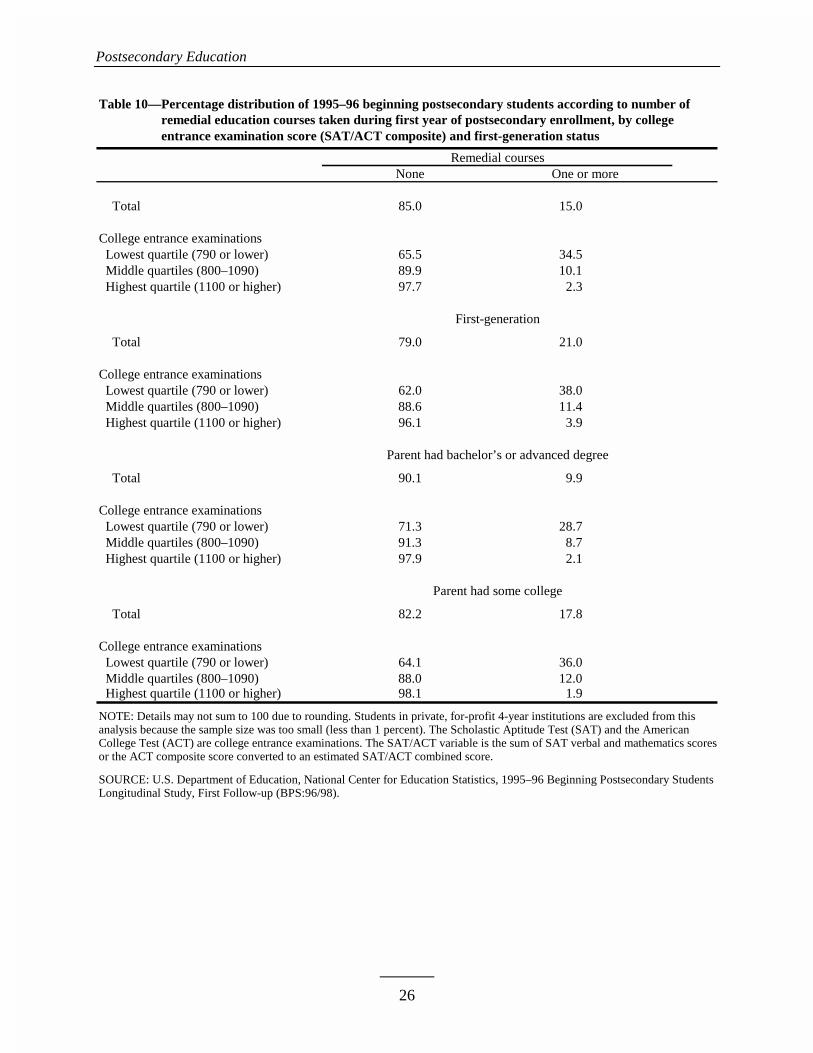
Postsecondary Education
26
Table 10—Percentage distribution of 1995–96 beginning postsecondary students according to number ofTable 10—remedial education courses taken during first year of postsecondary enrollment, by collegeTable 10—entrance examination score (SAT/ACT composite) and first-generation status
None One or more
Total 85.0 15.0
College entrance examinations Lowest quartile (790 or lower) 65.5 34.5 Middle quartiles (800–1090) 89.9 10.1 Highest quartile (1100 or higher) 97.7 2.3
Total 79.0 21.0
College entrance examinations Lowest quartile (790 or lower) 62.0 38.0 Middle quartiles (800–1090) 88.6 11.4 Highest quartile (1100 or higher) 96.1 3.9
Total 90.1 9.9
College entrance examinations Lowest quartile (790 or lower) 71.3 28.7 Middle quartiles (800–1090) 91.3 8.7 Highest quartile (1100 or higher) 97.9 2.1
Total 82.2 17.8
College entrance examinations Lowest quartile (790 or lower) 64.1 36.0 Middle quartiles (800–1090) 88.0 12.0 Highest quartile (1100 or higher) 98.1 1.9
NOTE: Details may not sum to 100 due to rounding. Students in private, for-profit 4-year institutions are excluded from thisanalysis because the sample size was too small (less than 1 percent). The Scholastic Aptitude Test (SAT) and the AmericanCollege Test (ACT) are college entrance examinations. The SAT/ACT variable is the sum of SAT verbal and mathematics scoresor the ACT composite score converted to an estimated SAT/ACT combined score.
SOURCE: U.S. Department of Education, National Center for Education Statistics, 1995–96 Beginning Postsecondary StudentsLongitudinal Study, First Follow-up (BPS:96/98).
Parent had bachelor’s or advanced degree
Remedial courses
First-generation
Parent had some college
27
Persistence and Attainment
Previous research on first-generation students showed that they were less likely than their
non-first-generation counterparts to have completed their postsecondary education within 5 years.
This negative trend was especially evident for students who began at 4-year public and private,
not-for-profit institutions (Nuñez and Cuccaro-Alamin 1998). The current analysis extends this
previous research by investigating the possible source of variation between the groups: that is,
does this difference remain after controlling for high school academic preparation and college
entrance examination scores? To address this question, this analysis looks at the following di-
mensions of persistence and attainment: 1) number of enrollment spells, 2) retention at the initial
4-year institution, 3) persistence track to a bachelor’s degree, and 4) attainment or last academic
year of enrollment through 1998.
Number of Enrollment Spells
An “enrollment spell” is a period of continuous enrollment at one or more institutions. One
spell ends each time the student is not enrolled in a postsecondary education institution for more
than 4 months. The new spell does not start until they enroll again. In this analysis, the number of
enrollment spells was calculated as of the First Follow-up survey, which took place in spring
1998 about 3 years after the beginning postsecondary students initially enrolled. Enrollment spell
is an important indicator of persistence and attainment because breaks in enrollment continuity
will increase the time required to complete a program of study (Berkner, McCormick, and Cuc-
caro-Alamin 1996).
First-generation students were more likely than their peers whose parents completed col-
lege to have two or more enrollment spells (15 percent versus 10 percent) (table 11). This finding
was particularly strong among students whose secondary curriculum somewhat exceeded the core
New Basics, where first-generation students were more likely than students whose parents had a
college education to have experienced two or more enrollment spells (18 percent versus 8 per-
cent). Similarly, first-generation students were more likely than students with parents who com-
pleted college to experience two or more postsecondary enrollment spells when their college
entrance examination scores were in the middle quartiles (17 percent versus 9 percent) (table 12).
The same was not true for students who substantially exceed the core New Basics or took rigor-
ous coursework or who scored in the top quartile, however; across levels of parents’ education,
there were no differences in the likelihood of having two or more enrollment spells.
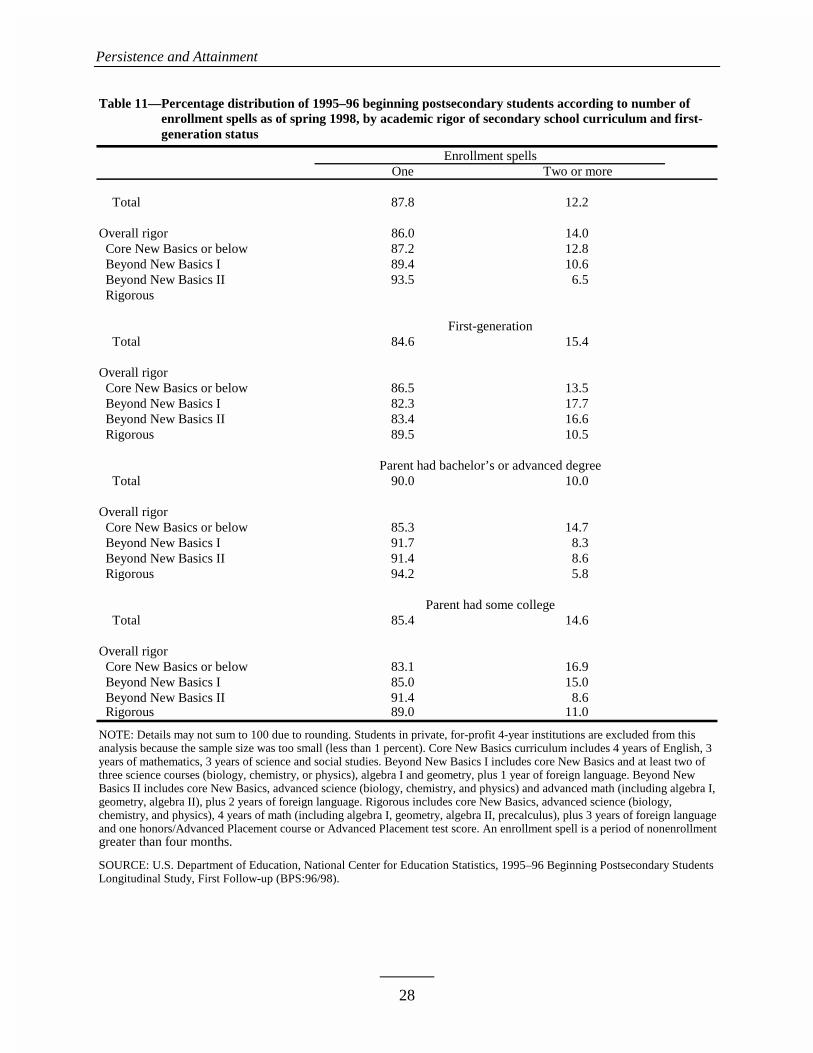
Persistence and Attainment
28
Table 11—Percentage distribution of 1995–96 beginning postsecondary students according to number ofTable 11—enrollment spells as of spring 1998, by academic rigor of secondary school curriculum and first-Table 11—generation status
One Two or more
Total 87.8 12.2
Overall rigor 86.0 14.0 Core New Basics or below 87.2 12.8 Beyond New Basics I 89.4 10.6 Beyond New Basics II 93.5 6.5 Rigorous
Total 84.6 15.4
Overall rigor Core New Basics or below 86.5 13.5 Beyond New Basics I 82.3 17.7 Beyond New Basics II 83.4 16.6 Rigorous 89.5 10.5
Total 90.0 10.0
Overall rigor Core New Basics or below 85.3 14.7 Beyond New Basics I 91.7 8.3 Beyond New Basics II 91.4 8.6 Rigorous 94.2 5.8
Total 85.4 14.6
Overall rigor Core New Basics or below 83.1 16.9 Beyond New Basics I 85.0 15.0 Beyond New Basics II 91.4 8.6 Rigorous 89.0 11.0
NOTE: Details may not sum to 100 due to rounding. Students in private, for-profit 4-year institutions are excluded from this analysis because the sample size was too small (less than 1 percent). Core New Basics curriculum includes 4 years of English, 3years of mathematics, 3 years of science and social studies. Beyond New Basics I includes core New Basics and at least two ofthree science courses (biology, chemistry, or physics), algebra I and geometry, plus 1 year of foreign language. Beyond New Basics II includes core New Basics, advanced science (biology, chemistry, and physics) and advanced math (including algebra I,geometry, algebra II), plus 2 years of foreign language. Rigorous includes core New Basics, advanced science (biology,chemistry, and physics), 4 years of math (including algebra I, geometry, algebra II, precalculus), plus 3 years of foreign languageand one honors/Advanced Placement course or Advanced Placement test score. An enrollment spell is a period of nonenrollmentgreater than four months.
SOURCE: U.S. Department of Education, National Center for Education Statistics, 1995–96 Beginning Postsecondary StudentsLongitudinal Study, First Follow-up (BPS:96/98).
First-generation
Parent had some college
Parent had bachelor’s or advanced degree
Enrollment spells
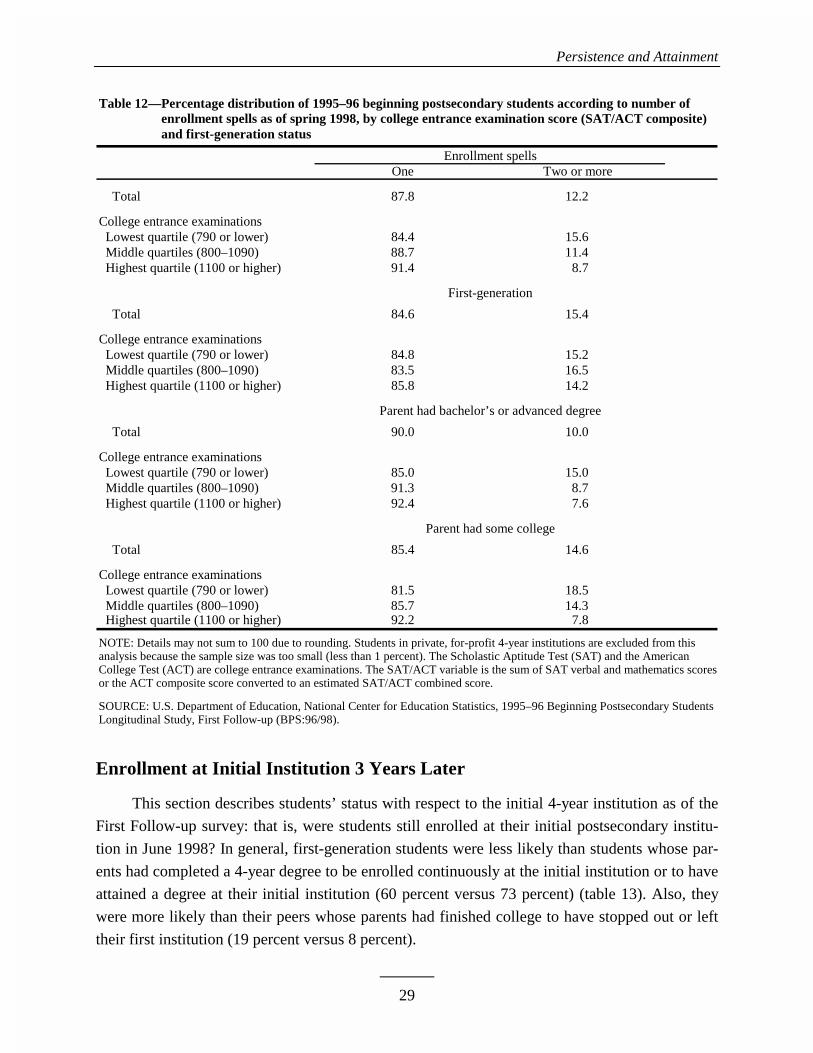
Persistence and Attainment
29
Table 12—Percentage distribution of 1995–96 beginning postsecondary students according to number ofTable 12—enrollment spells as of spring 1998, by college entrance examination score (SAT/ACT composite)Table 12—and first-generation status
One Two or more
Total 87.8 12.2
College entrance examinations Lowest quartile (790 or lower) 84.4 15.6 Middle quartiles (800–1090) 88.7 11.4 Highest quartile (1100 or higher) 91.4 8.7
Total 84.6 15.4
College entrance examinations Lowest quartile (790 or lower) 84.8 15.2 Middle quartiles (800–1090) 83.5 16.5 Highest quartile (1100 or higher) 85.8 14.2
Total 90.0 10.0
College entrance examinations Lowest quartile (790 or lower) 85.0 15.0 Middle quartiles (800–1090) 91.3 8.7 Highest quartile (1100 or higher) 92.4 7.6
Total 85.4 14.6
College entrance examinations Lowest quartile (790 or lower) 81.5 18.5 Middle quartiles (800–1090) 85.7 14.3 Highest quartile (1100 or higher) 92.2 7.8
NOTE: Details may not sum to 100 due to rounding. Students in private, for-profit 4-year institutions are excluded from thisanalysis because the sample size was too small (less than 1 percent). The Scholastic Aptitude Test (SAT) and the AmericanCollege Test (ACT) are college entrance examinations. The SAT/ACT variable is the sum of SAT verbal and mathematics scoresor the ACT composite score converted to an estimated SAT/ACT combined score.
SOURCE: U.S. Department of Education, National Center for Education Statistics, 1995–96 Beginning Postsecondary StudentsLongitudinal Study, First Follow-up (BPS:96/98).
First-generation
Parent had some college
Parent had bachelor’s or advanced degree
Enrollment spells
Enrollment at Initial Institution 3 Years Later
This section describes students’ status with respect to the initial 4-year institution as of the
First Follow-up survey: that is, were students still enrolled at their initial postsecondary institu-
tion in June 1998? In general, first-generation students were less likely than students whose par-
ents had completed a 4-year degree to be enrolled continuously at the initial institution or to have
attained a degree at their initial institution (60 percent versus 73 percent) (table 13). Also, they
were more likely than their peers whose parents had finished college to have stopped out or left
their first institution (19 percent versus 8 percent).
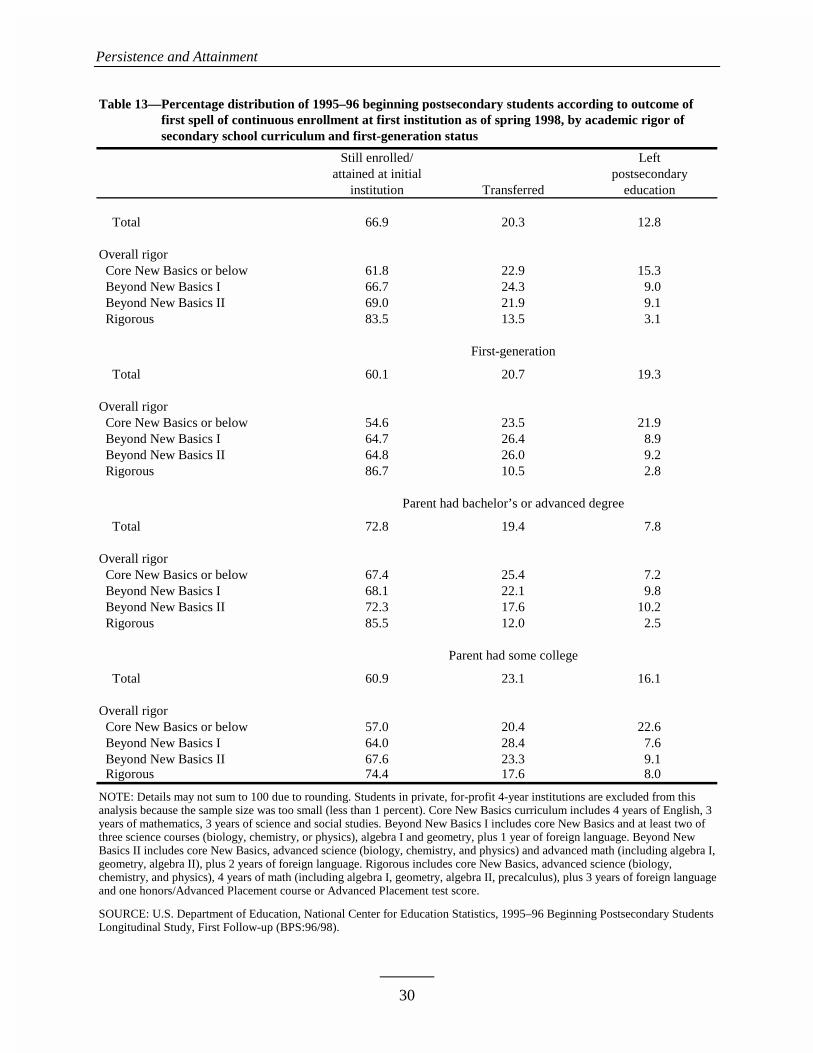
Persistence and Attainment
30
Table 13—Percentage distribution of 1995–96 beginning postsecondary students according to outcome ofTable 13—first spell of continuous enrollment at first institution as of spring 1998, by academic rigor ofTable 13—secondary school curriculum and first-generation status
Still enrolled/ Leftattained at initial postsecondary
institution Transferred education
Total 66.9 20.3 12.8
Overall rigor Core New Basics or below 61.8 22.9 15.3 Beyond New Basics I 66.7 24.3 9.0 Beyond New Basics II 69.0 21.9 9.1 Rigorous 83.5 13.5 3.1
First-generation
Total 60.1 20.7 19.3
Overall rigor Core New Basics or below 54.6 23.5 21.9 Beyond New Basics I 64.7 26.4 8.9 Beyond New Basics II 64.8 26.0 9.2 Rigorous 86.7 10.5 2.8
Parent had bachelor’s or advanced degree
Total 72.8 19.4 7.8
Overall rigor Core New Basics or below 67.4 25.4 7.2 Beyond New Basics I 68.1 22.1 9.8 Beyond New Basics II 72.3 17.6 10.2 Rigorous 85.5 12.0 2.5
Parent had some college
Total 60.9 23.1 16.1
Overall rigor Core New Basics or below 57.0 20.4 22.6 Beyond New Basics I 64.0 28.4 7.6 Beyond New Basics II 67.6 23.3 9.1 Rigorous 74.4 17.6 8.0
NOTE: Details may not sum to 100 due to rounding. Students in private, for-profit 4-year institutions are excluded from this analysis because the sample size was too small (less than 1 percent). Core New Basics curriculum includes 4 years of English, 3years of mathematics, 3 years of science and social studies. Beyond New Basics I includes core New Basics and at least two ofthree science courses (biology, chemistry, or physics), algebra I and geometry, plus 1 year of foreign language. Beyond New Basics II includes core New Basics, advanced science (biology, chemistry, and physics) and advanced math (including algebra I,geometry, algebra II), plus 2 years of foreign language. Rigorous includes core New Basics, advanced science (biology,chemistry, and physics), 4 years of math (including algebra I, geometry, algebra II, precalculus), plus 3 years of foreign languageand one honors/Advanced Placement course or Advanced Placement test score.
SOURCE: U.S. Department of Education, National Center for Education Statistics, 1995–96 Beginning Postsecondary StudentsLongitudinal Study, First Follow-up (BPS:96/98).
Persistence and Attainment
31
Students’ academic preparation was also related to their enrollment at their initial post-
secondary institution 3 years later. As the rigor of students’ high school curriculum increased, so
did the percentage of students who were still enrolled (or had attained a degree) at their first in-
stitution in June 1998—from 62 percent to 84 percent. Also, as rigor of the high school curricu-
lum increased, the percentage of all students who transferred or stopped out or left their initial
institution decreased.
Holding secondary curriculum rigor constant, there were only two differences between the
enrollment patterns of students who were first generation and those who were not. Among stu-
dents whose secondary curriculum was not rigorous, first-generation students were less likely
than students whose parents had completed college (but not those whose parents had some col-
lege) to still be enrolled or have attained a degree 3 years later (55 percent versus 67 percent).
Paralleling this trend, first-generation students whose secondary curriculum was not rigorous
were more likely to have stopped out or left their initial institution than students whose parents
had graduated from college (but not those whose parents had some college) (22 percent versus 7
percent).
These differences, however, were not apparent among students who took rigorous courses
in high school. In these cases, first-generation students were as likely as their non-first-generation
counterparts to be enrolled or have attained a degree in spring 1998. For example, among stu-
dents who took rigorous coursework, 87 percent of first-generation students were still enrolled 3
years after entering college, compared with 86 percent of their counterparts whose parents had a
bachelor’s degree.
Academic achievement was also related to students’ enrollment status (table 14). As stu-
dents’ college entrance examination scores increased, so did the percentage of students who were
still enrolled or had attained a degree at their initial institution. Conversely, as academic
achievement increased, the percentage of students who transferred or left postsecondary educa-
tion decreased.
Holding college entrance examination scores constant, there was only one difference be-
tween first-generation and non-first-generation students with regard to their enrollment at their
first institution 3 years later. Among students who scored in the lowest quartile in their college
entrance examinations, first-generation students were more likely than students whose parents
had completed college to have stopped out or left their first institution (21 percent versus 12 per-
cent). Among students who scored in higher quartiles, however, parents’ level of education was
not related to enrollment in June 1998. For example, first-generation students were as likely as
students whose parents had completed college to be continuously enrolled (or have attained a de-
gree) 3 years after entering their initial institution (81 percent for each group).
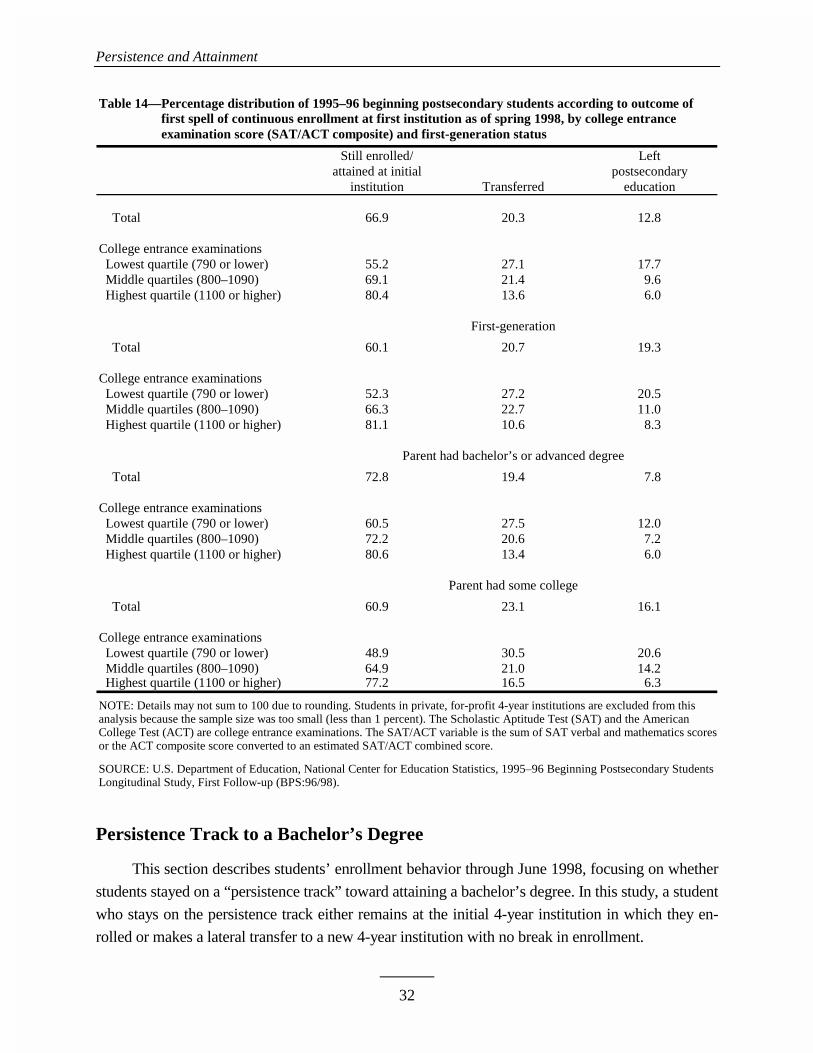
Persistence and Attainment
32
Table 14—Percentage distribution of 1995–96 beginning postsecondary students according to outcome ofTable 14—first spell of continuous enrollment at first institution as of spring 1998, by college entranceTable 14—examination score (SAT/ACT composite) and first-generation status
Still enrolled/ Leftattained at initial postsecondary
institution Transferred education
Total 66.9 20.3 12.8
College entrance examinations Lowest quartile (790 or lower) 55.2 27.1 17.7 Middle quartiles (800–1090) 69.1 21.4 9.6 Highest quartile (1100 or higher) 80.4 13.6 6.0
First-generation
Total 60.1 20.7 19.3
College entrance examinations Lowest quartile (790 or lower) 52.3 27.2 20.5 Middle quartiles (800–1090) 66.3 22.7 11.0 Highest quartile (1100 or higher) 81.1 10.6 8.3
Parent had bachelor’s or advanced degree
Total 72.8 19.4 7.8
College entrance examinations Lowest quartile (790 or lower) 60.5 27.5 12.0 Middle quartiles (800–1090) 72.2 20.6 7.2 Highest quartile (1100 or higher) 80.6 13.4 6.0
Parent had some college
Total 60.9 23.1 16.1
College entrance examinations Lowest quartile (790 or lower) 48.9 30.5 20.6 Middle quartiles (800–1090) 64.9 21.0 14.2 Highest quartile (1100 or higher) 77.2 16.5 6.3
NOTE: Details may not sum to 100 due to rounding. Students in private, for-profit 4-year institutions are excluded from thisanalysis because the sample size was too small (less than 1 percent). The Scholastic Aptitude Test (SAT) and the AmericanCollege Test (ACT) are college entrance examinations. The SAT/ACT variable is the sum of SAT verbal and mathematics scoresor the ACT composite score converted to an estimated SAT/ACT combined score.
SOURCE: U.S. Department of Education, National Center for Education Statistics, 1995–96 Beginning Postsecondary StudentsLongitudinal Study, First Follow-up (BPS:96/98).
Persistence Track to a Bachelor’s Degree
This section describes students’ enrollment behavior through June 1998, focusing on whether
students stayed on a “persistence track” toward attaining a bachelor’s degree. In this study, a student
who stays on the persistence track either remains at the initial 4-year institution in which they en-
rolled or makes a lateral transfer to a new 4-year institution with no break in enrollment.
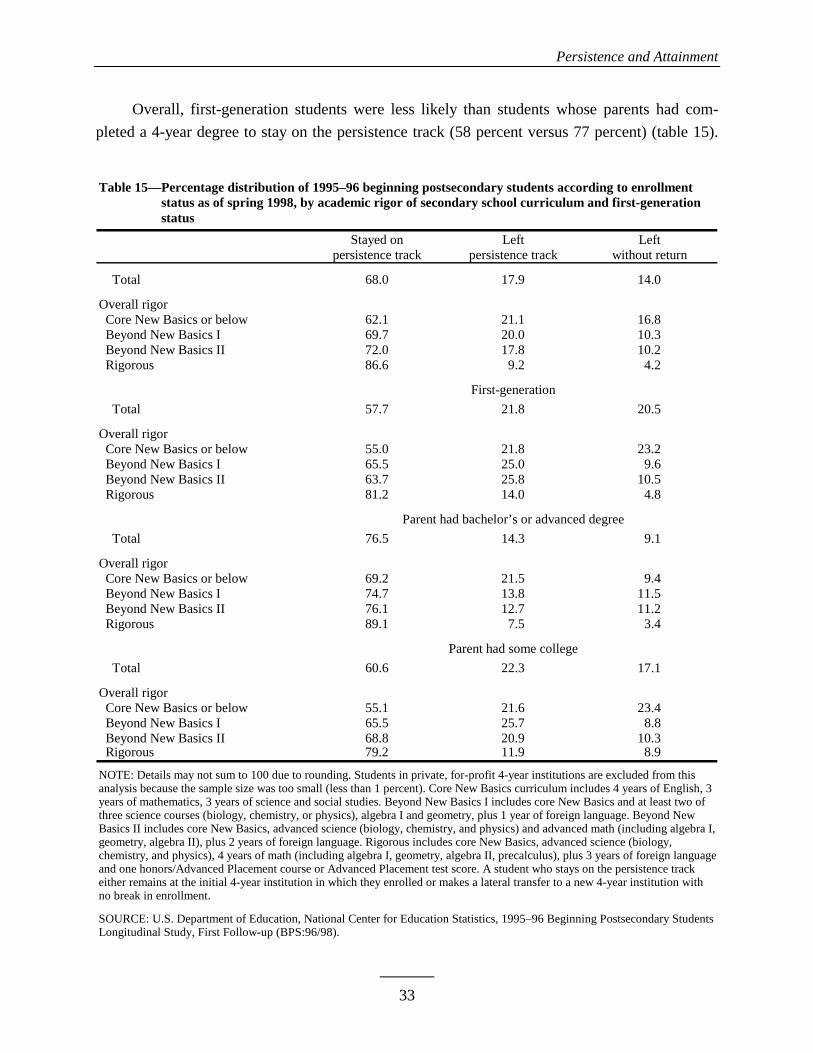
Persistence and Attainment
33
Overall, first-generation students were less likely than students whose parents had com-
pleted a 4-year degree to stay on the persistence track (58 percent versus 77 percent) (table 15).
Table 15—Percentage distribution of 1995–96 beginning postsecondary students according to enrollmentTable 15—status as of spring 1998, by academic rigor of secondary school curriculum and first-generationTable 15—status
Stayed on Left Leftpersistence track persistence track without return
Total 68.0 17.9 14.0
Overall rigor Core New Basics or below 62.1 21.1 16.8 Beyond New Basics I 69.7 20.0 10.3 Beyond New Basics II 72.0 17.8 10.2 Rigorous 86.6 9.2 4.2
First-generation
Total 57.7 21.8 20.5
Overall rigor Core New Basics or below 55.0 21.8 23.2 Beyond New Basics I 65.5 25.0 9.6 Beyond New Basics II 63.7 25.8 10.5 Rigorous 81.2 14.0 4.8
Parent had bachelor’s or advanced degree
Total 76.5 14.3 9.1
Overall rigor Core New Basics or below 69.2 21.5 9.4 Beyond New Basics I 74.7 13.8 11.5 Beyond New Basics II 76.1 12.7 11.2 Rigorous 89.1 7.5 3.4
Parent had some college
Total 60.6 22.3 17.1
Overall rigor Core New Basics or below 55.1 21.6 23.4 Beyond New Basics I 65.5 25.7 8.8 Beyond New Basics II 68.8 20.9 10.3 Rigorous 79.2 11.9 8.9
NOTE: Details may not sum to 100 due to rounding. Students in private, for-profit 4-year institutions are excluded from this analysis because the sample size was too small (less than 1 percent). Core New Basics curriculum includes 4 years of English, 3years of mathematics, 3 years of science and social studies. Beyond New Basics I includes core New Basics and at least two ofthree science courses (biology, chemistry, or physics), algebra I and geometry, plus 1 year of foreign language. Beyond New Basics II includes core New Basics, advanced science (biology, chemistry, and physics) and advanced math (including algebra I,geometry, algebra II), plus 2 years of foreign language. Rigorous includes core New Basics, advanced science (biology,chemistry, and physics), 4 years of math (including algebra I, geometry, algebra II, precalculus), plus 3 years of foreign languageand one honors/Advanced Placement course or Advanced Placement test score. A student who stays on the persistence trackeither remains at the initial 4-year institution in which they enrolled or makes a lateral transfer to a new 4-year institution withno break in enrollment.
SOURCE: U.S. Department of Education, National Center for Education Statistics, 1995–96 Beginning Postsecondary StudentsLongitudinal Study, First Follow-up (BPS:96/98).
Persistence and Attainment
34
Compared with their peers whose parents finished college, first-generation students were more
likely to have left the persistence track (22 percent versus 14 percent), and were more than twice
as likely to have left their first institution without returning (21 percent versus 9 percent).
Not surprisingly, given the findings related to the first enrollment spell, academic prepara-
tion was also related to students’ remaining on the persistence track. As the rigor of students’
high school curriculum increased, so did the likelihood that they would stay on the persistence
track toward earning a bachelor’s degree: 87 percent of all students who took rigorous academic
coursework in high school stayed on the persistence track, while only 62 percent of students who
did not take such coursework did so.
Differences between first-generation and non-first-generation students remained after con-
trolling for the rigor of high school coursetaking. For example, among students whose secondary
curriculum did not exceed the core New Basics, 55 percent of first-generation students stayed on
the persistence track, compared with 69 percent of students whose parents had a bachelor’s de-
gree or more. Likewise, first-generation students who substantially exceeded the core New Ba-
sics in high school were more likely than their peers whose parents completed college to leave
the persistence track (26 percent versus 13 percent). Finally, first-generation students whose
coursework did not exceed the core New Basics left postsecondary education without returning at
about double the rate of their counterparts whose parents had completed college (23 percent ver-
sus 9 percent).
However, much like the findings regarding the first enrollment spell, such differences were
not apparent among students who took the most rigorous high school curricula. Regardless of
first-generation status, between 79 and 89 percent of students who took rigorous curricula stayed
on the persistence track. In addition, first-generation students who took rigorous curricula in high
school were no more likely than their peers whose parents had a bachelor’s degree to leave post-
secondary education completely (5 percent versus 3 percent).
Controlling for students’ scores on college entrance examinations yielded similar findings
(table 16). As students’ scores on these examinations increased, so did their likelihood of staying
on the persistence track to the bachelor’s degree: 83 percent of all students who scored in the
highest quartile stayed on the persistence track, compared with only 55 percent of students scor-
ing in the lowest quartile. First-generation students were less likely than students whose parents
had a college degree to stay on the persistence track when their college entrance examination
scores were in the lowest quartile (52 percent versus 63 percent) or in the middle quartile (65
percent versus 78 percent). In contrast, these two student groups did not differ with respect to
staying on the persistence track when they scored in the highest quartile on college entrance ex-
aminations (75 percent versus 84 percent).
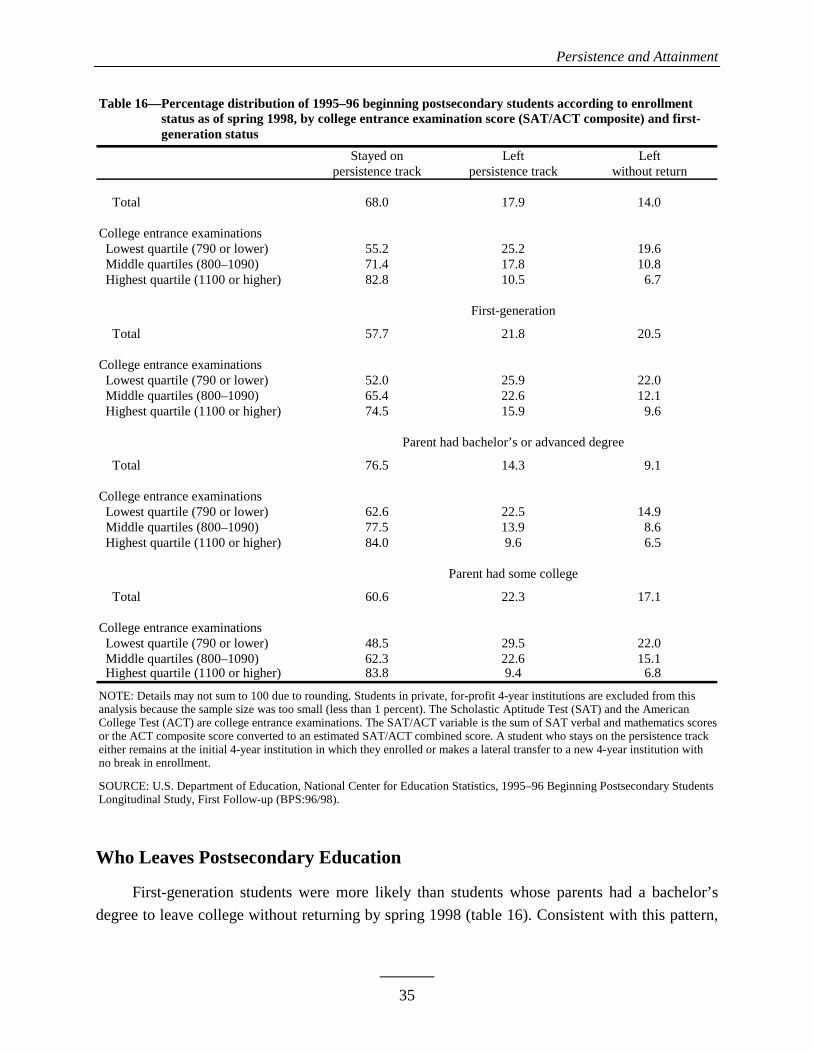
Persistence and Attainment
35
Table 16—Percentage distribution of 1995–96 beginning postsecondary students according to enrollment Table 16—status as of spring 1998, by college entrance examination score (SAT/ACT composite) and first-Table 16—generation status
Stayed on Left Leftpersistence track persistence track without return
Total 68.0 17.9 14.0
College entrance examinations Lowest quartile (790 or lower) 55.2 25.2 19.6 Middle quartiles (800–1090) 71.4 17.8 10.8 Highest quartile (1100 or higher) 82.8 10.5 6.7
First-generation
Total 57.7 21.8 20.5
College entrance examinations Lowest quartile (790 or lower) 52.0 25.9 22.0 Middle quartiles (800–1090) 65.4 22.6 12.1 Highest quartile (1100 or higher) 74.5 15.9 9.6
Parent had bachelor’s or advanced degree
Total 76.5 14.3 9.1
College entrance examinations Lowest quartile (790 or lower) 62.6 22.5 14.9 Middle quartiles (800–1090) 77.5 13.9 8.6 Highest quartile (1100 or higher) 84.0 9.6 6.5
Parent had some college
Total 60.6 22.3 17.1
College entrance examinations Lowest quartile (790 or lower) 48.5 29.5 22.0 Middle quartiles (800–1090) 62.3 22.6 15.1 Highest quartile (1100 or higher) 83.8 9.4 6.8
NOTE: Details may not sum to 100 due to rounding. Students in private, for-profit 4-year institutions are excluded from thisanalysis because the sample size was too small (less than 1 percent). The Scholastic Aptitude Test (SAT) and the AmericanCollege Test (ACT) are college entrance examinations. The SAT/ACT variable is the sum of SAT verbal and mathematics scoresor the ACT composite score converted to an estimated SAT/ACT combined score. A student who stays on the persistence trackeither remains at the initial 4-year institution in which they enrolled or makes a lateral transfer to a new 4-year institution withno break in enrollment.
SOURCE: U.S. Department of Education, National Center for Education Statistics, 1995–96 Beginning Postsecondary StudentsLongitudinal Study, First Follow-up (BPS:96/98).
Who Leaves Postsecondary Education
First-generation students were more likely than students whose parents had a bachelor’s
degree to leave college without returning by spring 1998 (table 16). Consistent with this pattern,
Persistence and Attainment
36
first-generation students were less likely than students whose parents had completed college to be
enrolled 3 years after entering a 4-year institution (68 percent versus 86 percent) (table 17).9
Once again, the rigor of students’ high school coursework made a difference in who left
college and who stayed enrolled: the percentage of students who were enrolled and still working
for a degree increased as the rigor of students’ high school coursework increased (table 17).
First-generation status also made a difference for the least prepared students. After control-
ling for academic preparation, first-generation students who did not take a rigorous curriculum in
high school were less likely than students whose parents completed college to be enrolled 3 years
after entering a 4-year institution (65 percent versus 85 percent). However, among students who
were more prepared—that is, students whose high school curriculum was rigorous—no differ-
ences in persistence were found according to students’ parental level of education. For example,
a large majority of both first-generation students (88 percent) and students whose parents com-
pleted college (94 percent) were still enrolled in June 1998.
In addition, students’ college entrance examination scores were related to who left college
and who stayed enrolled (table 18). The higher their college examination score, the less likely
students were to leave postsecondary education during the first 2 years of college: 74 percent of
students in the lowest quartile of examination scores were still working toward or had attained a
degree in spring 1998, whereas 85 percent to 92 percent of their peers with higher scores reported
the same. After controlling for academic preparation, first-generation students scoring in the low-
est quartile were more likely than students whose parents had completed college to have left
postsecondary education during the second academic year (1996–97). However, among students
who scored in the highest quartile, first-generation students were as likely as students whose par-
ents completed college to be enrolled.
9The results show a slightly higher proportion of first-generation students had attained a degree by June 1998, compared withstudents whose parents had a bachelor’s degree (5 percent versus 3 percent). This is probably due to the fact that first-generationstudents transferred down more often and then earned an associate’s or vocational certificate from a 2-year institution.
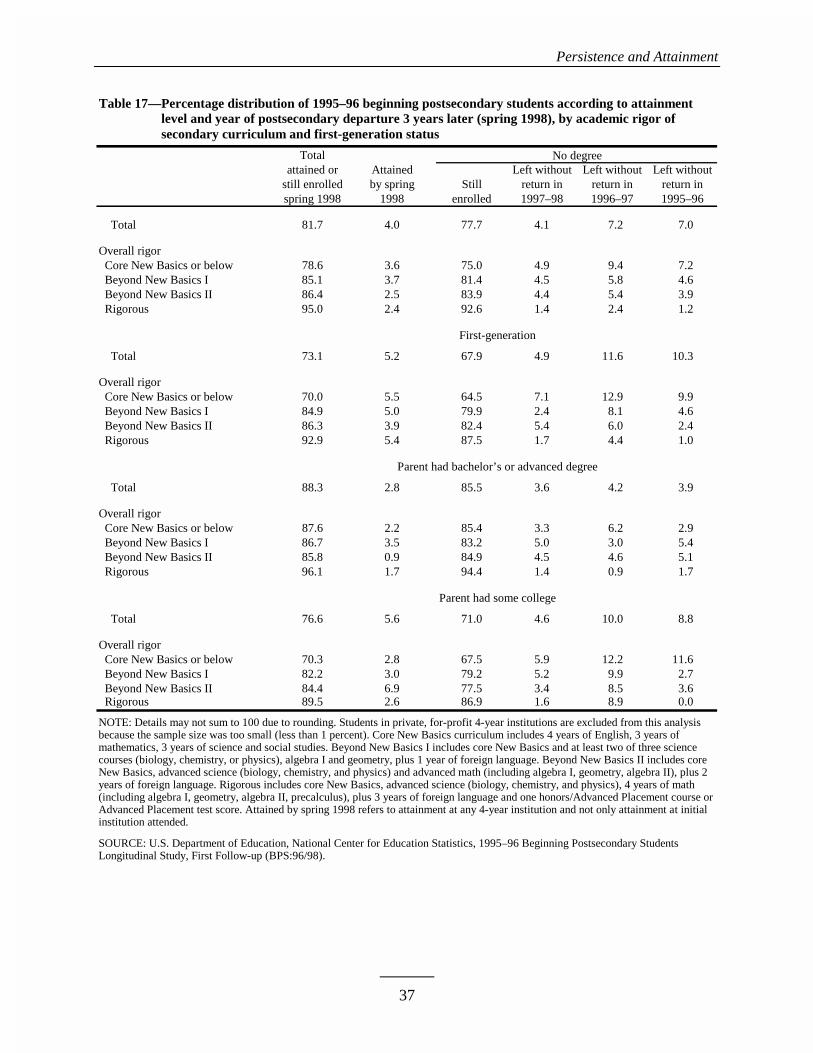
Persistence and Attainment
37
Table 17—Percentage distribution of 1995–96 beginning postsecondary students according to attainmentTable 17—level and year of postsecondary departure 3 years later (spring 1998), by academic rigor ofTable 17—secondary curriculum and first-generation status
Totalattained or Attained Left without Left without Left without
still enrolled by spring Still return in return in return inspring 1998 1998 enrolled 1997–98 1996–97 1995–96
Total 81.7 4.0 77.7 4.1 7.2 7.0
Overall rigor Core New Basics or below 78.6 3.6 75.0 4.9 9.4 7.2 Beyond New Basics I 85.1 3.7 81.4 4.5 5.8 4.6 Beyond New Basics II 86.4 2.5 83.9 4.4 5.4 3.9 Rigorous 95.0 2.4 92.6 1.4 2.4 1.2
Total 73.1 5.2 67.9 4.9 11.6 10.3
Overall rigor Core New Basics or below 70.0 5.5 64.5 7.1 12.9 9.9 Beyond New Basics I 84.9 5.0 79.9 2.4 8.1 4.6 Beyond New Basics II 86.3 3.9 82.4 5.4 6.0 2.4 Rigorous 92.9 5.4 87.5 1.7 4.4 1.0
Total 88.3 2.8 85.5 3.6 4.2 3.9
Overall rigor Core New Basics or below 87.6 2.2 85.4 3.3 6.2 2.9 Beyond New Basics I 86.7 3.5 83.2 5.0 3.0 5.4 Beyond New Basics II 85.8 0.9 84.9 4.5 4.6 5.1 Rigorous 96.1 1.7 94.4 1.4 0.9 1.7
Total 76.6 5.6 71.0 4.6 10.0 8.8
Overall rigor Core New Basics or below 70.3 2.8 67.5 5.9 12.2 11.6 Beyond New Basics I 82.2 3.0 79.2 5.2 9.9 2.7 Beyond New Basics II 84.4 6.9 77.5 3.4 8.5 3.6 Rigorous 89.5 2.6 86.9 1.6 8.9 0.0
NOTE: Details may not sum to 100 due to rounding. Students in private, for-profit 4-year institutions are excluded from this analysisbecause the sample size was too small (less than 1 percent). Core New Basics curriculum includes 4 years of English, 3 years ofmathematics, 3 years of science and social studies. Beyond New Basics I includes core New Basics and at least two of three sciencecourses (biology, chemistry, or physics), algebra I and geometry, plus 1 year of foreign language. Beyond New Basics II includes coreNew Basics, advanced science (biology, chemistry, and physics) and advanced math (including algebra I, geometry, algebra II), plus 2years of foreign language. Rigorous includes core New Basics, advanced science (biology, chemistry, and physics), 4 years of math(including algebra I, geometry, algebra II, precalculus), plus 3 years of foreign language and one honors/Advanced Placement course orAdvanced Placement test score. Attained by spring 1998 refers to attainment at any 4-year institution and not only attainment at initialinstitution attended.
SOURCE: U.S. Department of Education, National Center for Education Statistics, 1995–96 Beginning Postsecondary StudentsLongitudinal Study, First Follow-up (BPS:96/98).
No degree
First-generation
Parent had bachelor’s or advanced degree
Parent had some college
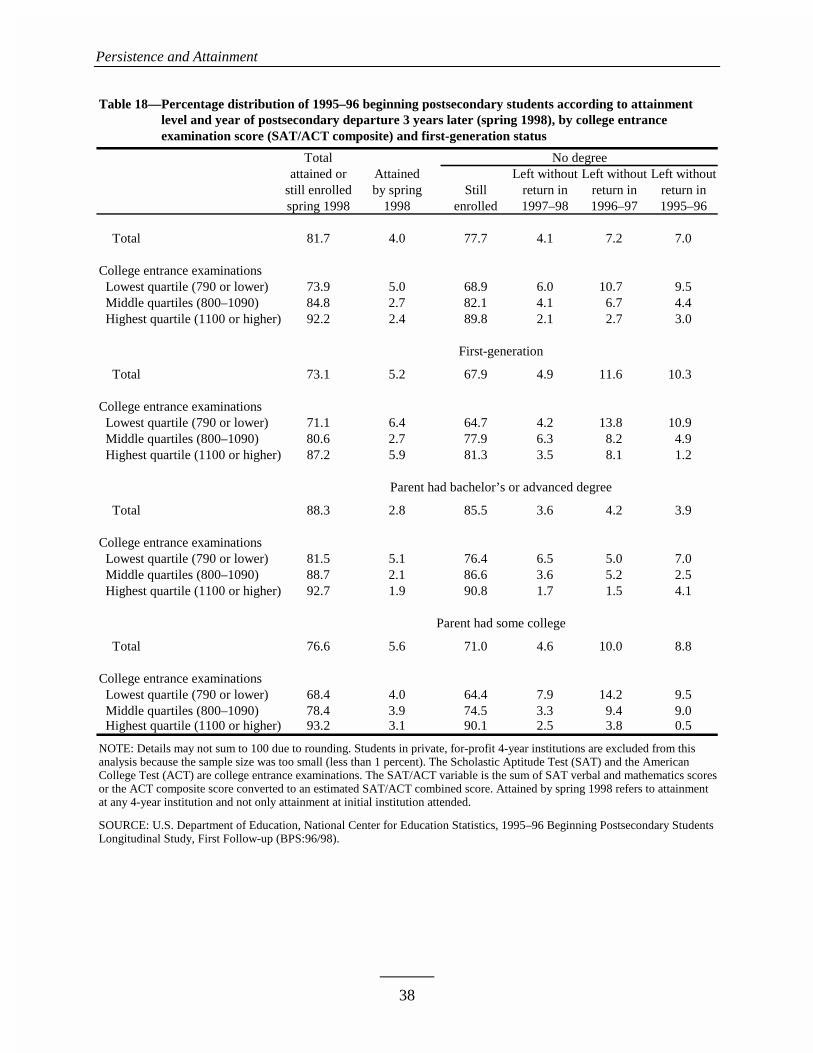
Persistence and Attainment
38
Table 18—Percentage distribution of 1995–96 beginning postsecondary students according to attainmentTable 18—level and year of postsecondary departure 3 years later (spring 1998), by college entranceTable 18—examination score (SAT/ACT composite) and first-generation status
Totalattained or Attained Left without Left without Left without
still enrolled by spring Still return in return in return inspring 1998 1998 enrolled 1997–98 1996–97 1995–96
Total 81.7 4.0 77.7 4.1 7.2 7.0
College entrance examinations Lowest quartile (790 or lower) 73.9 5.0 68.9 6.0 10.7 9.5 Middle quartiles (800–1090) 84.8 2.7 82.1 4.1 6.7 4.4 Highest quartile (1100 or higher) 92.2 2.4 89.8 2.1 2.7 3.0
Total 73.1 5.2 67.9 4.9 11.6 10.3
College entrance examinations Lowest quartile (790 or lower) 71.1 6.4 64.7 4.2 13.8 10.9 Middle quartiles (800–1090) 80.6 2.7 77.9 6.3 8.2 4.9 Highest quartile (1100 or higher) 87.2 5.9 81.3 3.5 8.1 1.2
Total 88.3 2.8 85.5 3.6 4.2 3.9
College entrance examinations Lowest quartile (790 or lower) 81.5 5.1 76.4 6.5 5.0 7.0 Middle quartiles (800–1090) 88.7 2.1 86.6 3.6 5.2 2.5 Highest quartile (1100 or higher) 92.7 1.9 90.8 1.7 1.5 4.1
Total 76.6 5.6 71.0 4.6 10.0 8.8
College entrance examinations Lowest quartile (790 or lower) 68.4 4.0 64.4 7.9 14.2 9.5 Middle quartiles (800–1090) 78.4 3.9 74.5 3.3 9.4 9.0 Highest quartile (1100 or higher) 93.2 3.1 90.1 2.5 3.8 0.5
NOTE: Details may not sum to 100 due to rounding. Students in private, for-profit 4-year institutions are excluded from thisanalysis because the sample size was too small (less than 1 percent). The Scholastic Aptitude Test (SAT) and the AmericanCollege Test (ACT) are college entrance examinations. The SAT/ACT variable is the sum of SAT verbal and mathematics scoresor the ACT composite score converted to an estimated SAT/ACT combined score. Attained by spring 1998 refers to attainmentat any 4-year institution and not only attainment at initial institution attended.
SOURCE: U.S. Department of Education, National Center for Education Statistics, 1995–96 Beginning Postsecondary StudentsLongitudinal Study, First Follow-up (BPS:96/98).
No degree
First-generation
Parent had bachelor’s or advanced degree
Parent had some college
39
Controlling for Related Variables
The tabular analyses presented thus far have compared parents’ education levels with stu-
dents’ preparation for postsecondary education, college enrollment and academic performance,
and persistence and attainment. To answer the study’s main research question—do first-
generation students (who were otherwise as prepared academically as their counterparts) persist
in college at a rate similar to that of students whose parents went to college—multiple regression
analysis is necessary to determine the independent effects of specific variables on selected out-
comes.
Two outcomes were examined in regression analyses: the proportion of students who were
retained at the initial institution as of spring 1998 and the proportion of students who stayed on
the persistence track to a bachelor’s degree. The following independent variables were included
in these models:
Students’ background
Parents’ education (some college or college graduates versus high school or less (first-generation))
Family income (low or high quartile versus middle two quartiles)
Marital status (married versus not married)
Race/ethnicity (black/non-Hispanic, Hispanic, Asian/Pacific Islander, or American In-dian/Alaskan Native versus white)
Gender (male versus female)
Preparation for postsecondary education
Overall rigor of academic coursework (beyond New Basics I & II or rigorous versus coreNew Basics or below)
College entrance examinations (low or high quartile versus middle two quartiles)
Controlling for Related Variables
40
Postsecondary status
Enrollment status (full-time versus part-time)
Employment status (did not work or part-time versus full-time employment)
Postsecondary academic performance
First-year GPA (low or high quartile versus middle two quartiles)
Remedial courses (no remedial course taken versus one or more remedial courses taken)
Enrollment at Initial Institution 3 Years Later
The first regression model examined how likely beginning postsecondary students were to
stay enrolled at their initial institution, controlling for the independent variables listed above. The
results are presented in table 19. The first column of numbers provides the unadjusted percent-
ages—that is, the proportion of students who stayed enrolled at the first institution before ad-
justing for covariation among all other independent variables. The second column shows the
adjusted percentages—that is, the expected percentages for various subgroups after adjusting for
covariance among the other variables. All comparisons and tests of statistical significance (indi-
cated with asterisks) are made in relation to the reference group, which is presented in italics.
After adjusting for covariance among all variables, parents’ education continued to be a
significant factor in whether a student stayed at the initial institution. Compared with first-
generation students, those whose parents attained a bachelor’s degree or higher were more likely
to persist at the initial institution in which they were enrolled. Even after controlling for interre-
lated variables such as family income, enrollment/employment status, and academic preparation
and postsecondary achievement, first-generation status still had a negative effect on students’
persistence at the initial institution in which they were enrolled relative to students whose parents
completed college. At the same time, academic preparedness proved to be an important predictor
of persistence at initial institution. After controlling for postsecondary achievement and parents’
education as well as all other variables, students who took rigorous coursework in high school
increased their chances of remaining at the 4-year institution in which they first enrolled.
Other characteristics associated with higher rates of retention in the original institution in-
cluded having higher first-year GPAs; enrolling full time, rather than part time; and not working
or only working part time, rather than working full time, while enrolled.
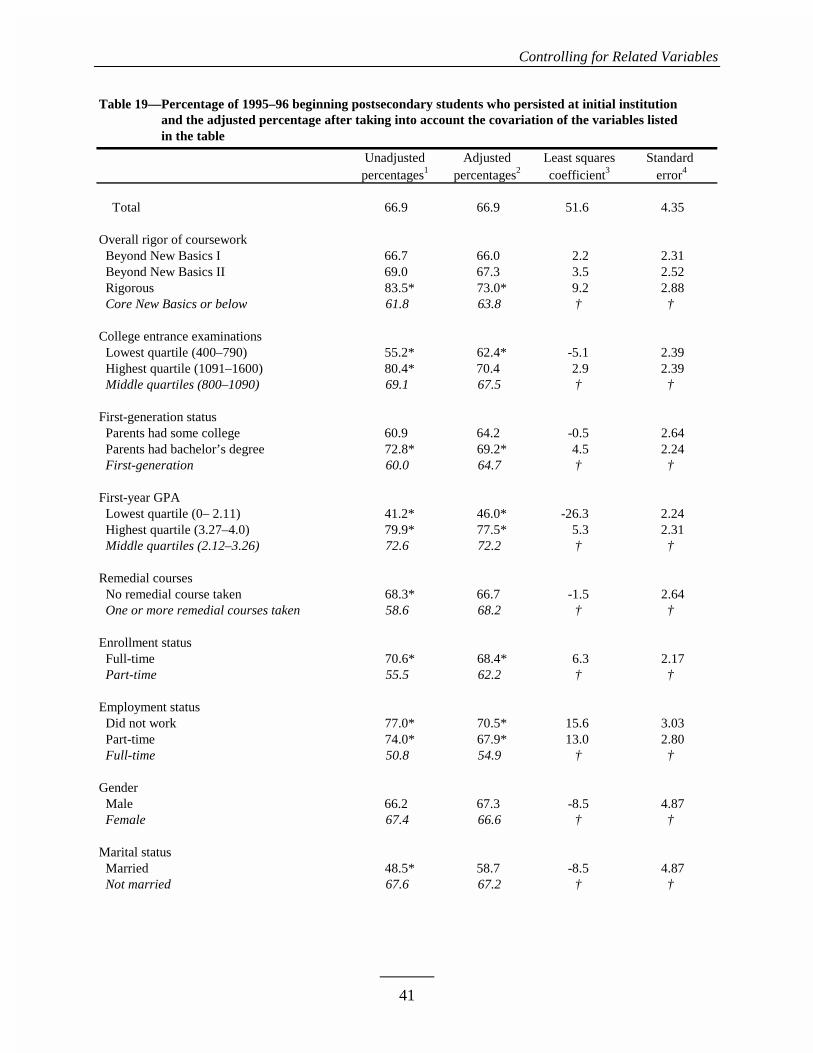
Controlling for Related Variables
41
Table 19—Percentage of 1995–96 beginning postsecondary students who persisted at initial institutionTable 19—and the adjusted percentage after taking into account the covariation of the variables listedTable 19—in the table
Unadjusted Adjusted Least squares Standard percentages1 percentages2 coefficient3 error4
Total 66.9 66.9 51.6 4.35
Overall rigor of coursework Beyond New Basics I 66.7 66.0 2.2 2.31 Beyond New Basics II 69.0 67.3 3.5 2.52 Rigorous 83.5* 73.0* 9.2 2.88 Core New Basics or below 61.8 63.8 † †
College entrance examinations Lowest quartile (400–790) 55.2* 62.4* -5.1 2.39 Highest quartile (1091–1600) 80.4* 70.4 2.9 2.39 Middle quartiles (800–1090) 69.1 67.5 † †
First-generation status Parents had some college 60.9 64.2 -0.5 2.64 Parents had bachelor’s degree 72.8* 69.2* 4.5 2.24 First-generation 60.0 64.7 † †
First-year GPA Lowest quartile (0– 2.11) 41.2* 46.0* -26.3 2.24 Highest quartile (3.27–4.0) 79.9* 77.5* 5.3 2.31 Middle quartiles (2.12–3.26) 72.6 72.2 † †
Remedial courses No remedial course taken 68.3* 66.7 -1.5 2.64 One or more remedial courses taken 58.6 68.2 † †
Enrollment status Full-time 70.6* 68.4* 6.3 2.17 Part-time 55.5 62.2 † †
Employment status Did not work 77.0* 70.5* 15.6 3.03 Part-time 74.0* 67.9* 13.0 2.80 Full-time 50.8 54.9 † †
Gender Male 66.2 67.3 -8.5 4.87 Female 67.4 66.6 † †
Marital status Married 48.5* 58.7 -8.5 4.87 Not married 67.6 67.2 † †
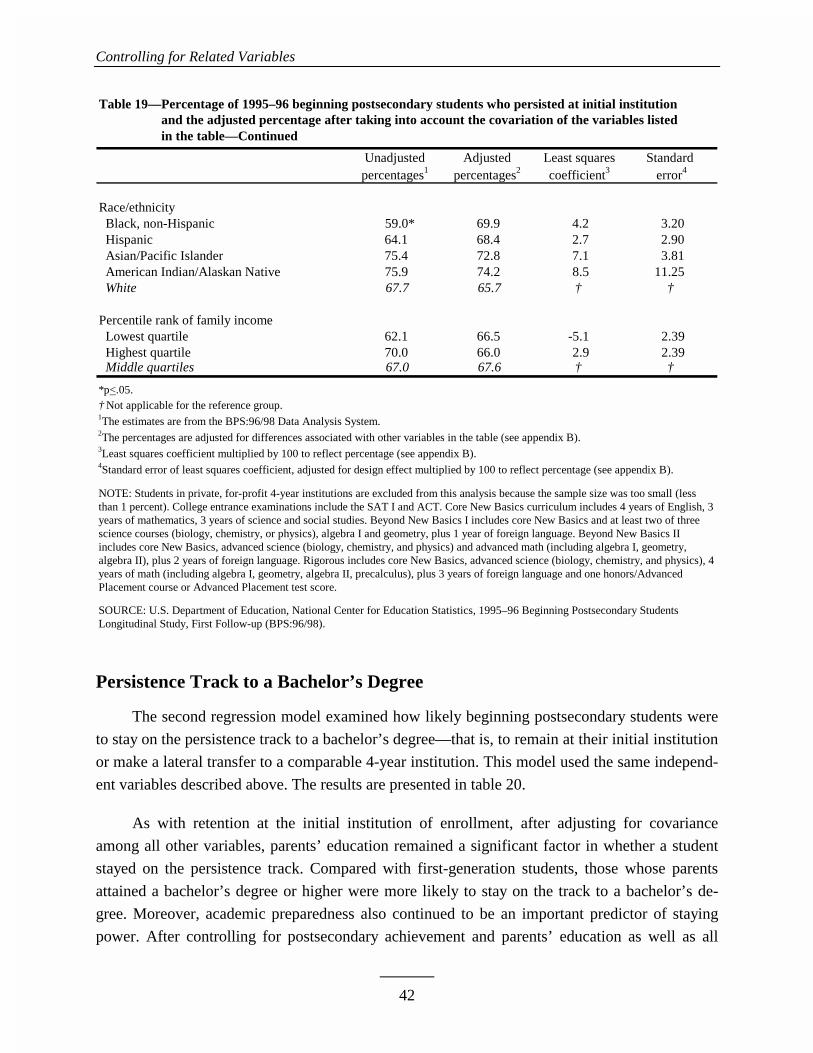
Controlling for Related Variables
42
Table 19—Percentage of 1995–96 beginning postsecondary students who persisted at initial institutionTable 19—and the adjusted percentage after taking into account the covariation of the variables listedTable 19—in the table—Continued
Unadjusted Adjusted Least squares Standard percentages1 percentages2 coefficient3 error4
Race/ethnicity Black, non-Hispanic 59.0* 69.9 4.2 3.20 Hispanic 64.1 68.4 2.7 2.90 Asian/Pacific Islander 75.4 72.8 7.1 3.81 American Indian/Alaskan Native 75.9 74.2 8.5 11.25 White 67.7 65.7 † †
Percentile rank of family income Lowest quartile 62.1 66.5 -5.1 2.39 Highest quartile 70.0 66.0 2.9 2.39 Middle quartiles 67.0 67.6 † †
*p<.05.† Not applicable for the reference group.1The estimates are from the BPS:96/98 Data Analysis System.2The percentages are adjusted for differences associated with other variables in the table (see appendix B).3Least squares coefficient multiplied by 100 to reflect percentage (see appendix B).4Standard error of least squares coefficient, adjusted for design effect multiplied by 100 to reflect percentage (see appendix B).
NOTE: Students in private, for-profit 4-year institutions are excluded from this analysis because the sample size was too small (lessthan 1 percent). College entrance examinations include the SAT I and ACT. Core New Basics curriculum includes 4 years of English, 3years of mathematics, 3 years of science and social studies. Beyond New Basics I includes core New Basics and at least two of threescience courses (biology, chemistry, or physics), algebra I and geometry, plus 1 year of foreign language. Beyond New Basics IIincludes core New Basics, advanced science (biology, chemistry, and physics) and advanced math (including algebra I, geometry,algebra II), plus 2 years of foreign language. Rigorous includes core New Basics, advanced science (biology, chemistry, and physics), 4years of math (including algebra I, geometry, algebra II, precalculus), plus 3 years of foreign language and one honors/AdvancedPlacement course or Advanced Placement test score.
SOURCE: U.S. Department of Education, National Center for Education Statistics, 1995–96 Beginning Postsecondary StudentsLongitudinal Study, First Follow-up (BPS:96/98).
Persistence Track to a Bachelor’s Degree
The second regression model examined how likely beginning postsecondary students were
to stay on the persistence track to a bachelor’s degree—that is, to remain at their initial institution
or make a lateral transfer to a comparable 4-year institution. This model used the same independ-
ent variables described above. The results are presented in table 20.
As with retention at the initial institution of enrollment, after adjusting for covariance
among all other variables, parents’ education remained a significant factor in whether a student
stayed on the persistence track. Compared with first-generation students, those whose parents
attained a bachelor’s degree or higher were more likely to stay on the track to a bachelor’s de-
gree. Moreover, academic preparedness also continued to be an important predictor of staying
power. After controlling for postsecondary achievement and parents’ education as well as all
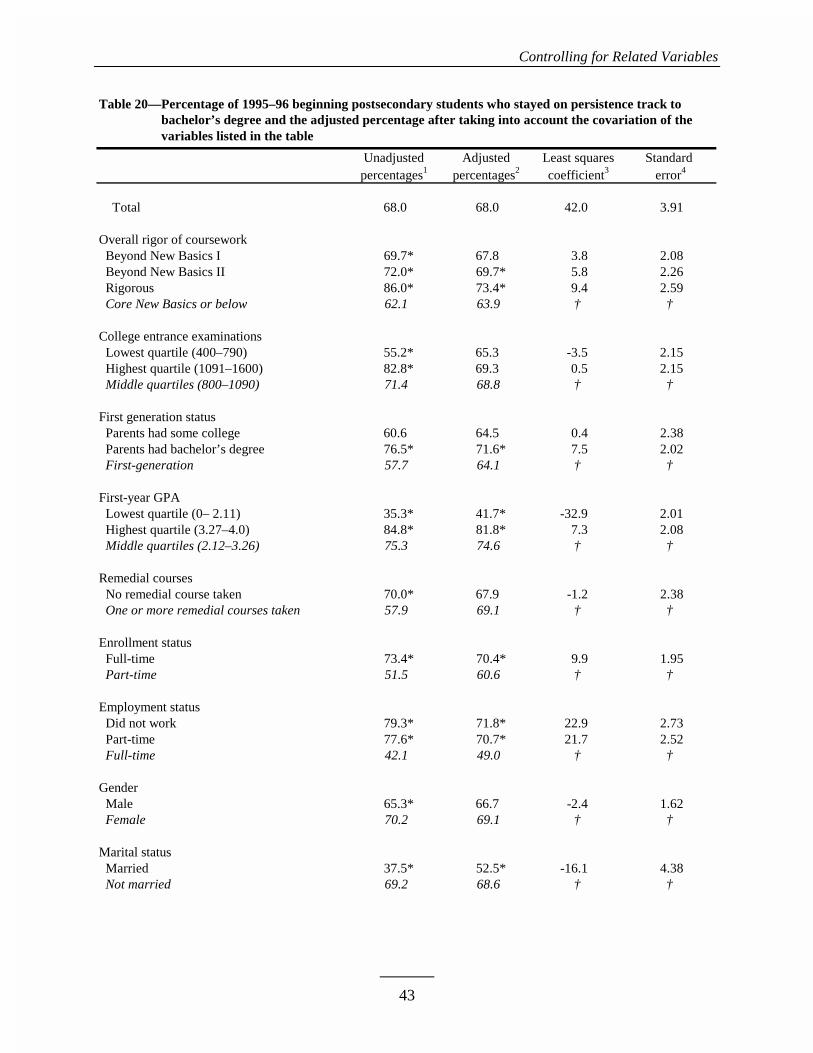
Controlling for Related Variables
43
Table 20—Percentage of 1995–96 beginning postsecondary students who stayed on persistence track toTable 20—bachelor’s degree and the adjusted percentage after taking into account the covariation of theTable 20—variables listed in the table
Unadjusted Adjusted Least squares Standard percentages1 percentages2 coefficient3 error4
Total 68.0 68.0 42.0 3.91
Overall rigor of coursework Beyond New Basics I 69.7* 67.8 3.8 2.08 Beyond New Basics II 72.0* 69.7* 5.8 2.26 Rigorous 86.0* 73.4* 9.4 2.59 Core New Basics or below 62.1 63.9 † †
College entrance examinations Lowest quartile (400–790) 55.2* 65.3 -3.5 2.15 Highest quartile (1091–1600) 82.8* 69.3 0.5 2.15 Middle quartiles (800–1090) 71.4 68.8 † †
First generation status Parents had some college 60.6 64.5 0.4 2.38 Parents had bachelor’s degree 76.5* 71.6* 7.5 2.02 First-generation 57.7 64.1 † †
First-year GPA Lowest quartile (0– 2.11) 35.3* 41.7* -32.9 2.01 Highest quartile (3.27–4.0) 84.8* 81.8* 7.3 2.08 Middle quartiles (2.12–3.26) 75.3 74.6 † †
Remedial courses No remedial course taken 70.0* 67.9 -1.2 2.38 One or more remedial courses taken 57.9 69.1 † †
Enrollment status Full-time 73.4* 70.4* 9.9 1.95 Part-time 51.5 60.6 † †
Employment status Did not work 79.3* 71.8* 22.9 2.73 Part-time 77.6* 70.7* 21.7 2.52 Full-time 42.1 49.0 † †
Gender Male 65.3* 66.7 -2.4 1.62 Female 70.2 69.1 † †
Marital status Married 37.5* 52.5* -16.1 4.38 Not married 69.2 68.6 † †
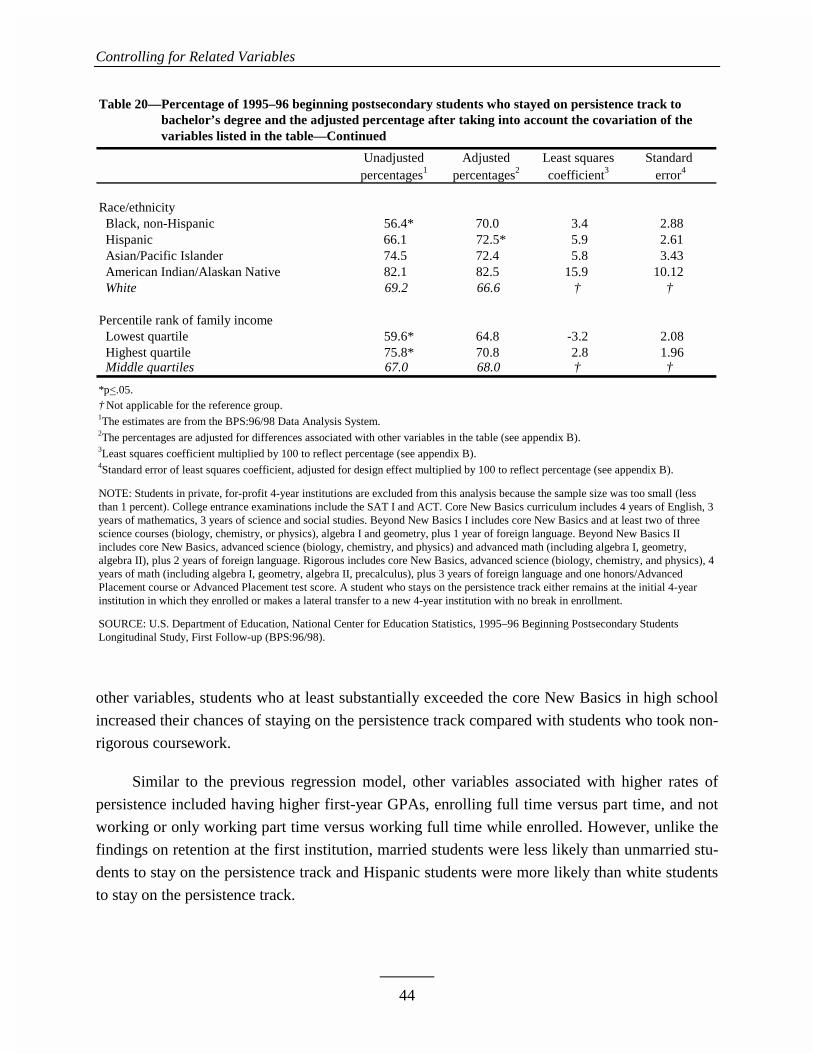
Controlling for Related Variables
44
Table 20—Percentage of 1995–96 beginning postsecondary students who stayed on persistence track toTable 20—bachelor’s degree and the adjusted percentage after taking into account the covariation of theTable 20—variables listed in the table—Continued
Unadjusted Adjusted Least squares Standard percentages1 percentages2 coefficient3 error4
Race/ethnicity Black, non-Hispanic 56.4* 70.0 3.4 2.88 Hispanic 66.1 72.5* 5.9 2.61 Asian/Pacific Islander 74.5 72.4 5.8 3.43 American Indian/Alaskan Native 82.1 82.5 15.9 10.12 White 69.2 66.6 † †
Percentile rank of family income Lowest quartile 59.6* 64.8 -3.2 2.08 Highest quartile 75.8* 70.8 2.8 1.96 Middle quartiles 67.0 68.0 † †
*p<.05.† Not applicable for the reference group.1The estimates are from the BPS:96/98 Data Analysis System.2The percentages are adjusted for differences associated with other variables in the table (see appendix B).3Least squares coefficient multiplied by 100 to reflect percentage (see appendix B).4Standard error of least squares coefficient, adjusted for design effect multiplied by 100 to reflect percentage (see appendix B).
NOTE: Students in private, for-profit 4-year institutions are excluded from this analysis because the sample size was too small (lessthan 1 percent). College entrance examinations include the SAT I and ACT. Core New Basics curriculum includes 4 years of English, 3years of mathematics, 3 years of science and social studies. Beyond New Basics I includes core New Basics and at least two of threescience courses (biology, chemistry, or physics), algebra I and geometry, plus 1 year of foreign language. Beyond New Basics IIincludes core New Basics, advanced science (biology, chemistry, and physics) and advanced math (including algebra I, geometry,algebra II), plus 2 years of foreign language. Rigorous includes core New Basics, advanced science (biology, chemistry, and physics), 4years of math (including algebra I, geometry, algebra II, precalculus), plus 3 years of foreign language and one honors/AdvancedPlacement course or Advanced Placement test score. A student who stays on the persistence track either remains at the initial 4-yearinstitution in which they enrolled or makes a lateral transfer to a new 4-year institution with no break in enrollment.
SOURCE: U.S. Department of Education, National Center for Education Statistics, 1995–96 Beginning Postsecondary StudentsLongitudinal Study, First Follow-up (BPS:96/98).
other variables, students who at least substantially exceeded the core New Basics in high school
increased their chances of staying on the persistence track compared with students who took non-
rigorous coursework.
Similar to the previous regression model, other variables associated with higher rates of
persistence included having higher first-year GPAs, enrolling full time versus part time, and not
working or only working part time versus working full time while enrolled. However, unlike the
findings on retention at the first institution, married students were less likely than unmarried stu-
dents to stay on the persistence track and Hispanic students were more likely than white students
to stay on the persistence track.
45
Conclusions
First-generation students—students who represent at least one-quarter of high school
graduates—are less likely than their counterparts whose parents have more education to be pre-
pared academically for postsecondary education. Consequently, first-generation students are less
likely to enroll in 4-year institutions and, if they do, are less likely to persist in college. To under-
stand the roots of these outcomes, this study examined how academic preparation in high school
affects the differences in outcomes of first-generation students and non-first-generation students.
First and foremost, students who took rigorous coursework in high school were very likely
to persist in 4-year postsecondary institutions. In addition, rigorous academic preparation in high
school seemed to play a substantial role in narrowing the gap in postsecondary outcomes between
first-generation students and their peers whose parents graduated college. At the same time, re-
sults from the multivariate analysis showed that parents’ levels of education were associated with
rates of students’ retention and persistence in college, even when controlling for measures of
academic preparedness. First-generation students were less likely than their peers whose parents
had a bachelor’s degree to be enrolled at their initial institution 3 years later and to stay on the
persistence track to a bachelor’s degree.
Nevertheless, regardless of postsecondary achievement, parents’ education, and other back-
ground characteristic variables, students’ level of academic preparedness remains an important
predictor of retention and persistence in college. Students who took rigorous coursework in high
school significantly increased their chances of either being enrolled at their initial institution 3
years later or making a lateral transfer to a comparable institution and of attaining a college de-
gree. Overall, these results indicate that providing first-generation students the opportunity to
take rigorous coursework in high school will increase their chances of succeeding in college.

THIS PAGE INTENTIONALLY LEFT BLANK
47
References
Adelman, C. (1999). Answers in the Toolbox: Academic Intensity, Attendance Patterns, andBachelor’s Degree Attainment. U.S. Department of Education. Washington, DC: Officeof Educational Research and Improvement.
Berkner, L.K., McCormick, A.C., and Cuccaro-Alamin, S. (1996). Descriptive Summary of1989–90 Beginning Postsecondary Students: 5 Years Later, With an Essay on Postsecon-dary Persistence and Attainment (NCES 96–155). U.S. Department of Education, Na-tional Center for Education Statistics. Washington, DC: U.S. Government PrintingOffice.
Burkam, D., Lee, V., and Smerdon, B. (1996). Mathematics Coursetaking and the NELS:88Transcript Data. Ann Arbor, MI: University of Michigan.
Choy, S.P. (2000). Low-Income Students: Who They Are and How They Pay for Their Education(NCES 2000–169). U.S. Department of Education, National Center for Education Statis-tics. Washington, DC: U.S. Government Printing Office.
Horn, L., and Nuñez, A.-M. (2000). Mapping the Road to College: First-Generation Students’Math Track, Planning Strategies, and Context of Support (NCES 2000–153). U.S. De-partment of Education, National Center for Education Statistics. Washington, DC: U.S.Government Printing Office.
Levine, A., and Nidiffer, J. (1996). Beating the Odds: How the Poor Get to College. San Fran-cisco: Jossey-Bass.
National Commission on Excellence in Education. (1983). A Nation at Risk: The Imperative forEducational Reform. Washington, DC: Author.
Nuñez, A.-M., and Cuccaro-Alamin, S. (1998). First-Generation Students: UndergraduatesWhose Parents Never Enrolled in Postsecondary Education (NCES 98–082). U.S. De-partment of Education, National Center for Education Statistics. Washington, DC: U.S.Government Printing Office.
Riley, R.W. (1997). Mathematics Equals Opportunity. White paper prepared by the U.S. Secre-tary of Education. Washington, DC: U.S. Department of Education.
References
48
Terenzini, P.T., Springer, L., Yaeger, P.M., Pascarella, E.T., and Nora, A. (1996). First-Generation Students: Characteristics, Experiences, and Cognitive Development. Researchin Higher Education, 37(1): 1–22.
U.S. Department of Education, National Center for Education Statistics. (2000). The Condition ofEducation 2000 (NCES 2000–062). Washington, DC: U.S. Government Printing Office.
U.S. General Accounting Office. (1994). Higher Education: Grants Effective at Increasing Mi-norities’ Chances of Graduating (HEHS-94-168). Washington, DC: U.S. GovernmentPrinting Office.
U.S. General Accounting Office. (1995). Higher Education: Restructuring Student Aid CouldReduce Low-Income Student Dropout Rate (HEHS-95-48). Washington, DC: U.S. Gov-ernment Printing Office.
49
Appendix A—Glossary
This glossary describes the variables used in this report. The variables were taken directly from the NCESBPS:96/98 Data Analysis Systems (DAS), which are NCES software applications that generate tables from the BPS:98. A description of the DAS software can be found in appendix B. The variable labels below are in bold capitalletters and correspond to the names of the variables in the DAS. In the index below, the variables in the five sectionsare listed in the order they appear in the report; the glossary is in alphabetical order in each section by variable name(displayed in the right-hand column).
GLOSSARY INDEX
STUDENT CHARACTERISTICS
Country of origin.............................................. ORIGINParents’ highest education (first- generation status) .........................................PBEDHI3Age...............................................................SBAGEFMGender ...................................................... SBGENDERLanguage spoken at home… .......................... SBLANGMarital status ............................................SBMARRY1Race/ethnicity ................................................SBRACEIFamily income as percentile rank of income.........................................................SFPCT294
HIGH SCHOOL CHARACTERISTICS
Coursetaking ................................................ CTAKINGHighest level of mathematics completed or planned..............................HCMATHHILocale of high school.................................HSLOCALEPercentage enrollment of underrep- resented minority at secondary level ...........HSPCMINType of high school ................................... HSTYPESR
ENROLLMENT AND EMPLOYMENT CHARACTERISTICS
Enrollment status .........................................ENIPTTB1Number of enrollment spells 1995–98.......ENSENUB1
Institution type by Carnegie Classifi- cation 1994 .............................................. INCARNEGFirst institution level and control ................... ITNPSASEmployment status......................................JEHOURB1Attainment and level of enrollment through 1998.............................................PRENRLB1
ACADEMIC CHARACTERISTICS
Average score on Advanced Place- ment exams taken............................................APAVGNumber of Advanced Placement exams taken ........................................... APNUMBERRemedial courses taken 1995–96 ...............RMANYY1Average SAT II score .................................. SAT2AVGGrade- point average (GPA) ......................... SEGPAY1Major field of study .................................... SEMAJ2B1Derived SAT combined score.................... TESATDER
PERSISTENCE AND ATTAINMENT CHARACTERISTICS
Attainment and last year of enrollment through 1998............................................ PRENYRB1First persistence track exit type...................PRFLTYB1Persistence and attainment, first institution through 1998.................................. PRSIB1
Appendix A—Glossary
50
Average score on Advanced Placement exams taken APAVG
Indicates the average score on all Advanced Placement examinations taken. Score range is 1–5 points, multiplied by100 to show finer gradations of average scores (range is 100–500). When average scores are reported, this variable isdivided by 100.
Number of Advanced Placement exams taken APNUMBER
Indicates the number of Advanced Placement tests respondent took in high school.
OneTwoThreeFourFive or more
Coursetaking CTAKING
Ranks the rigor of courses taken by the respondent in high school. The categories include the following:
Core New Basics Student completed core New Basics curriculum: 4 years ofEnglish and 3 years each of science, mathematics, and socialstudies.
Beyond New Basics I Student completed core New Basics curriculum that includedat least two of the following three science courses—biology,chemistry, or physics—and algebra I and geometry, plus 1year of foreign language.
Beyond New Basics II Student completed core New Basics curriculum that includedadvanced science (biology, chemistry, and physics) and ad-vanced mathematics (algebra I, geometry, and algebra II), plus2 years of foreign language.
Rigorous Student completed core New Basics curriculum that includedadvanced science (biology, chemistry, and physics), 4 years ofmathematics (algebra I, geometry, algebra II, pre-calculus),plus 3 years of foreign language and one honors/AdvancedPlacement course or Advanced Placement test score.
Enrollment status ENIPTTB1
Indicates the pattern of enrollment intensity during months enrolled, through June 1998.
Full time Always enrolled full time
Less than full time Always enrolled part time or had mixed enrollment pattern
Appendix A—Glossary
51
Number of enrollment spells 1995–98 ENSENUB1
Counts the periods of continuous enrollment (at any institution), each separated by more than 4 months of nonen-rollment, through June 1998.
OneTwo or more
Highest level of mathematics completed or planned HCMATHHI
Identifies the highest level of mathematics the respondent had completed in high school or planned to take, accordingto self report on standardized test questionnaire completed during high school. The categories are the following:
AlgebraGeometryAlgebra IITrigonometryPre-calculusCalculus
Locale of high school HSLOCALE
Identifies the location of the high school attended by the respondent.
Large central city In an area with a population greater than 250,000
Mid-size central city In an area with a population of less than 250,000
Urban On the fringe of a large city or mid-size city
Large town In an area with a population greater than 25,000
Small town In an area with a population less than 25,000
Rural In a rural area
Percentage enrollment of underrepresented minority at secondary level HSPCMIN
Indicates the percentage enrollment of black, Hispanic, or American Indian/Alaskan Native students at respondent’shigh school. Responses were grouped as follows:
0–25 percent26–50 percent51–75 percent76–100 percent
Appendix A—Glossary
52
Type of high school HSTYPESR
Indicates the type of high school the respondent attended.
Public Respondent attended a public high school.
Private Respondent attended Catholic, other religious, and/or nonre-ligious private school.
Institution type by Carnegie Classification 1994 INCARNEG
Identifies the type of institution the respondent attended by Carnegie Classification. This classification system in-cludes all colleges and universities in the United States that are degree granting and accredited by an agency recog-nized by the U.S. Secretary of Education.
Research/Doctoral Universities Includes all institutions classified as Research Universities I/IIand Doctoral Universities I/II. Research Universities I/II offera full range of baccalaureate programs, are committed tograduate education through the doctorate, and give high prior-ity to research. Institutions classified as Doctoral UniversitiesI/II also offer a full range of baccalaureate programs and arecommitted to graduate education through the doctorate.
Comprehensive Universities Includes all institutions classified as Master’s (Comprehen-sive) Colleges and Universities I/II. These institutions offer afull range of baccalaureate programs and are committed tograduate education through the master’s degree.
Baccalaureate Includes all institutions classified as Baccalaureate (LiberalArts) Colleges I/II. These institutions are primarily under-graduate colleges that place major emphasis on baccalaureatedegree programs.
Other Includes professional and specialized institutions offering de-grees in areas such as art, music, design, religion, medicine,other health professions, engineering and technology, businessand management, and law. In addition, degrees from theologi-cal seminaries, bible colleges, teachers’ colleges, tribal col-leges and universities, military institutes, maritime academies,and any other institutions that do not fit any other classificationcategory are included in this grouping.
Appendix A—Glossary
53
First institution level and control ITNPSAS
Identifies the type of postsecondary institution first attended by respondent.
Public 4-year A postsecondary education institution that is supported pri-marily by public funds and operated by publicly elected or ap-pointed officials who control the programs and activities andcan award bachelor’s degrees or higher, including institutionsthat award doctorate degrees and first-professional degrees.These degrees include chiropractic, pharmacy, dentistry, po-diatry, medicine, veterinary medicine, optometry, law, osteo-pathic medicine, and theology.
Private, not-for-profit 4-year A postsecondary education institution that is controlled by anindependent governing board and incorporated under Section501(c)(3) of the Internal Revenue Code and can award bache-lor’s degrees, including institutions that award doctorate de-grees and first-professional degrees. These degrees includechiropractic, pharmacy, dentistry, podiatry, medicine, veteri-nary medicine, optometry, law, osteopathic medicine, and the-ology.
Public 2-year A postsecondary education institution that is supported pri-marily by public funds and operated by publicly elected or ap-pointed officials who control the programs and activities andthat does not confer bachelor’s degrees, but does provide 2-year programs that result in a certificate or an associate’s de-gree, or 2-year programs that fulfill part of the requirementsfor a bachelor’s degree at 4-year institutions.
Private, for-profit A postsecondary education institution that is privately ownedand operated as a profit-making enterprise. Includes careercolleges and proprietary institutions. Level and control can beprivate, for-profit 4-year; private, for-profit 2-year; or private,for-profit less-than-2-year.
Other less-than-2-year A postsecondary education institution in which at least one ofthe programs offered at the institution is 3 months or longerand that produces a terminal award or certificate. In addition,no program at the institution lasts longer than 2 years. Thelevel and control can be private, not-for-profit 2-year; publicless-than-2-year; and private, not-for-profit less-than-2-year in-stitutions.
Employment status JEHOURB1
Indicates the number of hours worked while enrolled 1998.
Part-time Worked less than 35 hours
Full-time Worked 35 or more hours
Did not work Worked 0 hours
Appendix A—Glossary
54
Country of origin ORIGIN
Indicates the respondent’s country of birth based on citizenship status.
Native born Respondent was born in the United States.
Foreign born Respondent was not born in the United States; respondent is anaturalized citizen, permanent resident, or nonresident alien.
Parents’ highest education (first-generation status) PBEDHI3
Indicates the highest education level attained by either parent of the respondent. In 8 percent of the cases, the datawas recoded where students’ reporting of parental occupation and educational level were obviously dissonant; forexample, where the parental occupation indicated required at least a college education.
First-generation Parent had less than a high school education or a high schooldiploma.
Non-first-generation Parent had either some college or earned a bachelor’s degreeor postgraduate/professional degree (see below).
Some college Parent went to trade school, had less than two years of college,or had two or more years of college.
Bachelor’s or advanced degree Parent earned a bachelor’s degree or postgraduate/professionaldegree.
Attainment and level of enrollment through 1998 PRENRLB1
Identifies whether students had attained a degree by June 1998 and whether they were enrolled during spring 1998by level of institution. Responses were categorized as follows:
No degree Not enrolled Enrolled
Degree Attained associate’s degree or certificate, not enrolled Attained associate’s degree or certificate, enrolled in 2- or 4-year institution Attained bachelor’s degree, not enrolled Attained bachelor’s degree, enrolled in 2- or 4-year institution
Appendix A—Glossary
55
Attainment and last year of enrollment through 1998 PRENYRB1
Identifies whether students had attained a degree by June 1998, and if not, indicates the last academic year that theywere enrolled in postsecondary education.
No degree, left without return AY95–96No degree, left without return AY96–97No degree, left without return AY97–98No degree, enrolled spring 1998Attained by spring 1998
First persistence track exit type PRFLTYB1
Identifies the type of first departure from the persistence track. Responses were categorized as follows:
Did not leave track Respondents stayed in the same 4-year institution or made alateral transfer to a different 4-year institution.
Left track, transfer, stopout Respondents left persistence track by making an immediate ordelayed transfer from a 4-year institution to a less than 4-yearinstitution, stopout, or delayed lateral/upward transfer.
Left without return Respondents left without return to postsecondary education.
Persistence and attainment, first institution through 1998 PRSIB1
Identifies the outcome of the first institutional spell. The first institutional spell is the first spell of continuous en-rollment at the first institution. For those who attained a degree before the spell ended, the variable identifies thedegree attained. For those who did not attain before the spell ended, the variable distinguishes whether the studentwas still enrolled at the first institution in spring 1998, experienced a stopout and returned to the NPSAS institution,experienced a stopout and enrolled at a new institution, experienced an immediate transfer to a new institution, or leftpostsecondary education without returning at the end of the spell. Responses were grouped as follows:
Still enrolled/attained at first institution includes respondents who were identified as: Continuous enrollment, no transfer, attained bachelor’s degree Continuous enrollment, no transfer, attained associate’s degree Continuous enrollment, no transfer, attained certificate No degree, continuous enrollment, enrolled at institution No degree, stopout, returned to first institution
Transferred includes respondents who had: No degree, stopout or enrollment gap, enrolled at new institution No degree, no stopout, enrolled at new institution
Left postsecondary education includes respondents who had: No degree, left without return
Appendix A—Glossary
56
Remedial courses taken 1995–96 RMANYY1
Indicates the number of remedial courses taken by respondents in 1995–96. These include courses in reading, writ-ing, mathematics, study skills, or English language skills. The categories were defined as follows:
NoneOne or more
Average SAT II score SAT2AVG
Indicates the average score on all SAT II tests taken (range is 200–800). Scores were combined as follows:
Less than 450451–550551–650651 or higher
Age SBAGEFM
Indicates the respondent’s age when first enrolled at 1995–96 postsecondary institution. Age was defined in the fol-lowing categories:
18 years or younger19–24 years25–29 years30 years or older
Gender SBGENDER
Indicates respondent’s gender.
MaleFemale
Language spoken at home SBLANG
Identifies the language spoken most often at home when respondent was growing up.
English Respondent spoke mostly English growing up.
Other Respondent spoke mostly a language other than English, suchas Spanish, Arabic, Bahasa, Chinese (Mandarin), Farsi, Frenchand Canadian French, Gaelic, German, Hebrew, Hindi, Japa-nese, Korean, Malaysian (Bahasa Malay), Pakistani (Punjabi),Tagalog, Thai, Vietnamese, Welsh, or other
Appendix A—Glossary
57
Marital status SBMARRY1
Indicates respondent’s marital status during the 1995–96 academic year.
Not married Respondent was single, never married; divorced; or widowed
Married Respondent was married.
Separated Respondent was separated.
Race/ethnicity SBRACEI
Indicates the race/ethnicity and citizenship status of respondent.
White, non-Hispanic Respondent had origins in any of the original peoples ofEurope, North Africa, or the Middle East (except those of His-panic origin).
Black, non-Hispanic Respondent had origins in any of the black racial groups of Af-rica, not of Hispanic origin.
Hispanic Respondent was Mexican, Puerto Rican, Cuban, Central orSouth American, or other Spanish culture or origin, regardlessof race.
Asian/Pacific Islander Respondent had origins in any of the original peoples of theFar East, Southeast Asia, the Indian subcontinent, or PacificIslands. This includes people from China, Japan, Korea, thePhilippine Islands, Samoa, India, and Vietnam.
American Indian/Alaskan Native Respondent had origins in any of the original peoples of NorthAmerica and who maintains cultural identification throughtribal affiliation or community recognition.
Grade- point average (GPA) SEGPAY1
Indicates the average student GPA (standardized to a 4.00 point scale) as reported by the institution.
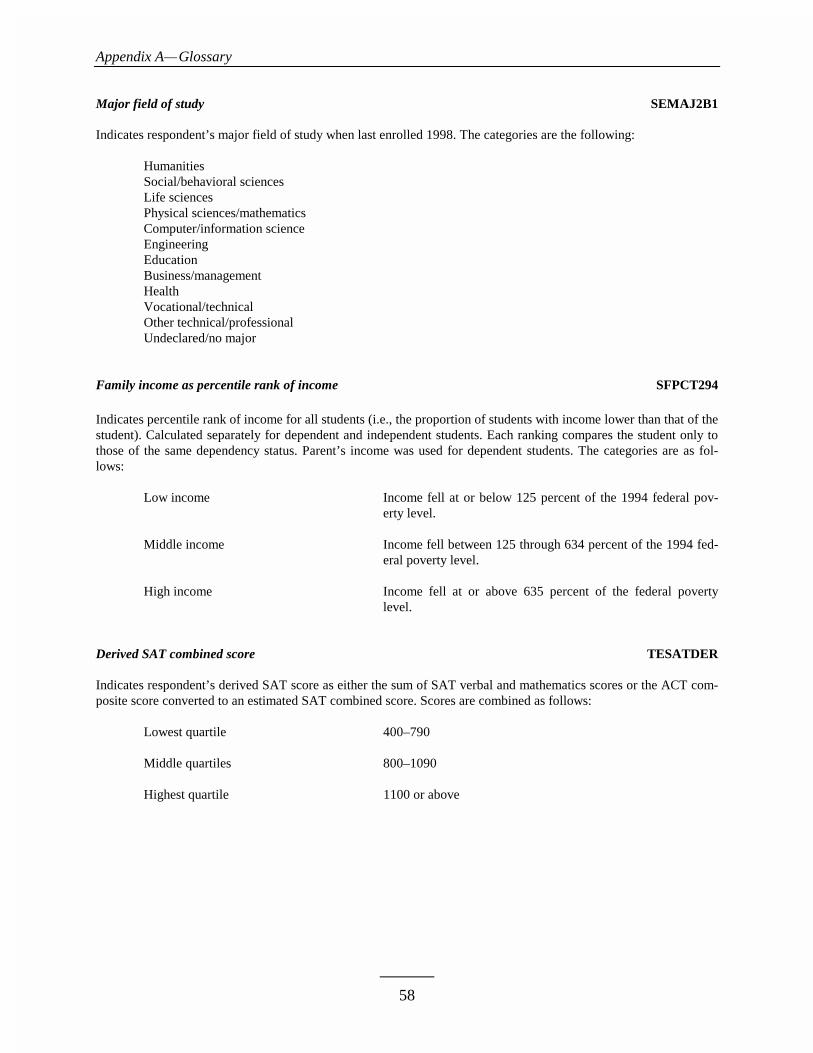
Appendix A—Glossary
58
Major field of study SEMAJ2B1
Indicates respondent’s major field of study when last enrolled 1998. The categories are the following:
HumanitiesSocial/behavioral sciencesLife sciencesPhysical sciences/mathematicsComputer/information scienceEngineeringEducationBusiness/managementHealthVocational/technicalOther technical/professionalUndeclared/no major
Family income as percentile rank of income SFPCT294
Indicates percentile rank of income for all students (i.e., the proportion of students with income lower than that of thestudent). Calculated separately for dependent and independent students. Each ranking compares the student only tothose of the same dependency status. Parent’s income was used for dependent students. The categories are as fol-lows:
Low income Income fell at or below 125 percent of the 1994 federal pov-erty level.
Middle income Income fell between 125 through 634 percent of the 1994 fed-eral poverty level.
High income Income fell at or above 635 percent of the federal povertylevel.
Derived SAT combined score TESATDER
Indicates respondent’s derived SAT score as either the sum of SAT verbal and mathematics scores or the ACT com-posite score converted to an estimated SAT combined score. Scores are combined as follows:
Lowest quartile 400–790
Middle quartiles 800–1090
Highest quartile 1100 or above
59
Appendix B—Technical Notes and Methodology
The Beginning Postsecondary Student Longitudinal Study (BPS:96/98)
The Beginning Postsecondary Student Longitudinal Study (BPS) is composed of the stu-
dents who participated in the 1995–96 National Postsecondary Student Aid Study (NPSAS:96)
who enrolled in postsecondary education for the first time in 1995–96. The National Postsecon-
dary Student Aid Study (NPSAS) is a comprehensive nationwide study conducted by the U.S.
Department of Education’s National Center for Education Statistics (NCES) to determine how
students and their families pay for postsecondary education.10 It also describes demographic and
other characteristics of students enrolled. The study is based on a nationally representative sam-
ple of all students in postsecondary education institutions, including undergraduate, graduate, and
first-professional students. For NPSAS:96, information was obtained from more than 830 post-
secondary institutions on approximately 44,500 undergraduate, 8,700 graduate, and 2,500 first-
professional students. They represented about 16.7 million undergraduates, 2.4 million graduate
students, and 300,000 first-professional students who were enrolled at some time between July 1,
1995 and June 30, 1996.
The BPS sample consists of approximately 12,000 students identified in NPSAS:96 as be-
ginning postsecondary education for the first time. Unlike other NCES longitudinal surveys (such
as High School and Beyond), which are based on age-specific cohorts, the BPS sample is more
likely to include “nontraditional” postsecondary students, such as those who have delayed their
education due to financial need or family responsibilities. The First Follow-up of the BPS cohort
(BPS:96/98) was conducted in the spring and summer of 1998, approximately 3 years after they
first enrolled. Approximately 10,300 of the students who first began in 1995–96 were located and
interviewed in the First Follow-up. The weighted effective response rate in the 1998 follow-up of
the NPSAS:96, for BPS-eligible respondents was 85.9 percent. The overall weighted response
10For more information on the NPSAS survey, consult U.S. Department of Education, National Center for Education Statistics,Methodology Report for the 1995–96 National Postsecondary Student Aid Study (NCES 98–073) (Washington, DC: 1997). Ad-ditional information is also available at the NPSAS website: http://nces.ed.gov/npsas.
Appendix B—Technical Notes and Methodology
60
rate (including those who were nonrespondents in NPSAS:96) for the BPS:96/98 First Follow-up
was 79.8 percent.11
The BPS:96/98 Data Analysis System includes sample weights for cross-sectional analysis
of the students in 1995–96 (B98IAWT) and longitudinal analysis of the sample through 1998
(B98AWT). All of the tables and estimates in this report used the longitudinal analysis weight.
Accuracy of Estimates
The statistics in this report are estimates derived from a sample. Two broad categories of
error occur in such estimates: sampling and nonsampling errors. Sampling errors occur because
observations are made only on samples of students, not entire populations. Nonsampling errors
occur not only in sample surveys but also in censuses of entire populations. Non-sampling errors
can be attributed to a number of sources: inability to obtain complete information about all stu-
dents in all institutions in the sample (some students or institutions refused to participate, or stu-
dents participated but answered only certain items); ambiguous definitions; differences in
interpreting questions; inability or unwillingness to give correct information; mistakes in record-
ing or coding data; and other errors of collecting, processing, sampling, and imputing missing
data.
Data Analysis System
The estimates presented in this report were produced using the BPS:98 Data Analysis Sys-
tems (DAS). The DAS software allows users to specify and generate tables from the BPS:98
data. With the DAS, users can replicate or expand upon the tables presented in this report. In ad-
dition to the table estimates, the DAS calculates proper standard errors12 and weighted sample
sizes for these estimates. For example, table B1 contains estimated standard errors for the esti-
mates provided in table 15 and was generated by the DAS. If the number of valid cases is too
small to produce a reliable estimate, the DAS prints the message “low-N” instead of the estimate.
11For more information on the BPS:96/98 survey, consult U.S. Department of Education, National Center for Education Statis-tics, Beginning Postsecondary Students Longitudinal Study First Follow-up 1996–98, Methodology Report (NCES 2000–157)(Washington, DC: 2000).12The BPS:98 samples are not simple random samples, and therefore simple random sample techniques for estimating samplingerror cannot be applied to these data. The DAS takes into account the complexity of the sampling procedures and calculates stan-dard errors appropriate for such samples. The method for computing sampling errors used by the DAS involves approximatingthe estimator by the linear terms of a Taylor series expansion. The procedure is typically referred to as the Taylor series method.
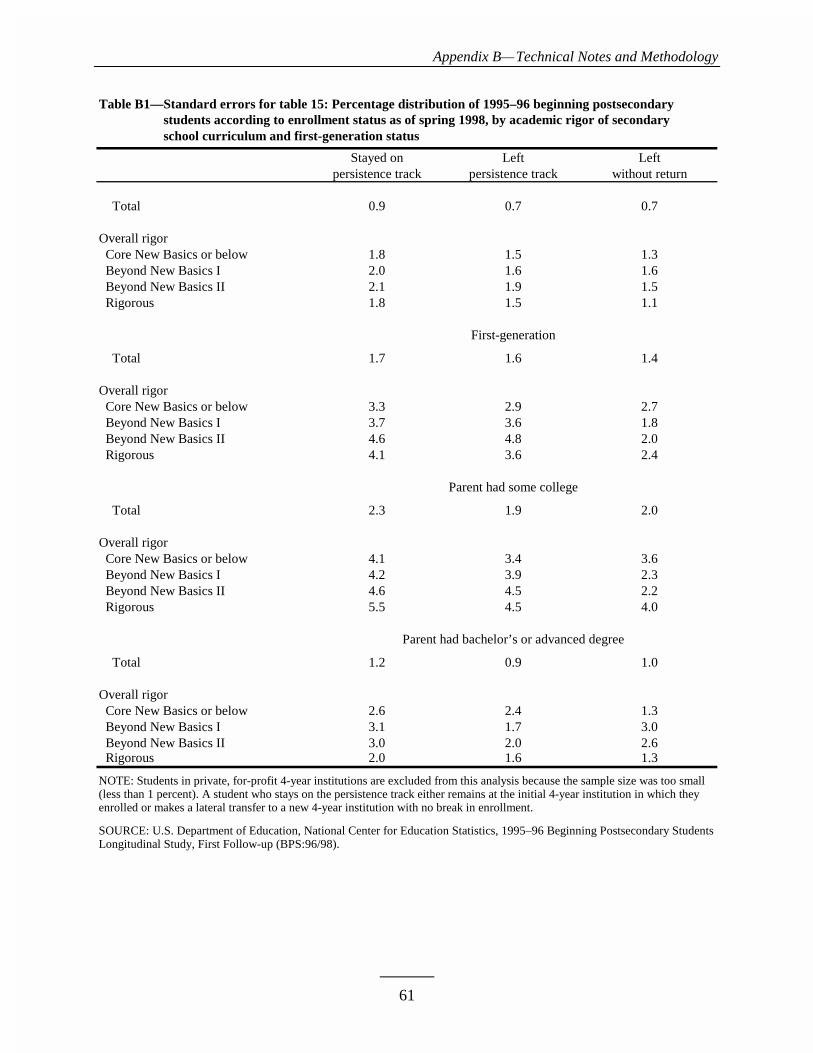
Appendix B—Technical Notes and Methodology
61
Table B1—Standard errors for table 15: Percentage distribution of 1995–96 beginning postsecondaryTable B1—students according to enrollment status as of spring 1998, by academic rigor of secondaryTable B1—school curriculum and first-generation status
Stayed on Left Leftpersistence track persistence track without return
Total 0.9 0.7 0.7 Overall rigor Core New Basics or below 1.8 1.5 1.3 Beyond New Basics I 2.0 1.6 1.6 Beyond New Basics II 2.1 1.9 1.5 Rigorous 1.8 1.5 1.1
First-generation
Total 1.7 1.6 1.4
Overall rigor Core New Basics or below 3.3 2.9 2.7 Beyond New Basics I 3.7 3.6 1.8 Beyond New Basics II 4.6 4.8 2.0 Rigorous 4.1 3.6 2.4
Parent had some college
Total 2.3 1.9 2.0 Overall rigor Core New Basics or below 4.1 3.4 3.6 Beyond New Basics I 4.2 3.9 2.3 Beyond New Basics II 4.6 4.5 2.2 Rigorous 5.5 4.5 4.0
Parent had bachelor’s or advanced degree
Total 1.2 0.9 1.0 Overall rigor Core New Basics or below 2.6 2.4 1.3 Beyond New Basics I 3.1 1.7 3.0 Beyond New Basics II 3.0 2.0 2.6 Rigorous 2.0 1.6 1.3
NOTE: Students in private, for-profit 4-year institutions are excluded from this analysis because the sample size was too small(less than 1 percent). A student who stays on the persistence track either remains at the initial 4-year institution in which theyenrolled or makes a lateral transfer to a new 4-year institution with no break in enrollment.
SOURCE: U.S. Department of Education, National Center for Education Statistics, 1995–96 Beginning Postsecondary StudentsLongitudinal Study, First Follow-up (BPS:96/98).
Appendix B—Technical Notes and Methodology
62
In addition to tables, the DAS can also produce a correlation matrix of selected variables to
be used for linear regression models. Included in the output with the correlation matrix are the
design effects (DEFTs) for each variable in the matrix. Since statistical procedures generally
compute regression coefficients based on simple random sample assumptions, the standard errors
must be adjusted with the design effects to take into account the BPS:98 sample design.
The DAS can be accessed electronically at http://nces.ed.gov/DAS. For more information
about BPS:98 Data Analysis System, contact:
Aurora D’AmicoNational Center for Education Statistics1990 K Street, NWRoom 8115Washington, DC 20006(202) 502-7334Internet address: Aurora_D’[email protected]
Statistical Procedures
Differences Between Means
The descriptive comparisons were tested in this report using Student’s t statistic. Differ-
ences between estimates are tested against the probability of a Type I error,13 or significance
level. The significance levels were determined by calculating the Student’s t values for the differ-
ences between each pair of means or proportions and comparing these with published tables of
significance levels for two-tailed hypothesis testing.
Student’s t values may be computed to test the difference between estimates with the fol-
lowing formula:
22
21
21
sese
EEt
+
−= (1)
where E1 and E2 are the estimates to be compared and se1 and se2 are their corresponding stan-
dard errors. This formula is valid only for independent estimates. When estimates are not inde-
pendent, a covariance term must be added to the formula:
13A Type I error occurs when one concludes that a difference observed in a sample reflects a true difference in the populationfrom which the sample was drawn, when no such difference is present.
Appendix B—Technical Notes and Methodology
63
2122
21
21
)(2 sesersese
EE
−+
−(2)
where r is the correlation between the two estimates.14 This formula is used when comparing two
percentages from a distribution that adds to 100. If the comparison is between the mean of a sub-
group and the mean of the total group, the following formula is used:
E E
se se p sesub tot
sub tot sub
−+ −2 2 22
(3)
where p is the proportion of the total group contained in the subgroup.15 The estimates, standard
errors, and correlations can all be obtained from the DAS.
There are hazards in reporting statistical tests for each comparison. First, comparisons
based on large t statistics may appear to merit special attention. This can be misleading since the
magnitude of the t statistic is related not only to the observed differences in means or percentages
but also to the number of students in the specific categories used for comparison. Hence, a small
difference compared across a large number of students would produce a large t statistic.
A second hazard in reporting statistical tests for each comparison occurs when making
multiple comparisons among categories of an independent variable. For example, when making
paired comparisons among different levels of income, the probability of a Type I error for these
comparisons taken as a group is larger than the probability for a single comparison. When more
than one difference between groups of related characteristics or “families” are tested for statisti-
cal significance, one must apply a standard that assures a level of significance for all of those
comparisons taken together.
Comparisons were made in this report only when p< .05/k for a particular pairwise com-
parison, where that comparison was one of k tests within a family. This guarantees both that the
individual comparison would have p< .05 and that for k comparisons within a family of possible
comparisons, the significance level for all the comparisons will sum to p< .05.16 For example,
when comparing the percentages of males and females who enrolled in postsecondary education,
only one comparison is possible (males versus females). In this family, k=1, and the comparison
14U.S. Department of Education, National Center for Education Statistics, A Note from the Chief Statistician, no. 2, 1993.15Ibid.16The standard that p≤ .05/k for each comparison is more stringent than the criterion that the significance level of the compari-sons should sum to p≤ .05. For tables showing the t statistic required to ensure that p≤ .05/k for a particular family size and de-grees of freedom, see Olive Jean Dunn, “Multiple Comparisons Among Means,” Journal of the American Statistical Association56 (1961): 52–64.
Appendix B—Technical Notes and Methodology
64
can be evaluated without adjusting the significance level. When students are divided into five
racial/ethnic groups and all possible comparisons are made, then k=10 and the significance level
of each test must be p< .05/10, or p< .005. The formula for calculating family size (k) is as fol-
lows:
kj j= −( )1
2(4)
where j is the number of categories for the variable being tested. In the case of race/ethnicity,
there are five racial/ethnic groups (American Indian/Alaskan Native; Asian/Pacific Islander;
black, non-Hispanic; Hispanic; and white, non-Hispanic), so substituting 5 for j in equation 4,
k =5(5 -1)
2=10
Linear Trends
While most descriptive comparisons in this report were tested using Student’s t statistic,
some comparisons among categories of an ordered variable with three or more levels involved a
test for a linear trend across all categories, rather than a series of tests between pairs of catego-
ries. In this report, when differences among percentages were examined relative to a variable
with ordered categories, Analysis of Variance (ANOVA) was used to test for a linear relationship
between the two variables. To do this, ANOVA models included orthogonal linear contrasts cor-
responding to successive levels of the independent variable. The squares of the Taylorized stan-
dard errors (that is, standard errors that were calculated by the Taylor series method), the
variance between the means, and the unweighted sample sizes were used to partition total sum of
squares into within- and between-group sums of squares. These were used to create mean squares
for the within- and between-group variance components and their corresponding F statistics,
which were then compared with published values of F for a significance level of .05.17 Signifi-
cant values of both the overall F and the F associated with the linear contrast term were required
as evidence of a linear relationship between the two variables. Means and Taylorized standard
errors were calculated by the DAS. Unweighted sample sizes are not available from the DAS and
were provided by NCES.
17More information about ANOVA and significance testing using the F statistic can be found in any standard textbook on statis-tical methods in the social and behavioral sciences.
Appendix B—Technical Notes and Methodology
65
Adjustment of Means to Control for Background Variation
Crosstabular analyses identify important relationships; however, many variables used in
crosstabular analyses may be correlated. For example, family income is related to socioeconomic
status, which in turn is related to parental education levels. Hence, finding differences among
family income groups, differences among socioeconomic status quartile groups, and differences
among groups based on parental education levels are not unique findings. To identify the under-
lying effects for all three correlated variables, multivariate analyses describe the extent of differ-
ences in family income groups after adjustments for the relationships with socioeconomic status
and parental education.
Multiple linear regression was used to obtain means that were adjusted for covariation
among a list of control variables.18 Adjusted means for subgroups were obtained by regressing
the dependent variable on a set of descriptive variables such as gender, age, employment status,
overall rigor of high school coursework, first-generation status, number of remedial courses taken
in postsecondary education, and so on. Substituting ones or zeros for the subgroup characteris-
tic(s) of interest and the mean proportions for the other variables results in an estimate of the ad-
justed proportion for the specified subgroup, holding the other variables in the equation constant.
For example, consider a hypothetical case in which two variables, age and gender, are used to
describe an outcome, Y (such as the percentage of students who left their initial institution). The
variables age and gender are recoded into a dummy variable representing age, A, and a dummy
variable representing gender, G:
Age A 24 years or older 1 Less than 24 years old 0
andGender G Female 1 Male 0
The following regression equation is then estimated from the correlation matrix output from the
DAS:
ˆ Y = a + b1A + b2G (5)
18For more information about weighted least squares regression, see Michael S. Lewis-Beck, Applied Regression: An Introduc-tion, Vol. 22 (Beverly Hills, CA: Sage Publications, Inc., 1980); William D. Berry and Stanley Feldman, Multiple Regression inPractice, Vol. 50 (Beverly Hills, CA: Sage Publications, Inc., 1987).
Appendix B—Technical Notes and Methodology
66
To estimate the adjusted mean for any subgroup evaluated at the mean of all other vari-
ables, one substitutes the appropriate values for that subgroup’s dummy variables (1 or 0) and the
mean for the dummy variable(s) representing all other subgroups. For example, suppose Y repre-
sents leaving the initial institution and is being described by age (A) and gender (G), coded as
shown above. The unadjusted mean values of these two variables are as follows:
Variable MeanA 0.355G 0.521
Next, suppose the regression equation results are as follows:
ˆ Y = 0.15 + 0.17A + 0.01G (6)
To estimate the adjusted value for older students, one substitutes the appropriate parameter
estimates and variable values into equation 6.
Variable Parameter Valuea 0.15 —A 0.17 1.000G 0.01 0.521
This results in the following equation:
ˆ Y = 0.15 +(0.17)(1) + (0.01)(0.521) = 0.325
In this case, the adjusted mean for older students is 0.325 and represents the expected out-
come for older students who resemble the average student across the other variables (in this ex-
ample, gender). In other words, the adjusted percentage who left the initial institution after
controlling for age and gender, is 32.5 percent (0.325 x 100 for conversion to a percentage).
It is relatively straightforward to produce a multivariate model using the DAS, since one of
the DAS output options is a correlation matrix, computed using pairwise missing values. In re-
gression analysis, there are several common approaches to the problem of missing data. The two
simplest are pairwise deletion of missing data and listwise deletion of missing data. In pairwise
deletion, each correlation is calculated using all of the cases for the two relevant variables. For
example, suppose you have a regression analysis that uses variables X1, X2, and X3. The regres-
sion is based on the correlation matrix between X1, X2, and X3. In pairwise deletion the correla-
tion between X1 and X2 is based on the nonmissing cases for X1 and X2. Cases missing on
Appendix B—Technical Notes and Methodology
67
either X1 or X2 would be excluded from the calculation of the correlation. In listwise deletion
the correlation between X1 and X2 would be based on the nonmissing values for X1, X2, and
X3. That is, all of the cases with missing data on any of the three variables would be excluded
from the analysis.19
The correlation matrix can be used by most statistical software packages as the input data
for least squares regression. That is the approach used for this report, with an additional adjust-
ment to incorporate the complex sample design into the statistical significance tests of the pa-
rameter estimates (described below). For tabular presentation, parameter estimates and standard
errors were multiplied by 100 to match the scale used for reporting unadjusted and adjusted per-
centages.
Most statistical software packages assume simple random sampling when computing stan-
dard errors of parameter estimates. Because of the complex sampling design used for the NPSAS
survey, this assumption is incorrect. A better approximation of their standard errors is to multiply
each standard error by the design effect associated with the dependent variable (DEFT),20 where
the DEFT is the ratio of the true standard error to the standard error computed under the assump-
tion of simple random sampling. It is calculated by the DAS and produced with the correlation
matrix.
19Although the DAS simplifies the process of making regression models, it also limits the range of models. Analysts who wish toestimate probit/logit models (which are the most appropriate for models with categorical dependent variables) can apply for arestricted data license from NCES. See John H. Aldrich and Forrest D. Nelson, Linear Probability, Logit and Probit Models(Quantitative Applications in Social Sciences, Vol. 45) (Beverly Hills, CA: Sage, 1984).20The adjustment procedure and its limitations are described in C.J. Skinner, D. Holt, and T.M.F. Smith, eds., Analysis of Com-plex Surveys (New York: John Wiley & Sons, 1989).