Embed Size (px)
Citation preview
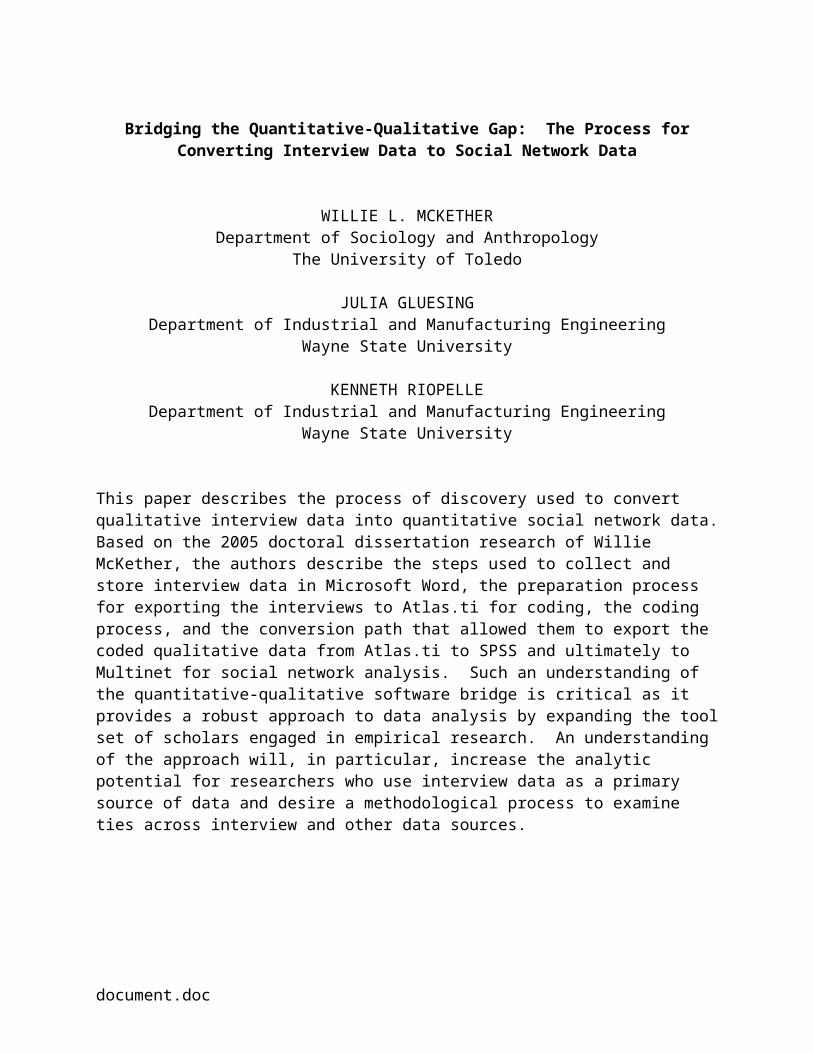
Bridging the Quantitative-Qualitative Gap: The Process for Converting Interview Data to Social Network Data
WILLIE L. MCKETHERDepartment of Sociology and Anthropology
The University of Toledo
JULIA GLUESINGDepartment of Industrial and Manufacturing Engineering
Wayne State University
KENNETH RIOPELLEDepartment of Industrial and Manufacturing Engineering
Wayne State University
This paper describes the process of discovery used to convert qualitative interview data into quantitative social network data. Based on the 2005 doctoral dissertation research of Willie McKether, the authors describe the steps used to collect and store interview data in Microsoft Word, the preparation process for exporting the interviews to Atlas.ti for coding, the coding process, and the conversion path that allowed them to export the coded qualitative data from Atlas.ti to SPSS and ultimately to Multinet for social network analysis. Such an understanding of the quantitative-qualitative software bridge is critical as it provides a robust approach to data analysis by expanding the tool set of scholars engaged in empirical research. An understanding of the approach will, in particular, increase the analytic potential for researchers who use interview data as a primary source of data and desire a methodological process to examine ties across interview and other data sources.
document.doc

Overview
This paper presents the methodological approach taken in a 2005 doctoral
dissertation1 study of African-American migration from various southern regions of the
United States to Saginaw, Michigan. The dissertation described the cultural adjustment
migrants and their families made as they arrived to the northern city in search of
employment. The study population was comprised of individuals who migrated to
Saginaw, Michigan as children with their parents before 1960 and came of age there,
and individuals that migrated to the city as adults before 1960 in search of employment
and better social, economic and political conditions than their southern, mostly rural,
home communities. The primary objective of the study was to examine and interpret
the migration experience from the perspectives of migrants themselves. This paper
focuses specifically on the processes used to convert oral history (life) interviews, or
qualitative data, for social network analysis.
To provide a context for the methodology, the paper begins with a brief
description of the oral history interview process. Following this description, the paper
proceeds with a step-by-step presentation of the data conversion and processing
procedures from data cleaning and preparation, to coding in the qualitative analysis
package Altas.ti, to exporting coded data into SPSS and then to Multinet for social
network analysis. Strengths and limitations of the methodology are also discussed. To
conclude the paper, there is a brief presentation of the network analysis results and
insights the methodology produced to provide a picture from beginning to end of the
methodological process.
1 The dissertation, Voices in Transition: African-American Migration to Saginaw, Michigan: 1920 to 1960 was completed by Dr. Willie McKether in 2005 at Wayne State University.
2
Data Collection: Oral History Interviews
Oral history programs are undertaken for various reasons, but typical reasons
are to fill the gap in a historical record or to document and preserve the history of an
individual, company, event or time period (Sommer and Quinlan 2002:3). A total of 96
people were interviewed for the migration study. Each person interviewed was asked
nearly an identical set of open-ended questions in interviews that lasted for not more
than two hours. Interviewees were also asked to provide specific names of people,
businesses, and organizations they had past relationships with and to describe the
nature of those relationships. Each person, for example, was asked to provide the
address (or cross streets) of where they lived either growing up in Saginaw, or upon
their arrival, who they lived with, the names of their closest personal friends, the schools
they attended, names of businesses they patronized, names of people they associated
with in their fights for social, economic and political justice, the church(es) they
attended, and other organizations to which they belonged in Saginaw during the time
period of the study.
Data Conversion and Processing
Converting the interviews into social network data required the following five
software programs: Microsoft Office Word, Excel 2003, Atlas.ti 5.0, SPSS Version 13,
and MULTINET Version 4.44. The data conversion and processing involved five major
steps: 1) transcribing and storing interviews, 2) data cleaning and preparation for
importing into Atlas.ti, 3) importing and coding the interview rich text files in Atlas.ti, 4)
creating the Atlas.ti SPSS data extract, and 5) creating an Excel Multinet link file. Each
of these steps is presented here in detail to provide enough information for others to
3

duplicate the process in their own studies. The methodology strengths and limitations
also are discussed.
Step 1: Transcribing and Storing Interviews
Interviews were transcribed and stored in separate Microsoft Word files. Each
interview was approximately 40 double-spaced typed pages. Each interviewee was
assigned a three digit identification number or “ID” number from 001 to 096. These ID
numbers and names were stored in an Excel Interview name file. This file was then
used as the social network Node file for Multinet.
The most complex part of the data conversion was to develop a process for
coding the interviews and creating the Link file which would indicate how the nodes
were related to one another. Multinet requires two files for social network analysis (see
sample diagram 1 below): a NODE file which is a two column file that contains the list of
all the nodes with a unique ID number and a text label or name. The LINK file has at
least three columns: ID1, ID2 and an Attribute value. ID1 and ID2 are the node IDs
indicating that ID1 has a relationship with ID2 in the format: FROM ID1 TO ID2 with
some Attribute such as Family Member, Friend, Co-worker etc. The process for
creating these files is described later in the paper.
4
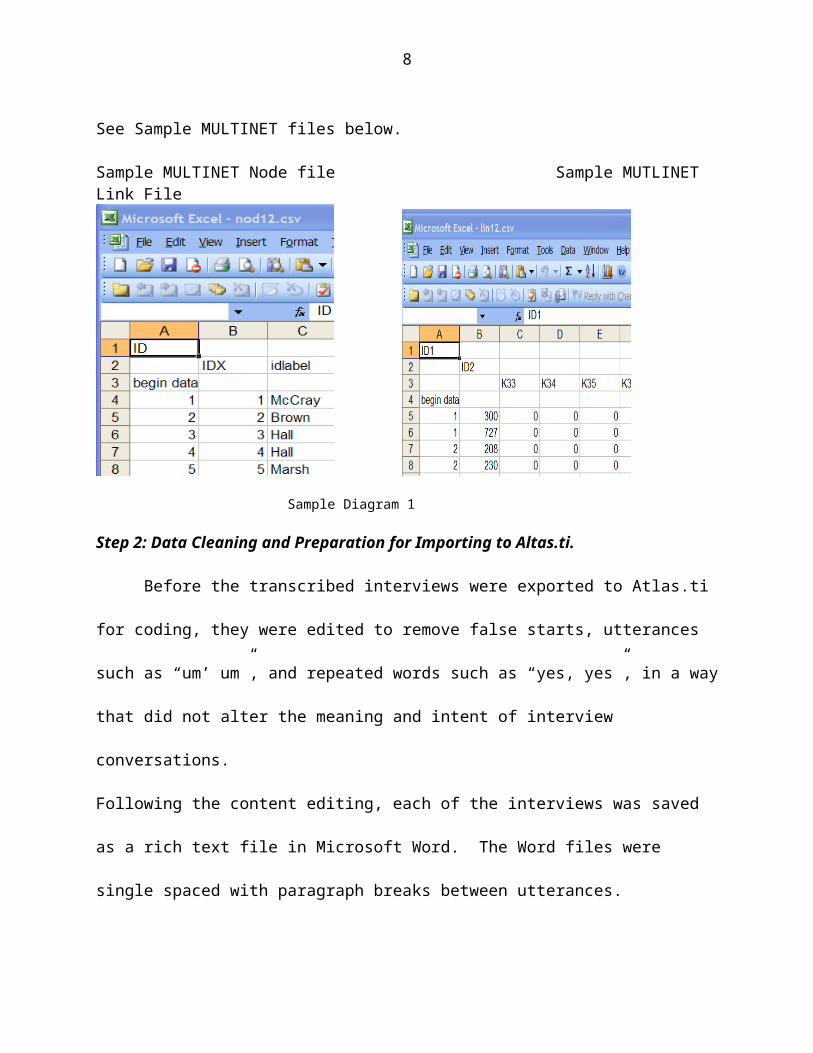
See Sample MULTINET files below.
Sample MULTINET Node file Sample MUTLINET Link File
Sample Diagram 1
Step 2: Data Cleaning and Preparation for Importing to Altas.ti.
Before the transcribed interviews were exported to Atlas.ti for coding, they were
edited to remove false starts, utterances such as “um’ um”, and repeated words such as
“yes, yes”, in a way that did not alter the meaning and intent of interview conversations.
Following the content editing, each of the interviews was saved as a rich text file in
Microsoft Word. The Word files were single spaced with paragraph breaks between
utterances.
5
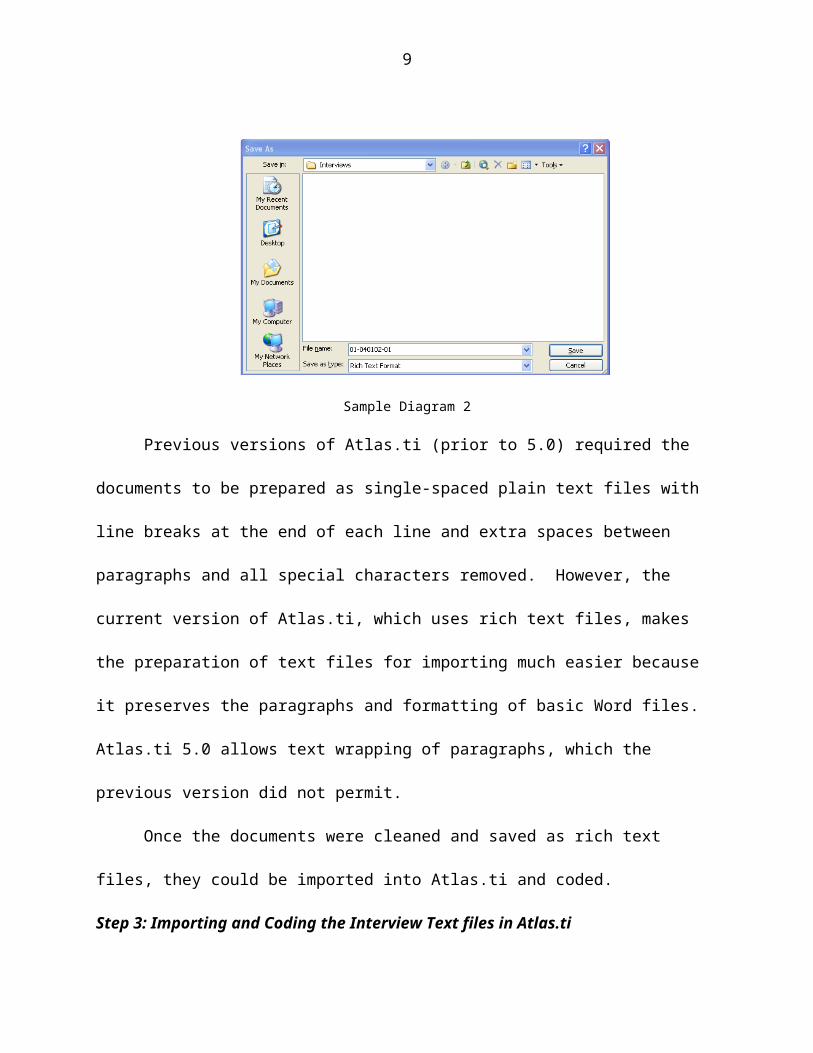
Sample Diagram 2
Previous versions of Atlas.ti (prior to 5.0) required the documents to be prepared
as single-spaced plain text files with line breaks at the end of each line and extra
spaces between paragraphs and all special characters removed. However, the current
version of Atlas.ti, which uses rich text files, makes the preparation of text files for
importing much easier because it preserves the paragraphs and formatting of basic
Word files. Atlas.ti 5.0 allows text wrapping of paragraphs, which the previous version
did not permit.
Once the documents were cleaned and saved as rich text files, they could be
imported into Atlas.ti and coded.
Step 3: Importing and Coding the Interview Text files in Atlas.ti
A key problem for creating social network data from qualitative interviews was
how to code the interviews in Atlas.ti and generate a LINK file for social network
analysis in Multinet, since we have in essence a NODE file developed with the
assignment of an ID with each interviewee stored in an Excel file. During the time of
this study the co-authors of this paper knew of no networking software on the market
that could be used in its original design alone to capture relationship data embedded in
6

interviews. Consequently, the dissertation interview data was used as “test data” to
discover a way in which to document and analyze network relationships embedded in
interview data. This required that a path be created between ATLAS.ti, SPSS and
Multinet in order to export data across each of the programs.2
Developing a Relation File
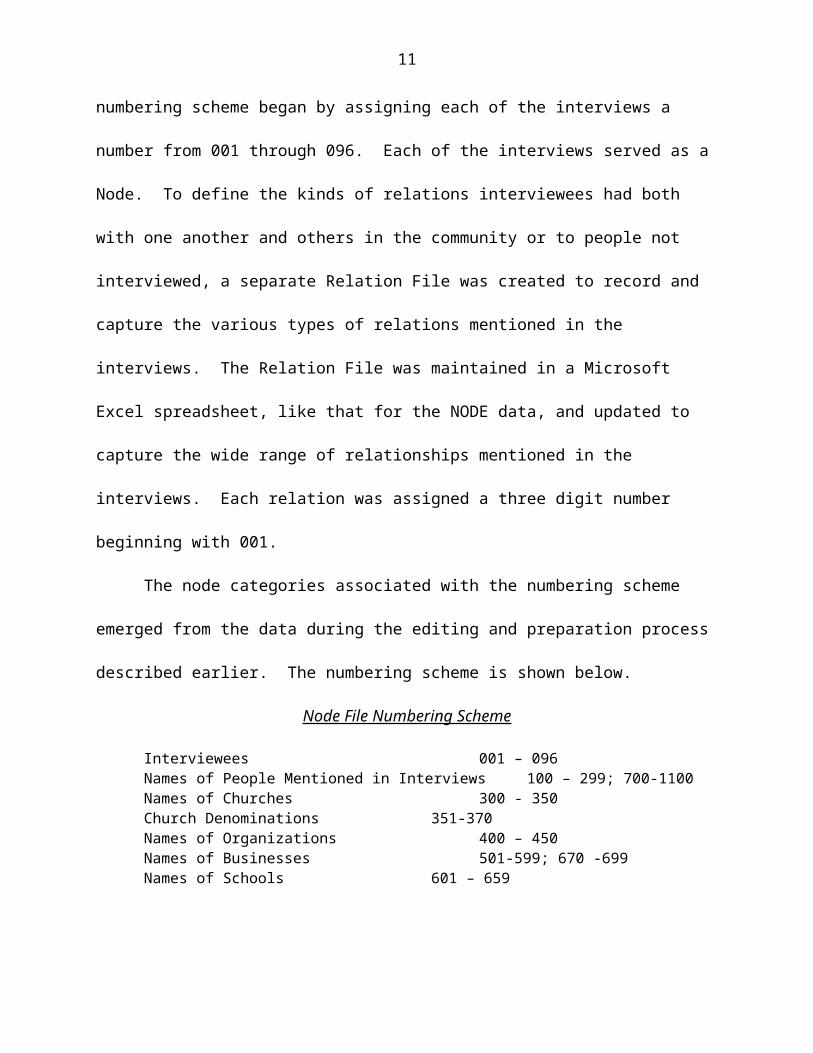
Overall, it was important to develop an appropriate numbering and labeling
scheme that would allow the node and link data to be generated and used as network
input files for the social network program, Multinet. As previously mentioned, the
numbering scheme began by assigning each of the interviews a number from 001
through 096. Each of the interviews served as a Node. To define the kinds of relations
interviewees had both with one another and others in the community or to people not
interviewed, a separate Relation File was created to record and capture the various
types of relations mentioned in the interviews. The Relation File was maintained in a
Microsoft Excel spreadsheet, like that for the NODE data, and updated to capture the
wide range of relationships mentioned in the interviews. Each relation was assigned a
three digit number beginning with 001.
The node categories associated with the numbering scheme emerged from the
data during the editing and preparation process described earlier. The numbering
scheme is shown below.
Node File Numbering Scheme
Interviewees 001 – 096Names of People Mentioned in Interviews 100 – 299; 700-1100Names of Churches 300 - 350Church Denominations 351-370Names of Organizations 400 – 450Names of Businesses 501-599; 670 -699
2 Drs. Kenneth Riopelle and Dr. Julia Gluesing at Wayne State University discovered and wrote the path.
7
Names of Schools 601 – 659
To capture all of the nodes embedded in the interview data, each time an interviewee
mentioned a person, church, organization, etc., that named person or organization was
assigned a 3 digit Node number based on the above numbering system. Each named
person, place or organization was assigned a single number even though they may
have been mentioned several times throughout the interviews. The named person,
place or organization was assigned a number only when mentioned the first time by one
of the 96 people interviewed. Thereafter, the 3 digit ID was used to link the specifically
named node with every person that mentioned the node in an interview. The NODE
File and the Relation File were maintained and constantly updated in a Microsoft Excel
program. The Microsoft Excel program allowed the lists to be sorted by last name and
number to ensure names and numbers were not duplicated.
Exporting Data to ATLAS.ti3
After all interviews were edited, cleaned and prepared in the first pass of reading,
and after node and relation data were recorded in excel files in the second pass, the
“cleaned” interview text documents were assigned to ATLAS.ti for coding and analysis.
In Atlas.ti terms, each of the interviews became a Primary Document (PD) in a single
ATLAS.ti Hermeneutic Unit. A code was created for every node and relation type from
the first few passes at the data with the Atlas.ti’s Code Manager using the command
“Create Free Code.”
3 In October 2004, Ken Riopelle wrote an unpublished document entitled “How to go from Atlas.ti to MULTINET” which explains the process in detail.
8
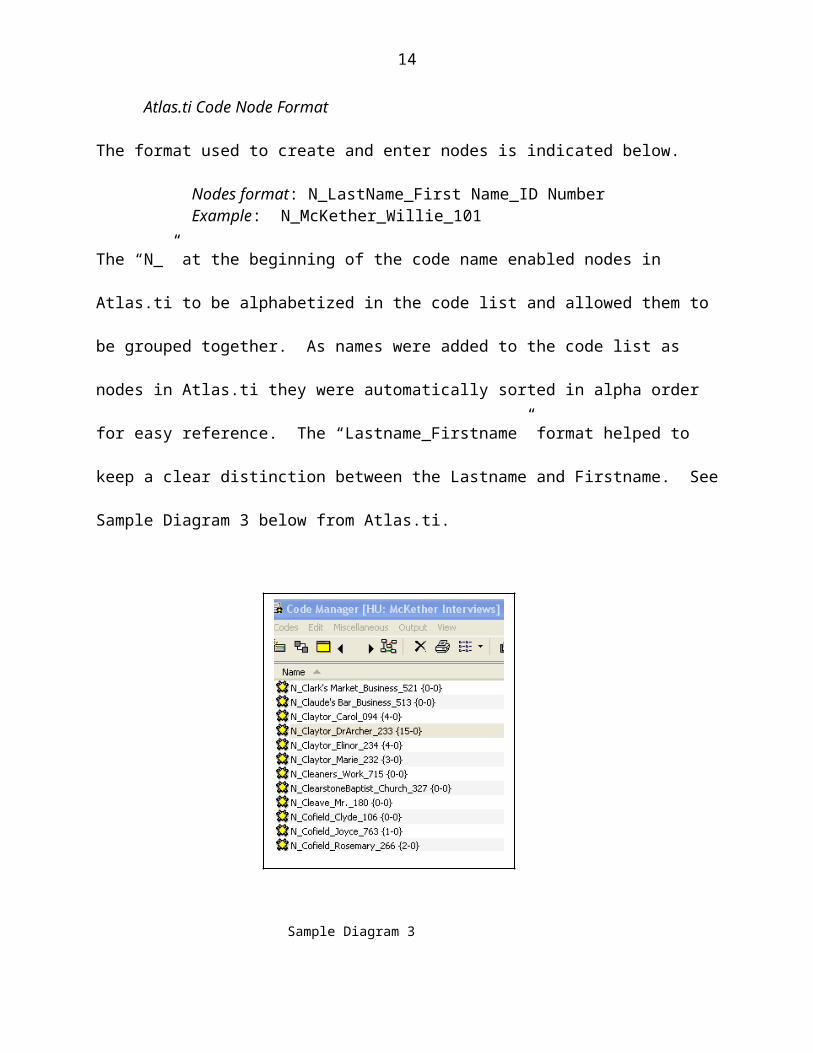
Atlas.ti Code Node Format
The format used to create and enter nodes is indicated below.
Nodes format: N_LastName_First Name_ID NumberExample: N_McKether_Willie_101
The “N_” at the beginning of the code name enabled nodes in Atlas.ti to be alphabetized
in the code list and allowed them to be grouped together. As names were added to the
code list as nodes in Atlas.ti they were automatically sorted in alpha order for easy
reference. The “Lastname_Firstname” format helped to keep a clear distinction
between the Lastname and Firstname. See Sample Diagram 3 below from Atlas.ti.
Sample Diagram 3
The “Lastname_Firstname” designations were 24 characters or less in order to meet
MULTINET labeling limit requirements. The “_ID number” tag at the end of the person’s
name allowed the list of all nodes to be prepared by ascending ID number in Excel. The
“_” underscore formatting allowed “text” columns to be easily parsed into “text to
columns” and for sorting Nodes alphabetically by name and by ID number. This was
very handy later in reformatting the Altas.ti coding into a MUTLINET file format.
9
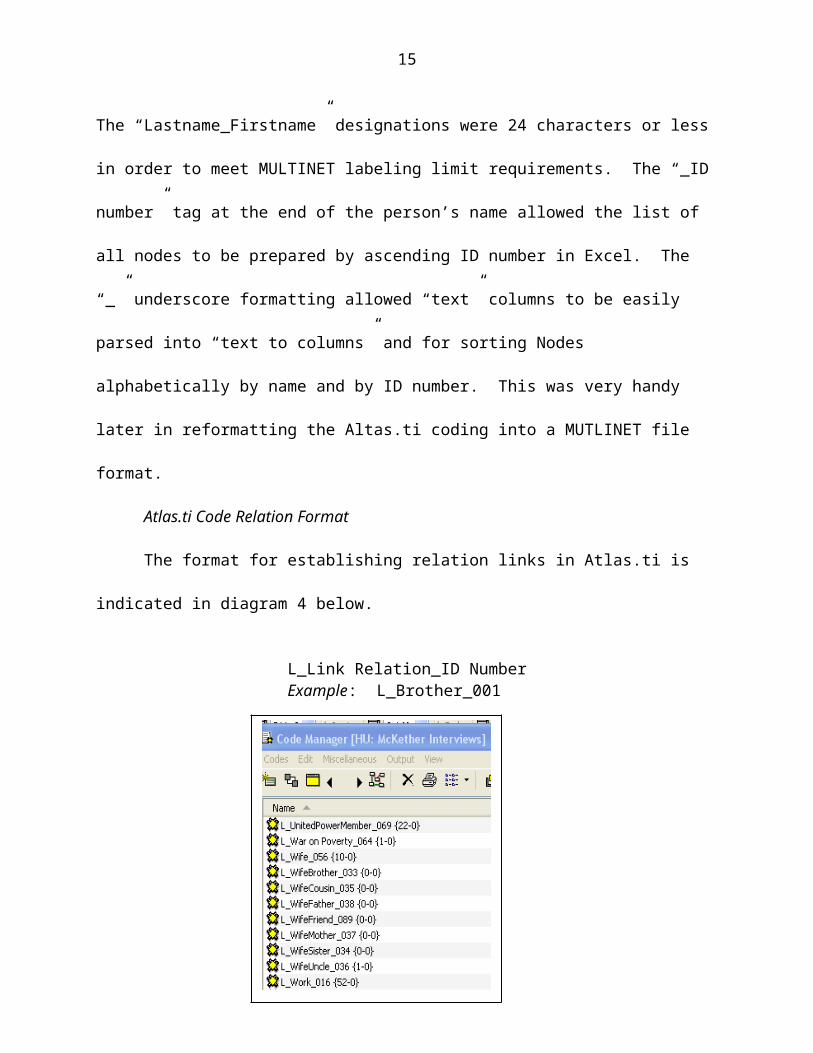
Atlas.ti Code Relation Format
The format for establishing relation links in Atlas.ti is indicated in diagram 4
below.
L_Link Relation_ID NumberExample: L_Brother_001
Sample Diagram 4
Similar to the node format, the “L_” at the beginning of the code name enabled
an alphabetical listing of Link relations in Atlas.ti and kept them grouped together.
Additionally, as Link relations were added to the Link list in Atlas.ti they were
automatically sorted in alpha order for easy reference. The “_ID number” tag at the end
of the Link relation allowed the list of all Links to be prepared ascending ID number in
Excel. The “_” underscore formatting allowed “text to columns” to be easily parsed in
Excel for sorting Links alphabetically by name and by ID number. This also was very
handy later in reformatting the Altas.ti coding into a MUTLINET file format.
10
Coding the Interview Data for Migration Themes
In addition to the coding for nodes and relations, the data were coded for the
major themes in the oral histories that described the migration experiences of the
interviewees. A thorough reading of the interviews produced the initial migration theme
code list in Atlas.ti. To help with the coding process, a high level word crunch frequency
was calculated in Altas.ti. The word crunch feature in ATLAS.ti provided a word count
of all words used in the Hermeneutic Unit (all words across all interview texts). Such an
analysis allowed the initial code list to be compared against the most frequently used
words in all interviews as a check to ensure the initial code list was representative, at a
high level of analysis, with major themes embodied in the interviews. Based on the
word crunch analysis the initial code was revised to include minor themes not observed
during the first and second pass of reading the interviews.
The coding process was iterative and required several passes. To simplify the
coding process, the interviews were coded first using the interview codes and then they
were coded using the node and link codes. While this process was slow and tedious, it
helped to ensure both the qualitative and quantitative objectives of the process were
met with equal concern and attention.
To facilitate the first pass of coding using the interview codes, based on major
themes reflected in the 88 interview codes, nine code families
were created in the Atlas.ti program. A code family is a feature in ATLAS.ti which
allows groups of codes to be classified under a single code or family name. See
diagram 5 below.
11
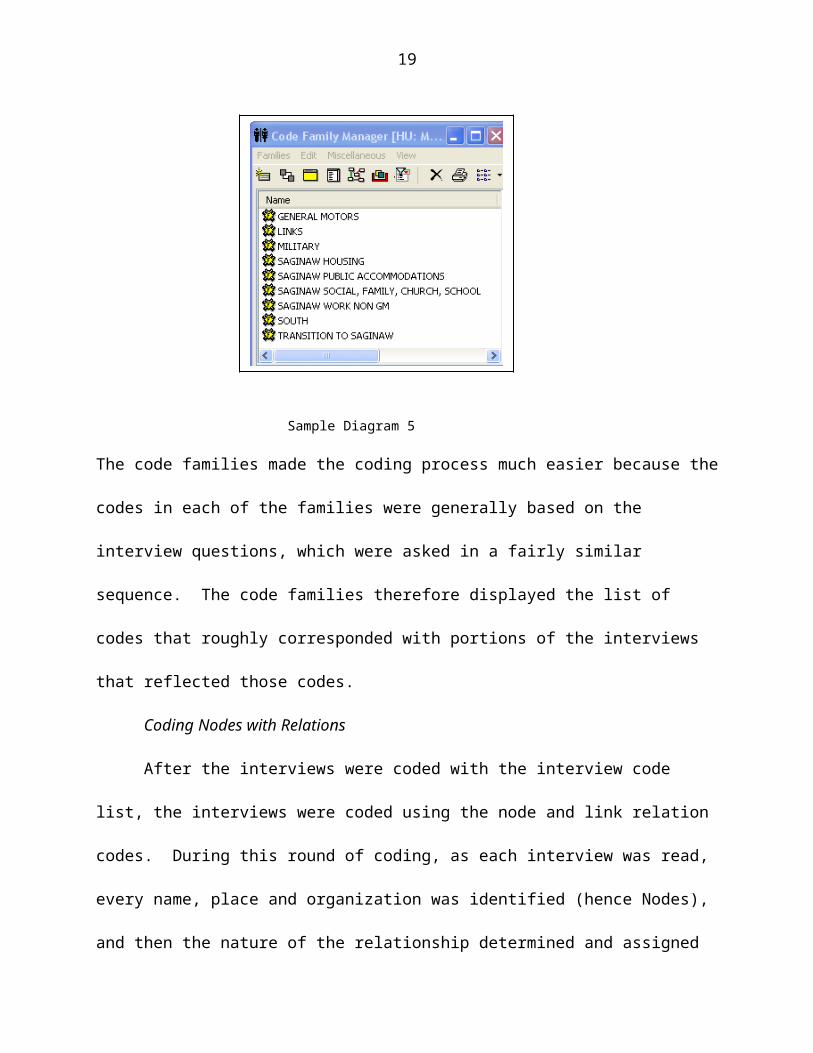
Sample Diagram 5
The code families made the coding process much easier because the codes in each of
the families were generally based on the interview questions, which were asked in a
fairly similar sequence. The code families therefore displayed the list of codes that
roughly corresponded with portions of the interviews that reflected those codes.
Coding Nodes with Relations
After the interviews were coded with the interview code list, the interviews were
coded using the node and link relation codes. During this round of coding, as each
interview was read, every name, place and organization was identified (hence Nodes),
and then the nature of the relationship determined and assigned an appropriate link
relation. To assign a code or codes, a person’s name was highlighted and they were
assigned the corresponding Node code for that person, and then assigned one or more
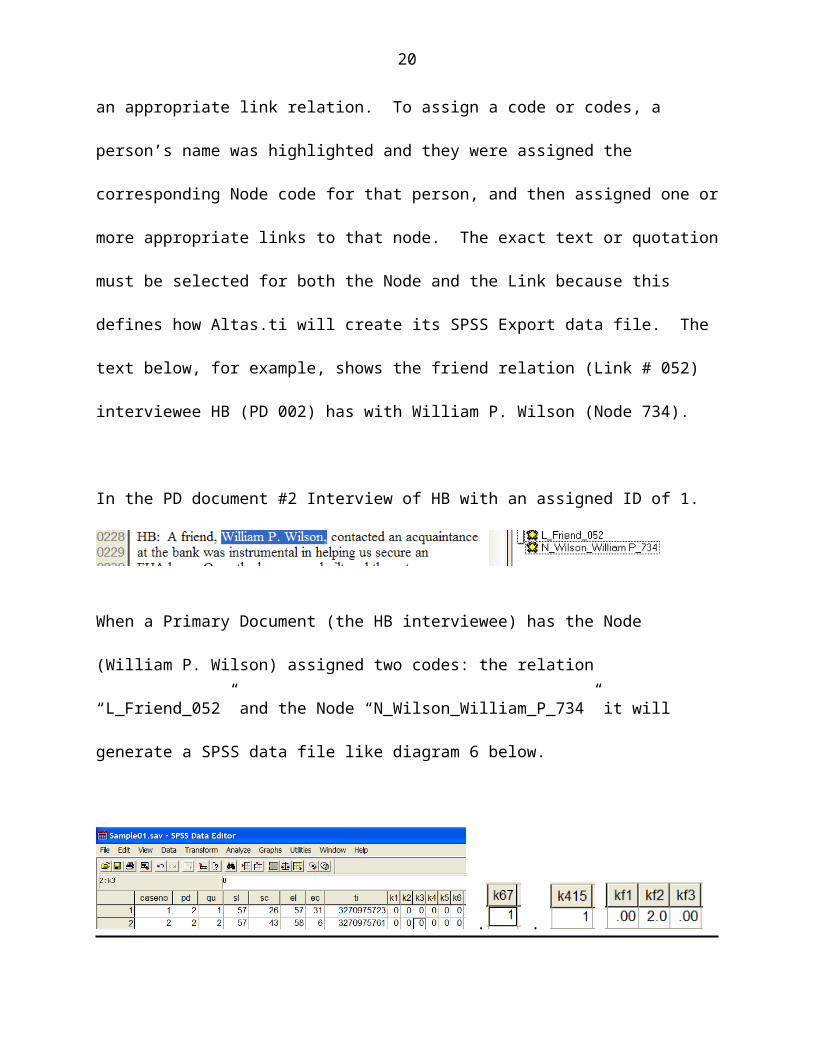
appropriate links to that node. The exact text or quotation must be selected for both the
Node and the Link because this defines how Altas.ti will create its SPSS Export data
file. The text below, for example, shows the friend relation (Link # 052) interviewee HB
(PD 002) has with William P. Wilson (Node 734).
12
In the PD document #2 Interview of HB with an assigned ID of 1.
When a Primary Document (the HB interviewee) has the Node (William P. Wilson)
assigned two codes: the relation “L_Friend_052” and the Node
“N_Wilson_William_P_734” it will generate a SPSS data file like diagram 6 below.
. .
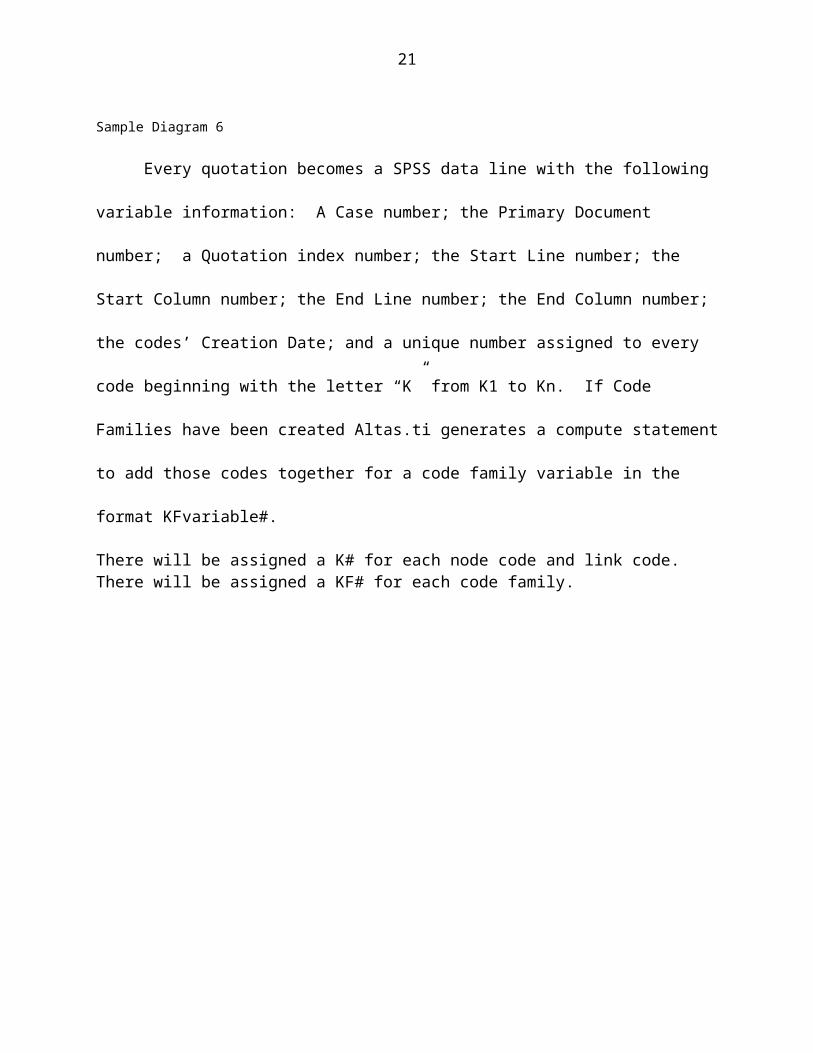
Sample Diagram 6
Every quotation becomes a SPSS data line with the following variable
information: A Case number; the Primary Document number; a Quotation index
number; the Start Line number; the Start Column number; the End Line number; the
End Column number; the codes’ Creation Date; and a unique number assigned to every
code beginning with the letter “K” from K1 to Kn. If Code Families have been created
Altas.ti generates a compute statement to add those codes together for a code family
variable in the format KFvariable#.
There will be assigned a K# for each node code and link code. There will be assigned a KF# for each code family.
13
There is a direct correspondence of Altas.ti coding that puts a “1” in a Node variable and
a “1” in a Link variable that enables the SPSS data file to be used to create the
MULTINET network files. For example, a MULTINET LINK file will be as follows:
InterviewID# Assigned
John Doe1
William Wilson734
Link
Altas.ti PD#, Codes
Uses Assigned
PD#N_Wilson_WilliamP_734
L_Friend_052
SPSS Variable:Label:
PDPrimary Doc
K415N_Wilson_734
K67L_Friend_052
<SPSS and Excel data manipulation steps here >MULTINETLink File Format
FromNode
ToNode
LinkRelation
MULTINETLink File Variable:
1D1 ID2 K67
MULTINETLink File Data values:
1 734 1
Step 4: Creating the Atlas.ti SPSS Data Extract
After coding each interview and assigning the appropriate Node and Link
Relation codes to a text segment, the next step was to create the SPSS data extract.
On the Atlas.ti menu choose the menu item, Extras, then Export to, then SPSS and
select the desired options.
Below is a sample Altas.ti SPSS Export Syntax file:
TITLE 'ATLAS.ti HE: INTERVIEWS FOR DISSERTATION 0804'.
* SPSS Syntax file generated by ATLAS.ti (WIN 5.0 (Build 60)).* SPSS Generator Version 3.0* Date: 2004-10-23T09:01:35.
14
DATA LIST RECORDS=13 /1 CASENO (F5.0) PD (F4.0) QU (F4.0) SL (F4.0) SC (F8.0) EL (F4.0) EC (F8.0) TI (F10.0) /2 K1 to K77 1-77 /3 K78 to K154 1-77
VARIABLE LABELS PD 'Primary Doc'/QU 'Q-Index'/SL 'Start Line'/SC 'Start Column'/EL 'End Line'/EC 'End Column'/TI 'Creation Date'/K1 'ARRIVALliveconditions'
/K33 'L_Aunt_011'/K34 'L_Babysat_057'/K35 'L_Barber_001'/K36 'L_Beautician_002'/K37 'L_Brother_007'/K38 'L_BrotherinLaw_068'/K39 'L_ChildhoodFriend_003'
/K110 'N_AFLCIO_Org_413'/K111 'N_Aldridge_Katherine_029'/K112 'N_Aldridge_William_050'/K113 'N_Alinski_Sol_279'/K114 'N_Allen_Bill_174'
COMPUTE KF1 = K5 + K6 + K13 . . .etc.
BEGIN DATA.0000100020001005700000026005700000031327097572300000000000000000 . . .
Note all the Link Relation codes will be grouped together as well as the Node codes.
15
Step 5 Creating an Excel Multinet Link File.
After the SPSS data file is created then create a SPSS syntax file with a series of
“If statements” to recode the Atlas.ti “PD” document numbers to match your interview
node ID numbers.
For example.
COMPUTE ID1 =0.
IF PD = 2 ID1 = 1.IF PD = 3 ID1 = 2.IF PD = 4 ID1 = 3.IF PD = 11 ID1 = 4.
This process, in effect, creates your MULTINET ID1 or FROM Node in the Link File.
Next create a series of SPSS IF statements to create the MULTINET ID2 or TO Node in the Link File.
COMPUTE ID2 =0.
IF K109 = 1 ID2 = 870.IF K110 = 1 ID2 = 413.IF K111 = 1 ID2 = 29.IF K112 = 1 ID2 = 50.
Next, add a select statement to select just the records with ID2 greater than 0.
USE ALL.COMPUTE filter_$=(id2 > 0).VARIABLE LABEL filter_$ 'id2 > 0 (FILTER)'.VALUE LABELS filter_$ 0 'Not Selected' 1 'Selected'.FORMAT filter_$ (f1.0).FILTER BY filter_$.
Finally, issue the SPSS Translate command to create the finished EXCEL MULTINET
Link file as follows:
SAVE TRANSLATE/Outfile = 'c:\lin01.xls' / Type = XLS /Fieldnames/ / Keep = ID1 ID2 K33 to K103.EXECUTE.
16
This Translate Command will create an Excel file with the FROM or ID1 variable
and the ID2 or TO variable along with all Relations or “K” variables that are defined.
There are now the two MULTINET network files necessary for social network analysis:
the NODE file with the IDs and Names of the Nodes and the Link File with the FROM
TO IDs and the corresponding relations. Lastly, the Excel files should be edited to add
the appropriate MULTINET header information. Then start MULTINET and import these
two data files for your social network analysis.
See Sample MULTINET files below.
Sample MULTINET Node file Sample MUTLINET Link File
Sample Diagram 7
MULTINET uses two files for network analysis:
1. A Node file which contains the unique ID #s which have been assigned to a
person or node, a label for the node up to 19 characters and any number of
demographic variables for each node, such as gender, age etc.
2. A Link file which contains two ID #s and there Link Relation variables.
17
In the Link file variable ID1 (From node) values are the PD#s matched to the assigned
IDs #s. The variable ID2 (To node) values are the Node code #s .
The Link relation variables K33 (e.g., Friend), etc., are 0 = No, 1 = Yes.
Methodology method strengths and limitations.
In this paper, we’ve described the process of discovery used to convert interview
data into social network data. In the conversion process, we used various functional
features of several qualitative and quantitative software programs to convert each of the
96 single personal oral history interviews into quantitative data that enabled network
analysis and mapping across all of the interviews.
The conversion process required the discovery and use of functional features of
the multiple software programs described in this paper. For example, the functionality
of Microsoft Word helped with storing and editing each of the interviews and then saving
them as text documents. We used Excel to create a simple Node file with a name and
assigned ID. We used Atlas.ti coding to create relationship links and export the data as
an SPSS data file, which we then exported to an Excel Link file. Finally, we imported
the Excel Node file and the Link file into Multinet for social network analysis. Although
the data tables created in SPSS could have been exported to various networking
software programs, we used Multinet because it was designed to manipulate nodes with
multiple attributes, such as demographic data, and links with multiple relations.
The interview method of data collection allowed data to be collected from an
insider’s perspective and provided first hand accounts about the migration and
settlement experiences from the people who had these experiences. The single person
interviews were designed to create a collective story of the process and outcome of a
18
twentieth century African-American migration. Although the interviews were key
sources of data for the migration study from the outset, the desire and ultimately the
decision, to examine the social networks embedded in the interview data emerged as
an outcome of preliminary interview and secondary data analysis.
Only as we began to review the interviews and to see the overlapping and
interrelated stories, people, and events, and needed a way to capture such relationships
across all of the interviews, did we begin the process of closely examining the functional
features of various software programs that would allow data exchange in dynamic ways
to enable network analysis. Through that iterative process, we began to demystify the
qualitative to quantitative software linkages and, more importantly, to piece together
individual nodes and links embedded in interview data that allowed us to uncover
relationships unattainable through any other process or software programs on the
market at the time of the study.
The social network analysis, through the link and node files, allowed for the
people, organizations and places mentioned in the interviews to be examined across
each of the interviews. This discovery process enabled us to investigate both ego-
centered as well as whole social networks embedded in and throughout the interviews,
thereby combining the functional features of ego and whole network centered software
programs. This multi-faceted approach was particularly useful because it allowed us to
look at the specific links individuals had with one another, places and organizations, but
also allowed us to see, through the mapping function in Multinet, the links and
relationships across all of the interviews. Through such an analysis, we were able to
uncover the effect of specific individuals on the migration population as well as on the
19
interactions within the group. In short, the functionality of social network analysis
through Multinet reduced the nearly 4,000 pages of interview data to short easy-to-read
and examinable network maps and reports.
This ability to extract and examine ego and whole social networks embedded in
interview data can be used by researchers across a wide range of disciplines and with a
variety of purposes to supplement existing strategies and research methods. These
processes are particularly useful for scholars who desire to explore specific kinds of
links in and across interview data sets no matter how the data are collected. While this
process played a key role in an anthropological study of migration, the processes
described in this paper can be replicated and used in both qualitative and quantitative-
based studies and disciplines.
The processes described in this paper are, however, limited to single person
interviews. As we mentioned earlier in this paper, we did not plan to examine the
interviews through social networks when we started the interview process. Only after
we started the process of discovery outlined in this paper did we recognize the difficulty
in coding a single interview (an Atlas.ti Primary Document) that originated from more
than one interviewee or Node. To address this current limitation, we recommend that
until a conversion process and coding scheme is developed for group interviews,
researchers conduct single person interviews to use the methodological process
described in this paper
20
REFERENCES
McKether, W. L.
2005 Voices in Transition: African-American Migration to Saginaw, Michigan: 1920
to 1960. Ph.D. dissertation, Department of Anthropology, Wayne State
University.
Riopelle, K.
2004 How to go from Altlas.ti to Multinet or Qualitative Analysis to Network
Analysis. Unpublished Manual. Department of Industrial and Manufacturing
Engineering, Wayne
State University.
Sommer B., and Margaret Quinlan
2002 The Oral History Manual. Walnut Creek: AltaMira Press.
21