Embed Size (px)
Citation preview

Brixen, September 2009
Antidumping Protection hurts Exporters
Jozef Konings(*) and Hylke Vandenbussche(**)
(*)Catholic University of Leuven
(**) Université Catholique de Louvain
Brixen, September 2009
Financial Crisis spurs protectionism
Brixen, September 2009
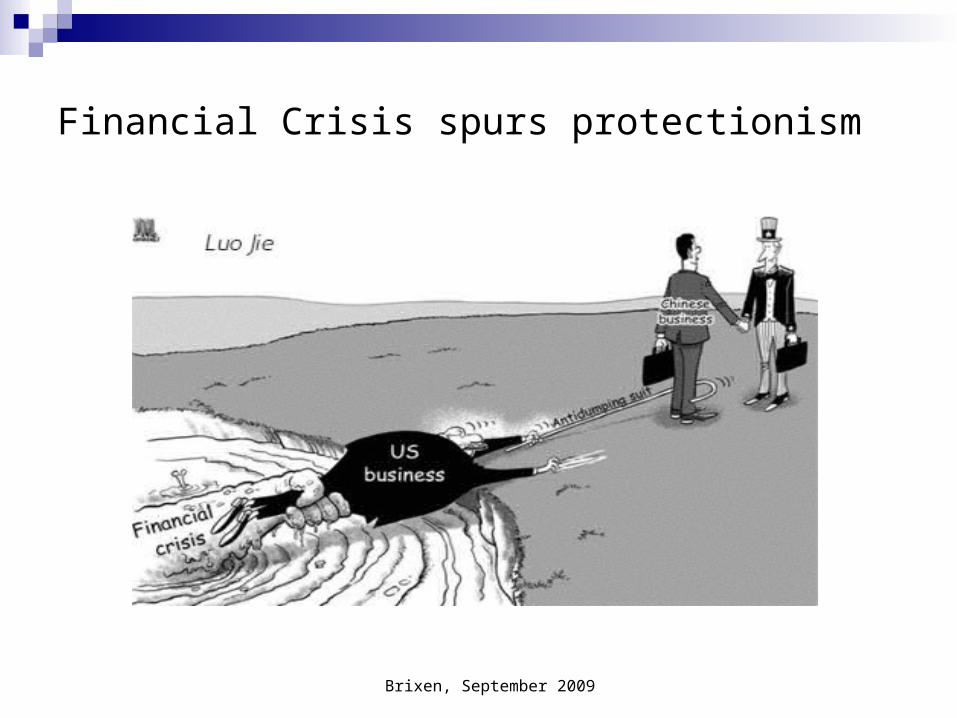
Antidumping protection on the rise
0
5
10
15
20
25
30
1980 1982 1984 1986 1988 1990 1992 1994 1996 1998 2000 2002 2004 2006 2008
Ave
rag
e ap
plie
d ta
riff
rat
es (%
)
0
50
100
150
200
250
AD
mea
sure
s
Average tariff AD measures
Brixen, September 2009
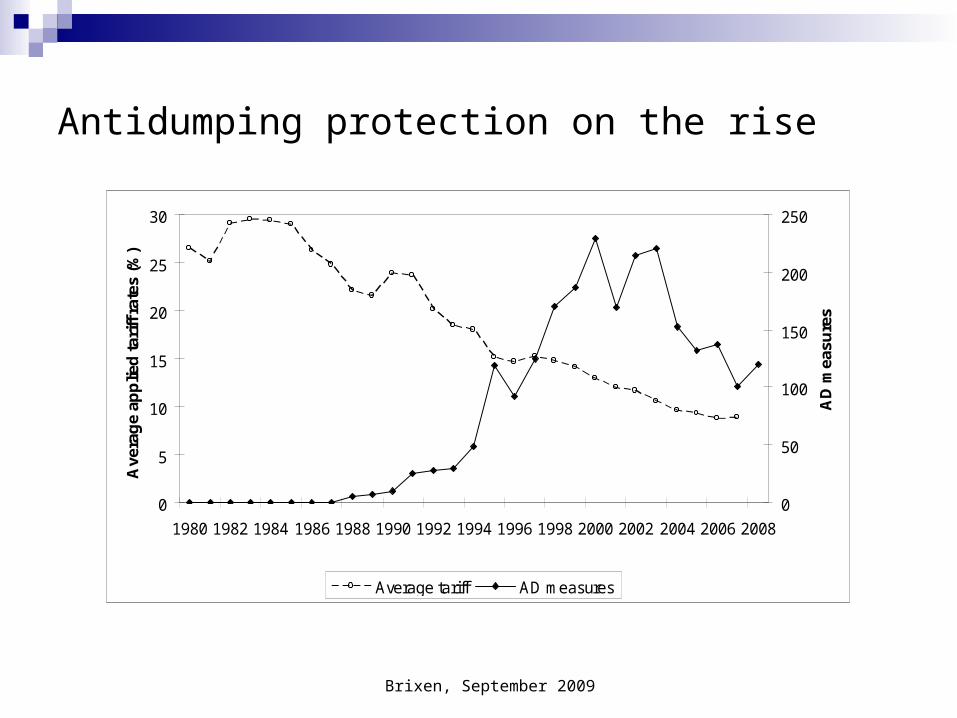
But…not all firms want protection
Antidumping Case in 2007:
EU antidumping protection against imports of shoes from China and Vietnam was supported by small scale Italian shoe producers but opposed by large EU producers with international activity.
Why?
This paper tries to give explanation
Brixen, September 2009
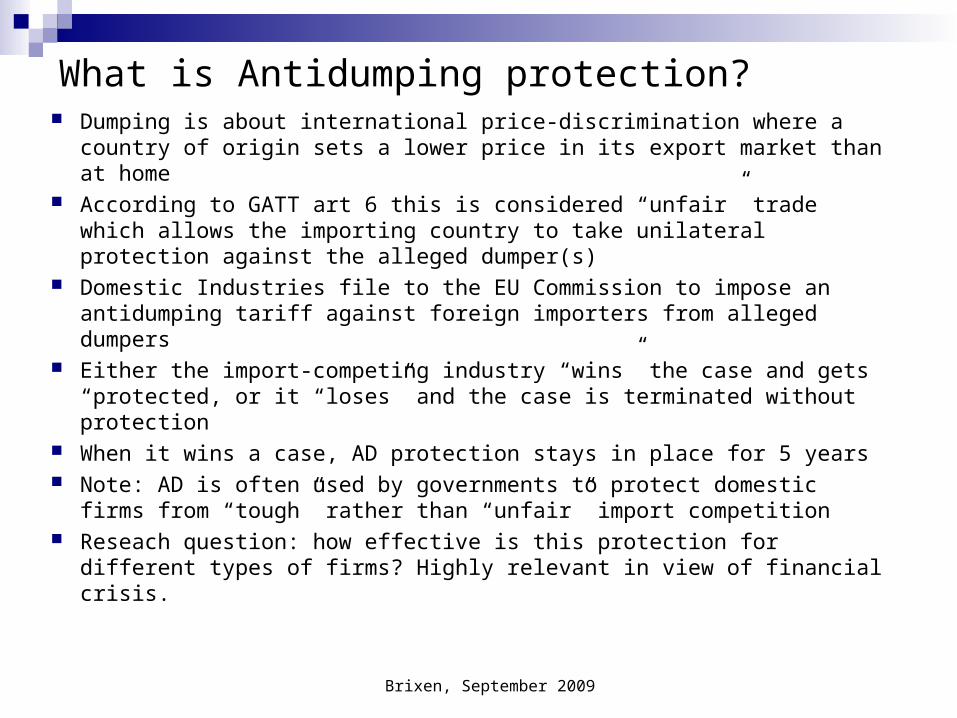
What is Antidumping protection? Dumping is about international price-discrimination where a country
of origin sets a lower price in its export market than at home According to GATT art 6 this is considered “unfair” trade which
allows the importing country to take unilateral protection against the alleged dumper(s)
Domestic Industries file to the EU Commission to impose an antidumping tariff against foreign importers from alleged dumpers
Either the import-competing industry “wins” the case and gets “protected, or it “loses” and the case is terminated without protection
When it wins a case, AD protection stays in place for 5 years Note: AD is often used by governments to protect domestic firms
from “tough” rather than “unfair” import competition Reseach question: how effective is this protection for different types
of firms? Highly relevant in view of financial crisis.
Brixen, September 2009
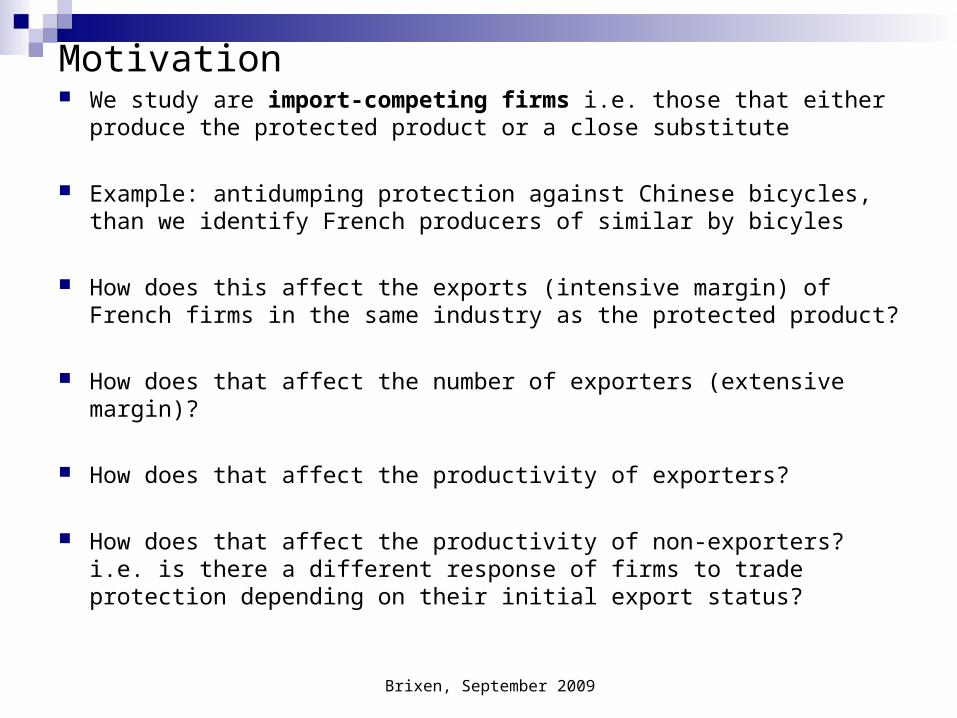
Motivation We study are import-competing firms i.e. those that either produce
the protected product or a close substitute
Example: antidumping protection against Chinese bicycles, than we identify French producers of similar by bicyles
How does this affect the exports (intensive margin) of French firms in the same industry as the protected product?
How does that affect the number of exporters (extensive margin)?
How does that affect the productivity of exporters?
How does that affect the productivity of non-exporters? i.e. is there a different response of firms to trade protection depending on their initial export status?
Brixen, September 2009
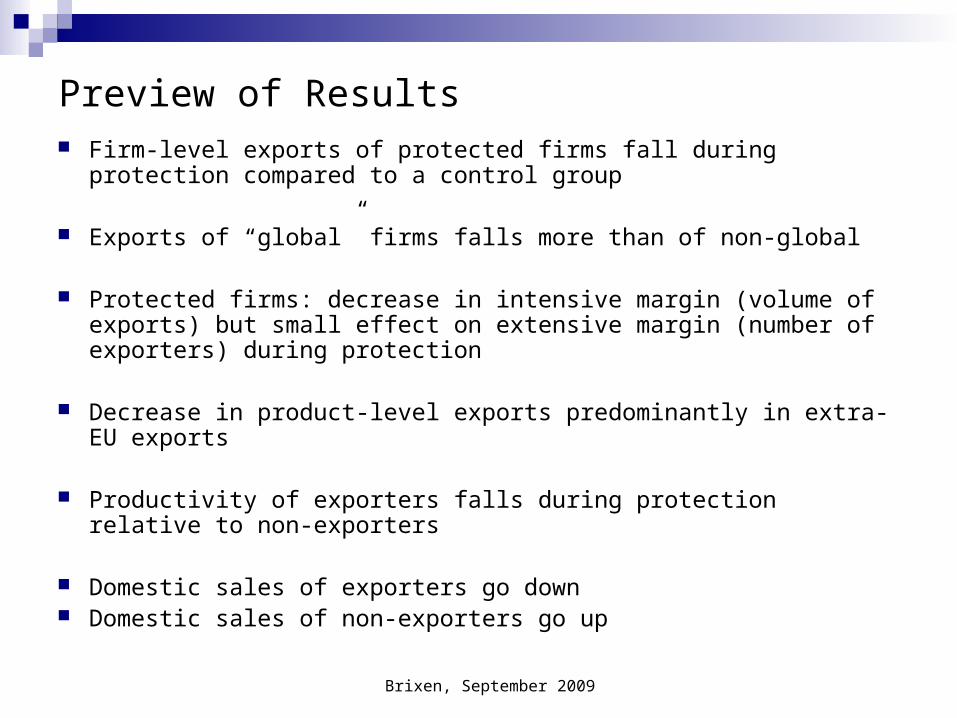
Preview of Results Firm-level exports of protected firms fall during protection compared to
a control group
Exports of “global” firms falls more than of non-global
Protected firms: decrease in intensive margin (volume of exports) but small effect on extensive margin (number of exporters) during protection
Decrease in product-level exports predominantly in extra-EU exports
Productivity of exporters falls during protection relative to non-exporters
Domestic sales of exporters go down Domestic sales of non-exporters go up
Brixen, September 2009
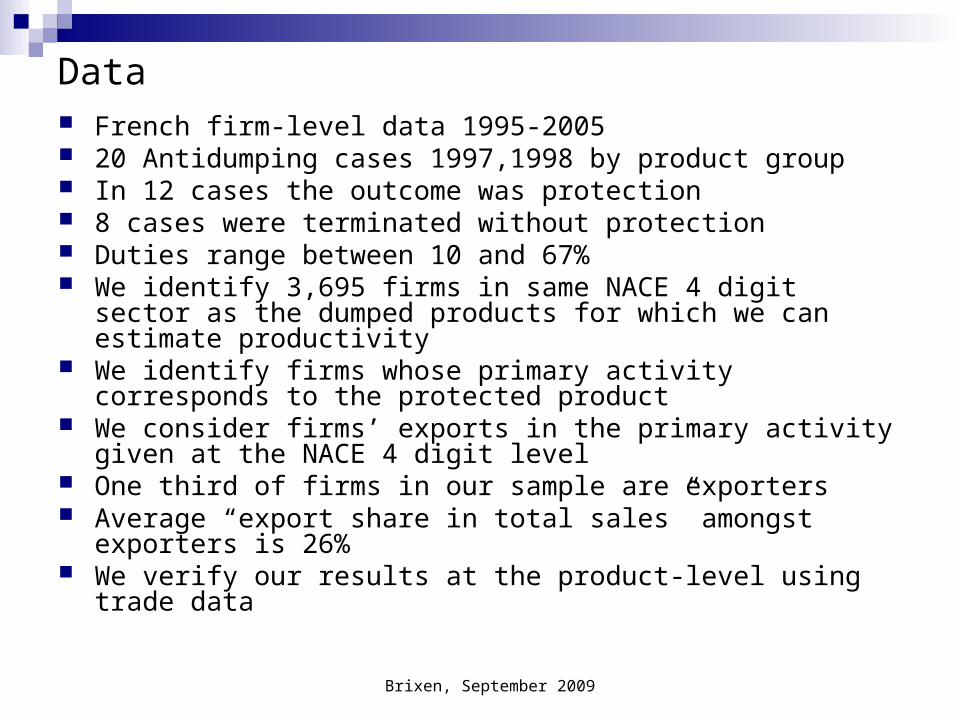
Data French firm-level data 1995-2005 20 Antidumping cases 1997,1998 by product group In 12 cases the outcome was protection 8 cases were terminated without protection Duties range between 10 and 67% We identify 3,695 firms in same NACE 4 digit sector as the dumped
products for which we can estimate productivity We identify firms whose primary activity corresponds to the
protected product We consider firms’ exports in the primary activity given at the NACE
4 digit level One third of firms in our sample are exporters Average “export share in total sales” amongst exporters is 26% We verify our results at the product-level using trade data
Brixen, September 2009
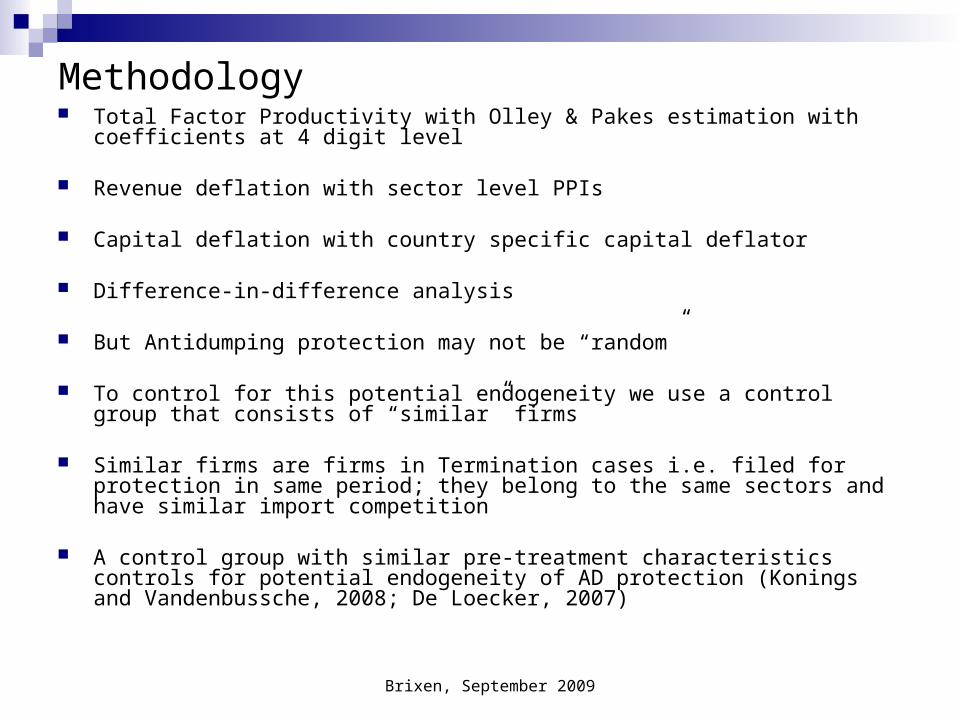
Methodology Total Factor Productivity with Olley & Pakes estimation with coefficients at 4 digit
level
Revenue deflation with sector level PPIs
Capital deflation with country specific capital deflator
Difference-in-difference analysis
But Antidumping protection may not be “random”
To control for this potential endogeneity we use a control group that consists of “similar” firms
Similar firms are firms in Termination cases i.e. filed for protection in same period; they belong to the same sectors and have similar import competition
A control group with similar pre-treatment characteristics controls for potential endogeneity of AD protection (Konings and Vandenbussche, 2008; De Loecker, 2007)
Brixen, September 2009
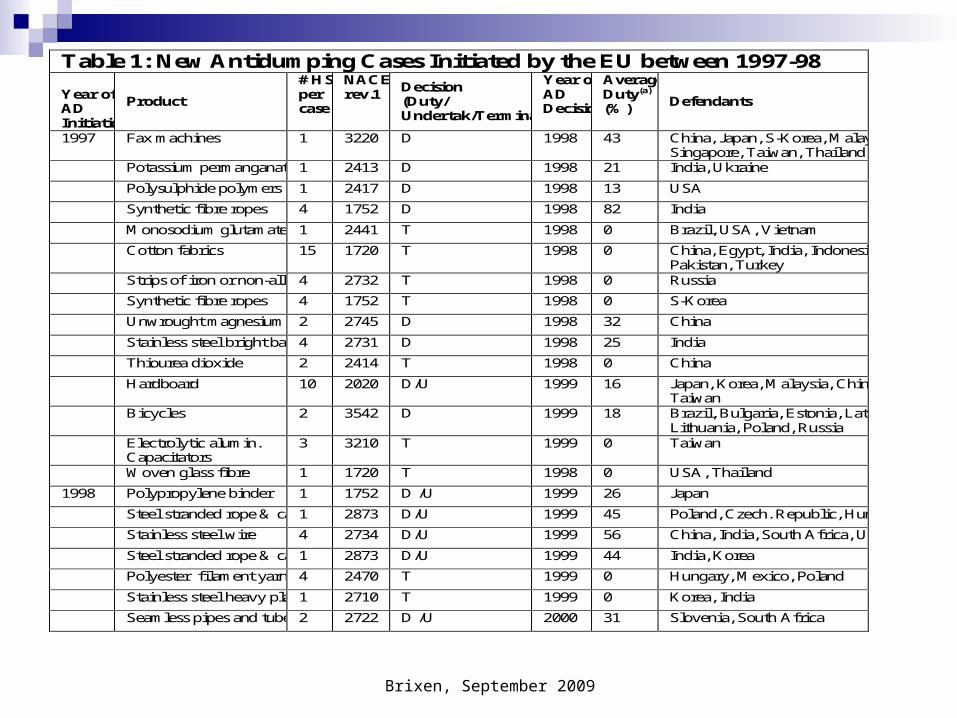
Table 1: New Antidumping Cases Initiated by the EU between 1997-98 Year of AD Initiation
Product
# HS per case
NACE rev.1
Decision (Duty/ Undertak/Termination)
Year of AD Decision
Average Duty(a)
(%) Defendants
1997 Fax machines 1 3220 D 1998 43 China, Japan, S-Korea, Malaysia, Singapore, Taiwan, Thailand
Potassium permanganate 1 2413 D 1998 21 India, Ukraine
Polysulphide polymers 1 2417 D 1998 13 USA
Synthetic fibre ropes 4 1752 D 1998 82 India
Monosodium glutamate 1 2441 T 1998 0 Brazil, USA, Vietnam
Cotton fabrics 15 1720 T 1998 0 China, Egypt, India, Indonesia,
Pakistan, Turkey
Strips of iron or non-alloy steel 4 2732 T 1998 0 Russia
Synthetic fibre ropes 4 1752 T 1998 0 S-Korea
Unwrought magnesium 2 2745 D 1998 32 China
Stainless steel bright bars 4 2731 D 1998 25 India
Thiourea dioxide 2 2414 T 1998 0 China
Hardboard 10 2020 D/U 1999 16 Japan, Korea, Malaysia, China,
Taiwan
Bicycles 2 3542 D 1999 18 Brazil, Bulgaria, Estonia, Latvia,
Lithuania, Poland, Russia
Electrolytic alumin. Capacitators
3 3210 T 1999 0 Taiwan
Woven glass fibre 1 1720 T 1998 0 USA, Thailand
1998 Polypropylene binder 1 1752 D /U 1999 26 Japan
Steel stranded rope & cables 1 2873 D/U 1999 45 Poland, Czech. Republic, Hungary
Stainless steel wire 4 2734 D/U 1999 56 China, India, South Africa, Ukraine
Steel stranded rope & cables 1 2873 D/U 1999 44 India, Korea
Polyester filament yarn 4 2470 T 1999 0 Hungary, Mexico, Poland
Stainless steel heavy plates 1 2710 T 1999 0 Korea, India
Seamless pipes and tubes 2 2722 D /U 2000 31 Slovenia, South Africa
Brixen, September 2009
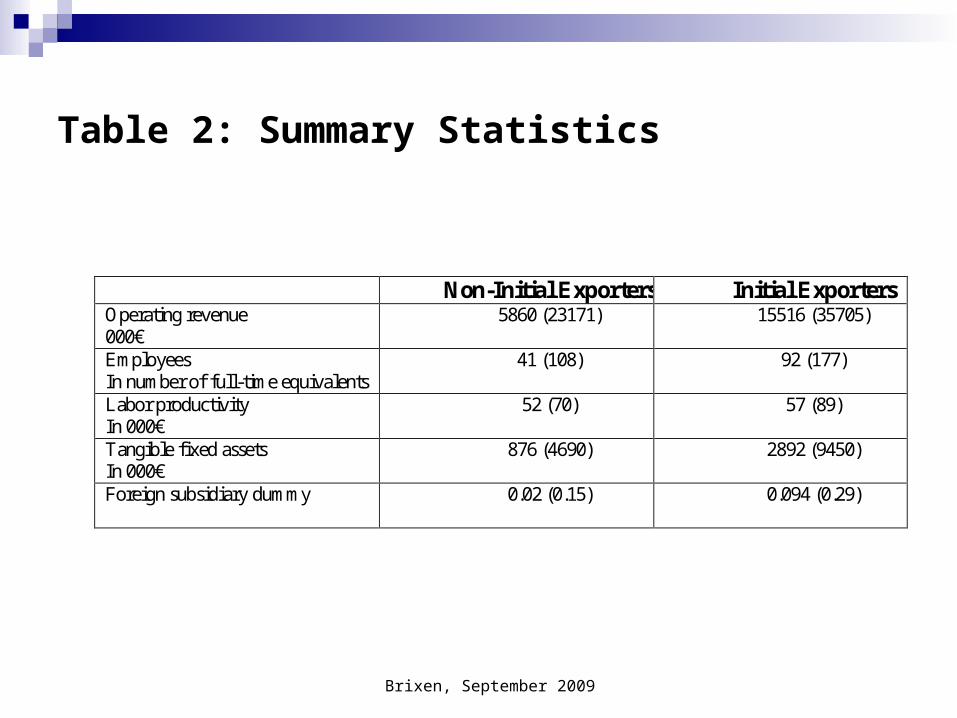
Table 2: Summary Statistics
Non-Initial Exporters Initial Exporters Operating revenue 000€
5860 (23171) 15516 (35705)
Employees In number of full-time equivalents
41 (108) 92 (177)
Labor productivity In 000€
52 (70) 57 (89)
Tangible fixed assets In 000€
876 (4690) 2892 (9450)
Foreign subsidiary dummy 0.02 (0.15) 0.094 (0.29)
Brixen, September 2009
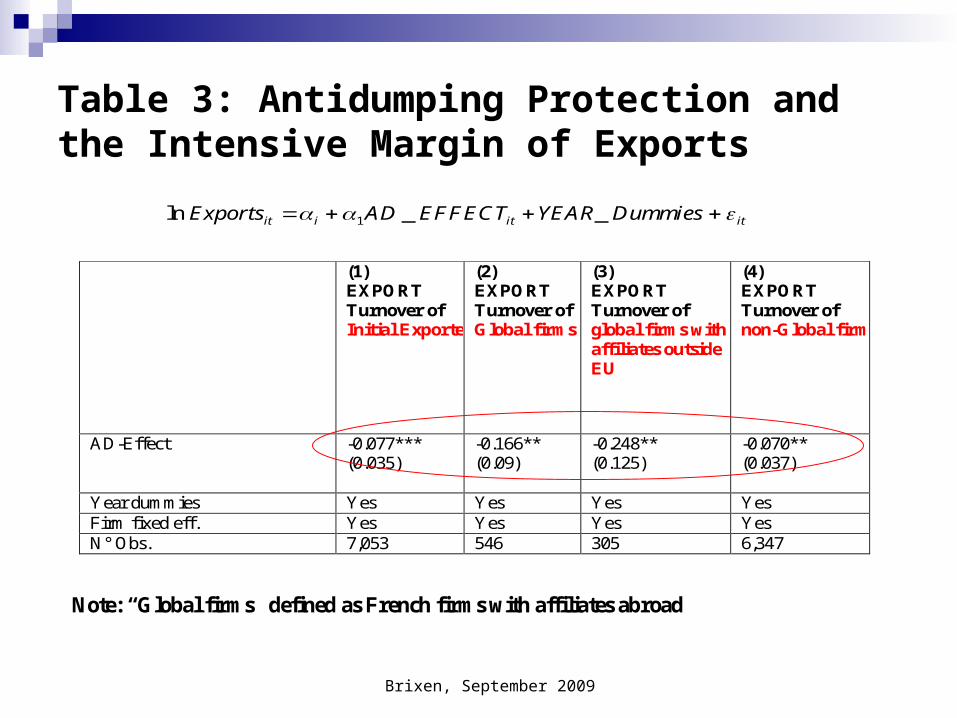
Table 3: Antidumping Protection and the Intensive Margin of Exports
(1) EXPORT Turnover of Initial Exporters
(2) EXPORT Turnover of Global firms
(3) EXPORT Turnover of global firms with affiliates outside EU
(4) EXPORT Turnover of non-Global firms
AD-Effect -0.077*** (0.035)
-0.166** (0.09)
-0.248** (0.125)
-0.070** (0.037)
Year dummies Yes Yes Yes Yes Firm fixed eff. Yes Yes Yes Yes N° Obs. 7,053 546 305 6,347
1ln _ _it i it itExports AD EFFECT YEAR Dummies
Note: “Global firms” defined as French firms with affiliates abroad
Brixen, September 2009
Possible Explanations for fall in Exports
Import protection limits French exporters ability to price-discriminate abroad
Import protection limits domestic price competition and keeps
domestic prices high undermining competitiveness abroad
Import protection mainly affects outsourcers that manufacture products abroad for re-imports
Import protection by France triggers retaliation by target countries (Prusa, 2001)
Brixen, September 2009
Theoretical Framework Krugman (1984): “Export Promotion through Import Protection”.
Model with one representative firm and unilateral protection. Empirics do not support this model
Helpman, Melitz, Rubinstein (2008). Model with monopolistic competition and heterogeneous firms. Reduction in transport costs increase exports and increase number of exporters. In line with our findings
Melitz and Ottaviano (2008): predictions of reciprocal dumping model with heterogeneous firms. Unilateral trade protection results in a decrease in exports and an increase in the number of non-exporters are in line with our findings
Verhoogen (2008), Bustos (2007), Acharya and Keller (2008). Trade Liberalization is best for high productivity firms. Transposed to AD: trade protection is best for lowly productive firms. In line with our result on non-exporters.
Brixen, September 2009
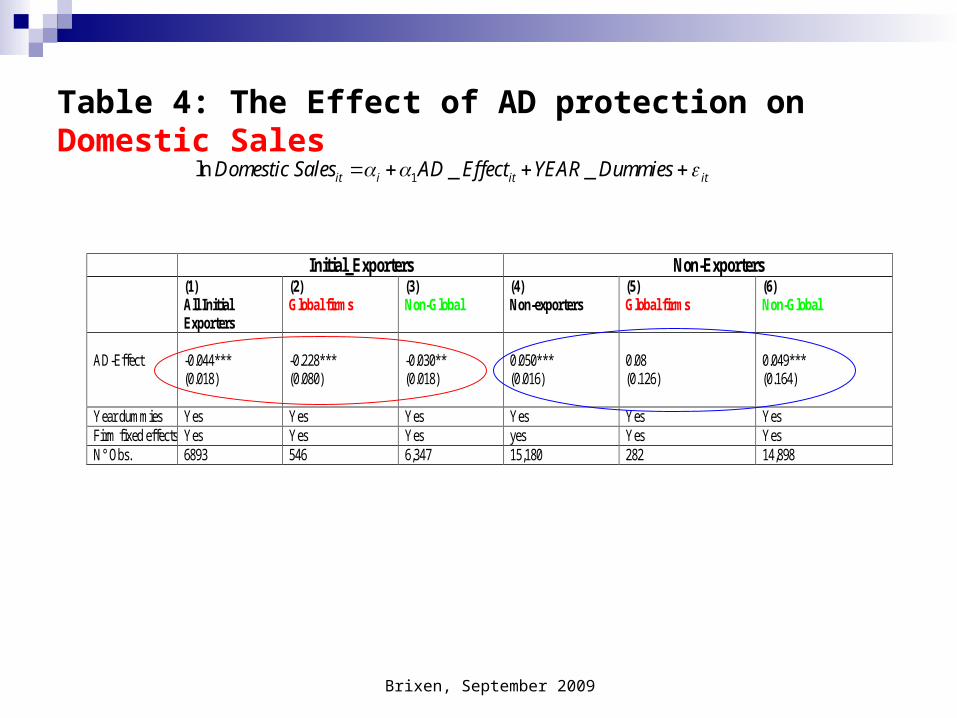
Table 4: The Effect of AD protection on Domestic Sales
Initial_Exporters Non-Exporters (1)
All Initial Exporters
(2) Global firms
(3) Non-Global
(4) Non-exporters
(5) Global firms
(6) Non-Global
AD-Effect
-0.044*** (0.018)
-0.228*** (0.080)
-0.030** (0.018)
0.050*** (0.016)
0.08 (0.126)
0.049*** (0.164)
Year dummies Yes Yes Yes Yes Yes Yes Firm fixed effects Yes Yes Yes yes Yes Yes N° Obs. 6893 546 6,347 15,180 282 14,898
1ln _ _it i it itDomestic Sales AD Effect YEAR Dummies
Brixen, September 2009
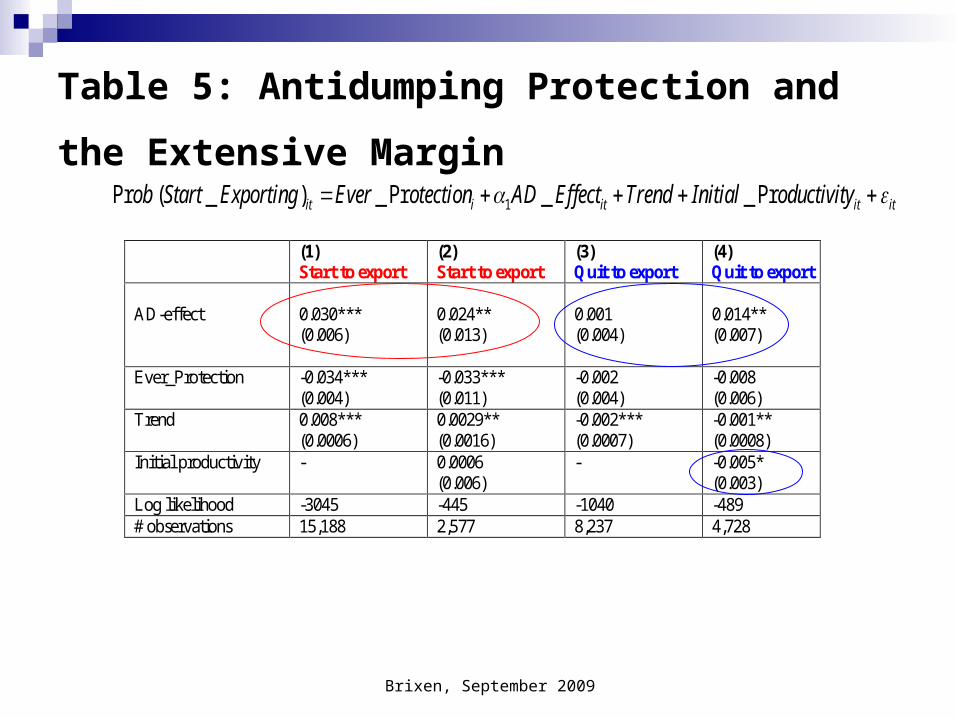
Table 5: Antidumping Protection and the
Extensive Margin
(1) Start to export
(2) Start to export
(3) Quit to export
(4) Quit to export
AD-effect
0.030*** (0.006)
0.024** (0.013)
0.001 (0.004)
0.014** (0.007)
Ever_Protection -0.034*** (0.004)
-0.033*** (0.011)
-0.002 (0.004)
-0.008 (0.006)
Trend 0.008*** (0.0006)
0.0029** (0.0016)
-0.002*** (0.0007)
-0.001** (0.0008)
Initial productivity - 0.0006 (0.006)
- -0.005* (0.003)
Log likelihood -3045 -445 -1040 -489 # observations 15,188 2,577 8,237 4,728
1Pr ( _ ) _ Pr _ _ Prit i it it itob Start Exporting Ever otection AD Effect Trend Initial oductivity
Brixen, September 2009
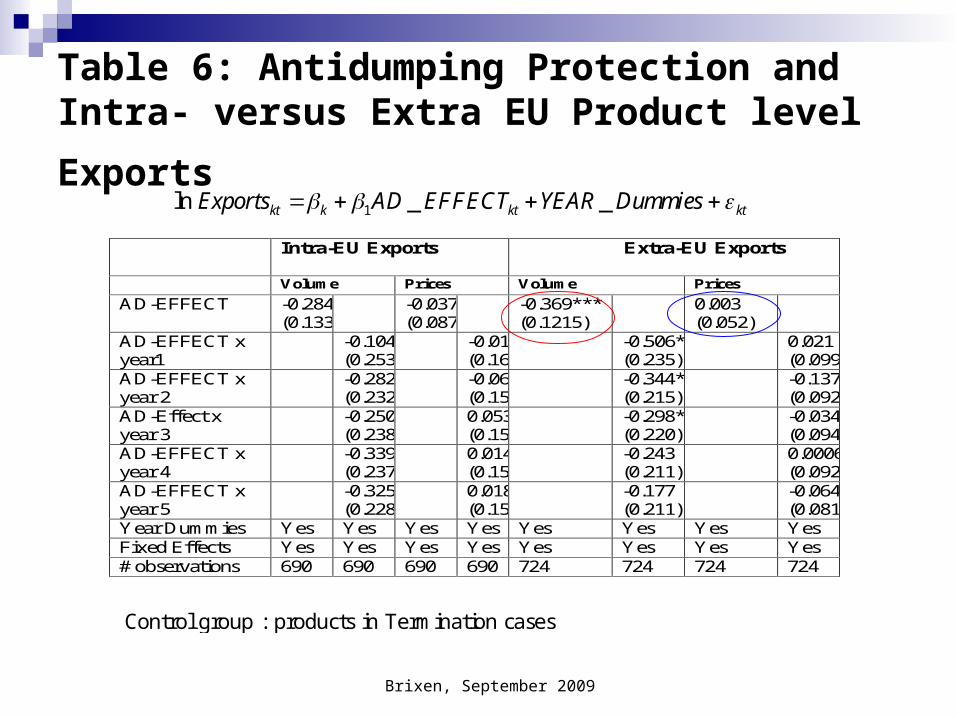
Table 6: Antidumping Protection and Intra-
versus Extra EU Product level Exports
Intra-EU Exports Extra-EU Exports
Volume Prices Volume Prices
AD-EFFECT -0.284** (0.133)
-0.037 (0.087)
-0.369*** (0.1215)
0.003 (0.052)
AD-EFFECT x year1
-0.104 (0.253)
-0.017 (0.166)
-0.506*** (0.235)
0.021 (0.099)
AD-EFFECT x year 2
-0.282 (0.232)
-0.061 (0.152)
-0.344* (0.215)
-0.137* (0.092)
AD-Effect x year 3
-0.250 (0.238)
0.053 (0.156)
-0.298* (0.220)
-0.034 (0.094)
AD-EFFECT x year 4
-0.339 (0.237)
0.0147 (0.155)
-0.243 (0.211)
0.0006 (0.092)
AD-EFFECT x year 5
-0.325 (0.228)
0.018 (0.150)
-0.177 (0.211)
-0.064 (0.081)
Year Dummies Yes Yes Yes Yes Yes Yes Yes Yes Fixed Effects Yes Yes Yes Yes Yes Yes Yes Yes # observations 690 690 690 690 724 724 724 724
1ln _ _kt k kt ktExports AD EFFECT YEAR Dummies
Control group : products in Termination cases
Brixen, September 2009
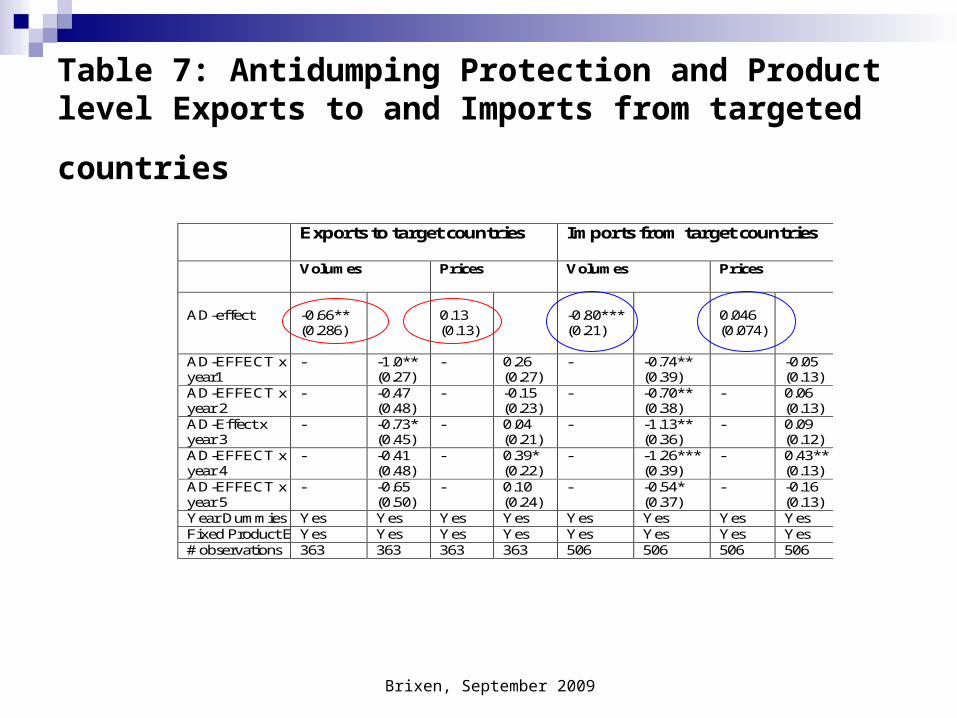
Table 7: Antidumping Protection and Product level
Exports to and Imports from targeted countries
Exports to target countries Imports from target countries
Volumes Prices Volumes Prices
AD-effect
-0.66** (0.286)
0.13 (0.13)
-0.80*** (0.21)
0.046 (0.074)
AD-EFFECT x year1
- -1.0** (0.27)
- 0.26 (0.27)
- -0.74** (0.39)
-0.05 (0.13)
AD-EFFECT x year 2
- -0.47 (0.48)
- -0.15 (0.23)
- -0.70** (0.38)
- 0.06 (0.13)
AD-Effect x year 3
- -0.73* (0.45)
- 0.04 (0.21)
- -1.13** (0.36)
- 0.09 (0.12)
AD-EFFECT x year 4
- -0.41 (0.48)
- 0.39* (0.22)
- -1.26*** (0.39)
- 0.43** (0.13)
AD-EFFECT x year 5
- -0.65 (0.50)
- 0.10 (0.24)
- -0.54* (0.37)
- -0.16 (0.13)
Year Dummies Yes Yes Yes Yes Yes Yes Yes Yes Fixed Product Effects Yes Yes Yes Yes Yes Yes Yes Yes # observations 363 363 363 363 506 506 506 506
Brixen, September 2009
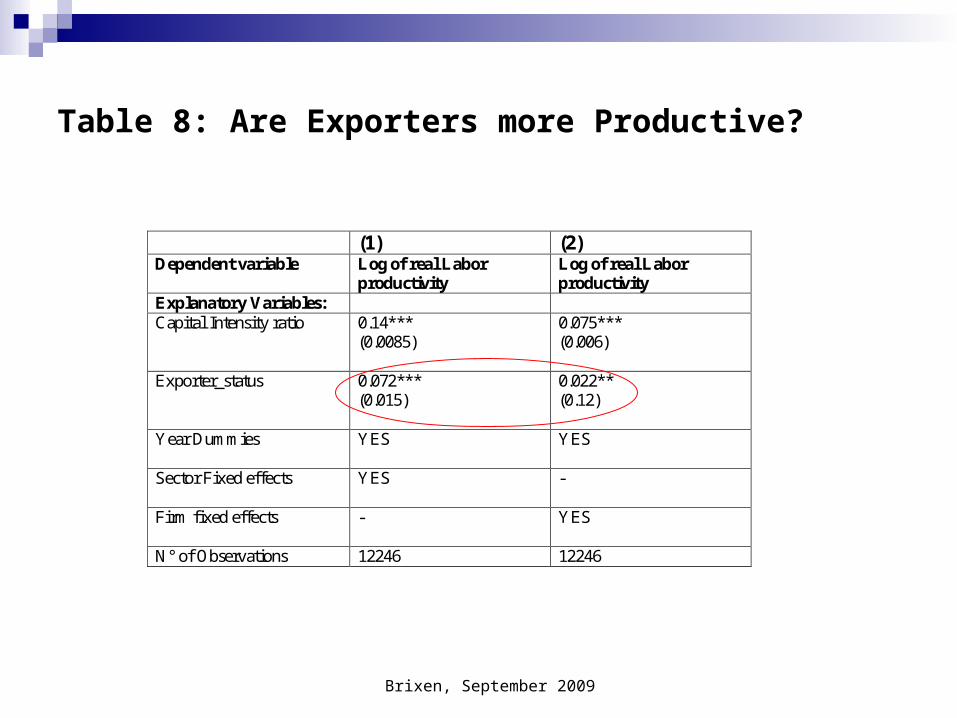
Table 8: Are Exporters more Productive?
(1) (2) Dependent variable Log of real Labor
productivity Log of real Labor productivity
Explanatory Variables: Capital Intensity ratio 0.14***
(0.0085) 0.075*** (0.006)
Exporter_status 0.072*** (0.015)
0.022** (0.12)
Year Dummies YES YES
Sector Fixed effects YES -
Firm fixed effects - YES
N° of Observations 12246 12246
Brixen, September 2009
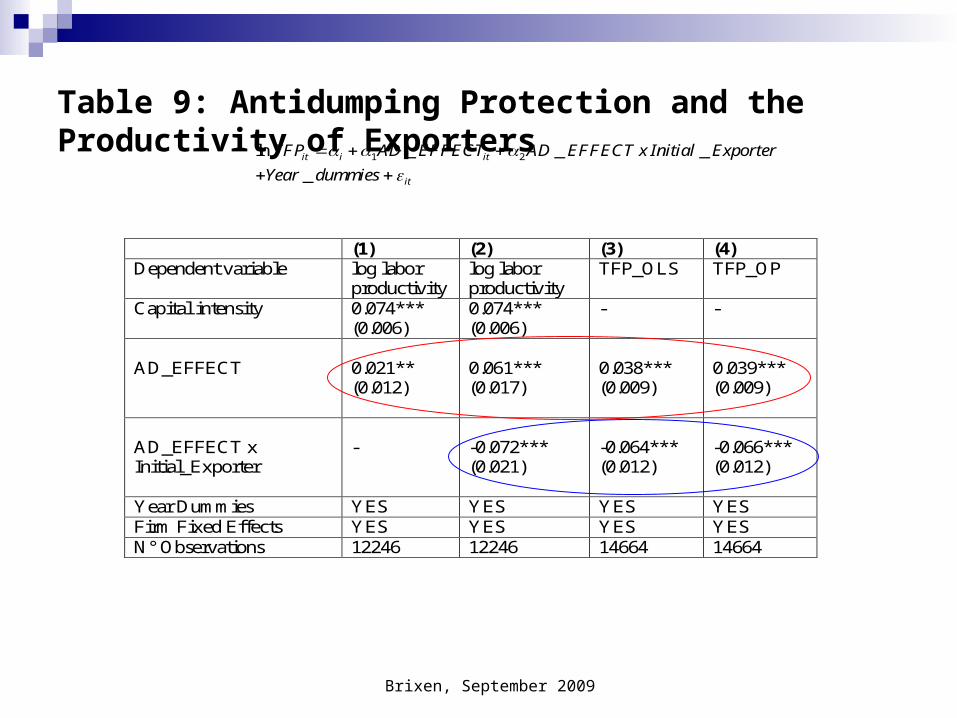
Table 9: Antidumping Protection and the Productivity of Exporters
(1) (2) (3) (4) Dependent variable log labor
productivity log labor productivity
TFP_OLS TFP_OP
Capital intensity 0.074*** (0.006)
0.074*** (0.006)
- -
AD_EFFECT
0.021** (0.012)
0.061*** (0.017)
0.038*** (0.009)
0.039*** (0.009)
AD_EFFECT x Initial_Exporter
-
-0.072*** (0.021)
-0.064*** (0.012)
-0.066*** (0.012)
Year Dummies YES YES YES YES Firm Fixed Effects YES YES YES YES N° Observations 12246 12246 14664 14664
1 2ln _ _ _
_it i it
it
TFP AD EFFECT AD EFFECT x Initial Exporter
Year dummies
Brixen, September 2009
Possible Explanations for productivity results
Production factors adjust slower than output reducing measured productivity
Non-exporters gain productivity due to increase in market size (Lileeva & Trefler, 2007)
De Loecker (2007), Van Biesebroeck (2005): when exporters have reduced market access abroad this reduces learning through exporting, which may explain the reduction in productivity for exporters
Brixen, September 2009
Conclusion AD protection raises market share of domestic non-exporters by 5% AD protection lowers firm-level exports on average by 8% AD protection lowers exports of “global firms” with affiliates outside
the EU by 24% AD protection lowers product-level exports by 36% on average
across export destinations AD protection lowers product-level exports to target countries by
66% AD protection raises the productivity of non-exporters AD protection lowers productivity of exporters
Brixen, September 2009
Conclusion