Embed Size (px)
Citation preview
Broadening horizonsHow do private equity investors create value? A joint study of private equity exits in Africa by AVCA and EY

Executive summary 4
Foreword 3
Exit activity and performance
6
Key findings• Entry multiples creeping upward
• Intermediated deals outperform proprietary transactions
• Local offices key to strong performance
• Organic revenue growth driving profit growth in PE portfolio
• More exit routes opening up
• Exit enablers in Africa
12
Outlook 20
About the study 22
Contacts 23
Contents
Africa’s remarkable momentum for growth continues, as does our ambition to provide investors with credible and trusted data on the African private equity and venture capital landscape. This research offers key information on the ways in which private capital creates value and delivers commercial returns, presenting practical, evidence-based indicators of what it takes to grow a portfolio company and to exit successfully in Africa.
Private capital acts as a catalyst for change in Africa. Our industry provides growth capital to private companies, creating jobs, sustaining economies, and providing stability
to an expanding and youthful population. We are proud to be a part of this essential ecosystem for growth, and are profoundly grateful to our members and supporting organizations, especially the South African Venture Capital and Private Equity Association, who have supported this important initiative.
We look forward to building upon this research to further equip the industry with the intelligence required to navigate the abundant opportunities present in Africa.
We are delighted to present the second annual study of private equity exits across Africa, in collaboration with EY.
Foreword
Michelle Kathryn Essomé African Private Equity and Venture Capital Association

4 How do private equity investors create value?
Executive summary
4 Broadening horizons: How do private equity investors create value?
A study of African exits 5
The contents of this second study back up our findings from 2013. We have collected more data over a longer time period, making our findings more statistically valid. While exits were down in 2013, between 2007 and 2013 we recorded a total of 207 realizations by African private equity fund managers for transactions with an entry enterprise value of at least US$1m. We have reinforced the view that the African PE industry is maturing fast and moving out of its infancy.
This is apparent in a number of ways. One of these is the broadening of exit routes over recent times, as sales to other PE houses now account for a far greater share of portfolio realizations than previously. While trade sales remain the key exit route — and among the most profitable for PE — the increasing options available to PE for exit will ensure PE in Africa can continue to realize value for its investors.
Allied to this is the good spread of exits across the continent. While the more developed South African market accounts for a large share of African exits, other regions, most notably West Africa, are seeing a high proportion of exits, demonstrating the industry’s expansion into less developed PE markets over recent years.
PE in Africa continues to provide outperformance for its investors over companies exited between 2007 and 2013. Our exit sample showed outperformance versus a number of benchmarks. Even more positively for the industry, our analysis shows that PE’s outperformance has increased for companies exited since 2011, attesting to the greater experience PE has gained and used to its advantage since the early years of investing in Africa.
As the industry has grown, we have found evidence of increasing entry enterprise values (entry EV), particularly at the larger end of the deal spectrum where deals are fewer and competition is therefore greater. And in a further sign of a maturing industry, auctions are steadily becoming more prevalent.
This is the second of our annual studies of how private equity (PE) investors create value in Africa. In our inaugural report, we countered popular opinion about PE in Africa to prove that the industry was making excellent progress in exiting its portfolio companies. We also provided evidence of genuine value creation by PE firms in the region through hands-on involvement in the companies they back.
As with other regions of the world where we have conducted these studies, we have found evidence consistent with PE’s ability to create value in the companies it backs as the main driver of its outperformance. In Africa, PE’s value-creating capability shows clear evidence of evolution. Our finding that exits generated in more recent years through investments managed by local offices outperform those managed regionally or from further afield, and that their holding periods are shorter, demonstrate that hands-on involvement with portfolio companies really makes a difference.
In addition, the development of African PE’s value creation levers is continuing. While the largest component of organic revenue growth remains sector growth — validating PE’s time spent carefully selecting investment prospects — there are signs that performance improvement measures, such as changing a company’s offering or developing new products, are becoming more important drivers of growth than was the case in the industry’s early years on the continent.
Overall, the study paints a picture of an industry that is developing fast but in a measured way. Exit numbers were down in 2013, but the pipeline is filling up as investments made over more recent years become ready for sale. As these exits start to come through and as exit routes continue to develop, we’d expect further evidence to emerge of African PE’s value-creating credentials. Home to fast-growing economies and more stable political environments, Africa has highly apparent attractions for PE investors; for its part, our study shows that PE is working in close partnership with portfolio company management to support their growth and take them to the next stage of their development. African PE is moving to a new phase of maturity.
A joint study of private equity exits in Africa by AVCA and EY 5

6 Broadening horizons: How do private equity investors create value?
Exit activity and performance
6 Broadening horizons: How do private equity investors create value?
A joint study of private equity exits in Africa by AVCA and EY 7
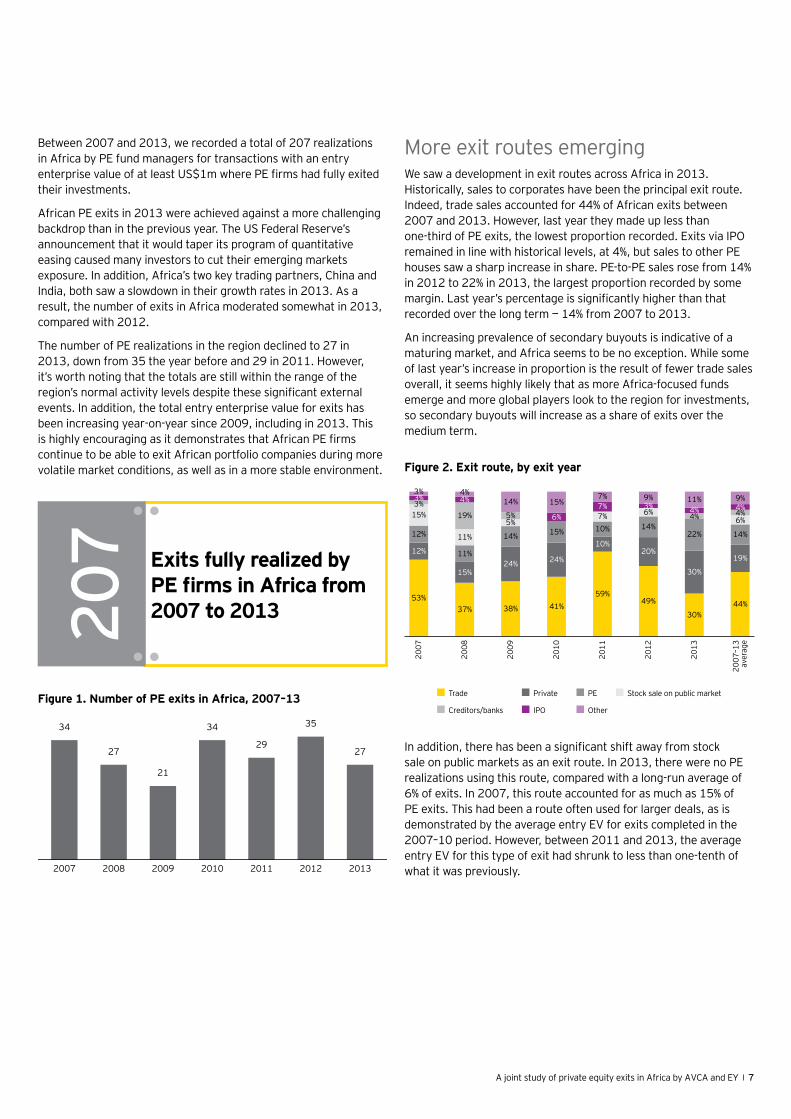
More exit routes emerging We saw a development in exit routes across Africa in 2013. Historically, sales to corporates have been the principal exit route. Indeed, trade sales accounted for 44% of African exits between 2007 and 2013. However, last year they made up less than one-third of PE exits, the lowest proportion recorded. Exits via IPO remained in line with historical levels, at 4%, but sales to other PE houses saw a sharp increase in share. PE-to-PE sales rose from 14% in 2012 to 22% in 2013, the largest proportion recorded by some margin. Last year’s percentage is significantly higher than that recorded over the long term — 14% from 2007 to 2013.
An increasing prevalence of secondary buyouts is indicative of a maturing market, and Africa seems to be no exception. While some of last year’s increase in proportion is the result of fewer trade sales overall, it seems highly likely that as more Africa-focused funds emerge and more global players look to the region for investments, so secondary buyouts will increase as a share of exits over the medium term.
Between 2007 and 2013, we recorded a total of 207 realizations in Africa by PE fund managers for transactions with an entry enterprise value of at least US$1m where PE firms had fully exited their investments.
African PE exits in 2013 were achieved against a more challenging backdrop than in the previous year. The US Federal Reserve’s announcement that it would taper its program of quantitative easing caused many investors to cut their emerging markets exposure. In addition, Africa’s two key trading partners, China and India, both saw a slowdown in their growth rates in 2013. As a result, the number of exits in Africa moderated somewhat in 2013, compared with 2012.
The number of PE realizations in the region declined to 27 in 2013, down from 35 the year before and 29 in 2011. However, it’s worth noting that the totals are still within the range of the region’s normal activity levels despite these significant external events. In addition, the total entry enterprise value for exits has been increasing year-on-year since 2009, including in 2013. This is highly encouraging as it demonstrates that African PE firms continue to be able to exit African portfolio companies during more volatile market conditions, as well as in a more stable environment.
In addition, there has been a significant shift away from stock sale on public markets as an exit route. In 2013, there were no PE realizations using this route, compared with a long-run average of 6% of exits. In 2007, this route accounted for as much as 15% of PE exits. This had been a route often used for larger deals, as is demonstrated by the average entry EV for exits completed in the 2007–10 period. However, between 2011 and 2013, the average entry EV for this type of exit had shrunk to less than one-tenth of what it was previously.
Exits fully realized by PE firms in Africa from 2007 to 201320
7
Figure 1. Number of PE exits in Africa, 2007–13
34
2007
27
2008
21
2009
34
2010
29
2011
35
2012
27
2013
Population
Figure 2. Exit route, by exit year
53%
12%
12%
15%3%3%3%
2007
37%
15%
11%
11%
19%
4%4%
2008
38%
24%
14%
5%5%
14%20
09
41%
24%
15%
6%
15%
2010
59%
10%
10%7%7%7%
2011
49%
20%
14%
6%3%9%
2012
30%
30%
22%
4%4%
11%
2013
44%
19%
14%
6%4%4%9%
2007
–13
aver
age
Trade Private PE Stock sale on public market
Creditors/banks IPO Other
8 Broadening horizons: How do private equity investors create value?
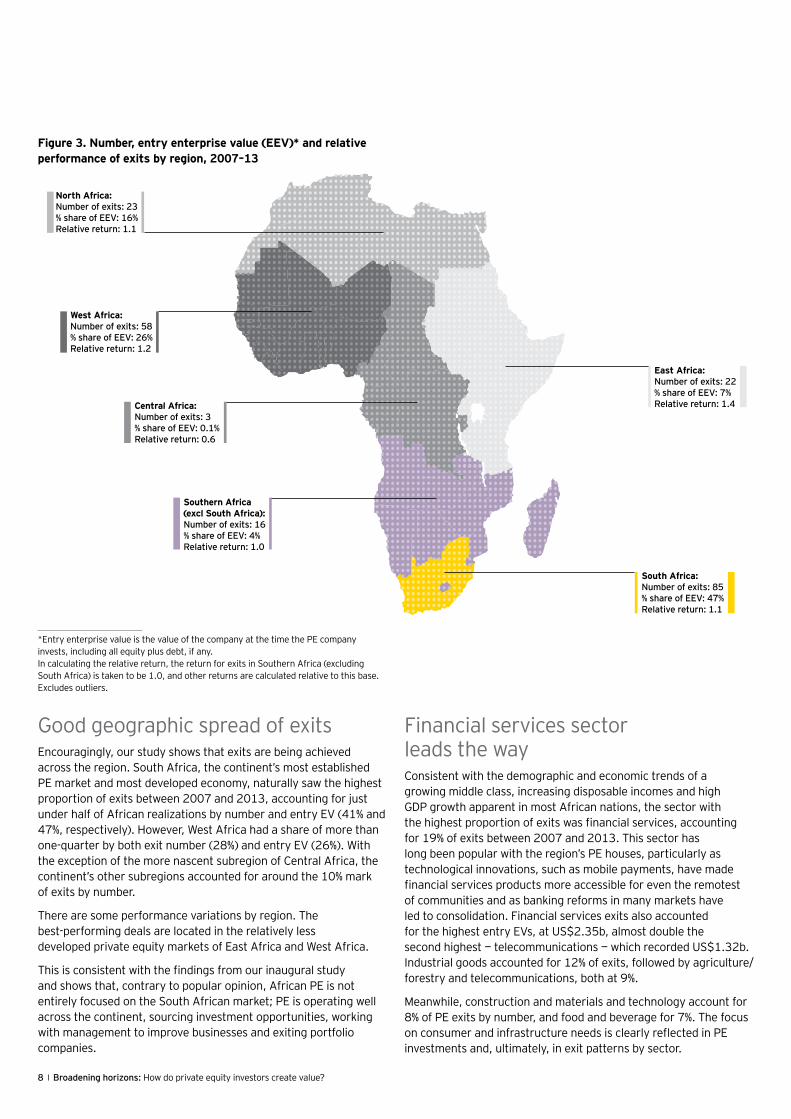
Figure 3. Number, entry enterprise value (EEV)* and relative performance of exits by region, 2007–13
*Entry enterprise value is the value of the company at the time the PE company invests, including all equity plus debt, if any. In calculating the relative return, the return for exits in Southern Africa (excluding South Africa) is taken to be 1.0, and other returns are calculated relative to this base. Excludes outliers.
North Africa:Number of exits: 23% share of EEV: 16%Relative return: 1.1
West Africa:Number of exits: 58% share of EEV: 26%Relative return: 1.2
South Africa:Number of exits: 85% share of EEV: 47%Relative return: 1.1
East Africa:Number of exits: 22% share of EEV: 7%Relative return: 1.4Central Africa:
Number of exits: 3% share of EEV: 0.1%Relative return: 0.6
Southern Africa(excl South Africa):Number of exits: 16% share of EEV: 4%Relative return: 1.0
Good geographic spread of exitsEncouragingly, our study shows that exits are being achieved across the region. South Africa, the continent’s most established PE market and most developed economy, naturally saw the highest proportion of exits between 2007 and 2013, accounting for just under half of African realizations by number and entry EV (41% and 47%, respectively). However, West Africa had a share of more than one-quarter by both exit number (28%) and entry EV (26%). With the exception of the more nascent subregion of Central Africa, the continent’s other subregions accounted for around the 10% mark of exits by number.
There are some performance variations by region. The best-performing deals are located in the relatively less developed private equity markets of East Africa and West Africa.
This is consistent with the findings from our inaugural study and shows that, contrary to popular opinion, African PE is not entirely focused on the South African market; PE is operating well across the continent, sourcing investment opportunities, working with management to improve businesses and exiting portfolio companies.
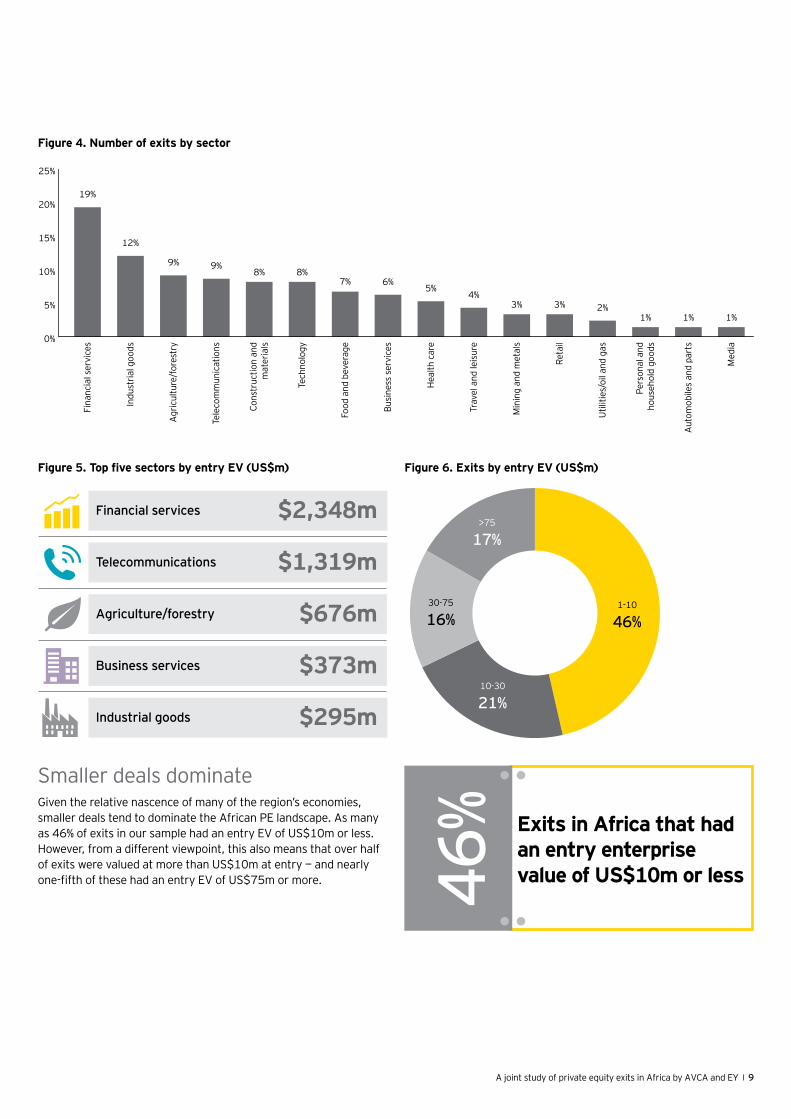
Financial services sector leads the wayConsistent with the demographic and economic trends of a growing middle class, increasing disposable incomes and high GDP growth apparent in most African nations, the sector with the highest proportion of exits was financial services, accounting for 19% of exits between 2007 and 2013. This sector has long been popular with the region’s PE houses, particularly as technological innovations, such as mobile payments, have made financial services products more accessible for even the remotest of communities and as banking reforms in many markets have led to consolidation. Financial services exits also accounted for the highest entry EVs, at US$2.35b, almost double the second highest — telecommunications — which recorded US$1.32b. Industrial goods accounted for 12% of exits, followed by agriculture/forestry and telecommunications, both at 9%.
Meanwhile, construction and materials and technology account for 8% of PE exits by number, and food and beverage for 7%. The focus on consumer and infrastructure needs is clearly reflected in PE investments and, ultimately, in exit patterns by sector.
A joint study of private equity exits in Africa by AVCA and EY 9
Smaller deals dominateGiven the relative nascence of many of the region’s economies, smaller deals tend to dominate the African PE landscape. As many as 46% of exits in our sample had an entry EV of US$10m or less. However, from a different viewpoint, this also means that over half of exits were valued at more than US$10m at entry — and nearly one-fifth of these had an entry EV of US$75m or more.
Figure 4. Number of exits by sector
19%
12%
9% 9%8% 8%
7% 6%5%
4%3% 3% 2%
1% 1% 1%
0%
5%
10%
15%
20%
25%
Fina
ncia
l ser
vice
s
Indu
stria
l goo
ds
Agr
icul
ture
/for
estr
y
Tele
com
mun
icat
ions
Cons
truc
tion
and
mat
eria
ls
Tech
nolo
gy
Food
and
bev
erag
e
Busi
ness
ser
vice
s
Hea
lth c
are
Trav
el a
nd le
isur
e
Min
ing
and
met
als
Reta
il
Util
ities
/oil
and
gas
Pers
onal
and
hous
ehol
d go
ods
Aut
omob
iles
and
part
s
Med
ia
Figure 5. Top five sectors by entry EV (US$m) Figure 6. Exits by entry EV (US$m)
1-10
46%30-75
16%
10-30
21%
>75
17%Telecommunications $1,319m
Agriculture/forestry $676m
Business services $373m
Industrial goods $295m
Financial services $2,348m
Exits in Africa that had an entry enterprise value of US$10m or less46
%
10 Broadening horizons: How do private equity investors create value?
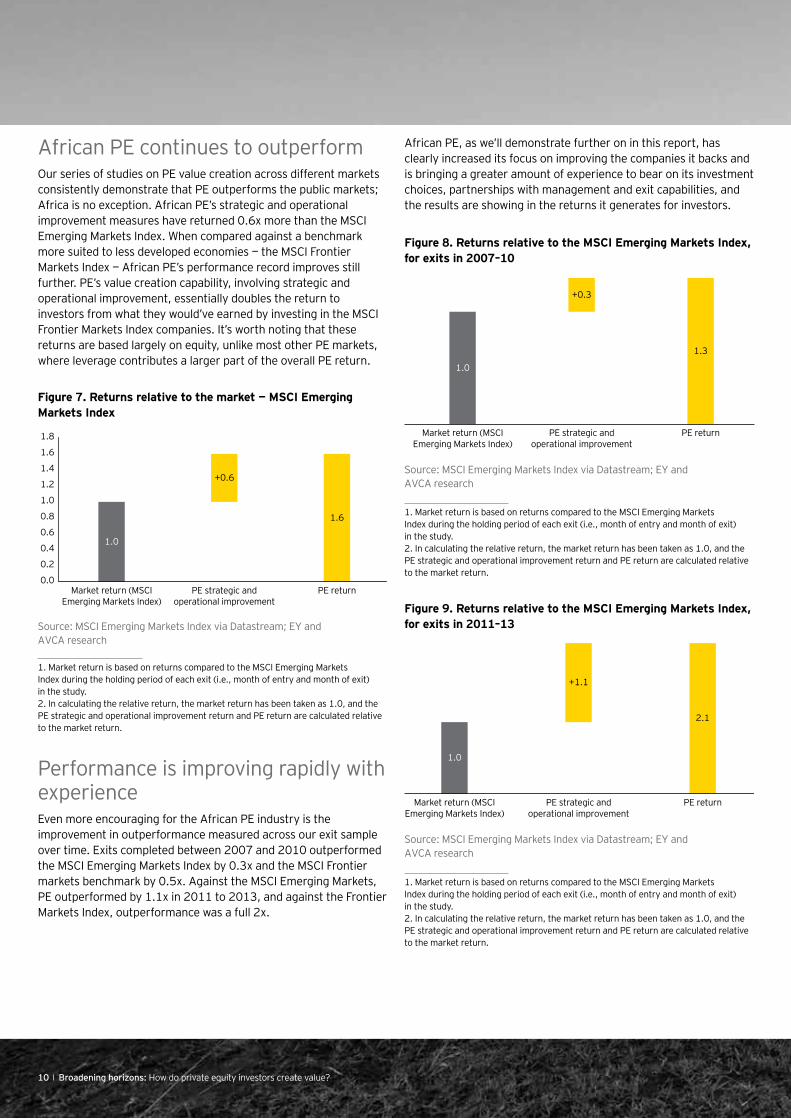
Performance is improving rapidly with experienceEven more encouraging for the African PE industry is the improvement in outperformance measured across our exit sample over time. Exits completed between 2007 and 2010 outperformed the MSCI Emerging Markets Index by 0.3x and the MSCI Frontier markets benchmark by 0.5x. Against the MSCI Emerging Markets, PE outperformed by 1.1x in 2011 to 2013, and against the Frontier Markets Index, outperformance was a full 2x.
African PE continues to outperformOur series of studies on PE value creation across different markets consistently demonstrate that PE outperforms the public markets; Africa is no exception. African PE’s strategic and operational improvement measures have returned 0.6x more than the MSCI Emerging Markets Index. When compared against a benchmark more suited to less developed economies — the MSCI Frontier Markets Index — African PE’s performance record improves still further. PE’s value creation capability, involving strategic and operational improvement, essentially doubles the return to investors from what they would’ve earned by investing in the MSCI Frontier Markets Index companies. It’s worth noting that these returns are based largely on equity, unlike most other PE markets, where leverage contributes a larger part of the overall PE return.
Figure 7. Returns relative to the market — MSCI Emerging Markets Index
Source: MSCI Emerging Markets Index via Datastream; EY and AVCA research
1. Market return is based on returns compared to the MSCI Emerging Markets Index during the holding period of each exit (i.e., month of entry and month of exit) in the study. 2. In calculating the relative return, the market return has been taken as 1.0, and the PE strategic and operational improvement return and PE return are calculated relative to the market return.
African PE, as we’ll demonstrate further on in this report, has clearly increased its focus on improving the companies it backs and is bringing a greater amount of experience to bear on its investment choices, partnerships with management and exit capabilities, and the results are showing in the returns it generates for investors.
0.0
0.2
0.4
0.6
0.8
1.0
1.2
1.4
1.6
1.8
1.0
+0.6
Market return (MSCIEmerging Markets Index)
PE strategic andoperational improvement
PE return
1.6
Figure 8. Returns relative to the MSCI Emerging Markets Index, for exits in 2007–10
Source: MSCI Emerging Markets Index via Datastream; EY and AVCA research
1. Market return is based on returns compared to the MSCI Emerging Markets Index during the holding period of each exit (i.e., month of entry and month of exit) in the study. 2. In calculating the relative return, the market return has been taken as 1.0, and the PE strategic and operational improvement return and PE return are calculated relative to the market return.
1. Market return is based on returns compared to the MSCI Emerging Markets Index during the holding period of each exit (i.e., month of entry and month of exit) in the study. 2. In calculating the relative return, the market return has been taken as 1.0, and the PE strategic and operational improvement return and PE return are calculated relative to the market return.
Figure 9. Returns relative to the MSCI Emerging Markets Index, for exits in 2011–13
Source: MSCI Emerging Markets Index via Datastream; EY and AVCA research
1.0
+0.3
Market return (MSCIEmerging Markets Index)
PE strategic andoperational improvement
PE return
1.3
1.0
+1.1
Market return (MSCIEmerging Markets Index)
PE strategic andoperational improvement
PE return
2.1
10 Broadening horizons: How do private equity investors create value?
A joint study of private equity exits in Africa by AVCA and EY 11
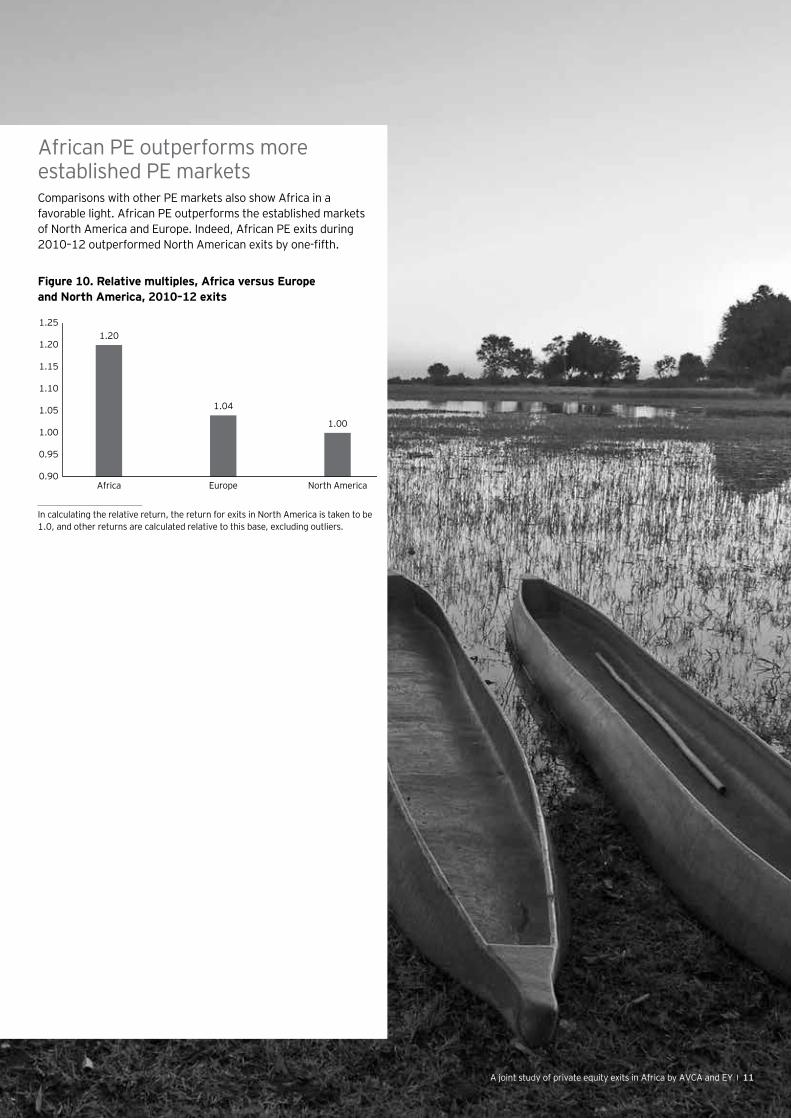
African PE outperforms more established PE marketsComparisons with other PE markets also show Africa in a favorable light. African PE outperforms the established markets of North America and Europe. Indeed, African PE exits during 2010–12 outperformed North American exits by one-fifth.
Figure 10. Relative multiples, Africa versus Europe and North America, 2010–12 exits
In calculating the relative return, the return for exits in North America is taken to be 1.0, and other returns are calculated relative to this base, excluding outliers.
0.90
0.95
1.00
1.05
1.10
1.15
1.20
1.251.20
1.04
1.00
Africa Europe North America
A joint study of private equity exits in Africa by AVCA and EY 11

12 Broadening horizons: How do private equity investors create value?
Key findings
12 Broadening horizons: How do private equity investors create value?
A joint study of private equity exits in Africa by AVCA and EY 13
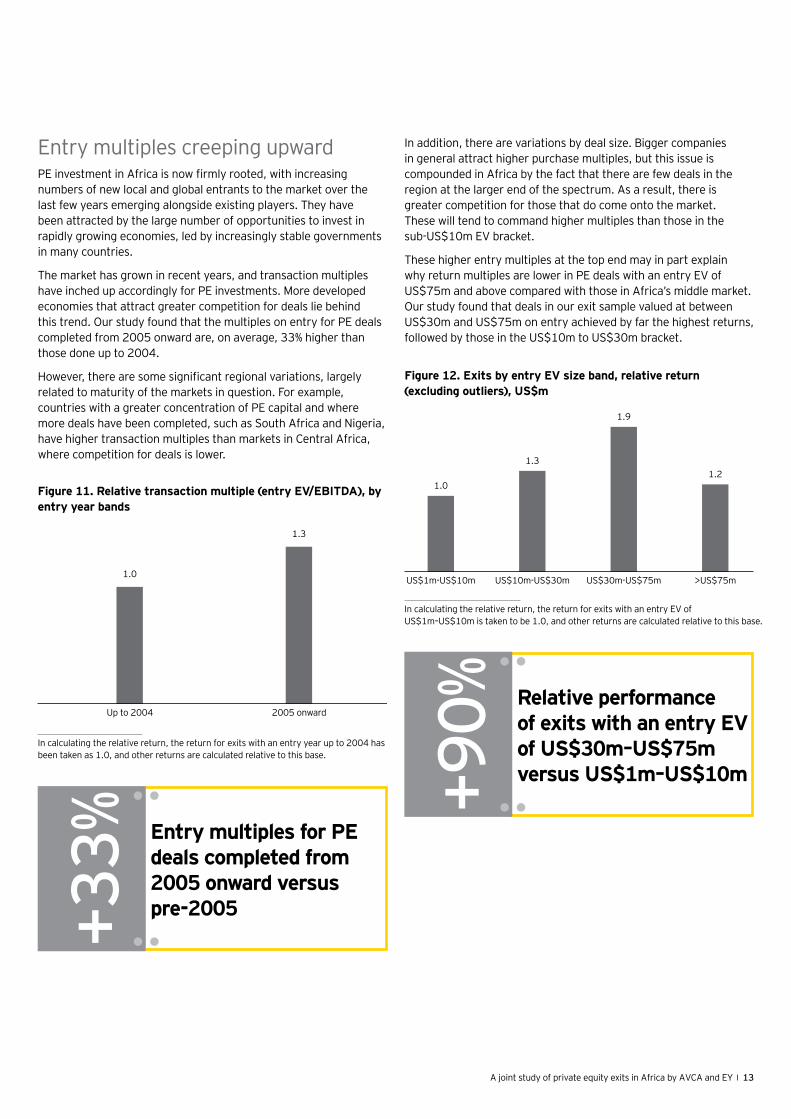
Entry multiples creeping upwardPE investment in Africa is now firmly rooted, with increasing numbers of new local and global entrants to the market over the last few years emerging alongside existing players. They have been attracted by the large number of opportunities to invest in rapidly growing economies, led by increasingly stable governments in many countries.
The market has grown in recent years, and transaction multiples have inched up accordingly for PE investments. More developed economies that attract greater competition for deals lie behind this trend. Our study found that the multiples on entry for PE deals completed from 2005 onward are, on average, 33% higher than those done up to 2004.
However, there are some significant regional variations, largely related to maturity of the markets in question. For example, countries with a greater concentration of PE capital and where more deals have been completed, such as South Africa and Nigeria, have higher transaction multiples than markets in Central Africa, where competition for deals is lower.
In addition, there are variations by deal size. Bigger companies in general attract higher purchase multiples, but this issue is compounded in Africa by the fact that there are few deals in the region at the larger end of the spectrum. As a result, there is greater competition for those that do come onto the market. These will tend to command higher multiples than those in the sub-US$10m EV bracket.
These higher entry multiples at the top end may in part explain why return multiples are lower in PE deals with an entry EV of US$75m and above compared with those in Africa’s middle market. Our study found that deals in our exit sample valued at between US$30m and US$75m on entry achieved by far the highest returns, followed by those in the US$10m to US$30m bracket.
In calculating the relative return, the return for exits with an entry year up to 2004 has been taken as 1.0, and other returns are calculated relative to this base.
Figure 11. Relative transaction multiple (entry EV/EBITDA), by entry year bands
1.0
1.3
Up to 2004 2005 onward
Figure 12. Exits by entry EV size band, relative return (excluding outliers), US$m
In calculating the relative return, the return for exits with an entry EV of US$1m–US$10m is taken to be 1.0, and other returns are calculated relative to this base.
1.0
1.3
1.9
1.2
US$1m-US$10m US$10m-US$30m US$30m-US$75m >US$75m
Entry multiples for PE deals completed from 2005 onward versus pre-2005+3
3%
Relative performance of exits with an entry EV of US$30m–US$75m versus US$1m–US$10m+9
0%
14 Broadening horizons: How do private equity investors create value?
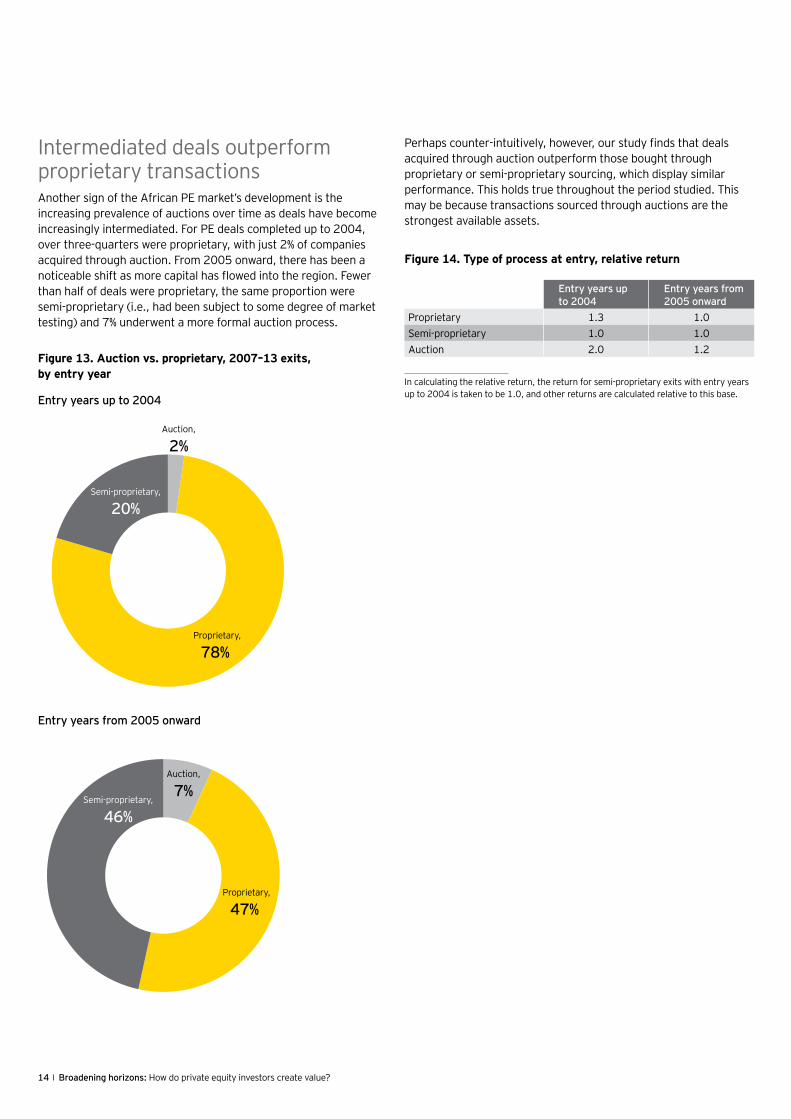
Intermediated deals outperform proprietary transactionsAnother sign of the African PE market’s development is the increasing prevalence of auctions over time as deals have become increasingly intermediated. For PE deals completed up to 2004, over three-quarters were proprietary, with just 2% of companies acquired through auction. From 2005 onward, there has been a noticeable shift as more capital has flowed into the region. Fewer than half of deals were proprietary, the same proportion were semi-proprietary (i.e., had been subject to some degree of market testing) and 7% underwent a more formal auction process.
Perhaps counter-intuitively, however, our study finds that deals acquired through auction outperform those bought through proprietary or semi-proprietary sourcing, which display similar performance. This holds true throughout the period studied. This may be because transactions sourced through auctions are the strongest available assets.
Figure 14. Type of process at entry, relative return
In calculating the relative return, the return for semi-proprietary exits with entry years up to 2004 is taken to be 1.0, and other returns are calculated relative to this base.
Entry years up to 2004
Entry years from 2005 onward
Proprietary 1.3 1.0Semi-proprietary 1.0 1.0Auction 2.0 1.2
Figure 13. Auction vs. proprietary, 2007–13 exits, by entry year
Entry years up to 2004
Entry years from 2005 onward
Semi-proprietary,
46%
Auction,
7%
Proprietary,
47%
Auction,
2%
Proprietary,
78%
Semi-proprietary,
20%
A joint study of private equity exits in Africa by AVCA and EY 15
Case study 1
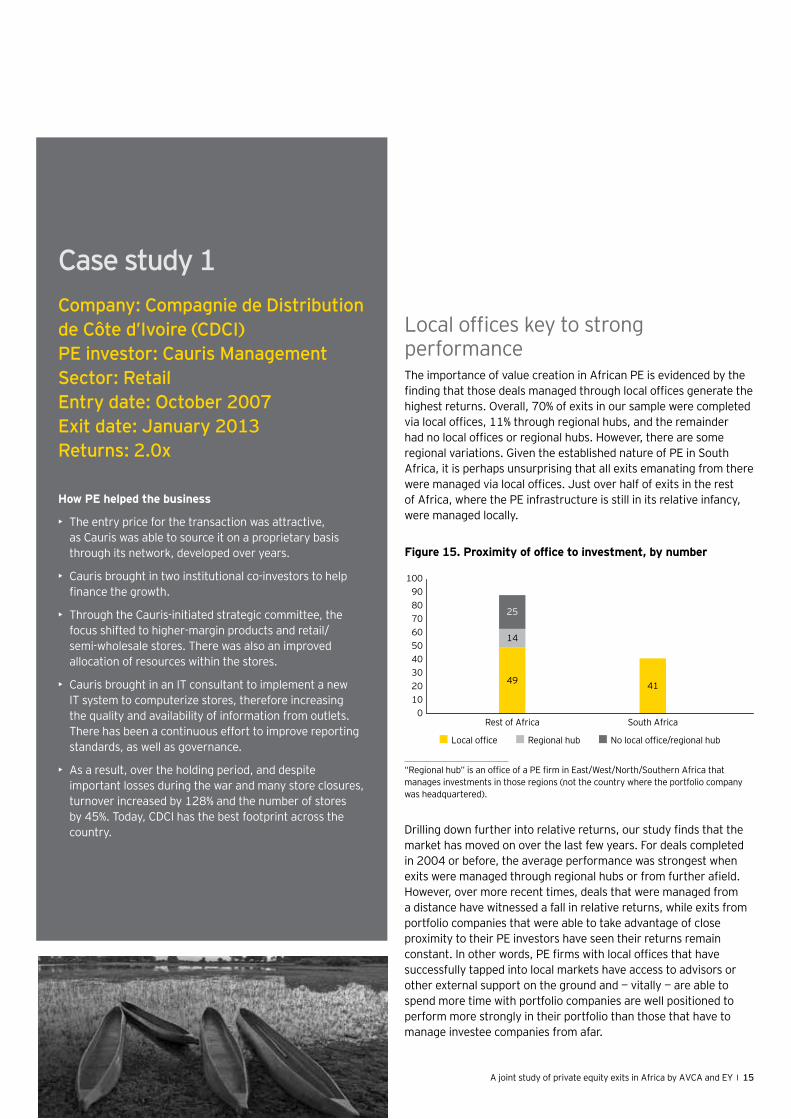
Local offices key to strong performanceThe importance of value creation in African PE is evidenced by the finding that those deals managed through local offices generate the highest returns. Overall, 70% of exits in our sample were completed via local offices, 11% through regional hubs, and the remainder had no local offices or regional hubs. However, there are some regional variations. Given the established nature of PE in South Africa, it is perhaps unsurprising that all exits emanating from there were managed via local offices. Just over half of exits in the rest of Africa, where the PE infrastructure is still in its relative infancy, were managed locally.
Drilling down further into relative returns, our study finds that the market has moved on over the last few years. For deals completed in 2004 or before, the average performance was strongest when exits were managed through regional hubs or from further afield. However, over more recent times, deals that were managed from a distance have witnessed a fall in relative returns, while exits from portfolio companies that were able to take advantage of close proximity to their PE investors have seen their returns remain constant. In other words, PE firms with local offices that have successfully tapped into local markets have access to advisors or other external support on the ground and — vitally — are able to spend more time with portfolio companies are well positioned to perform more strongly in their portfolio than those that have to manage investee companies from afar.
Figure 15. Proximity of office to investment, by number
“Regional hub” is an office of a PE firm in East/West/North/Southern Africa that manages investments in those regions (not the country where the portfolio company was headquartered).
Local office Regional hub No local office/regional hub
0102030405060708090
100
49
14
25
41
Rest of Africa South Africa
Company: Compagnie de Distribution de Côte d’Ivoire (CDCI) PE investor: Cauris Management Sector: Retail Entry date: October 2007 Exit date: January 2013 Returns: 2.0x
How PE helped the business
• The entry price for the transaction was attractive, as Cauris was able to source it on a proprietary basis through its network, developed over years.
• Cauris brought in two institutional co-investors to help finance the growth.
• Through the Cauris-initiated strategic committee, the focus shifted to higher-margin products and retail/ semi-wholesale stores. There was also an improved allocation of resources within the stores.
• Cauris brought in an IT consultant to implement a new IT system to computerize stores, therefore increasing the quality and availability of information from outlets. There has been a continuous effort to improve reporting standards, as well as governance.
• As a result, over the holding period, and despite important losses during the war and many store closures, turnover increased by 128% and the number of stores by 45%. Today, CDCI has the best footprint across the country.
16 Broadening horizons: How do private equity investors create value?
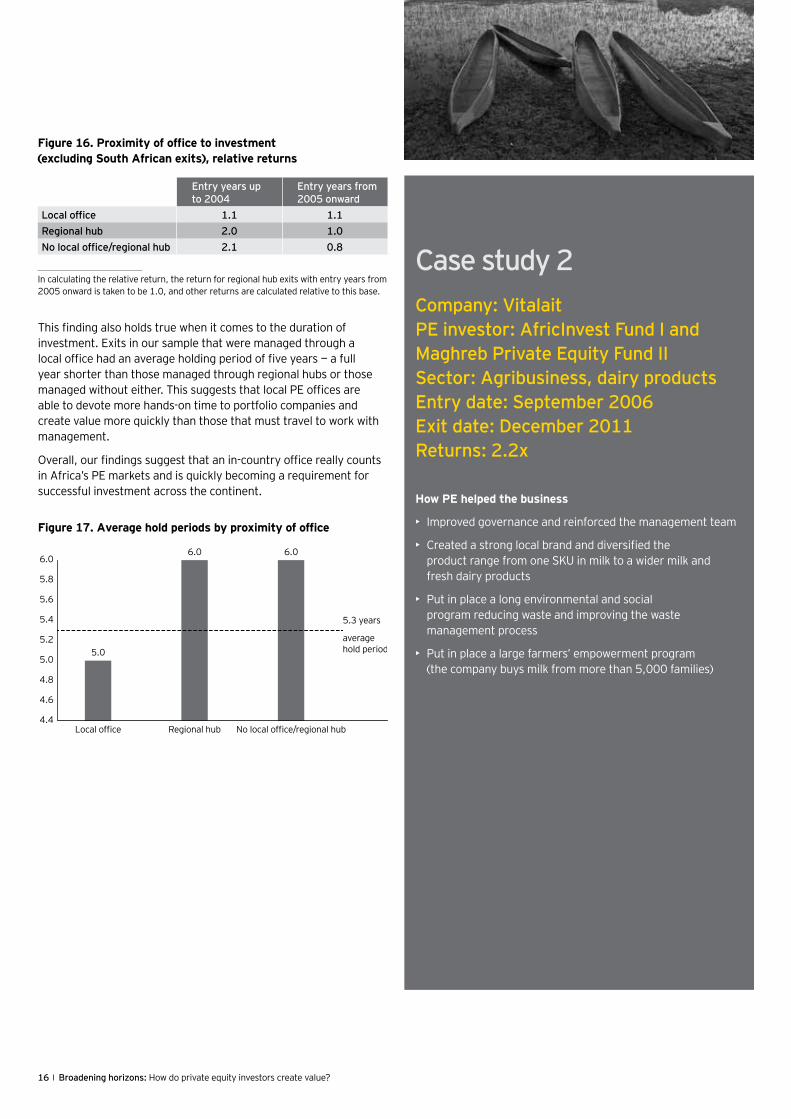
Figure 16. Proximity of office to investment (excluding South African exits), relative returns
In calculating the relative return, the return for regional hub exits with entry years from 2005 onward is taken to be 1.0, and other returns are calculated relative to this base.
This finding also holds true when it comes to the duration of investment. Exits in our sample that were managed through a local office had an average holding period of five years — a full year shorter than those managed through regional hubs or those managed without either. This suggests that local PE offices are able to devote more hands-on time to portfolio companies and create value more quickly than those that must travel to work with management.
Overall, our findings suggest that an in-country office really counts in Africa’s PE markets and is quickly becoming a requirement for successful investment across the continent.
Figure 17. Average hold periods by proximity of office
Entry years up to 2004
Entry years from 2005 onward
Local office 1.1 1.1Regional hub 2.0 1.0No local office/regional hub 2.1 0.8
4.4
4.6
4.8
5.0
5.2
5.4 5.3 years
averagehold period
5.6
5.8
6.0
5.0
Local office
6.0
Regional hub
6.0
No local office/regional hub
Case study 2Company: Vitalait PE investor: AfricInvest Fund I and Maghreb Private Equity Fund II Sector: Agribusiness, dairy products Entry date: September 2006 Exit date: December 2011 Returns: 2.2x
How PE helped the business
• Improved governance and reinforced the management team
• Created a strong local brand and diversified the product range from one SKU in milk to a wider milk and fresh dairy products
• Put in place a long environmental and social program reducing waste and improving the waste management process
• Put in place a large farmers’ empowerment program (the company buys milk from more than 5,000 families)
A joint study of private equity exits in Africa by AVCA and EY 17
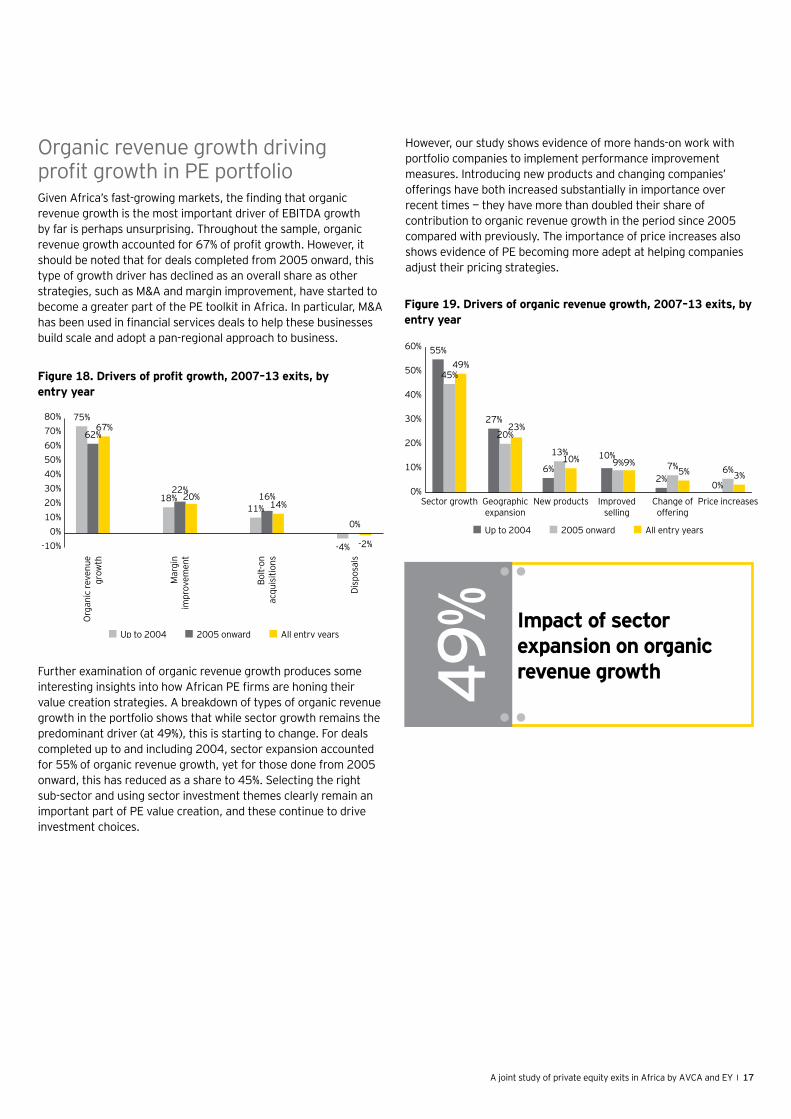
Organic revenue growth driving profit growth in PE portfolioGiven Africa’s fast-growing markets, the finding that organic revenue growth is the most important driver of EBITDA growth by far is perhaps unsurprising. Throughout the sample, organic revenue growth accounted for 67% of profit growth. However, it should be noted that for deals completed from 2005 onward, this type of growth driver has declined as an overall share as other strategies, such as M&A and margin improvement, have started to become a greater part of the PE toolkit in Africa. In particular, M&A has been used in financial services deals to help these businesses build scale and adopt a pan-regional approach to business.
Further examination of organic revenue growth produces some interesting insights into how African PE firms are honing their value creation strategies. A breakdown of types of organic revenue growth in the portfolio shows that while sector growth remains the predominant driver (at 49%), this is starting to change. For deals completed up to and including 2004, sector expansion accounted for 55% of organic revenue growth, yet for those done from 2005 onward, this has reduced as a share to 45%. Selecting the right sub-sector and using sector investment themes clearly remain an important part of PE value creation, and these continue to drive investment choices.
Figure 18. Drivers of profit growth, 2007–13 exits, by entry year
Figure 19. Drivers of organic revenue growth, 2007–13 exits, by entry year
Up to 2004 2005 onward All entry years
55%
45%49%
0%
6%3%
0%
10%
20%
30%
40%
50%
60%
Sector growth Geographicexpansion
New products Improvedselling
Change ofoffering
Price increases
27%20%
23%
6%
13%10% 10%
9%9%
2%7%5%
However, our study shows evidence of more hands-on work with portfolio companies to implement performance improvement measures. Introducing new products and changing companies’ offerings have both increased substantially in importance over recent times — they have more than doubled their share of contribution to organic revenue growth in the period since 2005 compared with previously. The importance of price increases also shows evidence of PE becoming more adept at helping companies adjust their pricing strategies.
Up to 2004 2005 onward All entry years
-10%0%
10%20%30%40%50%60%70%80%
18%22%
20%11%
16%14%
-4%
0%
-2%
Mar
gin
impr
ovem
ent
Bolt-
onac
quis
ition
s
Disp
osal
s
Org
anic
reve
nue
grow
th
75%67%
62%
Impact of sector expansion on organic revenue growth49
%
18 Broadening horizons: How do private equity investors create value?
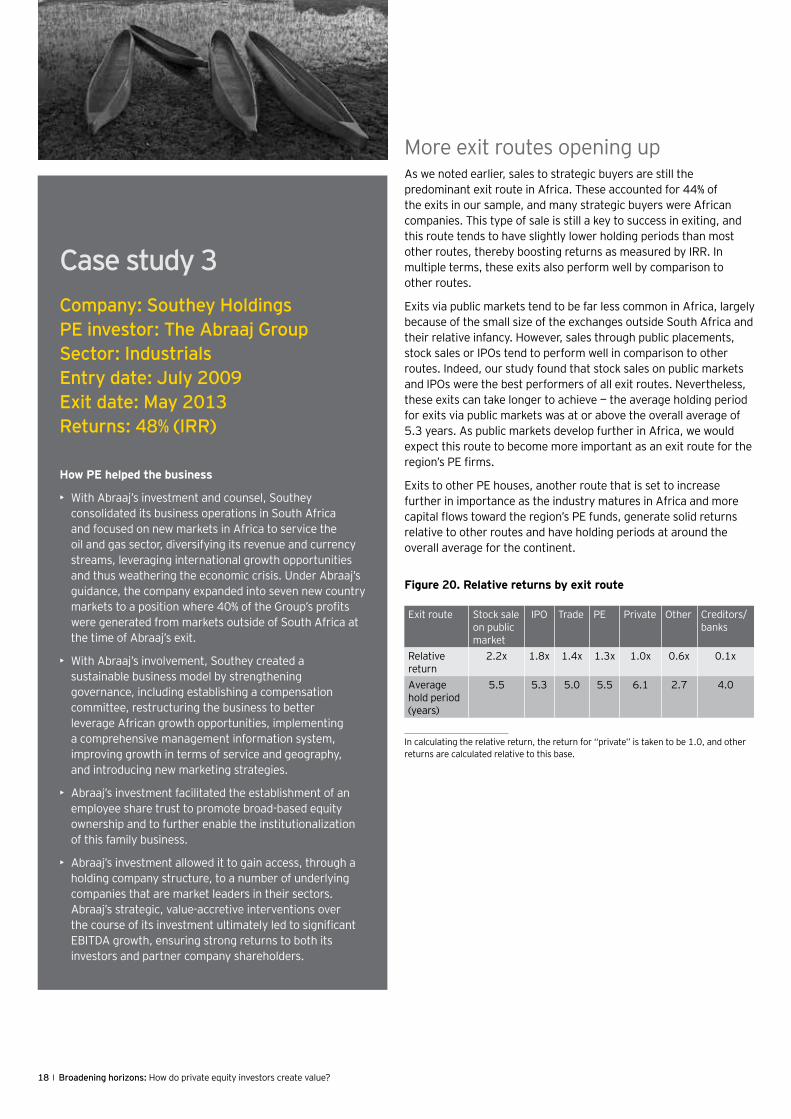
More exit routes opening upAs we noted earlier, sales to strategic buyers are still the predominant exit route in Africa. These accounted for 44% of the exits in our sample, and many strategic buyers were African companies. This type of sale is still a key to success in exiting, and this route tends to have slightly lower holding periods than most other routes, thereby boosting returns as measured by IRR. In multiple terms, these exits also perform well by comparison to other routes.
Exits via public markets tend to be far less common in Africa, largely because of the small size of the exchanges outside South Africa and their relative infancy. However, sales through public placements, stock sales or IPOs tend to perform well in comparison to other routes. Indeed, our study found that stock sales on public markets and IPOs were the best performers of all exit routes. Nevertheless, these exits can take longer to achieve — the average holding period for exits via public markets was at or above the overall average of 5.3 years. As public markets develop further in Africa, we would expect this route to become more important as an exit route for the region’s PE firms.
Exits to other PE houses, another route that is set to increase further in importance as the industry matures in Africa and more capital flows toward the region’s PE funds, generate solid returns relative to other routes and have holding periods at around the overall average for the continent.
Figure 20. Relative returns by exit route
In calculating the relative return, the return for ‘‘private’’ is taken to be 1.0, and other returns are calculated relative to this base.
Exit route Stock sale on public market
IPO Trade PE Private Other Creditors/banks
Relative return
2.2x 1.8x 1.4x 1.3x 1.0x 0.6x 0.1x
Average hold period (years)
5.5 5.3 5.0 5.5 6.1 2.7 4.0
Case study 3Company: Southey Holdings PE investor: The Abraaj Group Sector: Industrials Entry date: July 2009 Exit date: May 2013 Returns: 48% (IRR)
How PE helped the business
• With Abraaj’s investment and counsel, Southey consolidated its business operations in South Africa and focused on new markets in Africa to service the oil and gas sector, diversifying its revenue and currency streams, leveraging international growth opportunities and thus weathering the economic crisis. Under Abraaj’s guidance, the company expanded into seven new country markets to a position where 40% of the Group’s profits were generated from markets outside of South Africa at the time of Abraaj’s exit.
• With Abraaj’s involvement, Southey created a sustainable business model by strengthening governance, including establishing a compensation committee, restructuring the business to better leverage African growth opportunities, implementing a comprehensive management information system, improving growth in terms of service and geography, and introducing new marketing strategies.
• Abraaj’s investment facilitated the establishment of an employee share trust to promote broad-based equity ownership and to further enable the institutionalization of this family business.
• Abraaj’s investment allowed it to gain access, through a holding company structure, to a number of underlying companies that are market leaders in their sectors. Abraaj’s strategic, value-accretive interventions over the course of its investment ultimately led to significant EBITDA growth, ensuring strong returns to both its investors and partner company shareholders.
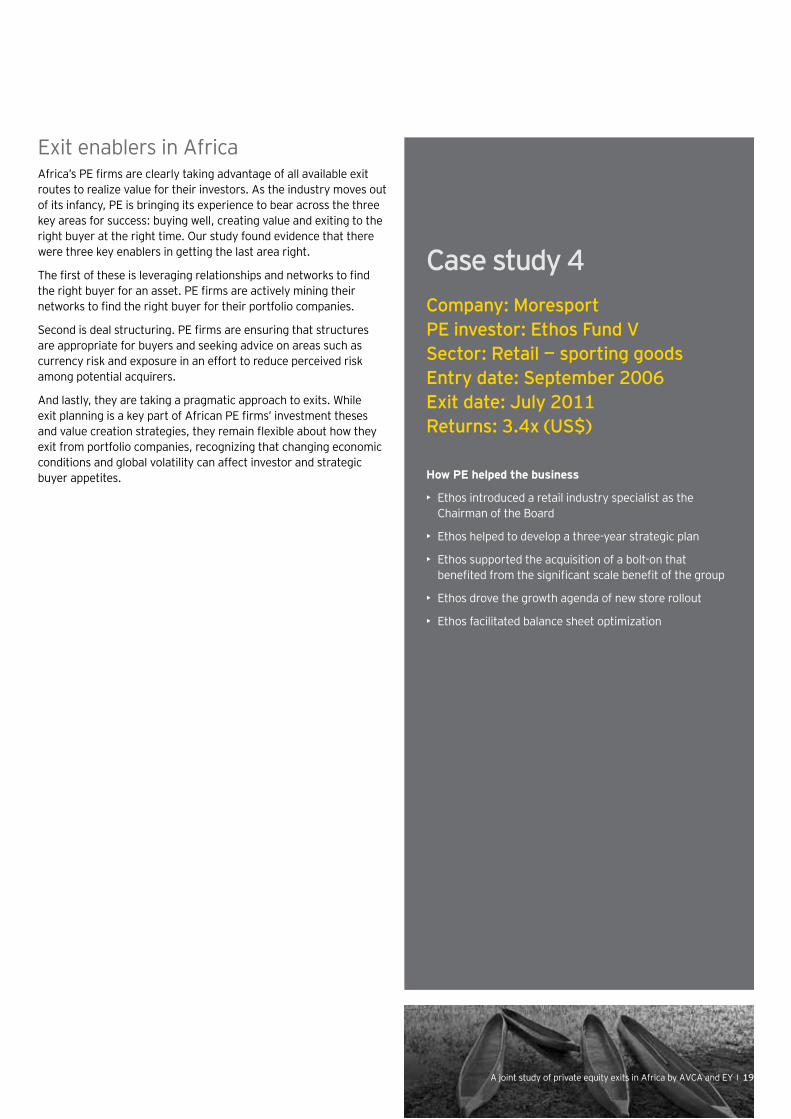
Exit enablers in AfricaAfrica’s PE firms are clearly taking advantage of all available exit routes to realize value for their investors. As the industry moves out of its infancy, PE is bringing its experience to bear across the three key areas for success: buying well, creating value and exiting to the right buyer at the right time. Our study found evidence that there were three key enablers in getting the last area right.
The first of these is leveraging relationships and networks to find the right buyer for an asset. PE firms are actively mining their networks to find the right buyer for their portfolio companies.
Second is deal structuring. PE firms are ensuring that structures are appropriate for buyers and seeking advice on areas such as currency risk and exposure in an effort to reduce perceived risk among potential acquirers.
And lastly, they are taking a pragmatic approach to exits. While exit planning is a key part of African PE firms’ investment theses and value creation strategies, they remain flexible about how they exit from portfolio companies, recognizing that changing economic conditions and global volatility can affect investor and strategic buyer appetites.
Case study 4Company: Moresport PE investor: Ethos Fund V Sector: Retail — sporting goods Entry date: September 2006 Exit date: July 2011 Returns: 3.4x (US$)
How PE helped the business
• Ethos introduced a retail industry specialist as the Chairman of the Board
• Ethos helped to develop a three-year strategic plan
• Ethos supported the acquisition of a bolt-on that benefited from the significant scale benefit of the group
• Ethos drove the growth agenda of new store rollout
• Ethos facilitated balance sheet optimization
A joint study of private equity exits in Africa by AVCA and EY 19

Outlook
20 Broadening horizons: How do private equity investors create value?
A joint study of private equity exits in Africa by AVCA and EY 21
The stage is set for continued PE growth in AfricaOur study has shown that African PE is moving out of its infancy to become a well-established part of the region’s investment landscape. The industry has developed over recent years as capital has flowed toward new and existing players, track records have been built and value-creating strategies honed.
Its new phase of maturity will mean it is well placed to take advantage of Africa’s growth, which has built momentum even despite unprecedented global economic volatility that has prevailed since the onset of the financial crisis in 2008.
The continent’s economies continue to diversify away from resource-driven growth and build on resilient consumer demand as increasing numbers of middle class Africans benefit from rising disposable incomes. Half of African countries (27) are now classified by the World Bank as middle-income countries. It has seen a growth in trade, bolstered by regional trade agreements and an increasingly diverse pool of trading partners. In addition, Africa has benefited from a new enthusiasm among investors, who have been seeking alternatives to established markets as a means of boosting returns.
All these factors will create further opportunity for Africa’s PE firms, with sectors such as financial services, fast-moving consumer goods, retail, education and health care continuing to benefit from the bulk of PE investment. At the larger end of the deal spectrum, there will be an increasing focus on areas requiring large amounts of capital, such as infrastructure, real estate and natural resources. The continued development of many economies outside South Africa, the currently low penetration of PE in these markets and a lack of alternative sources of funding for private companies mean that the PE industry in Africa has more room to grow, bringing its value creation capability to a variety of businesses across the continent.
This growth will be supported by appetite among limited partners (LPs) for African PE investment exposure. There was a significant increase in the amount of capital raised in 2013 by Africa-focused funds, in contrast to other emerging markets, which witnessed falls. And the prospects for future fund-raising remain strong. A recent survey* found that Sub-Saharan Africa topped the list of attractive emerging markets for LPs and that a fifth of LPs plan to begin investing in the region over the coming year.
We are starting to see the emergence of niche strategies, such as funds focused on infrastructure and impact investing, plus an increasing interest among global PE firms in Africa. We expect this to continue, contributing to the development of the industry overall and creating new pools of investment and value creation expertise.
As investment levels have risen over time, so the pipeline for exits has started to fill. As we’ve demonstrated in our study, African PE firms have taken the opportunity to exit well over the past few years and have proven their ability to generate outperformance through company growth and improvement techniques. As the industry develops further and new exit routes emerge, we would expect exit activity to pick up over the medium term, particularly as economic growth continues apace in most African markets.
There are some challenges, however. Competition at the larger end of the deal spectrum is already starting to have an impact on entry EV multiples. Those operating in this space will need to exercise caution when acquiring to ensure that high prices do not have a material impact on the returns they can generate. In addition, external events, such as the US Federal Reserve’s tapering of its quantitative easing program, may yet come to bear on African economies as it has done in other emerging markets. Recent FDI numbers across Africa show a mixed picture, for example, and Africa has not been immune to recent emerging market currency volatility, which may take the shine off some otherwise attractive investment opportunities.
Nevertheless, the stage is set for continued growth and development of the African PE industry, which is spotting opportunity in the rapid economic growth across the region and complementing this with increasingly sophisticated value creation techniques. African PE now has a record of outperformance against public markets and, indeed, the more established markets of the US and Europe. With a large number of private companies searching for growth capital and hands-on support throughout Africa, PE is truly in its element on the continent.
*2013 Global Limited Partners Survey, Emerging Markets Private Equity Association (EMPEA).
22 Broadening horizons: How do private equity investors create value?
About the studyThe 2014 Africa study examined the results and methods of PE exits between 2007 and 2013 using similar methodology to the US, Europe, Latin America and Australasia studies. Data was drawn from various sources, including AVCA and EMPEA, and confidential, detailed interviews with former PE owners of the exited businesses. Initial research was performed into 207 transactions across the continent, with in-depth information obtained on 129 exits. The exits had a minimum entry enterprise value of US$1m and included only full (not partial) exits.
Our analysis entailed an examination of the decision to invest, value creation during ownership, the exit strategy and key lessons learned. We obtained good coverage of data in our sample relative to the population across a number of metrics, such as exit year. However, as our exit population is not complete
for the period 2007–13, our findings may not be fully representative. In particular, we highlight the relatively small sample in Central Africa.
Despite this, our aim is to produce an analysis that will help enhance the understanding of exit modalities and strategies in these markets and the underlying drivers of value creation.
The size of the sample is a function of the availability of data on exits in these markets — our primary motivation for embarking on this research — and the extent of participation from the PE community. We are tremendously grateful for the generosity of those participating in this study and appreciate both their time and input.
We look forward to continuing to bring you insights into private equity value creation in both developed and emerging economies in the coming months and years.
About AVCAThe African Private Equity and Venture Capital Association’s (AVCA) mission is to promote and catalyze the private equity and venture capital industry in Africa.
AVCA is a member-supported organization, with members spanning private equity and venture capital firms, institutional investors, foundations and endowments, international development finance institutions, professional service firms and academia. They are all united by a common purpose: to be part of the African growth story.
AVCA endeavors to deliver its mission through four key pillars: building a knowledge centre of independent research for members and the industry; facilitating networking opportunities and thought leadership events; advocating on behalf of the industry to policymakers, regulators and global investors; and by providing training to investors and emerging fund managers on the asset class and best practice.
Together with a network of experts and collaborators across Africa and beyond, AVCA represents the voice of the pan-African industry in discussions with governments, regulators, lawmakers and the media.
For more information about AVCA, please visit www.avca-africa.org or contact Ashleigh Nelson, Director of Member Services & Communications, at [email protected].
22 Broadening horizons: How do private equity investors create value?

A joint study of private equity exits in Africa by AVCA and EY 23
ContactsAVCAMichelle Kathryn Essomé Chief Executive Officer [email protected]
Dara Owoyemi Chief Operating Officer [email protected]
Ponmile Osibo Research Analyst [email protected]
EYSandile Hlophe Africa Leader, Transaction Advisory Services [email protected]
Graham Stokoe Africa Private Equity Leader [email protected]
Jeff Bunder Global Private Equity Leader [email protected]
Michael Rogers Global Deputy Private Equity Leader [email protected]
Sachin Date EMEIA Private Equity Leader [email protected]
Special thanks to:Erika van der Merwe Chief Executive Officer South African Venture Capital and Private Equity Association
Dorothy Kelso Senior Private Equity Analyst, EY
A joint study of private equity exits in Africa by AVCA and EY 23
About EYEY is a global leader in assurance, tax, transaction and advisory services. The insights and quality services we deliver help build trust and confidence in the capital markets and in economies the world over. We develop outstanding leaders who team to deliver on our promises to all of our stakeholders. In so doing, we play a critical role in building a better working world for our people, for our clients and for our communities.
EY refers to the global organization, and may refer to one or more, of the member firms of Ernst & Young Global Limited, each of which is a separate legal entity. Ernst & Young Global Limited, a UK company limited by guarantee, does not provide services to clients. For more information about our organization, please visit ey.com.
How EY’s Global Private Equity Center can help your business Value creation goes beyond the private equity investment cycle to portfolio company and fund advice. EY’s Global Private Equity Center offers a tailored approach to the unique needs of private equity funds, their transaction processes, investment stewardship and portfolio companies’ performance. We focus on the market, sector and regulatory issues. If you lead a private equity business, we can help you meet your evolving requirements and those of your portfolio companies from acquisition to exit through a highly integrated global resource of 175,000 professionals across audit, tax, transactions and advisory services. Working together, we can help you meet your goals and compete more effectively.
© 2014 EYGM Limited. All Rights Reserved.
EYG no. FR0124CSG/GSC2014/1307806ED None
In line with EY’s commitment to minimize its impact on the environment, this document has been printed on paper with a high recycled content.
This material has been prepared for general informational purposes only and is not intended to be relied upon as accounting, tax, or other professional advice. Please refer to your advisors for specific advice.
ey.com/privateequity
EY | Assurance | Tax | Transactions | Advisory
EY AfricaEY has been operating in Africa for more than 164 years, and has offices in 33 African countries. With more than 260 partners across the continent, we employ over 5,400 employees and can offer support in most countries. Our African operations are managed by one African executive team, using a single, integrated business model. This local expertise is backed up by the profound industry and market insights of our global colleagues. From globalization to technological innovation, businesses around the world are exploring new and different ways of succeeding. By investing in dedicated Global Sector Centers around the world, EY can give you a global perspective on your assurance, tax, transaction and advisory needs, whatever your sector. The Centers serve as a hub for sharing sector-focused knowledge, enabling our global network of professionals to give you highly responsive advice that helps you compete more effectively in your sector.
Across Africa, we focus on a range of sectors that reflect the primary growth areas across Africa: government, infrastructure, mining and metals, oil and gas, telecommunications, power and utilities, retail and consumer products, and financial services, including private equity.