Embed Size (px)
Citation preview
Bromelton Quarry and Concrete Batching Plant
Final Report
per Groundwork Plus
Prepared by
MRCagney Pty Ltd
19-Apr-2016

Bromelton Quarry and Concrete Batching Plant
5461-B-TE-TIA-001 (1).docx
Document Information
Client per Groundwork Plus
Job Number 5461
Title Bromelton Quarry and Concrete Batching Plant
Prepared by MRCagney Pty Ltd 3B3BMILTON QLD
Date 19/04/2016
Quality Assurance Register
Issue Description Prepared by
Reviewed by
Authorised by
Date
a Draft MM DW - 17/12/2015
b Draft MM DW - 09/03/2016
1 Final SL NK/TC BRT 19/04/2016
© 2016 MRCagney Pty Ltd.
This document and information contained herein is the intellectual property of MRCagney Pty Ltd and is solely for the use of MRCagney’s contracted client. This document may not be used, copied or reproduced in whole or part for any purpose other than that for which it was supplied, without the written consent of MRCagney. MRCagney accepts no responsibility to any third party who may use or rely upon this document.
Bromelton Quarry and Concrete Batching Plant
5461-B-TE-TIA-001 (1).docx
Table of Contents 1. Introduction ....................................................................................................................................... 1
2. Existing Conditions ........................................................................................................................... 2
2.1 Existing Road Network ........................................................................................................... 2
2.2 Subject Site ........................................................................................................................... 2
2.3 Future Infrastructure Upgrade ................................................................................................ 3
3. The Transport Route ......................................................................................................................... 4
4. Base Traffic Volumes ........................................................................................................................ 6
4.1 2015 Traffic Volumes ............................................................................................................. 6
4.2 Base Traffic Growth ............................................................................................................... 8
5. Traffic Impact Assessment .............................................................................................................. 11
5.1 Trip Generation Characteristics of the Proposal ................................................................... 11
5.2 Trip Generation Characteristics of the New Concrete Batching Plant ................................... 14
5.3 Total Trip Generation of the Proposed Expanded Quarry and the New Concrete Batching Plant .................................................................................................................................... 16
6. Intersection Performance ................................................................................................................ 20
6.1 Intersection Capacity ........................................................................................................... 20
6.2 Turn Lane Treatments .......................................................................................................... 23
7. The Proposed New Site Access ...................................................................................................... 27
8. Pavement Contribution ................................................................................................................... 30
8.1 Pavement Contributions for State-Controlled Roads ............................................................ 30
9. Summary of Findings ...................................................................................................................... 32
Appendix A Site Plan Appendix B Results of Traffic Surveys Appendix C Results of SIDRA Analyses Appendix D Proposed Site Access Plan
Bromelton Quarry and Concrete Batching Plant
5461-B-TE-TIA-001 (1).docx Page 1
1. Introduction
MRCagney has been commissioned to prepare a Traffic Impact Assessment (TIA) report as part of a development application for the proposed expansion of the existing Bromelton Quarry and a new concrete batching plant located onsite.
We have been advised that the current maximum annual production rate of the existing quarry is 1.0M tonnes per annum; with transportation of material limited to 0.2M tonnes per annum by road and 0.8M tonnes per annum by rail.
The upper limit of annual production of the Bromelton Quarry is proposed to be increased to 3.5M tonnes per annum, of which 1.5M tonnes will be transported by road and 2.0M tonnes will be transported by rail. The average annual production (by road) is likely to be 1.2M tonnes per year over the anticipated operational life; i.e. the average production rate of the expanded quarry (by road) is estimated to be approximately 80% of the proposed production threshold (by road).
The upper limit of annual production of the new concrete batching plant is proposed to be 30,000m3 per year and the average annual production rate would be approximately 24,000m3 per year (ie. 80% of the production threshold).
The external traffic impact of the proposal has been assessed based on maximum production rates of the proposed expansion of the existing Bromelton Quarry (by road) and the new concrete batching plant to ensure satisfactory operation of road infrastructure components at all times during the operational period of the site. It is of course not possible to forecast the future annual production volumes, with the actual rates being subject to variables such as operating costs, supply and demand. Consequently, the targeted maximum (upper) operating conditions of the proposed expanded quarry (1.5M tonnes per year by road) and the new concrete batching plant (30,000m3 per year) have been assessed for the potential traffic impacts as they are considered to be appropriate yardsticks in this instance.
The pavement impacts associated with requirements of the proposal have been assessed based on the average production rates (1.2M tonnes per year by road of the expanded quarry and 24,000m3 per year of the concrete batching plant) over the operational life as these are fundamentally based on cumulative impacts. These methodologies are consistent with the requirements of The Department of Transport and Main Roads' (DTMR) “Guidelines for Assessment of Road Impacts of Development” (GARID) (Ref. 0F0F1).
The proposed Beaudesert Town Centre Bypass anticipated to be completed in 2017, will divert most of the haulage vehicles to / from the site away from the Beaudesert Town Centre.
It is estimated that the proposed increased production rate of the Quarry and the new concrete batching plant would be in operation for more than 10 years commencing from 2017, after the completion of the Beaudesert Town Centre Bypass.
A summary of findings is provided in Section 9 of this report.
1 ‘Guidelines for Assessment of Road Impacts of Development’ (GARID), Department of Transport and Main Roads, 2006.
Bromelton Quarry and Concrete Batching Plant
5461-B-TE-TIA-001 (1).docx Page 2
2. Existing Conditions
2.1 Existing Road Network The hierarchical classification and characteristics of roads in the vicinity of the subject site are described in Table 2-1 below.
It should be noted that Council is currently upgrading Sandy Creek Road with details of the upgrade discussed in Section 2.3 of this report.
Table 2-1: Existing Local Road Hierarchy
Road Speed limit Characteristics Authority
Beaudesert-Boonah Road 100km/h Sealed (undivided) two-lane road
Department of Transport and Main Roads
Sandy Creek Road 100km/h Sealed (undivided) two-lane road Scenic Rim Regional Council
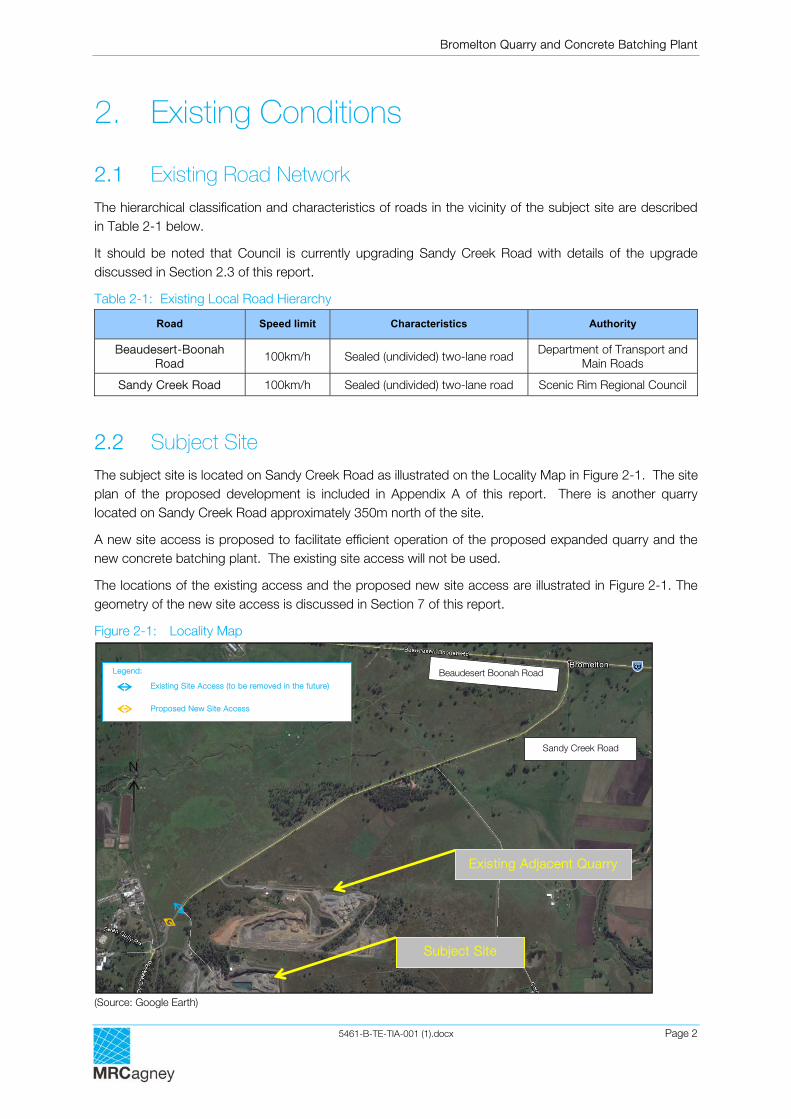
2.2 Subject Site The subject site is located on Sandy Creek Road as illustrated on the Locality Map in Figure 2-1. The site plan of the proposed development is included in Appendix A of this report. There is another quarry located on Sandy Creek Road approximately 350m north of the site.
A new site access is proposed to facilitate efficient operation of the proposed expanded quarry and the new concrete batching plant. The existing site access will not be used.
The locations of the existing access and the proposed new site access are illustrated in Figure 2-1. The geometry of the new site access is discussed in Section 7 of this report.
Figure 2-1: Locality Map
(Source: Google Earth)
N
Beaudesert Boonah Road
Sandy Creek Road
Legend: Existing Site Access (to be removed in the future) Proposed New Site Access
Subject Site
Existing Adjacent Quarry
Bromelton Quarry and Concrete Batching Plant
5461-B-TE-TIA-001 (1).docx Page 3
2.3 Future Infrastructure Upgrade The Beaudesert Town Centre Bypass
DTMR has scheduled construction of the Beaudesert Town Centre Bypass to commence late 2016 with completion anticipated in late 2017.
This project will be delivered as a joint partnership between the Department of Transport and Main Roads (DTMR), Economic Development Queensland and Scenic Rim Regional Council. The bypass will link the Mount Lindesay Highway to Beaudesert-Boonah Road, west of the town centre. The bypass will comprise:
Two lane road (1.5km in length);
Signalised Intersections at both ends of the bypass; and
Bridge over Spring Creek and extensive drainage culverts to provide Q50 flood immunity.
The Beaudesert Town Centre Bypass plays a critical part in the distribution of traffic to and from the north and north-eastern directions. Once complete, the bypass will reduce the flow of heavy vehicle traffic to and from the site through the Beaudesert town centre.
The bypass will also enable a dedicated route to service increasing freight demands in the Bromelton State Development area; allow local traffic to travel more freely through the town centre; improve the safety of pedestrians in the town centre and also allow the Scenic Rim Regional Council to rejuvenate the town centre.
In order to minimise the potential traffic impact to the Beaudesert town centre, it is proposed that the increased production rate of the Quarry and the new concrete batching plant commence after the completion of the Beaudesert Town Centre Bypass.
Sandy Creek Road
The email issued by Scenic Rim Regional Council dated 4 December 2015 regarding the upgrade of Sandy Creek Road states that:
“The road works on Sandy Creek Road are comprised of pavement strengthening and slight widening as a pavement rehabilitation project, with works on sections along a 3.5 km length from Beaudesert - Boonah Road to a couple of 100 metres north-east of the roundabout.
Work has been undertaken in stages with the final stage to be completed mid to late February 2016, weather permitting.”
The upgrade works on Sandy Creek Road extend from Beaudesert-Boonah Road to approximately the site access of the existing adjacent quarry, which is approximately 350m north of the subject site. The upgrading works are understood to be planned to be completed this year (2016) before the commencement of the proposed expanded quarry and the new concrete batching plant.
Bromelton Quarry and Concrete Batching Plant
5461-B-TE-TIA-001 (1).docx Page 4
3. The Transport Route
It is understood that the proposed expanded quarry and the new concrete batching plant will utilise the planned Beaudesert Town Centre Bypass for all haulage movements to / from the north and north-east. In order to minimise potential traffic impact to the Beaudesert town centre, it is proposed that the quarry's increased production rate and the concrete batching plant operations commence after the Town Centre Bypass is completed.
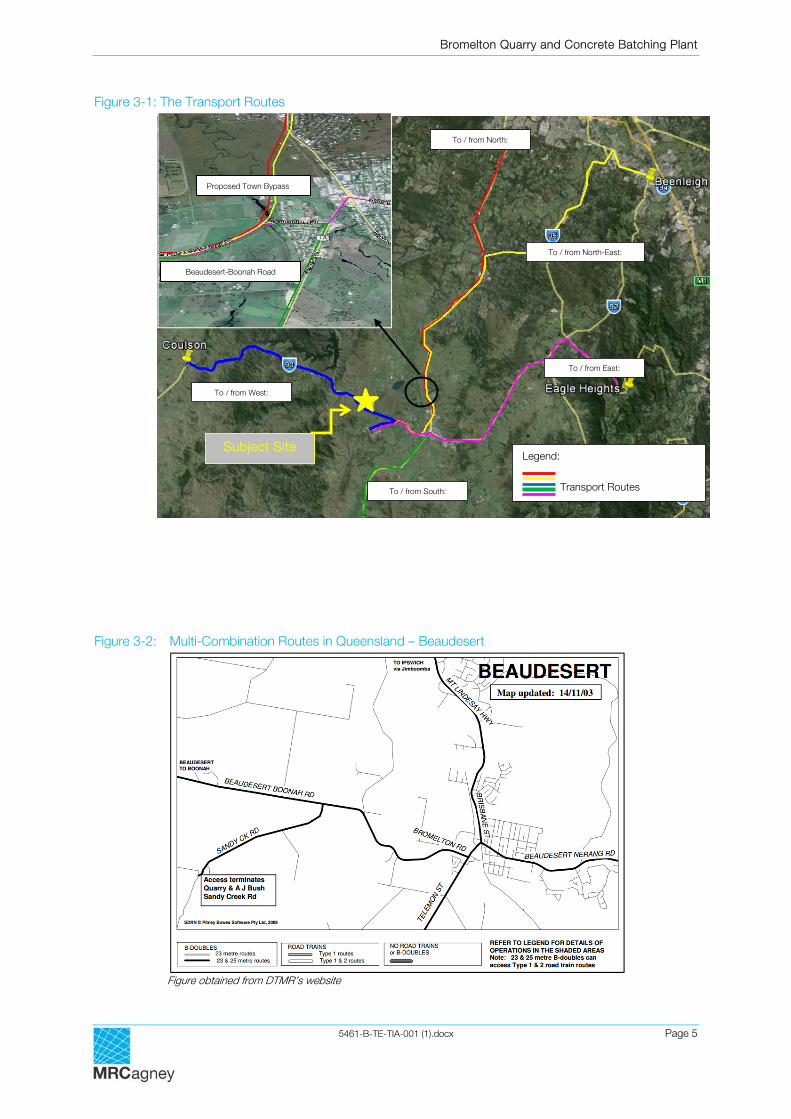
The road hierarchy in the vicinity of the site has been assessed to aid in determining appropriate transport routes for the various likely destinations of quarried products. The proposed transport routes, illustrated in Figure 3-1 overleaf, are the recommended transport routes to be used for haulage of materials to and from the site.
The proposed transport routes are detailed below:
To / from the north: via Sandy Creek Road, Beaudesert–Boonah Road, the Beaudesert Town Centre Bypass and Mount Lindesay Highway (illustrated by the red line in Figure 3-1);
To / from the north-east: via Sandy Creek Road, Beaudesert–Boonah Road, the Beaudesert Town Centre Bypass, Mount Lindesay Highway, Camp Cable Road and Waterford-Tamborine Road (illustrated by the yellow line in Figure 3-1);
To / from the east: via Sandy Creek Road, Beaudesert–Boonah Road, Bromelton Road, Beaudesert-Nerang Road and Tamborine Mountain Road (illustrated by the purple line in Figure 3-1);
To / from the south: via Sandy Creek Road, Beaudesert–Boonah Road and Mount Lindesay Highway (illustrated by the green line in Figure 3-1); and
To / from the west: via Sandy Creek Road and Beaudesert–Boonah Road (illustrated by the blue line in Figure 3-1).
The largest vehicle sought to be used by the site for the loading and hauling activities is a B-double. DTMR’s “Multi-Combination Routes in Queensland - Beaudesert” illustrates that all state-controlled roads included in the proposed transport routes outlined above are suitable for vehicles up to 23 & 25 metre B-doubles. As such, the proposed transport routes are considered to be appropriate for typical haulage / delivery vehicles. The “Multi-Combination Routes in Queensland - Beaudesert” map image is duplicated in Figure 3-2.
Bromelton Quarry and Concrete Batching Plant
5461-B-TE-TIA-001 (1).docx Page 5
Figure 3-1: The Transport Routes
Figure 3-2: Multi-Combination Routes in Queensland – Beaudesert
Figure obtained from DTMR’s website
Subject Site Legend:
Transport Routes
Beaudesert-Boonah Road
Proposed Town Bypass
To / from West:
To / from North:
To / from North-East:
To / from East:
To / from South:
Bromelton Quarry and Concrete Batching Plant
5461-B-TE-TIA-001 (1).docx Page 6
4. Base Traffic Volumes
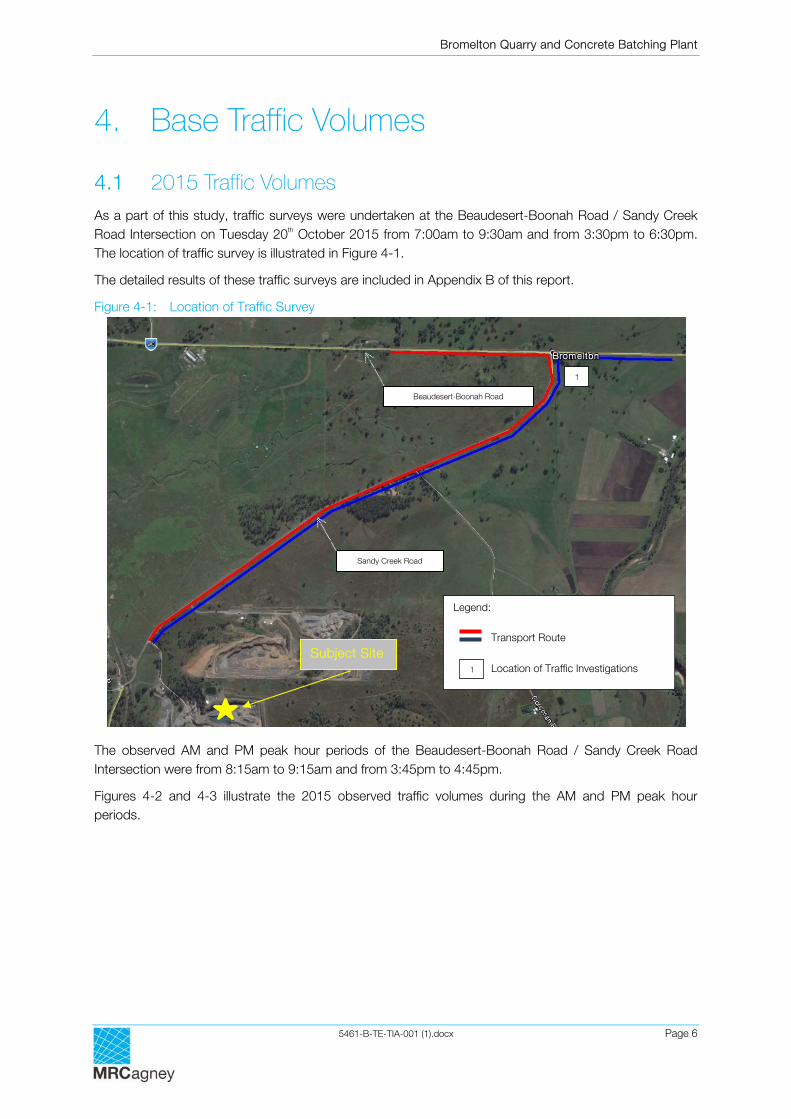
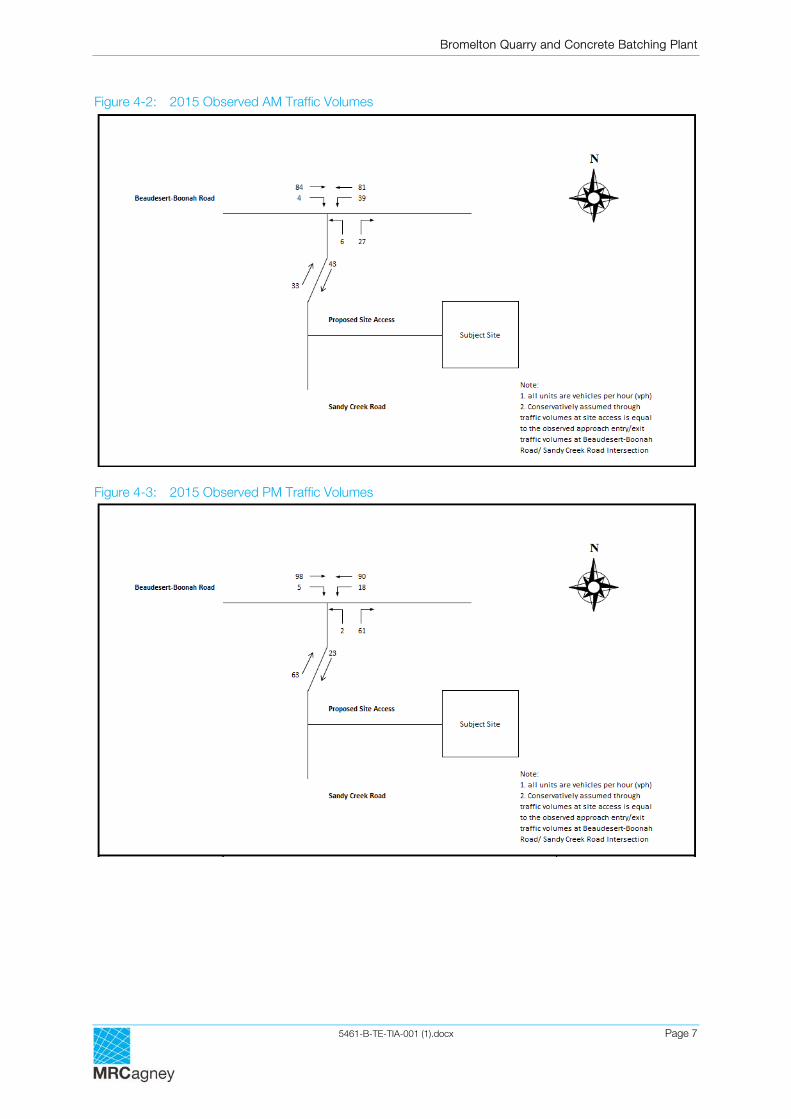
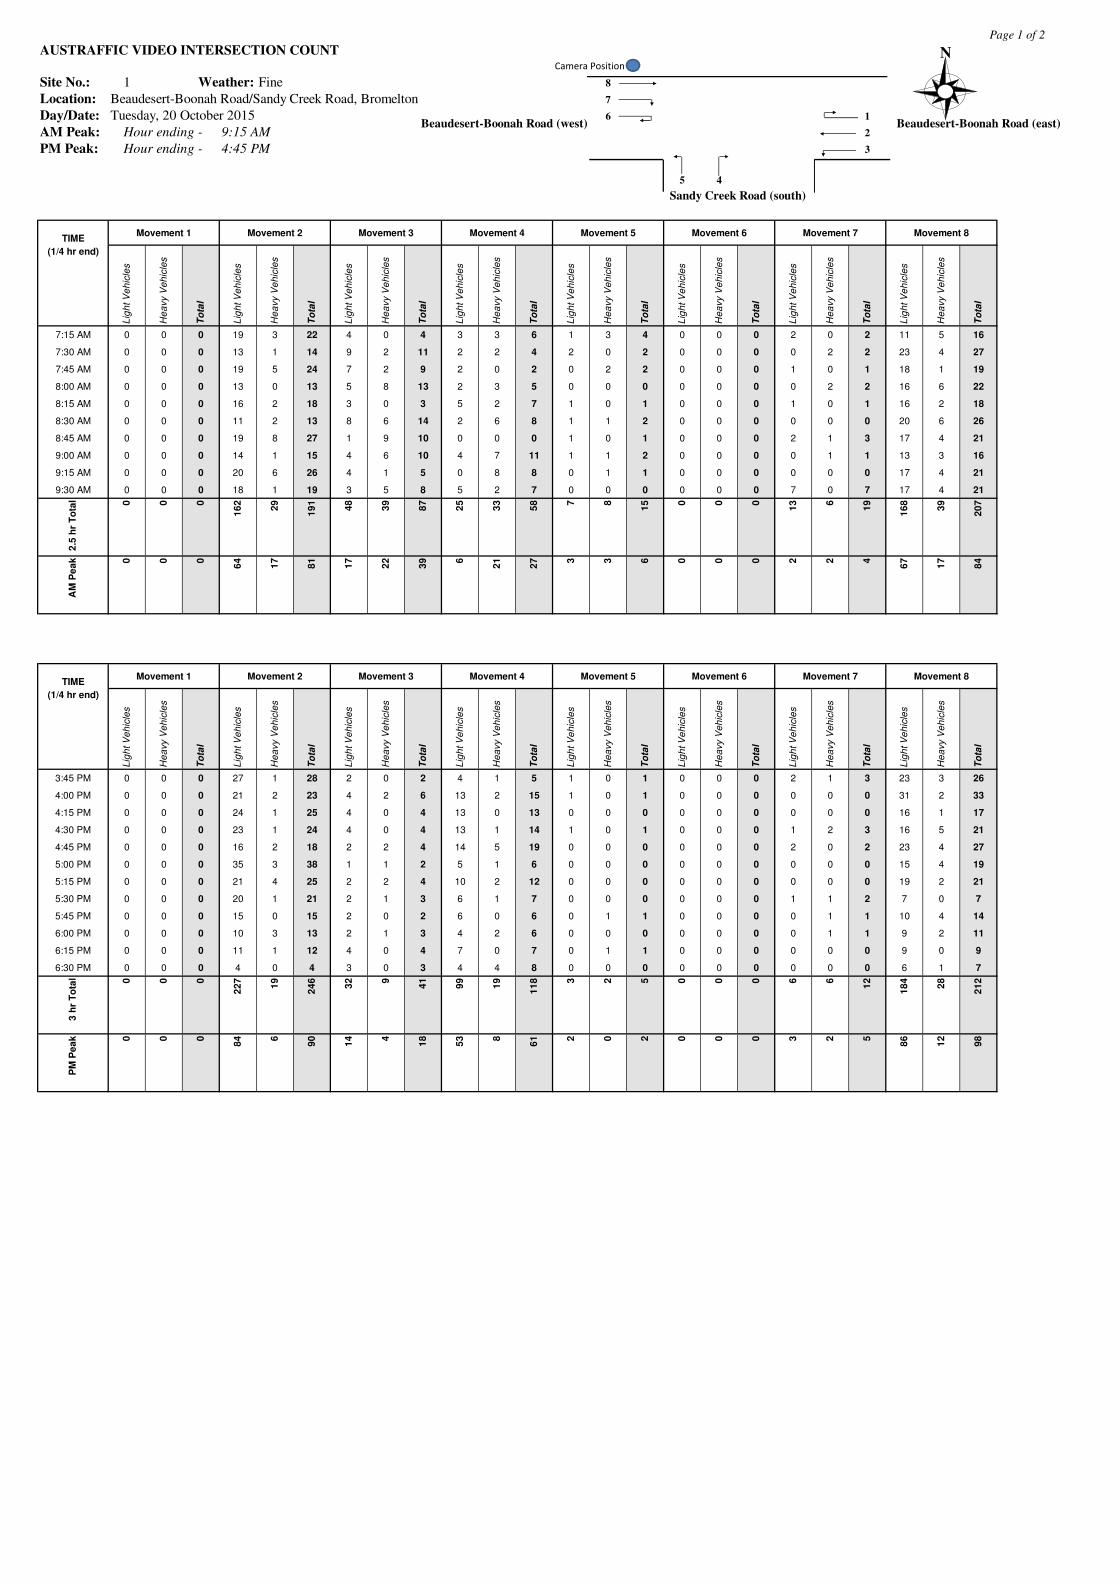
4.1 2015 Traffic Volumes As a part of this study, traffic surveys were undertaken at the Beaudesert-Boonah Road / Sandy Creek Road Intersection on Tuesday 20th October 2015 from 7:00am to 9:30am and from 3:30pm to 6:30pm. The location of traffic survey is illustrated in Figure 4-1.
The detailed results of these traffic surveys are included in Appendix B of this report.
Figure 4-1: Location of Traffic Survey
The observed AM and PM peak hour periods of the Beaudesert-Boonah Road / Sandy Creek Road Intersection were from 8:15am to 9:15am and from 3:45pm to 4:45pm.
Figures 4-2 and 4-3 illustrate the 2015 observed traffic volumes during the AM and PM peak hour periods.
1
Legend: Transport Route
Location of Traffic Investigations 1
Subject Site
Sandy Creek Road
Beaudesert-Boonah Road
Bromelton Quarry and Concrete Batching Plant
5461-B-TE-TIA-001 (1).docx Page 7
Figure 4-2: 2015 Observed AM Traffic Volumes
Figure 4-3: 2015 Observed PM Traffic Volumes
Bromelton Quarry and Concrete Batching Plant
5461-B-TE-TIA-001 (1).docx Page 8
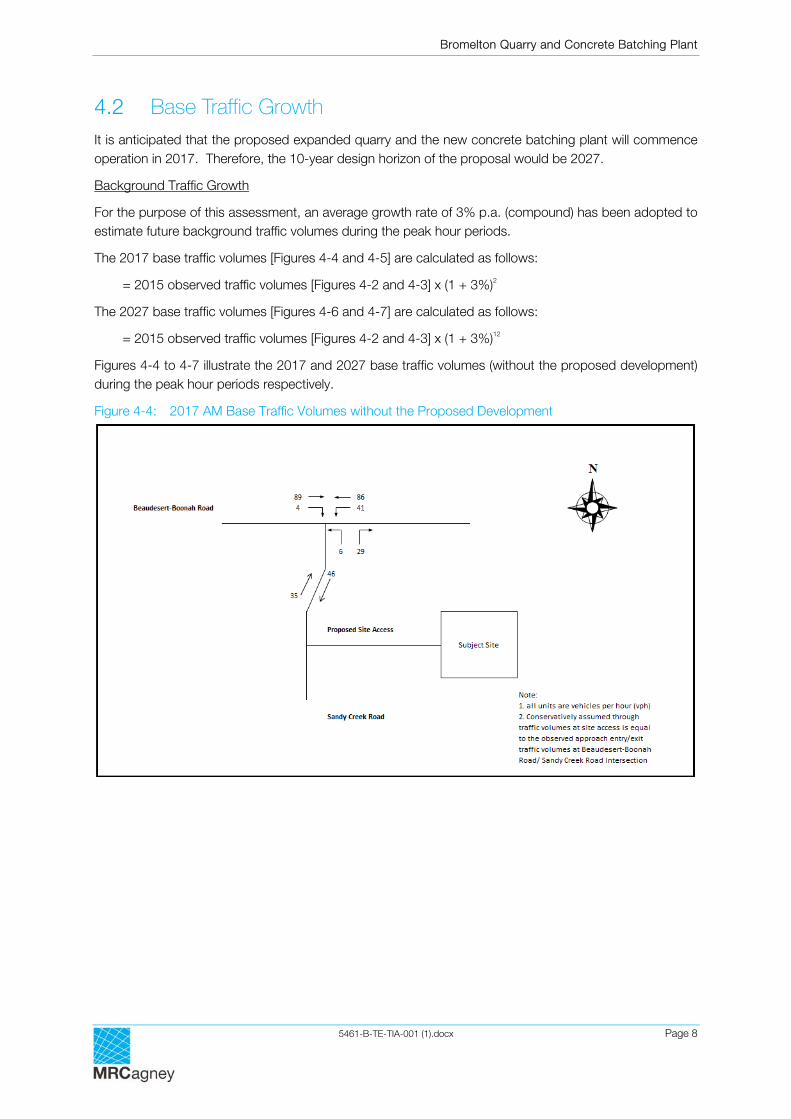
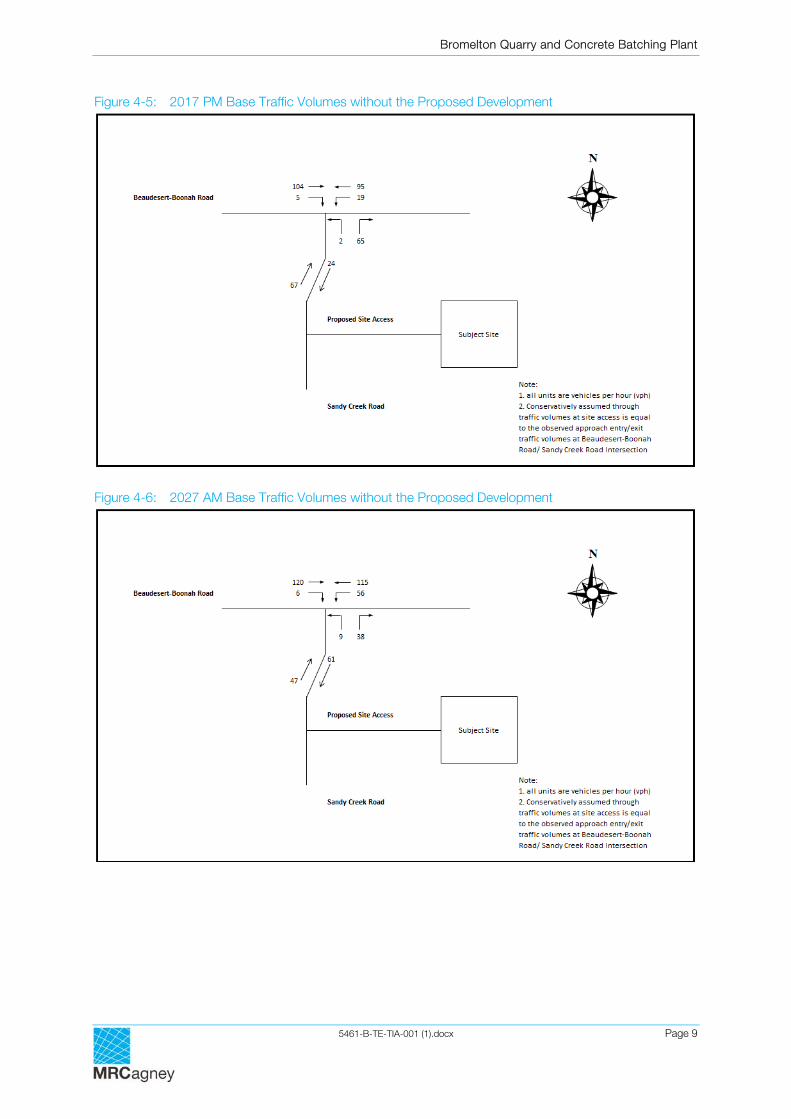
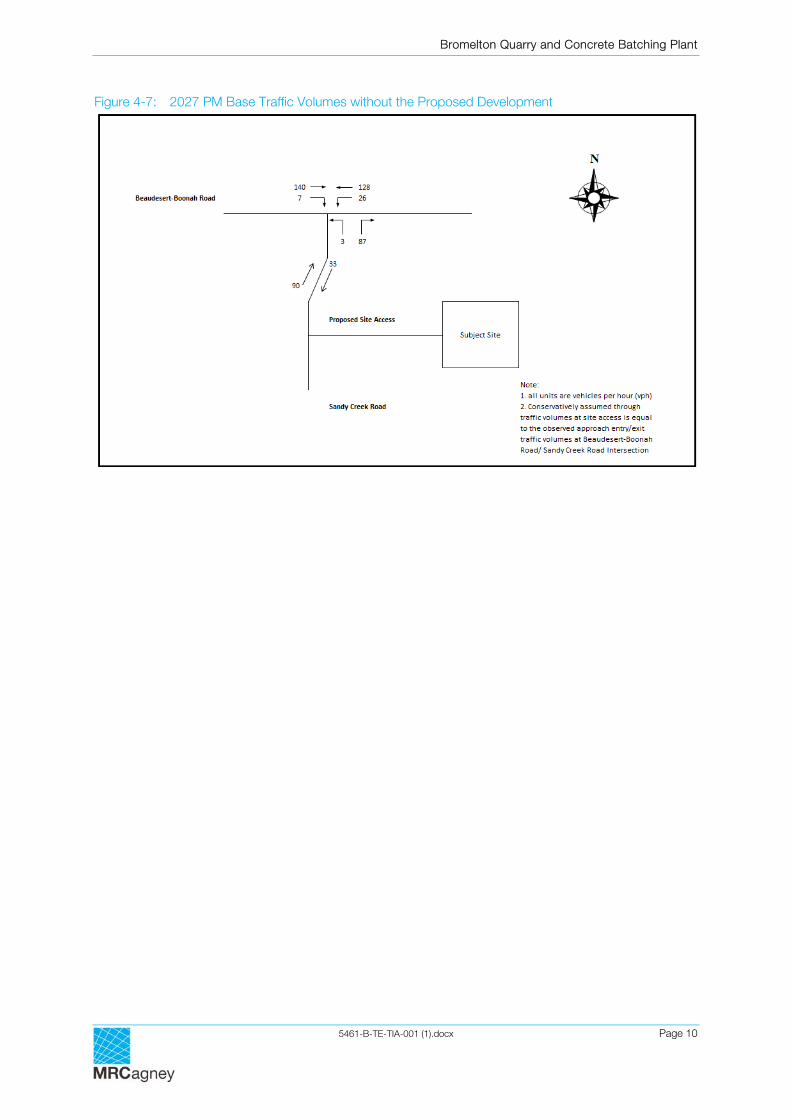
4.2 Base Traffic Growth It is anticipated that the proposed expanded quarry and the new concrete batching plant will commence operation in 2017. Therefore, the 10-year design horizon of the proposal would be 2027.
Background Traffic Growth
For the purpose of this assessment, an average growth rate of 3% p.a. (compound) has been adopted to estimate future background traffic volumes during the peak hour periods.
The 2017 base traffic volumes [Figures 4-4 and 4-5] are calculated as follows:
= 2015 observed traffic volumes [Figures 4-2 and 4-3] x (1 + 3%)2
The 2027 base traffic volumes [Figures 4-6 and 4-7] are calculated as follows:
= 2015 observed traffic volumes [Figures 4-2 and 4-3] x (1 + 3%)12
Figures 4-4 to 4-7 illustrate the 2017 and 2027 base traffic volumes (without the proposed development) during the peak hour periods respectively.
Figure 4-4: 2017 AM Base Traffic Volumes without the Proposed Development
Bromelton Quarry and Concrete Batching Plant
5461-B-TE-TIA-001 (1).docx Page 9
Figure 4-5: 2017 PM Base Traffic Volumes without the Proposed Development
Figure 4-6: 2027 AM Base Traffic Volumes without the Proposed Development
Bromelton Quarry and Concrete Batching Plant
5461-B-TE-TIA-001 (1).docx Page 10
Figure 4-7: 2027 PM Base Traffic Volumes without the Proposed Development
Bromelton Quarry and Concrete Batching Plant
5461-B-TE-TIA-001 (1).docx Page 11
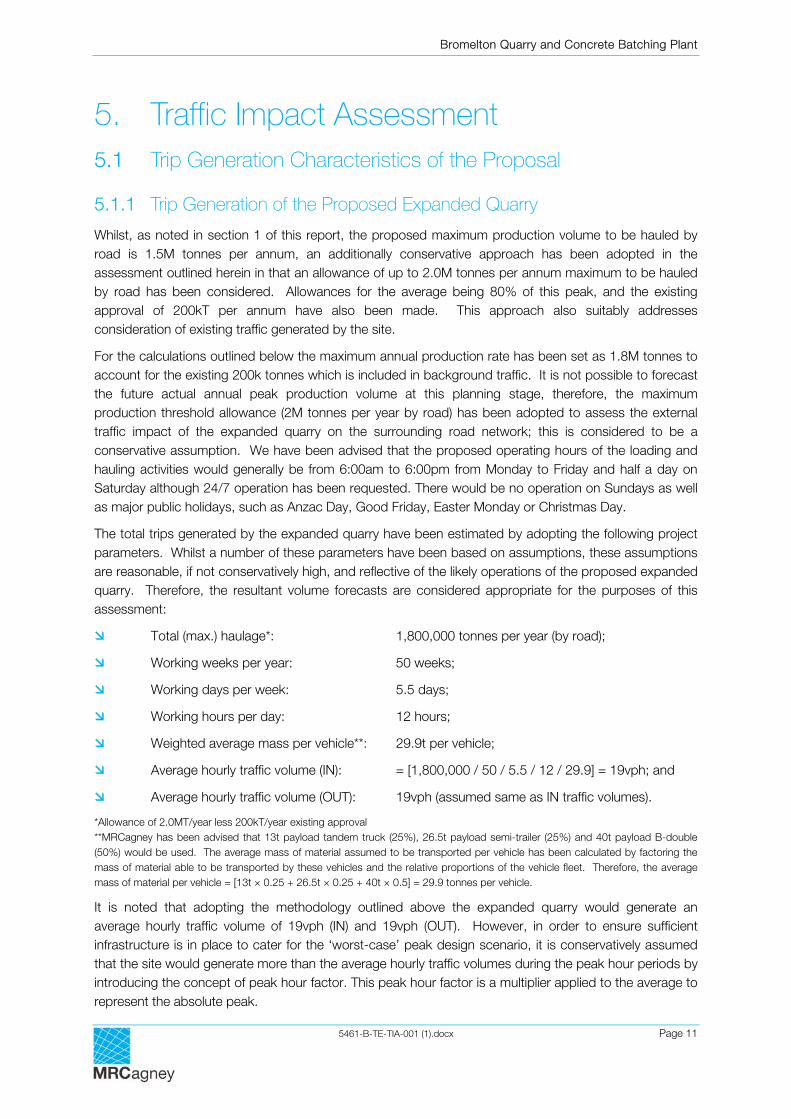
5. Traffic Impact Assessment 5.1 Trip Generation Characteristics of the Proposal
5.1.1 Trip Generation of the Proposed Expanded Quarry
Whilst, as noted in section 1 of this report, the proposed maximum production volume to be hauled by road is 1.5M tonnes per annum, an additionally conservative approach has been adopted in the assessment outlined herein in that an allowance of up to 2.0M tonnes per annum maximum to be hauled by road has been considered. Allowances for the average being 80% of this peak, and the existing approval of 200kT per annum have also been made. This approach also suitably addresses consideration of existing traffic generated by the site.
For the calculations outlined below the maximum annual production rate has been set as 1.8M tonnes to account for the existing 200k tonnes which is included in background traffic. It is not possible to forecast the future actual annual peak production volume at this planning stage, therefore, the maximum production threshold allowance (2M tonnes per year by road) has been adopted to assess the external traffic impact of the expanded quarry on the surrounding road network; this is considered to be a conservative assumption. We have been advised that the proposed operating hours of the loading and hauling activities would generally be from 6:00am to 6:00pm from Monday to Friday and half a day on Saturday although 24/7 operation has been requested. There would be no operation on Sundays as well as major public holidays, such as Anzac Day, Good Friday, Easter Monday or Christmas Day.
The total trips generated by the expanded quarry have been estimated by adopting the following project parameters. Whilst a number of these parameters have been based on assumptions, these assumptions are reasonable, if not conservatively high, and reflective of the likely operations of the proposed expanded quarry. Therefore, the resultant volume forecasts are considered appropriate for the purposes of this assessment:
Total (max.) haulage*: 1,800,000 tonnes per year (by road);
Working weeks per year: 50 weeks;
Working days per week: 5.5 days;
Working hours per day: 12 hours;
Weighted average mass per vehicle**: 29.9t per vehicle;
Average hourly traffic volume (IN): = [1,800,000 / 50 / 5.5 / 12 / 29.9] = 19vph; and
Average hourly traffic volume (OUT): 19vph (assumed same as IN traffic volumes).
*Allowance of 2.0MT/year less 200kT/year existing approval **MRCagney has been advised that 13t payload tandem truck (25%), 26.5t payload semi-trailer (25%) and 40t payload B-double (50%) would be used. The average mass of material assumed to be transported per vehicle has been calculated by factoring the mass of material able to be transported by these vehicles and the relative proportions of the vehicle fleet. Therefore, the average mass of material per vehicle = [13t × 0.25 + 26.5t × 0.25 + 40t × 0.5] = 29.9 tonnes per vehicle.
It is noted that adopting the methodology outlined above the expanded quarry would generate an average hourly traffic volume of 19vph (IN) and 19vph (OUT). However, in order to ensure sufficient infrastructure is in place to cater for the ‘worst-case’ peak design scenario, it is conservatively assumed that the site would generate more than the average hourly traffic volumes during the peak hour periods by introducing the concept of peak hour factor. This peak hour factor is a multiplier applied to the average to represent the absolute peak.
Bromelton Quarry and Concrete Batching Plant
5461-B-TE-TIA-001 (1).docx Page 12
Peak hour factor***: 3 (for the purpose of this traffic impact assessment, a peak hour factor of 3 has been adopted);
Peak hourly traffic volume (IN): = [19 x 3] = 57vph; and
Peak hourly traffic volume (OUT): 57vph (assumed same as IN traffic volumes).
***Peak hour factor is the ratio of the absolute peak operating conditions to the average operating conditions of a peak production year. This represents what is considered to be the ‘worst-case’ peak design scenario and has been used as the basis of this traffic impact assessment.
It is understood that there will be a total of approximately 15 on-site staff (on different shifts) working at the expanded quarry.
Whilst the staff may not necessarily arrive / leave the site during the AM and PM road peak hour periods, it is conservatively assumed that approximately one-third of staff would arrive at the site during the AM peak hour period and leave the site during the PM peak hour period; i.e. staff of the expanded quarry would generate 5vph during the AM peak hour period (5vph IN + 0vph OUT) and 5vph during the PM peak hour period (0vph IN + 5vph OUT). The trips generated by staff are in addition to the trips generated by the hauling activities.
The travel routes of staff aren't known at this stage; however, it is reasonable to assume staff travel to work from the east, such as Beaudesert, and access the site via the Beaudesert-Boonah Road / Sandy Creek Road intersection.
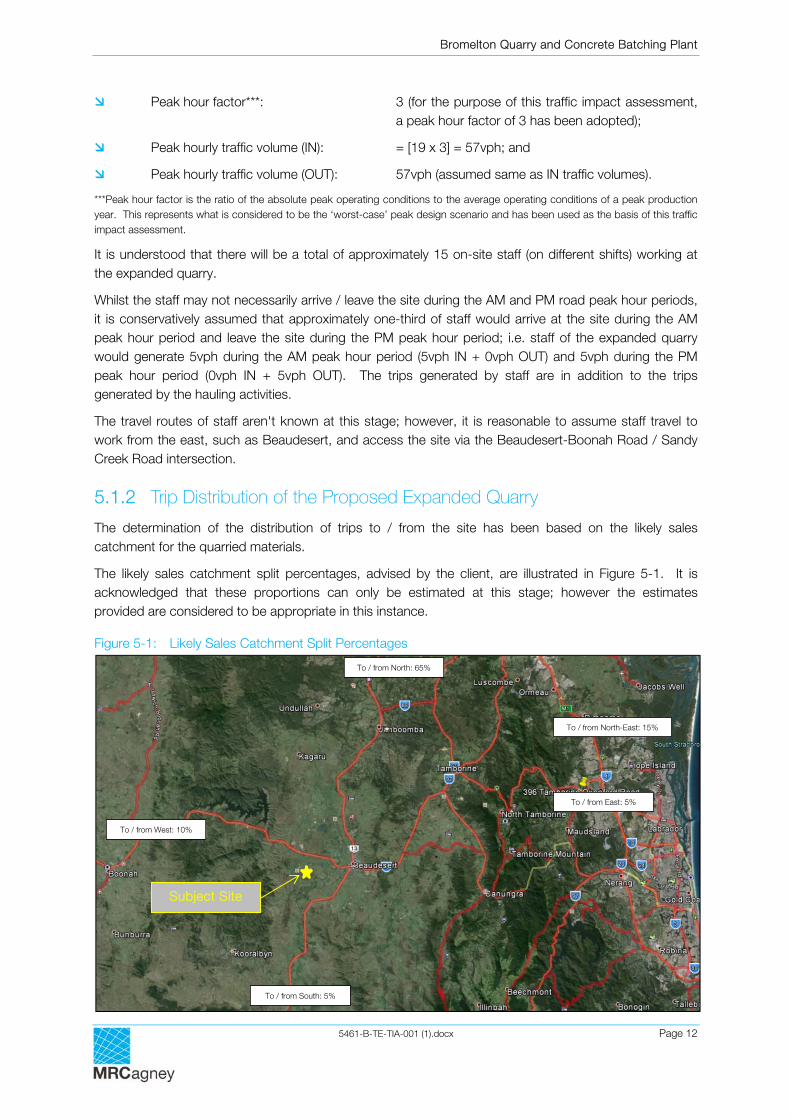
5.1.2 Trip Distribution of the Proposed Expanded Quarry
The determination of the distribution of trips to / from the site has been based on the likely sales catchment for the quarried materials.
The likely sales catchment split percentages, advised by the client, are illustrated in Figure 5-1. It is acknowledged that these proportions can only be estimated at this stage; however the estimates provided are considered to be appropriate in this instance.
Figure 5-1: Likely Sales Catchment Split Percentages
To / from North: 65%
To / from North-East: 15%
To / from East: 5%
To / from South: 5%
To / from West: 10%
Subject Site

Bromelton Quarry and Concrete Batching Plant
5461-B-TE-TIA-001 (1).docx Page 13
The peak hourly trips forecast to be generated by the expanded quarry based on the aforementioned assumptions are illustrated in Figures 5-2 and 5-3.
Figure 5-2: Trips Forecast to be Generated by the Expanded Quarry during the AM Peak Hour Period
Figure 5-3: Trips Forecast to be Generated by the Expanded Quarry during the PM Peak Hour Period
Bromelton Quarry and Concrete Batching Plant
5461-B-TE-TIA-001 (1).docx Page 14
5.2 Trip Generation Characteristics of the New Concrete Batching Plant
5.2.1 Trip Generation of the New Concrete Batching Plant
The maximum production volume of the new concrete batching plant is anticipated to be 30,000m3 per year. It is not possible to forecast the future actual annual peak production volume at this planning stage, therefore, the maximum production threshold (30,000m3) has been adopted to assess the external traffic impact of the new concrete batching plant on the surrounding road network; this is considered to be a conservative assumption.
The operation of the new concrete batching plant is different from a quarry as imported resources are required to produce the concrete. A large portion of incoming materials to the new concrete batching plant will be imported from the Bromelton Quarry itself and accordingly would allow these trips to remain internal to the site. The subject quarry will reduce the traffic generated by the new concrete batching plant on the external road network than would otherwise occur with a standalone plant, as a large proportion of materials would be sourced internally. A small portion of material (2,310m3 per year) will be imported to the site from external sources.
The total external trips generated by importing materials and hauling the produced concrete have been estimated by adopting the following project parameters. Whilst a number of these parameters have been based on assumptions, these assumptions are considered reasonable and reflective of the likely operations of the new concrete batching plant. Therefore, the resultant volume forecasts are considered appropriate for the purposes of this assessment. Although 24/7 operation has been requested, the following parameters have ben used for assessment.
Outgoing materials:
Annual production rate: 30,000m3 per year;
Working days per year: 300 days;
Working hours per day: 10 hours;
Average yield per vehicle: 5.5m3 per vehicle (100% concrete truck);
Incoming materials (resources imported from external sources):
Annual importing rate (externally)*: 2,310m3 per year;
Working days per year: 300 days;
Working hours per day: 10 hours;
Average yield per vehicle: 7.0m3 per vehicle (100% cement tanker).
*MRCagney has been advised that the majority of material for the new concrete batching plant would be sourced internally from the Bromelton Quarry, which would essentially remove an equivalent of 0.5vph quarry trucks (return trip) to / from the Bromelton Quarry.
Therefore, the average net peak traffic volumes generated by the new concrete batching plant is calculated below:
Average hourly traffic volume (IN): = [30,000 / 300 / 10 / 5.5 + 2,310 / 300 / 10 / 7.0 – 0.5] = 1.4vph; and
Average hourly traffic volume (OUT): 1.4vph (assumed same as IN traffic volumes).

Bromelton Quarry and Concrete Batching Plant
5461-B-TE-TIA-001 (1).docx Page 15
It is noted that the new concrete batching plant would generate an average hourly traffic volume of 1.4vph (IN) and 1.4vph (OUT). However, in order to ensure sufficient infrastructure is proposed to cater for the ‘worst-case’ peak design scenario, it is again conservatively assumed that the site would generate more than the average hourly traffic volumes during the peak hour periods by using the aforementioned peak hour factor.
Peak hour factor: 3;
Peak hourly traffic volume (IN): = [1.4 x 3] = 4vph; and
Peak hourly traffic volume (OUT): 4vph (assumed same as IN traffic volumes).
MRCagney has been advised that all of the outgoing materials will be exported to the east via Beaudesert-Boonah Road (east); and the vast majority of the (external) incoming materials will be from the east via Beaudesert-Boonah Road (east).
It is understood that there will be a total of approximately 5 on-site staff (on different shifts) working at the new concrete batching plant.
As per the previously discussed modelled staff arrangements for the quarry, it is conservatively assumed that approximately one-third of staff would arrive at the site during the AM peak hour period and leave the site during the PM peak hour period; i.e. staff of the new concrete batching plant would generate 2vph during the AM peak hour period (2vph IN + 0vph OUT) and 2vph during the PM peak hour period (0vph IN + 2vph OUT). The trips generated by the staff are in addition to the trips generated by the hauling activities.
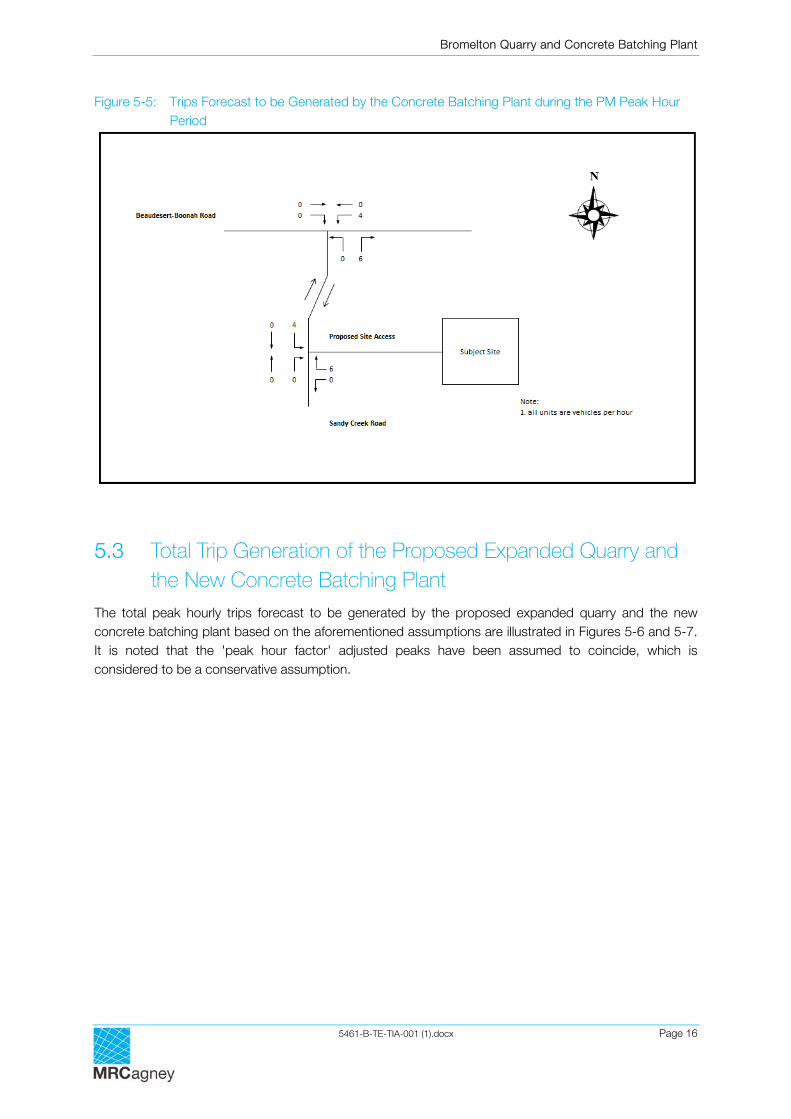
The peak hourly trips forecast to be generated by the new concrete batching plant based on the aforementioned assumptions are illustrated in Figures 5-4 and 5-5.
Figure 5-4: Trips Forecast to be Generated by the Concrete Batching Plant during the AM Peak Hour Period
Bromelton Quarry and Concrete Batching Plant
5461-B-TE-TIA-001 (1).docx Page 16
Figure 5-5: Trips Forecast to be Generated by the Concrete Batching Plant during the PM Peak Hour Period
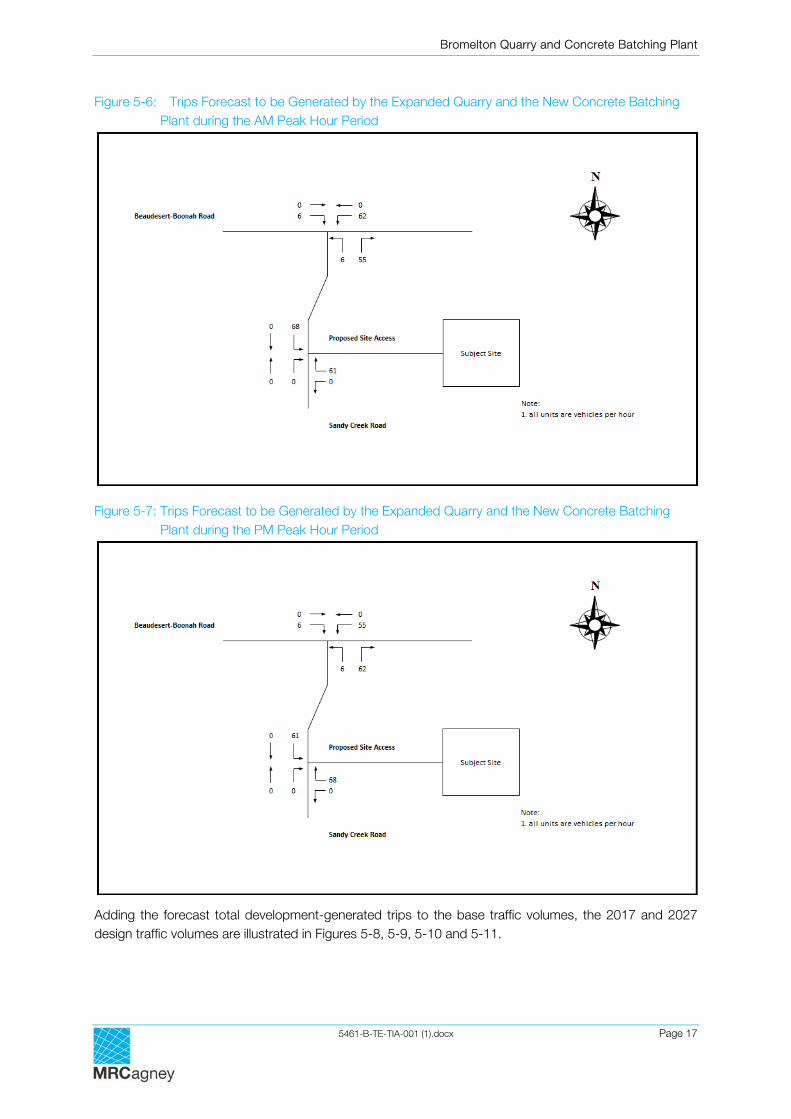
5.3 Total Trip Generation of the Proposed Expanded Quarry and the New Concrete Batching Plant
The total peak hourly trips forecast to be generated by the proposed expanded quarry and the new concrete batching plant based on the aforementioned assumptions are illustrated in Figures 5-6 and 5-7. It is noted that the 'peak hour factor' adjusted peaks have been assumed to coincide, which is considered to be a conservative assumption.
Bromelton Quarry and Concrete Batching Plant
5461-B-TE-TIA-001 (1).docx Page 17
Figure 5-6: Trips Forecast to be Generated by the Expanded Quarry and the New Concrete Batching Plant during the AM Peak Hour Period
Figure 5-7: Trips Forecast to be Generated by the Expanded Quarry and the New Concrete Batching Plant during the PM Peak Hour Period
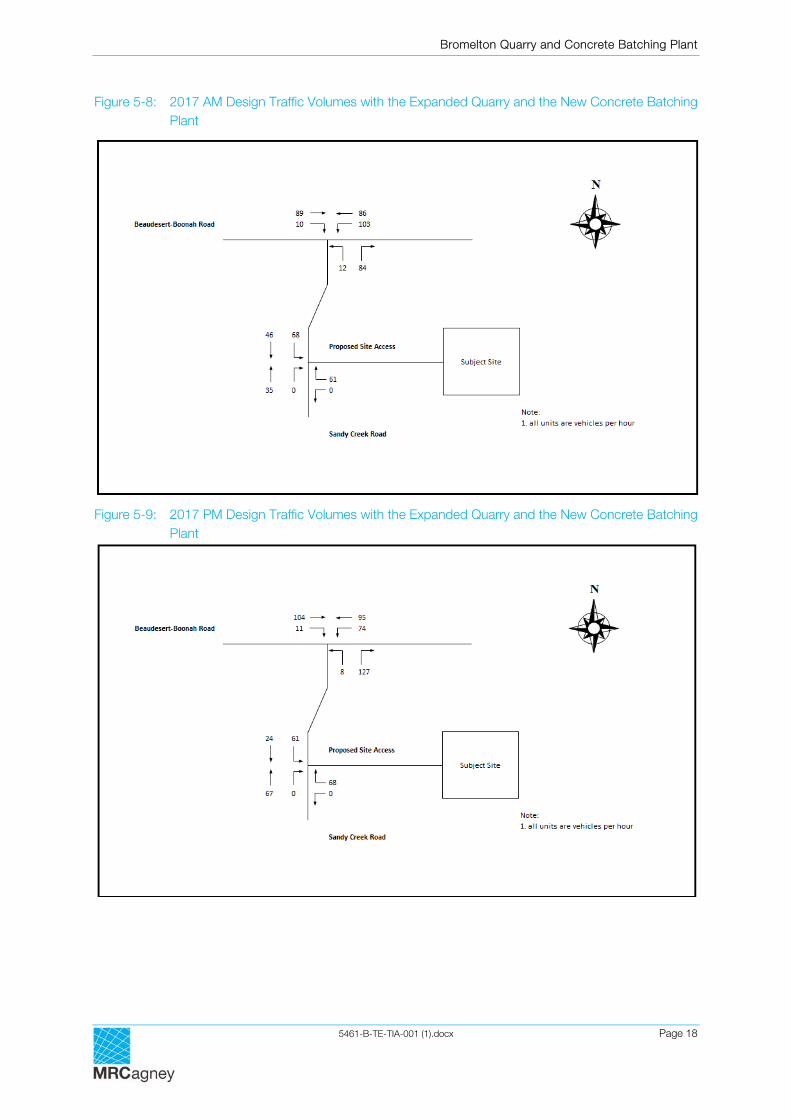
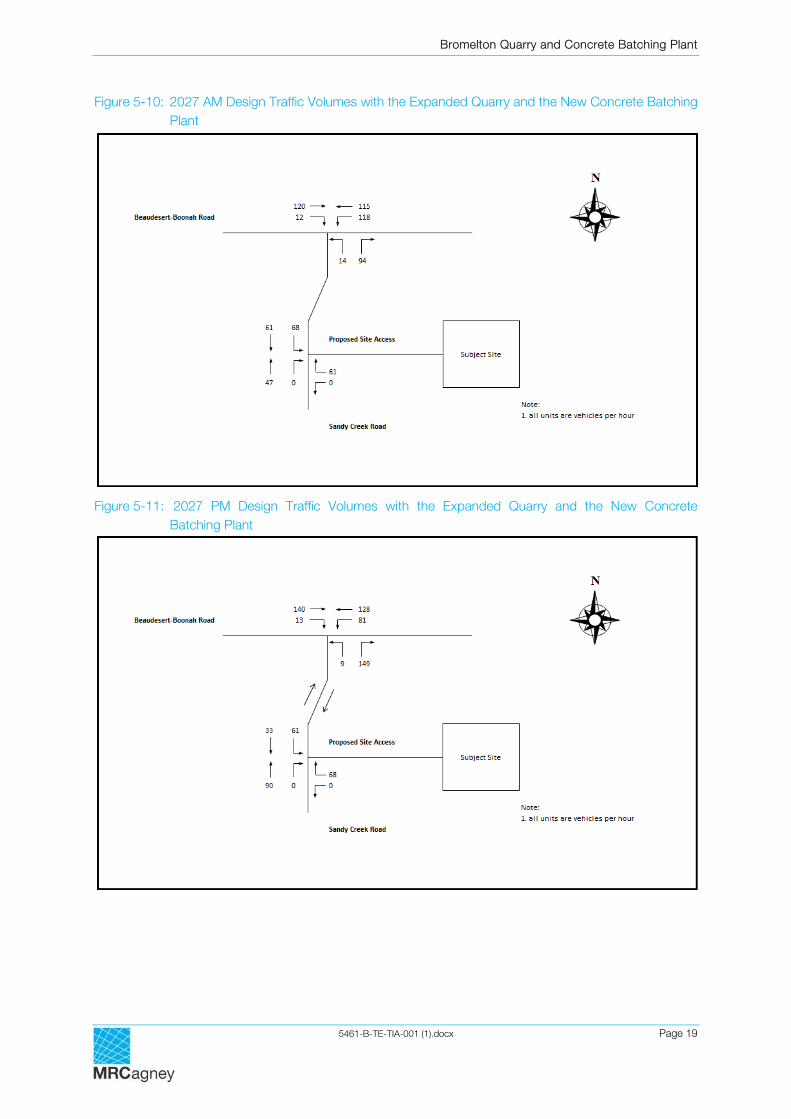
Adding the forecast total development-generated trips to the base traffic volumes, the 2017 and 2027 design traffic volumes are illustrated in Figures 5-8, 5-9, 5-10 and 5-11.
Bromelton Quarry and Concrete Batching Plant
5461-B-TE-TIA-001 (1).docx Page 18
Figure 5-8: 2017 AM Design Traffic Volumes with the Expanded Quarry and the New Concrete Batching Plant
Figure 5-9: 2017 PM Design Traffic Volumes with the Expanded Quarry and the New Concrete Batching Plant
Bromelton Quarry and Concrete Batching Plant
5461-B-TE-TIA-001 (1).docx Page 19
Figure 5-10: 2027 AM Design Traffic Volumes with the Expanded Quarry and the New Concrete Batching Plant
Figure 5-11: 2027 PM Design Traffic Volumes with the Expanded Quarry and the New Concrete Batching Plant
Bromelton Quarry and Concrete Batching Plant
5461-B-TE-TIA-001 (1).docx Page 20
6. Intersection Performance
6.1 Intersection Capacity To quantify the impact of the proposed expansion on the operation of the external road network, future operation of the following key intersections has been assessed:
Intersection 1: Beaudesert-Boonah Road / Sandy Creek Road; and
Intersection 2: Sandy Creek Road / New Site Access Road (the new site access intersection).
The following sections of this report summarise the findings of the analysis.
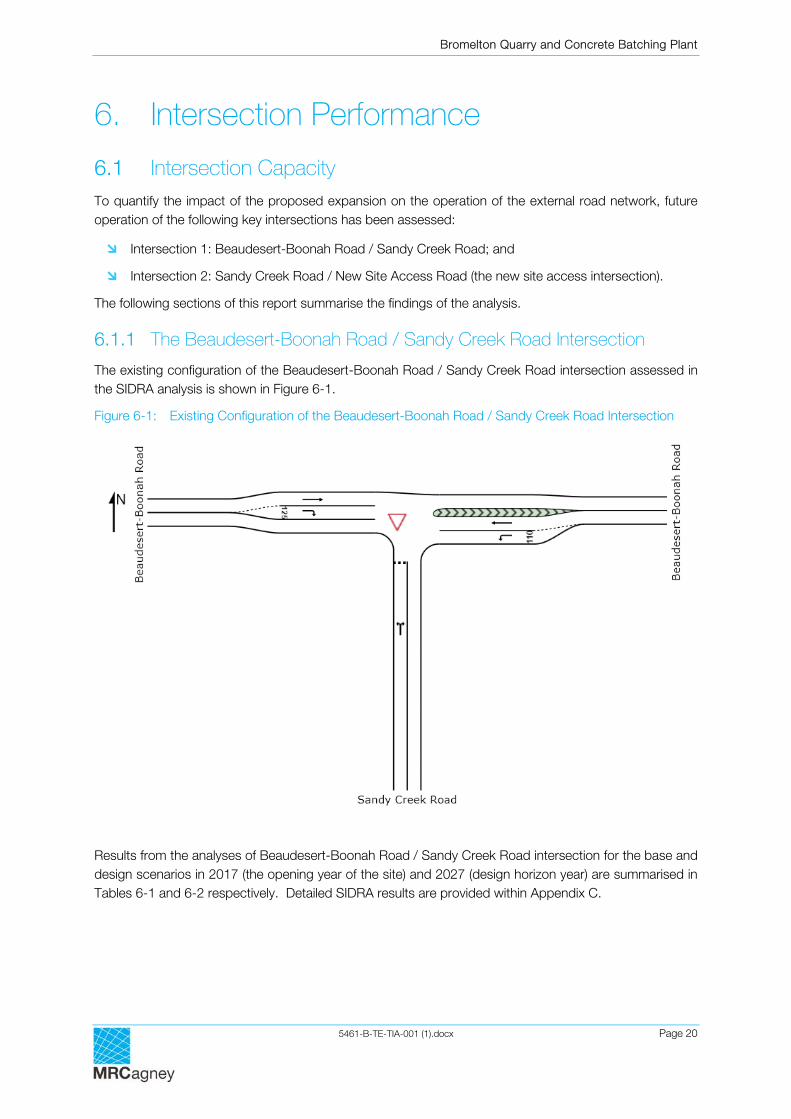
6.1.1 The Beaudesert-Boonah Road / Sandy Creek Road Intersection
The existing configuration of the Beaudesert-Boonah Road / Sandy Creek Road intersection assessed in the SIDRA analysis is shown in Figure 6-1.
Figure 6-1: Existing Configuration of the Beaudesert-Boonah Road / Sandy Creek Road Intersection
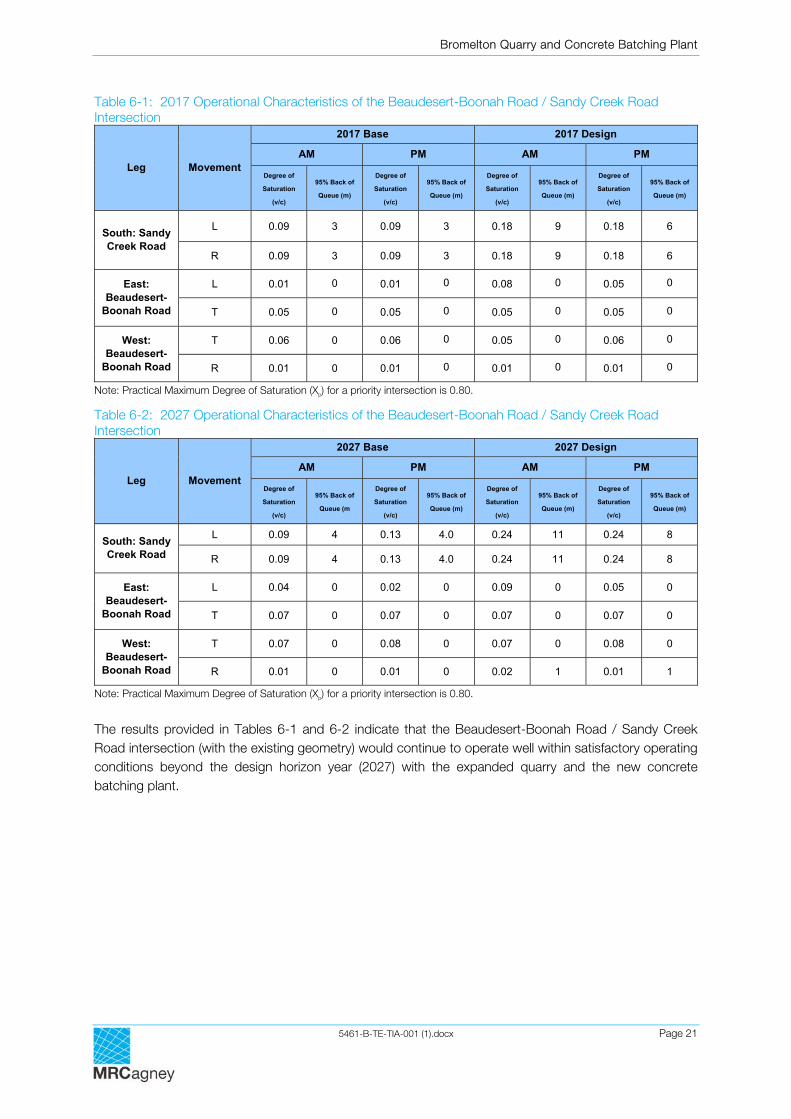
Results from the analyses of Beaudesert-Boonah Road / Sandy Creek Road intersection for the base and design scenarios in 2017 (the opening year of the site) and 2027 (design horizon year) are summarised in Tables 6-1 and 6-2 respectively. Detailed SIDRA results are provided within Appendix C.
Bromelton Quarry and Concrete Batching Plant
5461-B-TE-TIA-001 (1).docx Page 21
Table 6-1: 2017 Operational Characteristics of the Beaudesert-Boonah Road / Sandy Creek Road Intersection
Leg Movement
2017 Base 2017 Design
AM PM AM PM
Degree of
Saturation
(v/c)
95% Back of
Queue (m)
Degree of
Saturation
(v/c)
95% Back of
Queue (m)
Degree of
Saturation
(v/c)
95% Back of
Queue (m)
Degree of
Saturation
(v/c)
95% Back of
Queue (m)
South: Sandy Creek Road
L 0.09 3 0.09 3 0.18 9 0.18 6
R 0.09 3 0.09 3 0.18 9 0.18 6
East: Beaudesert-
Boonah Road
L 0.01 0 0.01 0 0.08 0 0.05 0
T 0.05 0 0.05 0 0.05 0 0.05 0
West: Beaudesert-
Boonah Road
T 0.06 0 0.06 0 0.05 0 0.06 0
R 0.01 0 0.01 0 0.01 0 0.01 0
Note: Practical Maximum Degree of Saturation (Xp) for a priority intersection is 0.80.
Table 6-2: 2027 Operational Characteristics of the Beaudesert-Boonah Road / Sandy Creek Road Intersection
Leg Movement
2027 Base 2027 Design
AM PM AM PM
Degree of
Saturation
(v/c)
95% Back of
Queue (m
Degree of
Saturation
(v/c)
95% Back of
Queue (m)
Degree of
Saturation
(v/c)
95% Back of
Queue (m)
Degree of
Saturation
(v/c)
95% Back of
Queue (m)
South: Sandy Creek Road
L 0.09 4 0.13 4.0 0.24 11 0.24 8
R 0.09 4 0.13 4.0 0.24 11 0.24 8
East: Beaudesert-
Boonah Road
L 0.04 0 0.02 0 0.09 0 0.05 0
T 0.07 0 0.07 0 0.07 0 0.07 0
West: Beaudesert-
Boonah Road
T 0.07 0 0.08 0 0.07 0 0.08 0
R 0.01 0 0.01 0 0.02 1 0.01 1
Note: Practical Maximum Degree of Saturation (Xp) for a priority intersection is 0.80.
The results provided in Tables 6-1 and 6-2 indicate that the Beaudesert-Boonah Road / Sandy Creek Road intersection (with the existing geometry) would continue to operate well within satisfactory operating conditions beyond the design horizon year (2027) with the expanded quarry and the new concrete batching plant.
Bromelton Quarry and Concrete Batching Plant
5461-B-TE-TIA-001 (1).docx Page 22
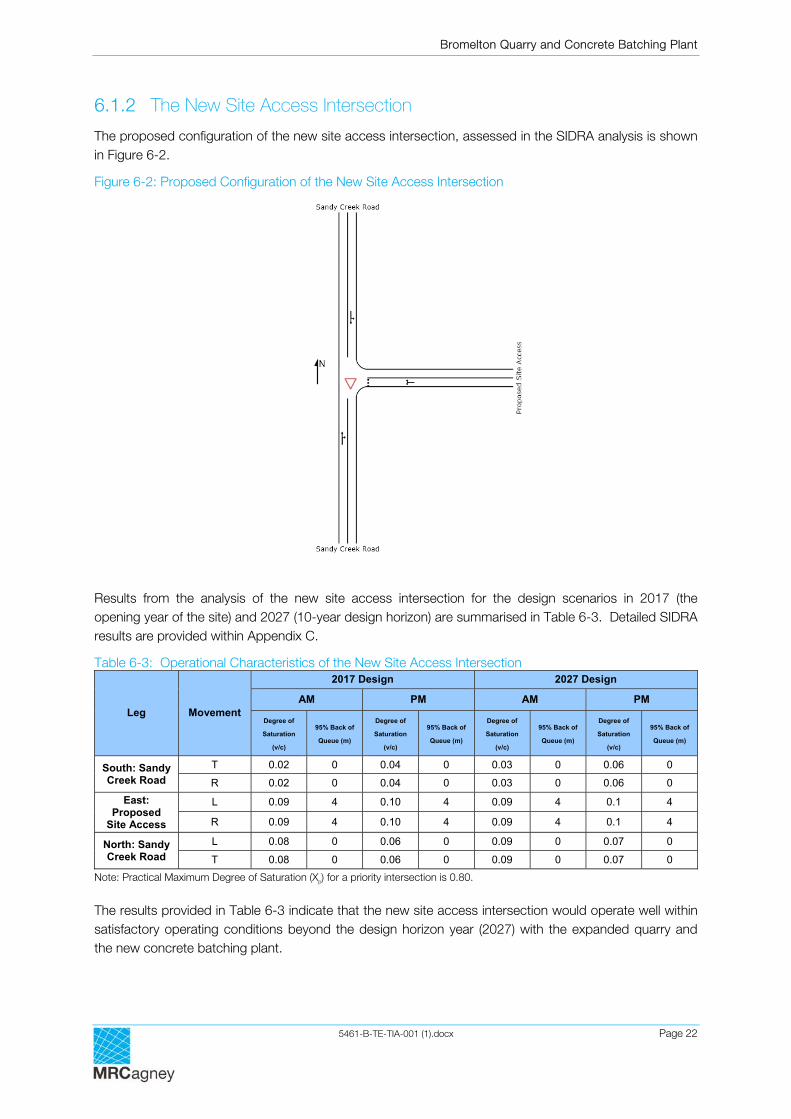
6.1.2 The New Site Access Intersection
The proposed configuration of the new site access intersection, assessed in the SIDRA analysis is shown in Figure 6-2.
Figure 6-2: Proposed Configuration of the New Site Access Intersection
Results from the analysis of the new site access intersection for the design scenarios in 2017 (the opening year of the site) and 2027 (10-year design horizon) are summarised in Table 6-3. Detailed SIDRA results are provided within Appendix C.
Table 6-3: Operational Characteristics of the New Site Access Intersection
Leg Movement
2017 Design 2027 Design
AM PM AM PM
Degree of
Saturation
(v/c)
95% Back of
Queue (m)
Degree of
Saturation
(v/c)
95% Back of
Queue (m)
Degree of
Saturation
(v/c)
95% Back of
Queue (m)
Degree of
Saturation
(v/c)
95% Back of
Queue (m)
South: Sandy Creek Road
T 0.02 0 0.04 0 0.03 0 0.06 0
R 0.02 0 0.04 0 0.03 0 0.06 0
East: Proposed
Site Access
L 0.09 4 0.10 4 0.09 4 0.1 4
R 0.09 4 0.10 4 0.09 4 0.1 4
North: Sandy Creek Road
L 0.08 0 0.06 0 0.09 0 0.07 0
T 0.08 0 0.06 0 0.09 0 0.07 0
Note: Practical Maximum Degree of Saturation (Xp) for a priority intersection is 0.80.
The results provided in Table 6-3 indicate that the new site access intersection would operate well within satisfactory operating conditions beyond the design horizon year (2027) with the expanded quarry and the new concrete batching plant.
Bromelton Quarry and Concrete Batching Plant
5461-B-TE-TIA-001 (1).docx Page 23
6.2 Turn Lane Treatments Consideration of appropriate turn lane treatments for the Beaudesert-Boonah Road / Sandy Creek Road intersection and the new site access intersection are outlined in this section.
Applying the critical traffic scenarios (2027 AM and PM design scenarios) ensures the warrants for the turn treatments are properly tested for all traffic conditions.
It is noted that the speed limits of Beaudesert-Boonah Road and Sandy Creek Road are both 100km/h.
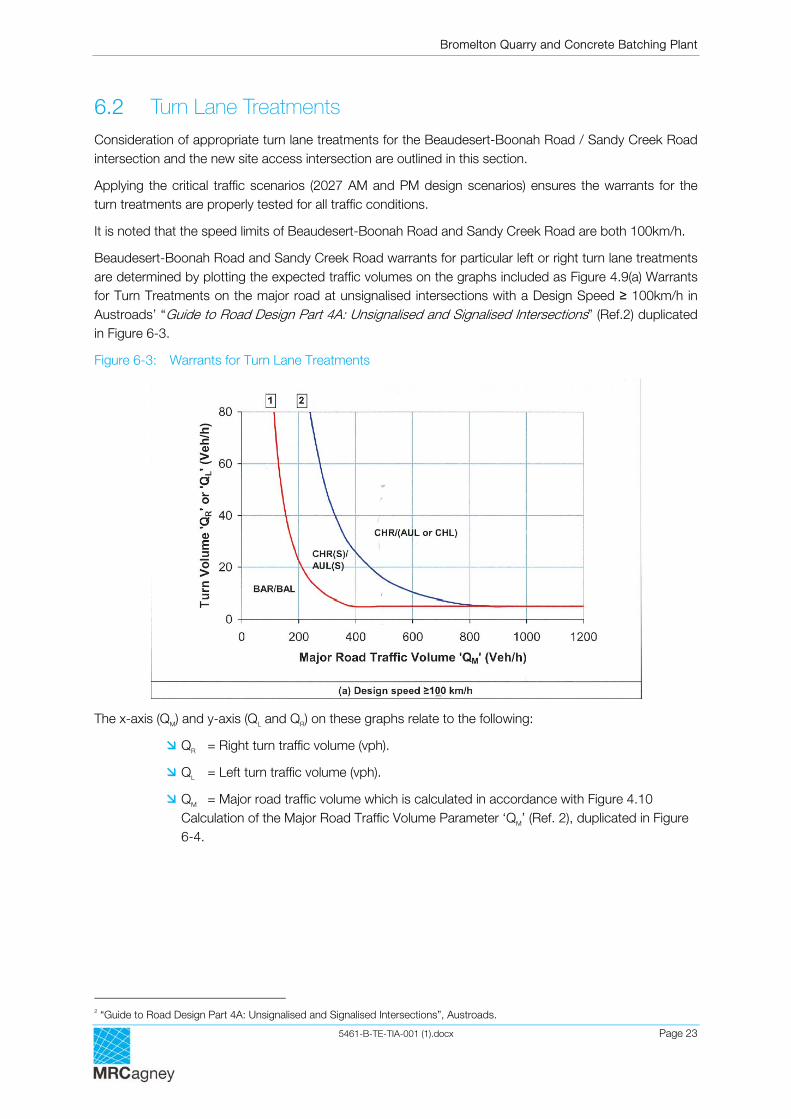
Beaudesert-Boonah Road and Sandy Creek Road warrants for particular left or right turn lane treatments are determined by plotting the expected traffic volumes on the graphs included as Figure 4.9(a) Warrants for Turn Treatments on the major road at unsignalised intersections with a Design Speed ≥ 100km/h in Austroads’ “Guide to Road Design Part 4A: Unsignalised and Signalised Intersections” (Ref.2) duplicated in Figure 6-3.
Figure 6-3: Warrants for Turn Lane Treatments
The x-axis (QM) and y-axis (QL and QR) on these graphs relate to the following:
QR = Right turn traffic volume (vph).
QL = Left turn traffic volume (vph).
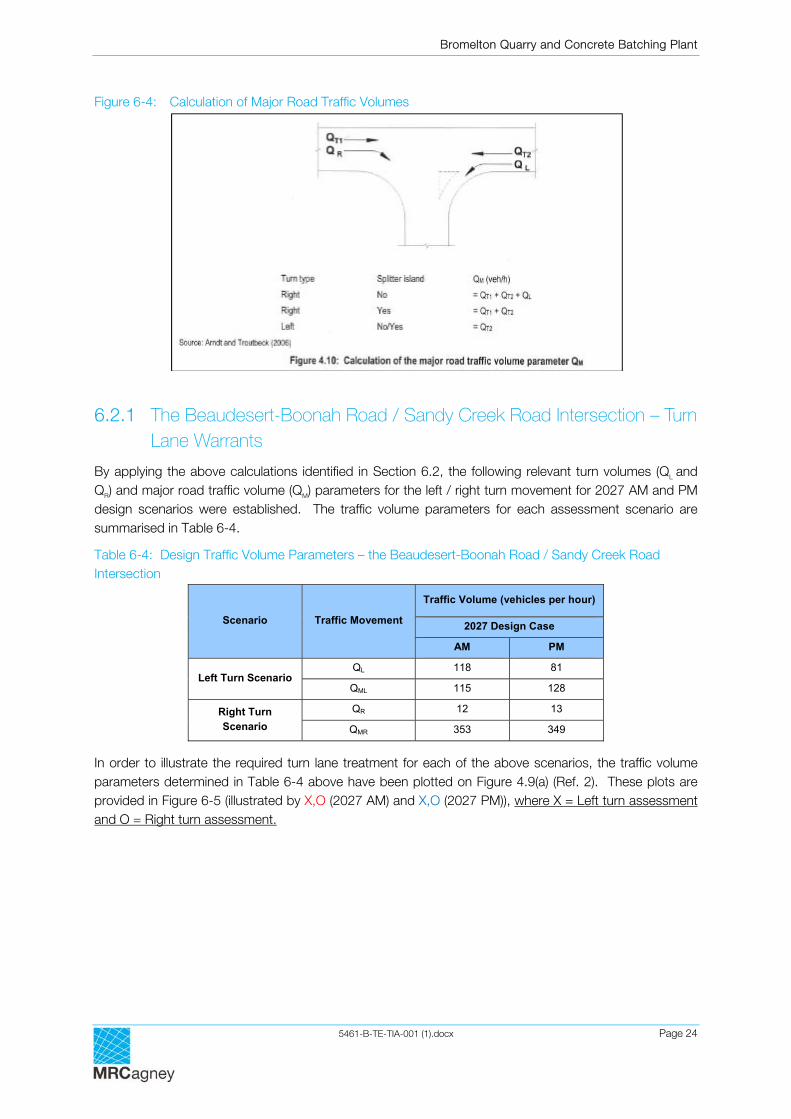
QM = Major road traffic volume which is calculated in accordance with Figure 4.10 Calculation of the Major Road Traffic Volume Parameter ‘QM’ (Ref. 2), duplicated in Figure 6-4.
2 “Guide to Road Design Part 4A: Unsignalised and Signalised Intersections”, Austroads.
Bromelton Quarry and Concrete Batching Plant
5461-B-TE-TIA-001 (1).docx Page 24
Figure 6-4: Calculation of Major Road Traffic Volumes
6.2.1 The Beaudesert-Boonah Road / Sandy Creek Road Intersection – Turn Lane Warrants
By applying the above calculations identified in Section 6.2, the following relevant turn volumes (QL and QR) and major road traffic volume (QM) parameters for the left / right turn movement for 2027 AM and PM design scenarios were established. The traffic volume parameters for each assessment scenario are summarised in Table 6-4.
Table 6-4: Design Traffic Volume Parameters – the Beaudesert-Boonah Road / Sandy Creek Road Intersection
Scenario Traffic Movement
Traffic Volume (vehicles per hour)
2027 Design Case
AM PM
Left Turn Scenario QL 118 81
QML 115 128
Right Turn Scenario
QR 12 13
QMR 353 349
In order to illustrate the required turn lane treatment for each of the above scenarios, the traffic volume parameters determined in Table 6-4 above have been plotted on Figure 4.9(a) (Ref. 2). These plots are provided in Figure 6-5 (illustrated by X,O (2027 AM) and X,O (2027 PM)), where X = Left turn assessment and O = Right turn assessment.
Bromelton Quarry and Concrete Batching Plant
5461-B-TE-TIA-001 (1).docx Page 25
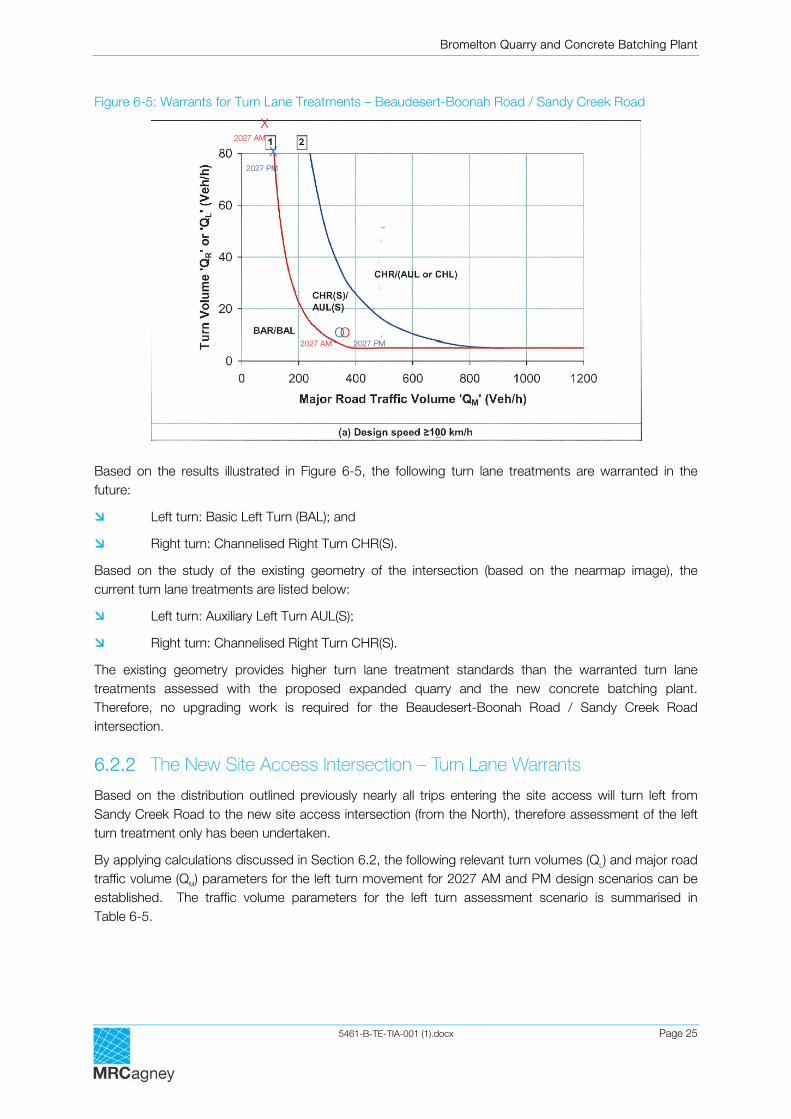
Figure 6-5: Warrants for Turn Lane Treatments – Beaudesert-Boonah Road / Sandy Creek Road
Based on the results illustrated in Figure 6-5, the following turn lane treatments are warranted in the future:
Left turn: Basic Left Turn (BAL); and
Right turn: Channelised Right Turn CHR(S).
Based on the study of the existing geometry of the intersection (based on the nearmap image), the current turn lane treatments are listed below:
Left turn: Auxiliary Left Turn AUL(S);
Right turn: Channelised Right Turn CHR(S).
The existing geometry provides higher turn lane treatment standards than the warranted turn lane treatments assessed with the proposed expanded quarry and the new concrete batching plant. Therefore, no upgrading work is required for the Beaudesert-Boonah Road / Sandy Creek Road intersection.
6.2.2 The New Site Access Intersection – Turn Lane Warrants
Based on the distribution outlined previously nearly all trips entering the site access will turn left from Sandy Creek Road to the new site access intersection (from the North), therefore assessment of the left turn treatment only has been undertaken.
By applying calculations discussed in Section 6.2, the following relevant turn volumes (QL) and major road traffic volume (QM) parameters for the left turn movement for 2027 AM and PM design scenarios can be established. The traffic volume parameters for the left turn assessment scenario is summarised in Table 6-5.
2027 PM
2027 AM
2027 PM 2027 AM O
X
X
O
Bromelton Quarry and Concrete Batching Plant
5461-B-TE-TIA-001 (1).docx Page 26
Table 6-5: Design Traffic Volume Parameters – The New Site Access Intersection
Scenario Traffic Movement
Traffic Volume (vehicles per hour)
2027 Design Case
AM PM
Left Turn Scenario QL 68 61
QML 61 33
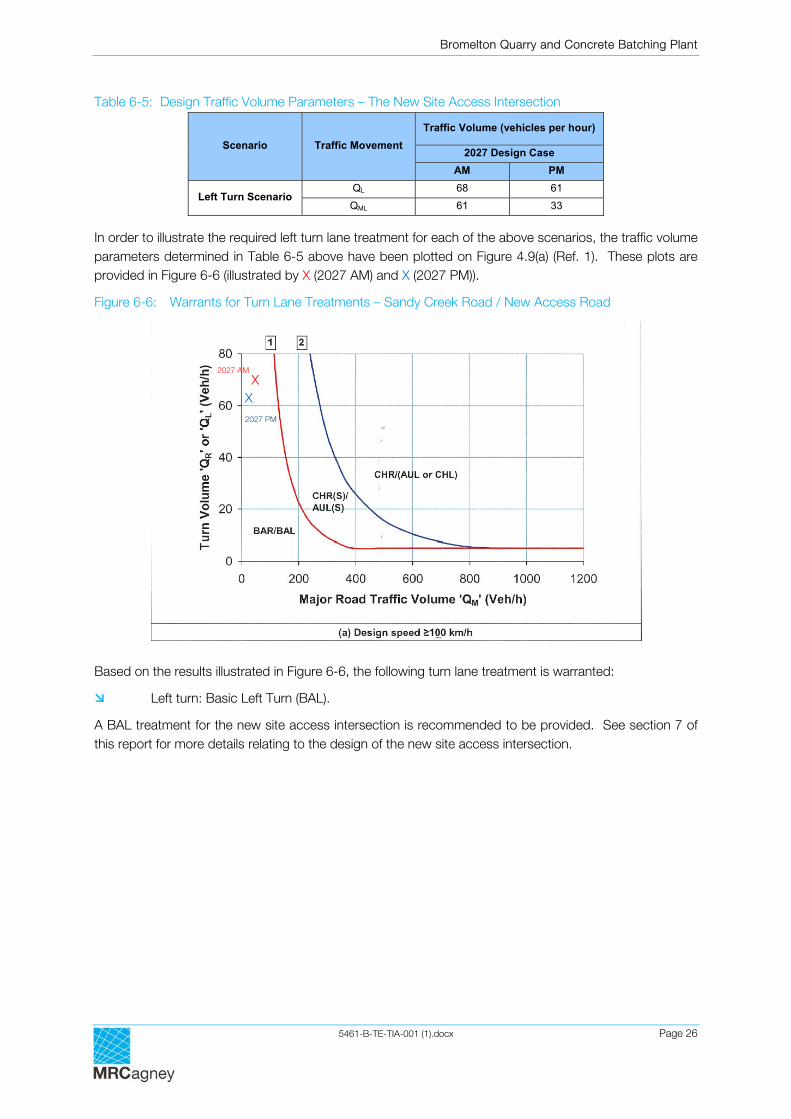
In order to illustrate the required left turn lane treatment for each of the above scenarios, the traffic volume parameters determined in Table 6-5 above have been plotted on Figure 4.9(a) (Ref. 1). These plots are provided in Figure 6-6 (illustrated by X (2027 AM) and X (2027 PM)).
Figure 6-6: Warrants for Turn Lane Treatments – Sandy Creek Road / New Access Road
Based on the results illustrated in Figure 6-6, the following turn lane treatment is warranted:
Left turn: Basic Left Turn (BAL).
A BAL treatment for the new site access intersection is recommended to be provided. See section 7 of this report for more details relating to the design of the new site access intersection.
2027 PM
2027 AM X
X
Bromelton Quarry and Concrete Batching Plant
5461-B-TE-TIA-001 (1).docx Page 27
7. The Proposed New Site Access
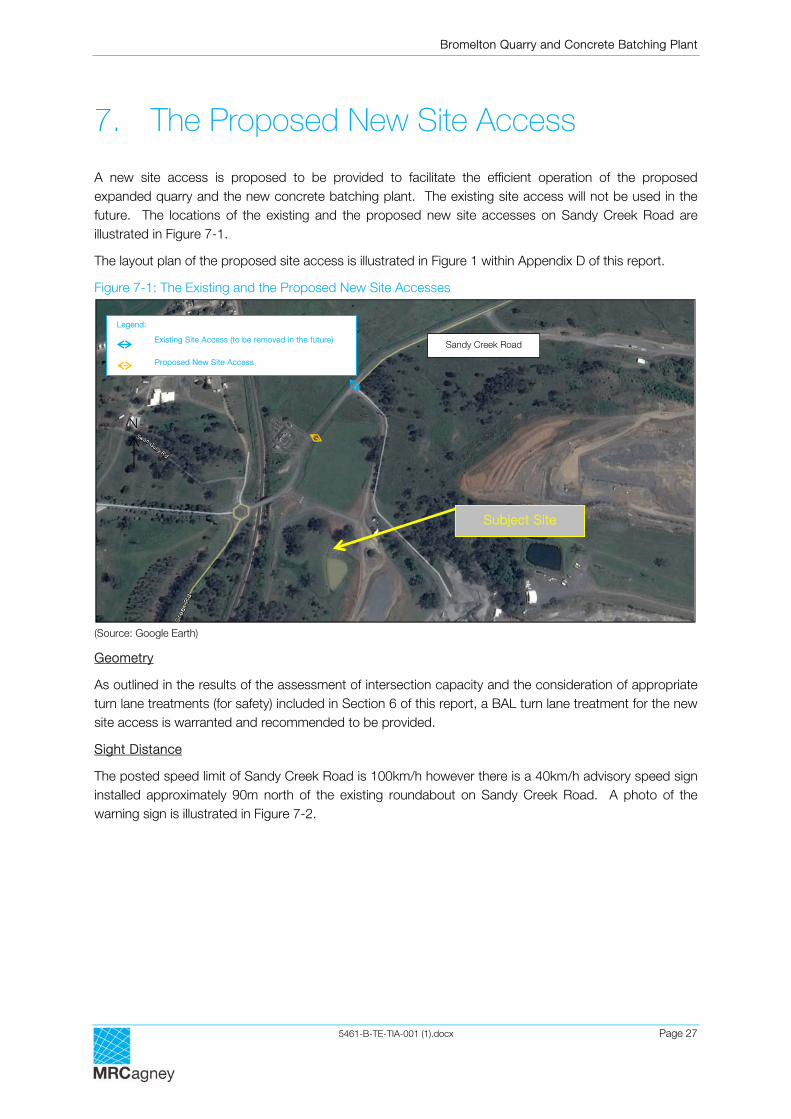
A new site access is proposed to be provided to facilitate the efficient operation of the proposed expanded quarry and the new concrete batching plant. The existing site access will not be used in the future. The locations of the existing and the proposed new site accesses on Sandy Creek Road are illustrated in Figure 7-1.
The layout plan of the proposed site access is illustrated in Figure 1 within Appendix D of this report.
Figure 7-1: The Existing and the Proposed New Site Accesses
(Source: Google Earth) Geometry
As outlined in the results of the assessment of intersection capacity and the consideration of appropriate turn lane treatments (for safety) included in Section 6 of this report, a BAL turn lane treatment for the new site access is warranted and recommended to be provided.
Sight Distance
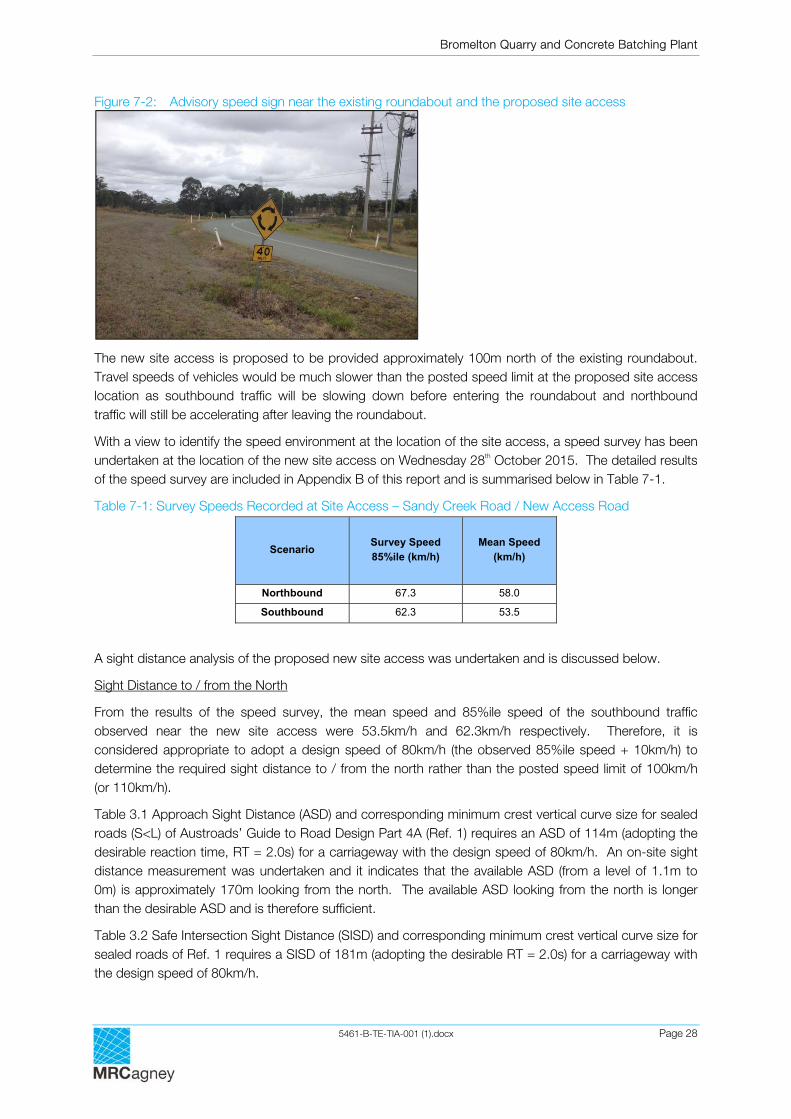
The posted speed limit of Sandy Creek Road is 100km/h however there is a 40km/h advisory speed sign installed approximately 90m north of the existing roundabout on Sandy Creek Road. A photo of the warning sign is illustrated in Figure 7-2.
Sandy Creek Road
Legend: Existing Site Access (to be removed in the future) Proposed New Site Access
Subject Site
N
Bromelton Quarry and Concrete Batching Plant
5461-B-TE-TIA-001 (1).docx Page 28
Figure 7-2: Advisory speed sign near the existing roundabout and the proposed site access
The new site access is proposed to be provided approximately 100m north of the existing roundabout. Travel speeds of vehicles would be much slower than the posted speed limit at the proposed site access location as southbound traffic will be slowing down before entering the roundabout and northbound traffic will still be accelerating after leaving the roundabout.
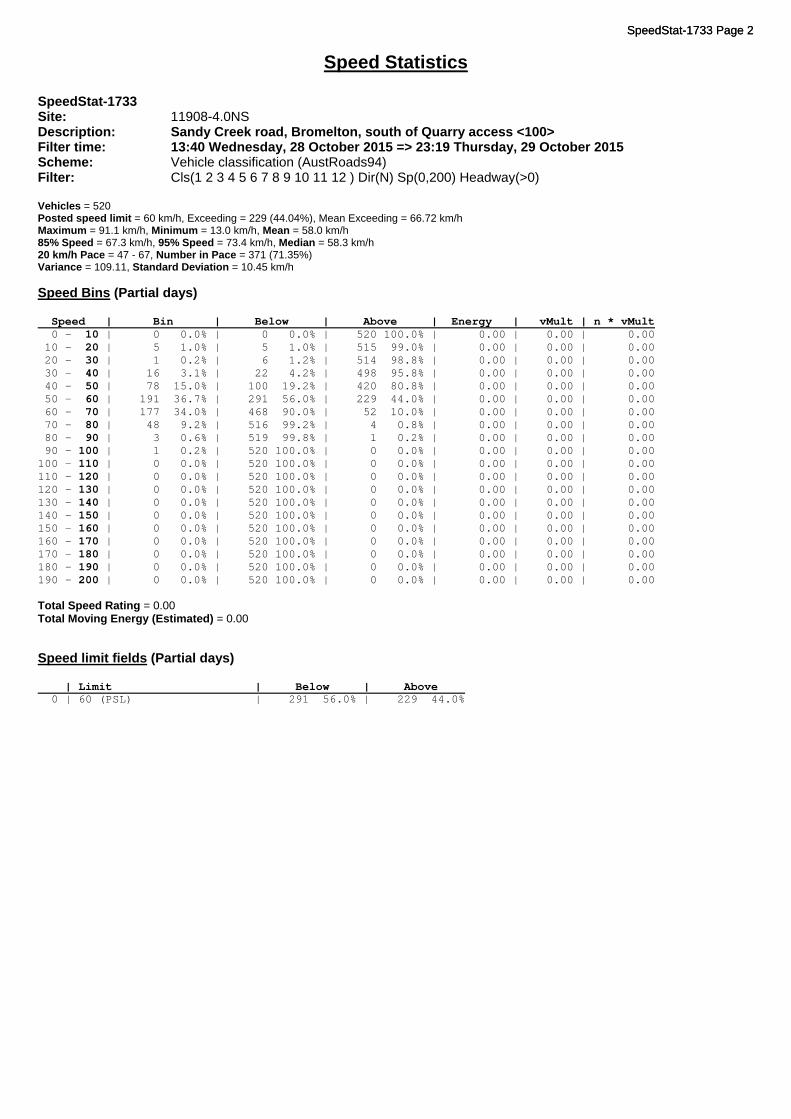
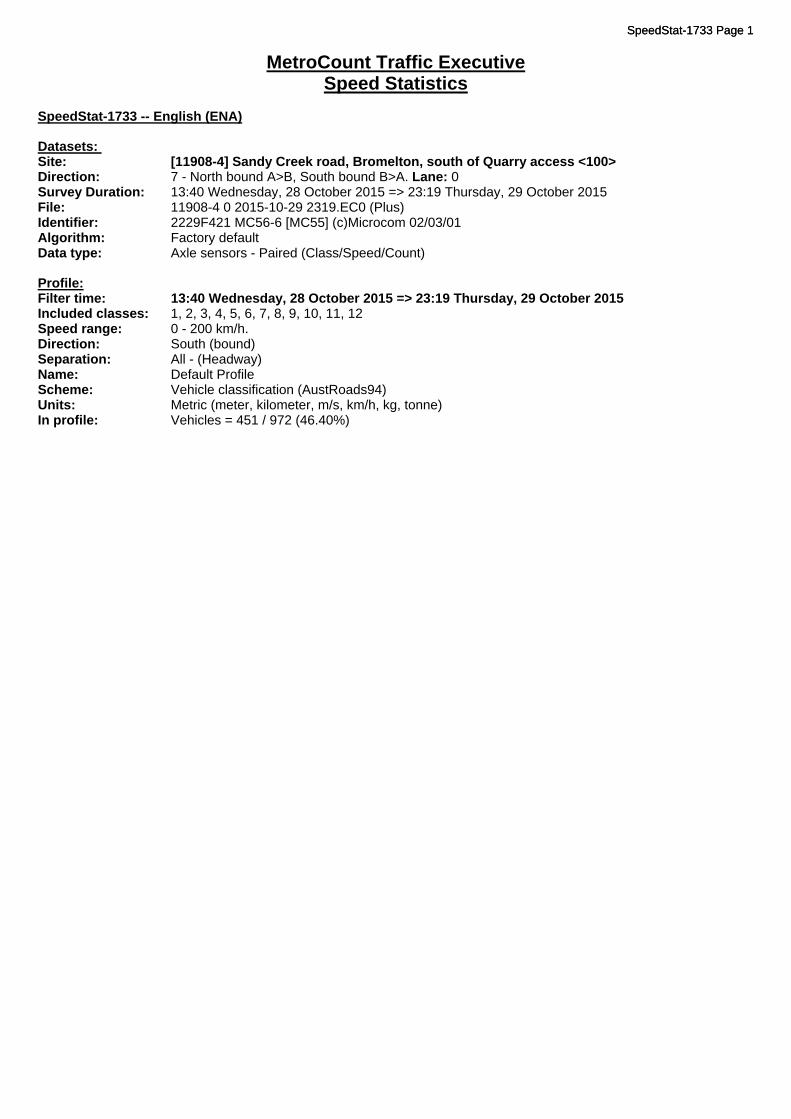
With a view to identify the speed environment at the location of the site access, a speed survey has been undertaken at the location of the new site access on Wednesday 28th October 2015. The detailed results of the speed survey are included in Appendix B of this report and is summarised below in Table 7-1.
Table 7-1: Survey Speeds Recorded at Site Access – Sandy Creek Road / New Access Road
Scenario Survey Speed 85%ile (km/h)
Mean Speed (km/h)
Northbound 67.3 58.0
Southbound 62.3 53.5
A sight distance analysis of the proposed new site access was undertaken and is discussed below.
Sight Distance to / from the North
From the results of the speed survey, the mean speed and 85%ile speed of the southbound traffic observed near the new site access were 53.5km/h and 62.3km/h respectively. Therefore, it is considered appropriate to adopt a design speed of 80km/h (the observed 85%ile speed + 10km/h) to determine the required sight distance to / from the north rather than the posted speed limit of 100km/h (or 110km/h).
Table 3.1 Approach Sight Distance (ASD) and corresponding minimum crest vertical curve size for sealed roads (S<L) of Austroads’ Guide to Road Design Part 4A (Ref. 1) requires an ASD of 114m (adopting the desirable reaction time, RT = 2.0s) for a carriageway with the design speed of 80km/h. An on-site sight distance measurement was undertaken and it indicates that the available ASD (from a level of 1.1m to 0m) is approximately 170m looking from the north. The available ASD looking from the north is longer than the desirable ASD and is therefore sufficient.
Table 3.2 Safe Intersection Sight Distance (SISD) and corresponding minimum crest vertical curve size for sealed roads of Ref. 1 requires a SISD of 181m (adopting the desirable RT = 2.0s) for a carriageway with the design speed of 80km/h.
Bromelton Quarry and Concrete Batching Plant
5461-B-TE-TIA-001 (1).docx Page 29
The results of the on-site sight distance measurement, illustrated in Figure 1 within Attachment D of this report, indicate that the available SISD (from a level of 1.1m to 1.25m) looking to the north is approximately 230m. The available SISD looking to the north is longer than the desirable SISD and is therefore sufficient.
Sight Distance to / from the South (towards the existing roundabout)
The existing roundabout, located approximately 100m south of the proposed site access, has a central island of 30m diameter. The maximum travelling speed at the existing roundabout is not anticipated to exceed 40km/h. Therefore, it is considered appropriate to adopt a design speed of 50km/h (travelling speed + 10km/h) to determine the required sight distance to / from the south (the roundabout).
Table 3.1 Approach Sight Distance (ASD) and corresponding minimum crest vertical curve size for sealed roads (S<L) of Ref. 1 requires an ASD of 55m (adopting the desirable RT = 2.0s) for a carriageway with the design speed of 50km/h. The results of the on-site sight distance measurement indicate that the available ASD (from a level of 1.1m to 0m) is more than 100m looking from the south. The available ASD looking from the south is longer than the desirable ASD and is therefore sufficient.
Table 3.2 Safe Intersection Sight Distance (SISD) and corresponding minimum crest vertical curve size for sealed roads (S<L) of Ref. 1 requires a SISD of 97m (adopting the desirable RT = 2.0s) for a carriageway with the design speed of 50km/h.
The results of the on-site sight distance measurement, illustrated in Figure 1 within Attachment D of this report, indicate that the available SISD (from a level of 1.1m to 1.25m) looking to the south is approximately 109m. The available SISD looking to the south is longer than the desirable SISD and is therefore sufficient.
Bromelton Quarry and Concrete Batching Plant
5461-B-TE-TIA-001 (1).docx Page 30
8. Pavement Contribution
8.1 Pavement Contributions for State-Controlled Roads DTMR has identified a number of roads (Beaudesert Town Centre Bypass, Mount Lindesay Highway Deviation and Beaudesert – Boonah Road) which will need to be upgraded or constructed to mitigate traffic related impacts from future development within the Bromelton State Development Area (BSDA). It is envisaged that the costs for the identified infrastructure projects together with a yet to be developed apportionment methodology will form the basis of infrastructure agreements to be entered into by the various developers within the BSDA.
The State-controlled Road Infrastructure Costing - Bromelton State Development Area (Ref.3) states that:
“Based on the agreed infrastructure cost of $372,102,043 (refer Appendix I (of Ref.3) for correspondence from TMR) and the agreed area of 6,444 hectares, a contribution rate of $5.77 per square metre has been agreed.”
The subject site is located within the BSDA. Therefore, adopting the recommendation of Ref. 3, the applicable pavement contribution for State-controlled roads associated with the proposed expanded quarry and the new concrete batching plant is $5.77 per square metre.
8.1.1 Pavement Contributions for State-Controlled Roads – the Proposed Expanded Quarry
The additional site area of the proposed expansion of the Bromelton Quarry is understood to be 51.25 hectares (512,500 square metres) i.e on the basis of the recommendation of Ref. 3, the applicable infrastructure contribution associated with the proposed expansion would be $2.957M (= $5.77 per square metre x 512,500 square metres). It is considered unlikely that the 'per square metre of development' philosophy is strictly applicable to the land use of a quarry; it would moreso be applicable to more traditional uses expected in a State Development Area, such as industrial uses for example. Additionally, it is considered to be a substantially prohibitive contribution cost if the applicant is required to pay a lump sum infrastructure cost upfront.
Notwithstanding this, some consideration of contributions that could reasonably be collected has been made as follows.
Based on the recent resource investigation undertaken in February 2014, MRCagney has been advised that the proposed expanded site area would contain in the order of 60M tonnes of material. Depending on the actual annual production rate, the life span of the expanded portion of the quarry could vary from 15 years to 60 years. An infrastructure contribution could be identified based on the production volume, i.e. cents / tonne.
As previously noted, the infrastructure contribution, as determined adopting the methodology outlined in Ref. 3 for the proposed expansion of the Bromelton Quarry would be $2.957M. Material forecast to be produced from the expanded site area is in the order of 60M tonnes. Consequently the identified infrastructure contribution per tonne for the proposed expansion of the Bromelton Quarry would be $0.0493 / tonne or 4.93 cents / tonne (= $2.957M / 60M tonnes).
Should all of the material from the site be hauled by road, then this contribution rate could be considered appropriate. 3 “State-controlled Road Infrastructure Costing Bromelton State Development Area”, Geleon Consulting, 5th July 2013.
Bromelton Quarry and Concrete Batching Plant
5461-B-TE-TIA-001 (1).docx Page 31
As noted, it is understood that the proposal is to haul 2.0Mt of the material from the site via rail, therefore this material should be exempt from the infrastructure contribution as no damage is being imparted on the road pavement associated with that material. Finally, it is also reasonable that the existing approval portion of the road haulage (200kt/year) should also be exempt.
As noted, whilst the land use of a quarry is not necessarily that envisaged in the preparation of Ref. 3, an appropriate methodology of determining pavement contributions should be determined. The approach explored herein quantifies the contribution amount that would be anticipated with development of the site area (51.25Ha) and apportions that cost amongst the haul vehicles that would be needed to extract the material anticipated to be available in conjunction with the application land, thereby yielding a 'cents per tonne' contribution. Consideration is then given to the fact that material transported by rail should not attract a contribution as no pavement damage would result from the transportation of that material, so accordingly a reasonable and relevant contribution of 4.93 cents/tonne could be conditioned associated with the haulage of material by road. As noted, the first 200kt/year hauled should be exempt from this contribution due to the existing approval.
8.1.2 Pavement Contributions for State-Controlled Roads – the New Concrete Batching Plant
The land use of the proposed concrete batching plant is a use more akin to that envisaged in Ref. 3; accordingly the 'per square metre of development ' approach is considered appropriate.
The site area of the new concrete batching plant is understood to be 3,450 square metres; therefore the infrastructure contribution associated with the new concrete batching plant would be $19,906.50 (= $5.77 per square metre x 3,450 square metres). This contribution is considered to be appropriate.
Bromelton Quarry and Concrete Batching Plant
5461-B-TE-TIA-001 (1).docx Page 32
9. Summary of Findings
MRCagney has been commissioned to prepare a Traffic Impact Assessment (TIA) report as part of a development application for the proposed expansion of the existing Bromelton Quarry and a new concrete batching plant located onsite.
MRCagney has been advised that the current maximum annual production rate of the existing quarry is 1.0M tonnes per annum; with transportation of material limited to 0.2M tonnes per annum by road and 0.8M tonnes per annum by rail.
The upper limit of annual production of the Bromelton Quarry is proposed to be increased to 3.5M tonnes per annum, of which 1.5M tonnes will be transported by road and 2.0M tonnes will be transported by rail. The upper limit of annual production of the new concrete batching plant is proposed to be 30,000m3 per year. The average production rates of the expanded quarry and the new concrete batching plant are estimated to be approximately 80% of the production thresholds.
The external traffic impact of the development has been assessed based on maximum production rates of the proposed expansion of the Bromelton Quarry (by road) and the new concrete batching plant in order to ensure satisfactory operation of road infrastructure components at all times during the operational period of the site. It is noted that a very conservative assumption of essentially allowing for haulage from the quarry site of up to 2.0MT/year has been included in the analysis.
Site Access
A new site access is proposed to be provided to facilitate efficient operation of the proposed expanded quarry and new concrete batching plant. The existing site access will not be used in the future.
As outlined in the results of the assessment of intersection capacity and the consideration of appropriate turn lane treatments (for safety) included in Section 6 of this report, a BAL left turn lane treatment for the new site access is warranted and recommended to be provided.
The results from the sight distance assessment of the new site access indicate that the available sight distances are sufficient.
The layout plan of the proposed site access is illustrated in Figure 1 within Appendix D of this report.
Traffic Impact
It is anticipated that the proposed expanded quarry and the new concrete batching plant will commence operation in 2017, after the completion of the Beaudesert Town Centre Bypass. Therefore, the 10-year design horizon of the proposal is 2027.
The results of the SIDRA analyses, included in Section 6 of this report, which included very conservative assumptions, including essentially allowing for 2.0MT/year haulage from this site, illustrate that the Beaudesert-Boonah Road / Sandy Creek Road intersection (with the existing geometry) and the Sandy Creek Road / new site access intersection would operate within satisfactory operating conditions beyond the design horizon year (2027) of the proposed expanded quarry and the new concrete batching plant.
Based on the results of an assessment of the appropriate turn lane treatments included in Section 6.2.1, the existing geometry of the Beaudesert-Boonah Road / Sandy Creek Road intersection provides higher turn lane treatment standards than the warranted turn lane treatments in the future with the proposed expanded quarry and the new concrete batching plant. Therefore, no upgrading work is required for the Beaudesert-Boonah Road / Sandy Creek Road intersection.
Bromelton Quarry and Concrete Batching Plant
5461-B-TE-TIA-001 (1).docx Page 33
Consequently no external intersection improvements, except the proposed new site access, are required in conjunction with the proposal.
Pavement Contributions for State-Controlled Roads
1) Pavement Contributions for State-Controlled Roads - Proposed Expanded Quarry
Based on the State-controlled Road Infrastructure Costing - Bromelton State Development Area (Ref. 3), the applicable infrastructure contribution for the proposed expansion (additional site area of 51.25 hectares) would be $2.957M (= $5.77 per square metre x 512,500 square metres). This is a substantially prohibitive contribution cost if the applicant is required to pay the lump sum infrastructure cost upfront.
It is proposed that the infrastructure contribution be payed based on the production volume, i.e. on a cents / tonne basis. The material forecast to be available within the proposed expanded site area is in the order of 60M tonnes; the infrastructure contribution per tonne of the proposed expansion would be therefore $0.0493 / tonne or 4.93 cents / tonne (= $2.957M / 60M tonnes) for that material to be transported by road. Should all of the material from the site be hauled by road, then this contribution rate could be considered appropriate.
As discussed in the report, it is understood that the proposal is to haul 2.0Mt of the material from the site via rail, therefore this material should be exempt from the infrastructure contribution as no damage is being imparted on the road pavement associated with that material. Finally, it is reasonable that the existing approval portion of the road haulage (200kt/year) should also be exempt.
As noted, whilst the land use of a quarry is not necessarily that envisaged in the preparation of Ref. 3, an appropriate methodology of determining pavement contributions should be determined. The approach explored herein quantifies the contribution amount that would be anticipated with development of the site area (51.25Ha) and apportions that cost amongst the haul vehicles that would be needed to extract the material anticipated to be available in conjunction with the application land, thereby yielding a 'cents per tonne' contribution. Consideration is then given to the fact that material transported by rail should not attract a contribution as no pavement damage would result from the transportation of that material, so accordingly a reasonable and relevant contribution of 4.93 cents/tonne could be conditioned associated with the haulage of material by road. As noted, the first 200kt/year hauled should be exempt from this contribution due to the existing approval.
2) Pavement Contributions for State-Controlled Roads - New Concrete Batching Plant
The site area of the new concrete batching plant is understood to be 3,450 square metres; adopting the recommendation of Ref. 3, the infrastructure contribution for the new concrete batching plant would be $19,906.50 (= $5.77 per square metre x 3,450 square metres).
Conclusions
Provided the above site access works are provided in accordance with the appropriate Australian design standards, there are no traffic engineering reasons not to approve the proposed development.

Bromelton Quarry and Concrete Batching Plant
5461-B-TE-TIA-001 (E).docx
Appendix A
Site Plan
Logan River
Sandy Creek
Logan River
N6903500
1RP98576
1RP32189
1RP139860
9
50WD4843
1RP186498
2RP191574
2R
P45
731
7RP812177
8RP812177
3RP191574
4RP179248
5RP210113
6RP210113
2RP192033
1RP192033
13SP125271
1RP177490
26SP114956
161SP107030
2RP177490
65W311348
2SP132357
1RP867614
1RP168389
4RP45231
DSP146022
CSP
1460
22
BSP146022
ASP146022
Sand
y C
reek
Roa
d
Bris
bane
- S
ydne
y R
ailw
ay
Bench 110mAHD
Bench 130mAHD
Bench 110mAHD
Bench 130mAHD
E49
2500
E49
3000
E49
3500
E49
4000
E49
4500
E49
5000
E49
2500
E49
3000
E49
3500
E49
4000
E49
4500
E49
5000
N6902000
N6902500
N6903000
N6902000
N6902500
N6903000
N6903500Swan Gully Road
A.J.Bush & Sons'Rendering Plant
EnergexElectricitySubstation
20m
30m
30m min.10
m
THESE DESIGNS AND PLANS ARE COPYRIGHT AND ARE NOT TO BE USED OR REPRODUCED
WHOLLY OR IN PART OR TO BE USED ON ANY PROJECT WITHOUT THE WRITTEN PERMISSION OF
GROUNDWORK PLUS. ABN: 80 829 145 906
DATEREV DESCRIPTION BY
CLIENT:
PROJECT: TITLE:
DRAWING NUMBER:SCALE:
DRAWN:
0When Printed On A3
DATUM: HORIZONTAL / VERTICAL / ZONE
REVISION:
CHECKED:
Photography:Topography:
Cadastre:Ecosystem:
Other:
/ /Ph: +61 7 3871 0411
www.groundwork.com.au
16 F
ebru
ary
2016
CR
EA
TED
:
DATE:
PRINTED:
4 March 2016
4 March 2016
M:\J
obs\
ID2\
08A
E3B
C5-
EA
C1-
4676
-B0D
2-47
43E
36D
BC
29\0
\790
00-7
9999
\795
36\L
\L\1
083.
DR
G.0
60 -
Qua
rry
Dev
elop
men
t Pla
n (ID
795
36)\1
083.
DR
G.0
60 -
Qua
rry
Dev
elop
men
t Pla
n.dw
gFI
LE N
AM
E:
JOB
SU
B #
:
1083.DRG.060 1
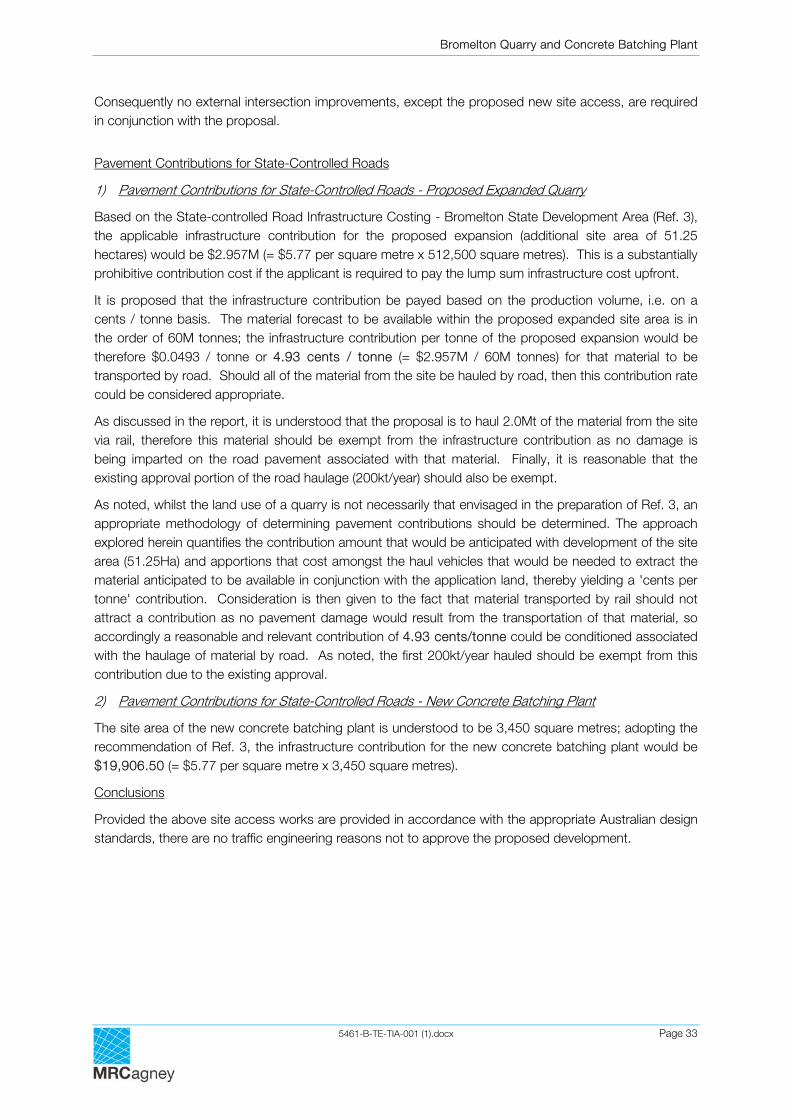
Quarry Development Plan
Bromelton Quarry Pty Ltd
Bromelton Quarry
JS
JT
1:8,000 160
MGA AHD 56
UAV Survey. Date: 2015-08-25; ESRI World Imagery, accessed 2015-11-06UAV Survey. Date: 2015-08-25
Legend:Site BoundaryCadastral Boundary
Cadastral Boundary - WatercourseEasement Boundary
Approved Quarry Footprint
Remnant Vegetation
Proposed Quarry FootprintExisting Operations FootprintProposed Operations Footprint
Future Hardstand Area
Concrete Batching Plant Footprint
Sediment Basin
Proposed Aggregate Secondary Conveyors
Proposed Pit Area
Existing Internal Haul RoadInterim Internal Haul RoadProposed Internal Haul Road
Proposed Rail Siding ConveyorExisting Rail Siding Conveyor
General Sequence Of Extraction
1 04/03/16 JSRevised Concrete Batch Plant
2RP177490
2SP132357
ROAD
BRIS
BAN
E - S
YDN
EY R
AILW
AY
281SP130095
E 4
9280
0 m
E 4
9280
0 m
E 4
9300
0 m
E 4
9300
0 m
E 4
9320
0 m
E 4
9320
0 m
E 4
9340
0 m
E 4
9340
0 m
E 4
9360
0 m
E 4
9360
0 m
N 6903000 m N 6903000 m
N 6903200 m N 6903200 m
N 6903400 m N 6903400 m
ExistingMachinery
Shed
Existing Light Vehicle Access Road
Proposed Site Entry
ProposedWeighbridge& Office
10m
Additional Staff Car Parking
Proposed Sediment Basin
THESE DESIGNS AND PLANS ARE COPYRIGHT AND ARE NOT TO BE USED OR REPRODUCED
WHOLLY OR IN PART OR TO BE USED ON ANY PROJECT WITHOUT THE WRITTEN PERMISSION OF
GROUNDWORK PLUS. ABN: 80 829 145 906
DATEREV DESCRIPTION BY
CLIENT:
PROJECT: TITLE:
DRAWING NUMBER:SCALE:
DRAWN:
0When Printed On A3
DATUM: HORIZONTAL / VERTICAL / ZONE
REVISION:
CHECKED:
Photography:Topography:
Cadastre:Ecosystem:
Other:
/ /Ph: +61 7 3871 0411
www.groundwork.com.au
1 O
ctob
er 2
015
CR
EA
TED
:
DATE:
PRINTED:
4 March 2016
4 March 2016
M:\J
obs\
ID2\
08A
E3B
C5-
EA
C1-
4676
-B0D
2-47
43E
36D
BC
29\0
\790
00-7
9999
\795
31\L
\L\1
083.
DR
G.0
59 -
Pro
cess
ing
Pla
nt &
Bui
ldin
g O
pera
tions
(ID
795
31)\1
083.
DR
G.0
59 -
Pro
cess
ing
Pla
nt &
Bui
ldin
g O
pera
tions
.dw
gFI
LE N
AM
E:
JOB
SU
B #
:
1083.DRG.059 1
Processing Plant & Building Operations Layout
Bromelton Quarry Pty Ltd
Bromelton Quarry
LT
JT
1:2,500 50
MGA 56
UAV Survey. Date: 2015-08-25; ESRI World Imagery, accessed 2015-11-06UAV Survey. Date: 2015-08-25
Legend:Site BoundaryCadastral BoundaryEasement Boundary
Remnant Vegetation Mapping
Future Rail Siding Conveyor
Proposed Quarry FootprintExisting Operations FootprintProposed Operations Footprint
Concrete Batching Plant Footprint
Sediment Basin
Existing Internal Haul RoadInterim Internal Haul Road
Proposed Aggregate Secondary Conveyors
Approved Quarry Footprint
Proposed Internal Haul Road
Vegetated Screening
1 04/03/16 JSRevised Concrete Batch Plant
SAND
Y CR
EEK
ROAD
Site Entry Road
Rail Access Road
Proposed Internal
Prop
osed
CBP
Acce
ss R
oad
Interim Internal Haul Road
Conceptual LayoutSubject to Change
N6903300
N6903350
N6903400
N6903450
N6903500
N6903550
E49
3050
E49
3100
E49
3150
E49
3200
E49
3050
E49
3100
E49
3150
E49
3200
N6903300
N6903350
N6903400
N6903450
N6903500
N6903550
Haul Road
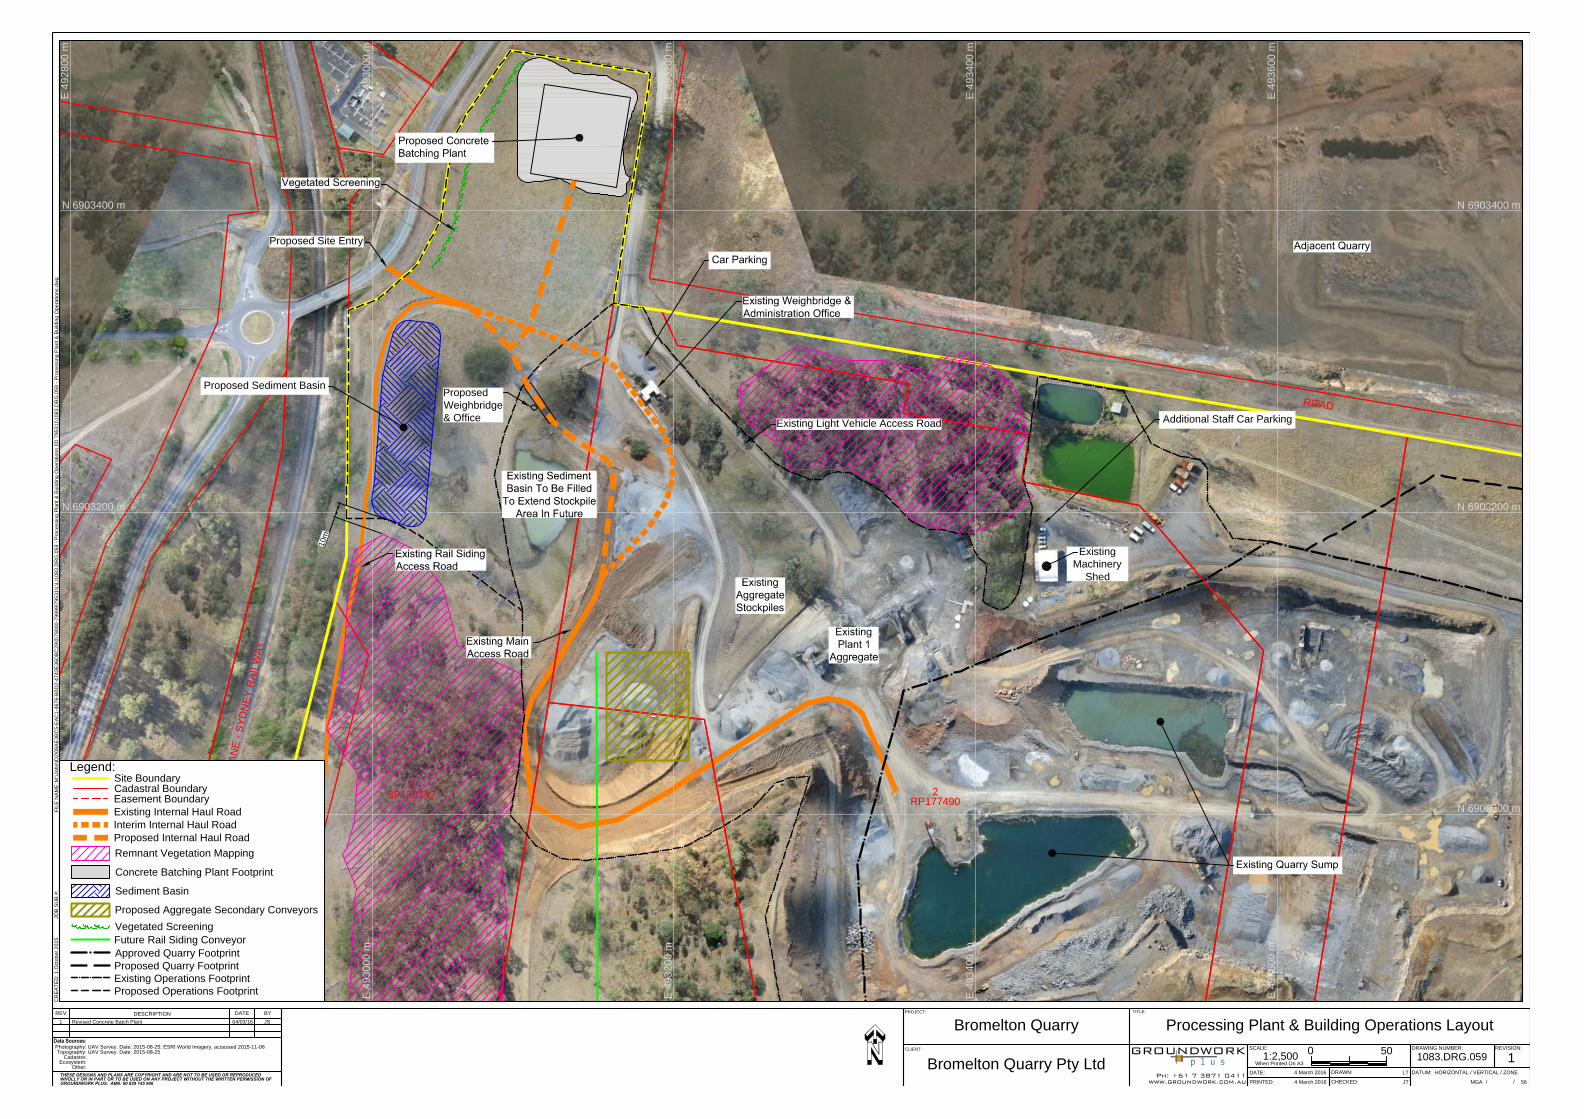
Truck Parking
Washout Bays
Wedge Pit
Admixture StorageConveyor
Cement Silo
Rollover Bund
3 Car Parking Spaces
ProposedSite Entry
Sealed Hardstand /Contaminated Water Area
Water Treatment Storage
AggregateStorage Bins
Batch Office
Pad RL90mRoad Base& Gravel
Rollover Bund
57.5m
60.0
m
THESE DESIGNS AND PLANS ARE COPYRIGHT AND ARE NOT TO BE USED OR REPRODUCED
WHOLLY OR IN PART OR TO BE USED ON ANY PROJECT WITHOUT THE WRITTEN PERMISSION OF
GROUNDWORK PLUS. ABN: 80 829 145 906
DATEREV DESCRIPTION BY
CLIENT:
PROJECT: TITLE:
DRAWING NUMBER:SCALE:
DRAWN:
0When Printed On A3
DATUM: HORIZONTAL / VERTICAL / ZONE
REVISION:
CHECKED:
Photography:Topography:
Cadastre:Ecosystem:
Other:
/ /
24 D
ecem
ber 2
015
CR
EA
TED
:
DATE:
PRINTED:
4 March 2016
4 March 2016Ph: +61 7 3871 0411
www.groundwork.com.au
M:\J
obs\
ID2\
08A
E3B
C5-
EA
C1-
4676
-B0D
2-47
43E
36D
BC
29\0
\770
00-7
7999
\775
56\L
\L\1
083.
DR
G.0
49 -
Con
cret
e B
atch
ing
Pla
nt (I
D 7
7556
)\108
3.D
RG
.049
- C
oncr
ete
Bat
chin
g P
lant
.dw
gFI
LE N
AM
E:
JOB
SU
B #
:
1083.DRG.049 1
Concrete Batching Plant Layout
Bromelton Quarry Pty Ltd
Bromelton Quarry
JS
JT
1:400 8
MGA AHD 56
UAV Survey. Date: 2015-08-25UAV Survey. Date: 2015-08-25
Legend:Site BoundaryInterim Internal Haul RoadProposed Internal Haul Road
1 04/03/16 JSRevised Concrete Batch Plant

Bromelton Quarry and Concrete Batching Plant
5461-B-TE-TIA-001 (E).docx
Appendix B
Results of Surveys
Page 1 of 2
AUSTRAFFIC VIDEO INTERSECTION COUNTCamera Position
Site No.: 1 Weather: Fine 8
Location: Beaudesert-Boonah Road/Sandy Creek Road, Bromelton 7
Day/Date: 6 1
AM Peak: 2
PM Peak: 3
5 4
TIMEMovement 1 Movement 2 Movement 3 Movement 4 Movement 5 Movement 6 Movement 7 Movement 8
(1/4 hr end)
Lig
ht V
eh
icle
s
He
avy V
eh
icle
s
To
tal
Lig
ht V
eh
icle
s
He
avy V
eh
icle
s
To
tal
Lig
ht V
eh
icle
s
He
avy V
eh
icle
s
To
tal
Lig
ht V
eh
icle
s
He
avy V
eh
icle
s
To
tal
Lig
ht V
eh
icle
s
He
avy V
eh
icle
s
To
tal
Lig
ht V
eh
icle
s
He
avy V
eh
icle
s
To
tal
Lig
ht V
eh
icle
s
He
avy V
eh
icle
s
To
tal
Lig
ht V
eh
icle
s
He
avy V
eh
icle
s
To
tal
7:15 AM 0 0 0 19 3 22 4 0 4 3 3 6 1 3 4 0 0 0 2 0 2 11 5 16
7:30 AM 0 0 0 13 1 14 9 2 11 2 2 4 2 0 2 0 0 0 0 2 2 23 4 27
7:45 AM 0 0 0 19 5 24 7 2 9 2 0 2 0 2 2 0 0 0 1 0 1 18 1 19
8:00 AM 0 0 0 13 0 13 5 8 13 2 3 5 0 0 0 0 0 0 0 2 2 16 6 22
8:15 AM 0 0 0 16 2 18 3 0 3 5 2 7 1 0 1 0 0 0 1 0 1 16 2 18
8:30 AM 0 0 0 11 2 13 8 6 14 2 6 8 1 1 2 0 0 0 0 0 0 20 6 26
8:45 AM 0 0 0 19 8 27 1 9 10 0 0 0 1 0 1 0 0 0 2 1 3 17 4 21
9:00 AM 0 0 0 14 1 15 4 6 10 4 7 11 1 1 2 0 0 0 0 1 1 13 3 16
9:15 AM 0 0 0 20 6 26 4 1 5 0 8 8 0 1 1 0 0 0 0 0 0 17 4 21
9:30 AM 0 0 0 18 1 19 3 5 8 5 2 7 0 0 0 0 0 0 7 0 7 17 4 21
2.5
hr
To
tal 0 0 0
16
2
29
19
1
48
39
87
25
33
58 7 8
15 0 0 0
13 6
19
16
8
39
20
7
AM
Pe
ak 0 0 0
64
17
81
17
22
39 6
21
27 3 3 6 0 0 0 2 2 4
67
17
84
TIMEMovement 1 Movement 2 Movement 3 Movement 4 Movement 5 Movement 6 Movement 7 Movement 8
(1/4 hr end)
Lig
ht V
eh
icle
s
He
avy V
eh
icle
s
To
tal
Lig
ht V
eh
icle
s
He
avy V
eh
icle
s
To
tal
Lig
ht V
eh
icle
s
He
avy V
eh
icle
s
To
tal
Lig
ht V
eh
icle
s
He
avy V
eh
icle
s
To
tal
Lig
ht V
eh
icle
s
He
avy V
eh
icle
s
To
tal
Lig
ht V
eh
icle
s
He
avy V
eh
icle
s
To
tal
Lig
ht V
eh
icle
s
He
avy V
eh
icle
s
To
tal
Lig
ht V
eh
icle
s
He
avy V
eh
icle
s
To
tal
3:45 PM 0 0 0 27 1 28 2 0 2 4 1 5 1 0 1 0 0 0 2 1 3 23 3 26
4:00 PM 0 0 0 21 2 23 4 2 6 13 2 15 1 0 1 0 0 0 0 0 0 31 2 33
4:15 PM 0 0 0 24 1 25 4 0 4 13 0 13 0 0 0 0 0 0 0 0 0 16 1 17
4:30 PM 0 0 0 23 1 24 4 0 4 13 1 14 1 0 1 0 0 0 1 2 3 16 5 21
4:45 PM 0 0 0 16 2 18 2 2 4 14 5 19 0 0 0 0 0 0 2 0 2 23 4 27
5:00 PM 0 0 0 35 3 38 1 1 2 5 1 6 0 0 0 0 0 0 0 0 0 15 4 19
5:15 PM 0 0 0 21 4 25 2 2 4 10 2 12 0 0 0 0 0 0 0 0 0 19 2 21
5:30 PM 0 0 0 20 1 21 2 1 3 6 1 7 0 0 0 0 0 0 1 1 2 7 0 7
5:45 PM 0 0 0 15 0 15 2 0 2 6 0 6 0 1 1 0 0 0 0 1 1 10 4 14
6:00 PM 0 0 0 10 3 13 2 1 3 4 2 6 0 0 0 0 0 0 0 1 1 9 2 11
6:15 PM 0 0 0 11 1 12 4 0 4 7 0 7 0 1 1 0 0 0 0 0 0 9 0 9
6:30 PM 0 0 0 4 0 4 3 0 3 4 4 8 0 0 0 0 0 0 0 0 0 6 1 7
3 h
r T
ota
l 0 0 0
22
7
19
24
6
32 9
41
99
19
11
8 3 2 5 0 0 0 6 6
12
18
4
28
21
2
PM
Pe
ak 0 0 0
84 6
90
14 4
18
53 8
61 2 0 2 0 0 0 3 2 5
86
12
98
Tuesday, 20 October 2015Beaudesert-Boonah Road (west) Beaudesert-Boonah Road (east)
Hour ending - 9:15 AM
Hour ending - 4:45 PM
Sandy Creek Road (south)
N

SpeedStat-1733 Page 1
MetroCount Traffic ExecutiveSpeed Statistics
SpeedStat-1733 -- English (ENA)
Datasets: Site: [11908-4] Sandy Creek road, Bromelton, south of Quarry access <100>Direction: 7 - North bound A>B, South bound B>A. Lane: 0Survey Duration: 13:40 Wednesday, 28 October 2015 => 23:19 Thursday, 29 October 2015 File: 11908-4 0 2015-10-29 2319.EC0 (Plus)Identifier: 2229F421 MC56-6 [MC55] (c)Microcom 02/03/01 Algorithm: Factory defaultData type: Axle sensors - Paired (Class/Speed/Count)
Profile:Filter time: 13:40 Wednesday, 28 October 2015 => 23:19 Thursday, 29 October 2015Included classes: 1, 2, 3, 4, 5, 6, 7, 8, 9, 10, 11, 12Speed range: 0 - 200 km/h.Direction: North (bound)Separation: All - (Headway)Name: Default ProfileScheme: Vehicle classification (AustRoads94)Units: Metric (meter, kilometer, m/s, km/h, kg, tonne)In profile: Vehicles = 520 / 972 (53.50%)
SpeedStat-1733 Page 1
SpeedStat-1733 Page 2
Speed Statistics SpeedStat-1733Site: 11908-4.0NS Description: Sandy Creek road, Bromelton, south of Quarry access <100>Filter time: 13:40 Wednesday, 28 October 2015 => 23:19 Thursday, 29 October 2015 Scheme: Vehicle classification (AustRoads94)Filter: Cls(1 2 3 4 5 6 7 8 9 10 11 12 ) Dir(N) Sp(0,200) Headway(>0)
Vehicles = 520Posted speed limit = 60 km/h, Exceeding = 229 (44.04%), Mean Exceeding = 66.72 km/hMaximum = 91.1 km/h, Minimum = 13.0 km/h, Mean = 58.0 km/h85% Speed = 67.3 km/h, 95% Speed = 73.4 km/h, Median = 58.3 km/h20 km/h Pace = 47 - 67, Number in Pace = 371 (71.35%)Variance = 109.11, Standard Deviation = 10.45 km/h
Speed Bins (Partial days)
Speed | Bin | Below | Above | Energy | vMult | n * vMult 0 - 10 | 0 0.0% | 0 0.0% | 520 100.0% | 0.00 | 0.00 | 0.00 10 - 20 | 5 1.0% | 5 1.0% | 515 99.0% | 0.00 | 0.00 | 0.00 20 - 30 | 1 0.2% | 6 1.2% | 514 98.8% | 0.00 | 0.00 | 0.00 30 - 40 | 16 3.1% | 22 4.2% | 498 95.8% | 0.00 | 0.00 | 0.00 40 - 50 | 78 15.0% | 100 19.2% | 420 80.8% | 0.00 | 0.00 | 0.00 50 - 60 | 191 36.7% | 291 56.0% | 229 44.0% | 0.00 | 0.00 | 0.00 60 - 70 | 177 34.0% | 468 90.0% | 52 10.0% | 0.00 | 0.00 | 0.00 70 - 80 | 48 9.2% | 516 99.2% | 4 0.8% | 0.00 | 0.00 | 0.00 80 - 90 | 3 0.6% | 519 99.8% | 1 0.2% | 0.00 | 0.00 | 0.00 90 - 100 | 1 0.2% | 520 100.0% | 0 0.0% | 0.00 | 0.00 | 0.00100 - 110 | 0 0.0% | 520 100.0% | 0 0.0% | 0.00 | 0.00 | 0.00110 - 120 | 0 0.0% | 520 100.0% | 0 0.0% | 0.00 | 0.00 | 0.00120 - 130 | 0 0.0% | 520 100.0% | 0 0.0% | 0.00 | 0.00 | 0.00130 - 140 | 0 0.0% | 520 100.0% | 0 0.0% | 0.00 | 0.00 | 0.00140 - 150 | 0 0.0% | 520 100.0% | 0 0.0% | 0.00 | 0.00 | 0.00150 - 160 | 0 0.0% | 520 100.0% | 0 0.0% | 0.00 | 0.00 | 0.00160 - 170 | 0 0.0% | 520 100.0% | 0 0.0% | 0.00 | 0.00 | 0.00170 - 180 | 0 0.0% | 520 100.0% | 0 0.0% | 0.00 | 0.00 | 0.00180 - 190 | 0 0.0% | 520 100.0% | 0 0.0% | 0.00 | 0.00 | 0.00190 - 200 | 0 0.0% | 520 100.0% | 0 0.0% | 0.00 | 0.00 | 0.00
Total Speed Rating = 0.00Total Moving Energy (Estimated) = 0.00
Speed limit fields (Partial days)
| Limit | Below | Above 0 | 60 (PSL) | 291 56.0% | 229 44.0%
SpeedStat-1733 Page 2
SpeedStat-1733 Page 1
MetroCount Traffic ExecutiveSpeed Statistics
SpeedStat-1733 -- English (ENA)
Datasets: Site: [11908-4] Sandy Creek road, Bromelton, south of Quarry access <100>Direction: 7 - North bound A>B, South bound B>A. Lane: 0Survey Duration: 13:40 Wednesday, 28 October 2015 => 23:19 Thursday, 29 October 2015 File: 11908-4 0 2015-10-29 2319.EC0 (Plus)Identifier: 2229F421 MC56-6 [MC55] (c)Microcom 02/03/01 Algorithm: Factory defaultData type: Axle sensors - Paired (Class/Speed/Count)
Profile:Filter time: 13:40 Wednesday, 28 October 2015 => 23:19 Thursday, 29 October 2015Included classes: 1, 2, 3, 4, 5, 6, 7, 8, 9, 10, 11, 12Speed range: 0 - 200 km/h.Direction: South (bound)Separation: All - (Headway)Name: Default ProfileScheme: Vehicle classification (AustRoads94)Units: Metric (meter, kilometer, m/s, km/h, kg, tonne)In profile: Vehicles = 451 / 972 (46.40%)
SpeedStat-1733 Page 1

SpeedStat-1733 Page 2
Speed Statistics SpeedStat-1733Site: 11908-4.0NS Description: Sandy Creek road, Bromelton, south of Quarry access <100>Filter time: 13:40 Wednesday, 28 October 2015 => 23:19 Thursday, 29 October 2015 Scheme: Vehicle classification (AustRoads94)Filter: Cls(1 2 3 4 5 6 7 8 9 10 11 12 ) Dir(S) Sp(0,200) Headway(>0)
Vehicles = 451Posted speed limit = 60 km/h, Exceeding = 112 (24.83%), Mean Exceeding = 64.86 km/hMaximum = 95.4 km/h, Minimum = 22.1 km/h, Mean = 53.5 km/h85% Speed = 62.3 km/h, 95% Speed = 67.0 km/h, Median = 53.6 km/h20 km/h Pace = 44 - 64, Number in Pace = 341 (75.61%)Variance = 86.97, Standard Deviation = 9.33 km/h
Speed Bins (Partial days)
Speed | Bin | Below | Above | Energy | vMult | n * vMult 0 - 10 | 0 0.0% | 0 0.0% | 451 100.0% | 0.00 | 0.00 | 0.00 10 - 20 | 0 0.0% | 0 0.0% | 451 100.0% | 0.00 | 0.00 | 0.00 20 - 30 | 3 0.7% | 3 0.7% | 448 99.3% | 0.00 | 0.00 | 0.00 30 - 40 | 37 8.2% | 40 8.9% | 411 91.1% | 0.00 | 0.00 | 0.00 40 - 50 | 112 24.8% | 152 33.7% | 299 66.3% | 0.00 | 0.00 | 0.00 50 - 60 | 187 41.5% | 339 75.2% | 112 24.8% | 0.00 | 0.00 | 0.00 60 - 70 | 98 21.7% | 437 96.9% | 14 3.1% | 0.00 | 0.00 | 0.00 70 - 80 | 13 2.9% | 450 99.8% | 1 0.2% | 0.00 | 0.00 | 0.00 80 - 90 | 0 0.0% | 450 99.8% | 1 0.2% | 0.00 | 0.00 | 0.00 90 - 100 | 1 0.2% | 451 100.0% | 0 0.0% | 0.00 | 0.00 | 0.00100 - 110 | 0 0.0% | 451 100.0% | 0 0.0% | 0.00 | 0.00 | 0.00110 - 120 | 0 0.0% | 451 100.0% | 0 0.0% | 0.00 | 0.00 | 0.00120 - 130 | 0 0.0% | 451 100.0% | 0 0.0% | 0.00 | 0.00 | 0.00130 - 140 | 0 0.0% | 451 100.0% | 0 0.0% | 0.00 | 0.00 | 0.00140 - 150 | 0 0.0% | 451 100.0% | 0 0.0% | 0.00 | 0.00 | 0.00150 - 160 | 0 0.0% | 451 100.0% | 0 0.0% | 0.00 | 0.00 | 0.00160 - 170 | 0 0.0% | 451 100.0% | 0 0.0% | 0.00 | 0.00 | 0.00170 - 180 | 0 0.0% | 451 100.0% | 0 0.0% | 0.00 | 0.00 | 0.00180 - 190 | 0 0.0% | 451 100.0% | 0 0.0% | 0.00 | 0.00 | 0.00190 - 200 | 0 0.0% | 451 100.0% | 0 0.0% | 0.00 | 0.00 | 0.00
Total Speed Rating = 0.00Total Moving Energy (Estimated) = 0.00
Speed limit fields (Partial days)
| Limit | Below | Above 0 | 60 (PSL) | 339 75.2% | 112 24.8%
SpeedStat-1733 Page 2
Bromelton Quarry and Concrete Batching Plant
5461-B-TE-TIA-001 (E).docx
Appendix C
Results of SIDRA Analyses

MOVEMENT SUMMARY
Site: 2017 Base AM Peak Hour
Beaudesert-Boonah Rd / Sandy Creek Rd IntersectionGiveway / Yield (Two-Way)
Movement Performance - Vehicles
Demand Flows 95% Back of QueueMovID
ODMov
Deg.Satn
AverageDelay
Level ofService
Prop. Queued
Effective Stop Rate
AverageSpeed Total HV Vehicles Distance
veh/h % v/c sec veh m per veh km/hSouth: Sandy Creek Road
1 L2 6 50.0 0.060 6.7 LOS A 0.2 2.6 0.37 0.60 49.7
3 R2 29 77.8 0.060 9.5 LOS A 0.2 2.6 0.37 0.60 48.4
Approach 35 73.0 0.060 9.0 LOS A 0.2 2.6 0.37 0.60 48.6
East: Beaudesert-Boonah Road
4 L2 41 56.4 0.031 6.2 LOS A 0.0 0.0 0.00 0.57 51.3
5 T1 86 21.0 0.050 0.0 LOS A 0.0 0.0 0.00 0.00 60.0
Approach 127 32.4 0.050 2.0 NA 0.0 0.0 0.00 0.18 56.9
West: Beaudesert-Boonah Road
11 T1 89 20.2 0.052 0.0 LOS A 0.0 0.0 0.00 0.00 60.0
12 R2 4 50.0 0.004 6.9 LOS A 0.0 0.2 0.28 0.55 50.2
Approach 93 21.5 0.052 0.3 NA 0.0 0.2 0.01 0.02 59.5
All Vehicles 255 34.0 0.060 2.3 NA 0.2 2.6 0.06 0.18 56.5
Level of Service (LOS) Method: Delay (HCM 2000).
Vehicle movement LOS values are based on average delay per movement
Minor Road Approach LOS values are based on average delay for all vehicle movements.
NA: Intersection LOS and Major Road Approach LOS values are Not Applicable for two-way sign control since the average delay is not a good LOS measure due to zero delays associated with major road movements.
SIDRA Standard Delay Model is used. Control Delay includes Geometric Delay.
Gap-Acceptance Capacity: SIDRA Standard (Akçelik M3D).
HV (%) values are calculated for All Movement Classes of All Heavy Vehicle Model Designation.
SIDRA INTERSECTION 6.1 | Copyright © 2000-2015 Akcelik and Associates Pty Ltd | sidrasolutions.comOrganisation: MRCAGNEY PTY LTD | Processed: Monday, 7 March 2016 4:27:10 PMProject: T:\5400-5499\5461 - (Refaka) Bromelton Quarry\Sidra\Beaudesert Boonah Rd & Sandy creek Rd S.L.sip6

MOVEMENT SUMMARY
Site: 2017 Base PM Peak Hour
Beaudesert-Boonah Rd / Sandy Creek Rd IntersectionGiveway / Yield (Two-Way)
Movement Performance - Vehicles
Demand Flows 95% Back of QueueMovID
ODMov
Deg.Satn
AverageDelay
Level ofService
Prop. Queued
Effective Stop Rate
AverageSpeed Total HV Vehicles Distance
veh/h % v/c sec veh m per veh km/hSouth: Sandy Creek Road
1 L2 2 0.0 0.087 5.9 LOS A 0.3 2.6 0.37 0.62 52.3
3 R2 65 13.1 0.087 7.4 LOS A 0.3 2.6 0.37 0.62 51.5
Approach 67 12.7 0.087 7.4 LOS A 0.3 2.6 0.37 0.62 51.6
East: Beaudesert-Boonah Road
4 L2 19 22.2 0.012 5.8 LOS A 0.0 0.0 0.00 0.57 52.7
5 T1 95 6.7 0.051 0.0 LOS A 0.0 0.0 0.00 0.00 60.0
Approach 114 9.3 0.051 1.0 NA 0.0 0.0 0.00 0.10 58.6
West: Beaudesert-Boonah Road
11 T1 104 12.2 0.058 0.0 LOS A 0.0 0.0 0.00 0.00 60.0
12 R2 5 40.0 0.005 6.5 LOS A 0.0 0.2 0.24 0.55 50.7
Approach 109 13.5 0.058 0.3 NA 0.0 0.2 0.01 0.03 59.5
All Vehicles 290 11.7 0.087 2.2 NA 0.3 2.6 0.09 0.19 57.1
Level of Service (LOS) Method: Delay (HCM 2000).
Vehicle movement LOS values are based on average delay per movement
Minor Road Approach LOS values are based on average delay for all vehicle movements.
NA: Intersection LOS and Major Road Approach LOS values are Not Applicable for two-way sign control since the average delay is not a good LOS measure due to zero delays associated with major road movements.
SIDRA Standard Delay Model is used. Control Delay includes Geometric Delay.
Gap-Acceptance Capacity: SIDRA Standard (Akçelik M3D).
HV (%) values are calculated for All Movement Classes of All Heavy Vehicle Model Designation.
SIDRA INTERSECTION 6.1 | Copyright © 2000-2015 Akcelik and Associates Pty Ltd | sidrasolutions.comOrganisation: MRCAGNEY PTY LTD | Processed: Monday, 7 March 2016 4:27:10 PMProject: T:\5400-5499\5461 - (Refaka) Bromelton Quarry\Sidra\Beaudesert Boonah Rd & Sandy creek Rd S.L.sip6

MOVEMENT SUMMARY
Site: 2017 Design AM Peak Hour
Beaudesert-Boonah Rd / Sandy Creek Rd IntersectionGiveway / Yield (Two-Way)
Movement Performance - Vehicles
Demand Flows 95% Back of QueueMovID
ODMov
Deg.Satn
AverageDelay
Level ofService
Prop. Queued
Effective Stop Rate
AverageSpeed Total HV Vehicles Distance
veh/h % v/c sec veh m per veh km/hSouth: Sandy Creek Road
1 L2 9 50.0 0.127 6.7 LOS A 0.5 5.8 0.42 0.65 49.2
3 R2 60 77.8 0.127 10.2 LOS B 0.5 5.8 0.42 0.65 48.0
Approach 69 74.2 0.127 9.7 LOS A 0.5 5.8 0.42 0.65 48.1
East: Beaudesert-Boonah Road
4 L2 79 56.4 0.060 6.2 LOS A 0.0 0.0 0.00 0.57 51.3
5 T1 86 21.0 0.050 0.0 LOS A 0.0 0.0 0.00 0.00 60.0
Approach 165 37.9 0.060 3.0 NA 0.0 0.0 0.00 0.27 55.5
West: Beaudesert-Boonah Road
11 T1 89 20.2 0.052 0.0 LOS A 0.0 0.0 0.00 0.00 60.0
12 R2 7 50.0 0.008 7.2 LOS A 0.0 0.3 0.32 0.57 50.1
Approach 96 22.4 0.052 0.5 NA 0.0 0.3 0.02 0.04 59.1
All Vehicles 330 41.0 0.127 3.7 NA 0.5 5.8 0.09 0.28 54.7
Level of Service (LOS) Method: Delay (HCM 2000).
Vehicle movement LOS values are based on average delay per movement
Minor Road Approach LOS values are based on average delay for all vehicle movements.
NA: Intersection LOS and Major Road Approach LOS values are Not Applicable for two-way sign control since the average delay is not a good LOS measure due to zero delays associated with major road movements.
SIDRA Standard Delay Model is used. Control Delay includes Geometric Delay.
Gap-Acceptance Capacity: SIDRA Standard (Akçelik M3D).
HV (%) values are calculated for All Movement Classes of All Heavy Vehicle Model Designation.
SIDRA INTERSECTION 6.1 | Copyright © 2000-2015 Akcelik and Associates Pty Ltd | sidrasolutions.comOrganisation: MRCAGNEY PTY LTD | Processed: Monday, 7 March 2016 4:27:11 PMProject: T:\5400-5499\5461 - (Refaka) Bromelton Quarry\Sidra\Beaudesert Boonah Rd & Sandy creek Rd S.L.sip6

MOVEMENT SUMMARY
Site: 2017 Design PM Peak Hour
Beaudesert-Boonah Rd / Sandy Creek Rd IntersectionGiveway / Yield (Two-Way)
Movement Performance - Vehicles
Demand Flows 95% Back of QueueMovID
ODMov
Deg.Satn
AverageDelay
Level ofService
Prop. Queued
Effective Stop Rate
AverageSpeed Total HV Vehicles Distance
veh/h % v/c sec veh m per veh km/hSouth: Sandy Creek Road
1 L2 5 0.0 0.143 5.9 LOS A 0.6 4.5 0.40 0.64 52.1
3 R2 103 13.1 0.143 7.8 LOS A 0.6 4.5 0.40 0.64 51.3
Approach 108 12.5 0.143 7.7 LOS A 0.6 4.5 0.40 0.64 51.4
East: Beaudesert-Boonah Road
4 L2 50 22.2 0.031 5.8 LOS A 0.0 0.0 0.00 0.57 52.7
5 T1 95 6.7 0.051 0.0 LOS A 0.0 0.0 0.00 0.00 60.0
Approach 145 12.0 0.051 2.0 NA 0.0 0.0 0.00 0.20 57.2
West: Beaudesert-Boonah Road
11 T1 104 12.2 0.058 0.0 LOS A 0.0 0.0 0.00 0.00 60.0
12 R2 8 40.0 0.008 6.7 LOS A 0.0 0.3 0.28 0.56 50.7
Approach 112 14.2 0.058 0.5 NA 0.0 0.3 0.02 0.04 59.2
All Vehicles 365 12.8 0.143 3.2 NA 0.6 4.5 0.12 0.28 55.9
Level of Service (LOS) Method: Delay (HCM 2000).
Vehicle movement LOS values are based on average delay per movement
Minor Road Approach LOS values are based on average delay for all vehicle movements.
NA: Intersection LOS and Major Road Approach LOS values are Not Applicable for two-way sign control since the average delay is not a good LOS measure due to zero delays associated with major road movements.
SIDRA Standard Delay Model is used. Control Delay includes Geometric Delay.
Gap-Acceptance Capacity: SIDRA Standard (Akçelik M3D).
HV (%) values are calculated for All Movement Classes of All Heavy Vehicle Model Designation.
SIDRA INTERSECTION 6.1 | Copyright © 2000-2015 Akcelik and Associates Pty Ltd | sidrasolutions.comOrganisation: MRCAGNEY PTY LTD | Processed: Monday, 7 March 2016 4:27:11 PMProject: T:\5400-5499\5461 - (Refaka) Bromelton Quarry\Sidra\Beaudesert Boonah Rd & Sandy creek Rd S.L.sip6

MOVEMENT SUMMARY
Site: 2027 Base AM Peak Hour
Beaudesert-Boonah Rd / Sandy Creek Rd IntersectionGiveway / Yield (Two-Way)
Movement Performance - Vehicles
Demand Flows 95% Back of QueueMovID
ODMov
Deg.Satn
AverageDelay
Level ofService
Prop. Queued
Effective Stop Rate
AverageSpeed Total HV Vehicles Distance
veh/h % v/c sec veh m per veh km/hSouth: Sandy Creek Road
1 L2 9 50.0 0.092 6.9 LOS A 0.3 4.0 0.44 0.65 48.9
3 R2 38 77.8 0.092 11.0 LOS B 0.3 4.0 0.44 0.65 47.7
Approach 47 72.5 0.092 10.2 LOS B 0.3 4.0 0.44 0.65 47.9
East: Beaudesert-Boonah Road
4 L2 56 56.4 0.042 6.2 LOS A 0.0 0.0 0.00 0.57 51.3
5 T1 115 21.0 0.067 0.0 LOS A 0.0 0.0 0.00 0.00 60.0
Approach 171 32.6 0.067 2.0 NA 0.0 0.0 0.00 0.19 56.8
West: Beaudesert-Boonah Road
11 T1 120 20.2 0.070 0.0 LOS A 0.0 0.0 0.00 0.00 60.0
12 R2 6 50.0 0.007 7.2 LOS A 0.0 0.3 0.33 0.57 50.1
Approach 126 21.7 0.070 0.3 NA 0.0 0.3 0.02 0.03 59.4
All Vehicles 344 34.0 0.092 2.5 NA 0.3 4.0 0.07 0.19 56.3
Level of Service (LOS) Method: Delay (HCM 2000).
Vehicle movement LOS values are based on average delay per movement
Minor Road Approach LOS values are based on average delay for all vehicle movements.
NA: Intersection LOS and Major Road Approach LOS values are Not Applicable for two-way sign control since the average delay is not a good LOS measure due to zero delays associated with major road movements.
SIDRA Standard Delay Model is used. Control Delay includes Geometric Delay.
Gap-Acceptance Capacity: SIDRA Standard (Akçelik M3D).
HV (%) values are calculated for All Movement Classes of All Heavy Vehicle Model Designation.
SIDRA INTERSECTION 6.1 | Copyright © 2000-2015 Akcelik and Associates Pty Ltd | sidrasolutions.comOrganisation: MRCAGNEY PTY LTD | Processed: Monday, 7 March 2016 4:27:12 PMProject: T:\5400-5499\5461 - (Refaka) Bromelton Quarry\Sidra\Beaudesert Boonah Rd & Sandy creek Rd S.L.sip6
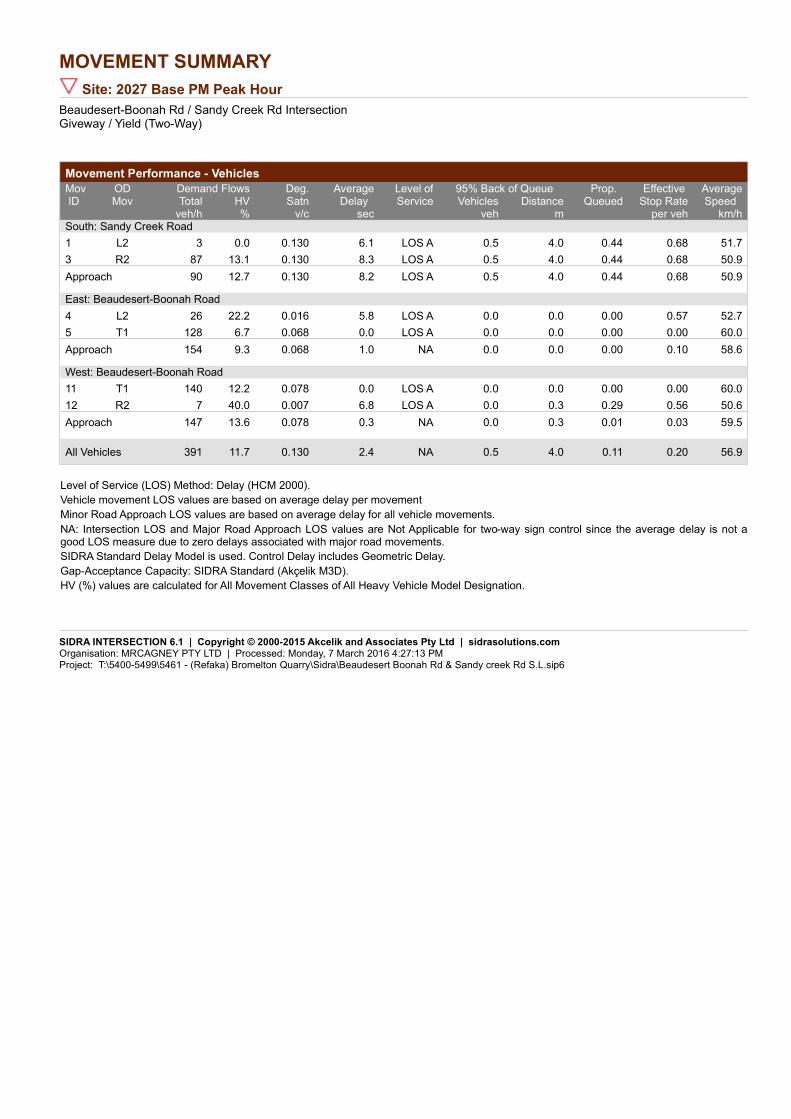
MOVEMENT SUMMARY
Site: 2027 Base PM Peak Hour
Beaudesert-Boonah Rd / Sandy Creek Rd IntersectionGiveway / Yield (Two-Way)
Movement Performance - Vehicles
Demand Flows 95% Back of QueueMovID
ODMov
Deg.Satn
AverageDelay
Level ofService
Prop. Queued
Effective Stop Rate
AverageSpeed Total HV Vehicles Distance
veh/h % v/c sec veh m per veh km/hSouth: Sandy Creek Road
1 L2 3 0.0 0.130 6.1 LOS A 0.5 4.0 0.44 0.68 51.7
3 R2 87 13.1 0.130 8.3 LOS A 0.5 4.0 0.44 0.68 50.9
Approach 90 12.7 0.130 8.2 LOS A 0.5 4.0 0.44 0.68 50.9
East: Beaudesert-Boonah Road
4 L2 26 22.2 0.016 5.8 LOS A 0.0 0.0 0.00 0.57 52.7
5 T1 128 6.7 0.068 0.0 LOS A 0.0 0.0 0.00 0.00 60.0
Approach 154 9.3 0.068 1.0 NA 0.0 0.0 0.00 0.10 58.6
West: Beaudesert-Boonah Road
11 T1 140 12.2 0.078 0.0 LOS A 0.0 0.0 0.00 0.00 60.0
12 R2 7 40.0 0.007 6.8 LOS A 0.0 0.3 0.29 0.56 50.6
Approach 147 13.6 0.078 0.3 NA 0.0 0.3 0.01 0.03 59.5
All Vehicles 391 11.7 0.130 2.4 NA 0.5 4.0 0.11 0.20 56.9
Level of Service (LOS) Method: Delay (HCM 2000).
Vehicle movement LOS values are based on average delay per movement
Minor Road Approach LOS values are based on average delay for all vehicle movements.
NA: Intersection LOS and Major Road Approach LOS values are Not Applicable for two-way sign control since the average delay is not a good LOS measure due to zero delays associated with major road movements.
SIDRA Standard Delay Model is used. Control Delay includes Geometric Delay.
Gap-Acceptance Capacity: SIDRA Standard (Akçelik M3D).
HV (%) values are calculated for All Movement Classes of All Heavy Vehicle Model Designation.
SIDRA INTERSECTION 6.1 | Copyright © 2000-2015 Akcelik and Associates Pty Ltd | sidrasolutions.comOrganisation: MRCAGNEY PTY LTD | Processed: Monday, 7 March 2016 4:27:13 PMProject: T:\5400-5499\5461 - (Refaka) Bromelton Quarry\Sidra\Beaudesert Boonah Rd & Sandy creek Rd S.L.sip6

MOVEMENT SUMMARY
Site: 2027 Design AM Peak Hour
Beaudesert-Boonah Rd / Sandy Creek Rd IntersectionGiveway / Yield (Two-Way)
Movement Performance - Vehicles
Demand Flows 95% Back of QueueMovID
ODMov
Deg.Satn
AverageDelay
Level ofService
Prop. Queued
Effective Stop Rate
AverageSpeed Total HV Vehicles Distance
veh/h % v/c sec veh m per veh km/hSouth: Sandy Creek Road
1 L2 12 50.0 0.169 6.9 LOS A 0.7 7.7 0.49 0.70 48.3
3 R2 69 77.8 0.169 11.8 LOS B 0.7 7.7 0.49 0.70 47.1
Approach 81 73.7 0.169 11.1 LOS B 0.7 7.7 0.49 0.70 47.3
East: Beaudesert-Boonah Road
4 L2 94 56.4 0.071 6.2 LOS A 0.0 0.0 0.00 0.57 51.3
5 T1 115 21.0 0.067 0.0 LOS A 0.0 0.0 0.00 0.00 60.0
Approach 209 36.9 0.071 2.8 NA 0.0 0.0 0.00 0.26 55.7
West: Beaudesert-Boonah Road
11 T1 120 20.2 0.070 0.0 LOS A 0.0 0.0 0.00 0.00 60.0
12 R2 9 50.0 0.011 7.5 LOS A 0.0 0.4 0.37 0.59 49.9
Approach 129 22.3 0.070 0.5 NA 0.0 0.4 0.03 0.04 59.2
All Vehicles 419 39.5 0.169 3.7 NA 0.7 7.7 0.10 0.28 54.8
Level of Service (LOS) Method: Delay (HCM 2000).
Vehicle movement LOS values are based on average delay per movement
Minor Road Approach LOS values are based on average delay for all vehicle movements.
NA: Intersection LOS and Major Road Approach LOS values are Not Applicable for two-way sign control since the average delay is not a good LOS measure due to zero delays associated with major road movements.
SIDRA Standard Delay Model is used. Control Delay includes Geometric Delay.
Gap-Acceptance Capacity: SIDRA Standard (Akçelik M3D).
HV (%) values are calculated for All Movement Classes of All Heavy Vehicle Model Designation.
SIDRA INTERSECTION 6.1 | Copyright © 2000-2015 Akcelik and Associates Pty Ltd | sidrasolutions.comOrganisation: MRCAGNEY PTY LTD | Processed: Monday, 7 March 2016 4:27:13 PMProject: T:\5400-5499\5461 - (Refaka) Bromelton Quarry\Sidra\Beaudesert Boonah Rd & Sandy creek Rd S.L.sip6

MOVEMENT SUMMARY
Site: 2027 Design PM Peak Hour
Beaudesert-Boonah Rd / Sandy Creek Rd IntersectionGiveway / Yield (Two-Way)
Movement Performance - Vehicles
Demand Flows 95% Back of QueueMovID
ODMov
Deg.Satn
AverageDelay
Level ofService
Prop. Queued
Effective Stop Rate
AverageSpeed Total HV Vehicles Distance
veh/h % v/c sec veh m per veh km/hSouth: Sandy Creek Road
1 L2 6 0.0 0.193 6.1 LOS A 0.8 6.2 0.47 0.70 51.4
3 R2 125 13.1 0.193 8.7 LOS A 0.8 6.2 0.47 0.70 50.7
Approach 131 12.5 0.193 8.6 LOS A 0.8 6.2 0.47 0.70 50.7
East: Beaudesert-Boonah Road
4 L2 57 22.2 0.036 5.8 LOS A 0.0 0.0 0.00 0.57 52.7
5 T1 128 6.7 0.068 0.0 LOS A 0.0 0.0 0.00 0.00 60.0
Approach 185 11.5 0.068 1.8 NA 0.0 0.0 0.00 0.18 57.5
West: Beaudesert-Boonah Road
11 T1 140 12.2 0.078 0.0 LOS A 0.0 0.0 0.00 0.00 60.0
12 R2 10 40.0 0.010 7.0 LOS A 0.0 0.4 0.32 0.57 50.5
Approach 150 14.1 0.078 0.5 NA 0.0 0.4 0.02 0.04 59.2
All Vehicles 466 12.6 0.193 3.3 NA 0.8 6.2 0.14 0.28 55.9
Level of Service (LOS) Method: Delay (HCM 2000).
Vehicle movement LOS values are based on average delay per movement
Minor Road Approach LOS values are based on average delay for all vehicle movements.
NA: Intersection LOS and Major Road Approach LOS values are Not Applicable for two-way sign control since the average delay is not a good LOS measure due to zero delays associated with major road movements.
SIDRA Standard Delay Model is used. Control Delay includes Geometric Delay.
Gap-Acceptance Capacity: SIDRA Standard (Akçelik M3D).
HV (%) values are calculated for All Movement Classes of All Heavy Vehicle Model Designation.
SIDRA INTERSECTION 6.1 | Copyright © 2000-2015 Akcelik and Associates Pty Ltd | sidrasolutions.comOrganisation: MRCAGNEY PTY LTD | Processed: Monday, 7 March 2016 4:27:14 PMProject: T:\5400-5499\5461 - (Refaka) Bromelton Quarry\Sidra\Beaudesert Boonah Rd & Sandy creek Rd S.L.sip6

MOVEMENT SUMMARY
Site: 2017 AM Design
New SiteGiveway / Yield (Two-Way)
Movement Performance - Vehicles
Demand Flows 95% Back of QueueMovID
ODMov
Deg.Satn
AverageDelay
Level ofService
Prop. Queued
Effective Stop Rate
AverageSpeed Total HV Vehicles Distance
veh/h % v/c sec veh m per veh km/hSouth: Sandy Creek Road
2 T1 35 27.3 0.022 0.0 LOS A 0.0 0.1 0.02 0.03 59.7
3 R2 1 100.0 0.022 6.7 LOS A 0.0 0.1 0.02 0.03 54.9
Approach 36 29.3 0.022 0.4 NA 0.0 0.1 0.02 0.03 59.6
East: New Site Access
4 L2 1 100.0 0.047 6.4 LOS A 0.2 2.0 0.23 0.59 51.0
6 R2 34 100.0 0.047 6.9 LOS A 0.2 2.0 0.23 0.59 50.3
Approach 35 100.0 0.047 6.9 LOS A 0.2 2.0 0.23 0.59 50.3
North: Sandy Creek Road
7 L2 41 57.1 0.056 6.2 LOS A 0.0 0.0 0.00 0.27 54.2
8 T1 46 10.7 0.056 0.0 LOS A 0.0 0.0 0.00 0.27 58.4
Approach 87 32.6 0.056 2.9 NA 0.0 0.0 0.00 0.27 56.3
All Vehicles 158 46.8 0.056 3.2 NA 0.2 2.0 0.06 0.29 55.6
Level of Service (LOS) Method: Delay (HCM 2000).
Vehicle movement LOS values are based on average delay per movement
Minor Road Approach LOS values are based on average delay for all vehicle movements.
NA: Intersection LOS and Major Road Approach LOS values are Not Applicable for two-way sign control since the average delay is not a good LOS measure due to zero delays associated with major road movements.
SIDRA Standard Delay Model is used. Control Delay includes Geometric Delay.
Gap-Acceptance Capacity: SIDRA Standard (Akçelik M3D).
HV (%) values are calculated for All Movement Classes of All Heavy Vehicle Model Designation.
SIDRA INTERSECTION 6.1 | Copyright © 2000-2015 Akcelik and Associates Pty Ltd | sidrasolutions.comOrganisation: MRCAGNEY PTY LTD | Processed: Tuesday, 8 March 2016 9:18:24 AMProject: T:\5400-5499\5461 - (Refaka) Bromelton Quarry\Sidra\Sandy Creek Road & Site Access S.L.sip6
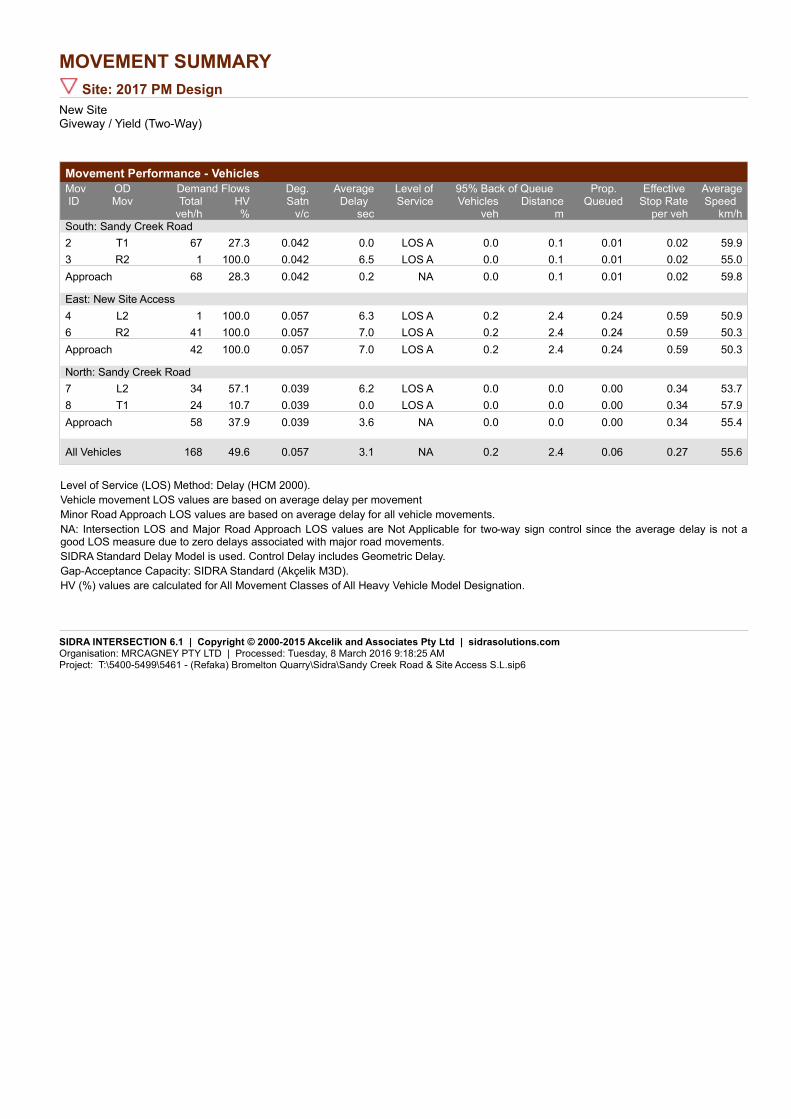
MOVEMENT SUMMARY
Site: 2017 PM Design
New SiteGiveway / Yield (Two-Way)
Movement Performance - Vehicles
Demand Flows 95% Back of QueueMovID
ODMov
Deg.Satn
AverageDelay
Level ofService
Prop. Queued
Effective Stop Rate
AverageSpeed Total HV Vehicles Distance
veh/h % v/c sec veh m per veh km/hSouth: Sandy Creek Road
2 T1 67 27.3 0.042 0.0 LOS A 0.0 0.1 0.01 0.02 59.9
3 R2 1 100.0 0.042 6.5 LOS A 0.0 0.1 0.01 0.02 55.0
Approach 68 28.3 0.042 0.2 NA 0.0 0.1 0.01 0.02 59.8
East: New Site Access
4 L2 1 100.0 0.057 6.3 LOS A 0.2 2.4 0.24 0.59 50.9
6 R2 41 100.0 0.057 7.0 LOS A 0.2 2.4 0.24 0.59 50.3
Approach 42 100.0 0.057 7.0 LOS A 0.2 2.4 0.24 0.59 50.3
North: Sandy Creek Road
7 L2 34 57.1 0.039 6.2 LOS A 0.0 0.0 0.00 0.34 53.7
8 T1 24 10.7 0.039 0.0 LOS A 0.0 0.0 0.00 0.34 57.9
Approach 58 37.9 0.039 3.6 NA 0.0 0.0 0.00 0.34 55.4
All Vehicles 168 49.6 0.057 3.1 NA 0.2 2.4 0.06 0.27 55.6
Level of Service (LOS) Method: Delay (HCM 2000).
Vehicle movement LOS values are based on average delay per movement
Minor Road Approach LOS values are based on average delay for all vehicle movements.
NA: Intersection LOS and Major Road Approach LOS values are Not Applicable for two-way sign control since the average delay is not a good LOS measure due to zero delays associated with major road movements.
SIDRA Standard Delay Model is used. Control Delay includes Geometric Delay.
Gap-Acceptance Capacity: SIDRA Standard (Akçelik M3D).
HV (%) values are calculated for All Movement Classes of All Heavy Vehicle Model Designation.
SIDRA INTERSECTION 6.1 | Copyright © 2000-2015 Akcelik and Associates Pty Ltd | sidrasolutions.comOrganisation: MRCAGNEY PTY LTD | Processed: Tuesday, 8 March 2016 9:18:25 AMProject: T:\5400-5499\5461 - (Refaka) Bromelton Quarry\Sidra\Sandy Creek Road & Site Access S.L.sip6
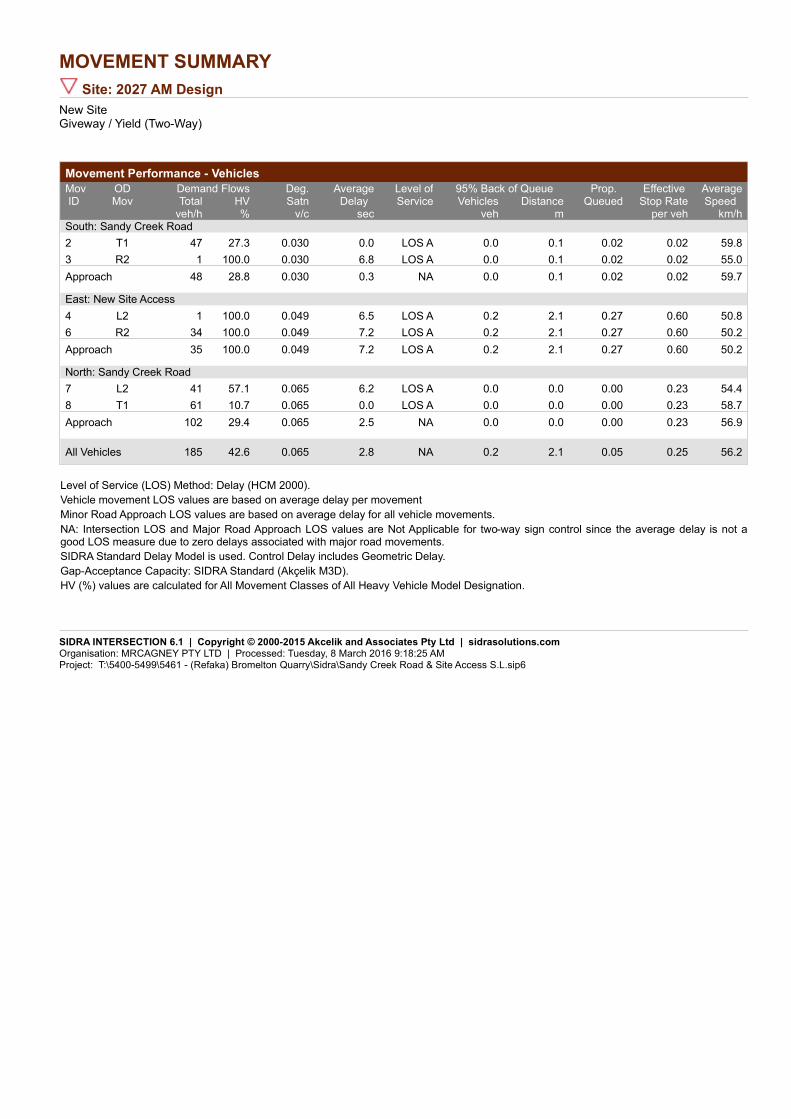
MOVEMENT SUMMARY
Site: 2027 AM Design
New SiteGiveway / Yield (Two-Way)
Movement Performance - Vehicles
Demand Flows 95% Back of QueueMovID
ODMov
Deg.Satn
AverageDelay
Level ofService
Prop. Queued
Effective Stop Rate
AverageSpeed Total HV Vehicles Distance
veh/h % v/c sec veh m per veh km/hSouth: Sandy Creek Road
2 T1 47 27.3 0.030 0.0 LOS A 0.0 0.1 0.02 0.02 59.8
3 R2 1 100.0 0.030 6.8 LOS A 0.0 0.1 0.02 0.02 55.0
Approach 48 28.8 0.030 0.3 NA 0.0 0.1 0.02 0.02 59.7
East: New Site Access
4 L2 1 100.0 0.049 6.5 LOS A 0.2 2.1 0.27 0.60 50.8
6 R2 34 100.0 0.049 7.2 LOS A 0.2 2.1 0.27 0.60 50.2
Approach 35 100.0 0.049 7.2 LOS A 0.2 2.1 0.27 0.60 50.2
North: Sandy Creek Road
7 L2 41 57.1 0.065 6.2 LOS A 0.0 0.0 0.00 0.23 54.4
8 T1 61 10.7 0.065 0.0 LOS A 0.0 0.0 0.00 0.23 58.7
Approach 102 29.4 0.065 2.5 NA 0.0 0.0 0.00 0.23 56.9
All Vehicles 185 42.6 0.065 2.8 NA 0.2 2.1 0.05 0.25 56.2
Level of Service (LOS) Method: Delay (HCM 2000).
Vehicle movement LOS values are based on average delay per movement
Minor Road Approach LOS values are based on average delay for all vehicle movements.
NA: Intersection LOS and Major Road Approach LOS values are Not Applicable for two-way sign control since the average delay is not a good LOS measure due to zero delays associated with major road movements.
SIDRA Standard Delay Model is used. Control Delay includes Geometric Delay.
Gap-Acceptance Capacity: SIDRA Standard (Akçelik M3D).
HV (%) values are calculated for All Movement Classes of All Heavy Vehicle Model Designation.
SIDRA INTERSECTION 6.1 | Copyright © 2000-2015 Akcelik and Associates Pty Ltd | sidrasolutions.comOrganisation: MRCAGNEY PTY LTD | Processed: Tuesday, 8 March 2016 9:18:25 AMProject: T:\5400-5499\5461 - (Refaka) Bromelton Quarry\Sidra\Sandy Creek Road & Site Access S.L.sip6
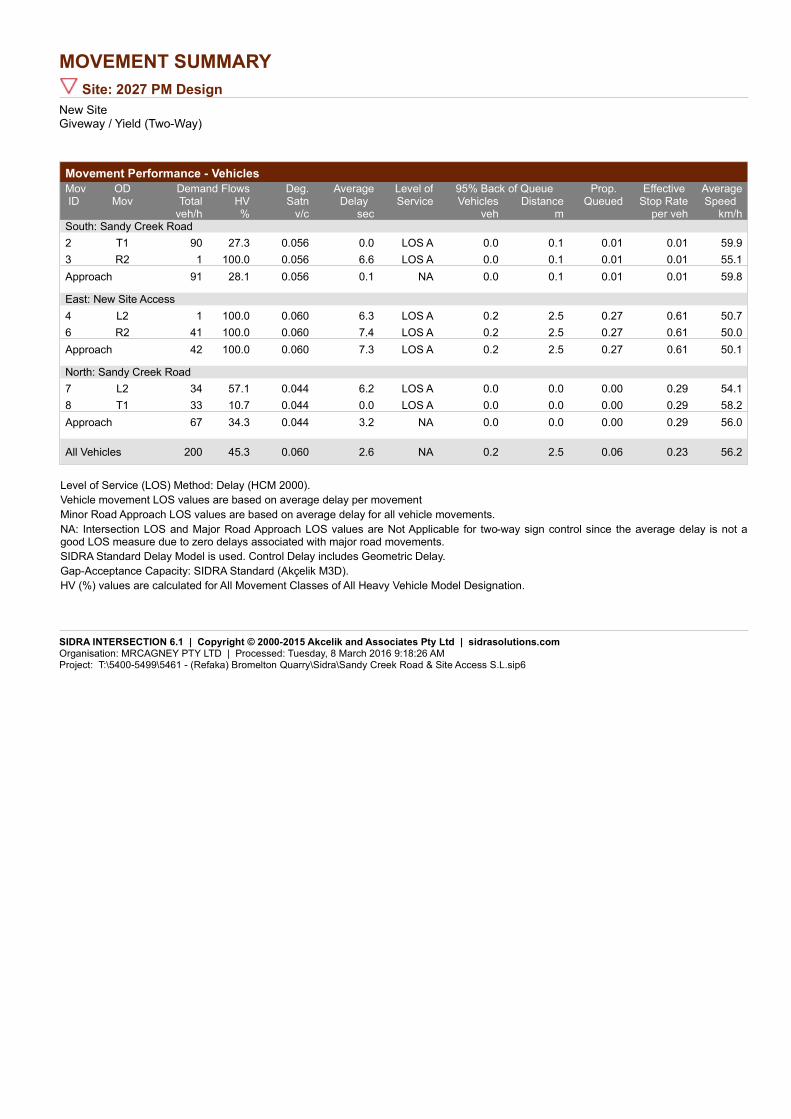
MOVEMENT SUMMARY
Site: 2027 PM Design
New SiteGiveway / Yield (Two-Way)
Movement Performance - Vehicles
Demand Flows 95% Back of QueueMovID
ODMov
Deg.Satn
AverageDelay
Level ofService
Prop. Queued
Effective Stop Rate
AverageSpeed Total HV Vehicles Distance
veh/h % v/c sec veh m per veh km/hSouth: Sandy Creek Road
2 T1 90 27.3 0.056 0.0 LOS A 0.0 0.1 0.01 0.01 59.9
3 R2 1 100.0 0.056 6.6 LOS A 0.0 0.1 0.01 0.01 55.1
Approach 91 28.1 0.056 0.1 NA 0.0 0.1 0.01 0.01 59.8
East: New Site Access
4 L2 1 100.0 0.060 6.3 LOS A 0.2 2.5 0.27 0.61 50.7
6 R2 41 100.0 0.060 7.4 LOS A 0.2 2.5 0.27 0.61 50.0
Approach 42 100.0 0.060 7.3 LOS A 0.2 2.5 0.27 0.61 50.1
North: Sandy Creek Road
7 L2 34 57.1 0.044 6.2 LOS A 0.0 0.0 0.00 0.29 54.1
8 T1 33 10.7 0.044 0.0 LOS A 0.0 0.0 0.00 0.29 58.2
Approach 67 34.3 0.044 3.2 NA 0.0 0.0 0.00 0.29 56.0
All Vehicles 200 45.3 0.060 2.6 NA 0.2 2.5 0.06 0.23 56.2
Level of Service (LOS) Method: Delay (HCM 2000).
Vehicle movement LOS values are based on average delay per movement
Minor Road Approach LOS values are based on average delay for all vehicle movements.
NA: Intersection LOS and Major Road Approach LOS values are Not Applicable for two-way sign control since the average delay is not a good LOS measure due to zero delays associated with major road movements.
SIDRA Standard Delay Model is used. Control Delay includes Geometric Delay.
Gap-Acceptance Capacity: SIDRA Standard (Akçelik M3D).
HV (%) values are calculated for All Movement Classes of All Heavy Vehicle Model Designation.
SIDRA INTERSECTION 6.1 | Copyright © 2000-2015 Akcelik and Associates Pty Ltd | sidrasolutions.comOrganisation: MRCAGNEY PTY LTD | Processed: Tuesday, 8 March 2016 9:18:26 AMProject: T:\5400-5499\5461 - (Refaka) Bromelton Quarry\Sidra\Sandy Creek Road & Site Access S.L.sip6
Bromelton Quarry and Concrete Batching Plant
5461-B-TE-TIA-001 (E).docx
Appendix D
Proposed Site Access Plan

MRCagney

![[SPECO] Catalog - Concrete Batching Plantkr.speco.co.kr/customer_center/pdf/Catalog-ConcreteBatchingPlant.… · Concrete batching plant Silo Top Type Portable Batching Plant Ribbon](https://img.pdfslide.net/doc/110x75/5a9deea57f8b9ada718b6595/speco-catalog-concrete-batching-concrete-batching-plant-silo-top-type-portable.jpg)