Embed Size (px)
Citation preview
Bruce R. White and Associates
3207 Shelter Cove Avenue Davis, California 95616-2627
(530 ) 758-1496
FINAL REPORT A WIND-TUNNEL STUDY OF PEDESTRIAN-LEVEL WIND SPEEDS FOR THE RENOVATION OF THE GETTY VILLA
Bruce R. White, Principal Rachael Coquilla, Engineer Bethany Kuspa, Engineer
Prepared for: Englekirk & Sabol, Inc.
Consulting Structural Engineers, Inc. 2116 Arlington Avenue
P. O. Box 7925 Los Angeles, CA 90007-13098
October 2001
2
1
TABLE OF CONTENTS
Page TABLE OF CONTENTS .......................................................................................................................................... 1
EXECUTIVE SUMMARY ....................................................................................................................................... 2
1. INTRODUCTION....................................................................................................................................... 6
2. WIND ENVIRONMENT IN THE GETTY VILLA AREA ....................................................................... 6
3. WIND EFFECTS OF COMPLEX TERRAIN FEATURES ....................................................................... 7
4. WIND-TUNNEL MODEL.......................................................................................................................... 7
5. METHODOLOGY AND ASSUMPTIONS................................................................................................ 7
6. PRESENTATION OF WIND-TUNNEL RESULTS.................................................................................. 10
7. INTERPRETATION OF WIND-TUNNEL RESULTS.............................................................................. 11
8. WIND-TUNNEL MEASUREMENTS ....................................................................................................... 12
9. DISCUSSION OF WIND-TUNNEL RESULTS ........................................................................................ 13
10. SUMMARY AND CONCLUDING REMARKS ....................................................................................... 15
11. REFERENCES............................................................................................................................................ 17
12. METEOROLOGICAL DATA .................................................................................................................... 19
13 FIGURES AND MISCELLANEOUS ........................................................................................................ 20
APPENDIX A: WIND TUNNEL REDUCED DATA SETS.................................................................................... 26
APPENDIX B: THE ATMOSPHERIC BOUNDARY LAYER WIND TUNNEL AT UC DAVIS......................... 28
APPENDIX C: WIND-TUNNEL ATMOSPHERIC FLOW SIMILARITY PARAMETERS ................................. 30
APPENDIX D: WIND-TUNNEL ATMOSPHERIC BOUNDARY-LAYER SIMILARITY .................................. 33
APPENDIX E: COMPUTER CODE OUTPUT FOR THE FOUR TIMES CASES................................................. 37
2
EXECUTIVE SUMMARY
A wind-tunnel study of the pedestrian-level wind environment was conducted for the proposed
Getty Museum renovation project. The wind study used a one-inch equals 75 foot scaled model
of the Getty Museum site and surrounding area of approximately one mile. The exact
topography of the area was incorporated into the model. Tests were conducted for the most
frequent and strongest wind directions. The Malibu meteorological monitoring station data,
which was felt to be the most appropriate nearby station due to the complex topography terrain,
was used to estimate full-scale wind speeds from the wind-tunnel data. The 10% exceeded full-
scale wind speeds were calculated from a computer code analysis previously used extensively for
San Francisco and Los Angeles areas. The code was adjusted for the prevailing wind conditions
at the Getty Villa site.
The main objective of the test was to predict the wind speeds that would exist on the site for the
determination of the various corresponding comfort levels. One hundred surface points were
measured to evaluate the site. Using the test data as input to the computer code analysis, wind
speeds were calculated for four different daily time intervals. (Note, there was little seasonal
differences observed in the wind speed meteorological data; therefore, the time of day became
the most important variable to examine.) The time intervals calculated were: 12-3 pm, 3-6 pm,
6-9 pm and the 24 hour daily average for a relative comparison. The results of the calculation
are presented in four contour plots of 10% exceeded mean wind speed that correspond to the four
time intervals.
Wind speeds less than 7 mph are appropriate for all pedestrian activities including
amphitheater/outdoor seating areas, while wind speeds 7-11 mph are appropriate for mild
walking. Wind speeds of 12-15 mph are acceptable for brisk walking activities; however would
be unacceptable for sitting activities and may, on occasion, be uncomfortable for leisurely
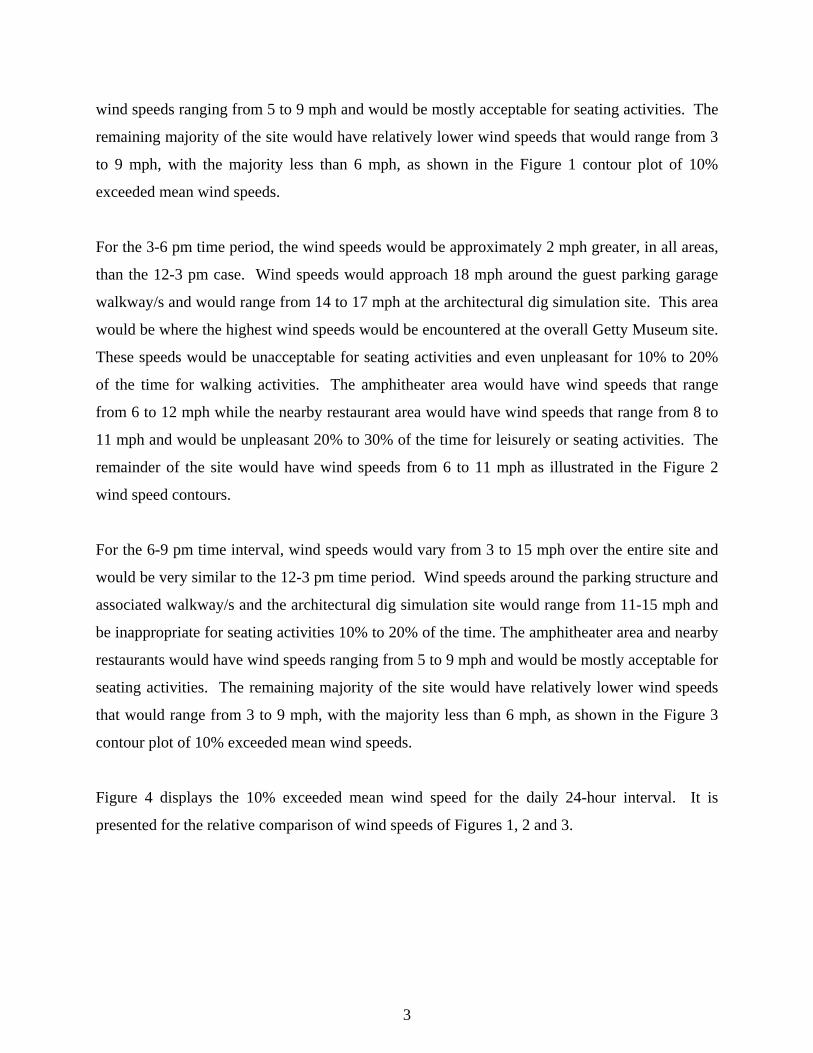
walking. For the 12-3 pm time interval, wind speeds would vary from 3 to 15 mph over the
entire site. Wind speeds around the parking structure and associated walkway/s and the
architectural dig simulation site would range from 11-15 mph and be inappropriate for seating
activities 10% to 20% of the time. The amphitheater area and nearby restaurants would have
3
wind speeds ranging from 5 to 9 mph and would be mostly acceptable for seating activities. The
remaining majority of the site would have relatively lower wind speeds that would range from 3
to 9 mph, with the majority less than 6 mph, as shown in the Figure 1 contour plot of 10%
exceeded mean wind speeds.
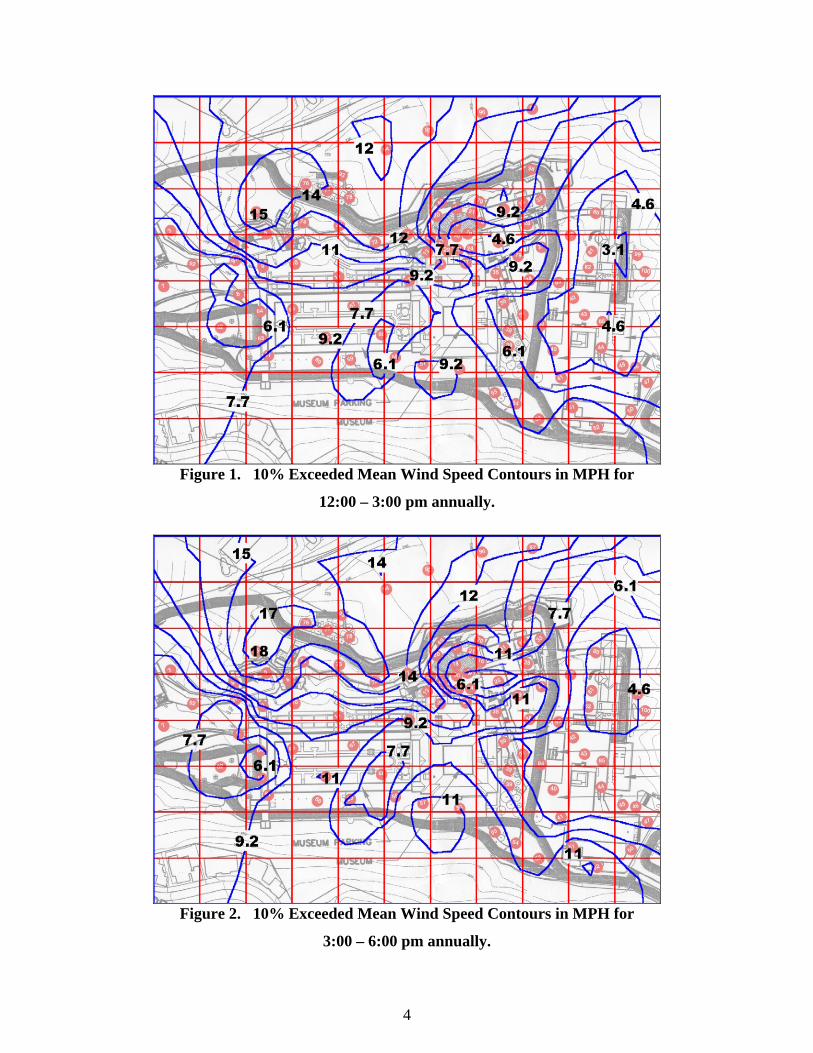
For the 3-6 pm time period, the wind speeds would be approximately 2 mph greater, in all areas,
than the 12-3 pm case. Wind speeds would approach 18 mph around the guest parking garage
walkway/s and would range from 14 to 17 mph at the architectural dig simulation site. This area
would be where the highest wind speeds would be encountered at the overall Getty Museum site.
These speeds would be unacceptable for seating activities and even unpleasant for 10% to 20%
of the time for walking activities. The amphitheater area would have wind speeds that range
from 6 to 12 mph while the nearby restaurant area would have wind speeds that range from 8 to
11 mph and would be unpleasant 20% to 30% of the time for leisurely or seating activities. The
remainder of the site would have wind speeds from 6 to 11 mph as illustrated in the Figure 2
wind speed contours.
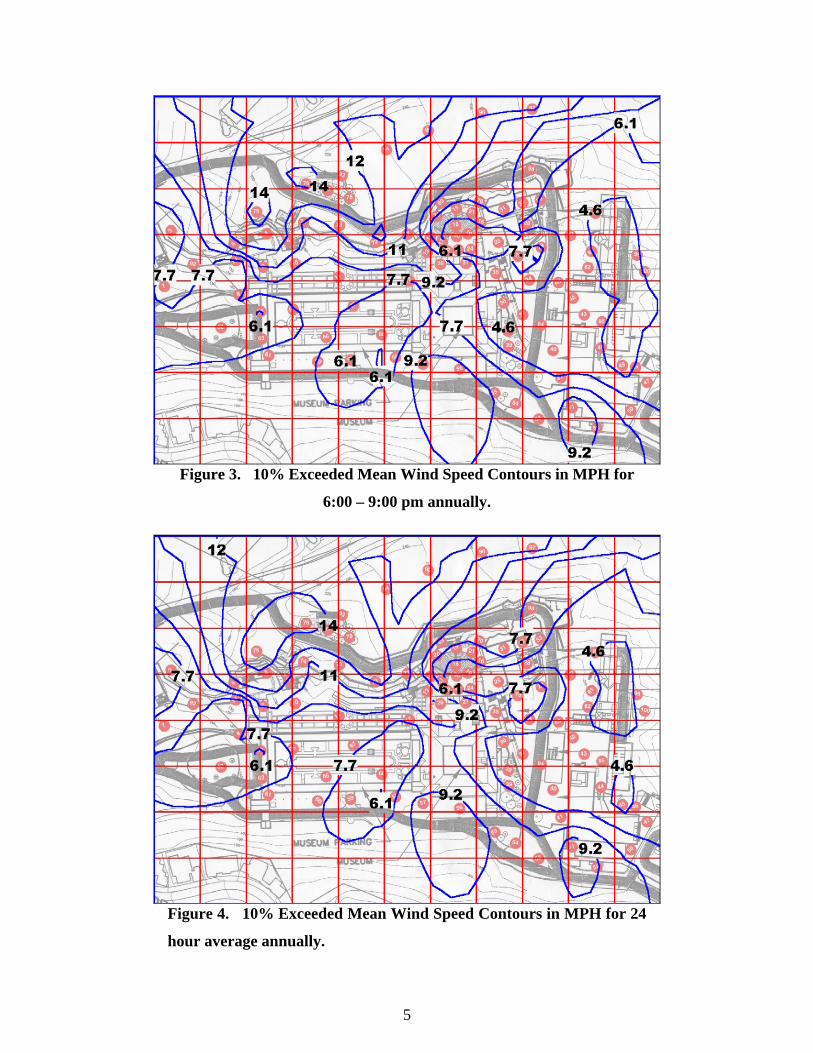
For the 6-9 pm time interval, wind speeds would vary from 3 to 15 mph over the entire site and
would be very similar to the 12-3 pm time period. Wind speeds around the parking structure and
associated walkway/s and the architectural dig simulation site would range from 11-15 mph and
be inappropriate for seating activities 10% to 20% of the time. The amphitheater area and nearby
restaurants would have wind speeds ranging from 5 to 9 mph and would be mostly acceptable for
seating activities. The remaining majority of the site would have relatively lower wind speeds
that would range from 3 to 9 mph, with the majority less than 6 mph, as shown in the Figure 3
contour plot of 10% exceeded mean wind speeds.
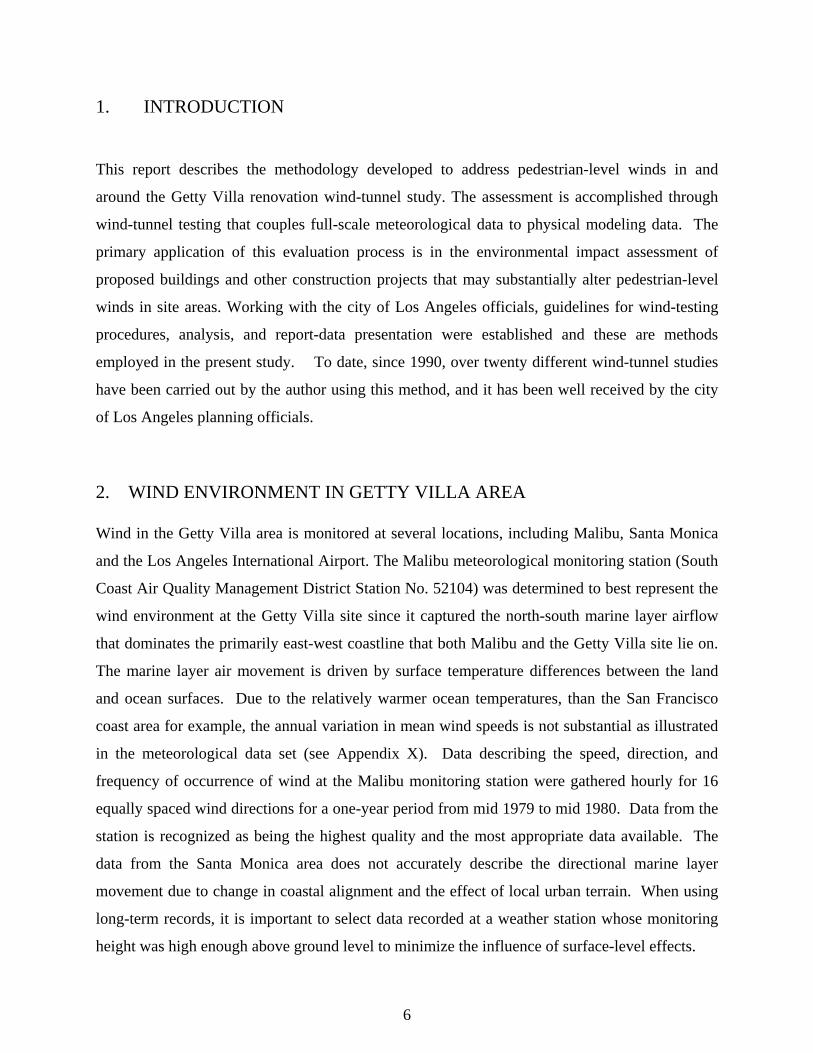
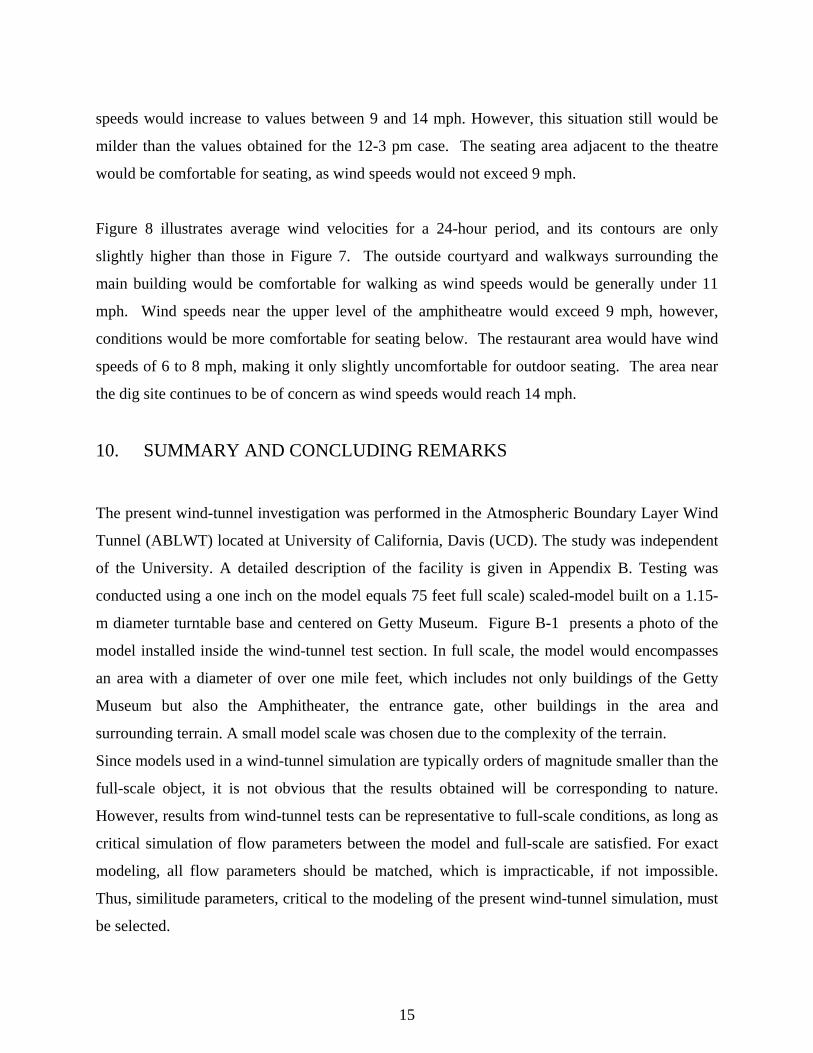
Figure 4 displays the 10% exceeded mean wind speed for the daily 24-hour interval. It is
presented for the relative comparison of wind speeds of Figures 1, 2 and 3.
4
Figure 1. 10% Exceeded Mean Wind Speed Contours in MPH for
12:00 – 3:00 pm annually.
Figure 2. 10% Exceeded Mean Wind Speed Contours in MPH for
3:00 – 6:00 pm annually.
5
Figure 3. 10% Exceeded Mean Wind Speed Contours in MPH for
6:00 – 9:00 pm annually.
Figure 4. 10% Exceeded Mean Wind Speed Contours in MPH for 24
hour average annually.
6
1. INTRODUCTION
This report describes the methodology developed to address pedestrian-level winds in and
around the Getty Villa renovation wind-tunnel study. The assessment is accomplished through
wind-tunnel testing that couples full-scale meteorological data to physical modeling data. The
primary application of this evaluation process is in the environmental impact assessment of
proposed buildings and other construction projects that may substantially alter pedestrian-level
winds in site areas. Working with the city of Los Angeles officials, guidelines for wind-testing
procedures, analysis, and report-data presentation were established and these are methods
employed in the present study. To date, since 1990, over twenty different wind-tunnel studies
have been carried out by the author using this method, and it has been well received by the city
of Los Angeles planning officials.
2. WIND ENVIRONMENT IN GETTY VILLA AREA Wind in the Getty Villa area is monitored at several locations, including Malibu, Santa Monica
and the Los Angeles International Airport. The Malibu meteorological monitoring station (South
Coast Air Quality Management District Station No. 52104) was determined to best represent the
wind environment at the Getty Villa site since it captured the north-south marine layer airflow
that dominates the primarily east-west coastline that both Malibu and the Getty Villa site lie on.
The marine layer air movement is driven by surface temperature differences between the land
and ocean surfaces. Due to the relatively warmer ocean temperatures, than the San Francisco
coast area for example, the annual variation in mean wind speeds is not substantial as illustrated
in the meteorological data set (see Appendix X). Data describing the speed, direction, and
frequency of occurrence of wind at the Malibu monitoring station were gathered hourly for 16
equally spaced wind directions for a one-year period from mid 1979 to mid 1980. Data from the
station is recognized as being the highest quality and the most appropriate data available. The
data from the Santa Monica area does not accurately describe the directional marine layer
movement due to change in coastal alignment and the effect of local urban terrain. When using
long-term records, it is important to select data recorded at a weather station whose monitoring
height was high enough above ground level to minimize the influence of surface-level effects.
7
3. WIND EFFECTS OF COMPLEX TERRAIN FEATURES The frequency of occurrence, speed, and level of turbulence of winds at street level are important
to the comfort and safety of pedestrians in pedestrians areas. Tall structures or rapidly changing
terrain may intercept the faster wind speeds that flow higher above the ground. Consequently,
pedestrian-level wind speeds can be significantly changed when a taller structure, or sharply
sloping terrain divert a portion of the higher-level wind speed either down the face of the
structure or along the sloping terrain until that flow reaches pedestrian level. Because the
diverted winds have higher speeds than those near the ground, the effects of those diverted winds
can be substantial. Rough terrain, sometimes referred to as “complex terrain,” in and around
Getty Villa site does rise many hundreds of feet above and below the Getty Villa buildings, and
thus cause major accelerations of the wind speeds over the site that would otherwise not occur.
Generally, as the heights of prevailing terrain in an area becomes more uniform, the ground-level
effects of individual features and buildings in the area are reduced. 4. WIND-TUNNEL MODEL A one-inch equals 75 foot scaled model was designed and built from the CAD plans provided at
the beginning of the project. The model included exact topographic features over a diameter of
about 3400 feet, with the center of the Getty Villa as the center of the turntable model. Areas
beyond this diameter were simulated in the wind-tunnel test by “building “ the proper terrain
topography, from seven and half minute USGS maps, for each wind direction that was tested.
Winds speeds and turbulence intensities were measured at 100 representative locations in the test
of the project for three prevailing wind directions. Figure 1 shows a photograph of the wind-
tunnel model.
5. METHODOLOGY AND ASSUMPTIONS For each surface wind-speed measurement made in the wind tunnel, it is desirable to estimate an
associated full-scale wind speed frequency distribution. The determination of the full-scale wind
8
distribution will, of course, depend upon the nature of the meteorological conditions at the site.
For the present study, it was determined to use the full-scale mean wind speed exceeded 10% of
the time from several different time periods during the day to determine its effect on the wind
speed values. For the present test, four time periods were analyzed with the wind-tunnel data: i)
the 24-hour a day interval; ii) the 12:00 p.m. to 3:00 p.m. interval; iii) the 3:00 p.m. to 6:00 p.m.
interval; and, iv) the 6:00 p.m. to 9:00 p.m. interval. The meteorological data used were
acquired at the weather station at the Malibu during the years 1979-1980 on an annual, hourly
basis for 16 equally spaced wind directions. The measurements were taken hourly and averaged
over one-minute time periods. Of the 16 measured wind directions, three primary wind
directions comprised the greatest frequency of occurrence as well as the majority of strong wind
occurrences. These wind directions were northeast (included the north-northeast and east-
northeast wind directions), south (included the south-southeast and south-southwest wind
directions); and west-southwest (included the southwest and west directions), These three wind
sectors had associated occurrence rates of 36.2%, 18.8% and 29.0%, respectively, thus totaling
84% of all wind occurrences. The remaining wind directions comprised the other 16% frequency
of occurrence. Calm conditions were distributed incrementally into all of the time.
In order to determine whether equivalent wind speeds are acceptable at specific locations, it is
necessary to establish a set of “comfort” criteria that defines wind speeds that are usually
acceptable for specific pedestrian uses. The term “10% exceeded speed” is used in the criteria to
account for the frequency with which winds occur. The 10% exceeded speed is the speed that is
exceeded on one day out of 10, or 10% of the time, for the specified time interval being
considered, i.e., 3:00 p.m. to 6:00 p.m.
The wind intensity is defined in terms of the equivalent wind speed. This term denotes the wind
speed averaged over an hour (hourly mean wind speed), modified to include the level of
gustiness, or turbulence, expected on the site. The equivalent wind speed calculated in the
present context assumes an unaltered wind with an inherent turbulence intensity of 15% of the
hourly mean wind-speed value. The turbulence intensity is defined as the root mean square of
the instantaneous deviations from the value of the mean velocity, divided by the mean velocity
value. When turbulence intensity as a street level point is greater than 15%, the mean velocity
9
for that point is multiplied by two times the turbulence intensity plus 0.7 to create the equivalent
wind speed for that point. This equation follows relationships developed by Hunt et al. (1976)
and Jackson (1978) in which winds with different turbulence intensities were compared to each
other for their effects on pedestrians.
The method used to estimate the full-scale 10% exceeded wind speed assumed the ratio of
pedestrian-level wind speed to reference height speed (both in the wind tunnel) was equal to the
same ratio in full scale. The reference height used corresponds to the height of the weather
station at the Malibu monitoring station (32 feet). The average of the measured wind-tunnel
wind ratios for the three tested wind directions (at a given position and setting) was assumed to
be the average wind ratio of the 13 untested wind directions. The justification for this procedure
is that there is a symmetry-of-sorts of the wind flow, and although the technique is not 100%
accurate, it does provide a reasonable estimate of the average wind speed that would occur from
the untested 13 wind directions. Thus, the weighted cumulative averaged pedestrian-level 10%
exceeded wind speed calculations account for all wind directions.
The ratio of the reference height wind speed to the wind speed at pedestrian-level is calculated
from the results of the wind-tunnel experiment for each major direction at each observation
location. For each, the calculation procedure to determine a given percent exceeded wind speed
(in the present case this is 10%) involves three steps. First, a pedestrian-level wind speed is
selected. Second, the specific pedestrian-level wind speed is used to calculate the reference
height wind speed for each wind speed component (using the ratios from the wind-tunnel
experiment). Third, the meteorological data is used to determine the percentage of time each of
the reference level wind speeds is exceeded. The three steps are iterated, with changes in the
pedestrian-level wind speed, until the percentage of the time the winds are exceeded equals the
selected percentage of time, thus yielding the selected percent exceeded wind speed. The
process may be repeated numerous times in 1% increments to develop pedestrian level wind
speed frequency distributions.
For the present case, the 10% exceeded pedestrian-level wind speed is determined from wind-
tunnel measurements made for the three wind directions. The wind-tunnel speed is scaled to the
10
full-scale speed by use of the power-law relationship given by Davenport (1961). The Malibu
meteorological data is used to find the distribution of speed as a function of time based on the
wind-tunnel speed ratio. The meteorological data is adjusted to the appropriate α , power-law
coefficient value which is set depending upon the local terrain of the test area; i.e., from Malibu
conditions: 500.2.0 == δα feet
The individual wind direction meteorological data is expressed as a cumulative frequency
distribution which is reasonably well described by the relation, N=exp(k1 log(S) + k2) where N
is the number of hourly observations, or percent of total time, the wind speed exceeds the value
S. S is the wind speed of interest; i.e., 11 mph, and k1, k2 are empirical constants fit to the data.
The cumulative full-scale frequency distribution of wind, at a height of 32 feet, is then calculated
and the desired percent-exceeded wind speed is mathematically described.
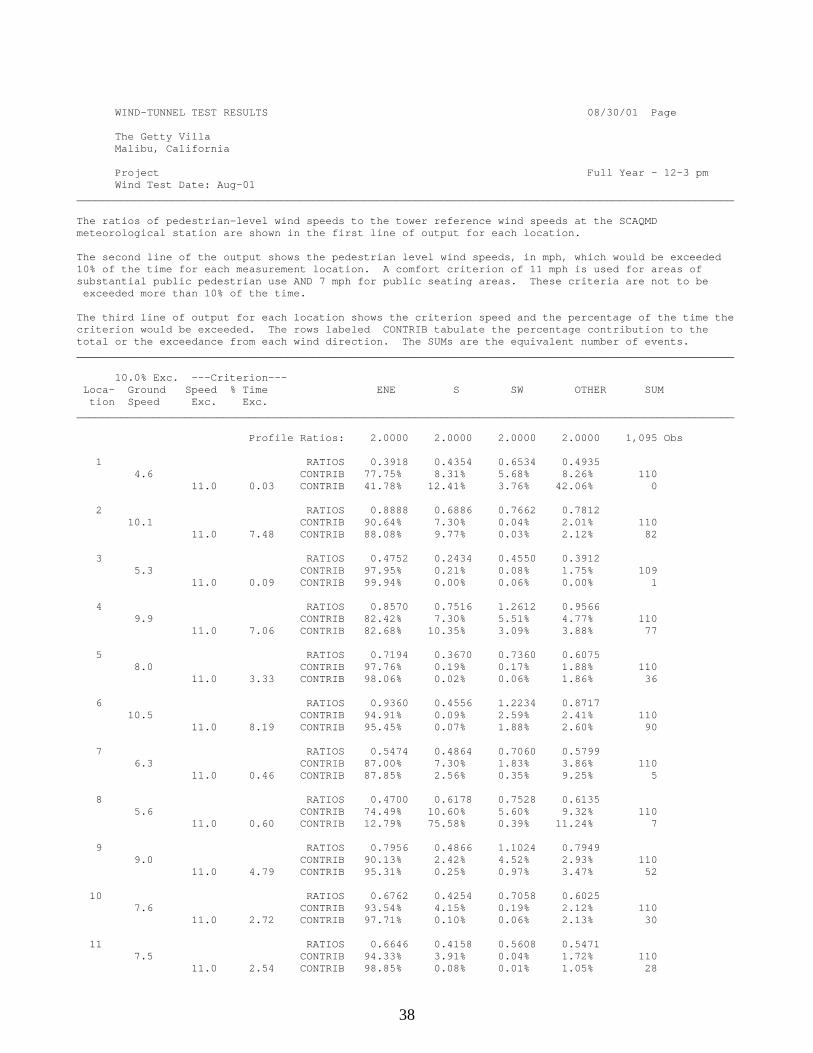
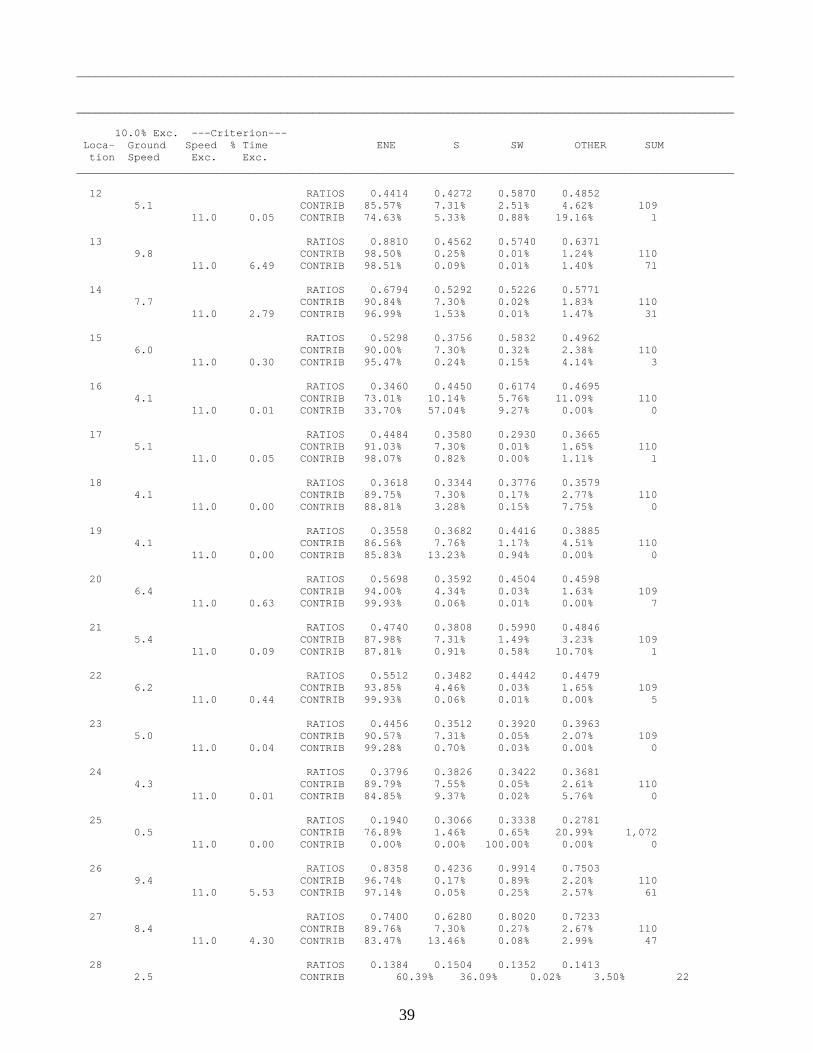
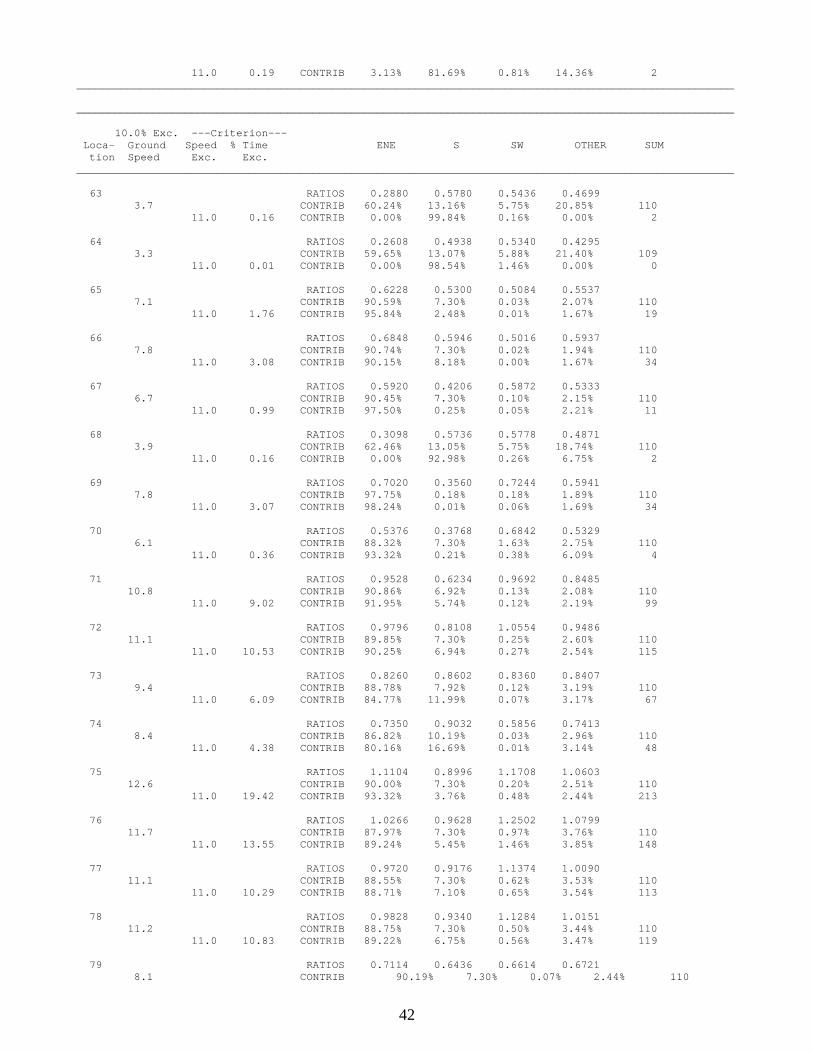
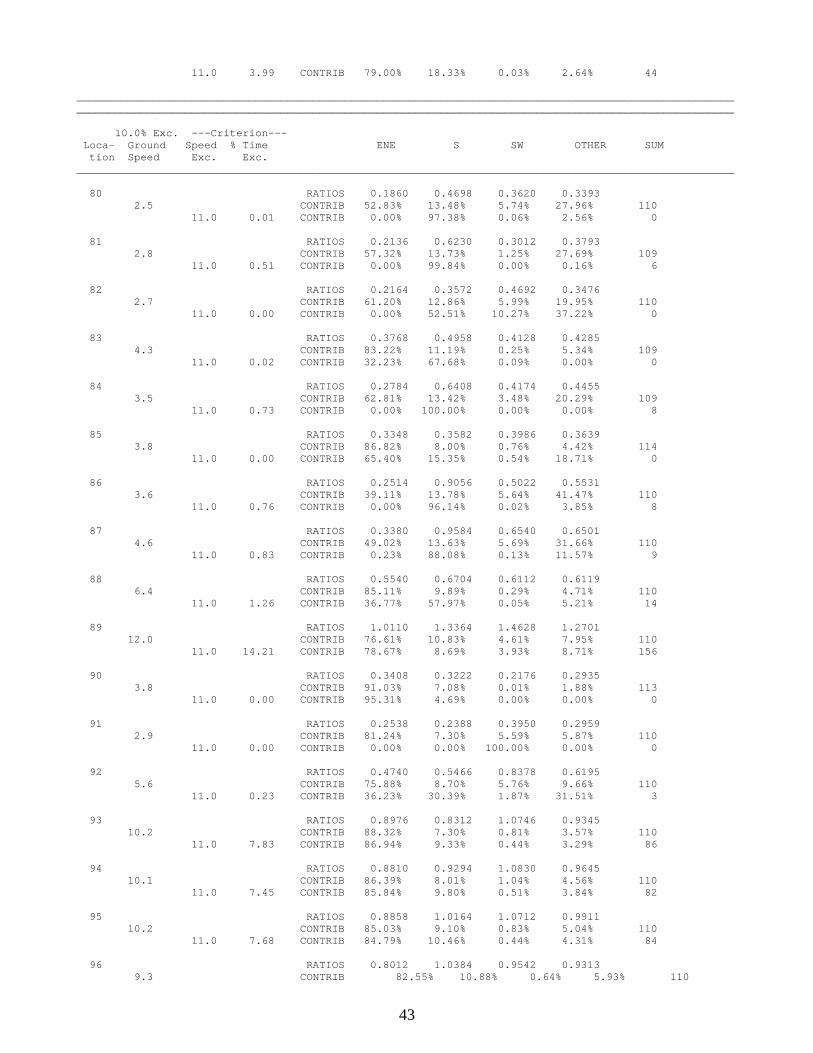
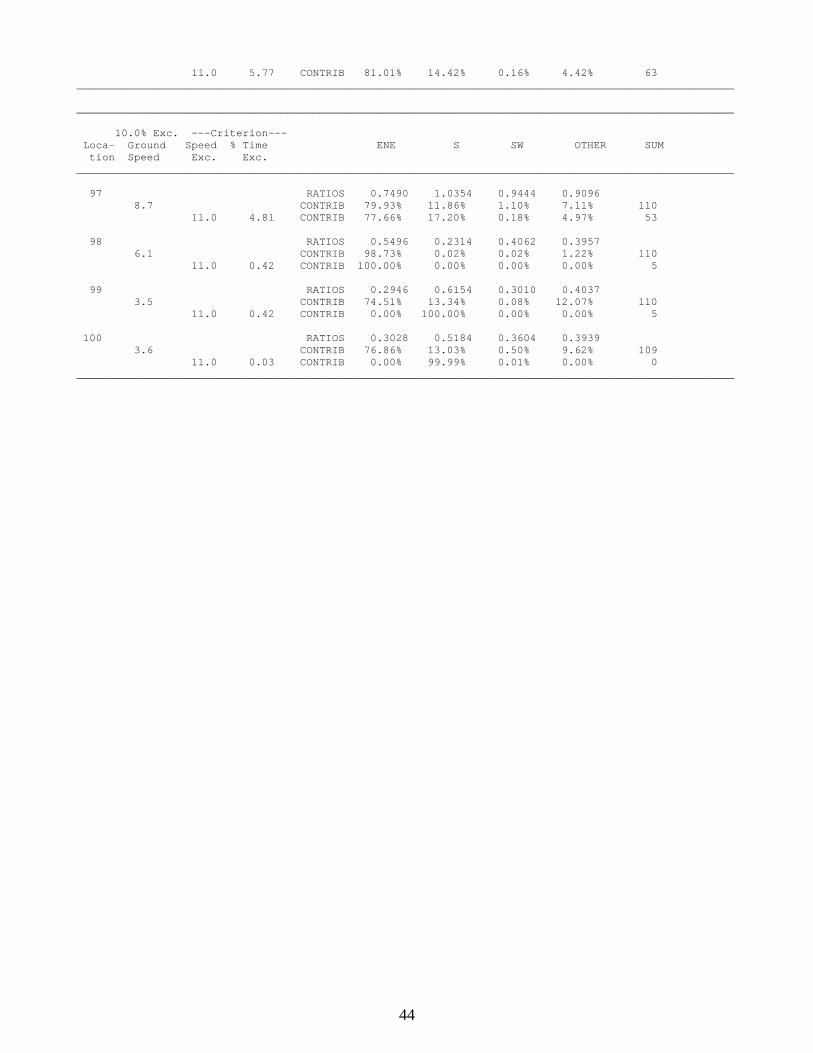
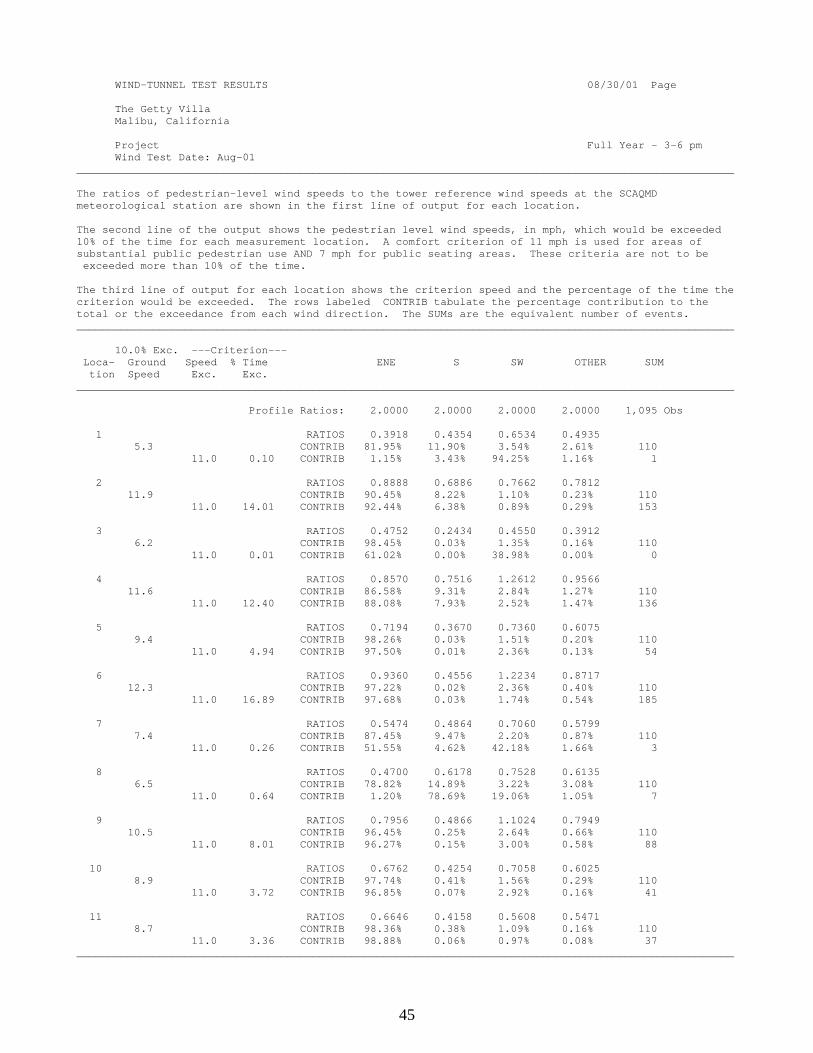
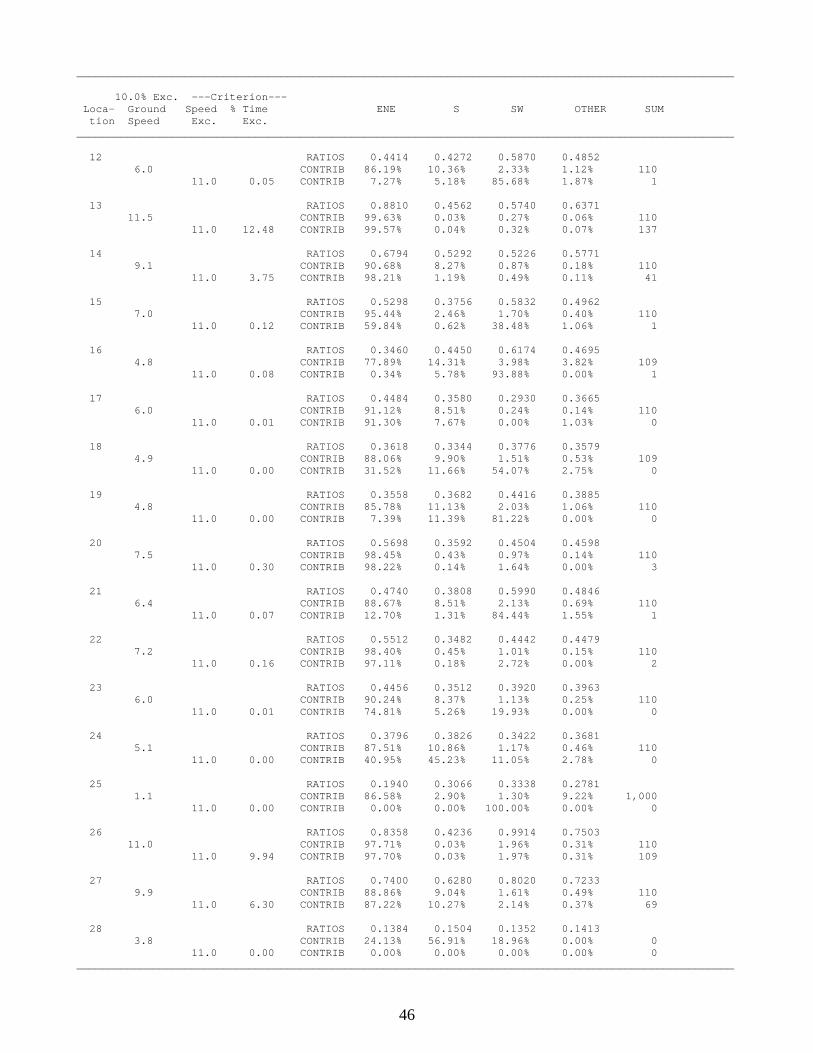
6. PRESENTATION OF RESULTS
The wind-tunnel test results are presented in table form as output from the computer program.
Appendix 2 displays an output for four time intervals computed for the 100 locations. The 10%
exceeded pedestrian-level wind speed (mph) is calculated and shown after the location column.
The appropriate criterion is listed in the next column to the right (it is adjustable depending upon
the location and in this sample case set to 11 mph). Next, the wind-tunnel speed ratios and
corresponding contributions are presented for the three tested wind directions (northeast, south or
southwest) and the “other” column is the average of the three test cases that is used to account
for the untested cases, which accounts for only 14% of all occurrences. The contributions
indicated the weighting of each 10% exceeded pedestrian-level wind speed calculated. For
example, for location 1, 89.7% of the 10.59 mph wind speed is contributed from the west
prevailing wind direction. In this way, the major influencing wind directions can be identified
and the validity of not testing all wind directions can be determined; i.e., in Location #1, only
0.8% of the 10.59 mph is estimated to be caused by the untested wind directions.
These data of Appendix 2 are from a proposed high-rise structure in the heart of downtown Los
Angeles near the intersection of Seventh and Figueroa Streets. For the existing setting Location
11
#2 exceeds the 11-mph criterion 1.0% of the time resulting in 10% exceeded pedestrian level
wind of 11.19 mph, with 95.5% contribution coming from the west wind direction. In the project
setting location #2 has an 11.79 mph wind with 2% exceedance of the criterion. Location #1
appears as a 13.40 mph 10% exceeded wind speed with a 5.0% exceedance of the 11-mph
criterion, with 93.4% of the exceedance being attributed to the west wind. In the existing setting
there was an exceedance for location #1.
In this fashion, a detailed analysis of the future wind environment around a site can be analyzed
locating critical areas and the specific wind directions and frequencies that would create the
condition. In this manner, intelligent planning decisions may be made that are based on
quantitative data and not subjective opinions.
7. INTERPRETATION OF RESULTS
A set of “comfort” criteria defines equivalent wind speeds that are usually acceptable for specific
pedestrian uses. The term “10% exceeded speed” is used in these criteria to account for the
frequency with which such “equivalent” winds occur. The city of Los Angeles officials have
agreed to the following criteria for recent wind-tunnel studies carried out by the author (White,
1991 and 1994). These should also be appropriate for the Getty Villa site as well: 10% exceeded
speeds of 7 mph and less will be considered as comfortable for outdoor seating. Those 10%
exceeded speed of 11 mph and less will be considered comfortable for standing and leisure
walking, while those between 12 and 15 mph will be suitable for walking and other occasional
uses. Ten percent exceeded speeds is excess of 15 mph will result in potentially uncomfortable
pedestrian conditions. Ten percent exceeded speeds reaching or exceeding 36 mph create
potential safety hazards for pedestrians.
The seating criterion of 7 mph equivalent wind speed not to be exceeded more than 10% of the
time year round between 8 a.m. and 7 p.m. was based on the wind-speed seating criterion given
by Penwarden (1973), Melbourne (1978), Arens (1981) and Arens et al. (1989). The interval
time of interest was chosen when most of the population would be exposed to the wind. It was
essentially an environmental quality decision based on the study of wind related complaints in
12
shopping centers (Penwarden, 1973). Penwarden found that most complaints occurred when the
limit of comfort (7 mph) was exceeded more than 10% of the time. The same also was found to
be true for the 11-mph and 15-mph comfort criteria.
Additionally, Penwarden’s suggestions for the onset of discomfort were based on mean speeds
and did not contain effects of turbulence or gustiness in his assessment. This is precisely the
reason the current method uses equivalent wind speeds instead of the mean speed. The
equivalent wind speed incorporates the effects of turbulence to estimate what a mean wind speed
with a 15% turbulence intensity (the unaltered value) would feel like or be equivalent to when
turbulence effects are incorporated. This procedure follows the ideas of estimating equivalent
wind speeds with variable levels of turbulence presented by Hunt et. al. (1976) in which winds of
different turbulence intensities were compared to each other for their effects on pedestrians.
8. WIND-TUNNEL MEASUREMENTS
Wind speed and the corresponding turbulence intensity were measured using a TSI, Inc. Model
1210 single hot-wire anemometer probe. Using a LabVIEW data-acquisition system, data was
acquired and digitally recorded for each measurement point at a sample rate of 1000 Hz for 30
seconds. This yielded 30,000 individual voltage values that were individually converted to
instantaneous wind speed according to a hot-wire calibration curve that was acquired before the
testing commenced. The 30,000 samples were then averaged to produce a single mean surface
wind speed and the root-mean-square value for the turbulence intensity. The resulting mean
speeds and turbulence intensities represent one-hour full-scale average time measurements when
the wind-tunnel data is converted to the full scale.
The majority of the testing centered on the areas around the amphitheater, pedestrian walkways,
outdoor eating areas, and suspected areas in which strong winds might be of concern. Tests were
conducted for the three wind directions: south, southwest and east-northeast, which according to
13
the wind data from the Malibu monitoring station were found to be the strongest and most
frequent winds. The referred wind data are given in Appendix 3.
For each wind direction tested, the approach wind speed, as a function of height above the
ground (boundary-layer velocity profile), was non-dimensionally simulated in the wind tunnel
based upon the upwind surface terrain-roughness features (i.e., terrain up to 3000 feet upwind
were modeled). This technique is known to provide accurate surface wind speed simulation of
the full-scale case. Mean wind speeds and the fluctuating components of the speeds (i.e.,
turbulence intensities) were measured at 100 surface locations distributed around the Getty
Museum renovation site. Figure 3 represents a contour map of the scaled models with the
location points superimposed over the chosen test area.
A first step in the analysis (with the wind-tunnel data) was to measure the ratio of equivalent
wind-speed to a reference height. This ratio is referred to as the “wind-speed ratio” or R-value.
This particular value represents a pedestrian-level wind-speed magnitude that accounts for the
effects of the local turbulence. A second step in the analysis is to input the wind-speed ratios into
the computer code that integrates and scales the measured wind data with full-scale
meteorological data to produce an averaged full-scale 10% exceeded equivalent wind speed.
Using values of pedestrian-level turbulence measured in the wind-tunnel tests, full-scale 10%
exceeded ground speeds were then numerically calculated. A collection of output files is
provided as an attachment to this report. The description at the top of each attachment refers to
the San Francisco Wind Ordinance Code for pedestrian comfort criteria, which was modified to
account for the full-scale winds measured at the Malibu monitoring station. This computer code
was originally developed by the city of San Francisco; however, it may be used for other
cities/areas if appropriate adjustments are made to the full-scale meteorological data set, which
have been performed for the present Getty Villa calculations.
9. DISCUSSION OF WIND-TUNNEL RESULTS
Contour plots of 10% exceeded mean wind speeds (in mph) are used to display the results for
specific times during the day in Figures 1 through 3, and Figure 4 shows a contour plot of the
14
10% exceeded for the 24 hour period. The contours of each time frame represent the average
conditions for the entire year and do not take into account seasonal effects. However, seasonal
changes during the same time are small; and, accordingly, the time of day has a greater influence
on the speeds than the seasonal variation. Standards for acceptable wind speeds have been
determined both from previous testing and conducted studies of wind speeds as they relate to
consumer comfort (Arens et al. 1989; White 1991 & 1994). Wind speeds under 7 mph are ideal
for outdoor seating areas and wind speeds below 11 mph are comfortable for leisurely walking,
wind speeds between 11 and 15 mph are generally acceptable for vigorous walking activities,
although wind speeds greater than 15 mph can become uncomfortable for outdoor activities and
even hazardous.
Figure 1 shows a contour of the wind speeds superimposed on a map of the proposed Getty
Museum renovation site between the hours of 12-3 pm. Conditions in the courtyard and around
the main structure maintain speeds between 4 and 9 mph in most of these areas, and are
acceptable for walking but can be uncomfortable for seating. Areas of concern, however,
include the amphitheater, its surrounding area and the area by the dig site and the walkway
leading to the site. Values here range from 7 to 12 mph and may be unpleasant for seated
activities held in the vicinity.
From 3-6pm, shown in Figure 6, the wind speeds increase over the entire area which are about 2
mph greater than the 12- 3 pm wind speeds. During this time, the areas surrounding the building
and inside the courtyard are bordering uncomfortable for walking as speeds approach 11 mph,
and the amphitheatre and adjacent outdoor restaurant areas would become unpleasant for seating.
The winds around the dig site increase from a maximum of 15 mph for the 12-3 pm case to a
maximum of 18 mph near the stairway. The conditions there may be unpleasant even for
walking.
Wind velocities would decrease during the 6-9 pm time, as seen from Figure 3, and closely
resemble the 12-3 pm case. Speeds around the museum’s main building would remain below 10
mph. The amphitheater would be more pleasant with wind speeds less than 9 mph, although at
the top of the amphitheater, near the dig site and stairway-walkway leading to the site, the wind
15
speeds would increase to values between 9 and 14 mph. However, this situation still would be
milder than the values obtained for the 12-3 pm case. The seating area adjacent to the theatre
would be comfortable for seating, as wind speeds would not exceed 9 mph.
Figure 8 illustrates average wind velocities for a 24-hour period, and its contours are only
slightly higher than those in Figure 7. The outside courtyard and walkways surrounding the
main building would be comfortable for walking as wind speeds would be generally under 11
mph. Wind speeds near the upper level of the amphitheatre would exceed 9 mph, however,
conditions would be more comfortable for seating below. The restaurant area would have wind
speeds of 6 to 8 mph, making it only slightly uncomfortable for outdoor seating. The area near
the dig site continues to be of concern as wind speeds would reach 14 mph.
10. SUMMARY AND CONCLUDING REMARKS
The present wind-tunnel investigation was performed in the Atmospheric Boundary Layer Wind
Tunnel (ABLWT) located at University of California, Davis (UCD). The study was independent
of the University. A detailed description of the facility is given in Appendix B. Testing was
conducted using a one inch on the model equals 75 feet full scale) scaled-model built on a 1.15-
m diameter turntable base and centered on Getty Museum. Figure B-1 presents a photo of the
model installed inside the wind-tunnel test section. In full scale, the model would encompasses
an area with a diameter of over one mile feet, which includes not only buildings of the Getty
Museum but also the Amphitheater, the entrance gate, other buildings in the area and
surrounding terrain. A small model scale was chosen due to the complexity of the terrain.
Since models used in a wind-tunnel simulation are typically orders of magnitude smaller than the
full-scale object, it is not obvious that the results obtained will be corresponding to nature.
However, results from wind-tunnel tests can be representative to full-scale conditions, as long as
critical simulation of flow parameters between the model and full-scale are satisfied. For exact
modeling, all flow parameters should be matched, which is impracticable, if not impossible.
Thus, similitude parameters, critical to the modeling of the present wind-tunnel simulation, must
be selected.
16
A wind-tunnel study of the pedestrian-level wind environment was conducted for the proposed
Getty Museum renovation project. Tests were conducted for the most frequent and strongest
wind directions. The Malibu meteorological monitoring station data, which was felt to be the
most appropriate nearby station due to the complex topography terrain, was used to estimate full-
scale wind speeds from the wind-tunnel data. The 10% exceeded full-scale wind speeds were
calculated from a computer code analysis previously used extensively for San Francisco and Los
Angeles areas. The code was adjusted for the prevailing wind conditions at the Getty Villa site.
The main objective of the test was to predict the wind speeds that would exist on the site for the
determination of the various corresponding comfort levels. One hundred surface points were
measured to evaluate the site. Using the test data as input to the computer code analysis, wind
speeds were calculated for four different daily time intervals. (Note, there was little seasonal
differences observed in the wind speed meteorological data; therefore, the time of day became
the most important variable to examine.) The time intervals calculated were: 12-3 pm, 3-6 pm,
6-9 pm and the 24 hour daily average for a relative comparison. The results of the calculation
are presented in four contour plots of 10% exceeded mean wind speed that correspond to the four
time intervals.
Wind speeds less than 7 mph are appropriate for all pedestrian activities including
amphitheater/outdoor seating areas, while wind speeds 7-11 mph are appropriate for mild
walking. Wind speeds of12-15 mph are acceptable for brisk walking activities; however would
be unacceptable for sitting activities and may, on occasion, be uncomfortable for leisurely
walking. For the 12-3 pm time interval, wind speeds would vary from 3 to 15 mph over the
entire site. Wind speeds around the parking structure and associated walkway/s and the
architectural dig simulation site would range from 11-15 mph and be inappropriate for seating
activities 10% to 20% of the time. The amphitheater area and nearby restaurants would have
wind speeds ranging from 5 to 9 mph and would be mostly acceptable for seating activities. The
remaining majority of the site would have relatively lower wind speeds that would range from 3
to 9 mph, with the majority less than 6 mph, as shown in the Figure 1 contour plot of 10%
exceeded mean wind speeds.
17
For the 3-6 pm time period, the wind speeds would be approximately 2 mph greater, at all areas,
than the 12-3 pm case. Wind speeds would approach 18 mph around the guest parking garage
walkway/s and would range from 14 to 17 mph at the architectural dig simulation site. This area
would be where the highest wind speeds would be encountered at the overall Getty Museum site.
These speeds would be unacceptable for seating activities and even unpleasant for 10% to 20%
of the time for walking activities. The amphitheater area would have wind speeds that range
from 6 to 12 mp,h while the nearby restaurant area would have wind speeds that range from 8 to
11 mph and would be unpleasant 20% to 30% of the time for leisurely or seating activities. The
remainder of the site would have wind speeds from 6 to 11 mph as illustrated in the Figure 2
wind speed contours.
For the 6-9 pm time interval, wind speeds would vary from 3 to 15 mph over the entire site and
would be very similar to the 12-3 pm time period. Wind speeds around the parking structure and
associated walkway/s and the architectural dig simulation site would range from 11-15 mph and
be inappropriate for seating activities 10% to 20% of the time. The amphitheater area and nearby
restaurants would have wind speeds ranging from 5 to 9 mph and would be mostly acceptable for
seating activities. The remaining majority of the site would have relatively lower wind speeds
that would range from 3 to 9 mph, with the majority less than 6 mph, as shown in the Figure 3
contour plot of 10% exceeded mean wind speeds.
11. REFERENCES
Arens, E. 1981 “Designing for an acceptable wind environment”, Trans. Engrg., ASCE, Vol. 107, No. Te 2, pp 127-141. Arens, E., C., D. Ballanti, C.B. Bennett, S. Guldman, and B.R. White 1989 “Developing the San Francisco wind ordinance and its guidelines for compliance”, Building and Environment, Vol. 24, No. 4, pp 297-303. Davenport, A.G. 1961 “The application of statistical concept of wind loading of structures”, Proc. Inst. Civil Engrg, 19, 449-472. Hunt, J.C.R., E.C. Poulton, and J.C. Mumford 1976 “The effects of wind on people: new criteria based on wind tunnel experiments,” Building and Environment, Vol. 13, pp 251-260.
18
Jackson, P.S. 1978 “The evaluation on windy environments,” Building and Environment 13, pp 251-260. Melbourne, W.H. 1978 “Criteria for environmental wind conditions,” Journal Wind Engineering and Industrial Aerodynamics , Vol. 3, pp 241-249. Penwarden, A.D. 1973 “Acceptable wind speeds in towers,” Building Science, Vol. 8 No. 3, pp 259-267. White, B. R. 1991 “Analysis and wind-tunnel simulation of pedestrian-level winds in San Francisco, Journal Wind Engineering and Industrial Aerodynamics, Vol. 41, pp 2353-2364. White, B. R. 1991 “Analysis and wind-tunnel simulation of pedestrian-level winds in San Francisco, Proceedings of the Eight International Conference on Win Engineering, University of Western Ontario, London, Ontario, Canada, July 8-12. White, B. R. 1994 “Wind-tunnel simulation of pedestrian level wind in Los Angeles,” Proceedings of the 2nd United Kingdom Wind Engineering Conference, Wind Engineering Society, held at University of Warwick, England, September 19-22.
19
Meteorological Data to be added in pdf format.

20
Figures and Miscellaneous
21
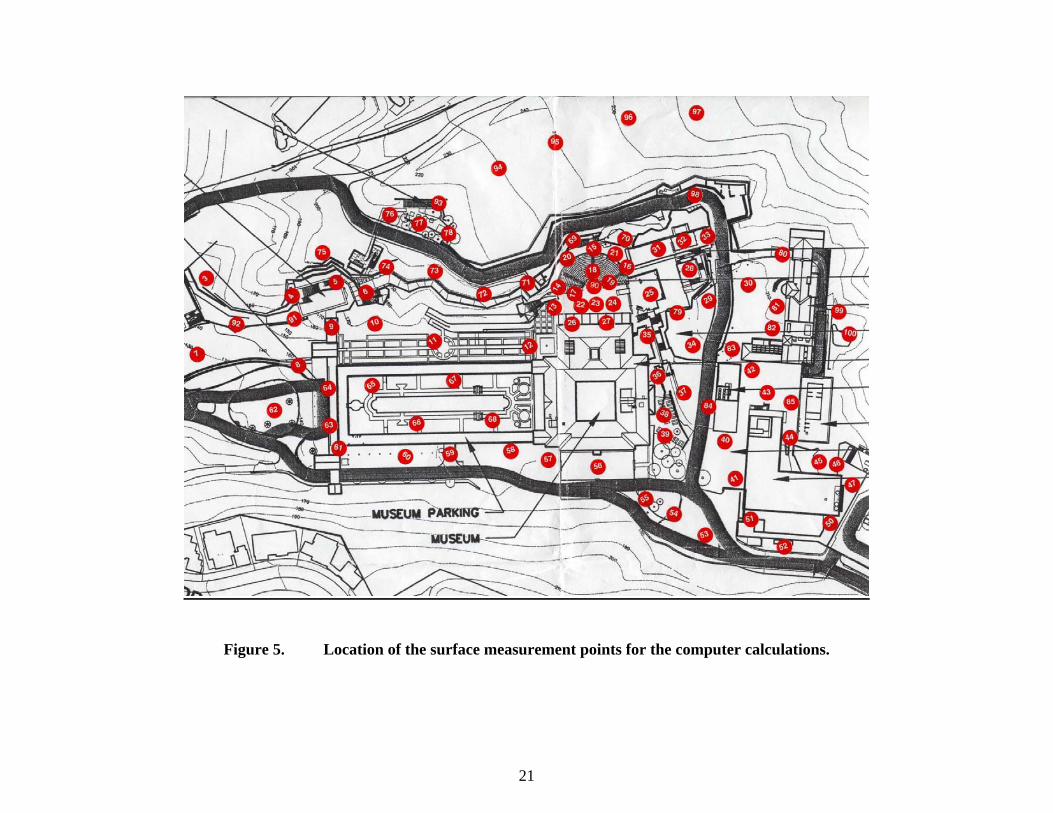
Figure 5. Location of the surface measurement points for the computer calculations.
22
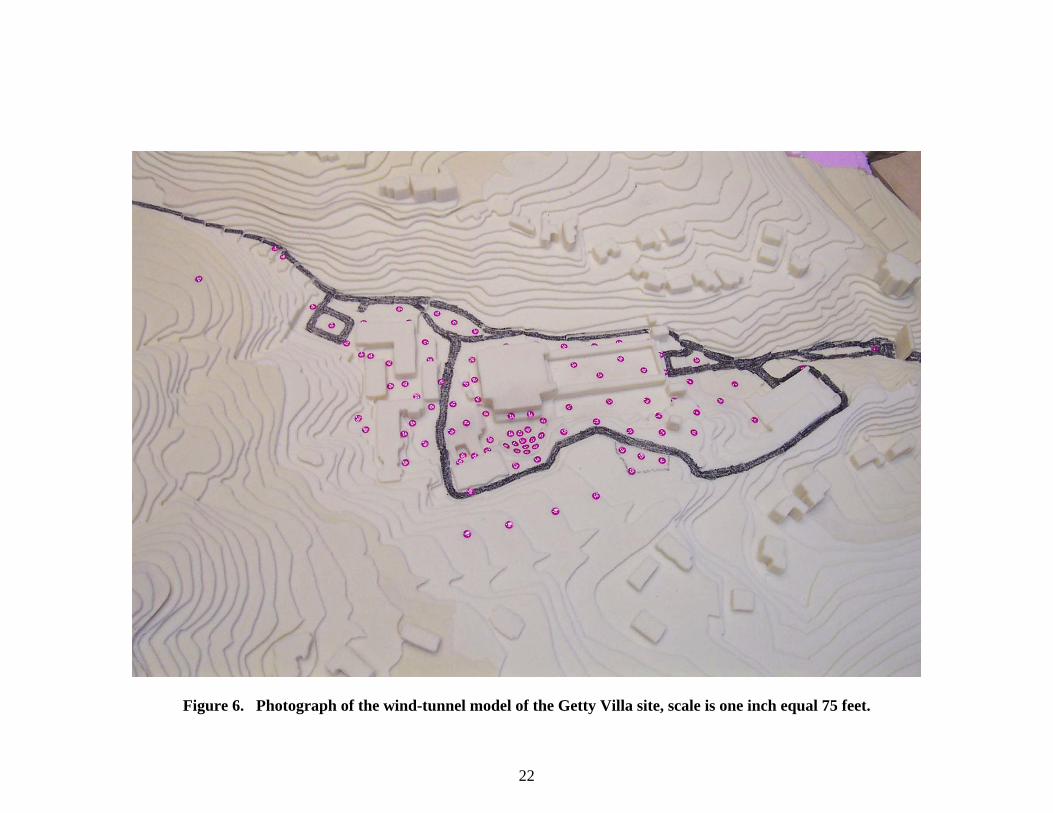
Figure 6. Photograph of the wind-tunnel model of the Getty Villa site, scale is one inch equal 75 feet.
23
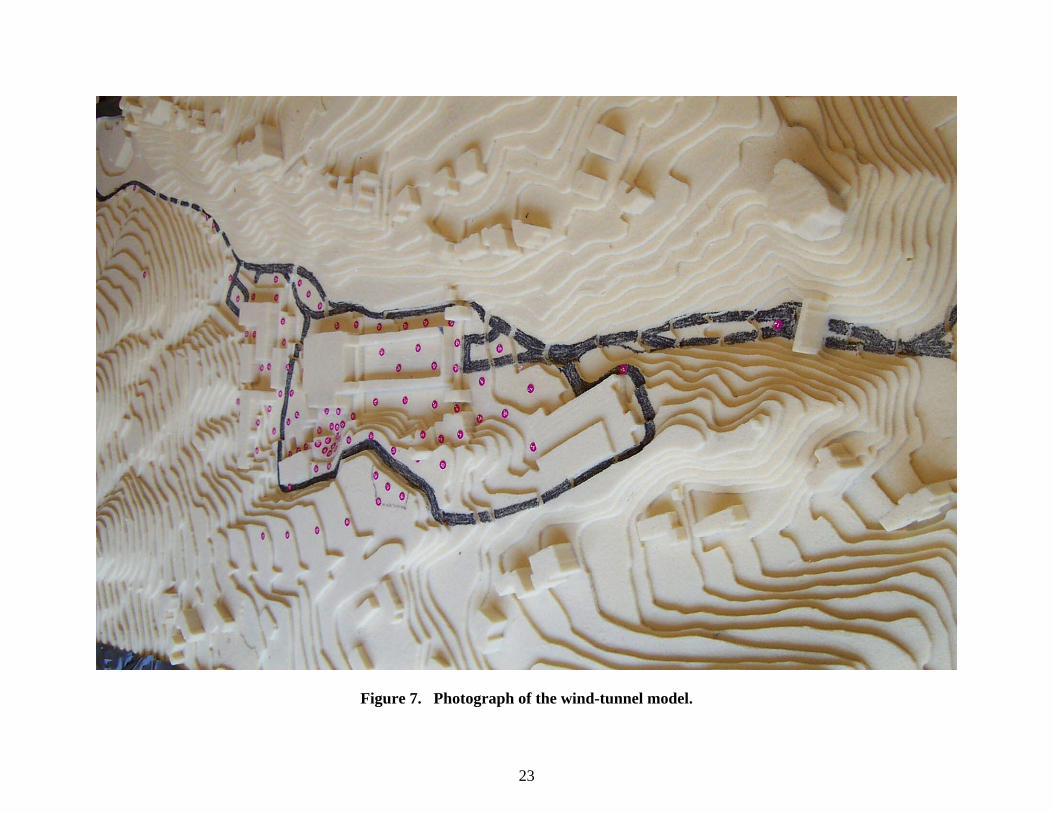
Figure 7. Photograph of the wind-tunnel model.

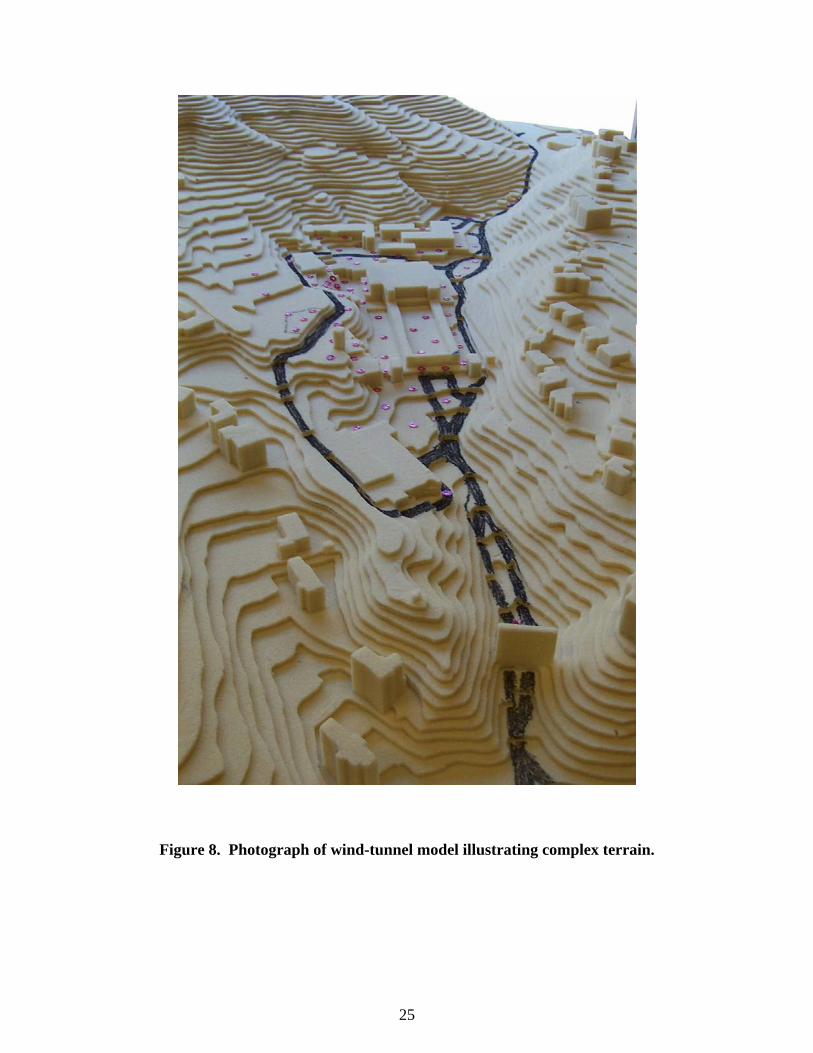
25
Figure 8. Photograph of wind-tunnel model illustrating complex terrain.
26
APPENDIX A:
WIND TUNNEL REDUCED DATA SETS
27
Wind-tunnel data to be added here.
28
APPENDIX B: THE ATMOSPHERIC BOUNDARY LAYER WIND
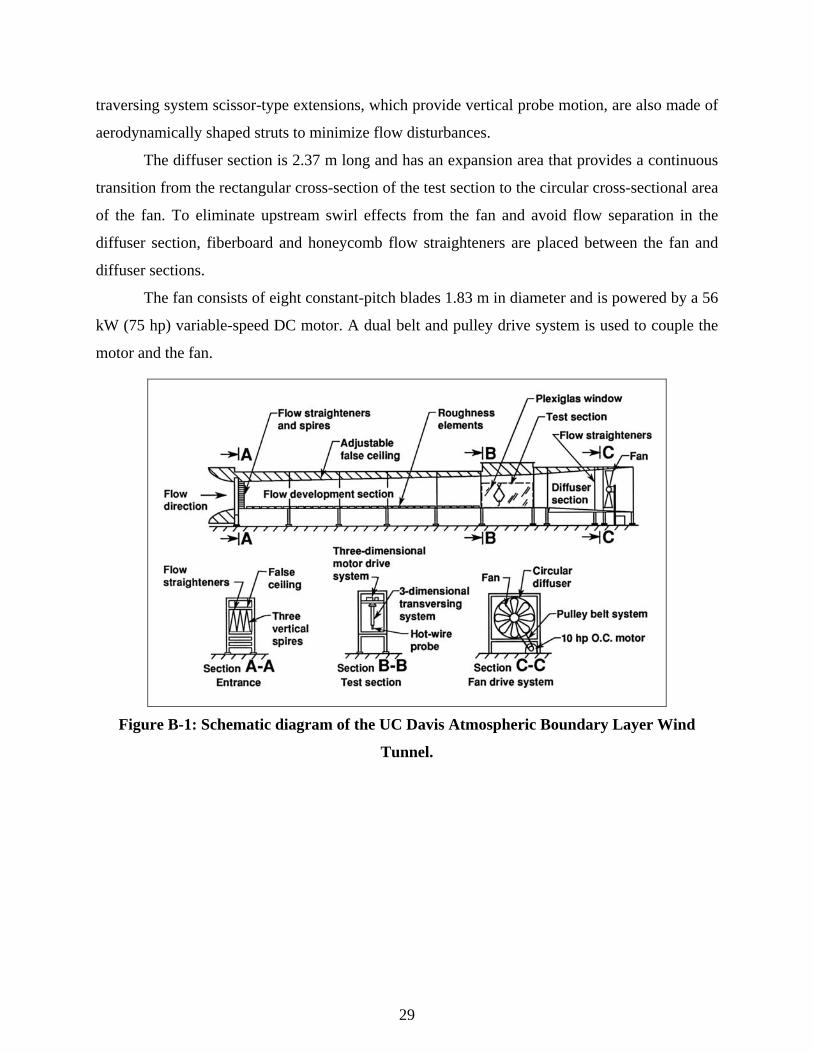
In the present investigation, the Atmospheric Boundary Layer Wind Tunnel (ABLWT)
located at University of California, Davis was used (Figure B-1). Built in 1979 the wind tunnel
was originally designed to simulate turbulent boundary layers comparable to wind flow near the
surface of the earth. In order to achieve this effect, the tunnel requires a long flow-development
section such that a mature boundary-layer flow is produced at the test section. The wind tunnel is
an open-return type with an overall length of 21.3 m and is composed of five sections: the
entrance, the flow-development section, the test section, the diffuser section, and the fan and
motor.
The entrance section is elliptical in shape with a smooth contraction area that minimizes
the free-stream turbulence of the incoming flow. Following the contraction area is a
commercially available air filter that reduces large-scale pressure fluctuations of the flow and
filters larger-size particles out of the incoming flow. Behind the filter, a honeycomb flow
straightener is used to reduce large-scale turbulence.
The flow development section is 12.2 m long with an adjustable ceiling for longitudinal
pressure-gradient control. For the present study, the ceiling was diverged ceiling so that a zero-
pressure-gradient condition is formed in the stream wise direction. At the leading edge of the
section immediately following the honeycomb flow straightener, four triangularly shaped spires
are stationed on the wind-tunnel floor to provide favorable turbulent characteristics in the
boundary-layer flow. Roughness elements are then placed all over the floor of this section to
artificially thicken the boundary layer. For a free-stream wind speed of 4.0 m/s, the wind-tunnel
boundary layer grows to a height of one meter at the test section. With a thick boundary layer,
larger models could be tested and thus measurements could be made at higher resolution.
Dimensions of the test section are 2.44 m in stream wise length, 1.66 m high, and 1.18 m
wide. Similar to the flow-development section, the test section ceiling can also be adjusted to
obtain the desired stream wise pressure gradient. Experiments can be observed from both sides
of the test section through framed Plexiglas windows. One of the windows is also a sliding door
that allows access into the test section. When closed twelve clamps distributed over the top and
lower edges are used to seal the door. Inside the test section, a three-dimensional probe-
positioning system is installed at the ceiling to provide fast and accurate sensor placement. The
29
traversing system scissor-type extensions, which provide vertical probe motion, are also made of
aerodynamically shaped struts to minimize flow disturbances.
The diffuser section is 2.37 m long and has an expansion area that provides a continuous
transition from the rectangular cross-section of the test section to the circular cross-sectional area
of the fan. To eliminate upstream swirl effects from the fan and avoid flow separation in the
diffuser section, fiberboard and honeycomb flow straighteners are placed between the fan and
diffuser sections.
The fan consists of eight constant-pitch blades 1.83 m in diameter and is powered by a 56
kW (75 hp) variable-speed DC motor. A dual belt and pulley drive system is used to couple the
motor and the fan.
Figure B-1: Schematic diagram of the UC Davis Atmospheric Boundary Layer Wind
Tunnel.
30
APPENDIX C:
WIND-TUNNEL ATMOSPHERIC FLOW SIMILARITY PARAMETERS
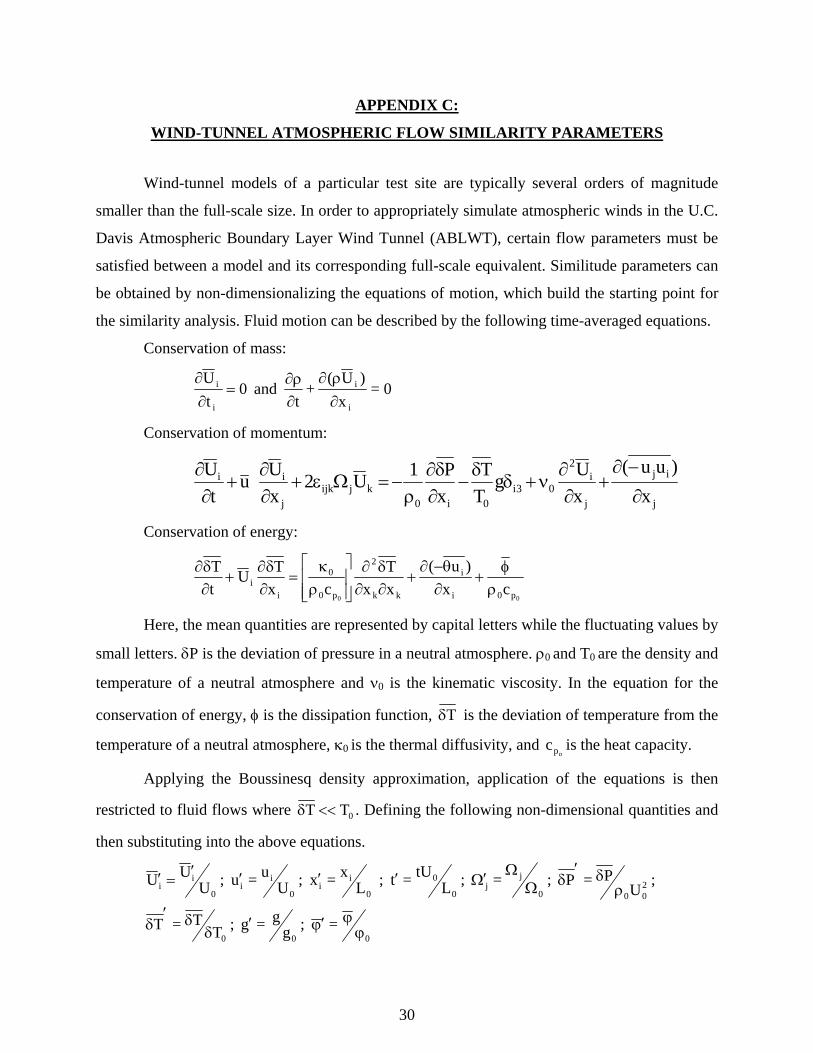
Wind-tunnel models of a particular test site are typically several orders of magnitude
smaller than the full-scale size. In order to appropriately simulate atmospheric winds in the U.C.
Davis Atmospheric Boundary Layer Wind Tunnel (ABLWT), certain flow parameters must be
satisfied between a model and its corresponding full-scale equivalent. Similitude parameters can
be obtained by non-dimensionalizing the equations of motion, which build the starting point for
the similarity analysis. Fluid motion can be described by the following time-averaged equations.
Conservation of mass:
0=x
)U(+
t and 0
tU
i
i
i
i
∂ρ∂
∂∂ρ
=∂∂
Conservation of momentum:
j
ij
j
i2
03i0i0
kjijkj
ii
x)uu(
xUg
TT
xP1U2
xUu
tU
∂
−∂+
∂∂
ν+δδ
−∂δ∂
ρ−=Ωε+
∂∂
+∂∂
Conservation of energy:
00 p0i
i
kk
2
p0
0
ii cx
)u(xxT
cxTU
tT
ρφ
+∂θ−∂
+∂∂δ∂
⎥⎥⎦
⎤
⎢⎢⎣
⎡
ρκ
=∂δ∂
+∂δ∂
Here, the mean quantities are represented by capital letters while the fluctuating values by
small letters. δP is the deviation of pressure in a neutral atmosphere. ρ0 and T0 are the density and
temperature of a neutral atmosphere and ν0 is the kinematic viscosity. In the equation for the
conservation of energy, φ is the dissipation function, Tδ is the deviation of temperature from the
temperature of a neutral atmosphere, κ0 is the thermal diffusivity, and opc is the heat capacity.
Applying the Boussinesq density approximation, application of the equations is then
restricted to fluid flows where 0TT <<δ . Defining the following non-dimensional quantities and
then substituting into the above equations.
= ; gg=g ; T
T=T
; UP=P ; = ; L
tU=t ; Lx=x ; U
u=u ; UUU
000
2000
jj
0
0
0
ii
0
ii
0
ii
ϕϕϕ′′δ
δ′δ
ρδ′
δΩΩ
Ω′′′′′=′
31
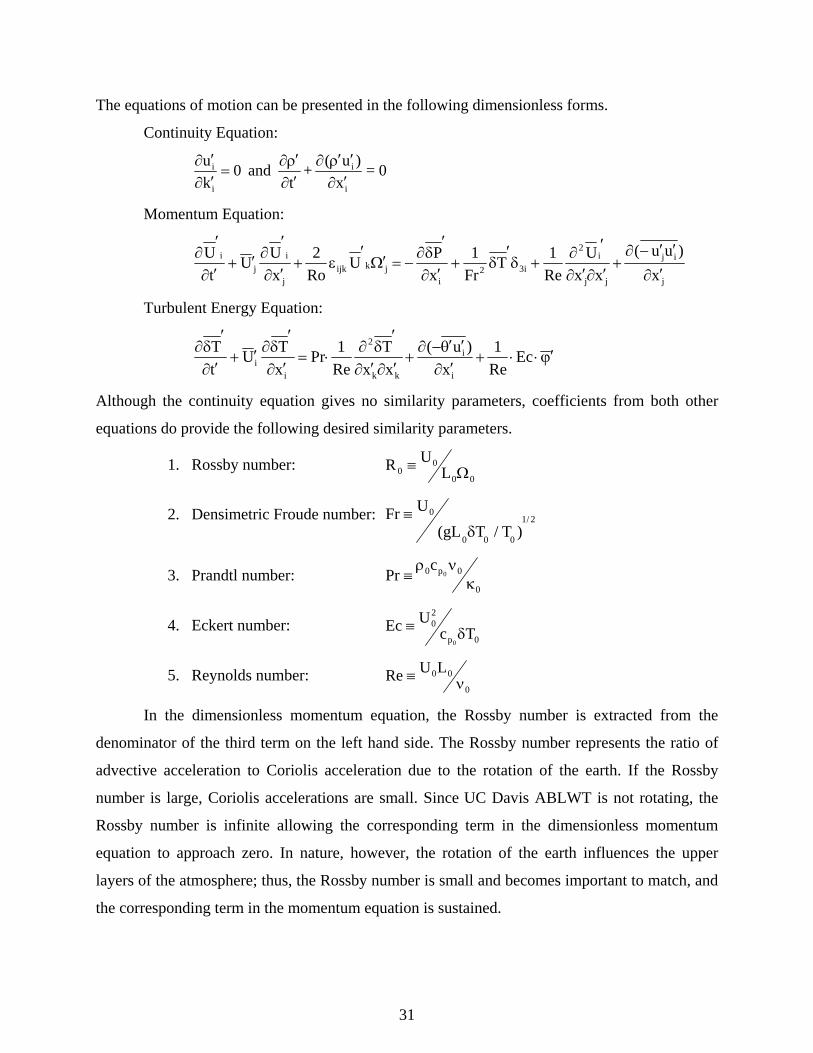
The equations of motion can be presented in the following dimensionless forms.
Continuity Equation:
0=x
)u(+t
and 0ku
i
i
i
i
′∂′ρ′∂
′∂ρ′∂
=′∂′∂
Momentum Equation:
j
ij
jj
i2
i32i
jkijkj
ij
i
x)uu(
xxU
Re1T
Fr1
xPU
Ro2
xUU
tU
′∂
′′−∂+
′∂′∂
′∂+δ
′δ+
′∂
′δ∂
−=Ω′′
ε+′∂
′∂′+
′∂
′∂
Turbulent Energy Equation:
ϕ′⋅⋅+′∂′θ′−∂
+′∂′∂
′δ∂
⋅=′∂
′δ∂′+
′∂
′δ∂ Ec
Re1
x)u(
xxT
Re1Pr
xTU
tT
i
i
kk
2
ii
Although the continuity equation gives no similarity parameters, coefficients from both other
equations do provide the following desired similarity parameters.
1. Rossby number: 00
00 L
UR Ω≡
2. Densimetric Froude number: )T/TgL(
UFr000
2/10
δ≡
3. Prandtl number: 0
0p0 0cPr κ
νρ≡
4. Eckert number: 0p
20
TcUEc
0δ≡
5. Reynolds number: 0
00LURe ν≡
In the dimensionless momentum equation, the Rossby number is extracted from the
denominator of the third term on the left hand side. The Rossby number represents the ratio of
advective acceleration to Coriolis acceleration due to the rotation of the earth. If the Rossby
number is large, Coriolis accelerations are small. Since UC Davis ABLWT is not rotating, the
Rossby number is infinite allowing the corresponding term in the dimensionless momentum
equation to approach zero. In nature, however, the rotation of the earth influences the upper
layers of the atmosphere; thus, the Rossby number is small and becomes important to match, and
the corresponding term in the momentum equation is sustained.
32
Most modelers have assumed the Rossby number to be large, thus, neglecting the
respective term in the equations of motion and ignoring the Rossby number as a criterion for
modeling. Snyder (1981) showed that the characteristic length scale, L0, must be smaller than 5
km in order to simulate diffusion under neutral or stable conditions in relatively flat terrain.
Other researchers discovered similar findings. Since UC Davis ABLWT produces a boundary
layer with a height of about one meter, the surface layer vertically extends 10 to 15 cm above the
ground. In this region the velocity spectrum would be accurately modeled. The Rossby number
can then be ignored in this region. Since testing is limited to the lower 10% to 15% of the
boundary layer, the length in longitudinal direction, which can be modeled, has to be no more
than a few kilometers.
Derived from the denominator of the second term on the right hand side of the
dimensionless momentum equation, the square of the Froude number represents the ratio of
inertial forces to buoyancy forces. High values of the Froude number infer that the inertial forces
are dominant. For values equal or less than unity, thermal effects become important. Since the
conditions inside the UC Davis ABLWT are inherently isothermal, the wind tunnel generates a
neutrally stable boundary layer; hence, the Froude number is infinitely large allowing the
respective term in the momentum equation to approach zero.
The third parameter is the Prandtl number, which is automatically matched between the
wind-tunnel flow and full-scale winds if the same fluid is been used. The Eckert number criterion
is important only in compressible flow, which is not of interest for a low-speed wind tunnel.
Reynolds number represents the ratio of inertial to viscous forces. The reduced scale of a
wind tunnel model results in a Reynolds number several orders of magnitude smaller than in full
scale. Thus, viscous forces are more dominant in the model than in nature. No atmospheric flow
could be modeled, if strict adherence to the Reynolds number criterion was required. However,
several arguments have been made to justify the use of a smaller Reynolds number in a model.
These arguments include laminar flow analogy, Reynolds number independence, and dissipation
scaling. With the absence of thermal and Coriolis effects, several test results have shown that the
scaled model flow will be dynamically similar to the full-scale case if a critical Reynolds number
is larger than a minimum independence value. The gross structure of turbulence is similar over a
wide range of Reynolds numbers. Nearly all modelers use this approach today.
33
APPENDIX D:
WIND-TUNNEL ATMOSPHERIC BOUNDARY-LAYER SIMILARITY
Wind-tunnel simulation of the atmospheric boundary layer under neutrally stable conditions
must also meet non-dimensional boundary-layer similarity parameters between the scaled-model flow
and its full-scale counterpart. The most important conditions are:
1. The normalized mean velocity, turbulence intensity, and turbulent energy profiles.
2. The roughness Reynolds number, ν= /uzRe *0z .
3. Jensen’s length-scale criterion of z0/H.
4. The ratio of H/δ for H greater than H/δ > 0.2.
In the turbulent core of a neutrally stable atmospheric boundary layer, the relationship between
the local flow velocity, U, versus its corresponding height, z, may be represented by the following
velocity-profile equation. α
∞
⎟⎠⎞
⎜⎝⎛δ
=z
UU
Here, U∞ is the mean velocity of the inviscid flow above the boundary layer, δ is the height of the
boundary layer, and α is the power-law exponent, which represents the upwind surface conditions.
Wind-tunnel flow can be shaped such that the exponent α will closely match its corresponding full-
scale value, which can be determined from field measurements of the local winds. The required power-
law exponent, α, can then be obtained by choosing the appropriate type and distribution of roughness
elements over the wind tunnel flow-development section.
Full-scale wind data suggest that the atmospheric wind profile at the site of the Lawrence
Berkeley National Laboratory yields a nominal value of α = 0.3. This condition was closely matched
in the UC Davis Atmospheric Boundary Layer Wind Tunnel by systematically arranging an pattern of
2” x 4” wooden blocks of 12” in length along the entire surface of the flow-development section. The
pattern generally consisted of alternating sets of four and five blocks in one row. A typical velocity
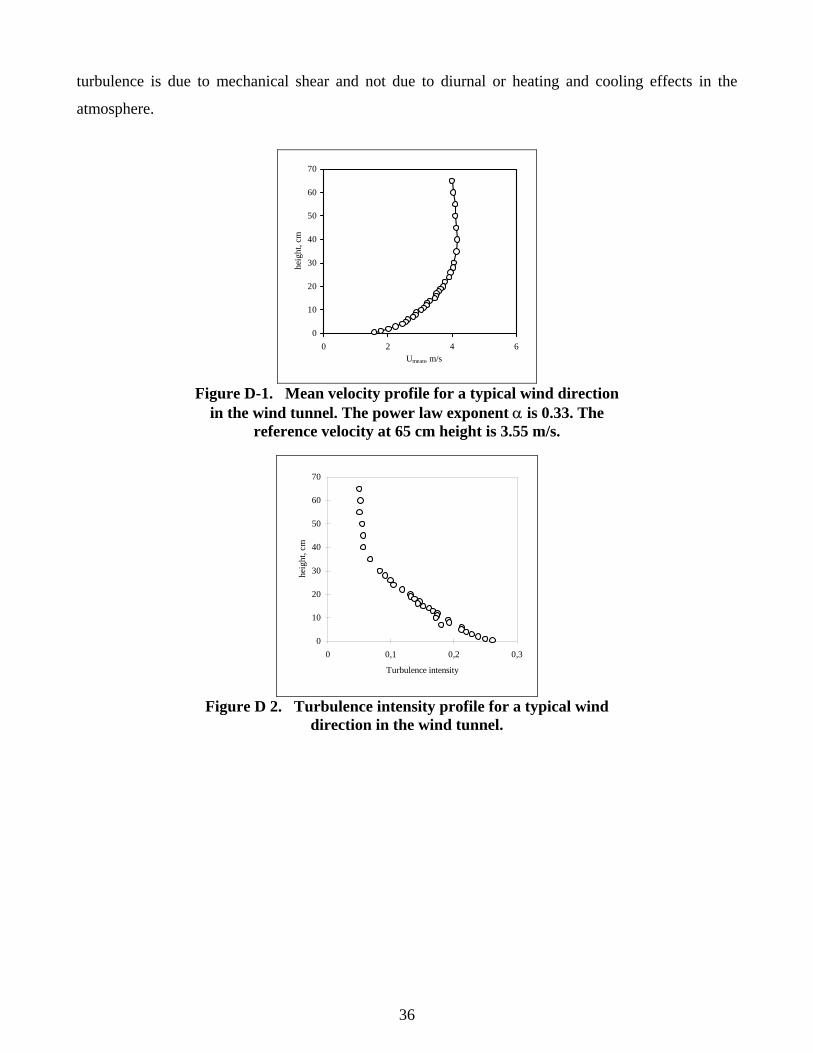
profile is presented in Figure 23, where the simulated power-law exponent is α = 0.33.
In the lower 20% of the boundary layer height, the flow is then governed by a rough-wall or
“law-of-the-wall” logarithmic velocity profile.
34
⎟⎟⎠
⎞⎜⎜⎝
⎛κ
=o* z
zln1uU
Here, *u is the surface friction velocity, κ is von Karman’s constant, and zo is the roughness height.
This region of the atmospheric boundary layer is relatively unaffected by the Coriolis force, the only
region that can be modeled accurately by the wind tunnel (i.e., the lowest 100 m of the atmospheric
boundary layer under neutral stability conditions). Thus, it is desirable to have the scaled-model
buildings and its surroundings contained within this layer.
The geometric scale of the model should be determined by the size of the wind tunnel, the
roughness height, zo, and the power-law index, α. With a boundary-layer height of 1 m in the test
section, the surface layer would be 0.2 m deep for the U.C. Davis ABLWT. For the current study, this
boundary layer corresponds to a full-scale height of the order of 800 m. Since the highest elevation of
the modeled site investigated in this study is about 160 m full-scale, a majority of the model is
contained in this region of full-scale similarity.
Due to scaling effects, full-scale agreement of simulated boundary-layer profiles can only be
attained in wind tunnels with long flow-development sections. For full-scale matching of the
normalized mean velocity profile, an upwind fetch of approximately 10 to 25 boundary-layer heights
can be easily constructed. To fully simulate the normalized turbulence intensity and energy spectra
profiles, the flow-development section needs to be extended to about 50 and 100 to 500 times the
boundary-layer height, respectively. These profiles must at least meet full-scale similarities in the
surface layer region. However, with the addition of spires and other flow tripping devices, the flow
development length can be reduced to less than 20 boundary layer heights for most engineering
applications.
In the U.C. Davis Atmospheric Boundary Layer Wind Tunnel, the maximum values of
turbulence intensity near the surface range from 35% to 40%, similar to that in full scale. Thus, the
turbulent intensity profile, z versusu/u′ , should agree reasonably with the full-scale, particularly in
the region where testing is performed. Figure 24 displays a typical turbulence intensity profile of the
boundary layer in the ABLWT test section.
The second boundary-layer condition involves the roughness Reynolds number, Rez. According
to the criterion given by Sutton (1949), Reynolds number independence is attained when the roughness
Reynolds number is defined as follows.
5.2zuRe 0*z ≥
ν=
35
Here, u* is the friction speed, z0 is the surface roughness length and ν is the kinematic viscosity. Rez
larger than 2.5 ensures that the flow is aerodynamically rough. Therefore, wind tunnels with a high
enough roughness Reynolds numbers simulate full-scale aerodynamically rough flows exactly. To
generate a rough surface in the wind tunnel, roughness elements are placed on the wind tunnel floor.
The height of the elements must be larger than the height of the viscous sub-layer in order to trip the
flow. The UC Davis ABLWT satisfies this condition, since the roughness Reynolds number is about
40, when the wind tunnel free stream velocity, U∞, is equal 3.8 m/s, the friction speed, u* , is 0.24 m/s,
and the roughness height, zo, is 0.0025 m. Thus, the flow setting satisfies the Re number independence
criterion and dynamically simulates the flow.
To simulate the pressure distribution on objects in the atmospheric wind, Jensen (1958) found
that the surface roughness to object-height ratio in the wind tunnel must be equal to that of the
atmospheric boundary layer, i.e., zo/H in the wind tunnel must match the full-scale value. Thus, the
geometric scaling should be accurately modeled.
The last condition for the boundary layer is the characteristic scale height to boundary layer
ratio, H/δ. There are two possibilities for the value of the ratio. If H/δ ≥ 0.2, then the ratios must be
matched. If (H/δ)F.S.< 0.2, then only the general inequality of (H/δ)W.T.< 0.2 must be met (F.S. stands
for full-scale and W.T. stands for wind tunnel). Using the law-of-the-wall logarithmic profile equation,
instead of the power-law velocity profile, this principle would constrain the physical model to the 10%
to 15% of the wind tunnel boundary layer height.
Along with these conditions, two other constraints have to be met. First, the mean stream wise
pressure gradient in the wind tunnel must be zero. Even if high- and low-pressure systems drive
atmospheric boundary layer flows, the magnitude of the pressure gradient in the flow direction is
negligible compared to the dynamic pressure variation caused by the boundary layer. The other
constraint is that the model should not take up more than 5% to 15% of the cross-sectional area at any
down wind location. This assures that local flow acceleration affecting the stream wise pressure
gradient will not distort the simulation flow.
Simulations in the U.C. Davis ABLWT were not capable of producing stable or unstable
boundary layer flows. In fact, proper simulation of unstable boundary layer flows could be a
disadvantage in any wind tunnel due to the artificial secondary flows generated by the heating that
dominate and distort the longitudinal mean-flow properties, thus, invalidating the similitude criteria.
However, this is not considered as a major constraint, since the winds that produce annual an average
dispersion are sufficiently strong, such that for flow over a complex terrain, the primary source of
36
turbulence is due to mechanical shear and not due to diurnal or heating and cooling effects in the
atmosphere.
0
10
20
30
40
50
60
70
0 2 4 6 Umean, m/s
heig
ht, c
m
Figure D-1. Mean velocity profile for a typical wind direction
in the wind tunnel. The power law exponent α is 0.33. The reference velocity at 65 cm height is 3.55 m/s.
0
10
20
30
40
50
60
70
0 0,1 0,2 0,3
Turbulence intensity
heig
ht, c
m
Figure D 2. Turbulence intensity profile for a typical wind
direction in the wind tunnel.

37
APPENDIX E:
OUTPUT FROM THE COMPUTER CODE ANALYSIS
38
WIND-TUNNEL TEST RESULTS 08/30/01 Page The Getty Villa Malibu, California Project Full Year - 12-3 pm Wind Test Date: Aug-01 _______________________________________________________________________________________________________ The ratios of pedestrian-level wind speeds to the tower reference wind speeds at the SCAQMD meteorological station are shown in the first line of output for each location. The second line of the output shows the pedestrian level wind speeds, in mph, which would be exceeded 10% of the time for each measurement location. A comfort criterion of 11 mph is used for areas of substantial public pedestrian use AND 7 mph for public seating areas. These criteria are not to be exceeded more than 10% of the time. The third line of output for each location shows the criterion speed and the percentage of the time the criterion would be exceeded. The rows labeled CONTRIB tabulate the percentage contribution to the total or the exceedance from each wind direction. The SUMs are the equivalent number of events. _______________________________________________________________________________________________________ 10.0% Exc. ---Criterion--- Loca- Ground Speed % Time ENE S SW OTHER SUM tion Speed Exc. Exc. _______________________________________________________________________________________________________ Profile Ratios: 2.0000 2.0000 2.0000 2.0000 1,095 Obs 1 RATIOS 0.3918 0.4354 0.6534 0.4935 4.6 CONTRIB 77.75% 8.31% 5.68% 8.26% 110 11.0 0.03 CONTRIB 41.78% 12.41% 3.76% 42.06% 0 2 RATIOS 0.8888 0.6886 0.7662 0.7812 10.1 CONTRIB 90.64% 7.30% 0.04% 2.01% 110 11.0 7.48 CONTRIB 88.08% 9.77% 0.03% 2.12% 82 3 RATIOS 0.4752 0.2434 0.4550 0.3912 5.3 CONTRIB 97.95% 0.21% 0.08% 1.75% 109 11.0 0.09 CONTRIB 99.94% 0.00% 0.06% 0.00% 1 4 RATIOS 0.8570 0.7516 1.2612 0.9566 9.9 CONTRIB 82.42% 7.30% 5.51% 4.77% 110 11.0 7.06 CONTRIB 82.68% 10.35% 3.09% 3.88% 77 5 RATIOS 0.7194 0.3670 0.7360 0.6075 8.0 CONTRIB 97.76% 0.19% 0.17% 1.88% 110 11.0 3.33 CONTRIB 98.06% 0.02% 0.06% 1.86% 36 6 RATIOS 0.9360 0.4556 1.2234 0.8717 10.5 CONTRIB 94.91% 0.09% 2.59% 2.41% 110 11.0 8.19 CONTRIB 95.45% 0.07% 1.88% 2.60% 90 7 RATIOS 0.5474 0.4864 0.7060 0.5799 6.3 CONTRIB 87.00% 7.30% 1.83% 3.86% 110 11.0 0.46 CONTRIB 87.85% 2.56% 0.35% 9.25% 5 8 RATIOS 0.4700 0.6178 0.7528 0.6135 5.6 CONTRIB 74.49% 10.60% 5.60% 9.32% 110 11.0 0.60 CONTRIB 12.79% 75.58% 0.39% 11.24% 7 9 RATIOS 0.7956 0.4866 1.1024 0.7949 9.0 CONTRIB 90.13% 2.42% 4.52% 2.93% 110 11.0 4.79 CONTRIB 95.31% 0.25% 0.97% 3.47% 52 10 RATIOS 0.6762 0.4254 0.7058 0.6025 7.6 CONTRIB 93.54% 4.15% 0.19% 2.12% 110 11.0 2.72 CONTRIB 97.71% 0.10% 0.06% 2.13% 30 11 RATIOS 0.6646 0.4158 0.5608 0.5471 7.5 CONTRIB 94.33% 3.91% 0.04% 1.72% 110 11.0 2.54 CONTRIB 98.85% 0.08% 0.01% 1.05% 28
39
_______________________________________________________________________________________________________ _______________________________________________________________________________________________________ 10.0% Exc. ---Criterion--- Loca- Ground Speed % Time ENE S SW OTHER SUM tion Speed Exc. Exc. _______________________________________________________________________________________________________ 12 RATIOS 0.4414 0.4272 0.5870 0.4852 5.1 CONTRIB 85.57% 7.31% 2.51% 4.62% 109 11.0 0.05 CONTRIB 74.63% 5.33% 0.88% 19.16% 1 13 RATIOS 0.8810 0.4562 0.5740 0.6371 9.8 CONTRIB 98.50% 0.25% 0.01% 1.24% 110 11.0 6.49 CONTRIB 98.51% 0.09% 0.01% 1.40% 71 14 RATIOS 0.6794 0.5292 0.5226 0.5771 7.7 CONTRIB 90.84% 7.30% 0.02% 1.83% 110 11.0 2.79 CONTRIB 96.99% 1.53% 0.01% 1.47% 31 15 RATIOS 0.5298 0.3756 0.5832 0.4962 6.0 CONTRIB 90.00% 7.30% 0.32% 2.38% 110 11.0 0.30 CONTRIB 95.47% 0.24% 0.15% 4.14% 3 16 RATIOS 0.3460 0.4450 0.6174 0.4695 4.1 CONTRIB 73.01% 10.14% 5.76% 11.09% 110 11.0 0.01 CONTRIB 33.70% 57.04% 9.27% 0.00% 0 17 RATIOS 0.4484 0.3580 0.2930 0.3665 5.1 CONTRIB 91.03% 7.30% 0.01% 1.65% 110 11.0 0.05 CONTRIB 98.07% 0.82% 0.00% 1.11% 1 18 RATIOS 0.3618 0.3344 0.3776 0.3579 4.1 CONTRIB 89.75% 7.30% 0.17% 2.77% 110 11.0 0.00 CONTRIB 88.81% 3.28% 0.15% 7.75% 0 19 RATIOS 0.3558 0.3682 0.4416 0.3885 4.1 CONTRIB 86.56% 7.76% 1.17% 4.51% 110 11.0 0.00 CONTRIB 85.83% 13.23% 0.94% 0.00% 0 20 RATIOS 0.5698 0.3592 0.4504 0.4598 6.4 CONTRIB 94.00% 4.34% 0.03% 1.63% 109 11.0 0.63 CONTRIB 99.93% 0.06% 0.01% 0.00% 7 21 RATIOS 0.4740 0.3808 0.5990 0.4846 5.4 CONTRIB 87.98% 7.31% 1.49% 3.23% 109 11.0 0.09 CONTRIB 87.81% 0.91% 0.58% 10.70% 1 22 RATIOS 0.5512 0.3482 0.4442 0.4479 6.2 CONTRIB 93.85% 4.46% 0.03% 1.65% 109 11.0 0.44 CONTRIB 99.93% 0.06% 0.01% 0.00% 5 23 RATIOS 0.4456 0.3512 0.3920 0.3963 5.0 CONTRIB 90.57% 7.31% 0.05% 2.07% 109 11.0 0.04 CONTRIB 99.28% 0.70% 0.03% 0.00% 0 24 RATIOS 0.3796 0.3826 0.3422 0.3681 4.3 CONTRIB 89.79% 7.55% 0.05% 2.61% 110 11.0 0.01 CONTRIB 84.85% 9.37% 0.02% 5.76% 0 25 RATIOS 0.1940 0.3066 0.3338 0.2781 0.5 CONTRIB 76.89% 1.46% 0.65% 20.99% 1,072 11.0 0.00 CONTRIB 0.00% 0.00% 100.00% 0.00% 0 26 RATIOS 0.8358 0.4236 0.9914 0.7503 9.4 CONTRIB 96.74% 0.17% 0.89% 2.20% 110 11.0 5.53 CONTRIB 97.14% 0.05% 0.25% 2.57% 61 27 RATIOS 0.7400 0.6280 0.8020 0.7233 8.4 CONTRIB 89.76% 7.30% 0.27% 2.67% 110 11.0 4.30 CONTRIB 83.47% 13.46% 0.08% 2.99% 47 28 RATIOS 0.1384 0.1504 0.1352 0.1413 2.5 CONTRIB 60.39% 36.09% 0.02% 3.50% 22

40
11.0 0.00 CONTRIB 0.00% 0.00% 0.00% 0.00% 0 _______________________________________________________________________________________________________ _______________________________________________________________________________________________________ 10.0% Exc. ---Criterion--- Loca- Ground Speed % Time ENE S SW OTHER SUM tion Speed Exc. Exc. _______________________________________________________________________________________________________ 29 RATIOS 0.6410 0.5794 0.6550 0.6251 7.3 CONTRIB 89.91% 7.30% 0.14% 2.65% 110 11.0 2.48 CONTRIB 89.97% 6.85% 0.04% 3.14% 27 30 RATIOS 0.3770 0.4676 0.4814 0.4420 4.4 CONTRIB 82.28% 10.14% 1.41% 6.17% 109 11.0 0.01 CONTRIB 50.82% 48.53% 0.65% 0.00% 0 31 RATIOS 0.7190 0.3632 0.6184 0.5669 8.0 CONTRIB 98.22% 0.17% 0.05% 1.56% 110 11.0 3.30 CONTRIB 98.88% 0.01% 0.02% 1.08% 36 32 RATIOS 0.6094 0.3244 0.4406 0.4581 6.8 CONTRIB 98.23% 0.38% 0.02% 1.37% 110 11.0 1.33 CONTRIB 99.99% 0.01% 0.00% 0.00% 15 33 RATIOS 0.4940 0.2270 0.4258 0.3823 5.5 CONTRIB 98.41% 0.05% 0.05% 1.49% 109 11.0 0.13 CONTRIB 99.29% 0.00% 0.02% 0.69% 1 34 RATIOS 0.5710 0.7490 0.4556 0.5919 6.5 CONTRIB 85.37% 11.24% 0.03% 3.37% 110 11.0 1.43 CONTRIB 45.31% 51.16% 0.00% 3.52% 16 35 RATIOS 0.5670 0.5240 0.2746 0.4552 6.4 CONTRIB 91.12% 7.30% 0.00% 1.58% 110 11.0 0.64 CONTRIB 94.22% 5.78% 0.00% 0.00% 7 36 RATIOS 0.3736 0.6602 0.1966 0.4101 4.3 CONTRIB 82.51% 13.12% 0.00% 4.37% 109 11.0 0.74 CONTRIB 0.92% 99.08% 0.00% 0.00% 8 37 RATIOS 0.4336 0.4142 0.3378 0.3952 4.9 CONTRIB 90.46% 7.30% 0.02% 2.22% 110 11.0 0.04 CONTRIB 94.13% 5.87% 0.01% 0.00% 0 38 RATIOS 0.3650 0.5010 0.1744 0.3468 4.2 CONTRIB 85.51% 12.08% 0.00% 2.41% 109 11.0 0.02 CONTRIB 21.13% 77.76% 0.00% 1.11% 0 39 RATIOS 0.4482 0.3882 0.2750 0.3705 5.1 CONTRIB 90.98% 7.30% 0.01% 1.70% 110 11.0 0.05 CONTRIB 96.55% 2.19% 0.00% 1.26% 1 40 RATIOS 0.3056 0.3962 0.4652 0.3890 3.6 CONTRIB 75.67% 10.45% 5.53% 8.36% 109 11.0 0.00 CONTRIB 0.00% 95.02% 4.98% 0.00% 0 41 RATIOS 0.2344 0.7980 0.4222 0.4849 3.3 CONTRIB 43.71% 13.77% 5.53% 36.99% 109 11.0 0.74 CONTRIB 0.00% 98.62% 0.00% 1.38% 8 42 RATIOS 0.2834 0.5756 0.4350 0.4313 3.5 CONTRIB 64.82% 13.23% 5.08% 16.87% 109 11.0 0.15 CONTRIB 0.00% 99.98% 0.02% 0.00% 2 43 RATIOS 0.2774 0.4582 0.4332 0.3896 3.4 CONTRIB 69.30% 12.92% 5.53% 12.25% 109 11.0 0.01 CONTRIB 0.00% 99.44% 0.56% 0.00% 0 44 RATIOS 0.3088 0.5332 0.3682 0.4034 3.6 CONTRIB 76.66% 13.04% 0.50% 9.80% 109 11.0 0.05 CONTRIB 0.00% 99.99% 0.01% 0.00% 1 45 RATIOS 0.2534 0.3590 0.2644 0.2923 2.9 CONTRIB 81.80% 12.46% 0.14% 5.61% 110

41
11.0 0.00 CONTRIB 0.00% 100.00% 0.00% 0.00% 0 _______________________________________________________________________________________________________ _______________________________________________________________________________________________________ 10.0% Exc. ---Criterion--- Loca- Ground Speed % Time ENE S SW OTHER SUM tion Speed Exc. Exc. _______________________________________________________________________________________________________ 46 RATIOS 0.3668 0.5084 0.4976 0.4576 4.3 CONTRIB 78.00% 11.77% 2.34% 7.89% 110 11.0 0.03 CONTRIB 18.70% 80.86% 0.44% 0.00% 0 47 RATIOS 0.3160 0.4472 0.3364 0.3665 3.7 CONTRIB 81.64% 12.43% 0.17% 5.76% 109 11.0 0.00 CONTRIB 0.00% 89.55% 0.04% 10.41% 0 48 RATIOS 0.3518 0.4832 0.4268 0.4206 4.1 CONTRIB 80.81% 11.80% 0.73% 6.65% 109 11.0 0.01 CONTRIB 22.80% 76.99% 0.20% 0.00% 0 49 RATIOS 0.2944 0.5572 0.4922 0.4479 3.7 CONTRIB 64.56% 13.11% 5.60% 16.73% 109 11.0 0.09 CONTRIB 0.00% 99.88% 0.12% 0.00% 1 50 RATIOS 0.5420 0.4014 0.6856 0.5430 6.2 CONTRIB 88.27% 7.30% 1.51% 2.91% 110 11.0 0.39 CONTRIB 92.83% 0.38% 0.35% 6.44% 4 51 RATIOS 0.6462 0.6436 1.1044 0.7981 7.6 CONTRIB 79.30% 7.30% 5.73% 7.67% 110 11.0 3.24 CONTRIB 70.77% 22.58% 1.47% 5.18% 35 52 RATIOS 0.6440 0.6084 0.8240 0.6921 7.4 CONTRIB 86.87% 7.30% 1.67% 4.16% 110 11.0 2.74 CONTRIB 82.66% 13.03% 0.14% 4.16% 30 53 RATIOS 0.4660 0.5564 0.6912 0.5712 5.5 CONTRIB 78.00% 9.31% 5.50% 7.18% 110 11.0 0.20 CONTRIB 34.81% 45.62% 0.72% 18.85% 2 54 RATIOS 0.5172 0.5404 0.8236 0.6271 6.0 CONTRIB 79.73% 7.63% 5.62% 7.02% 110 11.0 0.36 CONTRIB 60.35% 16.34% 1.09% 22.22% 4 55 RATIOS 0.5770 0.5006 0.8904 0.6560 6.7 CONTRIB 81.91% 7.30% 5.58% 5.21% 110 11.0 0.85 CONTRIB 85.52% 2.16% 0.72% 11.61% 9 56 RATIOS 0.6532 0.2644 0.9310 0.6162 7.4 CONTRIB 92.03% 0.01% 5.50% 2.45% 110 11.0 2.45 CONTRIB 96.85% 0.00% 0.32% 2.83% 27 57 RATIOS 0.6796 0.5162 0.9034 0.6997 7.8 CONTRIB 86.81% 7.30% 2.58% 3.31% 110 11.0 2.86 CONTRIB 94.64% 1.02% 0.23% 4.11% 31 58 RATIOS 0.5496 0.3330 0.6434 0.5087 6.2 CONTRIB 94.50% 2.41% 0.72% 2.36% 109 11.0 0.44 CONTRIB 96.35% 0.04% 0.22% 3.40% 5 59 RATIOS 0.4072 0.2454 0.4908 0.3811 4.6 CONTRIB 94.34% 2.21% 1.01% 2.43% 110 11.0 0.02 CONTRIB 94.65% 0.00% 0.61% 4.74% 0 60 RATIOS 0.6136 0.2536 0.5634 0.4769 6.8 CONTRIB 98.41% 0.02% 0.07% 1.50% 110 11.0 1.43 CONTRIB 99.98% 0.00% 0.02% 0.00% 16 61 RATIOS 0.6260 0.6758 0.8280 0.7099 7.2 CONTRIB 84.13% 8.24% 2.27% 5.36% 110 11.0 2.64 CONTRIB 67.59% 27.63% 0.15% 4.62% 29 62 RATIOS 0.3706 0.5770 0.7028 0.5501 4.6 CONTRIB 66.13% 12.80% 5.81% 15.26% 110
42
11.0 0.19 CONTRIB 3.13% 81.69% 0.81% 14.36% 2 _______________________________________________________________________________________________________ _______________________________________________________________________________________________________ 10.0% Exc. ---Criterion--- Loca- Ground Speed % Time ENE S SW OTHER SUM tion Speed Exc. Exc. _______________________________________________________________________________________________________ 63 RATIOS 0.2880 0.5780 0.5436 0.4699 3.7 CONTRIB 60.24% 13.16% 5.75% 20.85% 110 11.0 0.16 CONTRIB 0.00% 99.84% 0.16% 0.00% 2 64 RATIOS 0.2608 0.4938 0.5340 0.4295 3.3 CONTRIB 59.65% 13.07% 5.88% 21.40% 109 11.0 0.01 CONTRIB 0.00% 98.54% 1.46% 0.00% 0 65 RATIOS 0.6228 0.5300 0.5084 0.5537 7.1 CONTRIB 90.59% 7.30% 0.03% 2.07% 110 11.0 1.76 CONTRIB 95.84% 2.48% 0.01% 1.67% 19 66 RATIOS 0.6848 0.5946 0.5016 0.5937 7.8 CONTRIB 90.74% 7.30% 0.02% 1.94% 110 11.0 3.08 CONTRIB 90.15% 8.18% 0.00% 1.67% 34 67 RATIOS 0.5920 0.4206 0.5872 0.5333 6.7 CONTRIB 90.45% 7.30% 0.10% 2.15% 110 11.0 0.99 CONTRIB 97.50% 0.25% 0.05% 2.21% 11 68 RATIOS 0.3098 0.5736 0.5778 0.4871 3.9 CONTRIB 62.46% 13.05% 5.75% 18.74% 110 11.0 0.16 CONTRIB 0.00% 92.98% 0.26% 6.75% 2 69 RATIOS 0.7020 0.3560 0.7244 0.5941 7.8 CONTRIB 97.75% 0.18% 0.18% 1.89% 110 11.0 3.07 CONTRIB 98.24% 0.01% 0.06% 1.69% 34 70 RATIOS 0.5376 0.3768 0.6842 0.5329 6.1 CONTRIB 88.32% 7.30% 1.63% 2.75% 110 11.0 0.36 CONTRIB 93.32% 0.21% 0.38% 6.09% 4 71 RATIOS 0.9528 0.6234 0.9692 0.8485 10.8 CONTRIB 90.86% 6.92% 0.13% 2.08% 110 11.0 9.02 CONTRIB 91.95% 5.74% 0.12% 2.19% 99 72 RATIOS 0.9796 0.8108 1.0554 0.9486 11.1 CONTRIB 89.85% 7.30% 0.25% 2.60% 110 11.0 10.53 CONTRIB 90.25% 6.94% 0.27% 2.54% 115 73 RATIOS 0.8260 0.8602 0.8360 0.8407 9.4 CONTRIB 88.78% 7.92% 0.12% 3.19% 110 11.0 6.09 CONTRIB 84.77% 11.99% 0.07% 3.17% 67 74 RATIOS 0.7350 0.9032 0.5856 0.7413 8.4 CONTRIB 86.82% 10.19% 0.03% 2.96% 110 11.0 4.38 CONTRIB 80.16% 16.69% 0.01% 3.14% 48 75 RATIOS 1.1104 0.8996 1.1708 1.0603 12.6 CONTRIB 90.00% 7.30% 0.20% 2.51% 110 11.0 19.42 CONTRIB 93.32% 3.76% 0.48% 2.44% 213 76 RATIOS 1.0266 0.9628 1.2502 1.0799 11.7 CONTRIB 87.97% 7.30% 0.97% 3.76% 110 11.0 13.55 CONTRIB 89.24% 5.45% 1.46% 3.85% 148 77 RATIOS 0.9720 0.9176 1.1374 1.0090 11.1 CONTRIB 88.55% 7.30% 0.62% 3.53% 110 11.0 10.29 CONTRIB 88.71% 7.10% 0.65% 3.54% 113 78 RATIOS 0.9828 0.9340 1.1284 1.0151 11.2 CONTRIB 88.75% 7.30% 0.50% 3.44% 110 11.0 10.83 CONTRIB 89.22% 6.75% 0.56% 3.47% 119 79 RATIOS 0.7114 0.6436 0.6614 0.6721 8.1 CONTRIB 90.19% 7.30% 0.07% 2.44% 110
43
11.0 3.99 CONTRIB 79.00% 18.33% 0.03% 2.64% 44 _______________________________________________________________________________________________________ _______________________________________________________________________________________________________ 10.0% Exc. ---Criterion--- Loca- Ground Speed % Time ENE S SW OTHER SUM tion Speed Exc. Exc. _______________________________________________________________________________________________________ 80 RATIOS 0.1860 0.4698 0.3620 0.3393 2.5 CONTRIB 52.83% 13.48% 5.74% 27.96% 110 11.0 0.01 CONTRIB 0.00% 97.38% 0.06% 2.56% 0 81 RATIOS 0.2136 0.6230 0.3012 0.3793 2.8 CONTRIB 57.32% 13.73% 1.25% 27.69% 109 11.0 0.51 CONTRIB 0.00% 99.84% 0.00% 0.16% 6 82 RATIOS 0.2164 0.3572 0.4692 0.3476 2.7 CONTRIB 61.20% 12.86% 5.99% 19.95% 110 11.0 0.00 CONTRIB 0.00% 52.51% 10.27% 37.22% 0 83 RATIOS 0.3768 0.4958 0.4128 0.4285 4.3 CONTRIB 83.22% 11.19% 0.25% 5.34% 109 11.0 0.02 CONTRIB 32.23% 67.68% 0.09% 0.00% 0 84 RATIOS 0.2784 0.6408 0.4174 0.4455 3.5 CONTRIB 62.81% 13.42% 3.48% 20.29% 109 11.0 0.73 CONTRIB 0.00% 100.00% 0.00% 0.00% 8 85 RATIOS 0.3348 0.3582 0.3986 0.3639 3.8 CONTRIB 86.82% 8.00% 0.76% 4.42% 114 11.0 0.00 CONTRIB 65.40% 15.35% 0.54% 18.71% 0 86 RATIOS 0.2514 0.9056 0.5022 0.5531 3.6 CONTRIB 39.11% 13.78% 5.64% 41.47% 110 11.0 0.76 CONTRIB 0.00% 96.14% 0.02% 3.85% 8 87 RATIOS 0.3380 0.9584 0.6540 0.6501 4.6 CONTRIB 49.02% 13.63% 5.69% 31.66% 110 11.0 0.83 CONTRIB 0.23% 88.08% 0.13% 11.57% 9 88 RATIOS 0.5540 0.6704 0.6112 0.6119 6.4 CONTRIB 85.11% 9.89% 0.29% 4.71% 110 11.0 1.26 CONTRIB 36.77% 57.97% 0.05% 5.21% 14 89 RATIOS 1.0110 1.3364 1.4628 1.2701 12.0 CONTRIB 76.61% 10.83% 4.61% 7.95% 110 11.0 14.21 CONTRIB 78.67% 8.69% 3.93% 8.71% 156 90 RATIOS 0.3408 0.3222 0.2176 0.2935 3.8 CONTRIB 91.03% 7.08% 0.01% 1.88% 113 11.0 0.00 CONTRIB 95.31% 4.69% 0.00% 0.00% 0 91 RATIOS 0.2538 0.2388 0.3950 0.2959 2.9 CONTRIB 81.24% 7.30% 5.59% 5.87% 110 11.0 0.00 CONTRIB 0.00% 0.00% 100.00% 0.00% 0 92 RATIOS 0.4740 0.5466 0.8378 0.6195 5.6 CONTRIB 75.88% 8.70% 5.76% 9.66% 110 11.0 0.23 CONTRIB 36.23% 30.39% 1.87% 31.51% 3 93 RATIOS 0.8976 0.8312 1.0746 0.9345 10.2 CONTRIB 88.32% 7.30% 0.81% 3.57% 110 11.0 7.83 CONTRIB 86.94% 9.33% 0.44% 3.29% 86 94 RATIOS 0.8810 0.9294 1.0830 0.9645 10.1 CONTRIB 86.39% 8.01% 1.04% 4.56% 110 11.0 7.45 CONTRIB 85.84% 9.80% 0.51% 3.84% 82 95 RATIOS 0.8858 1.0164 1.0712 0.9911 10.2 CONTRIB 85.03% 9.10% 0.83% 5.04% 110 11.0 7.68 CONTRIB 84.79% 10.46% 0.44% 4.31% 84 96 RATIOS 0.8012 1.0384 0.9542 0.9313 9.3 CONTRIB 82.55% 10.88% 0.64% 5.93% 110
44
11.0 5.77 CONTRIB 81.01% 14.42% 0.16% 4.42% 63 _______________________________________________________________________________________________________ _______________________________________________________________________________________________________ 10.0% Exc. ---Criterion--- Loca- Ground Speed % Time ENE S SW OTHER SUM tion Speed Exc. Exc. _______________________________________________________________________________________________________ 97 RATIOS 0.7490 1.0354 0.9444 0.9096 8.7 CONTRIB 79.93% 11.86% 1.10% 7.11% 110 11.0 4.81 CONTRIB 77.66% 17.20% 0.18% 4.97% 53 98 RATIOS 0.5496 0.2314 0.4062 0.3957 6.1 CONTRIB 98.73% 0.02% 0.02% 1.22% 110 11.0 0.42 CONTRIB 100.00% 0.00% 0.00% 0.00% 5 99 RATIOS 0.2946 0.6154 0.3010 0.4037 3.5 CONTRIB 74.51% 13.34% 0.08% 12.07% 110 11.0 0.42 CONTRIB 0.00% 100.00% 0.00% 0.00% 5 100 RATIOS 0.3028 0.5184 0.3604 0.3939 3.6 CONTRIB 76.86% 13.03% 0.50% 9.62% 109 11.0 0.03 CONTRIB 0.00% 99.99% 0.01% 0.00% 0 _______________________________________________________________________________________________________
45
WIND-TUNNEL TEST RESULTS 08/30/01 Page The Getty Villa Malibu, California Project Full Year - 3-6 pm Wind Test Date: Aug-01 _______________________________________________________________________________________________________ The ratios of pedestrian-level wind speeds to the tower reference wind speeds at the SCAQMD meteorological station are shown in the first line of output for each location. The second line of the output shows the pedestrian level wind speeds, in mph, which would be exceeded 10% of the time for each measurement location. A comfort criterion of 11 mph is used for areas of substantial public pedestrian use AND 7 mph for public seating areas. These criteria are not to be exceeded more than 10% of the time. The third line of output for each location shows the criterion speed and the percentage of the time the criterion would be exceeded. The rows labeled CONTRIB tabulate the percentage contribution to the total or the exceedance from each wind direction. The SUMs are the equivalent number of events. _______________________________________________________________________________________________________ 10.0% Exc. ---Criterion--- Loca- Ground Speed % Time ENE S SW OTHER SUM tion Speed Exc. Exc. _______________________________________________________________________________________________________ Profile Ratios: 2.0000 2.0000 2.0000 2.0000 1,095 Obs 1 RATIOS 0.3918 0.4354 0.6534 0.4935 5.3 CONTRIB 81.95% 11.90% 3.54% 2.61% 110 11.0 0.10 CONTRIB 1.15% 3.43% 94.25% 1.16% 1 2 RATIOS 0.8888 0.6886 0.7662 0.7812 11.9 CONTRIB 90.45% 8.22% 1.10% 0.23% 110 11.0 14.01 CONTRIB 92.44% 6.38% 0.89% 0.29% 153 3 RATIOS 0.4752 0.2434 0.4550 0.3912 6.2 CONTRIB 98.45% 0.03% 1.35% 0.16% 110 11.0 0.01 CONTRIB 61.02% 0.00% 38.98% 0.00% 0 4 RATIOS 0.8570 0.7516 1.2612 0.9566 11.6 CONTRIB 86.58% 9.31% 2.84% 1.27% 110 11.0 12.40 CONTRIB 88.08% 7.93% 2.52% 1.47% 136 5 RATIOS 0.7194 0.3670 0.7360 0.6075 9.4 CONTRIB 98.26% 0.03% 1.51% 0.20% 110 11.0 4.94 CONTRIB 97.50% 0.01% 2.36% 0.13% 54 6 RATIOS 0.9360 0.4556 1.2234 0.8717 12.3 CONTRIB 97.22% 0.02% 2.36% 0.40% 110 11.0 16.89 CONTRIB 97.68% 0.03% 1.74% 0.54% 185 7 RATIOS 0.5474 0.4864 0.7060 0.5799 7.4 CONTRIB 87.45% 9.47% 2.20% 0.87% 110 11.0 0.26 CONTRIB 51.55% 4.62% 42.18% 1.66% 3 8 RATIOS 0.4700 0.6178 0.7528 0.6135 6.5 CONTRIB 78.82% 14.89% 3.22% 3.08% 110 11.0 0.64 CONTRIB 1.20% 78.69% 19.06% 1.05% 7 9 RATIOS 0.7956 0.4866 1.1024 0.7949 10.5 CONTRIB 96.45% 0.25% 2.64% 0.66% 110 11.0 8.01 CONTRIB 96.27% 0.15% 3.00% 0.58% 88 10 RATIOS 0.6762 0.4254 0.7058 0.6025 8.9 CONTRIB 97.74% 0.41% 1.56% 0.29% 110 11.0 3.72 CONTRIB 96.85% 0.07% 2.92% 0.16% 41 11 RATIOS 0.6646 0.4158 0.5608 0.5471 8.7 CONTRIB 98.36% 0.38% 1.09% 0.16% 110 11.0 3.36 CONTRIB 98.88% 0.06% 0.97% 0.08% 37 _______________________________________________________________________________________________________
46
_______________________________________________________________________________________________________ 10.0% Exc. ---Criterion--- Loca- Ground Speed % Time ENE S SW OTHER SUM tion Speed Exc. Exc. _______________________________________________________________________________________________________ 12 RATIOS 0.4414 0.4272 0.5870 0.4852 6.0 CONTRIB 86.19% 10.36% 2.33% 1.12% 110 11.0 0.05 CONTRIB 7.27% 5.18% 85.68% 1.87% 1 13 RATIOS 0.8810 0.4562 0.5740 0.6371 11.5 CONTRIB 99.63% 0.03% 0.27% 0.06% 110 11.0 12.48 CONTRIB 99.57% 0.04% 0.32% 0.07% 137 14 RATIOS 0.6794 0.5292 0.5226 0.5771 9.1 CONTRIB 90.68% 8.27% 0.87% 0.18% 110 11.0 3.75 CONTRIB 98.21% 1.19% 0.49% 0.11% 41 15 RATIOS 0.5298 0.3756 0.5832 0.4962 7.0 CONTRIB 95.44% 2.46% 1.70% 0.40% 110 11.0 0.12 CONTRIB 59.84% 0.62% 38.48% 1.06% 1 16 RATIOS 0.3460 0.4450 0.6174 0.4695 4.8 CONTRIB 77.89% 14.31% 3.98% 3.82% 109 11.0 0.08 CONTRIB 0.34% 5.78% 93.88% 0.00% 1 17 RATIOS 0.4484 0.3580 0.2930 0.3665 6.0 CONTRIB 91.12% 8.51% 0.24% 0.14% 110 11.0 0.01 CONTRIB 91.30% 7.67% 0.00% 1.03% 0 18 RATIOS 0.3618 0.3344 0.3776 0.3579 4.9 CONTRIB 88.06% 9.90% 1.51% 0.53% 109 11.0 0.00 CONTRIB 31.52% 11.66% 54.07% 2.75% 0 19 RATIOS 0.3558 0.3682 0.4416 0.3885 4.8 CONTRIB 85.78% 11.13% 2.03% 1.06% 110 11.0 0.00 CONTRIB 7.39% 11.39% 81.22% 0.00% 0 20 RATIOS 0.5698 0.3592 0.4504 0.4598 7.5 CONTRIB 98.45% 0.43% 0.97% 0.14% 110 11.0 0.30 CONTRIB 98.22% 0.14% 1.64% 0.00% 3 21 RATIOS 0.4740 0.3808 0.5990 0.4846 6.4 CONTRIB 88.67% 8.51% 2.13% 0.69% 110 11.0 0.07 CONTRIB 12.70% 1.31% 84.44% 1.55% 1 22 RATIOS 0.5512 0.3482 0.4442 0.4479 7.2 CONTRIB 98.40% 0.45% 1.01% 0.15% 110 11.0 0.16 CONTRIB 97.11% 0.18% 2.72% 0.00% 2 23 RATIOS 0.4456 0.3512 0.3920 0.3963 6.0 CONTRIB 90.24% 8.37% 1.13% 0.25% 110 11.0 0.01 CONTRIB 74.81% 5.26% 19.93% 0.00% 0 24 RATIOS 0.3796 0.3826 0.3422 0.3681 5.1 CONTRIB 87.51% 10.86% 1.17% 0.46% 110 11.0 0.00 CONTRIB 40.95% 45.23% 11.05% 2.78% 0 25 RATIOS 0.1940 0.3066 0.3338 0.2781 1.1 CONTRIB 86.58% 2.90% 1.30% 9.22% 1,000 11.0 0.00 CONTRIB 0.00% 0.00% 100.00% 0.00% 0 26 RATIOS 0.8358 0.4236 0.9914 0.7503 11.0 CONTRIB 97.71% 0.03% 1.96% 0.31% 110 11.0 9.94 CONTRIB 97.70% 0.03% 1.97% 0.31% 109 27 RATIOS 0.7400 0.6280 0.8020 0.7233 9.9 CONTRIB 88.86% 9.04% 1.61% 0.49% 110 11.0 6.30 CONTRIB 87.22% 10.27% 2.14% 0.37% 69 28 RATIOS 0.1384 0.1504 0.1352 0.1413 3.8 CONTRIB 24.13% 56.91% 18.96% 0.00% 0 11.0 0.00 CONTRIB 0.00% 0.00% 0.00% 0.00% 0 _______________________________________________________________________________________________________
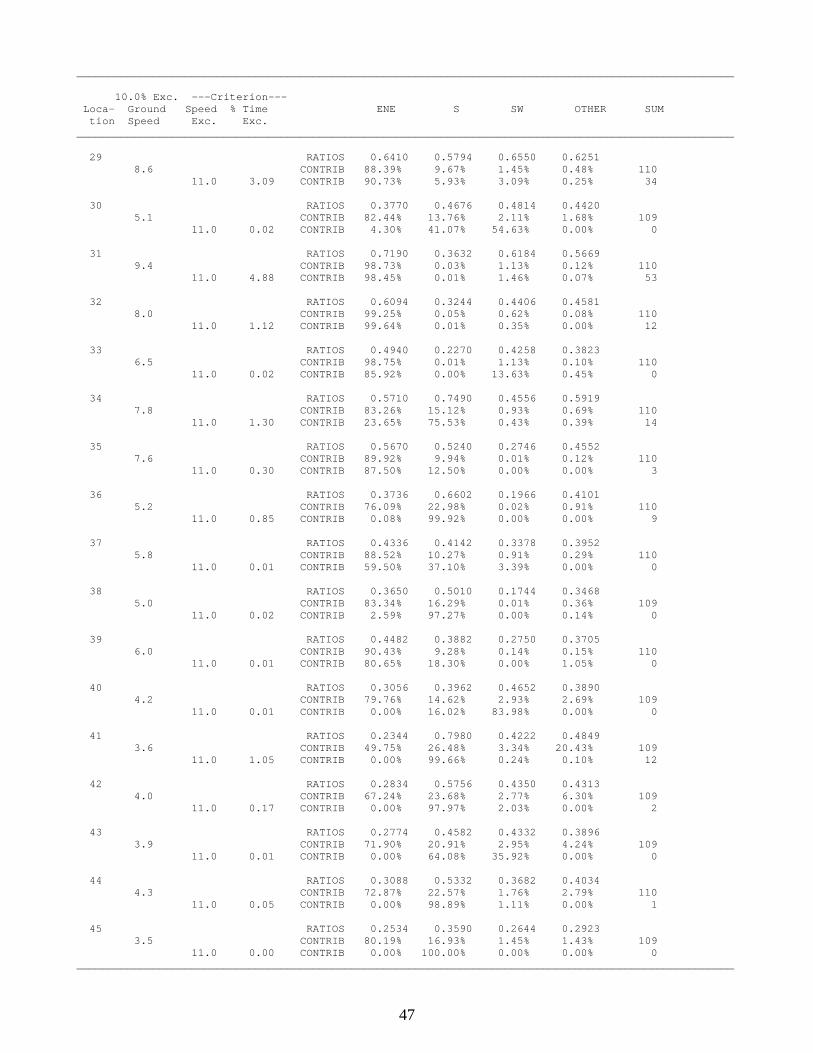
47
_______________________________________________________________________________________________________ 10.0% Exc. ---Criterion--- Loca- Ground Speed % Time ENE S SW OTHER SUM tion Speed Exc. Exc. _______________________________________________________________________________________________________ 29 RATIOS 0.6410 0.5794 0.6550 0.6251 8.6 CONTRIB 88.39% 9.67% 1.45% 0.48% 110 11.0 3.09 CONTRIB 90.73% 5.93% 3.09% 0.25% 34 30 RATIOS 0.3770 0.4676 0.4814 0.4420 5.1 CONTRIB 82.44% 13.76% 2.11% 1.68% 109 11.0 0.02 CONTRIB 4.30% 41.07% 54.63% 0.00% 0 31 RATIOS 0.7190 0.3632 0.6184 0.5669 9.4 CONTRIB 98.73% 0.03% 1.13% 0.12% 110 11.0 4.88 CONTRIB 98.45% 0.01% 1.46% 0.07% 53 32 RATIOS 0.6094 0.3244 0.4406 0.4581 8.0 CONTRIB 99.25% 0.05% 0.62% 0.08% 110 11.0 1.12 CONTRIB 99.64% 0.01% 0.35% 0.00% 12 33 RATIOS 0.4940 0.2270 0.4258 0.3823 6.5 CONTRIB 98.75% 0.01% 1.13% 0.10% 110 11.0 0.02 CONTRIB 85.92% 0.00% 13.63% 0.45% 0 34 RATIOS 0.5710 0.7490 0.4556 0.5919 7.8 CONTRIB 83.26% 15.12% 0.93% 0.69% 110 11.0 1.30 CONTRIB 23.65% 75.53% 0.43% 0.39% 14 35 RATIOS 0.5670 0.5240 0.2746 0.4552 7.6 CONTRIB 89.92% 9.94% 0.01% 0.12% 110 11.0 0.30 CONTRIB 87.50% 12.50% 0.00% 0.00% 3 36 RATIOS 0.3736 0.6602 0.1966 0.4101 5.2 CONTRIB 76.09% 22.98% 0.02% 0.91% 110 11.0 0.85 CONTRIB 0.08% 99.92% 0.00% 0.00% 9 37 RATIOS 0.4336 0.4142 0.3378 0.3952 5.8 CONTRIB 88.52% 10.27% 0.91% 0.29% 110 11.0 0.01 CONTRIB 59.50% 37.10% 3.39% 0.00% 0 38 RATIOS 0.3650 0.5010 0.1744 0.3468 5.0 CONTRIB 83.34% 16.29% 0.01% 0.36% 109 11.0 0.02 CONTRIB 2.59% 97.27% 0.00% 0.14% 0 39 RATIOS 0.4482 0.3882 0.2750 0.3705 6.0 CONTRIB 90.43% 9.28% 0.14% 0.15% 110 11.0 0.01 CONTRIB 80.65% 18.30% 0.00% 1.05% 0 40 RATIOS 0.3056 0.3962 0.4652 0.3890 4.2 CONTRIB 79.76% 14.62% 2.93% 2.69% 109 11.0 0.01 CONTRIB 0.00% 16.02% 83.98% 0.00% 0 41 RATIOS 0.2344 0.7980 0.4222 0.4849 3.6 CONTRIB 49.75% 26.48% 3.34% 20.43% 109 11.0 1.05 CONTRIB 0.00% 99.66% 0.24% 0.10% 12 42 RATIOS 0.2834 0.5756 0.4350 0.4313 4.0 CONTRIB 67.24% 23.68% 2.77% 6.30% 109 11.0 0.17 CONTRIB 0.00% 97.97% 2.03% 0.00% 2 43 RATIOS 0.2774 0.4582 0.4332 0.3896 3.9 CONTRIB 71.90% 20.91% 2.95% 4.24% 109 11.0 0.01 CONTRIB 0.00% 64.08% 35.92% 0.00% 0 44 RATIOS 0.3088 0.5332 0.3682 0.4034 4.3 CONTRIB 72.87% 22.57% 1.76% 2.79% 110 11.0 0.05 CONTRIB 0.00% 98.89% 1.11% 0.00% 1 45 RATIOS 0.2534 0.3590 0.2644 0.2923 3.5 CONTRIB 80.19% 16.93% 1.45% 1.43% 109 11.0 0.00 CONTRIB 0.00% 100.00% 0.00% 0.00% 0 _______________________________________________________________________________________________________
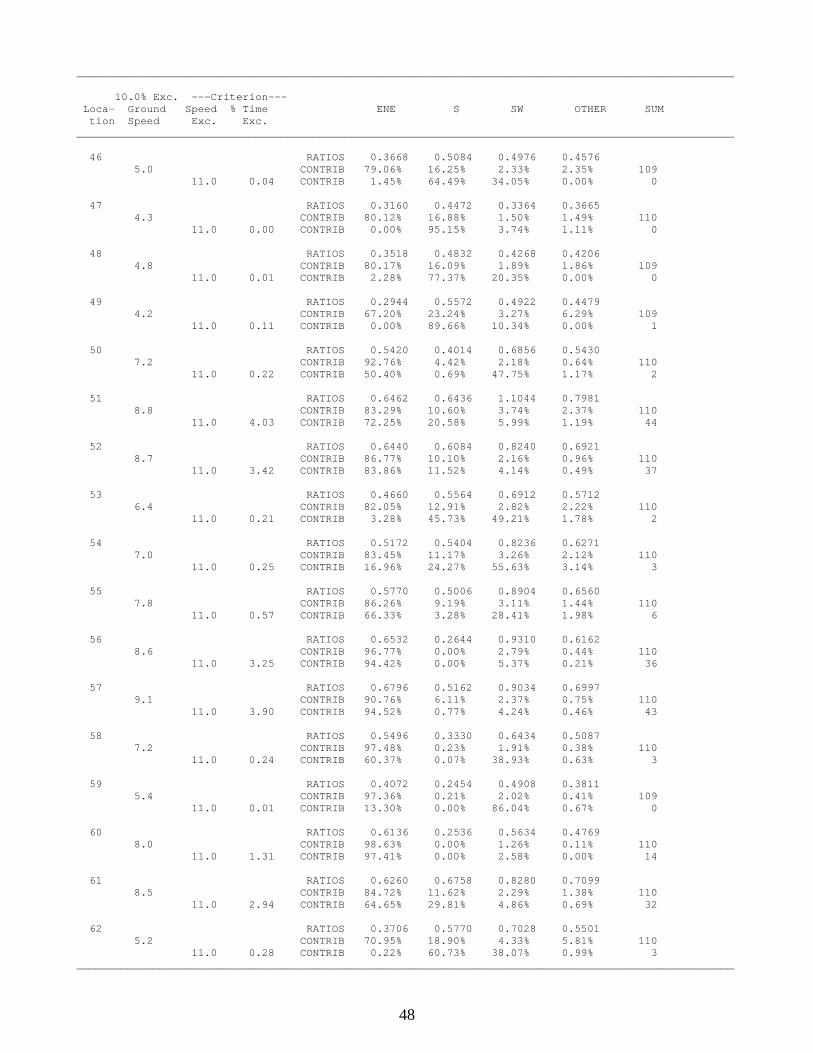
48
_______________________________________________________________________________________________________ 10.0% Exc. ---Criterion--- Loca- Ground Speed % Time ENE S SW OTHER SUM tion Speed Exc. Exc. _______________________________________________________________________________________________________ 46 RATIOS 0.3668 0.5084 0.4976 0.4576 5.0 CONTRIB 79.06% 16.25% 2.33% 2.35% 109 11.0 0.04 CONTRIB 1.45% 64.49% 34.05% 0.00% 0 47 RATIOS 0.3160 0.4472 0.3364 0.3665 4.3 CONTRIB 80.12% 16.88% 1.50% 1.49% 110 11.0 0.00 CONTRIB 0.00% 95.15% 3.74% 1.11% 0 48 RATIOS 0.3518 0.4832 0.4268 0.4206 4.8 CONTRIB 80.17% 16.09% 1.89% 1.86% 109 11.0 0.01 CONTRIB 2.28% 77.37% 20.35% 0.00% 0 49 RATIOS 0.2944 0.5572 0.4922 0.4479 4.2 CONTRIB 67.20% 23.24% 3.27% 6.29% 109 11.0 0.11 CONTRIB 0.00% 89.66% 10.34% 0.00% 1 50 RATIOS 0.5420 0.4014 0.6856 0.5430 7.2 CONTRIB 92.76% 4.42% 2.18% 0.64% 110 11.0 0.22 CONTRIB 50.40% 0.69% 47.75% 1.17% 2 51 RATIOS 0.6462 0.6436 1.1044 0.7981 8.8 CONTRIB 83.29% 10.60% 3.74% 2.37% 110 11.0 4.03 CONTRIB 72.25% 20.58% 5.99% 1.19% 44 52 RATIOS 0.6440 0.6084 0.8240 0.6921 8.7 CONTRIB 86.77% 10.10% 2.16% 0.96% 110 11.0 3.42 CONTRIB 83.86% 11.52% 4.14% 0.49% 37 53 RATIOS 0.4660 0.5564 0.6912 0.5712 6.4 CONTRIB 82.05% 12.91% 2.82% 2.22% 110 11.0 0.21 CONTRIB 3.28% 45.73% 49.21% 1.78% 2 54 RATIOS 0.5172 0.5404 0.8236 0.6271 7.0 CONTRIB 83.45% 11.17% 3.26% 2.12% 110 11.0 0.25 CONTRIB 16.96% 24.27% 55.63% 3.14% 3 55 RATIOS 0.5770 0.5006 0.8904 0.6560 7.8 CONTRIB 86.26% 9.19% 3.11% 1.44% 110 11.0 0.57 CONTRIB 66.33% 3.28% 28.41% 1.98% 6 56 RATIOS 0.6532 0.2644 0.9310 0.6162 8.6 CONTRIB 96.77% 0.00% 2.79% 0.44% 110 11.0 3.25 CONTRIB 94.42% 0.00% 5.37% 0.21% 36 57 RATIOS 0.6796 0.5162 0.9034 0.6997 9.1 CONTRIB 90.76% 6.11% 2.37% 0.75% 110 11.0 3.90 CONTRIB 94.52% 0.77% 4.24% 0.46% 43 58 RATIOS 0.5496 0.3330 0.6434 0.5087 7.2 CONTRIB 97.48% 0.23% 1.91% 0.38% 110 11.0 0.24 CONTRIB 60.37% 0.07% 38.93% 0.63% 3 59 RATIOS 0.4072 0.2454 0.4908 0.3811 5.4 CONTRIB 97.36% 0.21% 2.02% 0.41% 109 11.0 0.01 CONTRIB 13.30% 0.00% 86.04% 0.67% 0 60 RATIOS 0.6136 0.2536 0.5634 0.4769 8.0 CONTRIB 98.63% 0.00% 1.26% 0.11% 110 11.0 1.31 CONTRIB 97.41% 0.00% 2.58% 0.00% 14 61 RATIOS 0.6260 0.6758 0.8280 0.7099 8.5 CONTRIB 84.72% 11.62% 2.29% 1.38% 110 11.0 2.94 CONTRIB 64.65% 29.81% 4.86% 0.69% 32 62 RATIOS 0.3706 0.5770 0.7028 0.5501 5.2 CONTRIB 70.95% 18.90% 4.33% 5.81% 110 11.0 0.28 CONTRIB 0.22% 60.73% 38.07% 0.99% 3 _______________________________________________________________________________________________________
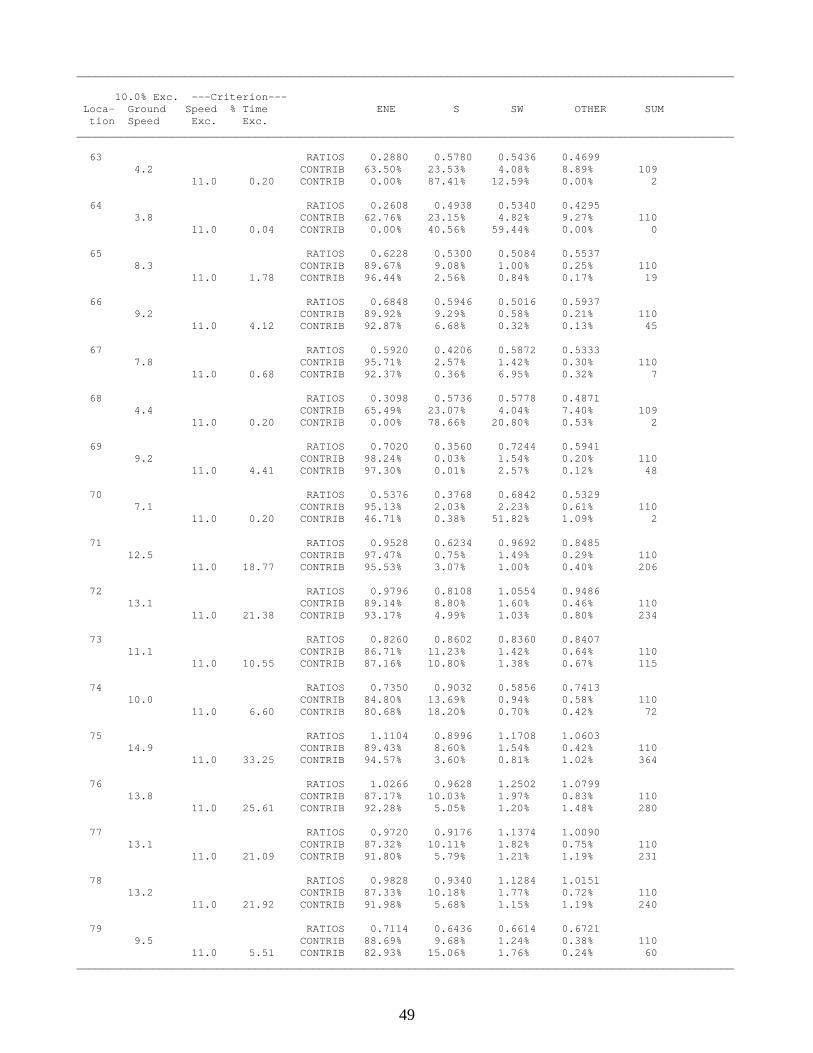
49
_______________________________________________________________________________________________________ 10.0% Exc. ---Criterion--- Loca- Ground Speed % Time ENE S SW OTHER SUM tion Speed Exc. Exc. _______________________________________________________________________________________________________ 63 RATIOS 0.2880 0.5780 0.5436 0.4699 4.2 CONTRIB 63.50% 23.53% 4.08% 8.89% 109 11.0 0.20 CONTRIB 0.00% 87.41% 12.59% 0.00% 2 64 RATIOS 0.2608 0.4938 0.5340 0.4295 3.8 CONTRIB 62.76% 23.15% 4.82% 9.27% 110 11.0 0.04 CONTRIB 0.00% 40.56% 59.44% 0.00% 0 65 RATIOS 0.6228 0.5300 0.5084 0.5537 8.3 CONTRIB 89.67% 9.08% 1.00% 0.25% 110 11.0 1.78 CONTRIB 96.44% 2.56% 0.84% 0.17% 19 66 RATIOS 0.6848 0.5946 0.5016 0.5937 9.2 CONTRIB 89.92% 9.29% 0.58% 0.21% 110 11.0 4.12 CONTRIB 92.87% 6.68% 0.32% 0.13% 45 67 RATIOS 0.5920 0.4206 0.5872 0.5333 7.8 CONTRIB 95.71% 2.57% 1.42% 0.30% 110 11.0 0.68 CONTRIB 92.37% 0.36% 6.95% 0.32% 7 68 RATIOS 0.3098 0.5736 0.5778 0.4871 4.4 CONTRIB 65.49% 23.07% 4.04% 7.40% 109 11.0 0.20 CONTRIB 0.00% 78.66% 20.80% 0.53% 2 69 RATIOS 0.7020 0.3560 0.7244 0.5941 9.2 CONTRIB 98.24% 0.03% 1.54% 0.20% 110 11.0 4.41 CONTRIB 97.30% 0.01% 2.57% 0.12% 48 70 RATIOS 0.5376 0.3768 0.6842 0.5329 7.1 CONTRIB 95.13% 2.03% 2.23% 0.61% 110 11.0 0.20 CONTRIB 46.71% 0.38% 51.82% 1.09% 2 71 RATIOS 0.9528 0.6234 0.9692 0.8485 12.5 CONTRIB 97.47% 0.75% 1.49% 0.29% 110 11.0 18.77 CONTRIB 95.53% 3.07% 1.00% 0.40% 206 72 RATIOS 0.9796 0.8108 1.0554 0.9486 13.1 CONTRIB 89.14% 8.80% 1.60% 0.46% 110 11.0 21.38 CONTRIB 93.17% 4.99% 1.03% 0.80% 234 73 RATIOS 0.8260 0.8602 0.8360 0.8407 11.1 CONTRIB 86.71% 11.23% 1.42% 0.64% 110 11.0 10.55 CONTRIB 87.16% 10.80% 1.38% 0.67% 115 74 RATIOS 0.7350 0.9032 0.5856 0.7413 10.0 CONTRIB 84.80% 13.69% 0.94% 0.58% 110 11.0 6.60 CONTRIB 80.68% 18.20% 0.70% 0.42% 72 75 RATIOS 1.1104 0.8996 1.1708 1.0603 14.9 CONTRIB 89.43% 8.60% 1.54% 0.42% 110 11.0 33.25 CONTRIB 94.57% 3.60% 0.81% 1.02% 364 76 RATIOS 1.0266 0.9628 1.2502 1.0799 13.8 CONTRIB 87.17% 10.03% 1.97% 0.83% 110 11.0 25.61 CONTRIB 92.28% 5.05% 1.20% 1.48% 280 77 RATIOS 0.9720 0.9176 1.1374 1.0090 13.1 CONTRIB 87.32% 10.11% 1.82% 0.75% 110 11.0 21.09 CONTRIB 91.80% 5.79% 1.21% 1.19% 231 78 RATIOS 0.9828 0.9340 1.1284 1.0151 13.2 CONTRIB 87.33% 10.18% 1.77% 0.72% 110 11.0 21.92 CONTRIB 91.98% 5.68% 1.15% 1.19% 240 79 RATIOS 0.7114 0.6436 0.6614 0.6721 9.5 CONTRIB 88.69% 9.68% 1.24% 0.38% 110 11.0 5.51 CONTRIB 82.93% 15.06% 1.76% 0.24% 60 _______________________________________________________________________________________________________
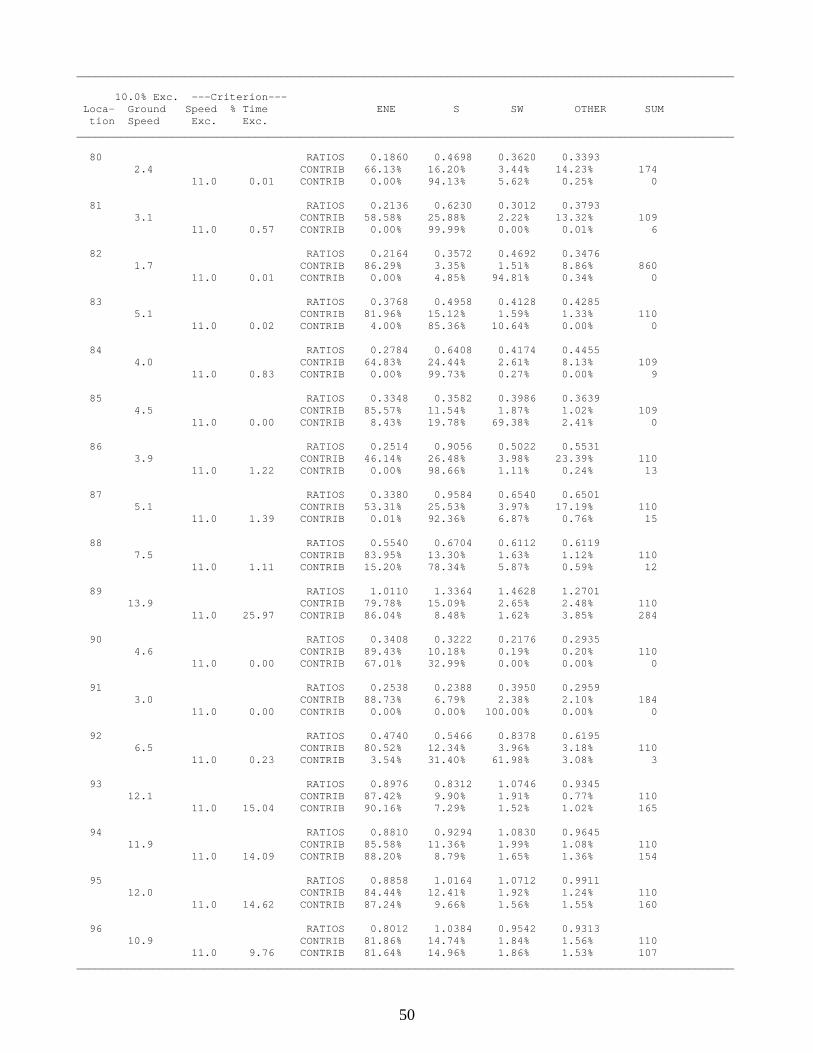
50
_______________________________________________________________________________________________________ 10.0% Exc. ---Criterion--- Loca- Ground Speed % Time ENE S SW OTHER SUM tion Speed Exc. Exc. _______________________________________________________________________________________________________ 80 RATIOS 0.1860 0.4698 0.3620 0.3393 2.4 CONTRIB 66.13% 16.20% 3.44% 14.23% 174 11.0 0.01 CONTRIB 0.00% 94.13% 5.62% 0.25% 0 81 RATIOS 0.2136 0.6230 0.3012 0.3793 3.1 CONTRIB 58.58% 25.88% 2.22% 13.32% 109 11.0 0.57 CONTRIB 0.00% 99.99% 0.00% 0.01% 6 82 RATIOS 0.2164 0.3572 0.4692 0.3476 1.7 CONTRIB 86.29% 3.35% 1.51% 8.86% 860 11.0 0.01 CONTRIB 0.00% 4.85% 94.81% 0.34% 0 83 RATIOS 0.3768 0.4958 0.4128 0.4285 5.1 CONTRIB 81.96% 15.12% 1.59% 1.33% 110 11.0 0.02 CONTRIB 4.00% 85.36% 10.64% 0.00% 0 84 RATIOS 0.2784 0.6408 0.4174 0.4455 4.0 CONTRIB 64.83% 24.44% 2.61% 8.13% 109 11.0 0.83 CONTRIB 0.00% 99.73% 0.27% 0.00% 9 85 RATIOS 0.3348 0.3582 0.3986 0.3639 4.5 CONTRIB 85.57% 11.54% 1.87% 1.02% 109 11.0 0.00 CONTRIB 8.43% 19.78% 69.38% 2.41% 0 86 RATIOS 0.2514 0.9056 0.5022 0.5531 3.9 CONTRIB 46.14% 26.48% 3.98% 23.39% 110 11.0 1.22 CONTRIB 0.00% 98.66% 1.11% 0.24% 13 87 RATIOS 0.3380 0.9584 0.6540 0.6501 5.1 CONTRIB 53.31% 25.53% 3.97% 17.19% 110 11.0 1.39 CONTRIB 0.01% 92.36% 6.87% 0.76% 15 88 RATIOS 0.5540 0.6704 0.6112 0.6119 7.5 CONTRIB 83.95% 13.30% 1.63% 1.12% 110 11.0 1.11 CONTRIB 15.20% 78.34% 5.87% 0.59% 12 89 RATIOS 1.0110 1.3364 1.4628 1.2701 13.9 CONTRIB 79.78% 15.09% 2.65% 2.48% 110 11.0 25.97 CONTRIB 86.04% 8.48% 1.62% 3.85% 284 90 RATIOS 0.3408 0.3222 0.2176 0.2935 4.6 CONTRIB 89.43% 10.18% 0.19% 0.20% 110 11.0 0.00 CONTRIB 67.01% 32.99% 0.00% 0.00% 0 91 RATIOS 0.2538 0.2388 0.3950 0.2959 3.0 CONTRIB 88.73% 6.79% 2.38% 2.10% 184 11.0 0.00 CONTRIB 0.00% 0.00% 100.00% 0.00% 0 92 RATIOS 0.4740 0.5466 0.8378 0.6195 6.5 CONTRIB 80.52% 12.34% 3.96% 3.18% 110 11.0 0.23 CONTRIB 3.54% 31.40% 61.98% 3.08% 3 93 RATIOS 0.8976 0.8312 1.0746 0.9345 12.1 CONTRIB 87.42% 9.90% 1.91% 0.77% 110 11.0 15.04 CONTRIB 90.16% 7.29% 1.52% 1.02% 165 94 RATIOS 0.8810 0.9294 1.0830 0.9645 11.9 CONTRIB 85.58% 11.36% 1.99% 1.08% 110 11.0 14.09 CONTRIB 88.20% 8.79% 1.65% 1.36% 154 95 RATIOS 0.8858 1.0164 1.0712 0.9911 12.0 CONTRIB 84.44% 12.41% 1.92% 1.24% 110 11.0 14.62 CONTRIB 87.24% 9.66% 1.56% 1.55% 160 96 RATIOS 0.8012 1.0384 0.9542 0.9313 10.9 CONTRIB 81.86% 14.74% 1.84% 1.56% 110 11.0 9.76 CONTRIB 81.64% 14.96% 1.86% 1.53% 107 _______________________________________________________________________________________________________
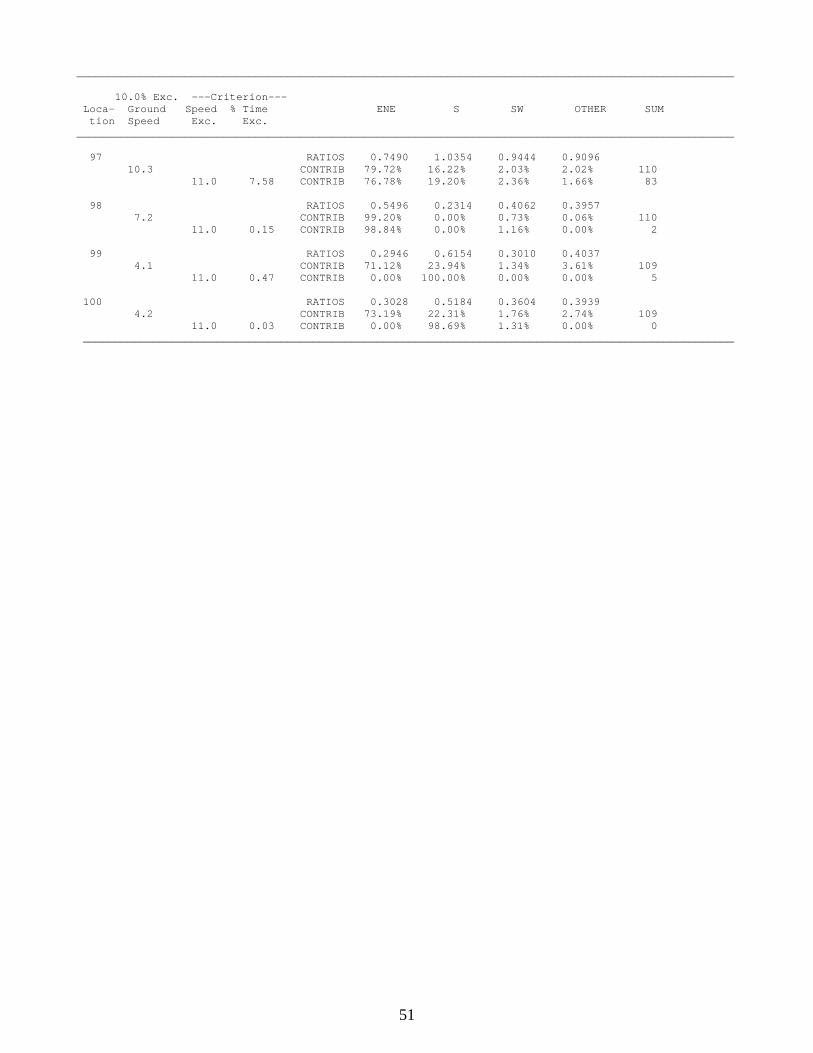
51
_______________________________________________________________________________________________________ 10.0% Exc. ---Criterion--- Loca- Ground Speed % Time ENE S SW OTHER SUM tion Speed Exc. Exc. _______________________________________________________________________________________________________ 97 RATIOS 0.7490 1.0354 0.9444 0.9096 10.3 CONTRIB 79.72% 16.22% 2.03% 2.02% 110 11.0 7.58 CONTRIB 76.78% 19.20% 2.36% 1.66% 83 98 RATIOS 0.5496 0.2314 0.4062 0.3957 7.2 CONTRIB 99.20% 0.00% 0.73% 0.06% 110 11.0 0.15 CONTRIB 98.84% 0.00% 1.16% 0.00% 2 99 RATIOS 0.2946 0.6154 0.3010 0.4037 4.1 CONTRIB 71.12% 23.94% 1.34% 3.61% 109 11.0 0.47 CONTRIB 0.00% 100.00% 0.00% 0.00% 5 100 RATIOS 0.3028 0.5184 0.3604 0.3939 4.2 CONTRIB 73.19% 22.31% 1.76% 2.74% 109 11.0 0.03 CONTRIB 0.00% 98.69% 1.31% 0.00% 0 ______________________________________________________________________________________________________
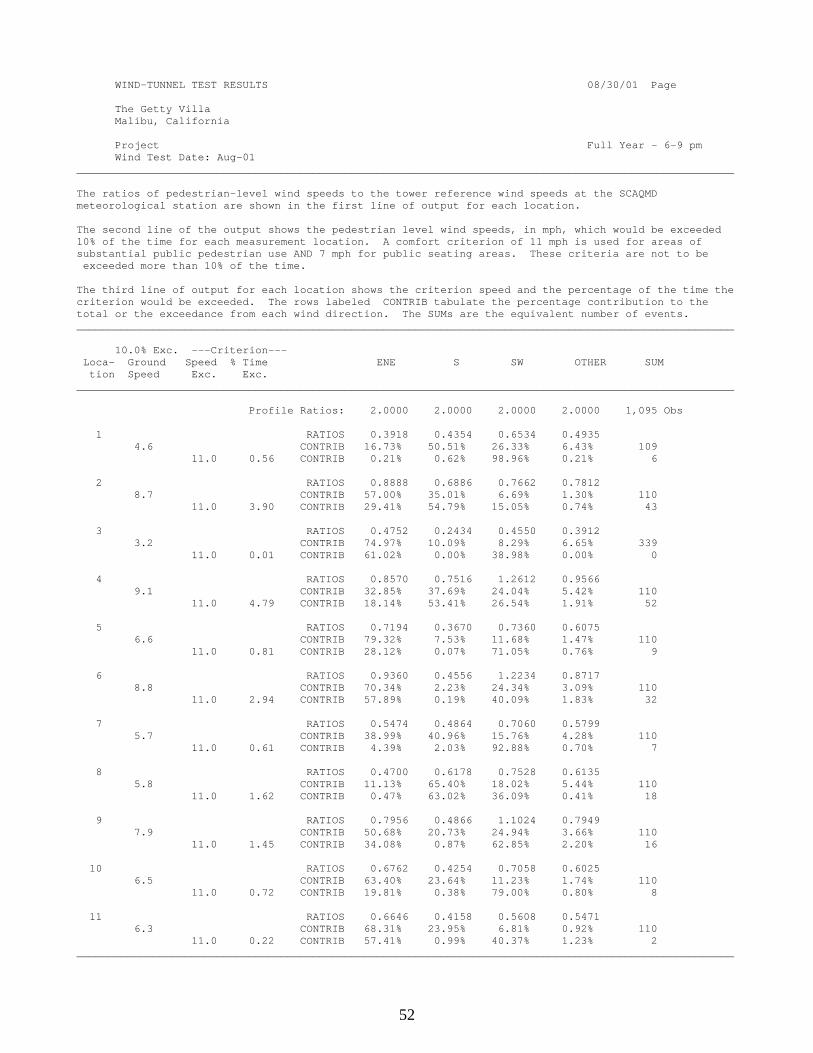
52
WIND-TUNNEL TEST RESULTS 08/30/01 Page The Getty Villa Malibu, California Project Full Year - 6-9 pm Wind Test Date: Aug-01 _______________________________________________________________________________________________________ The ratios of pedestrian-level wind speeds to the tower reference wind speeds at the SCAQMD meteorological station are shown in the first line of output for each location. The second line of the output shows the pedestrian level wind speeds, in mph, which would be exceeded 10% of the time for each measurement location. A comfort criterion of 11 mph is used for areas of substantial public pedestrian use AND 7 mph for public seating areas. These criteria are not to be exceeded more than 10% of the time. The third line of output for each location shows the criterion speed and the percentage of the time the criterion would be exceeded. The rows labeled CONTRIB tabulate the percentage contribution to the total or the exceedance from each wind direction. The SUMs are the equivalent number of events. _______________________________________________________________________________________________________ 10.0% Exc. ---Criterion--- Loca- Ground Speed % Time ENE S SW OTHER SUM tion Speed Exc. Exc. _______________________________________________________________________________________________________ Profile Ratios: 2.0000 2.0000 2.0000 2.0000 1,095 Obs 1 RATIOS 0.3918 0.4354 0.6534 0.4935 4.6 CONTRIB 16.73% 50.51% 26.33% 6.43% 109 11.0 0.56 CONTRIB 0.21% 0.62% 98.96% 0.21% 6 2 RATIOS 0.8888 0.6886 0.7662 0.7812 8.7 CONTRIB 57.00% 35.01% 6.69% 1.30% 110 11.0 3.90 CONTRIB 29.41% 54.79% 15.05% 0.74% 43 3 RATIOS 0.4752 0.2434 0.4550 0.3912 3.2 CONTRIB 74.97% 10.09% 8.29% 6.65% 339 11.0 0.01 CONTRIB 61.02% 0.00% 38.98% 0.00% 0 4 RATIOS 0.8570 0.7516 1.2612 0.9566 9.1 CONTRIB 32.85% 37.69% 24.04% 5.42% 110 11.0 4.79 CONTRIB 18.14% 53.41% 26.54% 1.91% 52 5 RATIOS 0.7194 0.3670 0.7360 0.6075 6.6 CONTRIB 79.32% 7.53% 11.68% 1.47% 110 11.0 0.81 CONTRIB 28.12% 0.07% 71.05% 0.76% 9 6 RATIOS 0.9360 0.4556 1.2234 0.8717 8.8 CONTRIB 70.34% 2.23% 24.34% 3.09% 110 11.0 2.94 CONTRIB 57.89% 0.19% 40.09% 1.83% 32 7 RATIOS 0.5474 0.4864 0.7060 0.5799 5.7 CONTRIB 38.99% 40.96% 15.76% 4.28% 110 11.0 0.61 CONTRIB 4.39% 2.03% 92.88% 0.70% 7 8 RATIOS 0.4700 0.6178 0.7528 0.6135 5.8 CONTRIB 11.13% 65.40% 18.02% 5.44% 110 11.0 1.62 CONTRIB 0.47% 63.02% 36.09% 0.41% 18 9 RATIOS 0.7956 0.4866 1.1024 0.7949 7.9 CONTRIB 50.68% 20.73% 24.94% 3.66% 110 11.0 1.45 CONTRIB 34.08% 0.87% 62.85% 2.20% 16 10 RATIOS 0.6762 0.4254 0.7058 0.6025 6.5 CONTRIB 63.40% 23.64% 11.23% 1.74% 110 11.0 0.72 CONTRIB 19.81% 0.38% 79.00% 0.80% 8 11 RATIOS 0.6646 0.4158 0.5608 0.5471 6.3 CONTRIB 68.31% 23.95% 6.81% 0.92% 110 11.0 0.22 CONTRIB 57.41% 0.99% 40.37% 1.23% 2 _______________________________________________________________________________________________________
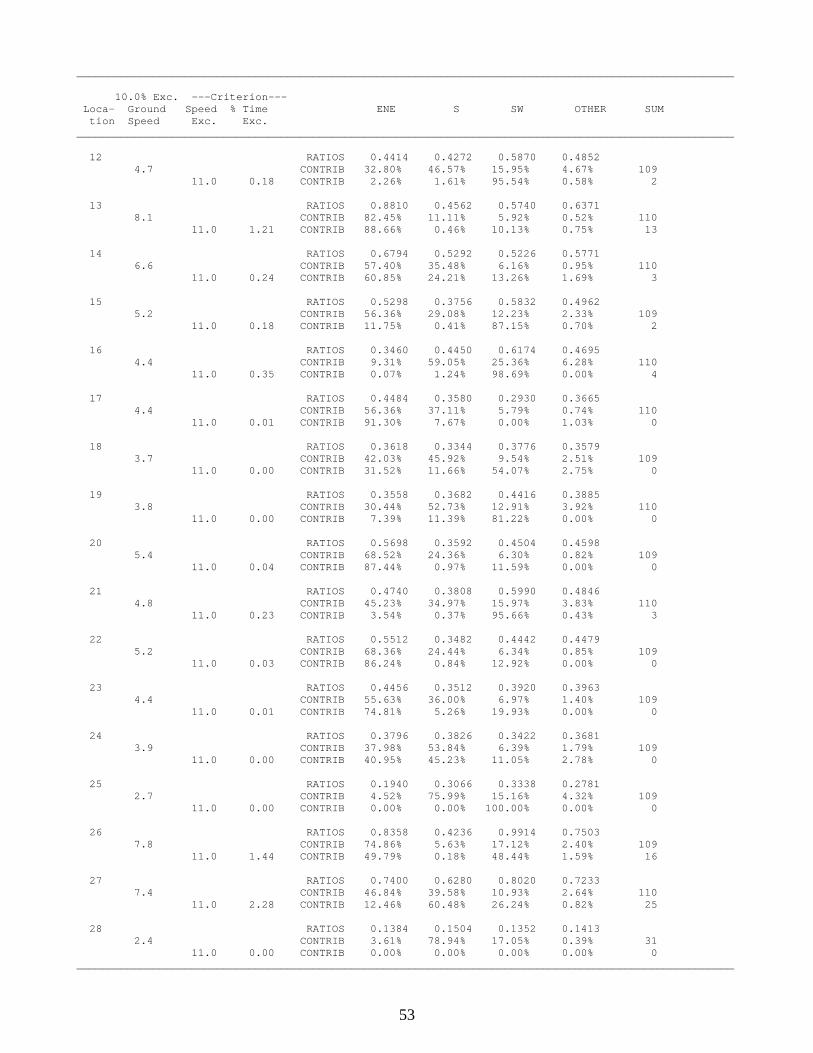
53
_______________________________________________________________________________________________________ 10.0% Exc. ---Criterion--- Loca- Ground Speed % Time ENE S SW OTHER SUM tion Speed Exc. Exc. _______________________________________________________________________________________________________ 12 RATIOS 0.4414 0.4272 0.5870 0.4852 4.7 CONTRIB 32.80% 46.57% 15.95% 4.67% 109 11.0 0.18 CONTRIB 2.26% 1.61% 95.54% 0.58% 2 13 RATIOS 0.8810 0.4562 0.5740 0.6371 8.1 CONTRIB 82.45% 11.11% 5.92% 0.52% 110 11.0 1.21 CONTRIB 88.66% 0.46% 10.13% 0.75% 13 14 RATIOS 0.6794 0.5292 0.5226 0.5771 6.6 CONTRIB 57.40% 35.48% 6.16% 0.95% 110 11.0 0.24 CONTRIB 60.85% 24.21% 13.26% 1.69% 3 15 RATIOS 0.5298 0.3756 0.5832 0.4962 5.2 CONTRIB 56.36% 29.08% 12.23% 2.33% 109 11.0 0.18 CONTRIB 11.75% 0.41% 87.15% 0.70% 2 16 RATIOS 0.3460 0.4450 0.6174 0.4695 4.4 CONTRIB 9.31% 59.05% 25.36% 6.28% 110 11.0 0.35 CONTRIB 0.07% 1.24% 98.69% 0.00% 4 17 RATIOS 0.4484 0.3580 0.2930 0.3665 4.4 CONTRIB 56.36% 37.11% 5.79% 0.74% 110 11.0 0.01 CONTRIB 91.30% 7.67% 0.00% 1.03% 0 18 RATIOS 0.3618 0.3344 0.3776 0.3579 3.7 CONTRIB 42.03% 45.92% 9.54% 2.51% 109 11.0 0.00 CONTRIB 31.52% 11.66% 54.07% 2.75% 0 19 RATIOS 0.3558 0.3682 0.4416 0.3885 3.8 CONTRIB 30.44% 52.73% 12.91% 3.92% 110 11.0 0.00 CONTRIB 7.39% 11.39% 81.22% 0.00% 0 20 RATIOS 0.5698 0.3592 0.4504 0.4598 5.4 CONTRIB 68.52% 24.36% 6.30% 0.82% 109 11.0 0.04 CONTRIB 87.44% 0.97% 11.59% 0.00% 0 21 RATIOS 0.4740 0.3808 0.5990 0.4846 4.8 CONTRIB 45.23% 34.97% 15.97% 3.83% 110 11.0 0.23 CONTRIB 3.54% 0.37% 95.66% 0.43% 3 22 RATIOS 0.5512 0.3482 0.4442 0.4479 5.2 CONTRIB 68.36% 24.44% 6.34% 0.85% 109 11.0 0.03 CONTRIB 86.24% 0.84% 12.92% 0.00% 0 23 RATIOS 0.4456 0.3512 0.3920 0.3963 4.4 CONTRIB 55.63% 36.00% 6.97% 1.40% 109 11.0 0.01 CONTRIB 74.81% 5.26% 19.93% 0.00% 0 24 RATIOS 0.3796 0.3826 0.3422 0.3681 3.9 CONTRIB 37.98% 53.84% 6.39% 1.79% 109 11.0 0.00 CONTRIB 40.95% 45.23% 11.05% 2.78% 0 25 RATIOS 0.1940 0.3066 0.3338 0.2781 2.7 CONTRIB 4.52% 75.99% 15.16% 4.32% 109 11.0 0.00 CONTRIB 0.00% 0.00% 100.00% 0.00% 0 26 RATIOS 0.8358 0.4236 0.9914 0.7503 7.8 CONTRIB 74.86% 5.63% 17.12% 2.40% 109 11.0 1.44 CONTRIB 49.79% 0.18% 48.44% 1.59% 16 27 RATIOS 0.7400 0.6280 0.8020 0.7233 7.4 CONTRIB 46.84% 39.58% 10.93% 2.64% 110 11.0 2.28 CONTRIB 12.46% 60.48% 26.24% 0.82% 25 28 RATIOS 0.1384 0.1504 0.1352 0.1413 2.4 CONTRIB 3.61% 78.94% 17.05% 0.39% 31 11.0 0.00 CONTRIB 0.00% 0.00% 0.00% 0.00% 0 _______________________________________________________________________________________________________
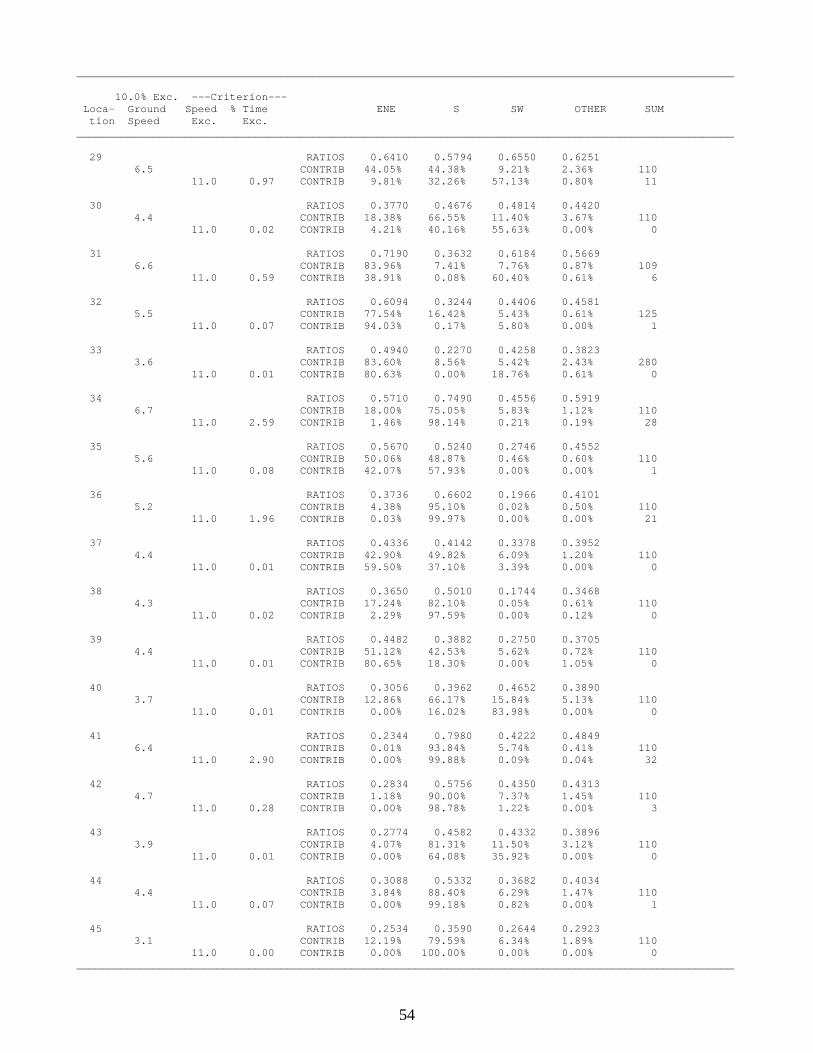
54
_______________________________________________________________________________________________________ 10.0% Exc. ---Criterion--- Loca- Ground Speed % Time ENE S SW OTHER SUM tion Speed Exc. Exc. _______________________________________________________________________________________________________ 29 RATIOS 0.6410 0.5794 0.6550 0.6251 6.5 CONTRIB 44.05% 44.38% 9.21% 2.36% 110 11.0 0.97 CONTRIB 9.81% 32.26% 57.13% 0.80% 11 30 RATIOS 0.3770 0.4676 0.4814 0.4420 4.4 CONTRIB 18.38% 66.55% 11.40% 3.67% 110 11.0 0.02 CONTRIB 4.21% 40.16% 55.63% 0.00% 0 31 RATIOS 0.7190 0.3632 0.6184 0.5669 6.6 CONTRIB 83.96% 7.41% 7.76% 0.87% 109 11.0 0.59 CONTRIB 38.91% 0.08% 60.40% 0.61% 6 32 RATIOS 0.6094 0.3244 0.4406 0.4581 5.5 CONTRIB 77.54% 16.42% 5.43% 0.61% 125 11.0 0.07 CONTRIB 94.03% 0.17% 5.80% 0.00% 1 33 RATIOS 0.4940 0.2270 0.4258 0.3823 3.6 CONTRIB 83.60% 8.56% 5.42% 2.43% 280 11.0 0.01 CONTRIB 80.63% 0.00% 18.76% 0.61% 0 34 RATIOS 0.5710 0.7490 0.4556 0.5919 6.7 CONTRIB 18.00% 75.05% 5.83% 1.12% 110 11.0 2.59 CONTRIB 1.46% 98.14% 0.21% 0.19% 28 35 RATIOS 0.5670 0.5240 0.2746 0.4552 5.6 CONTRIB 50.06% 48.87% 0.46% 0.60% 110 11.0 0.08 CONTRIB 42.07% 57.93% 0.00% 0.00% 1 36 RATIOS 0.3736 0.6602 0.1966 0.4101 5.2 CONTRIB 4.38% 95.10% 0.02% 0.50% 110 11.0 1.96 CONTRIB 0.03% 99.97% 0.00% 0.00% 21 37 RATIOS 0.4336 0.4142 0.3378 0.3952 4.4 CONTRIB 42.90% 49.82% 6.09% 1.20% 110 11.0 0.01 CONTRIB 59.50% 37.10% 3.39% 0.00% 0 38 RATIOS 0.3650 0.5010 0.1744 0.3468 4.3 CONTRIB 17.24% 82.10% 0.05% 0.61% 110 11.0 0.02 CONTRIB 2.29% 97.59% 0.00% 0.12% 0 39 RATIOS 0.4482 0.3882 0.2750 0.3705 4.4 CONTRIB 51.12% 42.53% 5.62% 0.72% 110 11.0 0.01 CONTRIB 80.65% 18.30% 0.00% 1.05% 0 40 RATIOS 0.3056 0.3962 0.4652 0.3890 3.7 CONTRIB 12.86% 66.17% 15.84% 5.13% 110 11.0 0.01 CONTRIB 0.00% 16.02% 83.98% 0.00% 0 41 RATIOS 0.2344 0.7980 0.4222 0.4849 6.4 CONTRIB 0.01% 93.84% 5.74% 0.41% 110 11.0 2.90 CONTRIB 0.00% 99.88% 0.09% 0.04% 32 42 RATIOS 0.2834 0.5756 0.4350 0.4313 4.7 CONTRIB 1.18% 90.00% 7.37% 1.45% 110 11.0 0.28 CONTRIB 0.00% 98.78% 1.22% 0.00% 3 43 RATIOS 0.2774 0.4582 0.4332 0.3896 3.9 CONTRIB 4.07% 81.31% 11.50% 3.12% 110 11.0 0.01 CONTRIB 0.00% 64.08% 35.92% 0.00% 0 44 RATIOS 0.3088 0.5332 0.3682 0.4034 4.4 CONTRIB 3.84% 88.40% 6.29% 1.47% 110 11.0 0.07 CONTRIB 0.00% 99.18% 0.82% 0.00% 1 45 RATIOS 0.2534 0.3590 0.2644 0.2923 3.1 CONTRIB 12.19% 79.59% 6.34% 1.89% 110 11.0 0.00 CONTRIB 0.00% 100.00% 0.00% 0.00% 0 _______________________________________________________________________________________________________
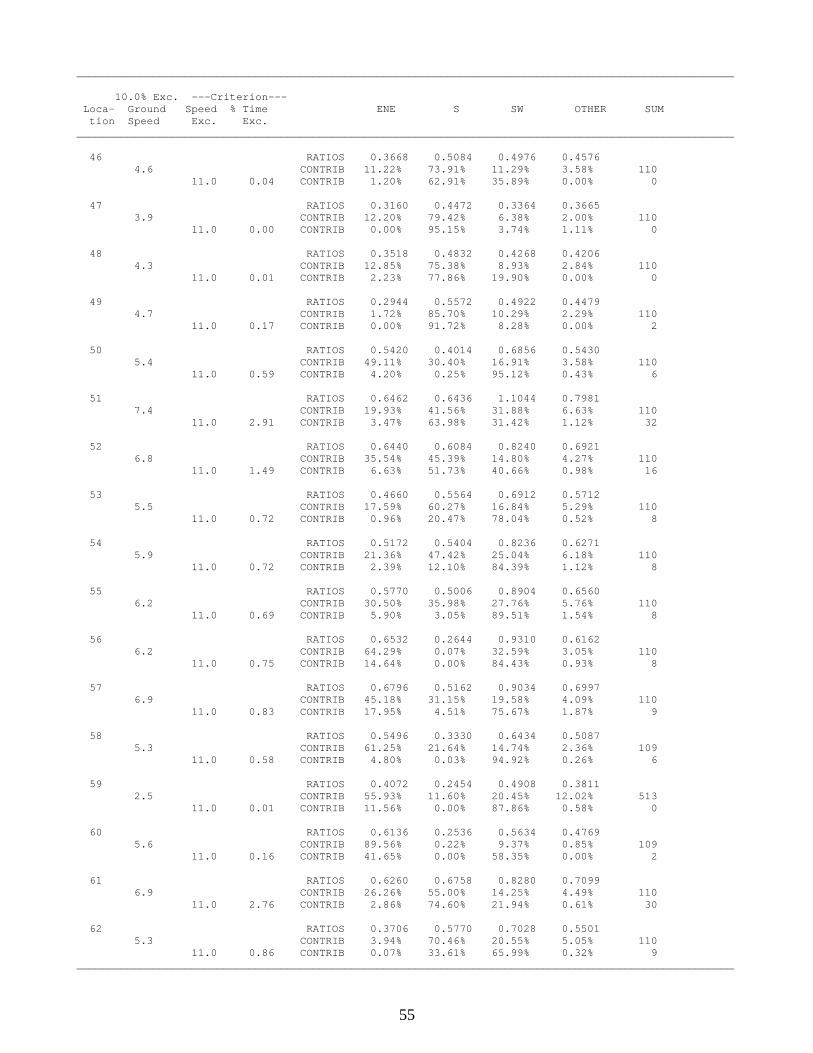
55
_______________________________________________________________________________________________________ 10.0% Exc. ---Criterion--- Loca- Ground Speed % Time ENE S SW OTHER SUM tion Speed Exc. Exc. _______________________________________________________________________________________________________ 46 RATIOS 0.3668 0.5084 0.4976 0.4576 4.6 CONTRIB 11.22% 73.91% 11.29% 3.58% 110 11.0 0.04 CONTRIB 1.20% 62.91% 35.89% 0.00% 0 47 RATIOS 0.3160 0.4472 0.3364 0.3665 3.9 CONTRIB 12.20% 79.42% 6.38% 2.00% 110 11.0 0.00 CONTRIB 0.00% 95.15% 3.74% 1.11% 0 48 RATIOS 0.3518 0.4832 0.4268 0.4206 4.3 CONTRIB 12.85% 75.38% 8.93% 2.84% 110 11.0 0.01 CONTRIB 2.23% 77.86% 19.90% 0.00% 0 49 RATIOS 0.2944 0.5572 0.4922 0.4479 4.7 CONTRIB 1.72% 85.70% 10.29% 2.29% 110 11.0 0.17 CONTRIB 0.00% 91.72% 8.28% 0.00% 2 50 RATIOS 0.5420 0.4014 0.6856 0.5430 5.4 CONTRIB 49.11% 30.40% 16.91% 3.58% 110 11.0 0.59 CONTRIB 4.20% 0.25% 95.12% 0.43% 6 51 RATIOS 0.6462 0.6436 1.1044 0.7981 7.4 CONTRIB 19.93% 41.56% 31.88% 6.63% 110 11.0 2.91 CONTRIB 3.47% 63.98% 31.42% 1.12% 32 52 RATIOS 0.6440 0.6084 0.8240 0.6921 6.8 CONTRIB 35.54% 45.39% 14.80% 4.27% 110 11.0 1.49 CONTRIB 6.63% 51.73% 40.66% 0.98% 16 53 RATIOS 0.4660 0.5564 0.6912 0.5712 5.5 CONTRIB 17.59% 60.27% 16.84% 5.29% 110 11.0 0.72 CONTRIB 0.96% 20.47% 78.04% 0.52% 8 54 RATIOS 0.5172 0.5404 0.8236 0.6271 5.9 CONTRIB 21.36% 47.42% 25.04% 6.18% 110 11.0 0.72 CONTRIB 2.39% 12.10% 84.39% 1.12% 8 55 RATIOS 0.5770 0.5006 0.8904 0.6560 6.2 CONTRIB 30.50% 35.98% 27.76% 5.76% 110 11.0 0.69 CONTRIB 5.90% 3.05% 89.51% 1.54% 8 56 RATIOS 0.6532 0.2644 0.9310 0.6162 6.2 CONTRIB 64.29% 0.07% 32.59% 3.05% 110 11.0 0.75 CONTRIB 14.64% 0.00% 84.43% 0.93% 8 57 RATIOS 0.6796 0.5162 0.9034 0.6997 6.9 CONTRIB 45.18% 31.15% 19.58% 4.09% 110 11.0 0.83 CONTRIB 17.95% 4.51% 75.67% 1.87% 9 58 RATIOS 0.5496 0.3330 0.6434 0.5087 5.3 CONTRIB 61.25% 21.64% 14.74% 2.36% 109 11.0 0.58 CONTRIB 4.80% 0.03% 94.92% 0.26% 6 59 RATIOS 0.4072 0.2454 0.4908 0.3811 2.5 CONTRIB 55.93% 11.60% 20.45% 12.02% 513 11.0 0.01 CONTRIB 11.56% 0.00% 87.86% 0.58% 0 60 RATIOS 0.6136 0.2536 0.5634 0.4769 5.6 CONTRIB 89.56% 0.22% 9.37% 0.85% 109 11.0 0.16 CONTRIB 41.65% 0.00% 58.35% 0.00% 2 61 RATIOS 0.6260 0.6758 0.8280 0.7099 6.9 CONTRIB 26.26% 55.00% 14.25% 4.49% 110 11.0 2.76 CONTRIB 2.86% 74.60% 21.94% 0.61% 30 62 RATIOS 0.3706 0.5770 0.7028 0.5501 5.3 CONTRIB 3.94% 70.46% 20.55% 5.05% 110 11.0 0.86 CONTRIB 0.07% 33.61% 65.99% 0.32% 9 _______________________________________________________________________________________________________
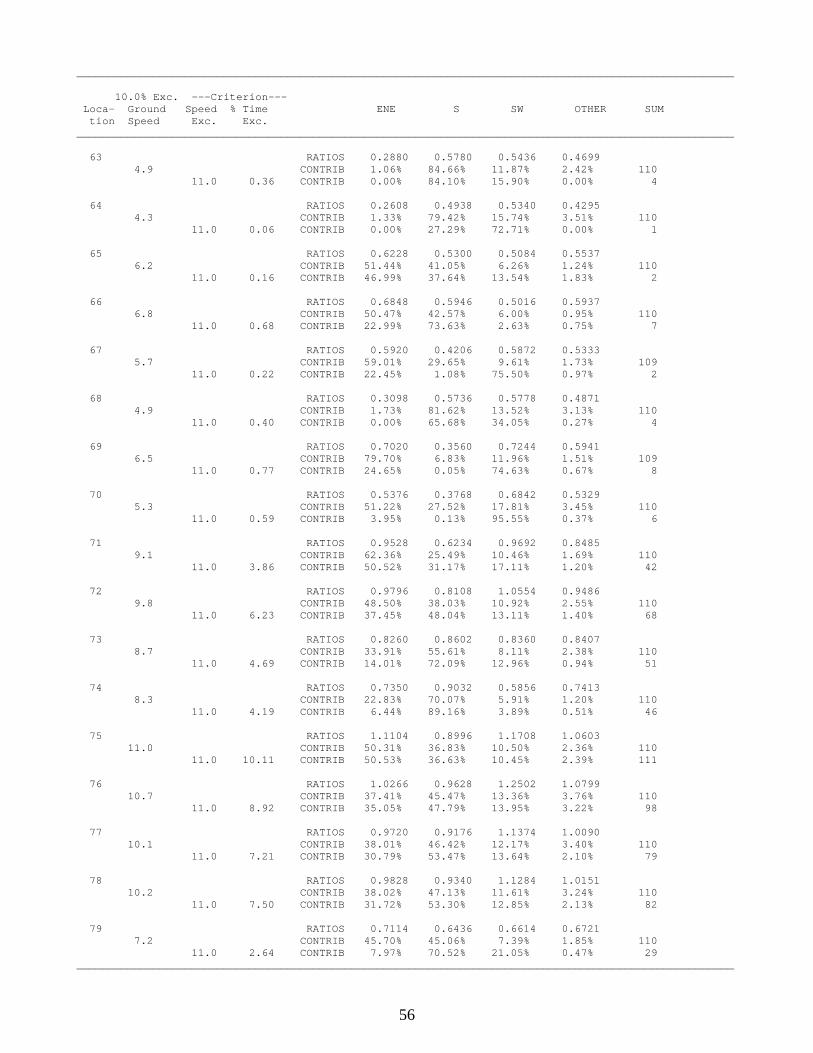
56
_______________________________________________________________________________________________________ 10.0% Exc. ---Criterion--- Loca- Ground Speed % Time ENE S SW OTHER SUM tion Speed Exc. Exc. _______________________________________________________________________________________________________ 63 RATIOS 0.2880 0.5780 0.5436 0.4699 4.9 CONTRIB 1.06% 84.66% 11.87% 2.42% 110 11.0 0.36 CONTRIB 0.00% 84.10% 15.90% 0.00% 4 64 RATIOS 0.2608 0.4938 0.5340 0.4295 4.3 CONTRIB 1.33% 79.42% 15.74% 3.51% 110 11.0 0.06 CONTRIB 0.00% 27.29% 72.71% 0.00% 1 65 RATIOS 0.6228 0.5300 0.5084 0.5537 6.2 CONTRIB 51.44% 41.05% 6.26% 1.24% 110 11.0 0.16 CONTRIB 46.99% 37.64% 13.54% 1.83% 2 66 RATIOS 0.6848 0.5946 0.5016 0.5937 6.8 CONTRIB 50.47% 42.57% 6.00% 0.95% 110 11.0 0.68 CONTRIB 22.99% 73.63% 2.63% 0.75% 7 67 RATIOS 0.5920 0.4206 0.5872 0.5333 5.7 CONTRIB 59.01% 29.65% 9.61% 1.73% 109 11.0 0.22 CONTRIB 22.45% 1.08% 75.50% 0.97% 2 68 RATIOS 0.3098 0.5736 0.5778 0.4871 4.9 CONTRIB 1.73% 81.62% 13.52% 3.13% 110 11.0 0.40 CONTRIB 0.00% 65.68% 34.05% 0.27% 4 69 RATIOS 0.7020 0.3560 0.7244 0.5941 6.5 CONTRIB 79.70% 6.83% 11.96% 1.51% 109 11.0 0.77 CONTRIB 24.65% 0.05% 74.63% 0.67% 8 70 RATIOS 0.5376 0.3768 0.6842 0.5329 5.3 CONTRIB 51.22% 27.52% 17.81% 3.45% 110 11.0 0.59 CONTRIB 3.95% 0.13% 95.55% 0.37% 6 71 RATIOS 0.9528 0.6234 0.9692 0.8485 9.1 CONTRIB 62.36% 25.49% 10.46% 1.69% 110 11.0 3.86 CONTRIB 50.52% 31.17% 17.11% 1.20% 42 72 RATIOS 0.9796 0.8108 1.0554 0.9486 9.8 CONTRIB 48.50% 38.03% 10.92% 2.55% 110 11.0 6.23 CONTRIB 37.45% 48.04% 13.11% 1.40% 68 73 RATIOS 0.8260 0.8602 0.8360 0.8407 8.7 CONTRIB 33.91% 55.61% 8.11% 2.38% 110 11.0 4.69 CONTRIB 14.01% 72.09% 12.96% 0.94% 51 74 RATIOS 0.7350 0.9032 0.5856 0.7413 8.3 CONTRIB 22.83% 70.07% 5.91% 1.20% 110 11.0 4.19 CONTRIB 6.44% 89.16% 3.89% 0.51% 46 75 RATIOS 1.1104 0.8996 1.1708 1.0603 11.0 CONTRIB 50.31% 36.83% 10.50% 2.36% 110 11.0 10.11 CONTRIB 50.53% 36.63% 10.45% 2.39% 111 76 RATIOS 1.0266 0.9628 1.2502 1.0799 10.7 CONTRIB 37.41% 45.47% 13.36% 3.76% 110 11.0 8.92 CONTRIB 35.05% 47.79% 13.95% 3.22% 98 77 RATIOS 0.9720 0.9176 1.1374 1.0090 10.1 CONTRIB 38.01% 46.42% 12.17% 3.40% 110 11.0 7.21 CONTRIB 30.79% 53.47% 13.64% 2.10% 79 78 RATIOS 0.9828 0.9340 1.1284 1.0151 10.2 CONTRIB 38.02% 47.13% 11.61% 3.24% 110 11.0 7.50 CONTRIB 31.72% 53.30% 12.85% 2.13% 82 79 RATIOS 0.7114 0.6436 0.6614 0.6721 7.2 CONTRIB 45.70% 45.06% 7.39% 1.85% 110 11.0 2.64 CONTRIB 7.97% 70.52% 21.05% 0.47% 29 _______________________________________________________________________________________________________
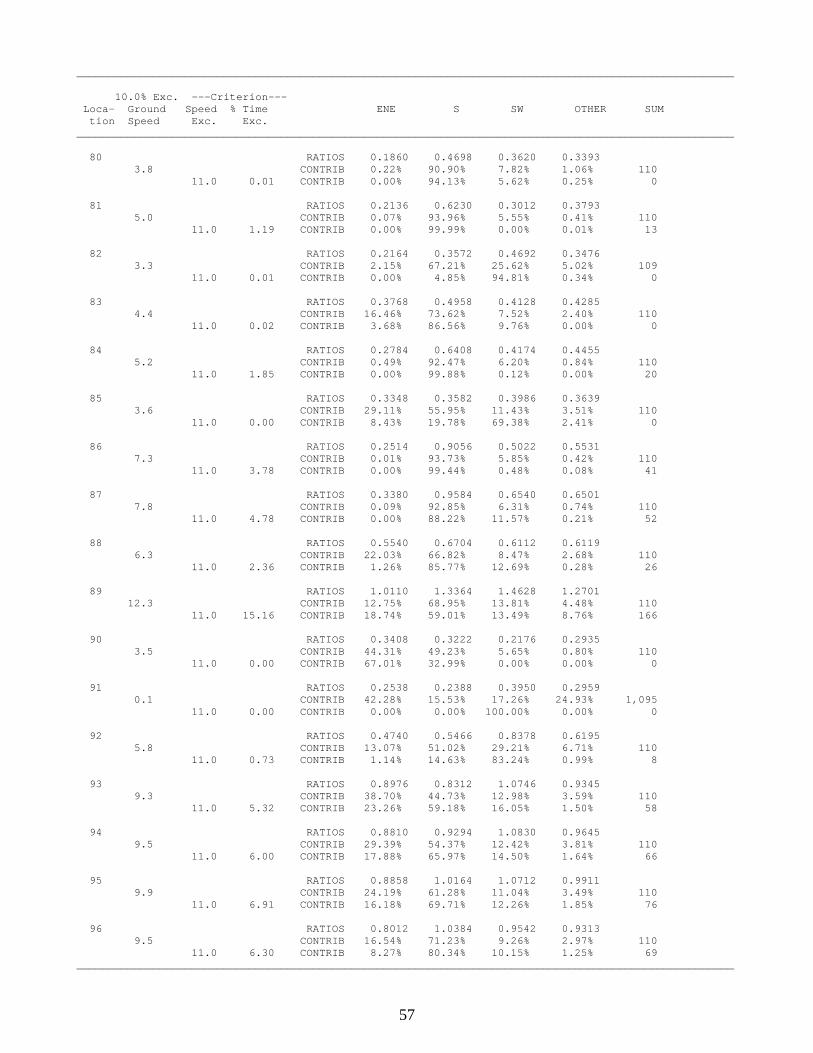
57
_______________________________________________________________________________________________________ 10.0% Exc. ---Criterion--- Loca- Ground Speed % Time ENE S SW OTHER SUM tion Speed Exc. Exc. _______________________________________________________________________________________________________ 80 RATIOS 0.1860 0.4698 0.3620 0.3393 3.8 CONTRIB 0.22% 90.90% 7.82% 1.06% 110 11.0 0.01 CONTRIB 0.00% 94.13% 5.62% 0.25% 0 81 RATIOS 0.2136 0.6230 0.3012 0.3793 5.0 CONTRIB 0.07% 93.96% 5.55% 0.41% 110 11.0 1.19 CONTRIB 0.00% 99.99% 0.00% 0.01% 13 82 RATIOS 0.2164 0.3572 0.4692 0.3476 3.3 CONTRIB 2.15% 67.21% 25.62% 5.02% 109 11.0 0.01 CONTRIB 0.00% 4.85% 94.81% 0.34% 0 83 RATIOS 0.3768 0.4958 0.4128 0.4285 4.4 CONTRIB 16.46% 73.62% 7.52% 2.40% 110 11.0 0.02 CONTRIB 3.68% 86.56% 9.76% 0.00% 0 84 RATIOS 0.2784 0.6408 0.4174 0.4455 5.2 CONTRIB 0.49% 92.47% 6.20% 0.84% 110 11.0 1.85 CONTRIB 0.00% 99.88% 0.12% 0.00% 20 85 RATIOS 0.3348 0.3582 0.3986 0.3639 3.6 CONTRIB 29.11% 55.95% 11.43% 3.51% 110 11.0 0.00 CONTRIB 8.43% 19.78% 69.38% 2.41% 0 86 RATIOS 0.2514 0.9056 0.5022 0.5531 7.3 CONTRIB 0.01% 93.73% 5.85% 0.42% 110 11.0 3.78 CONTRIB 0.00% 99.44% 0.48% 0.08% 41 87 RATIOS 0.3380 0.9584 0.6540 0.6501 7.8 CONTRIB 0.09% 92.85% 6.31% 0.74% 110 11.0 4.78 CONTRIB 0.00% 88.22% 11.57% 0.21% 52 88 RATIOS 0.5540 0.6704 0.6112 0.6119 6.3 CONTRIB 22.03% 66.82% 8.47% 2.68% 110 11.0 2.36 CONTRIB 1.26% 85.77% 12.69% 0.28% 26 89 RATIOS 1.0110 1.3364 1.4628 1.2701 12.3 CONTRIB 12.75% 68.95% 13.81% 4.48% 110 11.0 15.16 CONTRIB 18.74% 59.01% 13.49% 8.76% 166 90 RATIOS 0.3408 0.3222 0.2176 0.2935 3.5 CONTRIB 44.31% 49.23% 5.65% 0.80% 110 11.0 0.00 CONTRIB 67.01% 32.99% 0.00% 0.00% 0 91 RATIOS 0.2538 0.2388 0.3950 0.2959 0.1 CONTRIB 42.28% 15.53% 17.26% 24.93% 1,095 11.0 0.00 CONTRIB 0.00% 0.00% 100.00% 0.00% 0 92 RATIOS 0.4740 0.5466 0.8378 0.6195 5.8 CONTRIB 13.07% 51.02% 29.21% 6.71% 110 11.0 0.73 CONTRIB 1.14% 14.63% 83.24% 0.99% 8 93 RATIOS 0.8976 0.8312 1.0746 0.9345 9.3 CONTRIB 38.70% 44.73% 12.98% 3.59% 110 11.0 5.32 CONTRIB 23.26% 59.18% 16.05% 1.50% 58 94 RATIOS 0.8810 0.9294 1.0830 0.9645 9.5 CONTRIB 29.39% 54.37% 12.42% 3.81% 110 11.0 6.00 CONTRIB 17.88% 65.97% 14.50% 1.64% 66 95 RATIOS 0.8858 1.0164 1.0712 0.9911 9.9 CONTRIB 24.19% 61.28% 11.04% 3.49% 110 11.0 6.91 CONTRIB 16.18% 69.71% 12.26% 1.85% 76 96 RATIOS 0.8012 1.0384 0.9542 0.9313 9.5 CONTRIB 16.54% 71.23% 9.26% 2.97% 110 11.0 6.30 CONTRIB 8.27% 80.34% 10.15% 1.25% 69 _______________________________________________________________________________________________________

58
_______________________________________________________________________________________________________ 10.0% Exc. ---Criterion--- Loca- Ground Speed % Time ENE S SW OTHER SUM tion Speed Exc. Exc. _______________________________________________________________________________________________________ 97 RATIOS 0.7490 1.0354 0.9444 0.9096 9.2 CONTRIB 12.13% 75.17% 9.65% 3.06% 110 11.0 6.04 CONTRIB 5.15% 83.18% 10.53% 1.14% 66 98 RATIOS 0.5496 0.2314 0.4062 0.3957 4.9 CONTRIB 92.83% 0.35% 6.25% 0.57% 110 11.0 0.03 CONTRIB 94.26% 0.00% 5.74% 0.00% 0 99 RATIOS 0.2946 0.6154 0.3010 0.4037 5.0 CONTRIB 1.06% 92.77% 5.56% 0.61% 110 11.0 0.95 CONTRIB 0.00% 100.00% 0.00% 0.00% 10 100 RATIOS 0.3028 0.5184 0.3604 0.3939 4.3 CONTRIB 4.06% 88.12% 6.30% 1.51% 110 11.0 0.04 CONTRIB 0.00% 98.95% 1.05% 0.00% 0 _______________________________________________________________________________________________________
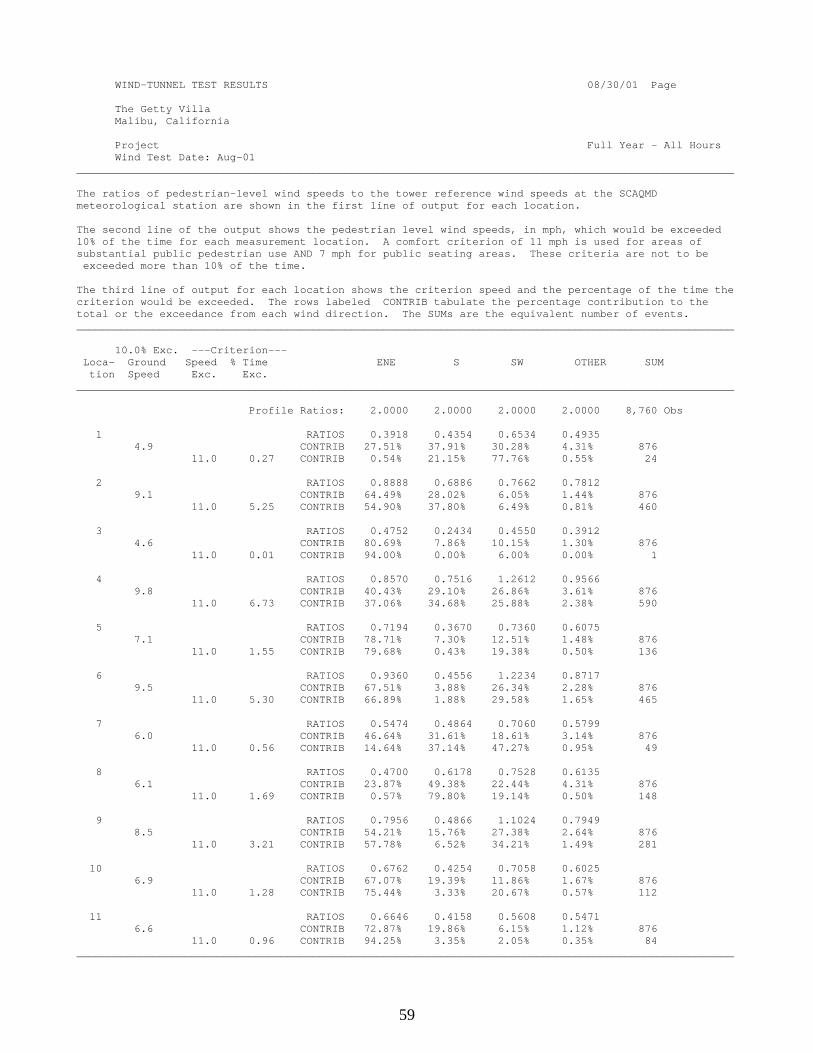
59
WIND-TUNNEL TEST RESULTS 08/30/01 Page The Getty Villa Malibu, California Project Full Year - All Hours Wind Test Date: Aug-01 _______________________________________________________________________________________________________ The ratios of pedestrian-level wind speeds to the tower reference wind speeds at the SCAQMD meteorological station are shown in the first line of output for each location. The second line of the output shows the pedestrian level wind speeds, in mph, which would be exceeded 10% of the time for each measurement location. A comfort criterion of 11 mph is used for areas of substantial public pedestrian use AND 7 mph for public seating areas. These criteria are not to be exceeded more than 10% of the time. The third line of output for each location shows the criterion speed and the percentage of the time the criterion would be exceeded. The rows labeled CONTRIB tabulate the percentage contribution to the total or the exceedance from each wind direction. The SUMs are the equivalent number of events. _______________________________________________________________________________________________________ 10.0% Exc. ---Criterion--- Loca- Ground Speed % Time ENE S SW OTHER SUM tion Speed Exc. Exc. _______________________________________________________________________________________________________ Profile Ratios: 2.0000 2.0000 2.0000 2.0000 8,760 Obs 1 RATIOS 0.3918 0.4354 0.6534 0.4935 4.9 CONTRIB 27.51% 37.91% 30.28% 4.31% 876 11.0 0.27 CONTRIB 0.54% 21.15% 77.76% 0.55% 24 2 RATIOS 0.8888 0.6886 0.7662 0.7812 9.1 CONTRIB 64.49% 28.02% 6.05% 1.44% 876 11.0 5.25 CONTRIB 54.90% 37.80% 6.49% 0.81% 460 3 RATIOS 0.4752 0.2434 0.4550 0.3912 4.6 CONTRIB 80.69% 7.86% 10.15% 1.30% 876 11.0 0.01 CONTRIB 94.00% 0.00% 6.00% 0.00% 1 4 RATIOS 0.8570 0.7516 1.2612 0.9566 9.8 CONTRIB 40.43% 29.10% 26.86% 3.61% 876 11.0 6.73 CONTRIB 37.06% 34.68% 25.88% 2.38% 590 5 RATIOS 0.7194 0.3670 0.7360 0.6075 7.1 CONTRIB 78.71% 7.30% 12.51% 1.48% 876 11.0 1.55 CONTRIB 79.68% 0.43% 19.38% 0.50% 136 6 RATIOS 0.9360 0.4556 1.2234 0.8717 9.5 CONTRIB 67.51% 3.88% 26.34% 2.28% 876 11.0 5.30 CONTRIB 66.89% 1.88% 29.58% 1.65% 465 7 RATIOS 0.5474 0.4864 0.7060 0.5799 6.0 CONTRIB 46.64% 31.61% 18.61% 3.14% 876 11.0 0.56 CONTRIB 14.64% 37.14% 47.27% 0.95% 49 8 RATIOS 0.4700 0.6178 0.7528 0.6135 6.1 CONTRIB 23.87% 49.38% 22.44% 4.31% 876 11.0 1.69 CONTRIB 0.57% 79.80% 19.14% 0.50% 148 9 RATIOS 0.7956 0.4866 1.1024 0.7949 8.5 CONTRIB 54.21% 15.76% 27.38% 2.64% 876 11.0 3.21 CONTRIB 57.78% 6.52% 34.21% 1.49% 281 10 RATIOS 0.6762 0.4254 0.7058 0.6025 6.9 CONTRIB 67.07% 19.39% 11.86% 1.67% 876 11.0 1.28 CONTRIB 75.44% 3.33% 20.67% 0.57% 112 11 RATIOS 0.6646 0.4158 0.5608 0.5471 6.6 CONTRIB 72.87% 19.86% 6.15% 1.12% 876 11.0 0.96 CONTRIB 94.25% 3.35% 2.05% 0.35% 84 _______________________________________________________________________________________________________
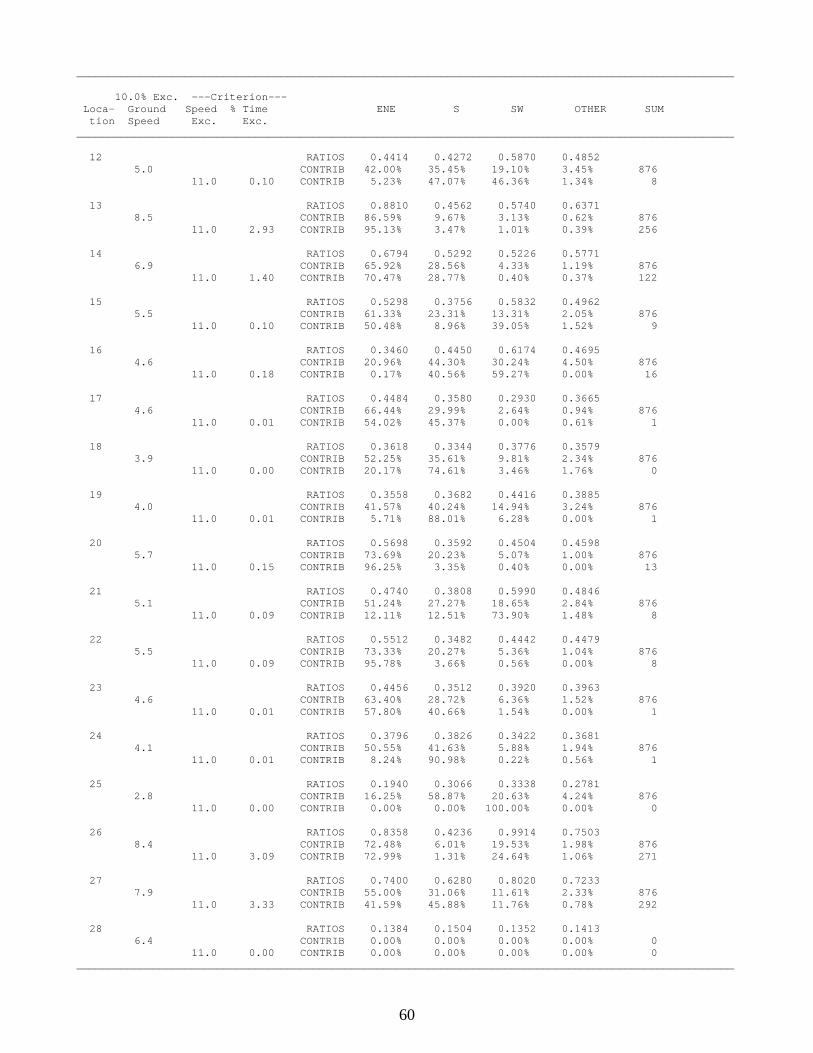
60
_______________________________________________________________________________________________________ 10.0% Exc. ---Criterion--- Loca- Ground Speed % Time ENE S SW OTHER SUM tion Speed Exc. Exc. _______________________________________________________________________________________________________ 12 RATIOS 0.4414 0.4272 0.5870 0.4852 5.0 CONTRIB 42.00% 35.45% 19.10% 3.45% 876 11.0 0.10 CONTRIB 5.23% 47.07% 46.36% 1.34% 8 13 RATIOS 0.8810 0.4562 0.5740 0.6371 8.5 CONTRIB 86.59% 9.67% 3.13% 0.62% 876 11.0 2.93 CONTRIB 95.13% 3.47% 1.01% 0.39% 256 14 RATIOS 0.6794 0.5292 0.5226 0.5771 6.9 CONTRIB 65.92% 28.56% 4.33% 1.19% 876 11.0 1.40 CONTRIB 70.47% 28.77% 0.40% 0.37% 122 15 RATIOS 0.5298 0.3756 0.5832 0.4962 5.5 CONTRIB 61.33% 23.31% 13.31% 2.05% 876 11.0 0.10 CONTRIB 50.48% 8.96% 39.05% 1.52% 9 16 RATIOS 0.3460 0.4450 0.6174 0.4695 4.6 CONTRIB 20.96% 44.30% 30.24% 4.50% 876 11.0 0.18 CONTRIB 0.17% 40.56% 59.27% 0.00% 16 17 RATIOS 0.4484 0.3580 0.2930 0.3665 4.6 CONTRIB 66.44% 29.99% 2.64% 0.94% 876 11.0 0.01 CONTRIB 54.02% 45.37% 0.00% 0.61% 1 18 RATIOS 0.3618 0.3344 0.3776 0.3579 3.9 CONTRIB 52.25% 35.61% 9.81% 2.34% 876 11.0 0.00 CONTRIB 20.17% 74.61% 3.46% 1.76% 0 19 RATIOS 0.3558 0.3682 0.4416 0.3885 4.0 CONTRIB 41.57% 40.24% 14.94% 3.24% 876 11.0 0.01 CONTRIB 5.71% 88.01% 6.28% 0.00% 1 20 RATIOS 0.5698 0.3592 0.4504 0.4598 5.7 CONTRIB 73.69% 20.23% 5.07% 1.00% 876 11.0 0.15 CONTRIB 96.25% 3.35% 0.40% 0.00% 13 21 RATIOS 0.4740 0.3808 0.5990 0.4846 5.1 CONTRIB 51.24% 27.27% 18.65% 2.84% 876 11.0 0.09 CONTRIB 12.11% 12.51% 73.90% 1.48% 8 22 RATIOS 0.5512 0.3482 0.4442 0.4479 5.5 CONTRIB 73.33% 20.27% 5.36% 1.04% 876 11.0 0.09 CONTRIB 95.78% 3.66% 0.56% 0.00% 8 23 RATIOS 0.4456 0.3512 0.3920 0.3963 4.6 CONTRIB 63.40% 28.72% 6.36% 1.52% 876 11.0 0.01 CONTRIB 57.80% 40.66% 1.54% 0.00% 1 24 RATIOS 0.3796 0.3826 0.3422 0.3681 4.1 CONTRIB 50.55% 41.63% 5.88% 1.94% 876 11.0 0.01 CONTRIB 8.24% 90.98% 0.22% 0.56% 1 25 RATIOS 0.1940 0.3066 0.3338 0.2781 2.8 CONTRIB 16.25% 58.87% 20.63% 4.24% 876 11.0 0.00 CONTRIB 0.00% 0.00% 100.00% 0.00% 0 26 RATIOS 0.8358 0.4236 0.9914 0.7503 8.4 CONTRIB 72.48% 6.01% 19.53% 1.98% 876 11.0 3.09 CONTRIB 72.99% 1.31% 24.64% 1.06% 271 27 RATIOS 0.7400 0.6280 0.8020 0.7233 7.9 CONTRIB 55.00% 31.06% 11.61% 2.33% 876 11.0 3.33 CONTRIB 41.59% 45.88% 11.76% 0.78% 292 28 RATIOS 0.1384 0.1504 0.1352 0.1413 6.4 CONTRIB 0.00% 0.00% 0.00% 0.00% 0 11.0 0.00 CONTRIB 0.00% 0.00% 0.00% 0.00% 0 _______________________________________________________________________________________________________
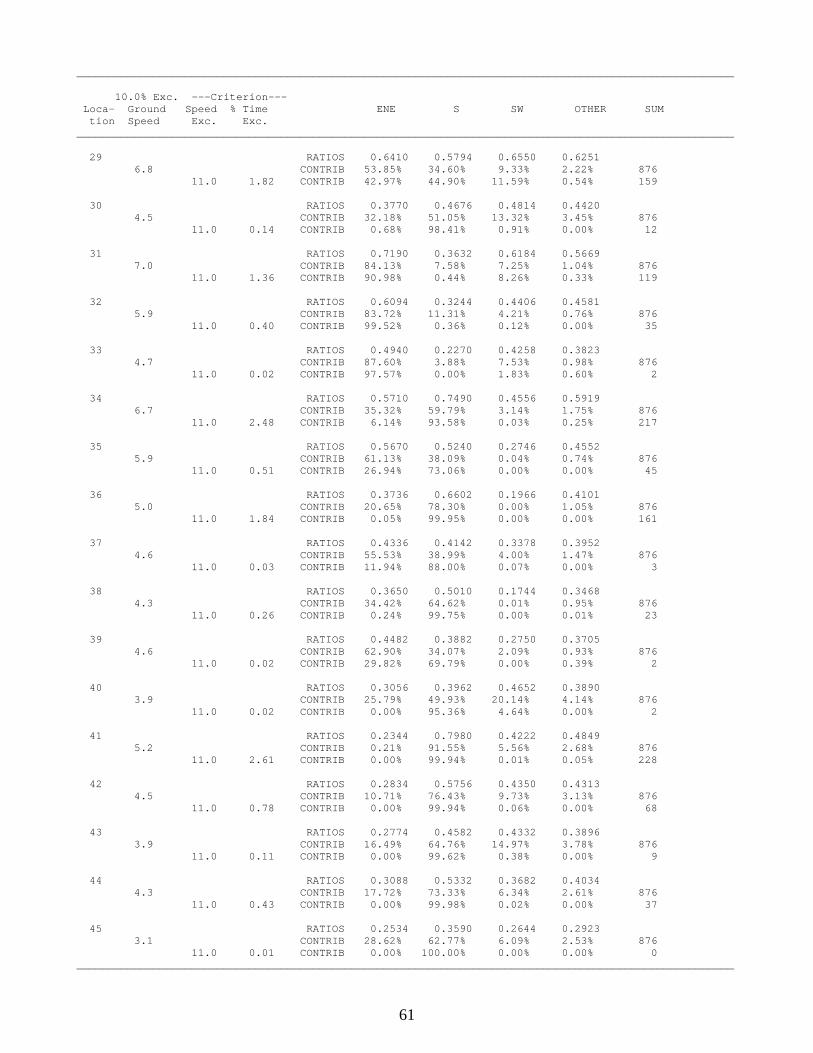
61
_______________________________________________________________________________________________________ 10.0% Exc. ---Criterion--- Loca- Ground Speed % Time ENE S SW OTHER SUM tion Speed Exc. Exc. _______________________________________________________________________________________________________ 29 RATIOS 0.6410 0.5794 0.6550 0.6251 6.8 CONTRIB 53.85% 34.60% 9.33% 2.22% 876 11.0 1.82 CONTRIB 42.97% 44.90% 11.59% 0.54% 159 30 RATIOS 0.3770 0.4676 0.4814 0.4420 4.5 CONTRIB 32.18% 51.05% 13.32% 3.45% 876 11.0 0.14 CONTRIB 0.68% 98.41% 0.91% 0.00% 12 31 RATIOS 0.7190 0.3632 0.6184 0.5669 7.0 CONTRIB 84.13% 7.58% 7.25% 1.04% 876 11.0 1.36 CONTRIB 90.98% 0.44% 8.26% 0.33% 119 32 RATIOS 0.6094 0.3244 0.4406 0.4581 5.9 CONTRIB 83.72% 11.31% 4.21% 0.76% 876 11.0 0.40 CONTRIB 99.52% 0.36% 0.12% 0.00% 35 33 RATIOS 0.4940 0.2270 0.4258 0.3823 4.7 CONTRIB 87.60% 3.88% 7.53% 0.98% 876 11.0 0.02 CONTRIB 97.57% 0.00% 1.83% 0.60% 2 34 RATIOS 0.5710 0.7490 0.4556 0.5919 6.7 CONTRIB 35.32% 59.79% 3.14% 1.75% 876 11.0 2.48 CONTRIB 6.14% 93.58% 0.03% 0.25% 217 35 RATIOS 0.5670 0.5240 0.2746 0.4552 5.9 CONTRIB 61.13% 38.09% 0.04% 0.74% 876 11.0 0.51 CONTRIB 26.94% 73.06% 0.00% 0.00% 45 36 RATIOS 0.3736 0.6602 0.1966 0.4101 5.0 CONTRIB 20.65% 78.30% 0.00% 1.05% 876 11.0 1.84 CONTRIB 0.05% 99.95% 0.00% 0.00% 161 37 RATIOS 0.4336 0.4142 0.3378 0.3952 4.6 CONTRIB 55.53% 38.99% 4.00% 1.47% 876 11.0 0.03 CONTRIB 11.94% 88.00% 0.07% 0.00% 3 38 RATIOS 0.3650 0.5010 0.1744 0.3468 4.3 CONTRIB 34.42% 64.62% 0.01% 0.95% 876 11.0 0.26 CONTRIB 0.24% 99.75% 0.00% 0.01% 23 39 RATIOS 0.4482 0.3882 0.2750 0.3705 4.6 CONTRIB 62.90% 34.07% 2.09% 0.93% 876 11.0 0.02 CONTRIB 29.82% 69.79% 0.00% 0.39% 2 40 RATIOS 0.3056 0.3962 0.4652 0.3890 3.9 CONTRIB 25.79% 49.93% 20.14% 4.14% 876 11.0 0.02 CONTRIB 0.00% 95.36% 4.64% 0.00% 2 41 RATIOS 0.2344 0.7980 0.4222 0.4849 5.2 CONTRIB 0.21% 91.55% 5.56% 2.68% 876 11.0 2.61 CONTRIB 0.00% 99.94% 0.01% 0.05% 228 42 RATIOS 0.2834 0.5756 0.4350 0.4313 4.5 CONTRIB 10.71% 76.43% 9.73% 3.13% 876 11.0 0.78 CONTRIB 0.00% 99.94% 0.06% 0.00% 68 43 RATIOS 0.2774 0.4582 0.4332 0.3896 3.9 CONTRIB 16.49% 64.76% 14.97% 3.78% 876 11.0 0.11 CONTRIB 0.00% 99.62% 0.38% 0.00% 9 44 RATIOS 0.3088 0.5332 0.3682 0.4034 4.3 CONTRIB 17.72% 73.33% 6.34% 2.61% 876 11.0 0.43 CONTRIB 0.00% 99.98% 0.02% 0.00% 37 45 RATIOS 0.2534 0.3590 0.2644 0.2923 3.1 CONTRIB 28.62% 62.77% 6.09% 2.53% 876 11.0 0.01 CONTRIB 0.00% 100.00% 0.00% 0.00% 0 _______________________________________________________________________________________________________
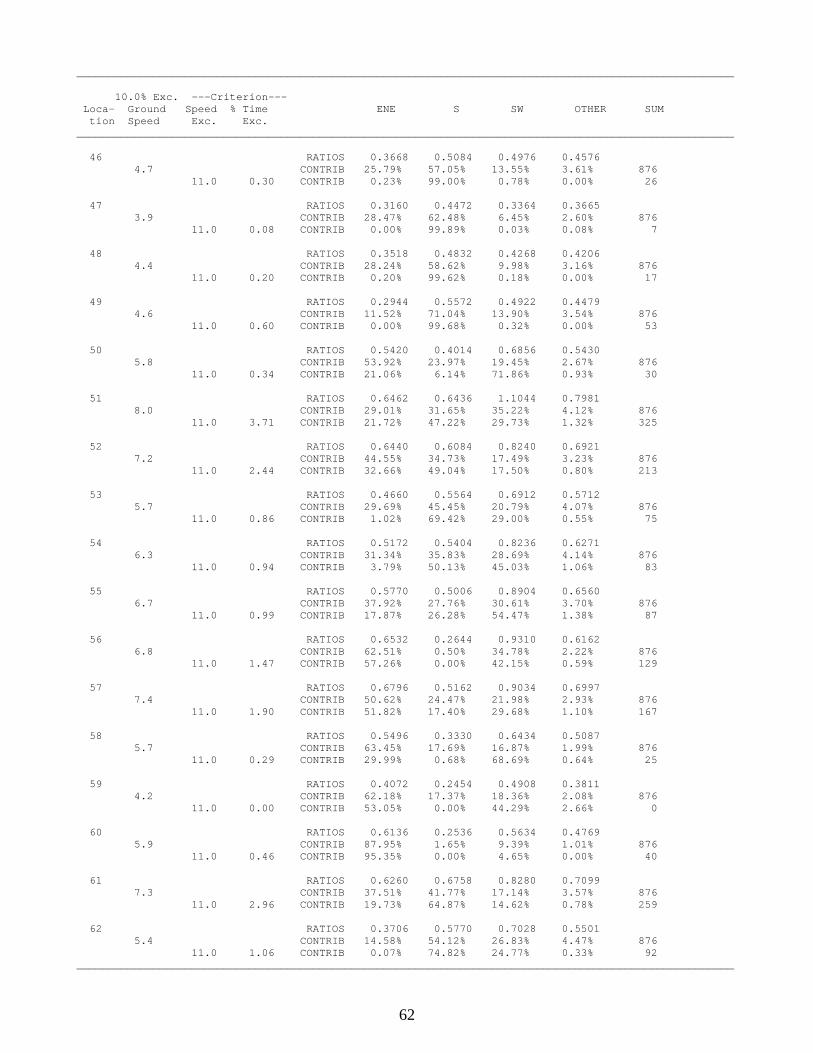
62
_______________________________________________________________________________________________________ 10.0% Exc. ---Criterion--- Loca- Ground Speed % Time ENE S SW OTHER SUM tion Speed Exc. Exc. _______________________________________________________________________________________________________ 46 RATIOS 0.3668 0.5084 0.4976 0.4576 4.7 CONTRIB 25.79% 57.05% 13.55% 3.61% 876 11.0 0.30 CONTRIB 0.23% 99.00% 0.78% 0.00% 26 47 RATIOS 0.3160 0.4472 0.3364 0.3665 3.9 CONTRIB 28.47% 62.48% 6.45% 2.60% 876 11.0 0.08 CONTRIB 0.00% 99.89% 0.03% 0.08% 7 48 RATIOS 0.3518 0.4832 0.4268 0.4206 4.4 CONTRIB 28.24% 58.62% 9.98% 3.16% 876 11.0 0.20 CONTRIB 0.20% 99.62% 0.18% 0.00% 17 49 RATIOS 0.2944 0.5572 0.4922 0.4479 4.6 CONTRIB 11.52% 71.04% 13.90% 3.54% 876 11.0 0.60 CONTRIB 0.00% 99.68% 0.32% 0.00% 53 50 RATIOS 0.5420 0.4014 0.6856 0.5430 5.8 CONTRIB 53.92% 23.97% 19.45% 2.67% 876 11.0 0.34 CONTRIB 21.06% 6.14% 71.86% 0.93% 30 51 RATIOS 0.6462 0.6436 1.1044 0.7981 8.0 CONTRIB 29.01% 31.65% 35.22% 4.12% 876 11.0 3.71 CONTRIB 21.72% 47.22% 29.73% 1.32% 325 52 RATIOS 0.6440 0.6084 0.8240 0.6921 7.2 CONTRIB 44.55% 34.73% 17.49% 3.23% 876 11.0 2.44 CONTRIB 32.66% 49.04% 17.50% 0.80% 213 53 RATIOS 0.4660 0.5564 0.6912 0.5712 5.7 CONTRIB 29.69% 45.45% 20.79% 4.07% 876 11.0 0.86 CONTRIB 1.02% 69.42% 29.00% 0.55% 75 54 RATIOS 0.5172 0.5404 0.8236 0.6271 6.3 CONTRIB 31.34% 35.83% 28.69% 4.14% 876 11.0 0.94 CONTRIB 3.79% 50.13% 45.03% 1.06% 83 55 RATIOS 0.5770 0.5006 0.8904 0.6560 6.7 CONTRIB 37.92% 27.76% 30.61% 3.70% 876 11.0 0.99 CONTRIB 17.87% 26.28% 54.47% 1.38% 87 56 RATIOS 0.6532 0.2644 0.9310 0.6162 6.8 CONTRIB 62.51% 0.50% 34.78% 2.22% 876 11.0 1.47 CONTRIB 57.26% 0.00% 42.15% 0.59% 129 57 RATIOS 0.6796 0.5162 0.9034 0.6997 7.4 CONTRIB 50.62% 24.47% 21.98% 2.93% 876 11.0 1.90 CONTRIB 51.82% 17.40% 29.68% 1.10% 167 58 RATIOS 0.5496 0.3330 0.6434 0.5087 5.7 CONTRIB 63.45% 17.69% 16.87% 1.99% 876 11.0 0.29 CONTRIB 29.99% 0.68% 68.69% 0.64% 25 59 RATIOS 0.4072 0.2454 0.4908 0.3811 4.2 CONTRIB 62.18% 17.37% 18.36% 2.08% 876 11.0 0.00 CONTRIB 53.05% 0.00% 44.29% 2.66% 0 60 RATIOS 0.6136 0.2536 0.5634 0.4769 5.9 CONTRIB 87.95% 1.65% 9.39% 1.01% 876 11.0 0.46 CONTRIB 95.35% 0.00% 4.65% 0.00% 40 61 RATIOS 0.6260 0.6758 0.8280 0.7099 7.3 CONTRIB 37.51% 41.77% 17.14% 3.57% 876 11.0 2.96 CONTRIB 19.73% 64.87% 14.62% 0.78% 259 62 RATIOS 0.3706 0.5770 0.7028 0.5501 5.4 CONTRIB 14.58% 54.12% 26.83% 4.47% 876 11.0 1.06 CONTRIB 0.07% 74.82% 24.77% 0.33% 92 _______________________________________________________________________________________________________
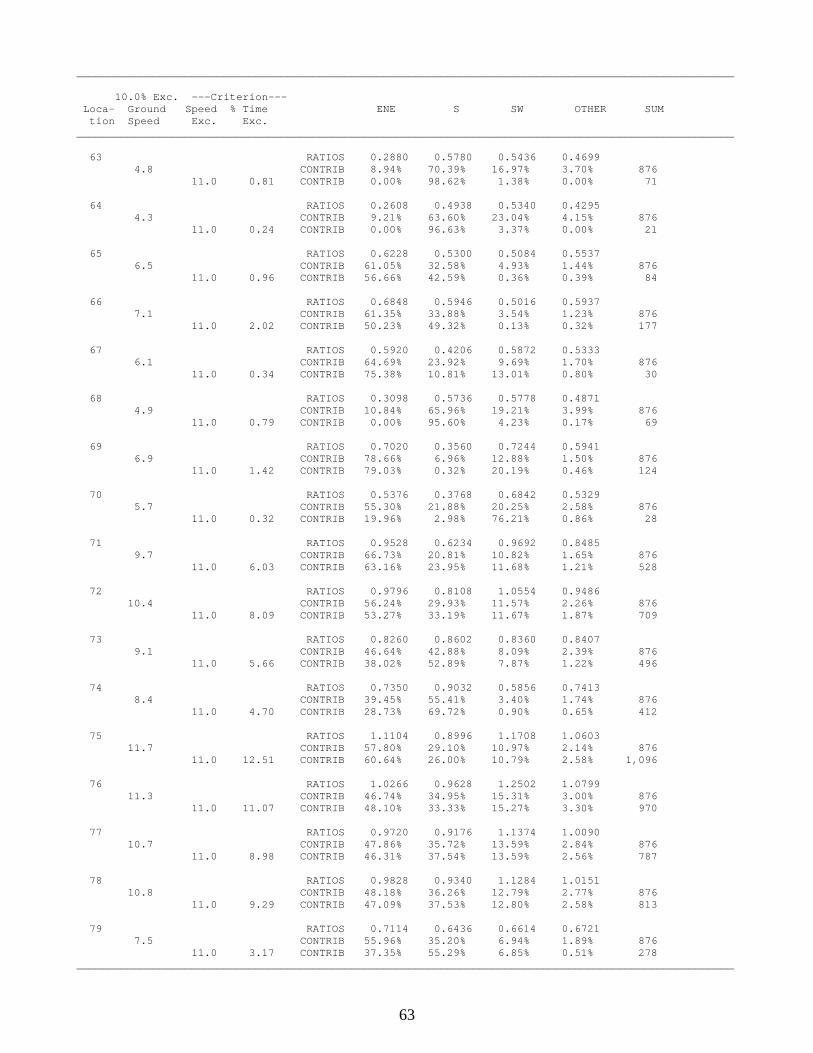
63
_______________________________________________________________________________________________________ 10.0% Exc. ---Criterion--- Loca- Ground Speed % Time ENE S SW OTHER SUM tion Speed Exc. Exc. _______________________________________________________________________________________________________ 63 RATIOS 0.2880 0.5780 0.5436 0.4699 4.8 CONTRIB 8.94% 70.39% 16.97% 3.70% 876 11.0 0.81 CONTRIB 0.00% 98.62% 1.38% 0.00% 71 64 RATIOS 0.2608 0.4938 0.5340 0.4295 4.3 CONTRIB 9.21% 63.60% 23.04% 4.15% 876 11.0 0.24 CONTRIB 0.00% 96.63% 3.37% 0.00% 21 65 RATIOS 0.6228 0.5300 0.5084 0.5537 6.5 CONTRIB 61.05% 32.58% 4.93% 1.44% 876 11.0 0.96 CONTRIB 56.66% 42.59% 0.36% 0.39% 84 66 RATIOS 0.6848 0.5946 0.5016 0.5937 7.1 CONTRIB 61.35% 33.88% 3.54% 1.23% 876 11.0 2.02 CONTRIB 50.23% 49.32% 0.13% 0.32% 177 67 RATIOS 0.5920 0.4206 0.5872 0.5333 6.1 CONTRIB 64.69% 23.92% 9.69% 1.70% 876 11.0 0.34 CONTRIB 75.38% 10.81% 13.01% 0.80% 30 68 RATIOS 0.3098 0.5736 0.5778 0.4871 4.9 CONTRIB 10.84% 65.96% 19.21% 3.99% 876 11.0 0.79 CONTRIB 0.00% 95.60% 4.23% 0.17% 69 69 RATIOS 0.7020 0.3560 0.7244 0.5941 6.9 CONTRIB 78.66% 6.96% 12.88% 1.50% 876 11.0 1.42 CONTRIB 79.03% 0.32% 20.19% 0.46% 124 70 RATIOS 0.5376 0.3768 0.6842 0.5329 5.7 CONTRIB 55.30% 21.88% 20.25% 2.58% 876 11.0 0.32 CONTRIB 19.96% 2.98% 76.21% 0.86% 28 71 RATIOS 0.9528 0.6234 0.9692 0.8485 9.7 CONTRIB 66.73% 20.81% 10.82% 1.65% 876 11.0 6.03 CONTRIB 63.16% 23.95% 11.68% 1.21% 528 72 RATIOS 0.9796 0.8108 1.0554 0.9486 10.4 CONTRIB 56.24% 29.93% 11.57% 2.26% 876 11.0 8.09 CONTRIB 53.27% 33.19% 11.67% 1.87% 709 73 RATIOS 0.8260 0.8602 0.8360 0.8407 9.1 CONTRIB 46.64% 42.88% 8.09% 2.39% 876 11.0 5.66 CONTRIB 38.02% 52.89% 7.87% 1.22% 496 74 RATIOS 0.7350 0.9032 0.5856 0.7413 8.4 CONTRIB 39.45% 55.41% 3.40% 1.74% 876 11.0 4.70 CONTRIB 28.73% 69.72% 0.90% 0.65% 412 75 RATIOS 1.1104 0.8996 1.1708 1.0603 11.7 CONTRIB 57.80% 29.10% 10.97% 2.14% 876 11.0 12.51 CONTRIB 60.64% 26.00% 10.79% 2.58% 1,096 76 RATIOS 1.0266 0.9628 1.2502 1.0799 11.3 CONTRIB 46.74% 34.95% 15.31% 3.00% 876 11.0 11.07 CONTRIB 48.10% 33.33% 15.27% 3.30% 970 77 RATIOS 0.9720 0.9176 1.1374 1.0090 10.7 CONTRIB 47.86% 35.72% 13.59% 2.84% 876 11.0 8.98 CONTRIB 46.31% 37.54% 13.59% 2.56% 787 78 RATIOS 0.9828 0.9340 1.1284 1.0151 10.8 CONTRIB 48.18% 36.26% 12.79% 2.77% 876 11.0 9.29 CONTRIB 47.09% 37.53% 12.80% 2.58% 813 79 RATIOS 0.7114 0.6436 0.6614 0.6721 7.5 CONTRIB 55.96% 35.20% 6.94% 1.89% 876 11.0 3.17 CONTRIB 37.35% 55.29% 6.85% 0.51% 278 _______________________________________________________________________________________________________
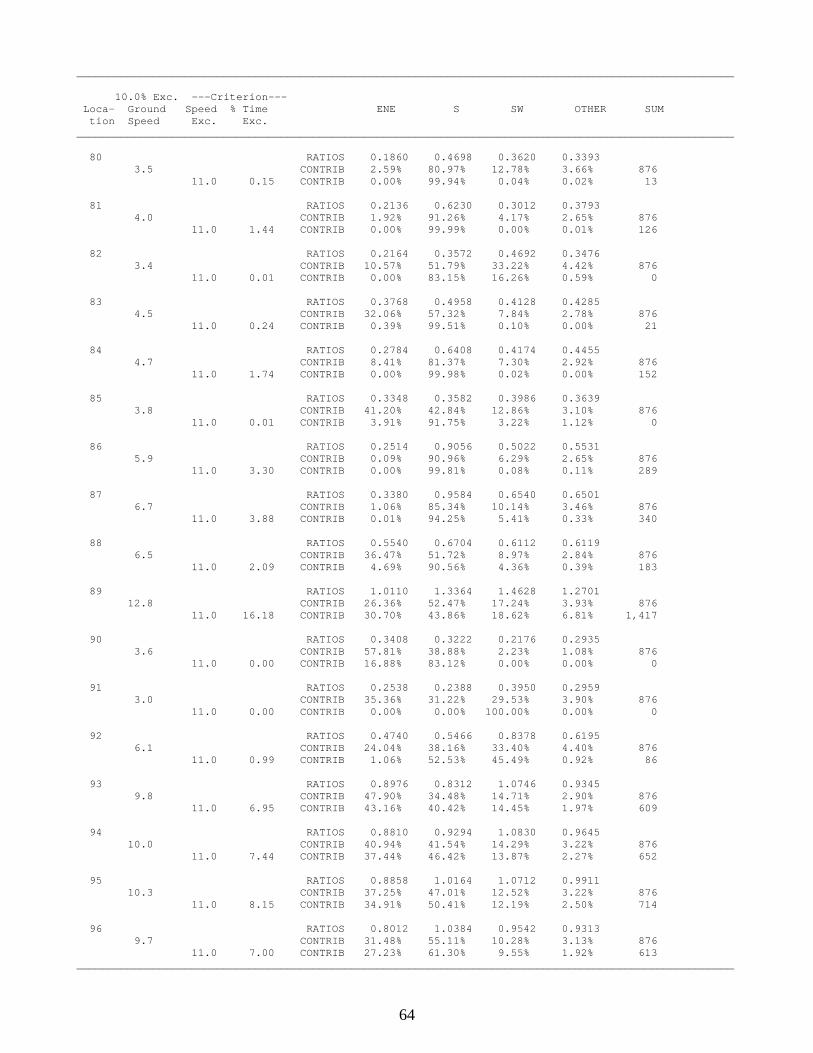
64
_______________________________________________________________________________________________________ 10.0% Exc. ---Criterion--- Loca- Ground Speed % Time ENE S SW OTHER SUM tion Speed Exc. Exc. _______________________________________________________________________________________________________ 80 RATIOS 0.1860 0.4698 0.3620 0.3393 3.5 CONTRIB 2.59% 80.97% 12.78% 3.66% 876 11.0 0.15 CONTRIB 0.00% 99.94% 0.04% 0.02% 13 81 RATIOS 0.2136 0.6230 0.3012 0.3793 4.0 CONTRIB 1.92% 91.26% 4.17% 2.65% 876 11.0 1.44 CONTRIB 0.00% 99.99% 0.00% 0.01% 126 82 RATIOS 0.2164 0.3572 0.4692 0.3476 3.4 CONTRIB 10.57% 51.79% 33.22% 4.42% 876 11.0 0.01 CONTRIB 0.00% 83.15% 16.26% 0.59% 0 83 RATIOS 0.3768 0.4958 0.4128 0.4285 4.5 CONTRIB 32.06% 57.32% 7.84% 2.78% 876 11.0 0.24 CONTRIB 0.39% 99.51% 0.10% 0.00% 21 84 RATIOS 0.2784 0.6408 0.4174 0.4455 4.7 CONTRIB 8.41% 81.37% 7.30% 2.92% 876 11.0 1.74 CONTRIB 0.00% 99.98% 0.02% 0.00% 152 85 RATIOS 0.3348 0.3582 0.3986 0.3639 3.8 CONTRIB 41.20% 42.84% 12.86% 3.10% 876 11.0 0.01 CONTRIB 3.91% 91.75% 3.22% 1.12% 0 86 RATIOS 0.2514 0.9056 0.5022 0.5531 5.9 CONTRIB 0.09% 90.96% 6.29% 2.65% 876 11.0 3.30 CONTRIB 0.00% 99.81% 0.08% 0.11% 289 87 RATIOS 0.3380 0.9584 0.6540 0.6501 6.7 CONTRIB 1.06% 85.34% 10.14% 3.46% 876 11.0 3.88 CONTRIB 0.01% 94.25% 5.41% 0.33% 340 88 RATIOS 0.5540 0.6704 0.6112 0.6119 6.5 CONTRIB 36.47% 51.72% 8.97% 2.84% 876 11.0 2.09 CONTRIB 4.69% 90.56% 4.36% 0.39% 183 89 RATIOS 1.0110 1.3364 1.4628 1.2701 12.8 CONTRIB 26.36% 52.47% 17.24% 3.93% 876 11.0 16.18 CONTRIB 30.70% 43.86% 18.62% 6.81% 1,417 90 RATIOS 0.3408 0.3222 0.2176 0.2935 3.6 CONTRIB 57.81% 38.88% 2.23% 1.08% 876 11.0 0.00 CONTRIB 16.88% 83.12% 0.00% 0.00% 0 91 RATIOS 0.2538 0.2388 0.3950 0.2959 3.0 CONTRIB 35.36% 31.22% 29.53% 3.90% 876 11.0 0.00 CONTRIB 0.00% 0.00% 100.00% 0.00% 0 92 RATIOS 0.4740 0.5466 0.8378 0.6195 6.1 CONTRIB 24.04% 38.16% 33.40% 4.40% 876 11.0 0.99 CONTRIB 1.06% 52.53% 45.49% 0.92% 86 93 RATIOS 0.8976 0.8312 1.0746 0.9345 9.8 CONTRIB 47.90% 34.48% 14.71% 2.90% 876 11.0 6.95 CONTRIB 43.16% 40.42% 14.45% 1.97% 609 94 RATIOS 0.8810 0.9294 1.0830 0.9645 10.0 CONTRIB 40.94% 41.54% 14.29% 3.22% 876 11.0 7.44 CONTRIB 37.44% 46.42% 13.87% 2.27% 652 95 RATIOS 0.8858 1.0164 1.0712 0.9911 10.3 CONTRIB 37.25% 47.01% 12.52% 3.22% 876 11.0 8.15 CONTRIB 34.91% 50.41% 12.19% 2.50% 714 96 RATIOS 0.8012 1.0384 0.9542 0.9313 9.7 CONTRIB 31.48% 55.11% 10.28% 3.13% 876 11.0 7.00 CONTRIB 27.23% 61.30% 9.55% 1.92% 613 _______________________________________________________________________________________________________
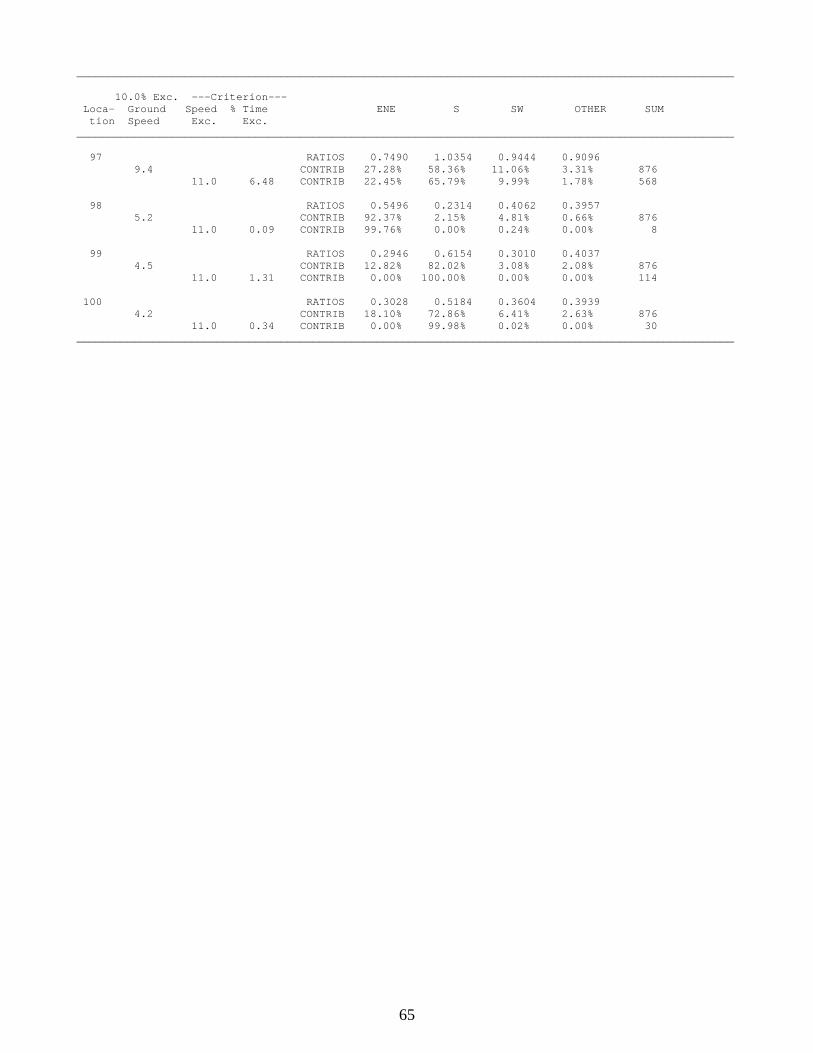
65
_______________________________________________________________________________________________________ 10.0% Exc. ---Criterion--- Loca- Ground Speed % Time ENE S SW OTHER SUM tion Speed Exc. Exc. _______________________________________________________________________________________________________ 97 RATIOS 0.7490 1.0354 0.9444 0.9096 9.4 CONTRIB 27.28% 58.36% 11.06% 3.31% 876 11.0 6.48 CONTRIB 22.45% 65.79% 9.99% 1.78% 568 98 RATIOS 0.5496 0.2314 0.4062 0.3957 5.2 CONTRIB 92.37% 2.15% 4.81% 0.66% 876 11.0 0.09 CONTRIB 99.76% 0.00% 0.24% 0.00% 8 99 RATIOS 0.2946 0.6154 0.3010 0.4037 4.5 CONTRIB 12.82% 82.02% 3.08% 2.08% 876 11.0 1.31 CONTRIB 0.00% 100.00% 0.00% 0.00% 114 100 RATIOS 0.3028 0.5184 0.3604 0.3939 4.2 CONTRIB 18.10% 72.86% 6.41% 2.63% 876 11.0 0.34 CONTRIB 0.00% 99.98% 0.02% 0.00% 30 _______________________________________________________________________________________________________